Embed Size (px)
Citation preview
Agricultural governance and Food Security: Where does
Africa stand ?
Brussels Policy Briefing n° 21 Geopolitics of Food: implications for ACP countries
Wednesday 2nd February 2011
Ousmane Djibo NEPAD Planning and Coordinating Agency

Constraints faced by the African continent
• Tougher international competition• Exogenous shocks: Global market/Food crisis,
international financial crisis, global climate change,, HIV/AIDS
• Lack of social cohesion, political stability, and bureaucratic capacity
• Weak governance• Weak national political commitment• Weak donor commitment

Share of Agricultural ODA in Total ODA, All Donors (1980-2005)
0
5
10
15
20
25
30
1980 1985 1990 1995 2000 2005
Pe
rce
nt
(%)
Source: IFPRI, Badiane (2008)

B U T . . .

Le Monde16 September 2010
Foreign capital investment increase from USD 9 to 62 billion
between 2000 and 2008 (similar to China)
Continent with the highest return of investment - Guillaume
Chaloin, Meeschart Asset Management
In the telecommunications industry the rate of penetration,
which is 37% today, projected to rise to 80%.

The agricultural potential of SSA
• The African Guinea Savannah is one of the largest underused agricultural land reserves in the world
• 60% of uncultivated arable land worldwide are in Africa
• about 600 million hectares in SSA, of which about 400 million hectares can be used for agriculture
• less than 10 percent are cropped

Comparative advantages
• Farm-level production costs in Africa are competitive, This derives mainly from:– very low returns to labor– limited use of purchased inputs
• Africa’s producers are generally competitive in domestic markets BUT generally not competitive in global markets
• Regional markets appear to offer the most promising opportunities for expansion over the short-to-medium term

• The competitiveness of African countries is undermined by inefficiencies in domestic logistics
• Smallholders farmers have a critical role to play as a source of competitiveness– Investments in smallholder agriculture is an important
source of competitiveness in their own right– higher level of second-round demand effects that occur
when income gains
Comparative advantage ctd

• Bright prospects for commercial agriculture• Rapid economic growth and strong demand
prospects• The continent of the • Increased incentives to invest in agriculture• New technologies
– Advanced technology for soil management– The biotechnology revolution
Comparative advantage ctd

Interventions required
• Continuing macro policy reforms• Land policy reforms• Scaling up public investments• Inducing private investment• Institutional reforms to make markets work better• Public sector reform and governance• Management of social impacts• Management of environmental impacts

11
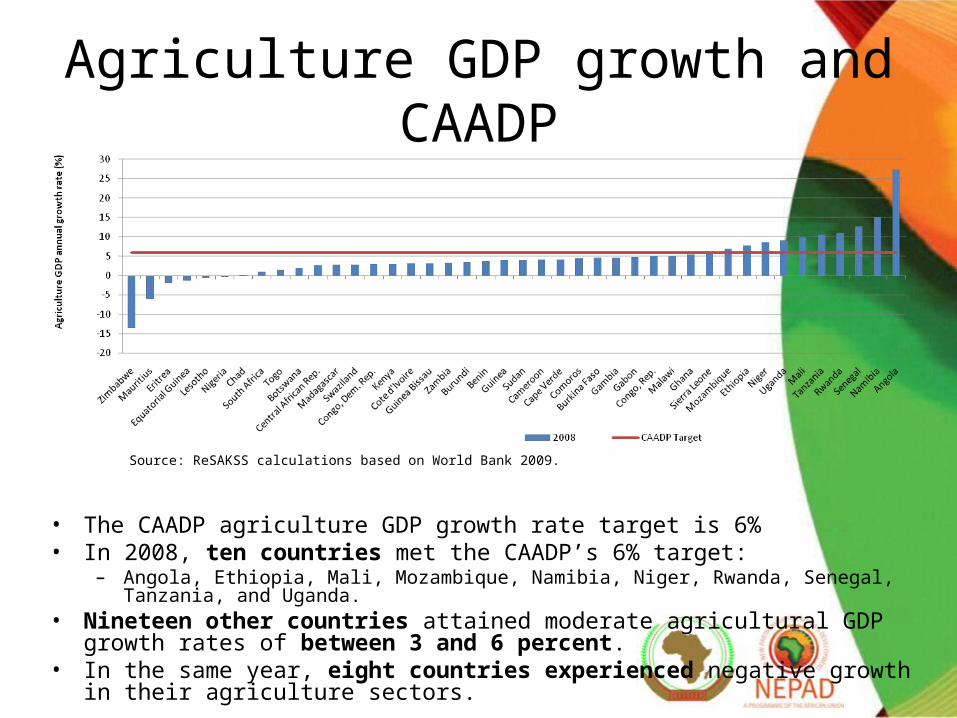
The contribution of CAADP
• 24 national compacts
• 1 regional compact
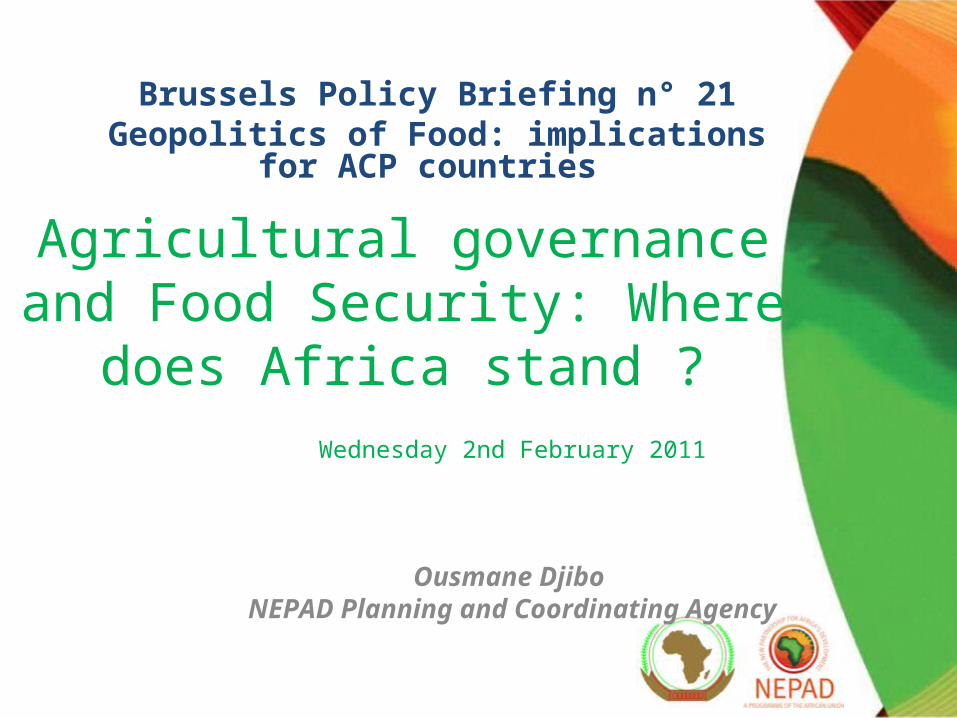
Agriculture GDP growth and CAADP
• The CAADP agriculture GDP growth rate target is 6%• In 2008, ten countries met the CAADP’s 6% target:
– Angola, Ethiopia, Mali, Mozambique, Namibia, Niger, Rwanda, Senegal, Tanzania, and Uganda. • Nineteen other countries attained moderate agricultural GDP growth rates of
between 3 and 6 percent. • In the same year, eight countries experienced negative growth in their agriculture
sectors.
Source: ReSAKSS calculations based on World Bank 2009.

• In 2003, only 5.9% of African countries were spending at least 10% of their total budget allocations on agriculture
• This figure increased to 15.2% in 2007 and to 35.7% in 2008
Sources: Based on ReSAKSS data collected from various national government sources and IMF 2009.
Increase of the share of countries meeting the 10%
The contribution of CAADP

Agricultural performance• Although agricultural performance varies within and across African countries, recent
trends indicate an increase in agricultural GDP growth at the continental and regional levels
• SSA’s agriculture GDP growth rate increased from an annual average of 3.0% in the 1990s and 2000s to 5.3% in 2008
• A similar trend can be observed at the regional level
Source: World Bank 2009. Note: 2009 GDP estimates are from International Monetary Fund (IMF) 2009.

What to do to sustain this encouraging trend ?

CAADP DP Task Team joint visit to ADWGs
Engagement and partnership development
Key milestones:• Government Commitment• Good governance

CAADP DP Task Team joint visit to ADWGs
Stage 2: Evidence-based planning
Key milestones:• Stocktaking
analysis

CAADP DP Task Team joint visit to ADWGs
Building alliances for investment
Key milestones:• Investment planning and review (Pro-Poor Growth oriented)

CAADP DP Task Team joint visit to ADWGs
Stage 4: Program implementation, M&E, and peer review
Key milestones:• Collective
commitment
THANK YOU