Embed Size (px)
Citation preview
Agricultural Exports and 2014 Farm Bill
Programs: Background and Current Issues
Mark A. McMinimy
Analyst in Agricultural Policy
May 9, 2016
Congressional Research Service
7-5700
www.crs.gov
R43696

Agricultural Exports and 2014 Farm Bill Programs: Background and Issues
Congressional Research Service
Summary U.S. agricultural exports have long been a bright spot in the U.S. balance of trade, with exports
exceeding imports in every year since 1960. But the trend of recent years—increasing export
sales and a wider agricultural trade surplus—was reversed in FY2015, and the reversal is
expected to be more pronounced in FY2016. After climbing to a record $152.3 billion in FY2014,
U.S. farm exports declined to $139.7 billion in FY2015, and the U.S. Department of Agriculture
(USDA) projects a further reduction to $125 billion in FY2016. Meanwhile, the value of U.S.
agricultural imports has continued to climb: In consequence, the U.S. agricultural trade surplus
fell to $25.7 billion in FY2015 from a peak of $43.1 billion in FY2014, and it is projected to
narrow further to $6.5 billion in FY2016. Exports are a major outlet for many farm commodities,
representing about 20% of the value of farm production, making exports an important contributor
to farm income.
Among the key variables affecting the value of U.S. agricultural exports are commodity prices,
the value of the U.S. dollar vis-a-vis currencies of trading partners, and the pace of economic
growth—particularly in developing and emerging countries. According to USDA, factors
contributing to a continued downturn in U.S. farm exports in FY2016 include low commodity
prices, a strong U.S. dollar, relatively weak importer demand, and strong foreign competition.
The United States operates a number of programs aimed at developing overseas markets for U.S.
agricultural products and facilitating exports. The Agricultural Act of 2014, P.L. 113-79, extended
most programs from FY2014 through FY2018. The trade title (Title III) of the 2014 farm bill
authorized, amended, and repealed three main types of agricultural export programs:
1. Export market development programs. The Foreign Agricultural Service (FAS) of
USDA administers five market development programs that aim to assist U.S. industry
efforts to build, maintain, and expand overseas markets for U.S. agricultural products.
The five are the Market Access Program (MAP), the Foreign Market Development
Program (FMDP), the Emerging Markets Program (EMP), the Quality Samples
Program (QSP), and the Technical Assistance for Specialty Crops Program (TASC).
2. Export credit guarantee programs. Through the GSM-102 Program and the
Facility Guarantee Program, USDA’s Commodity Credit Corporation (CCC)
guarantees loans so that private U.S. financial institutions will extend financing
to buyers in emerging markets that want to purchase U.S. agricultural products.
The 2014 farm bill shortened the loan term on which export credit guarantees
would be made available to conform to U.S. commitments in the World Trade
Organization (WTO).
3. Direct export subsidy programs. The 2014 farm bill terminated the Dairy
Export Incentive Program (DEIP), which had been inactive for several years.
The 2014 farm bill also directed the Secretary of Agriculture to reorganize USDA’s export and
import activities and create a new Under Secretary of Agriculture position to oversee trade-related
sanitary and phytosanitary issues affecting agriculture, as well as non-tariff trade barriers.
In view of the more challenging market environment for U.S. farm exports, Congress could
weigh possible opportunities to expand foreign markets and remove impediments to farm exports.
For example, the Trans-Pacific Partnership Agreement (TPP), if implemented, would lower many
tariffs that Japan and other TPP nations impose on U.S. farm and food exports. Also, numerous
U.S. agricultural interests assert that U.S. farm exports to Cuba could increase if Congress were
to repeal statutory restrictions on this trade. In addition, U.S. farm groups and lawmakers have
identified foreign subsidies as distorting trade and displacing U.S. farm exports. Another possible
issue for Congress involves overseeing plans to reorganize USDA’s trade functions.
Agricultural Exports and 2014 Farm Bill Programs: Background and Issues
Congressional Research Service
Contents
U.S. Agricultural Exports ................................................................................................................ 1
Economic and Other Factors in Agricultural Trade ......................................................................... 4
USDA’s Agricultural Export Programs ........................................................................................... 9
Market Development Programs .............................................................................................. 10 Authorized Annual Funding Levels .................................................................................. 10 Market Access Program (MAP) ......................................................................................... 11 Foreign Market Development Program (FMDP) ............................................................... 11 Emerging Markets Program (EMP) .................................................................................. 12 Quality Samples Program (QSP) ...................................................................................... 12 Technical Assistance for Specialty Crops (TASC) Program ............................................. 12
Export Credit Guarantees ........................................................................................................ 13 GSM-102 Program ............................................................................................................ 13 Facility Guarantee Program (FGP) ................................................................................... 15 Dairy Export Incentive Program (DEIP) Repealed ........................................................... 15
Funding ................................................................................................................................... 16 Reorganization of Trade Functions at USDA .......................................................................... 17
Issues for Congress ........................................................................................................................ 17
U.S. Agricultural Exports in a Downturn ................................................................................ 17 Trans-Pacific Partnership Agreement (TPP) ..................................................................... 18 Cuban Market for U.S. Farm Products ............................................................................. 18 Trade Distorting Foreign Farm Subsidies ......................................................................... 19
Reorganizing Trade and Farm Services Functions Within USDA .......................................... 20 Public Sector Role and Effectiveness in Export Promotion .................................................... 20
Congressional Efforts to Eliminate Export Promotion Programs Come Up Short ........... 21 Market Access Program Reforms of the 1990s ................................................................. 21
Figures
Figure 1. Value of U.S. Agricultural Trade, FY2000-FY2016 ........................................................ 1
Figure 2. Change in Value of U.S. Dollar vs. Currencies of Major Agricultural Importers
and Export Competitors ............................................................................................................... 7
Tables
Table 1. Top U.S. Agricultural Export Destinations, by Value, FY2015 ......................................... 2
Table 2. Top U.S. Agricultural Export Commodities, by Value, FY2015 ....................................... 3
Table 3. Top Exporting States of Agricultural Commodities, CY2014 ........................................... 4
Table 4. Macroeconomic Variables Affecting U.S. Agricultural Exports ........................................ 5
Table 5. GSM-102 Allocation by Leading Commodities, FY2015 ............................................... 14
Table 6. USDA International Export Program Net Outlays, FY20012-FY2015, and
Budget, FY2016-FY2018 ........................................................................................................... 16
Table A-1. Value of U.S. Agricultural Trade, FY1960-FY2016 .................................................... 23

Agricultural Exports and 2014 Farm Bill Programs: Background and Issues
Congressional Research Service
Appendixes
Appendix. Value of U.S. Agricultural Trade ................................................................................. 23
Contacts
Author Contact Information .......................................................................................................... 24
Agricultural Exports and 2014 Farm Bill Programs: Background and Issues
Congressional Research Service 1
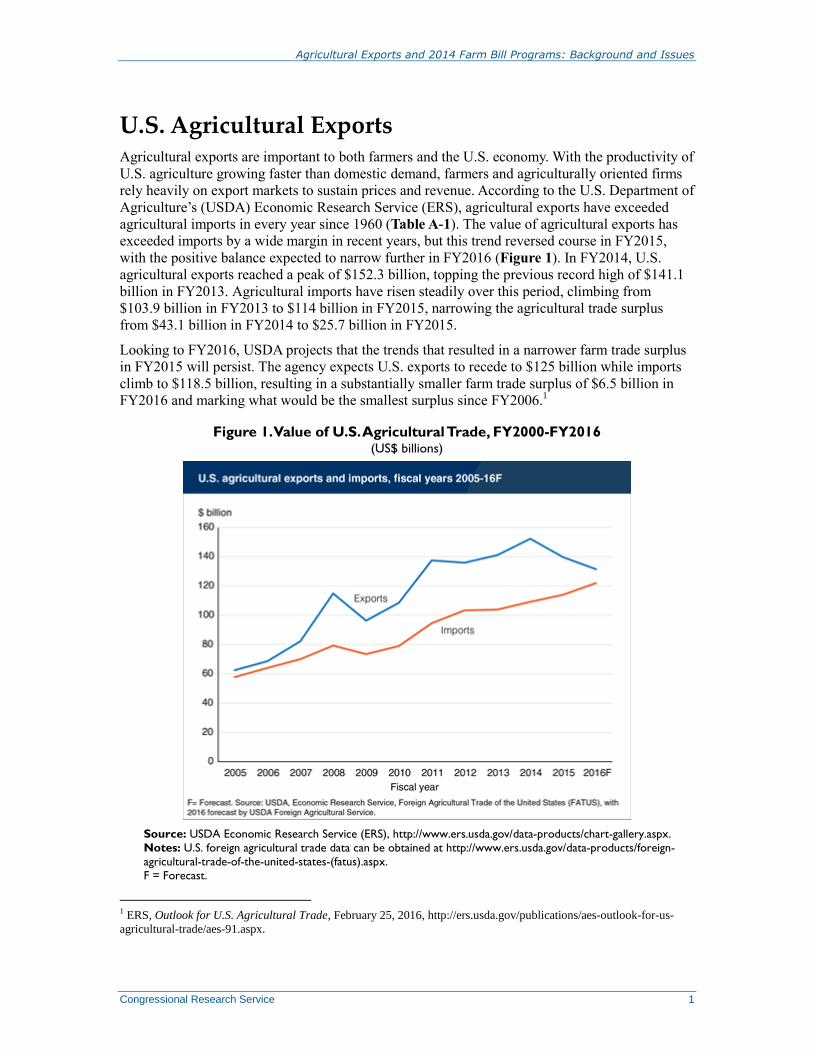
U.S. Agricultural Exports Agricultural exports are important to both farmers and the U.S. economy. With the productivity of
U.S. agriculture growing faster than domestic demand, farmers and agriculturally oriented firms
rely heavily on export markets to sustain prices and revenue. According to the U.S. Department of
Agriculture’s (USDA) Economic Research Service (ERS), agricultural exports have exceeded
agricultural imports in every year since 1960 (Table A-1). The value of agricultural exports has
exceeded imports by a wide margin in recent years, but this trend reversed course in FY2015,
with the positive balance expected to narrow further in FY2016 (Figure 1). In FY2014, U.S.
agricultural exports reached a peak of $152.3 billion, topping the previous record high of $141.1
billion in FY2013. Agricultural imports have risen steadily over this period, climbing from
$103.9 billion in FY2013 to $114 billion in FY2015, narrowing the agricultural trade surplus
from $43.1 billion in FY2014 to $25.7 billion in FY2015.
Looking to FY2016, USDA projects that the trends that resulted in a narrower farm trade surplus
in FY2015 will persist. The agency expects U.S. exports to recede to $125 billion while imports
climb to $118.5 billion, resulting in a substantially smaller farm trade surplus of $6.5 billion in
FY2016 and marking what would be the smallest surplus since FY2006.1
Figure 1. Value of U.S. Agricultural Trade, FY2000-FY2016 (US$ billions)
Source: USDA Economic Research Service (ERS), http://www.ers.usda.gov/data-products/chart-gallery.aspx.
Notes: U.S. foreign agricultural trade data can be obtained at http://www.ers.usda.gov/data-products/foreign-
agricultural-trade-of-the-united-states-(fatus).aspx.
F = Forecast.
1 ERS, Outlook for U.S. Agricultural Trade, February 25, 2016, http://ers.usda.gov/publications/aes-outlook-for-us-
agricultural-trade/aes-91.aspx.
Agricultural Exports and 2014 Farm Bill Programs: Background and Issues
Congressional Research Service 2
For perspective, USDA estimates that during the most recent three years (2013-2015), the value
of U.S. agricultural exports accounted for between 10% and 11% of total U.S. exports, while U.S.
agricultural imports made up 5% of total imports.2 Within the agricultural sector, the importance
of exports looms even larger, accounting for 20% of the value of overall agricultural production
in 2013, the most recent year for which USDA data are available.3
Foreign markets represent the largest outlet for a number of U.S. farm commodities while
providing a substantial market for many other agricultural products. During the 2014/2015
marketing year, export markets absorbed 69% of U.S. cotton production, 41% of wheat output,
and 47% of the soybean harvest. In the livestock sector, USDA estimates the export share of pork,
broiler meat, and beef production in 2015 amounted to 20%, 16%, and 10%, respectively.4
Foreign markets also represent the largest outlet for certain specialty crops, including tree nuts.
USDA indicates that during the 2014/2015 season, export markets absorbed 71% of the
marketable production of U.S. walnuts, 68% of almond production, 75% of the pecan crop, and
59% of pistachios.5
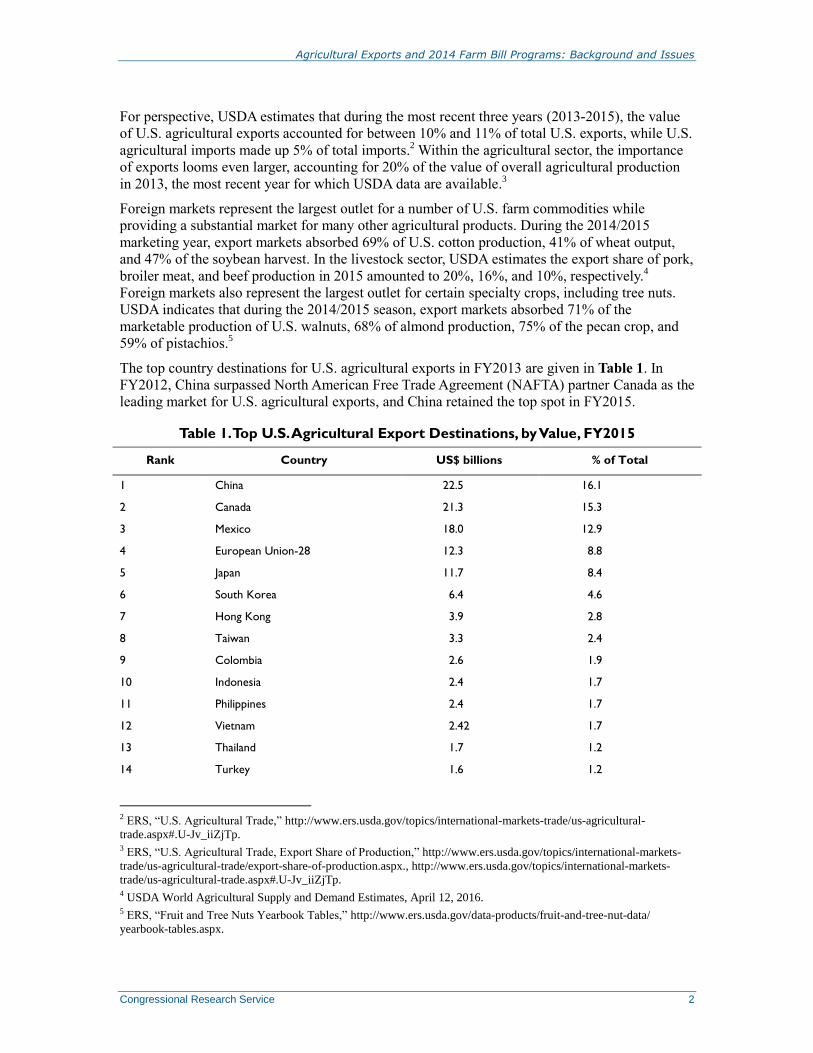
The top country destinations for U.S. agricultural exports in FY2013 are given in Table 1. In
FY2012, China surpassed North American Free Trade Agreement (NAFTA) partner Canada as the
leading market for U.S. agricultural exports, and China retained the top spot in FY2015.
Table 1. Top U.S. Agricultural Export Destinations, by Value, FY2015
Rank Country US$ billions % of Total
1 China 22.5 16.1
2 Canada 21.3 15.3
3 Mexico 18.0 12.9
4 European Union-28 12.3 8.8
5 Japan 11.7 8.4
6 South Korea 6.4 4.6
7 Hong Kong 3.9 2.8
8 Taiwan 3.3 2.4
9 Colombia 2.6 1.9
10 Indonesia 2.4 1.7
11 Philippines 2.4 1.7
12 Vietnam 2.42 1.7
13 Thailand 1.7 1.2
14 Turkey 1.6 1.2
2 ERS, “U.S. Agricultural Trade,” http://www.ers.usda.gov/topics/international-markets-trade/us-agricultural-
trade.aspx#.U-Jv_iiZjTp. 3 ERS, “U.S. Agricultural Trade, Export Share of Production,” http://www.ers.usda.gov/topics/international-markets-
trade/us-agricultural-trade/export-share-of-production.aspx., http://www.ers.usda.gov/topics/international-markets-
trade/us-agricultural-trade.aspx#.U-Jv_iiZjTp. 4 USDA World Agricultural Supply and Demand Estimates, April 12, 2016. 5 ERS, “Fruit and Tree Nuts Yearbook Tables,” http://www.ers.usda.gov/data-products/fruit-and-tree-nut-data/
yearbook-tables.aspx.
Agricultural Exports and 2014 Farm Bill Programs: Background and Issues
Congressional Research Service 3
Rank Country US$ billions % of Total
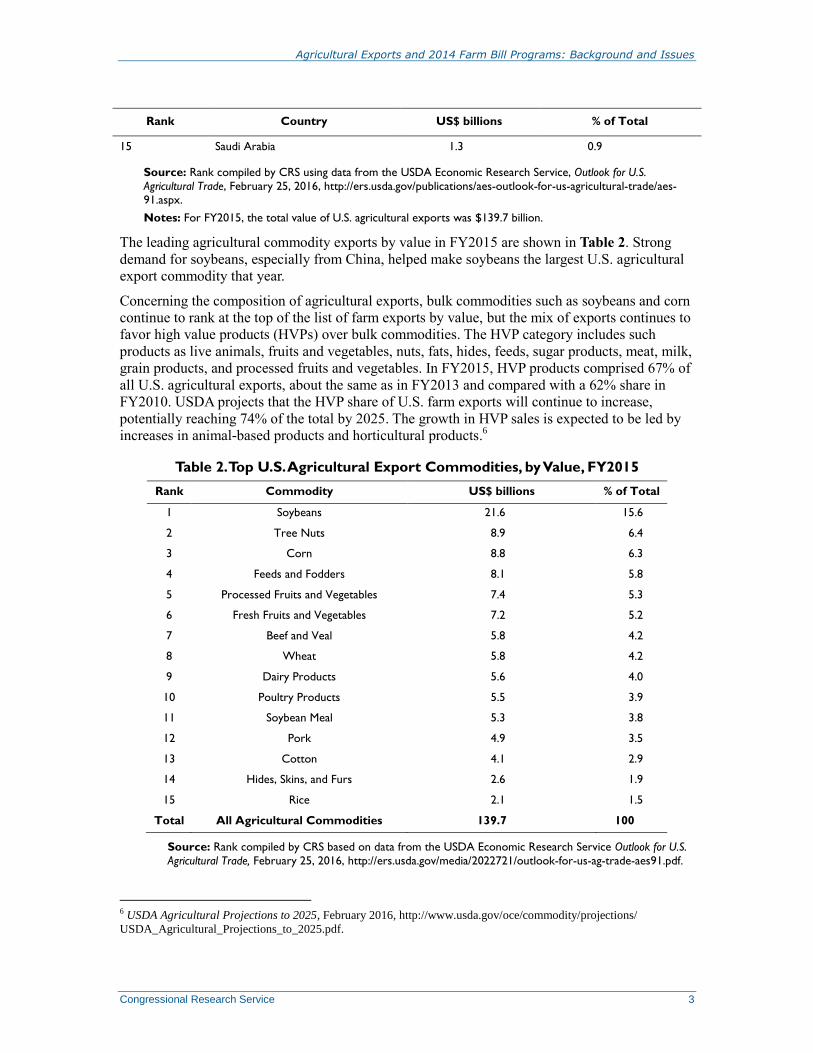
15 Saudi Arabia 1.3 0.9
Source: Rank compiled by CRS using data from the USDA Economic Research Service, Outlook for U.S.
Agricultural Trade, February 25, 2016, http://ers.usda.gov/publications/aes-outlook-for-us-agricultural-trade/aes-91.aspx.
Notes: For FY2015, the total value of U.S. agricultural exports was $139.7 billion.
The leading agricultural commodity exports by value in FY2015 are shown in Table 2. Strong
demand for soybeans, especially from China, helped make soybeans the largest U.S. agricultural
export commodity that year.
Concerning the composition of agricultural exports, bulk commodities such as soybeans and corn
continue to rank at the top of the list of farm exports by value, but the mix of exports continues to
favor high value products (HVPs) over bulk commodities. The HVP category includes such
products as live animals, fruits and vegetables, nuts, fats, hides, feeds, sugar products, meat, milk,
grain products, and processed fruits and vegetables. In FY2015, HVP products comprised 67% of
all U.S. agricultural exports, about the same as in FY2013 and compared with a 62% share in
FY2010. USDA projects that the HVP share of U.S. farm exports will continue to increase,
potentially reaching 74% of the total by 2025. The growth in HVP sales is expected to be led by
increases in animal-based products and horticultural products.6
Table 2. Top U.S. Agricultural Export Commodities, by Value, FY2015
Rank Commodity US$ billions % of Total
1 Soybeans 21.6 15.6
2 Tree Nuts 8.9 6.4
3 Corn 8.8 6.3
4 Feeds and Fodders 8.1 5.8
5 Processed Fruits and Vegetables 7.4 5.3
6 Fresh Fruits and Vegetables 7.2 5.2
7 Beef and Veal 5.8 4.2
8 Wheat 5.8 4.2
9 Dairy Products 5.6 4.0
10 Poultry Products 5.5 3.9
11 Soybean Meal 5.3 3.8
12 Pork 4.9 3.5
13 Cotton 4.1 2.9
14 Hides, Skins, and Furs 2.6 1.9
15 Rice 2.1 1.5
Total All Agricultural Commodities 139.7 100
Source: Rank compiled by CRS based on data from the USDA Economic Research Service Outlook for U.S.
Agricultural Trade, February 25, 2016, http://ers.usda.gov/media/2022721/outlook-for-us-ag-trade-aes91.pdf.
6 USDA Agricultural Projections to 2025, February 2016, http://www.usda.gov/oce/commodity/projections/
USDA_Agricultural_Projections_to_2025.pdf.
Agricultural Exports and 2014 Farm Bill Programs: Background and Issues
Congressional Research Service 4
Agricultural exports make a significant contribution to the overall U.S. economy. USDA
estimates that each dollar of agricultural exports stimulates an additional $1.27 in business
activity, while each $1 billion in agricultural exports supports 7,550 jobs.7
Nearly every state produces agricultural commodities that are exported. Actual exports of
agricultural commodity production by state are not available as such, but USDA provides
estimates of commodity exports by state based on data for U.S. farm cash receipts. Table 3
provides a listing of the 10 states with the highest estimated shares of U.S. agricultural exports by
value in calendar year (CY) 2014. These 10 states accounted for 56% of total U.S. agricultural
exports that year.
Table 3. Top Exporting States of Agricultural Commodities, CY2014
Rank State US$ billions % of Total
1 California 23.6 15.7
2 Iowa 11.3 7.5
3 Illinois 9.3 6.2
4 Minnesota 7.3 4.9
5 Nebraska 7.3 4.9
6 Texas 6.4 4.3
7 Indiana 5.7 3.8
8 Kansas 4.7 3.1
9 North Dakota 4.5 3.0
10 Ohio 4.5 3.0
Total Top 10 States 84.6 56.4
Source: USDA, Economic Research Service, “State Export Data,” http://www.ers.usda.gov/data-
products/state-export-data.aspx.
Notes: For CY2014, the total value of U.S. agricultural exports was $150.0billion.
Economic and Other Factors in Agricultural Trade U.S. and global trade are greatly affected by the growth and stability of world markets.
8 Changes
in world population, economic growth, and income; tastes and preferences in foreign markets;
and exchange rates are most likely to alter global food demand. U.S. domestic farm policies that
affect price and supply, as well as trade agreements with other countries, also influence the level
of U.S. agricultural exports. According to USDA, world economic growth—particularly sustained
relatively high growth in developing countries—provides a foundation for increases in global
food demand, trade, and agricultural exports.
Developing countries are expected to drive most of the growth in demand for U.S. agricultural
exports in the years ahead, reflecting the outlook for faster population growth in these countries
and rising incomes associated with an expanding middle class. These economic trends, coupled
with younger population demographics and increased urbanization, are closely associated with
7 USDA FY2017 Budget Summary and Annual Performance Plan, http://www.obpa.usda.gov/budsum/fy17budsum.pdf 8 For more information about U.S. agricultural trade, see USDA, “U.S. Agricultural Trade,” http://ers.usda.gov/topics/international-markets-trade/us-agricultural-trade.aspx.

Agricultural Exports and 2014 Farm Bill Programs: Background and Issues
Congressional Research Service 5
greater diversification of diets and increased demand for meat, dairy products, and processed
foods that tend to shift import demand in favor of feedstuffs and HVPs.9
Global economic growth is projected to rise to 3.1% in 2016 from 2.8% in 2015, according to
USDA.10
Table 4 contains a breakdown of growth prospects by major regions and key countries.
Economic growth is expected to be led by moderately stronger growth in the United States, a
further uptick in economic activity in the European Union and Africa, relatively stable growth
prospects in Asia and Oceania overall amid slower growth in China. A further downturn in
Brazil’s economic prospects may weigh on growth prospects in South America.
Table 4. Macroeconomic Variables Affecting U.S. Agricultural Exports
Region/Country
Share of World GDP
2015 GDP Growth Rate
2016 GDP Growth Rate
Real Exchange Ratea
2015
Real Exchange Rate
2016
World (U.S. trade,
weighted) 100% 2.8% 3.1% 8.6 3.8
NAFTA 26.3% 2.3% 2.5% 2.0 0.9
Canada 2.5% 1.2% 1.6% 14.7 6.4
United States 23.1% 2.4% 2.6% 0.0 0.0
Mexico 1.1% 2.5% 2.5% 16.2 7.4
Latin America 7.7% -0.5 0.0% 11.2 8.8
Argentina 0.7% 1.3% 0.5% -.16 33.4
Brazil 3.4% -3.7% -3.0% 30.0 27.3
Eurozone 24.1% 1.5% 2.0% 19.8 4.5
Asia and Oceania 28.7% 4.4% 4.5% 6.5 4.3
China 9.3% 6.9% 6.3% 0.7 6.4
Japan 8.4% 0.7% 1.2% 13.4 3.1
South Korea 1.7% 2.5% 3.0% 6.8 7.2
Indonesia 1.2% 4.8% 5.0% 6.2 2.6
Vietnam 0.2% 6.7% 6.4% 0.3 -1.0
India 2.6% 7.3% 7.5% 1.0 3.1
Australia 1.8% 2.4% 2.6% 18.4 7.1
New Zealand 0.2% 2.2% 2.5% 18.6 4.4
Middle East 4.2% 2.5% 3.2% 5.2 2.5
Turkey 1.1% 3.3% 3.0% 15.6 8.4
Africa 2.9% 3.4% 3.8% 6.6 1.5
Source: Calculations and compilation by USDA’s Economic Research Service using data from Global Insight, the
International Monetary Fund, and Oxford Economics.
9 USDA, “Agricultural Projections to 2023,” pp. 2, 7, 88, http://www.ers.usda.gov/publications/oce-usda-agricultural-
projections/oce141.aspx#.U8gbziiZjTo. 10 ERS, Outlook for U.S. Agricultural Trade, February 25, 2016, http://www.ers.usda.gov/publications/aes-outlook-for-us-agricultural-trade/aes-91.aspx.
Agricultural Exports and 2014 Farm Bill Programs: Background and Issues
Congressional Research Service 6
a. Local currency per U.S. dollar. A negative rate indicates a depreciation of the dollar. Real exchange rates
have a 2010 base year.
b. The eurozone consists of the 19 countries that have adopted the euro as their common currency.
A leading factor in the decline in the value of U.S. agricultural exports in FY2015 was lower
prevailing market prices for numerous farm commodities. For instance, the average farm prices of
2014-crop soybeans and corn (marketed from September 1, 2014, to August 31, 2015) were lower
than average prices for the 2013 crops by 22% and 17%, respectively. Farm prices for major
animal products—including beef cattle, hogs, broilers, and milk—were also lower in 2015
compared to 2014, thereby contributing to the lower dollar value of export sales in FY2015.11
Another factor influencing U.S. agricultural trade is the value of the U.S. dollar relative to foreign
currencies. Following a 10-year period of dollar depreciation from 2002 to 2011, the U.S.
currency has since strengthened. The dollar is projected to continue to strengthen relative to most
foreign currencies in 2016, though not as sharply as it appreciated in 2015 (Figure 2). In part, the
stronger U.S. dollar reflects relatively favorable economic prospects for the U.S. economy
compared with circumstances elsewhere. For agriculture, a stronger dollar makes U.S.
commodities more expensive in local currency for foreign buyers and renders U.S. products less
competitive in relation to commodities from export competitors with weaker currencies, such as
Brazil and Argentina. In this way the stronger dollar contributed to a lower level of farm exports
in FY2015 with projected dollar strengthening expected to have a similar effect in FY2016.12
The
stronger dollar also encourages increased levels of U.S. agricultural imports by making foreign
products cheaper in U.S. dollar terms.
11 USDA, World Agricultural Supply and Demand Estimates, April 12, 2016, http://www.usda.gov/oce/commodity/
wasde/index.htm. 12 ERS, Outlook for U.S. Agricultural Trade, February 25, 2016 and USDA Agricultural Projections to 2025.

Agricultural Exports and 2014 Farm Bill Programs: Background and Issues
Congressional Research Service 7
Figure 2. Change in Value of U.S. Dollar vs. Currencies of Major Agricultural
Importers and Export Competitors
Source: Reprinted from U.S. Department of Agriculture, http://www.usda.gov/oce/forum/2016_speeches/Johansson_Outlook_2016_slides.pdf.
Notes: Y-O-Y designates year-on-year change.
Agricultural Exports and 2014 Farm Bill Programs: Background and Issues
Congressional Research Service 8
U.S. trade policy and geopolitical events also factor into the level of agricultural exports. Trade
liberalization efforts aim to expand international commerce by lowering various barriers to trade
and broadening access to foreign markets. These efforts include multilateral agreements under the
auspices of the General Agreement on Tariffs and Trade (GATT) and its successor, the World
Trade Organization (WTO), as well as regional trade agreements such as NAFTA, and bilateral
free trade agreements, including the recent Korea-U.S. Free Trade Agreement (KORUS FTA).
Geopolitical events, such as economic sanctions, can influence the scope of trade in agricultural
products as well. The effects of sanctions are often temporary, as commodities are fungible and
trade flows tend to realign. One such event was the embargo that President Jimmy Carter imposed
on U.S. grain sales to the Soviet Union in January 1980 in response to the Soviet invasion of
Afghanistan in December 1979. At the time, the Soviet Union was the largest importer of U.S.
grain and feed. The quantity of U.S. grain and feed exports to the Soviet Union plunged by 66%
in 1980, but total exports of U.S. grain and feed that year climbed by 10% as other importers
absorbed the displaced grain.
More recently, on August 7, 2014, Russia banned the import of certain foods—including certain
beef, pork, poultry, fish, seafood, fruits, nuts, vegetables, sausages, and prepared foods—from a
number of Western countries, including the United States, in retaliation for economic sanctions
imposed on Russia for its actions in Ukraine. Banned food imports from the affected countries
amounted to 22% of the value of Russia’s food imports in 2013. The U.S. share of the affected
product imports amounted to about 9% of the total but comprised only about 0.5% of annual U.S.
agricultural exports. In the wake of the ban, U.S. agricultural exports to Russia have fallen from a
total of 712,697 metric tons in 2013 to 565,652 metric tons in 2015. Shipments of poultry meat
and products have been severely affected, declining from 276,636 metric tons in 2013 prior to the
ban to zero in 2015.13
U.S. Agricultural Trade and the Trans-Pacific Partnership Agreement (TPP)
In February 2016, the Obama Administration signed the TPP, a proposed regional free trade agreement (FTA) with 11
other Pacific nations: Australia, Brunei, Canada, Chile, Japan, Malaysia, Mexico, New Zealand, Peru, Singapore, and
Vietnam. Importantly, the TPP will not have the force of law until it is ratified by the countries involved, which would
require enacting implementing legislation in the United States.14
If implemented, TPP would be the largest regional FTA to which the United States is a party. In 2015, TPP countries
absorbed 43% of U.S. agricultural exports and supplied 51% of U.S. agricultural imports.
Among the five TPP countries with which the United States currently lacks an FTA—Brunei, Japan, Malaysia, New
Zealand, and Vietnam—Japan, Malaysia, and Vietnam have a combined population of roughly 250 million. Moreover,
each of these three countries imposes significantly higher average combined tariffs on agricultural products than does
the United States, suggesting the potential for U.S. agricultural products to make greater inroads into these markets
as a result of more favorable market access that would be provided under TPP.
Prominent among the market access provisions in the agreement are liberalized terms of trade in agricultural
products, including a reduction in tariff rates, which for many products would be lowered to zero. For example, the
agreement provides that Japan—the largest foreign market for U.S. beef—would lower its tariff on fresh, chilled, and
frozen beef from 38.5% currently to 27.5% once the agreement enters into force. Japan’s tariff would then be
progressively lowered to 9% by year 16. In one of numerous other examples, Japan would eliminate seasonal tariffs on
oranges of 16% and 32% over six and eight years, respectively.
13 For more on Russia’s import ban, see U.S. Trade Representative, The 2016 National Trade Estimate Report,
https://ustr.gov/sites/default/files/2016-NTE-Report-FINAL.pdf. 14 For additional background on the TPP agreement, see CRS Report R44278, The Trans-Pacific Partnership (TPP): In
Brief, by Ian F. Fergusson, Mark A. McMinimy, and Brock R. Williams. After two years from its signing in February
2016, TPP may enter into force if ratified by six countries accounting for 85% of the membership’s GDP, which, in
practice, would require U.S. and Japanese participation.
Agricultural Exports and 2014 Farm Bill Programs: Background and Issues
Congressional Research Service 9
Other farm products would benefit from expanded tariff rate quotas (TRQs), which allow TPP participants to export
increased quantities of certain products either duty-free or at sharply reduced rates of duty. Japan has agreed to a
country-specific quota that would allow an additional 114,000 metric tons of U.S. wheat to be imported on a duty-
free basis. This concession—equivalent to about 0.5% of total U.S. wheat exports in the 2014/2015 marketing year—
would be expanded to 150,000 tons over seven years.
The United States would also provide market access concessions across numerous categories of agricultural imports
that are currently subject to either import tariffs or TRQs. U.S. tariffs on beef and beef products, which range as high
as 26.4%, would be eliminated in no more than 15 years, while new TRQs would be established for sugar and sugar-
containing products from several countries, including Australia and Canada. New TRQs would also be established for
a range of dairy products.15
The TPP agreement has met with substantial support from U.S. agriculture, agribusiness, and food industry interests,
but TPP has its detractors within these industries as well. Among the numerous assessments of how the TPP
agreement could affect U.S. agricultural food industry interests are the following:
The American Farm Bureau Federation, the largest U.S. general farm organization, issued an analysis in February
2016 that concluded that the TPP agreement would boost net trade in numerous agricultural commodities,
resulting in higher receipts for both the crop and livestock sectors while also lifting annual net farm income by $4.4 billion after TPP is fully implemented compared with a scenario. in which a similar agreement enters into
force without U.S. participation.16
The National Farmers Union (NFU) has expressed its opposition to the agreement, asserting that even though
TPP could provide for modest increases in U.S. agricultural exports, this benefit could be overshadowed by
massive increases in agricultural imports. NFU also faults TPP for its lack of enforcement measures to address
the U.S. trade deficit and curtail currency manipulation.17
The U.S. International Trade Commission (ITC) is to issue a report on the projected economic impact of the
agreement on the U.S. economy as a whole, as well as on specific industry sectors and on consumers as required
by P.L. 114-26, the law that provides the President with trade promotion authority. ITC has stated that it intends
to transmit its report to the President and to Congress by May 18, 2016.
USDA’s Agricultural Export Programs Recognizing the importance of agricultural exports to the financial well-being of the U.S. farm
sector, farm bills have typically included programs that promote commercial agricultural exports.
The 2014 farm bill continues this pattern.
USDA’s Foreign Agricultural Service (FAS) works to improve the competitive position of U.S.
agriculture in the global marketplace.18
To this end, FAS administers several export programs
designed to improve the competitive position of U.S. agricultural goods in the world marketplace
with the objective of facilitating export sales and improving foreign market access for U.S. farm
products. The trade title of the 2014 farm bill, the Agricultural Act of 2014 (Title III of P.L. 113-
79), as signed into law on February 7, 2014, establishes policy for five years through FY2018.
The law reauthorizes and amends USDA’s foreign agricultural export programs. Budget authority
for these programs is mandatory and not subject to annual appropriations. Funds required for
15 For more on the potential implications of the TPP agreement for U.S. agriculture, see CRS Report R44337, American
Agriculture and the Trans-Pacific Partnership (TPP) Agreement, by Mark A. McMinimy. 16 American Farm Bureau Federation, Comments Regarding Effects of Trans-Pacific Partnership on the United States
Agricultural Sector, February 2016, http://www.fb.org/issues/tpp/pdf/TPP%20Full%20Report.pdf. 17 Testimony of Roger Johnson, President, National Farmers Union, to the U.S. International Trade Commission,
January 13, 2016, http://nfu.org/wp-content/uploads/2016/01/01-12-15-Testimony-on-TPP-for-USITC.pdf. 18 An overview of FAS is available at http://www.fas.usda.gov/aboutfas.asp.
Agricultural Exports and 2014 Farm Bill Programs: Background and Issues
Congressional Research Service 10
these export programs are provided directly by the Commodity Credit Corporation (CCC)
through its borrowing authority.19
Agricultural export programs generally fit within three broad groupings:
1. Export market development programs,
2. Export credit guarantee programs, and
3. Direct export subsidies.
The 2014 farm bill made several changes to Title III but left intact most programs that facilitate
overseas market development and sales. Key changes include alterations to the Export Credit
Guarantee Program to align it with WTO rulings concerning its use in facilitating exports of U.S.
cotton and the elimination of the Dairy Export Incentive Program (DEIP), which effectively
curtailed the use of direct export subsidies. The bill also directs the Secretary of Agriculture to
establish the position of Under Secretary of Agriculture for Trade and International Affairs as part
of a reorganization of the agency’s trade functions.
Market Development Programs
FAS supports U.S. industry efforts to build, maintain, and expand overseas markets for U.S. food
and agricultural products. FAS administers five market development programs:
1. Market Access Program (MAP),
2. Foreign Market Development Program (FMDP),
3. Emerging Markets Program (EMP),
4. Quality Samples Program (QSP), and
5. Technical Assistance for Specialty Crops Program (TASC).
In general, these programs provide matching funds to U.S. organizations to conduct a wide range
of activities, including market research, consumer promotion, trade servicing, capacity building,
and market access support. FAS also facilitates U.S. participation in a range of international trade
shows. The 2014 farm bill extended legislative authorization of CCC funds for these market
development programs for FY2014 through FY2018. Export programs are funded through the
borrowing authority of the CCC.
Authorized Annual Funding Levels
Mandatory annual funding for market development programs as authorized in the 2014 farm bill
includes $200 million for MAP, $34.5 million for the FMDP, $10 million for the EMP, and $9
million for TASC. QSP is authorized under the CCC Charter Act, not the farm bill, and is funded
through CCC’s borrowing authority.
19 The CCC is a corporation created in 1933 that is owned and operated by the U.S. government. It has broad powers to
support farm income and prices and assist in the export of U.S. agricultural products. Toward this end, the CCC
finances USDA’s domestic price and income support programs and its export programs using its permanent authority to
borrow up to $30 billion at any one time from the U.S. Treasury. More information is available at
http://www.fsa.usda.gov/FSA/webapp?area=about&subject=landing&topic=sao-cc.

Agricultural Exports and 2014 Farm Bill Programs: Background and Issues
Congressional Research Service 11
Market Access Program (MAP)20
MAP—which aids in the creation, expansion, and maintenance of foreign markets for U.S.
agricultural products—was originally authorized by the Agricultural Trade Act of 1978 (P.L. 95-
501, as amended) and is administered by FAS.21
MAP provides funding to nonprofit U.S.
agricultural trade associations, nonprofit U.S. agricultural cooperatives, nonprofit state-regional
trade groups, and small U.S. businesses for overseas marketing and promotional activities, such
as trade shows, market research, consumer promotions for retail products, technical capacity
building, and seminars to educate overseas customers. MAP funds assist primarily value-added
products, such as cotton, fruits, dairy products, meat, nuts, wood products, wine, and seafood.
MAP funds can be used to support both generic promotions and brand-name promotions. Generic
promotions are undertaken by nonprofit trade associations, state regional groups, and state
agencies to increase demand for a specific commodity (e.g., peas, lentils, cotton) with no
emphasis on a particular brand.
MAP funds may be spent by the participating organizations themselves (direct funding) or
redistributed to entities that have applied to participating organizations for MAP assistance
(indirect funding). Since FY1998, USDA policy has been to prohibit the allocation of MAP funds
to large U.S. companies. Agricultural cooperatives and small U.S. companies22
can receive
assistance under the brand program, which seeks to establish consumer loyalty for their brand-
name products.23
To conduct branded product promotion activities, individual companies must
provide a funding match of at least 50% of the total marketing cost. For generic promotion
activities, trade associations and others must meet a minimum 10% match requirement.
Although MAP is a mandatory program and hence does not require an annual appropriation,
agriculture appropriations acts have on occasion capped the amounts that could be spent on the
program or imposed other restraints on programming. For example, the FY1996 Agriculture
Appropriations Act prohibited MAP spending to promote exports of mink pelts or garments.
Since 1993, no MAP funds may be used to promote tobacco exports.
MAP has been targeted for cuts by some Members of Congress who maintain that it is a form of
corporate welfare, or to help offset increased expenditures on other programs, but such efforts
have been unsuccessful. MAP funding steadily increased from $90 million in FY2000 to $200
million in FY2006, where it has remained. The 2014 farm bill reauthorized CCC funding for
MAP at then-current mandatory funding levels of $200 million annually through FY2018.
Foreign Market Development Program (FMDP)24
FMDP was established in 1955 and, like MAP, has the primary objective of assisting industry
organizations in the expansion of export opportunities. The 2014 farm bill reauthorizes CCC
funding for FMDP for FY2014-FY2018 at an annual level of $34.5 million. The 1996 farm bill
provided new statutory authority for the program. Funding for FMDP has been maintained at
$34.5 million since the 2002 farm bill.
20 Additional information on MAP is available at http://www.fas.usda.gov/mos/programs/map.asp. 21 MAP had two predecessor programs. In 1996, MAP replaced the Market Promotion Program, which was established
in 1990 to replace the Targeted Export Assistance Program authorized in 1985. 22 As defined by the Small Business Administration. 23 A listing of MAP funding allocations by participating organization for FY2013 and FY2014 is available at
http://www.fas.usda.gov/programs/market-access-program-map/map-funding-allocations-fy-2013. 24 Additional information on FMDP is available at http://www.fas.usda.gov/mos/programs/fmdprogram.asp.

Agricultural Exports and 2014 Farm Bill Programs: Background and Issues
Congressional Research Service 12
FMDP funds industry groups, with a match requirement, to undertake activities such as consumer
promotions, technical assistance, trade servicing, and market research by the government and
industry groups. Unlike MAP, which mainly promotes consumer goods and brand-name products,
FMDP mainly promotes generic or bulk commodities.
Emerging Markets Program (EMP)25
EMP assists U.S. entities in developing, maintaining, and expanding the exports of U.S.
agricultural commodities and products by providing partial funding for technical assistance
activities that promote U.S. agricultural exports to emerging markets. Emerging markets are
defined as any country or regional grouping that (1) is taking steps toward a market-oriented
economy through the food, agriculture, or rural business sectors of the economy of the country;
(2) has the potential to provide a viable and significant market for U.S. agricultural commodities
or products; (3) has a population greater than 1 million; and (4) has a per-capita income level
below the level for upper-middle-income countries as determined by the World Bank.
The program is intended primarily to support export market development efforts of the private
sector, but its resources may also be used to assist public agricultural organizations. Technical
assistance may include activities such as feasibility studies, market research, sector assessments,
orientation visits, specialized training, business workshops, and similar undertakings.
The 2014 farm bill extended EMP through FY2018, authorizing up to $10 million of CCC
funding annually through FY2018—unchanged from the 2008 farm bill—to carry out technical
assistance activities to promote U.S. agricultural exports and address technical barriers to trade in
emerging markets.
Quality Samples Program (QSP)26
QSP assists U.S. agricultural trade organizations in providing small samples of their agricultural
products to potential importers in emerging markets overseas. QSP focuses on industrial and
manufacturing users of products, not end-use consumers, and allows manufacturers overseas to
do test runs to assess how U.S. food and fiber products can best meet their production needs.
Priority is given to projects targeting developing nations or regions with a per-capita income of
less than $10,725 and a population greater than 1 million. Priority is also given to projects
designed to expand exports where a U.S. commodity’s market share is 10% or less. Operating
under the authority of the CCC Charter Act of 1948, FAS used $1.06 million of CCC funds in
FY2013, $1.29 million in 2014, and $1.57 million in FY2015 to carry out the program. The
USDA estimated net expenditures of $2.55 million in FY2016, while the President’s budget for
FY2017 estimates net expenditures of 2.56 million.
Technical Assistance for Specialty Crops (TASC) Program27
TASC aims to assist U.S. exporters by funding projects that address sanitary, phytosanitary, and
technical barriers that prohibit or limit U.S. specialty crop exports. The 2008 farm bill defined
specialty crops as all cultivated plants, and the products thereof, produced in the United States
except wheat, feed grains, oilseeds, cotton, rice, peanuts, sugar, and tobacco. The 2014 farm bill
broadened TASC’s scope, replacing “related barriers” with “technical barriers,” which allows
25 Additional information on EMP is available at http://www.fas.usda.gov/programs/emerging-markets-program-emp. 26 Additional information on the QSP is available at http://www.fas.usda.gov/mos/programs/QSP.asp. 27 Additional information on TASC is available at http://www.fas.usda.gov/mos/tasc/tasc.asp.
Agricultural Exports and 2014 Farm Bill Programs: Background and Issues
Congressional Research Service 13
TASC to fund projects that address technical barriers to trade that are not related to a sanitary or
phytosanitary barrier.
The types of activities covered include seminars and workshops, study tours, field surveys, pest
and disease research, and preclearance programs. The 2014 farm bill authorizes TASC funding of
$9 million annually from FY2014 through FY2018, unchanged from the FY2011-FY2013
authorization levels. Also under this section of the bill, Congress directed the Secretary of
Agriculture to conduct an economic study of the existing market in the United States for Atlantic
spiny dogfish within 90 days of the bill’s enactment. According to USDA, the report was
communicated to the appropriate committees of the House and Senate on May 22, 2014.28
Export Credit Guarantees
For FY2014 through FY2018, the 2014 farm bill reauthorized USDA-operated export credit
guarantee programs, which were first established in the Agricultural Trade Act of 1978 (P.L. 95-
501) to facilitate sales of U.S. agricultural exports. Under these programs, private U.S. financial
institutions extend financing at prevailing market interest rates to countries that want to purchase
U.S. agricultural exports with a CCC guarantee that the loans will be repaid. In guaranteeing
these loans, the CCC assumes the risk of default on payments by the foreign purchasers on loans
for U.S. farm exports. Two export credit guarantee programs were reauthorized: the short-term
credit guarantee program (GSM-102) and the Facility Guarantee Program (FGP).
GSM-102 Program29
The GSM-102 program guarantees repayment of short-term financing extended by approved
foreign banks, mainly in developing countries, for purchases of U.S. food and agricultural
products by foreign buyers. The GSM-102 program aims to encourage commercial exports of
U.S. agricultural products on competitive credit terms for buyers in countries where credit is
necessary to maintain or increase U.S. sales but financing may not be available without CCC
guarantees. Eligible countries are those that USDA determines can service the debt backed by the
guarantees. The use of CCC guarantees for foreign aid, foreign policy, or debt rescheduling
purposes is prohibited. The CCC selects agricultural commodities and products according to
market potential and eligibility based on applicable legislative and regulatory requirements. All
products must be entirely produced in the United States. Eligible products include a broad range
of agricultural commodities and HVPs.30
The leading recipients of export credit guarantees over the years have been Mexico, South Korea,
Iraq, Algeria, and the former Soviet Union. In FY2015, the major beneficiary countries (in terms
of loan amounts guaranteed) were Mexico ($250.4 million), South Korea ($224.3 million), and
Turkey ($189.6 million). On a regional basis,31
the largest allocation of guarantees in FY2015
went to South America ($434 million), the Caribbean ($217.2 million), Central America ($200.1
28 USDA, “Progress on the 2014 Farm Bill Implementation,” http://www.usda.gov/wps/portal/usda/usdahome?
contentidonly=true&contentid=progress-2014-farm-bill.html. 29 The acronym GSM refers to the General Sales Manager, an official of FAS who administers the credit, and other,
export programs. Additional information on GSM-102 is available at http://www.fas.usda.gov/programs/export-credit-
guarantee-program-gsm-102. 30 A list of eligible commodities and products under the GSM-102 program can be found at http://www.fas.usda.gov/
programs/export-credit-gurantee-program-gsm-102/eligible-commodities. 31 Major individual country recipients of export credit guarantees—such as Mexico, South Korea, and Turkey—are not
included in the regional funding figures.
Agricultural Exports and 2014 Farm Bill Programs: Background and Issues
Congressional Research Service 14
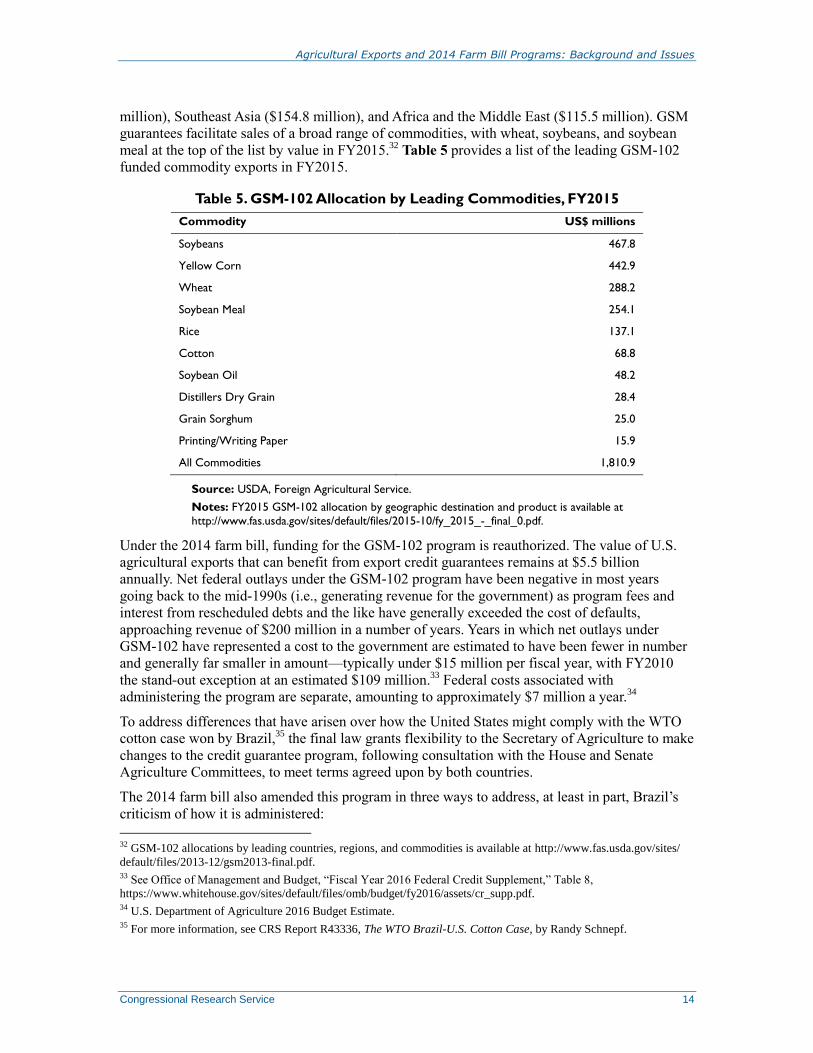
million), Southeast Asia ($154.8 million), and Africa and the Middle East ($115.5 million). GSM
guarantees facilitate sales of a broad range of commodities, with wheat, soybeans, and soybean
meal at the top of the list by value in FY2015.32
Table 5 provides a list of the leading GSM-102
funded commodity exports in FY2015.
Table 5. GSM-102 Allocation by Leading Commodities, FY2015
Commodity US$ millions
Soybeans 467.8
Yellow Corn 442.9
Wheat 288.2
Soybean Meal 254.1
Rice 137.1
Cotton 68.8
Soybean Oil 48.2
Distillers Dry Grain 28.4
Grain Sorghum 25.0
Printing/Writing Paper 15.9
All Commodities 1,810.9
Source: USDA, Foreign Agricultural Service.
Notes: FY2015 GSM-102 allocation by geographic destination and product is available at
http://www.fas.usda.gov/sites/default/files/2015-10/fy_2015_-_final_0.pdf.
Under the 2014 farm bill, funding for the GSM-102 program is reauthorized. The value of U.S.
agricultural exports that can benefit from export credit guarantees remains at $5.5 billion
annually. Net federal outlays under the GSM-102 program have been negative in most years
going back to the mid-1990s (i.e., generating revenue for the government) as program fees and
interest from rescheduled debts and the like have generally exceeded the cost of defaults,
approaching revenue of $200 million in a number of years. Years in which net outlays under
GSM-102 have represented a cost to the government are estimated to have been fewer in number
and generally far smaller in amount—typically under $15 million per fiscal year, with FY2010
the stand-out exception at an estimated $109 million.33
Federal costs associated with
administering the program are separate, amounting to approximately $7 million a year.34
To address differences that have arisen over how the United States might comply with the WTO
cotton case won by Brazil,35
the final law grants flexibility to the Secretary of Agriculture to make
changes to the credit guarantee program, following consultation with the House and Senate
Agriculture Committees, to meet terms agreed upon by both countries.
The 2014 farm bill also amended this program in three ways to address, at least in part, Brazil’s
criticism of how it is administered:
32 GSM-102 allocations by leading countries, regions, and commodities is available at http://www.fas.usda.gov/sites/
default/files/2013-12/gsm2013-final.pdf. 33 See Office of Management and Budget, “Fiscal Year 2016 Federal Credit Supplement,” Table 8,
https://www.whitehouse.gov/sites/default/files/omb/budget/fy2016/assets/cr_supp.pdf. 34 U.S. Department of Agriculture 2016 Budget Estimate. 35 For more information, see CRS Report R43336, The WTO Brazil-U.S. Cotton Case, by Randy Schnepf.

Agricultural Exports and 2014 Farm Bill Programs: Background and Issues
Congressional Research Service 15
1. The maximum loan guarantee term is reduced to two years from three years.
2. The requirement that the Secretary of Agriculture maximize the amount of credit
guarantees made available each year is repealed.
3. The provision restricting the Secretary’s ability to adjust program fees is also
repealed in order to allow fees to fully cover the costs of the program’s operation,
thereby avoiding any implicit subsidy.
Although the enacted 2014 farm bill shortened the maximum length of credit guarantees from
three years previously to not more than 24 months, FAS has established a maximum repayment
term under GSM-102 of 18 months, with actual terms subject to variation by country.36
The 18-
month limit for repayment reflects the October 2014 memorandum of understanding between the
United States and Brazil that was one of a number of U.S. actions taken to address Brazil’s
successful WTO complaint that U.S. cotton support programs were depressing international
cotton prices and thereby harming Brazil’s cotton industry.37
Previously, under the 2008 farm bill (P.L. 110-246), Congress repealed the GSM-103 program,
which guaranteed longer-term financing of between three and 10 years. This action was also
taken in response to the WTO Brazil cotton decision.
Facility Guarantee Program (FGP)38
Under the general provisions of the GSM-102 program, the CCC provides funding to guarantee
financing under the FGP. The FGP guarantees financing of goods and services exported from the
United States to improve or establish agriculture-related facilities in emerging markets. Eligible
projects must improve the handling, marketing, storage, or distribution of imported U.S.
agricultural commodities and products. Under GSM-102, the farm bill authorized not less than $1
billion through FY2018 to promote U.S. agricultural exports to emerging markets, including the
FGP. In FY2014, FAS programmed no funds for FGP pending the publication of a new rule. As of
April 2016, the program was still inactive pending a final rule that was expected to be issued by
the end of FY2016, at which point the program is to be reactivated, according to USDA.39
The
inactive status of FGP notwithstanding, the agency estimated a program level of $100 million
FY2016, climbing to $500 million for FY2017.40
Dairy Export Incentive Program (DEIP) Repealed
The 2014 farm bill repealed DEIP effective immediately. Terminating the program was consistent
with a WTO commitment to eliminate the use of export subsidies. DEIP was established under
the 1985 farm bill (P.L. 99-198) to assist in the export of U.S. dairy products. DEIP was included
in the commodity title (Title I), not the trade title (Title III), where most export programs are
located. The purpose of DEIP was to develop international export markets in regions where U.S.
dairy products were not competitive due to the presence of subsidized products from other
countries. The original purpose of the program was to counter the adverse effects of foreign dairy
36 USDA, “About the FAS, Export Credit Guarantee Program (GSM-102),” http://www.fas.usda.gov/programs/export-
credit-gurantee-program-gsm-102/about-export-credit-guarantee-program-gsm-102. 37 For more detail, see CRS Report R43336, The WTO Brazil-U.S. Cotton Case, by Randy Schnepf. 38 Additional information on the FGP is available at http://www.fas.usda.gov/excredits/facility-new.asp. 39 E-mail correspondence with Amy Slusher, Deputy Director, Credit Programs Division, FAS, USDA, April 20, 2016. 40 See USDA 2016 Budget Summary at http://www.obpa.usda.gov/budsum/fy16budsum.pdf.
Agricultural Exports and 2014 Farm Bill Programs: Background and Issues
Congressional Research Service 16
product subsidies, primarily those of the European Union. Eligible commodities under DEIP
included milk powder, butterfat, and various cheeses.
The program level for DEIP has varied over years depending on the dairy price situation. No
DEIP bonuses were awarded from FY2005 through FY2008. In response to lower milk producer
returns in 2008 and 2009, USDA reactivated the program in July 2009 to provide support in
FY2009-FY2010. No DEIP subsidies have been provided since FY2010.41
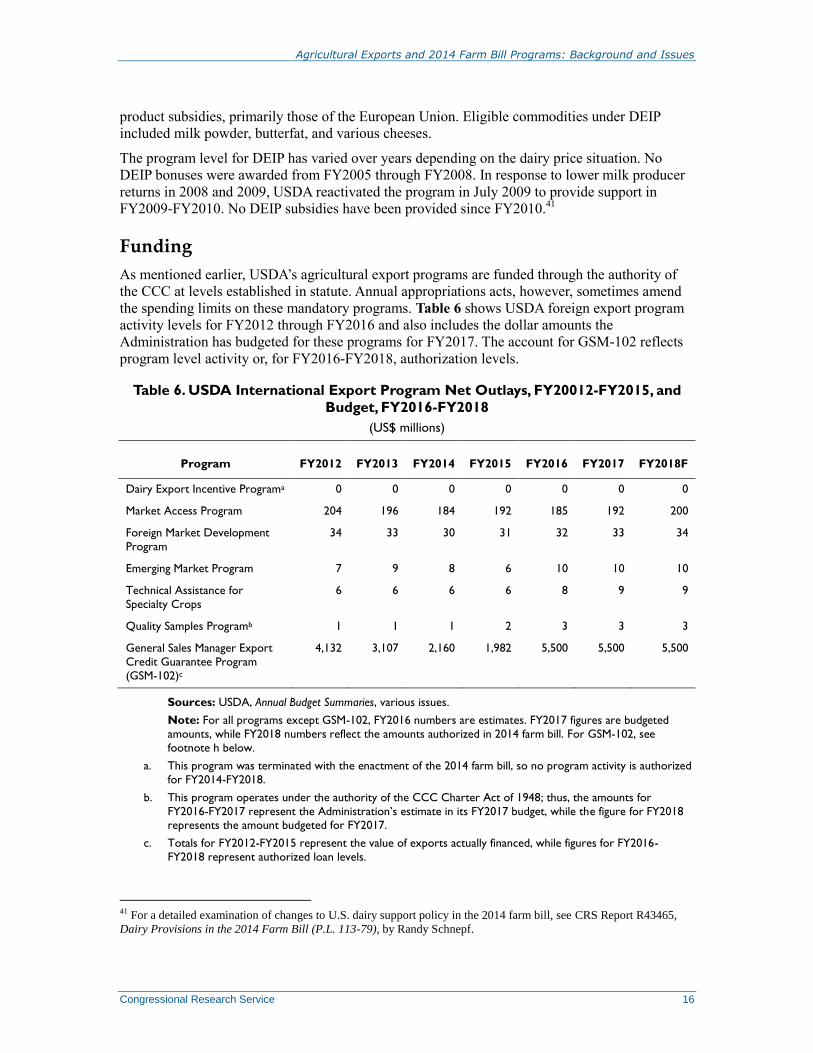
Funding
As mentioned earlier, USDA’s agricultural export programs are funded through the authority of
the CCC at levels established in statute. Annual appropriations acts, however, sometimes amend
the spending limits on these mandatory programs. Table 6 shows USDA foreign export program
activity levels for FY2012 through FY2016 and also includes the dollar amounts the
Administration has budgeted for these programs for FY2017. The account for GSM-102 reflects
program level activity or, for FY2016-FY2018, authorization levels.
Table 6. USDA International Export Program Net Outlays, FY20012-FY2015, and
Budget, FY2016-FY2018
(US$ millions)
Program FY2012 FY2013 FY2014 FY2015 FY2016 FY2017 FY2018F
Dairy Export Incentive Programa 0 0 0 0 0 0 0
Market Access Program 204 196 184 192 185 192 200
Foreign Market Development
Program
34 33 30 31 32 33 34
Emerging Market Program 7 9 8 6 10 10 10
Technical Assistance for
Specialty Crops
6 6 6 6 8 9 9
Quality Samples Programb 1 1 1 2 3 3 3
General Sales Manager Export
Credit Guarantee Program
(GSM-102)c
4,132 3,107 2,160 1,982 5,500 5,500 5,500
Sources: USDA, Annual Budget Summaries, various issues.
Note: For all programs except GSM-102, FY2016 numbers are estimates. FY2017 figures are budgeted
amounts, while FY2018 numbers reflect the amounts authorized in 2014 farm bill. For GSM-102, see
footnote h below.
a. This program was terminated with the enactment of the 2014 farm bill, so no program activity is authorized
for FY2014-FY2018.
b. This program operates under the authority of the CCC Charter Act of 1948; thus, the amounts for
FY2016-FY2017 represent the Administration’s estimate in its FY2017 budget, while the figure for FY2018 represents the amount budgeted for FY2017.
c. Totals for FY2012-FY2015 represent the value of exports actually financed, while figures for FY2016-
FY2018 represent authorized loan levels.
41 For a detailed examination of changes to U.S. dairy support policy in the 2014 farm bill, see CRS Report R43465,
Dairy Provisions in the 2014 Farm Bill (P.L. 113-79), by Randy Schnepf.
Agricultural Exports and 2014 Farm Bill Programs: Background and Issues
Congressional Research Service 17
Reorganization of Trade Functions at USDA
A new element in the 2014 farm bill required the Secretary of Agriculture, in consultation with
the House and Senate Agriculture Committees and House and Senate Appropriations Committees,
to propose a plan to reorganize the international trade functions of USDA. The law directed the
Secretary to report to the congressional committees on the plan within 180 days of the farm bill’s
enactment date of February 7, 2014, and to implement the reorganization plan not later than one
year after the report is submitted. The law also directed the Secretary to include in the plan the
establishment of the position of Under Secretary of Agriculture for Trade and Foreign
Agricultural Affairs within USDA. This position, which requires Senate confirmation, is
responsible for serving as a multi-agency coordinator of sanitary and phytosanitary issues that
arise in the course of trade in agricultural products and for addressing agricultural non-tariff trade
barriers. The timeline for establishing this position is within one year of the Secretary’s report to
Congress.
Currently, USDA’s Under Secretary for Farm and Foreign Agricultural Affairs oversees the
operation of FAS in addition to the Farm Service Agency and the Risk Management Agency. The
creation of the position of Under Secretary for Trade and Foreign Agricultural Affairs would
appear to segregate the domestic from the export-oriented programs.
As of the end of April 2016, the report that Congress directed the Secretary to prepare for
Congress had not been transmitted. With the process of proposing a reorganization plan and
establishing the new Under Secretary position incomplete, Congress directed the USDA Office of
Chief Economist in December 2015 to contract with an independent organization to assist in
completing this task and to consult with the congressional committees of jurisdiction. To fund this
effort, Congress provided $1 million as part of the FY2016 Agricultural Appropriations Act, P.L.
114-113 (for more, see “Reorganizing Trade and Farm Services Function within USDA” below).
Issues for Congress
U.S. Agricultural Exports in a Downturn
The value of U.S. agricultural exports climbed by nearly 60% between FY2009 and FY2014,
reaching a record $152 billion. Thereafter, U.S. farm exports receded to $139 billion in FY2015,
and USDA projects that exports will decline further to $125 billion in FY2016, which would
mark the lowest ebb for farm exports since FY2010 (Table A-1). Export earnings have declined
in tandem with generally ample world harvests, resulting in lower market prices and a stronger
U.S. dollar vis-a-vis trading partner currencies, which has reduced U.S. competitiveness in
relation to other exporters, including Brazil and Argentina. In FY2015, the downturn in export
sales was led by lower unit prices for several major commodities—such as wheat, corn, broiler
meat, and pork—the effect of which was compounded by a reduction in the quantities of these
commodities exported.
Given that about 20% of U.S. agricultural production is shipped abroad, export sales are
manifestly an important contributor to agricultural prices, farm income, and the financial well-
being of a broad array of interests within the U.S. agribusiness sector, including crop and
livestock processors and farm input suppliers, among others. Considering the sharp fall in net
farm income in recent years—to a forecast $91 billion in 2016 from a peak of $135 billion in
2012 and 2013—Congress might consider the possible advantages and potential downsides of
addressing opportunities and market circumstances that could contribute to an increase in U.S.
agricultural exports, which could include the following three.
Agricultural Exports and 2014 Farm Bill Programs: Background and Issues
Congressional Research Service 18
Trans-Pacific Partnership Agreement (TPP)
TPP, a regional FTA that the U.S. government has concluded with 11 other Pacific-facing
countries, would, in part, provide improved access to these markets for agricultural products—
through a reduction in tariff rates and expanded tariff-rate quotas—for a broad range of U.S.
agricultural products (See “U.S. Agricultural Trade and the Trans-Pacific Partnership
Agreement”). Two TPP countries with which the United States does not have an existing FTA are
considered to be particularly attractive growth prospects for U.S. agricultural exports: Japan, a
food importer with a large population, high per-capita income, and highly protected agricultural
sector; and Vietnam, in view of its sizable population and rapidly growing economy.
USDA has argued that FTAs (such as NAFTA and numerous bilateral FTAs) have contributed
substantially to a steep increase in U.S. agricultural exports in recent decades.42
As noted earlier,
the TPP agreement has drawn broad support within U.S. agriculture and within the agribusiness
and food sectors generally. But TPP also has its detractors, who contend that the terms are
unbalanced and the potential benefits to U.S. agriculture and food industry interests are oversold
while the downside risks are minimized. Among food and farm critics of the TPP are the United
Food and Commercial Workers International Union and the National Farmers Union, both of
which have broad objections to TPP, as well as elements of the U.S. rice industry and tobacco
producers, which object to specific provisions in the agreement that concern treatment of their
commodities.43
Congress would need to enact implementing legislation for TPP to have the force
of law for the United States.
Cuban Market for U.S. Farm Products
Numerous farm and agribusiness groups have pointed to Cuba as a market that could become a
significantly larger importer of U.S. farm products.44
This reflects Cuba’s heavy dependence on
agricultural imports to feed its population of 11 million, the considerable transportation cost and
delivery time advantages that U.S. exporters have over competitors (such as Brazil and Vietnam)
due to the close proximity of major U.S. ports to Cuba, and the broad range of U.S. agricultural
products available for export. Title IX of the Trade Sanctions Reform and Export Enhancement
Act of 2000 (TSRA, P.L. 106-387) opened a window in the long-standing U.S. embargo on trade
with Cuba by permitting exports of agricultural products. Thereafter, U.S. farm exports from
Cuba climbed from zero in 2000 to $685 million in 2008 but since then have receded, amounting
to $149 million in 2015. In a report issued in 2015, USDA compared the potential for U.S.
agricultural exports to Cuba to the Dominican Republic, noting that the Dominican Republic
market bears similarities to Cuba in terms of population and per-capita income. But whereas the
Dominican Republic imported an annual average of $1.1 billion of U.S. farm products between
2012 and 2014, Cuba’s average annual imports were far lower at $365 million over the same
period.
TSRA specifically prohibits the use of private financing to underwrite exports of agricultural
products (except through third-country financial institutions) and prohibits any access to U.S.
government export promotion programs for Cuba. Numerous farm groups contend that the
42 See ERS, “Trade Agreements and U.S. Agriculture,” January 24, 2014, http://www.usda.gov/oce/economics/papers/
WhitePaper_012014_TradeAgreements.pdf. 43 For more detail see CRS Report R44337, American Agriculture and the Trans-Pacific Partnership (TPP) Agreement,
by Mark A. McMinimy. 44 ERS, “U.S.-Cuba Agricultural Trade: Past, Present and Possible Future,” August 3, 2015, http://www.ers.usda.gov/
publications/aes-outlook-for-us-agricultural-trade/aes-87.aspx.
Agricultural Exports and 2014 Farm Bill Programs: Background and Issues
Congressional Research Service 19
restrictions on financing, which in practice tend to limit sales to Cuba to cash transactions,
comprise a major impediment to expanding U.S. farm exports by making terms for U.S. products
less competitive than those offered by alternative suppliers.45
In a March 2016 report, the U.S.
International Trade Commission concluded that U.S. agricultural exports to Cuba could post
significant gains if U.S. restrictions on trade were removed. In particular, it noted that U.S.
agricultural suppliers view the inability to offer credit and travel to Cuba to facilitate transactions
as key obstacles to increasing farm exports.
In 2015, and in early 2016, the Obama Administration issued a policy of general approval for the
export to Cuba of certain additional categories of goods and followed this up in January 2016 by
permitting U.S. private export financing of these goods. But agricultural products continued to be
excluded from private U.S. financing due to the prohibition imposed under TSRA.46
Critics of the
Obama Administration’s policy initiative to engage Cuba diplomatically and move toward more
normal bilateral relations point out that Cuba remains a one-party communist regime with a poor
record on human rights, and they contend that reforms that demonstrate a commitment to
democracy and human rights should precede a relaxation in the U.S. sanctions regime.
Trade Distorting Foreign Farm Subsidies
In recent years, U.S. agricultural interests and policymakers have become increasingly concerned
that U.S. agricultural exports are being displaced by developing country competitors. The concern
is that certain export competitors have benefited from increasingly generous government
support—including domestic price support programs, production subsidies, and export
subsidies—which has led to the accumulation of domestic surpluses irrespective of market
conditions. Disposing of these surpluses can weigh on international market prices and distort
trade patterns. Foreign surpluses resulting from high government support levels may displace
both imports of U.S. farm products to countries that employ trade-distorting subsidies and U.S.
exports to third country markets. Generous price supports and production subsidies—and in some
cases export subsidies—have insulated producers from price signals in international markets and
have led to exports that are often below domestic prices and production costs.
In 2015, the House Agriculture Committee held several hearings on this topic.47
The committee
heard testimony from academics, economic consultants, and commodity groups, including
representatives of the cotton, sugar, wheat, and dairy industries. The testimony centered on the
variety of methods by which advanced developing countries (such as Brazil, China, India,
Thailand, and Turkey) provide support that exceeds their WTO obligations and, consequently,
distorts trade to the detriment of U.S. agricultural interests.
Establishing disciplines on agricultural support programs has traditionally been the province of
the WTO and its predecessor, GATT. Lodging a complaint with the WTO against another member
government for violating WTO rules under dispute settlement provides an established framework
for seeking redress. Beyond pursuing individual complaints via dispute settlement on a case-by-
case basis, multilateral negotiations within a trade “round” can rewrite the rules of trade for WTO
members. The Doha Round of multilateral trade negotiations that was launched in 2001 was
intended to address agricultural trade issues broadly, including domestic support levels, market
45 For more detail on U.S. farm trade with Cuba and financing restrictions, see CRS Report R44119, U.S. Agricultural
Trade with Cuba: Current Limitations and Future Prospects, by Mark A. McMinimy. 46 For more see CRS Report R43926, Cuba: Issues for the 114th Congress, by Mark P. Sullivan. 47 House Committee on Agriculture hearings, October 21, 2015, and June 3, 2015, http://agriculture.house.gov/
calendar/?EventTypeID=214&Timeframe=All.
Agricultural Exports and 2014 Farm Bill Programs: Background and Issues
Congressional Research Service 20
access, and export competition. But the negotiations reached an impasse in 2009 and have made
little progress since then.
Reorganizing Trade and Farm Services Functions Within USDA
Another activity that might evoke continued congressional oversight involves the reorganization
of the trade functions at USDA as required by the enacted 2014 farm bill. As noted above,
following consultations with the House and Senate Agriculture Committees, a report outlining the
Secretary of Agriculture’s reorganization plan was to have been submitted to those committees by
early August 2014, but by the end of April 2016 the reorganization plan had not been completed.
At a hearing of the House Appropriations Committee on March 17, 2016, Deputy Under
Secretary for Farm and Foreign Agricultural Services Alexis Taylor stated that USDA hoped to
provide the required report to Congress by the end of the current year.48
The FY2016 Agricultural
Appropriations Act (P.L. 114-113) set a revised deadline of mid-June 2016 for transmitting the
report on a proposed reorganization plan to Congress.
As part of this reorganization proposal, the 2014 farm bill also calls for the Secretary to establish
within USDA the position of Under Secretary of Agriculture for Trade and Foreign Affairs. As
noted previously, the creation of this new position implies the organizational separation of key
domestic farm programs, such as crop insurance, from the main export-oriented programs
discussed in this report. Considering that both of these functions currently fall within the purview
of the Under Secretary for Farm and Foreign Agricultural Services—and in view of the
importance of these program activities to the agricultural sector—Congress might have a keen
interest in considering the Secretary’s plan and in overseeing the subsequent reorganization effort.
Public Sector Role and Effectiveness in Export Promotion
Historically, many Members of Congress have been highly supportive of MAP and cite the
benefits the program brings to U.S. agricultural industries through export market development
abroad. Although the program has its detractors, strong support for export market development
programs has been reflected in Congress’s rejection in FY2010 and FY2011 of the
Administration’s proposals to reduce MAP funding by 20% in each of those years. The
Administration has not requested reductions in MAP funding since FY2011.
Also, the continuity that the 2014 farm bill provides in terms of extending most agricultural
export programs speaks to ongoing congressional support for this type of activity. The elimination
of DEIP as part of the new law appeared to be mainly a function of fundamental changes the law
makes in the structure of federal support programs for milk producers, a U.S. commitment to
eliminate direct export subsidies, and a recognition that no activity had been recorded under DEIP
since FY2010.
At the same time, a concern raised by some Members of Congress with respect to MAP and
FMDP is whether the federal government should play an active role at all in helping agricultural
producer organizations and agribusiness entities market their products overseas. Some argue that
MAP and FMDP are forms of corporate welfare in that they fund activities that private firms
could and would otherwise fund for themselves.49
Other critics argue that the principal
48 House Committee on Appropriations, budget hearing, March 17, 2016, http://appropriations.house.gov/
calendararchive/eventsingle.aspx?EventID=394459. 49 See for example, http://www.fpif.org/articles/corporate_welfare_and_foreign_policy; and http://councilfor.cagw.org/
site/News2?page=NewsArticle&id=11742.
Agricultural Exports and 2014 Farm Bill Programs: Background and Issues
Congressional Research Service 21
beneficiaries are foreign consumers and that funds could be better spent, for example, instructing
U.S. firms on how to export. Program supporters emphasize that foreign competitors, especially
EU member countries, also spend money on market promotion and that U.S. marketing programs
help keep U.S. products competitive in foreign markets.
Congressional Efforts to Eliminate Export Promotion Programs Come Up Short
The concerns of critics notwithstanding, Congress has continued to demonstrate support for
programs that promote farm exports. In considering the House Agriculture Committee-reported
farm bill (H.R. 1947), the House in 2013 rejected by substantial margins two amendments that
sought to retire two farm export promotion programs. An amendment to repeal MAP (H.Amdt.
191), offered by Representative Steve Chabot, failed by a vote of 98-322, while the House also
turned down by 103-322 another amendment (H.Amdt. 193) offered by Representative Mo
Brooks that sought to terminate EMP. A core argument advanced in both cases was that taxpayer
money ought not be spent on promotional activities that should and could be borne by private
interests.
During the House Agriculture Committee’s markup of the same bill in 2013, no amendments that
sought to eliminate or scale back farm export programs were considered. Similarly, in marking up
its farm bill, S. 954, in 2013, the Senate Agriculture Committee did not consider any amendments
to curtail agricultural export programs. Likewise, during the floor debate on S. 954 in 2013, the
Senate did not consider any amendments that sought to curb or end agricultural export
programs.50
Market Access Program Reforms of the 1990s
In the early 1990s, some Members raised specific concerns about the effectiveness of MAP
operations, specifically questioning the program’s cost-effectiveness and impact and citing its
lack of support for small businesses and displacement of private sector marketing funds. In
response, Congress directed USDA to make significant changes to MAP. In 1996, Congress
through the appropriations process prohibited FAS from providing direct assistance for brand-
name promotions to companies that are not recognized as small businesses under the Small
Business Act. In 1997, Congress prohibited large companies from receiving indirect assistance
from MAP as well. Giving priority to small businesses did result in a substantial increase in the
small business share of MAP assistance for brand-name promotion by 1997.
FAS also established a five-year limit (a “graduation requirement”) on the use of MAP funds for
companies that use funds to promote a “specific branded product” in a “single market,” unless
FAS determined that further assistance was still necessary to meet program objectives (generic
marketing was not subject to the graduation requirement). FAS later revised the regulations in
1998 to limit each company to no more than five years (consecutive or nonconsecutive) of MAP
funding for brand-name promotions per country. Finally, Congress added a requirement that each
participant certify that MAP funds supplement—rather than supplant—its own foreign market
development expenditures.
50 During the 112th Congress, the Senate during floor consideration of its farm bill (S. 3240) rejected attempts to scale
back and eliminate entirely several agricultural export programs. On June 19, 2012, the Senate voted 14-84 to reject
S.Amdt. 2268, offered by Senator Jim DeMint, which sought to prohibit the Secretary of Agriculture from making any
loan guarantees. On June 20, the Senate voted 30-69 against adopting S.Amdt. 2289, advanced by Senator Tom
Coburn, which proposed to reduce funding for MAP by 20%.
Agricultural Exports and 2014 Farm Bill Programs: Background and Issues
Congressional Research Service 22
A 1999 study by the then General Accounting Office (GAO) reviewed a number of studies
looking at MAP’s effectiveness and concluded that while changes had been made to the program,
the economic benefits of export programs (including MAP) were unclear. It stated that “few
studies show an unambiguously positive effect of government promotional activity on exports.”51
In 2009 testimony before the Senate Finance Committee, GAO said that U.S. export promotion
activities were in need of strengthened performance management systems.52
A 2010 report by IHS Global Insight sponsored by FAS concluded that USDA’s market
development expenditures have had a positive and significant impact on U.S. agricultural trade.
Global Insight concluded that increased spending on market development under MAP and FMD
over the period 2002-2009—from roughly $125 million per year in FY2001 to $234.5 million
annually during the FY2002-FY2009 period—is estimated to have raised the U.S. share of
foreign agricultural imports by 1.3 percentage points, a rise to 19.9% from 18.6% under a no-
increase scenario. Global Insight concluded that, in value terms, by FY2009 this additional
market development activity was responsible for a 6% boost in U.S. agricultural exports to $96.1
billion that year, compared with $90.5 billion under a modeling scenario in which MAP and
FMDP spending were held to the lower FY2001 levels.
51 GAO, Changes Made to Market Access Program, but Questions Remain on Economic Impact, Washington, DC,
April 1999, http://www.gao.gov/archive/1999/ns99038.pdf. 52 L. Yager, “International Trade: Observations on U.S. and Foreign Countries’ Export Promotion Activities,” GAO
testimony to Subcommittee on International Trade, Customs, and Global Competitiveness, Senate Committee on
Finance, December 2009.
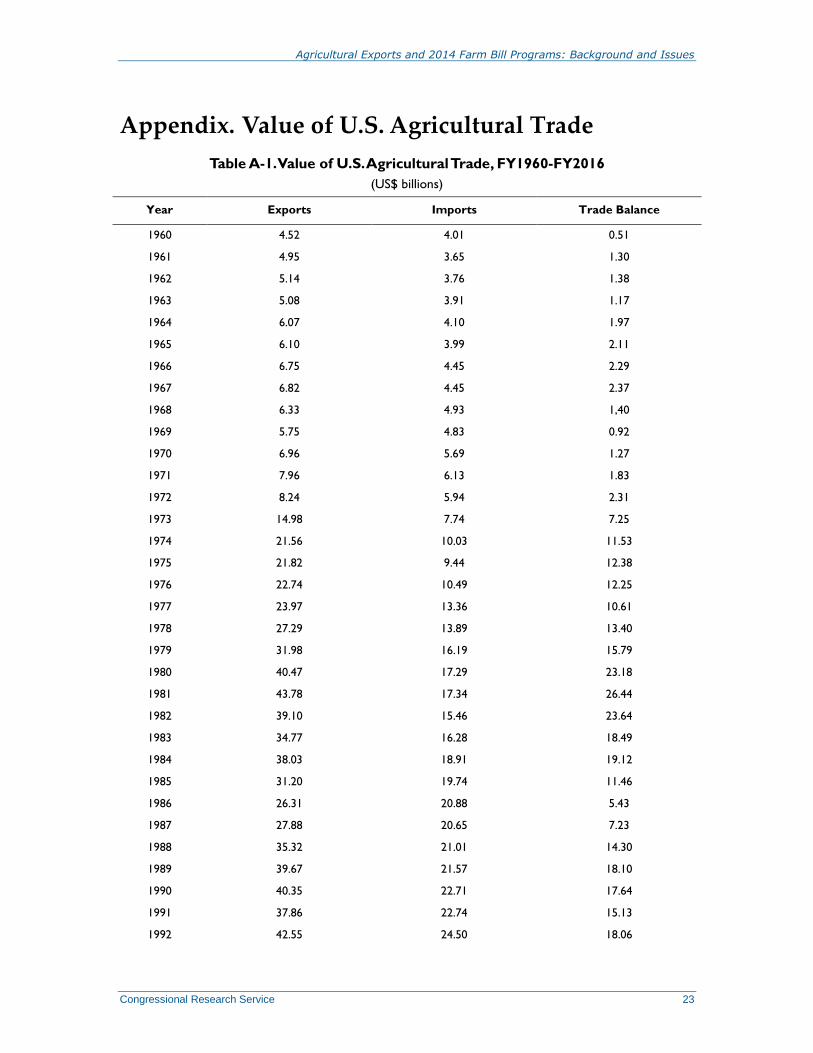
Agricultural Exports and 2014 Farm Bill Programs: Background and Issues
Congressional Research Service 23
Appendix. Value of U.S. Agricultural Trade
Table A-1. Value of U.S. Agricultural Trade, FY1960-FY2016
(US$ billions)
Year Exports Imports Trade Balance
1960 4.52 4.01 0.51
1961 4.95 3.65 1.30
1962 5.14 3.76 1.38
1963 5.08 3.91 1.17
1964 6.07 4.10 1.97
1965 6.10 3.99 2.11
1966 6.75 4.45 2.29
1967 6.82 4.45 2.37
1968 6.33 4.93 1,40
1969 5.75 4.83 0.92
1970 6.96 5.69 1.27
1971 7.96 6.13 1.83
1972 8.24 5.94 2.31
1973 14.98 7.74 7.25
1974 21.56 10.03 11.53
1975 21.82 9.44 12.38
1976 22.74 10.49 12.25
1977 23.97 13.36 10.61
1978 27.29 13.89 13.40
1979 31.98 16.19 15.79
1980 40.47 17.29 23.18
1981 43.78 17.34 26.44
1982 39.10 15.46 23.64
1983 34.77 16.28 18.49
1984 38.03 18.91 19.12
1985 31.20 19.74 11.46
1986 26.31 20.88 5.43
1987 27.88 20.65 7.23
1988 35.32 21.01 14.30
1989 39.67 21.57 18.10
1990 40.35 22.71 17.64
1991 37.86 22.74 15.13
1992 42.55 24.50 18.06
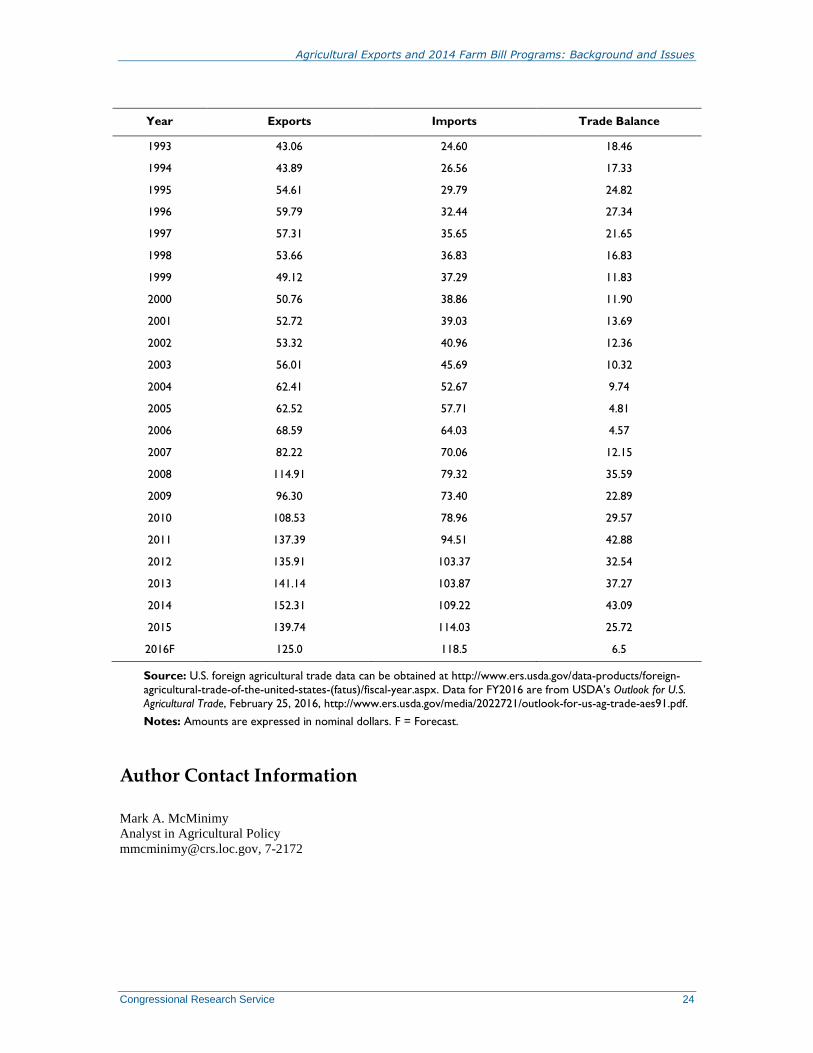
Agricultural Exports and 2014 Farm Bill Programs: Background and Issues
Congressional Research Service 24
Year Exports Imports Trade Balance
1993 43.06 24.60 18.46
1994 43.89 26.56 17.33
1995 54.61 29.79 24.82
1996 59.79 32.44 27.34
1997 57.31 35.65 21.65
1998 53.66 36.83 16.83
1999 49.12 37.29 11.83
2000 50.76 38.86 11.90
2001 52.72 39.03 13.69
2002 53.32 40.96 12.36
2003 56.01 45.69 10.32
2004 62.41 52.67 9.74
2005 62.52 57.71 4.81
2006 68.59 64.03 4.57
2007 82.22 70.06 12.15
2008 114.91 79.32 35.59
2009 96.30 73.40 22.89
2010 108.53 78.96 29.57
2011 137.39 94.51 42.88
2012 135.91 103.37 32.54
2013 141.14 103.87 37.27
2014 152.31 109.22 43.09
2015 139.74 114.03 25.72
2016F 125.0 118.5 6.5
Source: U.S. foreign agricultural trade data can be obtained at http://www.ers.usda.gov/data-products/foreign-
agricultural-trade-of-the-united-states-(fatus)/fiscal-year.aspx. Data for FY2016 are from USDA’s Outlook for U.S.
Agricultural Trade, February 25, 2016, http://www.ers.usda.gov/media/2022721/outlook-for-us-ag-trade-aes91.pdf.
Notes: Amounts are expressed in nominal dollars. F = Forecast.
Author Contact Information
Mark A. McMinimy
Analyst in Agricultural Policy
[email protected], 7-2172