Embed Size (px)
Citation preview
Agricultural Credit Risk Management Training Manual Centenary Bank (2014)
Module 3
Agricultural Credit Risk Management
Training Manual
Wasmus Consulting

Agricultural Credit Risk Management Training Manual Centenary Bank (2014)
Training notes
Module objective
The objective of this module is to enhance agricultural risk management. After completion of
this course, participants should be able to:
- Recognize and measure risks related to agricultural lending
- Manage risks related to agricultural lending
- Compile a risk dashboard
The target group of this module consists of agricultural loan officers, credit managers and
branch managers.
Mode of delivery
This training manual is accompanied by a Powerpoint presentation that follows the sequence
of the manual. The style is interactive.
The module foresees in 3 exercises:
- Case study: manual calculation of vintage analysis and portfolio migration rates
- Risk scoring using a risk matrix
- Compilation of a risk dashboard
Mode of assessment
Students will be assessed based on their participation in discussions and the quality of
individual exercises.
Trainer to be evaluated based on Centenary form for this purpose.
Reference material
1. Von Pischke (1992): Finance at the Frontier
2. CGAP (2005): Managing risks and designing products for agricultural microfinance:
features of an emerging model
Time line
Our estimate is that this module can be taught in 1.5 days.

Agricultural Credit Risk Management Training Manual Centenary Bank (2014)
Contents Training notes ................................................................................................................................. 2
Module objective ........................................................................................................................ 2
Mode of delivery ......................................................................................................................... 2
Mode of assessment ................................................................................................................... 2
Reference material ...................................................................................................................... 2
Time line ...................................................................................................................................... 2
1. Introduction to agricultural credit risk management .............................................................. 1
1.1 What is risk? ..................................................................................................................... 1
1.2 What is agricultural credit risk? ....................................................................................... 1
1.3 Risk management framework for agricultural credit ....................................................... 1
2. Risk recognition ....................................................................................................................... 3
2.1 Introduction...................................................................................................................... 3
2.2 Operational risk ................................................................................................................ 3
2.3 Credit risk ......................................................................................................................... 3
2.4 Intrinsic risk ...................................................................................................................... 3
2.5 Concentration risk ............................................................................................................ 4
2.6 Agricultural production risk ............................................................................................. 4
2.7 Agricultural marketing and price risk ............................................................................... 4
2.8 Untimely disbursement risk ............................................................................................. 7
2.9 Rural risks ......................................................................................................................... 7
3. Risk measurement ................................................................................................................... 8
3.1 Introduction ........................................................................................................................... 8
3.2 Operational risk measurement ........................................................................................ 9
3.3 Credit risk measurement through scoring– at individual loan level .............................. 10
3.4 Credit risk measurement - Portfolio Quality Indicators ................................................. 12
3.5 Concentration risk measurement .................................................................................. 15
3.6 Agricultural production risk measurement .................................................................... 16

Agricultural Credit Risk Management Training Manual Centenary Bank (2014)
3.7 Market and price risk measurement .............................................................................. 17
3.8 Untimely disbursement risk measurement ................................................................... 19
4. Risk management strategies and tools ................................................................................. 20
4.1 Introduction.................................................................................................................... 20
4.2 Risk Transfer ................................................................................................................... 22
4.3 Risk mitigation through internal processes and controls .............................................. 22
4.4 Risk mitigation at portfolio level – the Risk Dashboard ................................................. 25
4.5 Risk Coping or risk acceptance ....................................................................................... 27
Annex 1 – Scorecard for agricultural loans below 50 million Shs ................................................. 28
Annex 2 - Scorecard for agricultural loans above 50 million Shs ................................................. 30

Agricultural Credit Risk Management Training Manual Centenary Bank (2014)
1
1. Introduction to agricultural credit risk management
1.1 What is risk?
A few easy to grasp definitions of risk are ‘the possibility of loss’1; or ‘the possibility that things
do not work out as planned’; or even simpler: ‘uncertainty’. In (agricultural) lending, we trade
the present (the agricultural loan) against the future (loan repayments) at a cost (interest
payments). Because the future is uncertain, risk is always present in what we do.
1.2 What is agricultural credit risk?
Risk is inherent in agriculture. Thus, it is not surprising that many agricultural lending projects
have had poor repayment performance2. Agricultural risks can be broken down into three main
types of risks, i.e. risks caused by fluctuations in production, risks caused by fluctuation in prices
and, last but not least, risks related to untimely loan disbursements.
For the purpose of this training manual, agricultural credit risk is not limited to agricultural risks,
but includes risks that interrelate to agricultural lending such as credit risk, operational risk,
concentration risk.
1.3 Risk management framework for agricultural credit
In this manual we will introduce a simple but effective framework for agricultural risk
management. Risk management is defined as the process of understanding and proactively
managing risk before the event responsible for the risk occurs. Risks are typically managed
through risk mitigation, risk transfer and risk coping.
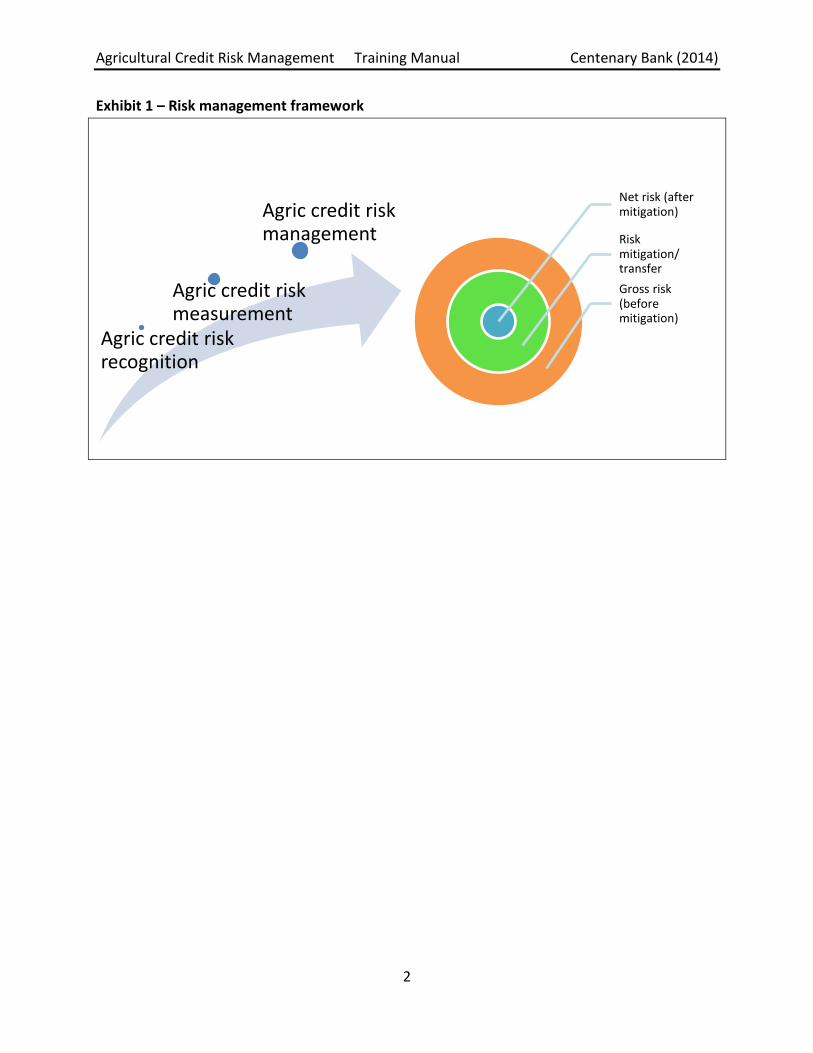
However, before risks can be managed, risks have to be first recognized and understood; and
measurements need to be in place to indicate the risk exposure per category. Once that is
done, we can start managing the agricultural credit risk and related risks that we are exposed
to. Risk before any mitigation or transfer takes place is referred to as ‘gross risk’. After risk has
been mitigated, the remaining risk is ‘net risk’.
In this manual, we look at risk management from the perspective of the agricultural loan
officer, credit manager and branch manager.
1 Von Pischke (1991) Finance at the Frontier
2 CGAP (2005)
Agricultural Credit Risk Management Training Manual Centenary Bank (2014)
2
Exhibit 1 – Risk management framework
Agric credit risk recognition
Agric credit risk measurement
Agric credit risk management
Net risk (after mitigation)
Risk mitigation/ transfer
Gross risk (before mitigation)

Agricultural Credit Risk Management Training Manual Centenary Bank (2014)
3
2. Risk recognition
2.1 Introduction
As mentioned before, we look at risk management of agricultural lending through the eyes of
the loan officer, credit manager and branch manager. We will leave out typical risks that are
associated with financial intermediation, such as risks related to mismatches in maturity
between assets and liabilities and interest rate risk.
In discussing the types of risks, we will start with those risks that are present in lending, and
then focus in on those risks that are specific for agricultural lending relationships. Finally,
attention will be paid to rural risk.
2.2 Operational risk
Operational risk arises from the potential that inadequate information systems and controls,
operational problems, breaches in internal controls, fraud, human error, management failure or
unforeseen catastrophes will result in unexpected losses.
2.3 Credit risk
Credit risk is the risk that the borrower may not pay as scheduled; or may not pay at all. One
context in which credit risk needs to be examined is the problem of asymmetrical distribution
of information. In any lending relationship, the borrower has more information about his
activities than the lender does. This means that the lender bears the risk of innocently making
poor credit decisions because of inadequate information, and also that the borrower may
abuse the lending relationship.
Another view on credit risk is one that arises from the design of credit arrangements. Are loan
products, amounts, repayment plans, maturities, costs etc. adequate for the borrower or do
they cause the borrower to default?
2.4 Intrinsic risk
Intrinsic risk is the risk associated with the financial situation, skills and experience of an
individual borrower. Assuming the problem of information asymmetry is adequately dealt with,
does the borrower have the skills and experience to make the project work?
Agricultural Credit Risk Management Training Manual Centenary Bank (2014)
4
2.5 Concentration risk
Concentration risk is the risk associated with a concentration of borrowers with certain
characteristics in a loan portfolio that are subject to similar adverse events. For instance,
hawkers may be subject to restrictive municipal legislation, maize farmers may be subject to
price risk; coffee farmers may be subject to risk of coffee berry borer. The higher the
concentration of similar characteristics in a loan portfolio, the higher the concentration risk
may be.
2.6 Agricultural production risk
Agricultural production risk can be broken down into: Climatic risk: the occurrence of drought, excessive rainfall, temperatures, hailstorms etc. Risk of pests and diseases; Risk related to farm management (intrinsic risk). Such risks are higher for farmers engaged in monoculture of crops that are particularly sensitive
to the correct use of high-quality inputs or the timing of harvesting. Risk in agriculture can also
be traced to farmers seeking to increase their incomes through higher-risk, higher-return
cropping strategies.
Risk related to the quality of farm management, a form of intrinsic risk, is an outgrowth of
factors or characteristics that are specific to a given individual farmer. This can be risks related
to faulty farm management, lack of skills, use of poor quality inputs, dependency on a single
crop, lack of access to markets etc. Although modern farm methods are generally looked upon
favorably as yields can be higher, they can also increase risk and make the farmer more
dependent on inputs than when planting local varieties.
2.7 Agricultural marketing and price risk
Marketing risk relates to the inability to sell on time, in the right quantities and/or at an
acceptable quality standard. This includes the short- and long-term market situation and the
use or absence of marketing contracts.
Related to marketing risk is the risk of side selling (from a buyer’s perspective), whereby farmers do not honor their supply obligations by selling ‘on the side’. Price risk is the risk that earnings decline as a result of a change in the level or volatility of commodity prices. Many agricultural markets are imperfect, lacking full information and a good communications
infrastructure. The prices that crops will sell for are unknown at the time of planting, and vary
Agricultural Credit Risk Management Training Manual Centenary Bank (2014)
5
with levels of production (locally and globally) and demand at the time of sale. And farmers
have no real way of knowing how many other farmers are planting a specific crop or how
average yields will fare in any given year. Often, a good price one year motivates a lot of
farmers to move into the same crop the next year. This shift increases production in the face of
constant demand, driving down the price and making the crop much less attractive the
following year. This is what happened (among other things) in Centenary Bank in late 2001 and
early 2002 when a bumper maize harvest caused maize prices (and farmer incomes) to fall,
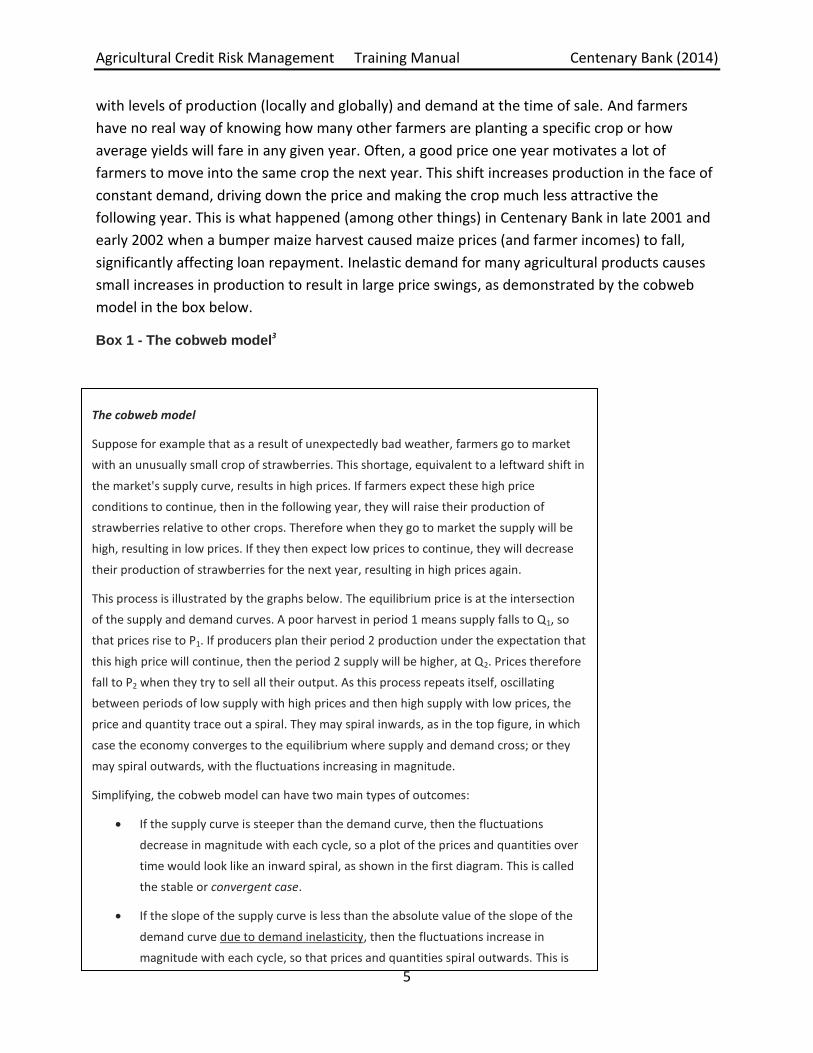
significantly affecting loan repayment. Inelastic demand for many agricultural products causes
small increases in production to result in large price swings, as demonstrated by the cobweb
model in the box below.
Box 1 - The cobweb model3
3 Source: Wikipedia
The cobweb model
Suppose for example that as a result of unexpectedly bad weather, farmers go to market
with an unusually small crop of strawberries. This shortage, equivalent to a leftward shift in
the market's supply curve, results in high prices. If farmers expect these high price
conditions to continue, then in the following year, they will raise their production of
strawberries relative to other crops. Therefore when they go to market the supply will be
high, resulting in low prices. If they then expect low prices to continue, they will decrease
their production of strawberries for the next year, resulting in high prices again.
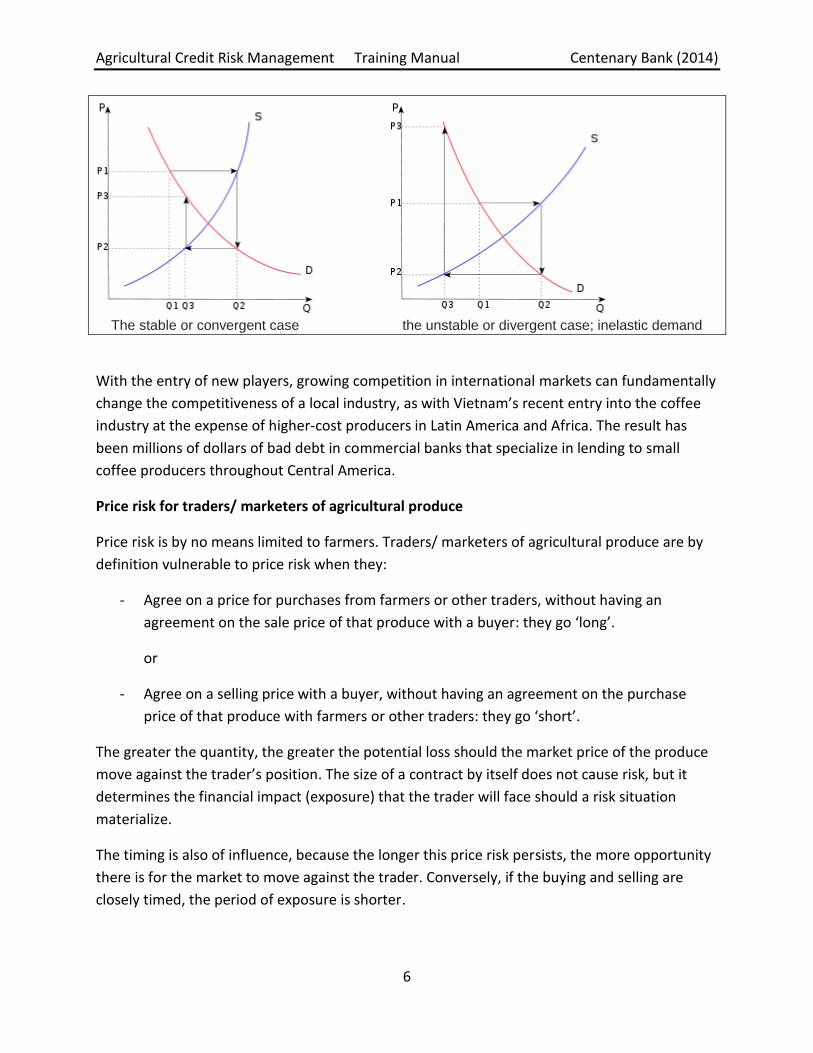
This process is illustrated by the graphs below. The equilibrium price is at the intersection
of the supply and demand curves. A poor harvest in period 1 means supply falls to Q1, so
that prices rise to P1. If producers plan their period 2 production under the expectation that
this high price will continue, then the period 2 supply will be higher, at Q2. Prices therefore
fall to P2 when they try to sell all their output. As this process repeats itself, oscillating
between periods of low supply with high prices and then high supply with low prices, the
price and quantity trace out a spiral. They may spiral inwards, as in the top figure, in which
case the economy converges to the equilibrium where supply and demand cross; or they
may spiral outwards, with the fluctuations increasing in magnitude.
Simplifying, the cobweb model can have two main types of outcomes:
If the supply curve is steeper than the demand curve, then the fluctuations
decrease in magnitude with each cycle, so a plot of the prices and quantities over
time would look like an inward spiral, as shown in the first diagram. This is called
the stable or convergent case.
If the slope of the supply curve is less than the absolute value of the slope of the
demand curve due to demand inelasticity, then the fluctuations increase in
magnitude with each cycle, so that prices and quantities spiral outwards. This is
called the unstable or divergent case.
Agricultural Credit Risk Management Training Manual Centenary Bank (2014)
6
The stable or convergent case the unstable or divergent case; inelastic demand
With the entry of new players, growing competition in international markets can fundamentally
change the competitiveness of a local industry, as with Vietnam’s recent entry into the coffee
industry at the expense of higher-cost producers in Latin America and Africa. The result has
been millions of dollars of bad debt in commercial banks that specialize in lending to small
coffee producers throughout Central America.
Price risk for traders/ marketers of agricultural produce
Price risk is by no means limited to farmers. Traders/ marketers of agricultural produce are by
definition vulnerable to price risk when they:
- Agree on a price for purchases from farmers or other traders, without having an
agreement on the sale price of that produce with a buyer: they go ‘long’.
or
- Agree on a selling price with a buyer, without having an agreement on the purchase
price of that produce with farmers or other traders: they go ‘short’.
The greater the quantity, the greater the potential loss should the market price of the produce
move against the trader’s position. The size of a contract by itself does not cause risk, but it
determines the financial impact (exposure) that the trader will face should a risk situation
materialize.
The timing is also of influence, because the longer this price risk persists, the more opportunity
there is for the market to move against the trader. Conversely, if the buying and selling are
closely timed, the period of exposure is shorter.

Agricultural Credit Risk Management Training Manual Centenary Bank (2014)
7
2.8 Untimely disbursement risk
Untimely disbursement risk refers to the risk that the bank is late in disbursing the loan, making
the loan unusable for purchasing the necessary inputs, or even worse, leading to a delay in
sowing/ planting.
The precision of crop schedules generates specific risk for agricultural finance. Loan
disbursements need to be tailored to irregular cash flows, yet the timing of final crop income
may vary, based on when farmers choose to sell. (They may delay selling until market
conditions are favorable.) These characteristics of agricultural production require lenders to be
quite efficient and physically close to their farmer clients. Thus, for banks and other financial
institutions, agricultural lending involves a risk of causing default due to their own inefficiency.
The production of most improved cash crops is relatively complex, involving careful timing of
numerous steps— from preparing land through planting, fertilizing, and harvesting. Mistakes or
delays at any step can substantially reduce returns—or eliminate them altogether.
2.9 Rural risks
A number of risks occur precisely because the target group resides in the rural areas. As
mentioned before, rural areas are sparsely populated by relatively poor people and have poor
access to basic services such as health and education, which increases the risks to the lender.
Another characteristic of rural areas is that ownership of land is often not formalized, giving the
Bank little formal securities to liquidate in case of default.
Agricultural Credit Risk Management Training Manual Centenary Bank (2014)
8
3. Risk measurement
3.1 Introduction
Some risks are easier to measure than others. Many risks are mitigated by controls that are
embedded in work flows or processes, and are therefore barely noticeable as they have been
mitigated already to a large extent. Some risks are internal while others are external. This
chapter will deal with a structured and pragmatic way of measuring risk exposure; and
presenting the measurements in a risk dashboard. The idea is that the dashboards can be
completed at loan officer or branch level with information that is readily available from the
internet in combination with information from the bank’s core banking system.
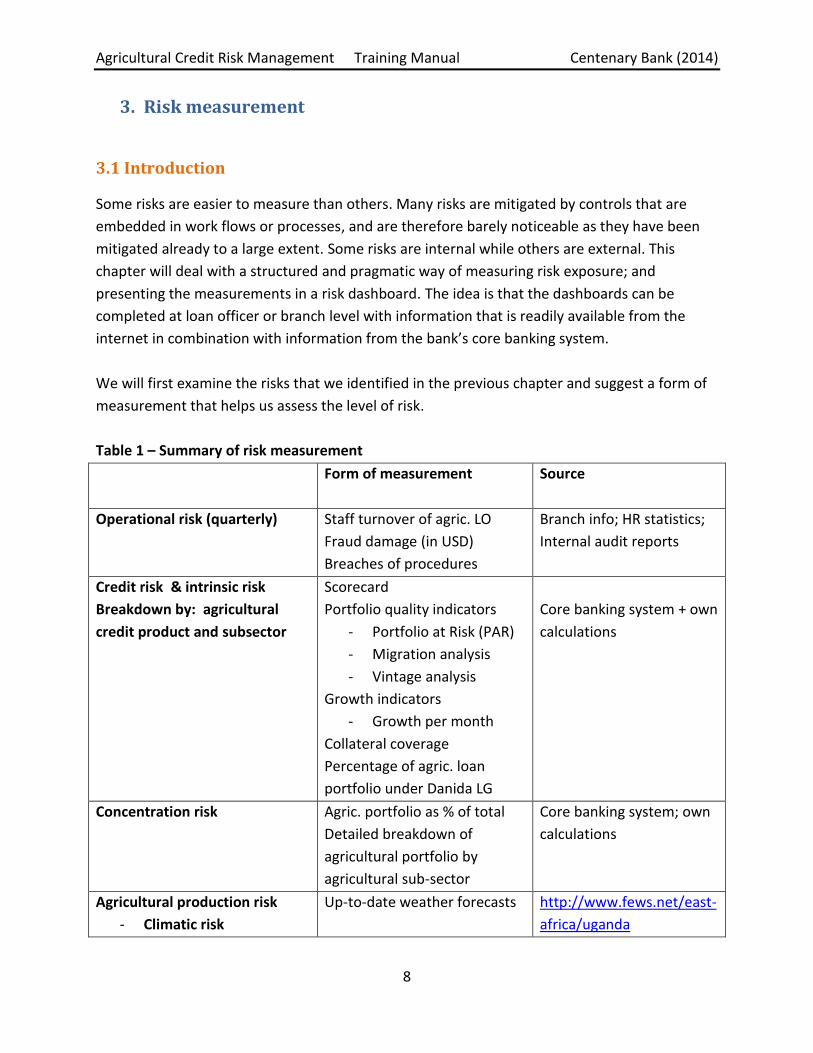
We will first examine the risks that we identified in the previous chapter and suggest a form of
measurement that helps us assess the level of risk.
Table 1 – Summary of risk measurement
Form of measurement Source
Operational risk (quarterly) Staff turnover of agric. LO
Fraud damage (in USD)
Breaches of procedures
Branch info; HR statistics;
Internal audit reports
Credit risk & intrinsic risk
Breakdown by: agricultural
credit product and subsector
Scorecard
Portfolio quality indicators
- Portfolio at Risk (PAR)
- Migration analysis
- Vintage analysis
Growth indicators
- Growth per month
Collateral coverage
Percentage of agric. loan
portfolio under Danida LG
Core banking system + own
calculations
Concentration risk Agric. portfolio as % of total
Detailed breakdown of
agricultural portfolio by
agricultural sub-sector
Core banking system; own
calculations
Agricultural production risk
- Climatic risk
Up-to-date weather forecasts http://www.fews.net/east-
africa/uganda

Agricultural Credit Risk Management Training Manual Centenary Bank (2014)
9
- Risk of pest and diseases
Market and price risk
Development of farm gate and
retail prices per week/ month
Infotrade, FEWS,
Farmgainafrica.
Untimely disbursement risk Average processing time since
application
3.2 Operational risk measurement
Staff turnover
The risk associated with staff turnover is first and foremost that experience and knowledge
leaves the institution or is terminated and is replaced with less experienced and less
knowledgeable and experienced staff. There is an additional risk related to turnover of
agricultural loan officers as they may take ‘their’ clients with them to their new employer,
usually a competing financial institution.
For purposes of agricultural credit risk management staff turnover is defined as the percentage
of agricultural credit staff that left the institution in a certain period, divided by the total
number of agricultural credit staff. It can be calculated at branch level, at department level or
for the institution as a whole. For ease of interpretation, the ratio can best be calculated per
quarter but also cumulatively and on an annualized basis.
Agric. staff turnover = No. of agric. staff that left the /branch institution in previous quarter
No. of agric. staff (at branch or institutional level)
Cumulative agric. staff turnover = No. of agric. staff that left the branch/ institution since 01.01
No. of agric. staff (at branch or institutional level
Both formulas can be annualized to make it comparable to previous year figures and to act as
an early warning indicator.
Fraud occurrence & audit findings related to agricultural credit
Fraud occurrence measures the number of fraud incidents (if any) linked to agricultural credit
per quarter at branch and institutional level, based on internal audit reports.
Breaches of procedures that are related to agricultural credit are also measured by quarter.
These include errors such as omissions in forms, missing signatures etc.

Agricultural Credit Risk Management Training Manual Centenary Bank (2014)
10
3.3 Credit risk measurement through scoring– at individual loan level
Centenary Bank has recently developed 2 scorecards for agricultural lending: one for loans
below 50 million Shs and one for loans above 50 milllion Shs.
Scorecard for loans below 50 million Shs
The scorecard builds on the current score card in use by the Bank and incorporates specific
agriculture related risks. The model has three parts, Part A, B and C. Part A is the same as the
credit score card in use in the Bank, slightly modified for a maximum score of 85.
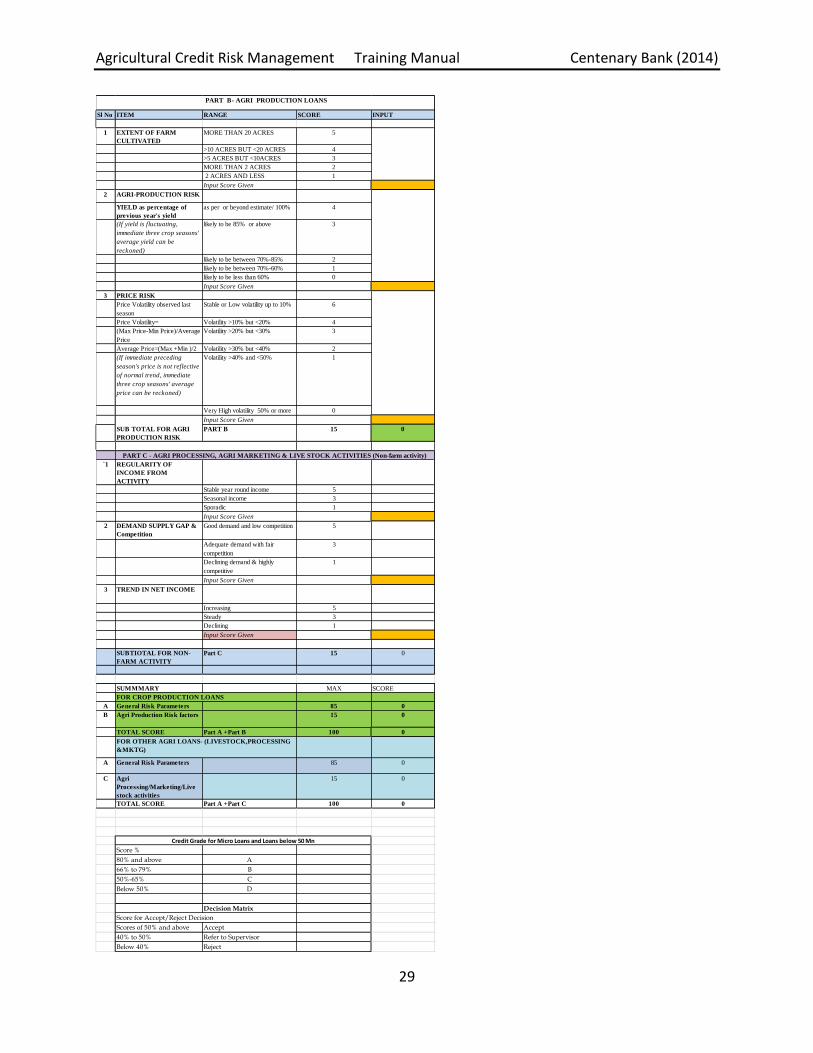
Part B of the model includes parameters for evaluation of the risks related to crop production,
focusing on acreage under cultivation (whereby it is assumed that large farmers are better able
to withstand risk than small farmers), production risk (fluctuation in yield) and price risk
(fluctuation in price). Part B carries a maximum of 15 marks.
Exhibit – Scorecard Part B: agricultural production
Sl No ITEM RANGE SCORE INPUT
1 EXTENT OF FARM
CULTIVATED
MORE THAN 20 ACRES 5
>10 ACRES BUT <20 ACRES 4
>5 ACRES BUT <10ACRES 3
MORE THAN 2 ACRES 2
2 ACRES AND LESS 1
Input Score Given
2 AGRI-PRODUCTION RISK
YIELD as percentage of
previous year's yield
as per or beyond estimate/ 100% 4
(If yield is fluctuating,
immediate three crop seasons'
average yield can be
reckoned)
likely to be 85% or above 3
likely to be between 70%-85% 2
likely to be between 70%-60% 1
likely to be less than 60% 0
Input Score Given
3 PRICE RISK
Price Volatility observed last
season
Stable or Low volatility up to 10% 6
Price Volatility= Volatility >10% but <20% 4
(Max Price-Min Price)/Average
Price
Volatility >20% but <30% 3
Average Price=(Max +Min )/2 Volatility >30% but <40% 2
(If immediate preceding
season's price is not reflective
of normal trend, immediate
three crop seasons' average
price can be reckoned)
Volatility >40% and <50% 1
Very High volatility 50% or more 0
Input Score Given
SUB TOTAL FOR AGRI
PRODUCTION RISK
PART B 15 0
Agricultural Credit Risk Management Training Manual Centenary Bank (2014)
11
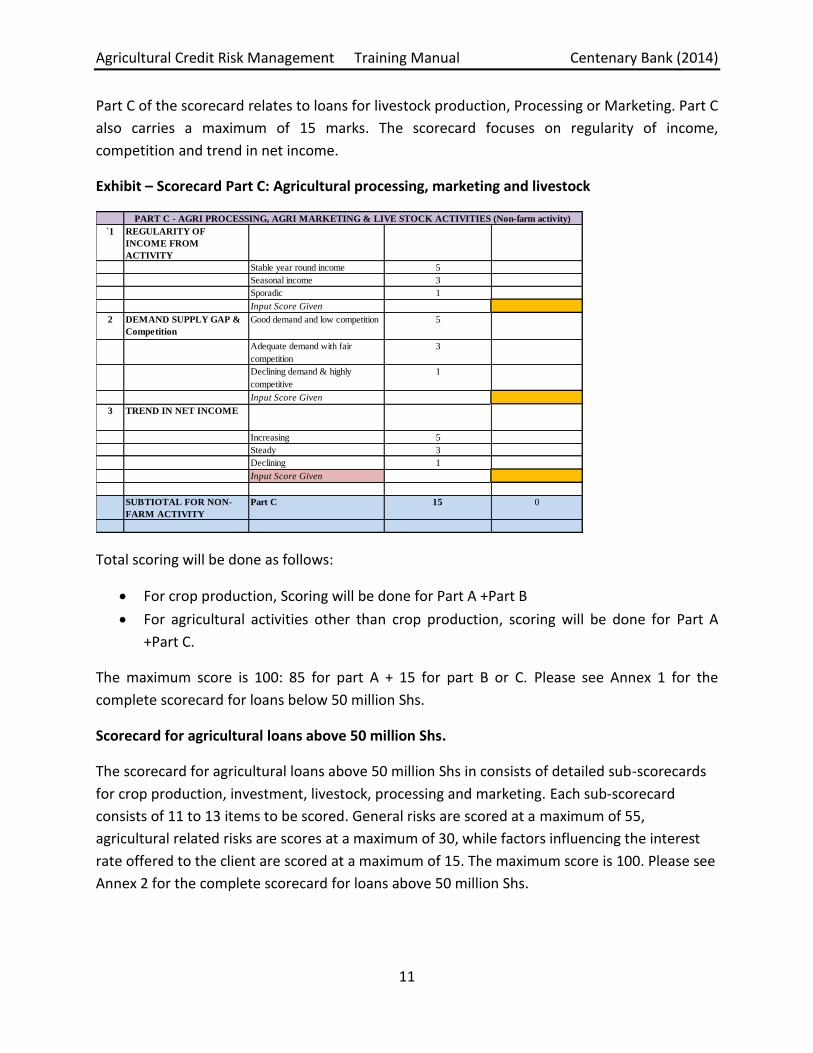
Part C of the scorecard relates to loans for livestock production, Processing or Marketing. Part C
also carries a maximum of 15 marks. The scorecard focuses on regularity of income,
competition and trend in net income.
Exhibit – Scorecard Part C: Agricultural processing, marketing and livestock
Total scoring will be done as follows:
For crop production, Scoring will be done for Part A +Part B
For agricultural activities other than crop production, scoring will be done for Part A
+Part C.
The maximum score is 100: 85 for part A + 15 for part B or C. Please see Annex 1 for the
complete scorecard for loans below 50 million Shs.
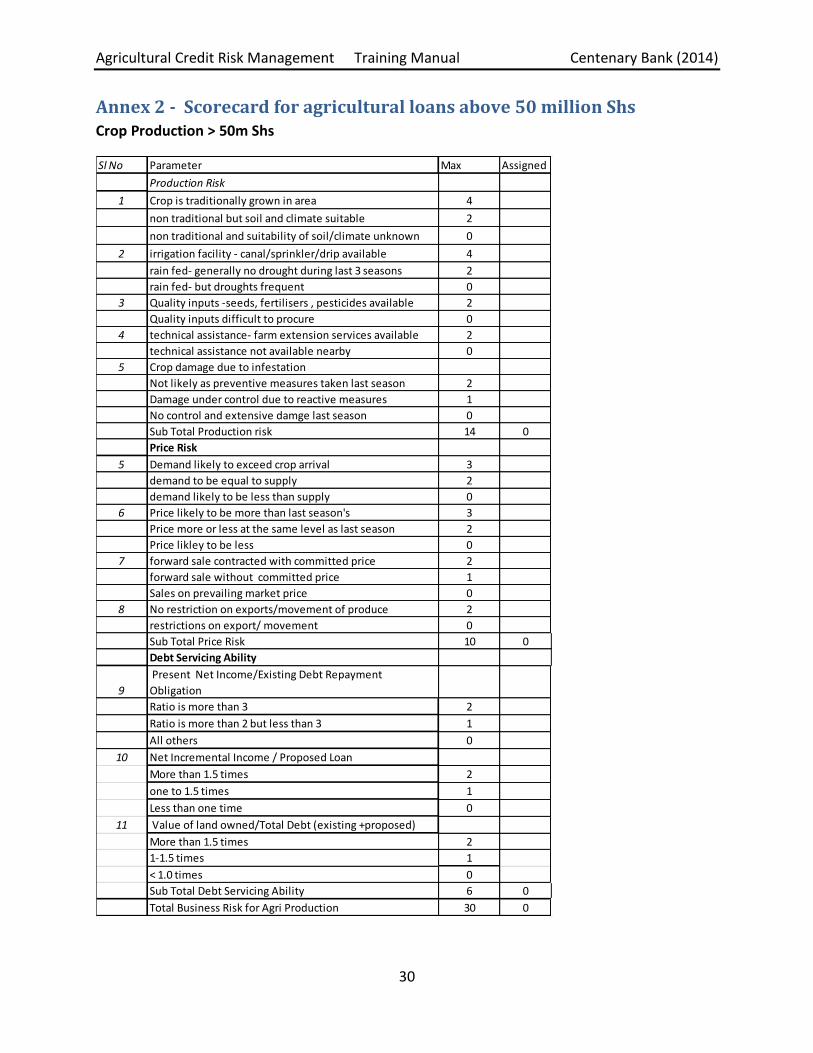
Scorecard for agricultural loans above 50 million Shs.
The scorecard for agricultural loans above 50 million Shs in consists of detailed sub-scorecards
for crop production, investment, livestock, processing and marketing. Each sub-scorecard
consists of 11 to 13 items to be scored. General risks are scored at a maximum of 55,
agricultural related risks are scores at a maximum of 30, while factors influencing the interest
rate offered to the client are scored at a maximum of 15. The maximum score is 100. Please see
Annex 2 for the complete scorecard for loans above 50 million Shs.
`1 REGULARITY OF
INCOME FROM
ACTIVITY
Stable year round income 5
Seasonal income 3
Sporadic 1
Input Score Given
2 DEMAND SUPPLY GAP &
Competition
Good demand and low competition 5
Adequate demand with fair
competition
3
Declining demand & highly
competitive
1
Input Score Given
3 TREND IN NET INCOME
Increasing 5
Steady 3
Declining 1
Input Score Given
SUBTIOTAL FOR NON-
FARM ACTIVITY
Part C 15 0
PART C - AGRI PROCESSING, AGRI MARKETING & LIVE STOCK ACTIVITIES (Non-farm activity)
Agricultural Credit Risk Management Training Manual Centenary Bank (2014)
12
3.4 Credit risk measurement - Portfolio Quality Indicators
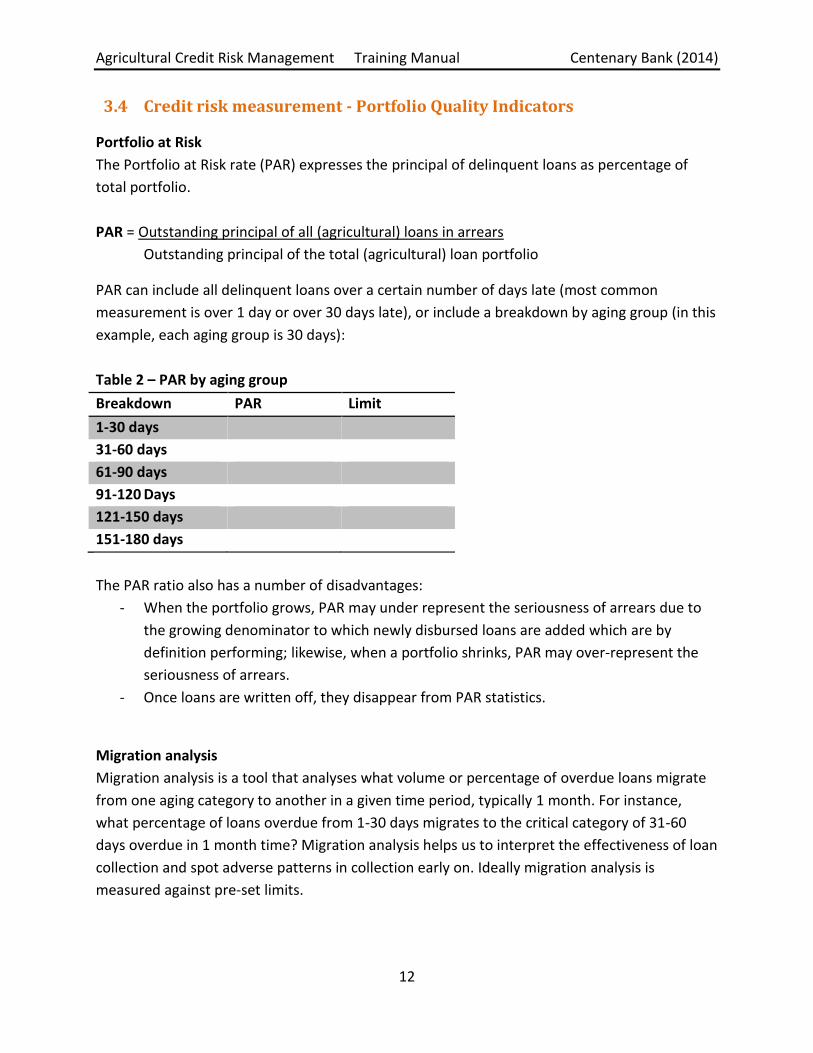
Portfolio at Risk
The Portfolio at Risk rate (PAR) expresses the principal of delinquent loans as percentage of
total portfolio.
PAR = Outstanding principal of all (agricultural) loans in arrears
Outstanding principal of the total (agricultural) loan portfolio
PAR can include all delinquent loans over a certain number of days late (most common
measurement is over 1 day or over 30 days late), or include a breakdown by aging group (in this
example, each aging group is 30 days):
Table 2 – PAR by aging group
Breakdown PAR Limit
1-30 days
31-60 days
61-90 days
91-120 Days
121-150 days
151-180 days
The PAR ratio also has a number of disadvantages:
- When the portfolio grows, PAR may under represent the seriousness of arrears due to
the growing denominator to which newly disbursed loans are added which are by
definition performing; likewise, when a portfolio shrinks, PAR may over-represent the
seriousness of arrears.
- Once loans are written off, they disappear from PAR statistics.
Migration analysis
Migration analysis is a tool that analyses what volume or percentage of overdue loans migrate
from one aging category to another in a given time period, typically 1 month. For instance,
what percentage of loans overdue from 1-30 days migrates to the critical category of 31-60
days overdue in 1 month time? Migration analysis helps us to interpret the effectiveness of loan
collection and spot adverse patterns in collection early on. Ideally migration analysis is
measured against pre-set limits.

Agricultural Credit Risk Management Training Manual Centenary Bank (2014)
13
Table 3 – Example of migration analysis
The above data can also be presented graphically:
Graph 1 – Example of migration analysis
Vintage analysis
Vintage analysis is a tool that allows for performance comparisons of portfolio quality between
portfolio segments, usually months. Data is grouped into segments based on the origination
month (a vintage), and can be formatted in a triangular fashion with age (months on book) and
vintage as the two axes (see table 4).
Each cell in a vintage table shows a delinquency percentage, similar to the PAR rate with the
difference that the rate is calculated as a percentage of amount disbursed in a certain month,
and not as a percentage of the outstanding portfolio. The other difference is that written off
loans or rescheduled loans are not excluded from the delinquent loans.
Vintage PAR = Principal of all delinquent loans disbursed in a certain month
Amount disbursed in a certain month
Dec-10 Jan-11 Feb-11 Mar-11 Apr-11 May-11 Jun-11 Jul-11 Aug-11 Sep-11 Oct-11 Nov-11
1 to 301,935131
2,320,994 2,592,538 2,663,674 2,797,524 2,500,743 2,707,490 2,590,905 2,194,010 2,177,431 2,298,966 2,428,209
31 to 60434,935
476,587 531,631 374,014 465,420 487,198 457,444 376,317 334,969 378,196 472,781 478,119
61 to 90226,621
255,278 283,031 244,271 215,527 327,555 270,308 298,817 262,952 253,661 175,615 253,791
1-30 to 31-60 25% 23% 14% 17% 17% 18% 14% 13% 17% 22% 21%
31-60 to 61-90 59% 59% 46% 58% 70% 55% 65% 70% 76% 46% 54%
0%
20%
40%
60%
80%
Migration analysis
1-30 to 31-60 31-60 to 61-90
Agricultural Credit Risk Management Training Manual Centenary Bank (2014)
14
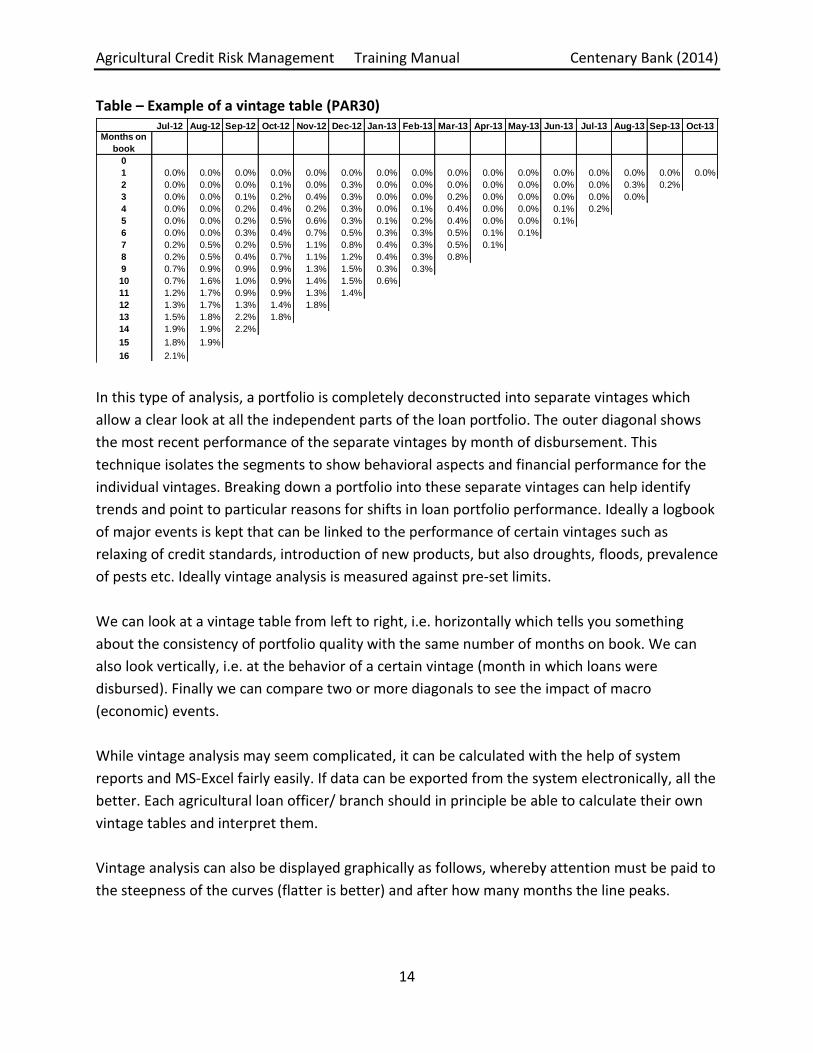
Table – Example of a vintage table (PAR30)
In this type of analysis, a portfolio is completely deconstructed into separate vintages which
allow a clear look at all the independent parts of the loan portfolio. The outer diagonal shows
the most recent performance of the separate vintages by month of disbursement. This
technique isolates the segments to show behavioral aspects and financial performance for the
individual vintages. Breaking down a portfolio into these separate vintages can help identify
trends and point to particular reasons for shifts in loan portfolio performance. Ideally a logbook
of major events is kept that can be linked to the performance of certain vintages such as
relaxing of credit standards, introduction of new products, but also droughts, floods, prevalence
of pests etc. Ideally vintage analysis is measured against pre-set limits.
We can look at a vintage table from left to right, i.e. horizontally which tells you something
about the consistency of portfolio quality with the same number of months on book. We can
also look vertically, i.e. at the behavior of a certain vintage (month in which loans were
disbursed). Finally we can compare two or more diagonals to see the impact of macro
(economic) events.
While vintage analysis may seem complicated, it can be calculated with the help of system
reports and MS-Excel fairly easily. If data can be exported from the system electronically, all the
better. Each agricultural loan officer/ branch should in principle be able to calculate their own
vintage tables and interpret them.
Vintage analysis can also be displayed graphically as follows, whereby attention must be paid to
the steepness of the curves (flatter is better) and after how many months the line peaks.
Jul-12 Aug-12 Sep-12 Oct-12 Nov-12 Dec-12 Jan-13 Feb-13 Mar-13 Apr-13 May-13 Jun-13 Jul-13 Aug-13 Sep-13 Oct-13Months on
book
0
1 0.0% 0.0% 0.0% 0.0% 0.0% 0.0% 0.0% 0.0% 0.0% 0.0% 0.0% 0.0% 0.0% 0.0% 0.0% 0.0%
2 0.0% 0.0% 0.0% 0.1% 0.0% 0.3% 0.0% 0.0% 0.0% 0.0% 0.0% 0.0% 0.0% 0.3% 0.2%
3 0.0% 0.0% 0.1% 0.2% 0.4% 0.3% 0.0% 0.0% 0.2% 0.0% 0.0% 0.0% 0.0% 0.0%
4 0.0% 0.0% 0.2% 0.4% 0.2% 0.3% 0.0% 0.1% 0.4% 0.0% 0.0% 0.1% 0.2%
5 0.0% 0.0% 0.2% 0.5% 0.6% 0.3% 0.1% 0.2% 0.4% 0.0% 0.0% 0.1%
6 0.0% 0.0% 0.3% 0.4% 0.7% 0.5% 0.3% 0.3% 0.5% 0.1% 0.1%
7 0.2% 0.5% 0.2% 0.5% 1.1% 0.8% 0.4% 0.3% 0.5% 0.1%
8 0.2% 0.5% 0.4% 0.7% 1.1% 1.2% 0.4% 0.3% 0.8%
9 0.7% 0.9% 0.9% 0.9% 1.3% 1.5% 0.3% 0.3%
10 0.7% 1.6% 1.0% 0.9% 1.4% 1.5% 0.6%
11 1.2% 1.7% 0.9% 0.9% 1.3% 1.4%
12 1.3% 1.7% 1.3% 1.4% 1.8%
13 1.5% 1.8% 2.2% 1.8%
14 1.9% 1.9% 2.2%
15 1.8% 1.9%
16 2.1%

Agricultural Credit Risk Management Training Manual Centenary Bank (2014)
15
Graph – Vintage analysis
Growth rate
The growth rate is a straightforward ratio:
Growth rate = (Agric) Loan Portfolio end of period–(Agric) Loan Portfolio end of previous period
Agric. Loan Portfolio end of previous period
Usually growth is considered to be positive as it means the bank is increasing its portfolio; but
fast growth can be unsustainable if there are insufficient resources available to manage the
growth properly. Growth rates need to be measured against pre-set limits.
Exercise 1 : case study to practice migration and vintage analysis (on handouts)
3.5 Concentration risk measurement
Breakdown of loan portfolio by sub-sector and geography/zone
A breakdown of the loan portfolio by agricultural sub-sector allows us to see if concentration
risk exists or if there is a trend towards concentration risk.
A meaningful breakdown of the agricultural portfolio could look as follows:
% of portfolio Limit
Agricultural production
Agricultural Marketing
0.0%
0.5%
1.0%
1.5%
2.0%
2.5%1
mo
nth
2 m
on
th
3 m
on
th
4 m
on
th
5 m
on
th
6 m
on
th
7 m
on
th
8 m
on
th
9 m
on
th
10
mo
nth
11
mo
nth
12
mo
nth
13
mo
nth
14
mo
nth
15
mo
nth
16
mo
nth
Jul-12
Aug-12
Sep-12
Oct-12
Nov-12
Dec-12
Jan-13
Feb-13
Mar-13
Apr-13
May-13
Jun-13
Jul-13

Agricultural Credit Risk Management Training Manual Centenary Bank (2014)
16
Agricultural Processing
Total Agriculture
In order to get a grip on the real risk of agricultural lending, agricultural production risk needs
to be broken down further into key activities or crops/ livestock farming which are each subject
to their own sub-set of risks. Such a breakdown could be (livestock and crop activities can differ
from branch to branch according to what the branch finances):
% of portfolio Limit
Dairy
Poultry
Cattle breeding
Pig rearing
Subtotal livestock
Matooke
Maize
Coffee
Beans
…..
Subtotal crop production
Total agricultural production
3.6 Agricultural production risk measurement
Agricultural production risk is difficult to measure and quantify at (loan officer or branch) loan
portfolio levels. One approach could be to periodically classify each loan into one of 3 risk
categories, low, medium and high. Another, less cumbersome approach is to consider external
information on weather forecasts that impacts food security, as published by the Famine Early
Warning Systems Network (FEWS Net), a leading provider of early warning and analysis on
acute food insecurity. Created by the USAID after devastating famines in East and West Africa,
FEWS provides objective, evidence-based analysis to help government decision-makers and
relief agencies plan for and respond to humanitarian crises.
While our concern is of course not food security per se, the events that impact food security
also impact the harvests and animal health of our clients. FEWS offers relevant and up-to-date
web-based information that is available at no cost. There is a special page on Uganda:
http://www.fews.net/east-africa/uganda.

Agricultural Credit Risk Management Training Manual Centenary Bank (2014)
17
Exhibit 2 – screenshot of FEWs Net website
In addition, we can take available local press and local information into account. We can then
indicate in the Dashboard either low, medium or high agricultural production risk due to
projected weather conditions.
3.7 Market and price risk measurement
Primary source: Information from Infotrade Infotrade issues weekly commodity prices on their website by 34 different markets throughout Uganda, and also consolidated prices per region. http://www.infotradeuganda.com/index.php/market-information/food-prices.html Exhibit 3 - Screenshot of Infotrade website

Agricultural Credit Risk Management Training Manual Centenary Bank (2014)
18
It also issues weekly analysis reports; Infotrade collects food prices three times a week, Monday, Wednesday and Saturday. Field officers from each of the markets covered collects prices and other relevant agricultural data and enters it into a secure on-line database. Once a week all the data entered into the database is analyzed and a summary report is produced containing highlights from the week. This report includes:
- Average food prices per market - Announcements for upcoming agricultural events - workshops, trainings, meeting - Featured commodity - every week attention is paid to one special commodity - Weather Forecasts for the next 7 Days - Narrative Analysis explaining why price changes occurred that week
Loan officers/ branches can subscribe to the weekly analysis reports free of charge which is recommended. Secondary source: Information from FEWS Net FEWS net, the same source that we use for climatic risk, issues a monthly price bulletin. The price bulletin provides a set of charts showing monthly prices in the current marketing year in selected urban centers and allowing users to compare current trends with both five-year average prices, indicative of seasonal trends, and prices in the previous year. The slight drawback, as mentioned previously, is that it focuses on crops that are important for food security: matoke, dry cassava chips, sorghum, millet, beans, and white maize
Secondary source: Information from Farmgainafrica
Another source of price information is Farmgain Africa http://www.farmgainafrica.org/ with
retail and wholesale prices on a large variety of commodities, plus a summary on key trends:
Exhibit 4 – Example of trends from www.farmgainafrica.com
Maize price in Kampala decreases
The maize grain price fell this week from Ugx.600/kg last week to Ugx.580/kg in Kisenyi-Kampala dry grain market. The price of maize flour also reduced to Ugx.60, 000 for a 50 kilograms bag in the same market. Apparently there was more maize on the market as people search for school fees. A lot of maize is still held in the rural areas in stores. There was no change at the Produce line market in Lira. In Masindi, maize was bought at Ugx.500 farm gate price in Diima Sub County. In Gulu, the maize price increased from Ugx.600 to 700/kg due to low demand. Usually at this time of the year, when the first school term opens, the demand for maize increases the market price slightly. However, if the big grain buyers are stocking, the market price would rise faster. This will also depend on the harvest season. In Kiboga, maize was offered at Ugx. 450/kg farm gate price in Ntunda and Nsambya Sub County generally. The wholesale price in Kiboga town centre was recorded at Ugx.500/kg. In Arua, the grain price increased slightly to Ugx.850/kg wholesale. At Busia border produce market which has been the main maize market since this year began, Kenyan traders were vigorously sorting and loading maize destined for major towns such as Kisumu, Nairobi, Nakuru and Bondo. Over 1500-1900 tons were ferried out of this market daily. Maize was delivered to this border town from Kiboga, Mubende, Kadagi, Hoima, Soroti, Serere, Bunyoli, Busoga and Fort Portal.

Agricultural Credit Risk Management Training Manual Centenary Bank (2014)
19
Good quality maize grain was bought at Ksh.25/kg. It has been at this price for the last 4 weeks. The Ugandan shilling appreciated a little at Ksh.27.8. This meant that the maize price declined slightly from last (Feb 10, 2014).
3.8 Untimely disbursement risk measurement
The average processing time per agricultural loan can be measured as the time between
application and disbursement for all loans disbursed in a certain period, expressed in number of
days.
Average processing time per agric. loan = Processing time of all agric loans disbursed in month
Number of agric. loans disbursed in month

Agricultural Credit Risk Management Training Manual Centenary Bank (2014)
20
4. Risk management strategies and tools
4.1 Introduction
Now that the main risks are acknowledged and measured, we can consider on how to best
manage these risks. Risk management is defined as the process of understanding and
proactively managing risk before the event responsible for the risk occurs.
It may help to think of risk in two dimensions, likelihood of an event taking place; and the
impact of such an event. This is usually displayed in a ‘risk matrix’ (see below). Risks that have
high likelihood and critical impact can be considered ‘high risk’.
Thus, the risk management measures taken need to lower the probability of the event
occurring, and/ or lower the impact when the event occurs.
Exhibit 5 – Risk matrix with probability and impact
LIKELIHOOD
Almost Certain 55 6 7 8 9
Probable 44 5 6 7 8
Possible 33 4 5 7 7
Unlikely 22 2 4 6 7
Rare 11 2 4 5 6
Insignificant
1
Minor
2
Moderate
3
Major
4
Critical
5
IMPACT
Agricultural Credit Risk Management Training Manual Centenary Bank (2014)
21
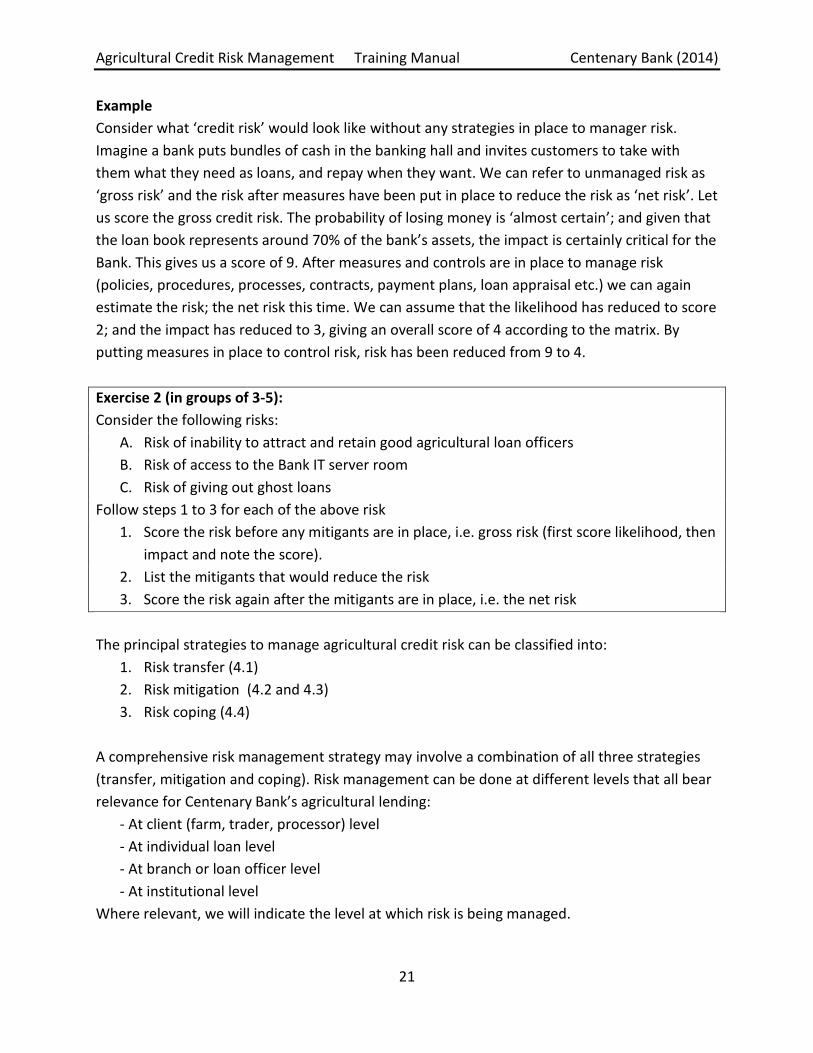
Example
Consider what ‘credit risk’ would look like without any strategies in place to manager risk.
Imagine a bank puts bundles of cash in the banking hall and invites customers to take with
them what they need as loans, and repay when they want. We can refer to unmanaged risk as
‘gross risk’ and the risk after measures have been put in place to reduce the risk as ‘net risk’. Let
us score the gross credit risk. The probability of losing money is ‘almost certain’; and given that
the loan book represents around 70% of the bank’s assets, the impact is certainly critical for the
Bank. This gives us a score of 9. After measures and controls are in place to manage risk
(policies, procedures, processes, contracts, payment plans, loan appraisal etc.) we can again
estimate the risk; the net risk this time. We can assume that the likelihood has reduced to score
2; and the impact has reduced to 3, giving an overall score of 4 according to the matrix. By
putting measures in place to control risk, risk has been reduced from 9 to 4.
Exercise 2 (in groups of 3-5):
Consider the following risks:
A. Risk of inability to attract and retain good agricultural loan officers
B. Risk of access to the Bank IT server room
C. Risk of giving out ghost loans
Follow steps 1 to 3 for each of the above risk
1. Score the risk before any mitigants are in place, i.e. gross risk (first score likelihood, then
impact and note the score).
2. List the mitigants that would reduce the risk
3. Score the risk again after the mitigants are in place, i.e. the net risk
The principal strategies to manage agricultural credit risk can be classified into:
1. Risk transfer (4.1)
2. Risk mitigation (4.2 and 4.3)
3. Risk coping (4.4)
A comprehensive risk management strategy may involve a combination of all three strategies
(transfer, mitigation and coping). Risk management can be done at different levels that all bear
relevance for Centenary Bank’s agricultural lending:
- At client (farm, trader, processor) level
- At individual loan level
- At branch or loan officer level
- At institutional level
Where relevant, we will indicate the level at which risk is being managed.

Agricultural Credit Risk Management Training Manual Centenary Bank (2014)
22
4.2 Risk Transfer
Risk transfer entails the transfer of the risk impact to a willing party, for a fee or premium.
Commercial insurance, guarantee schemes and hedging are the well-known forms of risk
transfer. Transfer of (credit) risk is usually done within a framework that the institution
provides, as it requires high level arrangements with third parties.
At Centenary bank, risk transfer consists of:
- the Danida Loan Guarantee scheme to which 50% of the credit risk is transferred of
loans that are placed under the guarantee;
- the (compulsory) weather insurance for production loans.
An example of risk transfer at client level is for instance when a coffee trader transfers part of
the price risk to an institutional buyer through a fixed future price.
4.3 Risk mitigation through internal processes and controls
As mentioned before, risk mitigation includes activities designed to reduce the likelihood of an
adverse event or reduce the impact of actual losses. Many of the risk mitigating measures are
embedded in the Bank’s policies, procedures and processes and thus their effect is difficult to
measure and analyze. With the help of the risk matrix and imagining a situation without
controls in place, an idea of the importance of the controls or risk mitigating measures can be
given. Below please find a description of the main factors that mitigate the risk of agricultural
credit through the process.
The extreme form of risk mitigation by exiting an activity altogether (for instance stop lending
to maize farmers) is not considered here.
Risk mitigation at client level
Let us take a step back by considering the risk mitigation options at farm/ client level and the
extent to which we (can) build or rely on them.
The farmer is first and foremost exposed to climatic risk, risk of pests and diseases and price
risk, on top of the fundamental issue of irregular farm incomes and fairly expenses throughout
the year. Having had to deal with risks and irregularity of income for generations, farm
households are in fact very good risk managers themselves.
The risk mitigation possibilities to the farmer are numerous and varied:
- Diversification of income (multiple income sources) – this is the key risk mitigant;
- Irrigation to be less rainfall dependent;
Agricultural Credit Risk Management Training Manual Centenary Bank (2014)
23
- Use of drought/ pest resistant seeds or planting material;
- Adoption of improved agronomic practices;
- Contract farming to limit price risk;
- Etcetera.
In conclusion, the first level of risk mitigation takes place at client level, on the farm.
Risk mitigation through loan appraisal/ credit scoring/ client selection
All the risks that the farmer is exposed to and his ability to mitigate those risks, factors in to
credit risk from the agricultural loan officer’s perspective, i.e. the risk that the farmer will not
repay his loan on time or will not repay at all.
Thus it is key is that the agricultural loan officer, in assessing the loan application, first of all
understands to which risks the farmer is exposed; and secondly to what extent and how the
client has the ability to mitigate his key risks (as explained in the previous section). The
deployed agricultural lending methodology needs to expressly take multiple income sources
into account and not only rely on the income of the project to be financed. It also needs to
acknowledge and build on the other risk mitigating strategies of the farmer.
On top of the farmer’s risk mitigating measures such as having multiple and diverse income
sources and applying modern farm techniques, the lending methodology needs to further limit
risk exposure by carefully looking at the two drivers of agricultural income, price and
production:
- Price: the loan officer needs to take conservative prices for his calculations; it is
recommended to use the lowest prices over the last 12 month period.
- Production: the loan officer needs to be conservative on yield by applying last season’s
yield and accurate in the land measurement by pacing the land.
If price and/ or production are overestimated, the farmer’s repayment capacity will be
overestimated and default is a likely outcome.
The loan officer will also make use of the credit scoring model (as presented in paragraph 3.3)
to guide him/ her on the risk exposure.
Obviously clients that remain over exposed to risks and/ or have insufficient income to repay a
loan they would need, should not be considered for financing. Client selection remains key in
the success of any lending program.

Agricultural Credit Risk Management Training Manual Centenary Bank (2014)
24
In conclusion, the second level of risk mitigation takes place by having an appropriate
agricultural credit methodology in place that builds on the risk mitigating strategies of the
client. The methodology will result a fair assessment of agricultural income and the farmer’s
repayment capacity.
Box 2 – Price risk assessment in case of traders of produce
Price Risk Assessment of produce traders As part of assessing an application from a produce trader, it is important to identify and quantify the trader’s exposure to price risk based on their position in the market. By netting out their ‘long’ and ‘short’ positions, we can understand their true exposure to risk – and what mitigating factors, if any, have been taken to reduce the risk exposure.
Risk mitigation through value chain finance
By employing a comprehensive chain approach that looks beyond the borrower to the health of
the chain (see Module 5), the Bank is better informed about the capacity of the chain partners
and linkages, including producers’ capacity to ensure adequate supply in terms of quantity and
quality and/ or price guarantee. The Bank can also finance and manage financial transactions
for various actors in the chain (e.g. input suppliers, storage facilities, trade) which may help in
securing loan payments that are made directly to producers’ accounts.
Non-repayment of credit to chain actors can be greatly reduced by incorporating a lead actor
that is considered trustworthy. Such an actor can help instill and ensure accountability.
Arrangements of this type are strengthened when a lead actor (co-signatory) is able to absorb
risks (e.g. through its equity capital or member savings). Providing financing through a tripartite
arrangement not only improves the efficiency of credit delivery, but minimizes the risk of non-
performing loans.
In conclusion, a value chain approach can be regarded as the third level of risk mitigation.
Risk mitigation by the credit committee
At Centenary Bank, the decision-making body for approving a loan is the credit committee. At
branch level, it consists of at least 3 persons. Arguably, the credit committee is the most
important institution within the bank. After the loan officer presents the case and his
recommendation, committee members are then given the opportunity to ask questions to the
loan officer regarding the details of the client’s economic situation and closely check the
appraisal and the recommendations made by the loan officer. Decisions are made on a
consensus basis.

Agricultural Credit Risk Management Training Manual Centenary Bank (2014)
25
By separating the loan appraisal (loan officer) from loan approval (credit committee), the credit
committee plays a vital dual control role in ensuring that good loan decisions are made
consistently.
The credit committee can thus be regarded as the fourth level of risk mitigation.
Post-disbursement risk mitigation through adequate monitoring, collection and recovery
Regular monitoring of agricultural loans is key to detecting potential risks early on. Loan officers
are required to visit each client at least twice during the loan period for post approval follow
up. Of course, if a problem is detected that may affect loan repayment, action needs to be
taken in consultation with the branch manager and/ or credit committee.
Risk mitigation through system of internal controls
There are many risk mitigating factors embedded in Centenary Bank’s written down processes,
policies and procedures. Examples are ID verification for clients which limits the risk of ghost
lending, the fact that all cash transactions take place over the counter which limits the risk of
cash disappearing in loan officers’ pockets, the credit committee (as explained above), the
signing of the loan contract by the manager and not the loan officer. All these measures aim in
one way or another to reduce operational risk and/or credit risk.
4.4 Risk mitigation at portfolio level – the Risk Dashboard
Please find below a mock version of a completed agricultural risk dashboard for an imaginary
branch, named ‘maize valley’. Such a report needs to be prepared on a monthly basis, reviewed
and discussed in a wider group, for instance agricultural loan officers and branch manager.

Agricultural Credit Risk Management Training Manual Centenary Bank (2014)
26
Agricultural Credit Risk Dashboard - Maize Valley Branch Jun-14
Agricultural loansActual
resultsLimit Deviation% Risk trend
I. Operational Risk (quarter ending June)
Staff Turnover (annualized) 12% 10% 20%
Fraud damage in USD 50,000 0 50,000
Breach of procedures 15 25 -40%
Number of exceptions approved by HQ 34 25 36%
II. Credit & Intrinsic Risk
PAR 1-30 days 2.5% 2.5% 0%
PAR> 30 days 3.1% 3.0% 3%
PAR> 90 days 1.9% 2.0% -5%
Migration performing to 1-30d 1.1% 1.0% 10%
Migration 1-30d to 31-60d 13.1% 12.4% 6%
Migration 31-60d to 61-90d 35.0% 44.0% -20%
PAR30 - 3 months on book 0.0% 0.5% -100%
PAR30 - 6 months on book 0.5% 0.70% -29%
PAR30 - 9 months on book 1.2% 1.20% 0%
PAR30 - 12 months on book 1.9% 2.50% -24%
Portfolio growth 1.7% 2% -15%
Collateral coverage 83% >90% -8%
% of agric. loans under Danida LG 55% >50% -45%
III. Concentration risk
Agriculture as % of branch loan portfolio 45% 50% -10%
Agric. production as % of agric pf. 56% 60% -7%
Agric. Marketing as % of agric. pf. 35% 31% 13%
Agric. Processing as % of agric. pf. 8% 9% -11%
IV. Agricultural production risk
Climatic Risk Outlook LOW LOW
Maize price (kg) 850
Matoke price (bunch) 21050
Coffee Robusta price (kg) 2200
V. Untimely disbursement risk
Average processing time (days) 4 5 -20%
Agricultural Credit Risk Management Training Manual Centenary Bank (2014)
27
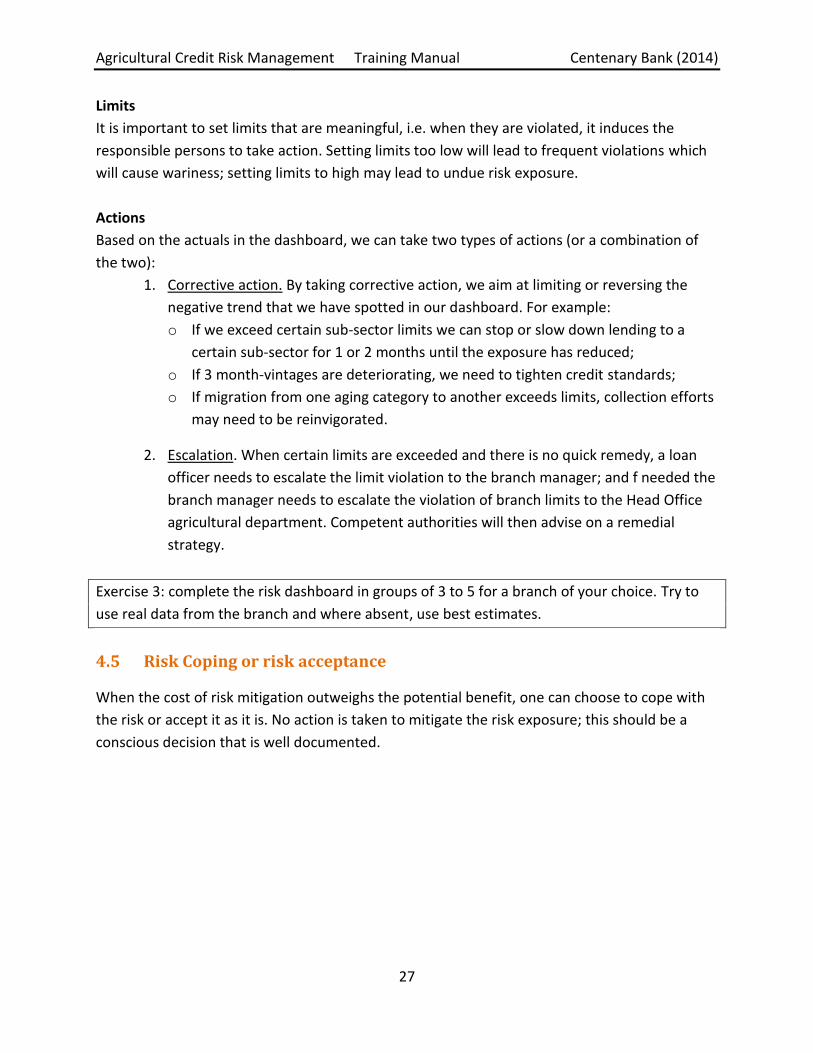
Limits
It is important to set limits that are meaningful, i.e. when they are violated, it induces the
responsible persons to take action. Setting limits too low will lead to frequent violations which
will cause wariness; setting limits to high may lead to undue risk exposure.
Actions
Based on the actuals in the dashboard, we can take two types of actions (or a combination of
the two):
1. Corrective action. By taking corrective action, we aim at limiting or reversing the
negative trend that we have spotted in our dashboard. For example:
o If we exceed certain sub-sector limits we can stop or slow down lending to a
certain sub-sector for 1 or 2 months until the exposure has reduced;
o If 3 month-vintages are deteriorating, we need to tighten credit standards;
o If migration from one aging category to another exceeds limits, collection efforts
may need to be reinvigorated.
2. Escalation. When certain limits are exceeded and there is no quick remedy, a loan
officer needs to escalate the limit violation to the branch manager; and f needed the
branch manager needs to escalate the violation of branch limits to the Head Office
agricultural department. Competent authorities will then advise on a remedial
strategy.
Exercise 3: complete the risk dashboard in groups of 3 to 5 for a branch of your choice. Try to
use real data from the branch and where absent, use best estimates.
4.5 Risk Coping or risk acceptance
When the cost of risk mitigation outweighs the potential benefit, one can choose to cope with
the risk or accept it as it is. No action is taken to mitigate the risk exposure; this should be a
conscious decision that is well documented.

Agricultural Credit Risk Management Training Manual Centenary Bank (2014)
28
Annex 1 – Scorecard for agricultural loans below 50 million Shs
Sl No ITEM RANGE SCORE INPUT
1 CLIENT REPUTATION Customer of very good character 10
and known by more than half
the number of committee members
Customer known by at least 2 6
committee members and
introduced/guaranteed by reputed
client
Customer was introduced and 2
guaranteed by reputed client
New Client 0
Input score
2 RELEVANT EXPERIENCE
Number of years in the business More than 10 years 8
More than 5 years 6
More than 2 years 3
Less than 2 years 2
New entrant 1
Input Score
3 PREVIOUS LOAN
HISTORY
NUMBER OF TIMES CLIENT More than 5 times 10
HAS BORROWED >3 times <5 times 8
> 2 times 5
One time 2
New borrower 0
Input Score
4 PREVIOUS LOAN HISTORY Average days of delay <2 days 5
Average days of delay < 2 but less
than 4 days
2
Average days of delay >4 days 0
Input Score
COLLATERAL
5 COLLATERAL TYPE Land Title (Developed) 10
Land Title (Undeveloped) 6
Motor Vehicle 2
Unregistered land 2
Chattel 2
Guarantor 2
Input Score
6 COLLATERAL VALUE FSV>150% of Loan Amount 10
FSV=100% to150% of Loan
Amount
8
FSV below 100% 2
Input Score
7 Residential Home Home owned with developed land
title
8
Home owned on
undeveloped/Kibanjia
4
Home rented 0
Input Score
FINANCIALS
8 Current Ratio
(Current Assets/Current
Liabilities)
More than 100% 6
80% -100% 4
>50%-80% 2
Below 50% 0
Input Score
9 INSTALMENT AMOUNT less than 30% of monthly 8
disposable income
less than 60% of monthly 4
disposable income
Near or more than 100% of 2
disposable income
Input Score
10 ACCOUNT RUN monthly deposits more than 5
times the instalment 5
monthly deposits more than
double the instalment 3
Monthly deposits equal or
below the instalment 2
Input Score
11 VILLAGE POTENTIAL:
Borrower situate in village/town
council/place with credit
potential considered
High Potential 5
(business/activity location) Medium 2
Low 0
Input Score
85 0Sub-Total GENERAL RISK PARAMETERS
Credit Score Model for Agricultural Loans Below UGX 50 Mn
PART "A" - GENERAL CREDIT RISK PARAMETERS
Agricultural Credit Risk Management Training Manual Centenary Bank (2014)
29
Sl No ITEM RANGE SCORE INPUT
1 EXTENT OF FARM
CULTIVATED
MORE THAN 20 ACRES 5
>10 ACRES BUT <20 ACRES 4
>5 ACRES BUT <10ACRES 3
MORE THAN 2 ACRES 2
2 ACRES AND LESS 1
Input Score Given
2 AGRI-PRODUCTION RISK
YIELD as percentage of
previous year's yield
as per or beyond estimate/ 100% 4
(If yield is fluctuating,
immediate three crop seasons'
average yield can be
reckoned)
likely to be 85% or above 3
likely to be between 70%-85% 2
likely to be between 70%-60% 1
likely to be less than 60% 0
Input Score Given
3 PRICE RISK
Price Volatility observed last
season
Stable or Low volatility up to 10% 6
Price Volatility= Volatility >10% but <20% 4
(Max Price-Min Price)/Average
Price
Volatility >20% but <30% 3
Average Price=(Max +Min )/2 Volatility >30% but <40% 2
(If immediate preceding
season's price is not reflective
of normal trend, immediate
three crop seasons' average
price can be reckoned)
Volatility >40% and <50% 1
Very High volatility 50% or more 0
Input Score Given
SUB TOTAL FOR AGRI
PRODUCTION RISK
PART B 15 0
`1 REGULARITY OF
INCOME FROM
ACTIVITY
Stable year round income 5
Seasonal income 3
Sporadic 1
Input Score Given
2 DEMAND SUPPLY GAP &
Competition
Good demand and low competition 5
Adequate demand with fair
competition
3
Declining demand & highly
competitive
1
Input Score Given
3 TREND IN NET INCOME
Increasing 5
Steady 3
Declining 1
Input Score Given
SUBTIOTAL FOR NON-
FARM ACTIVITY
Part C 15 0
SUMMMARY MAX SCORE
A General Risk Parameters 85 0
B Agri Production Risk factors 15 0
TOTAL SCORE Part A +Part B 100 0
A General Risk Parameters 85 0
C Agri
Processing/Marketing/Live
stock activities
15 0
TOTAL SCORE Part A +Part C 100 0
Score %
80% and above A
66% to 79% B
50%-65% C
Below 50% D
Decision Matrix
Score for Accept/Reject Decision
Scores of 50% and above Accept
40% to 50% Refer to Supervisor
Below 40% Reject
PART B- AGRI PRODUCTION LOANS
Credit Grade for Micro Loans and Loans below 50 Mn
FOR CROP PRODUCTION LOANS
FOR OTHER AGRI LOANS- (LIVESTOCK,PROCESSING
&MKTG)
PART C - AGRI PROCESSING, AGRI MARKETING & LIVE STOCK ACTIVITIES (Non-farm activity)
Agricultural Credit Risk Management Training Manual Centenary Bank (2014)
30
Annex 2 - Scorecard for agricultural loans above 50 million Shs Crop Production > 50m Shs
Sl No Parameter Max Assigned
Production Risk
1 Crop is traditionally grown in area 4
non traditional but soil and climate suitable 2
non traditional and suitability of soil/climate unknown 0
2 irrigation facility - canal/sprinkler/drip available 4
rain fed- generally no drought during last 3 seasons 2
rain fed- but droughts frequent 0
3 Quality inputs -seeds, fertilisers , pesticides available 2
Quality inputs difficult to procure 0
4 technical assistance- farm extension services available 2
technical assistance not available nearby 0
5 Crop damage due to infestation
Not likely as preventive measures taken last season 2
Damage under control due to reactive measures 1
No control and extensive damge last season 0
Sub Total Production risk 14 0
Price Risk
5 Demand likely to exceed crop arrival 3
demand to be equal to supply 2
demand likely to be less than supply 0
6 Price likely to be more than last season's 3
Price more or less at the same level as last season 2
Price likley to be less 0
7 forward sale contracted with committed price 2
forward sale without committed price 1
Sales on prevailing market price 0
8 No restriction on exports/movement of produce 2
restrictions on export/ movement 0
Sub Total Price Risk 10 0
Debt Servicing Ability
9
Present Net Income/Existing Debt Repayment
Obligation
Ratio is more than 3 2
Ratio is more than 2 but less than 3 1
All others 0
10 Net Incremental Income / Proposed Loan
More than 1.5 times 2
one to 1.5 times 1
Less than one time 0
11 Value of land owned/Total Debt (existing +proposed)
More than 1.5 times 2
1-1.5 times 1
< 1.0 times 0
Sub Total Debt Servicing Ability 6 0
Total Business Risk for Agri Production 30 0
Agricultural Credit Risk Management Training Manual Centenary Bank (2014)
31
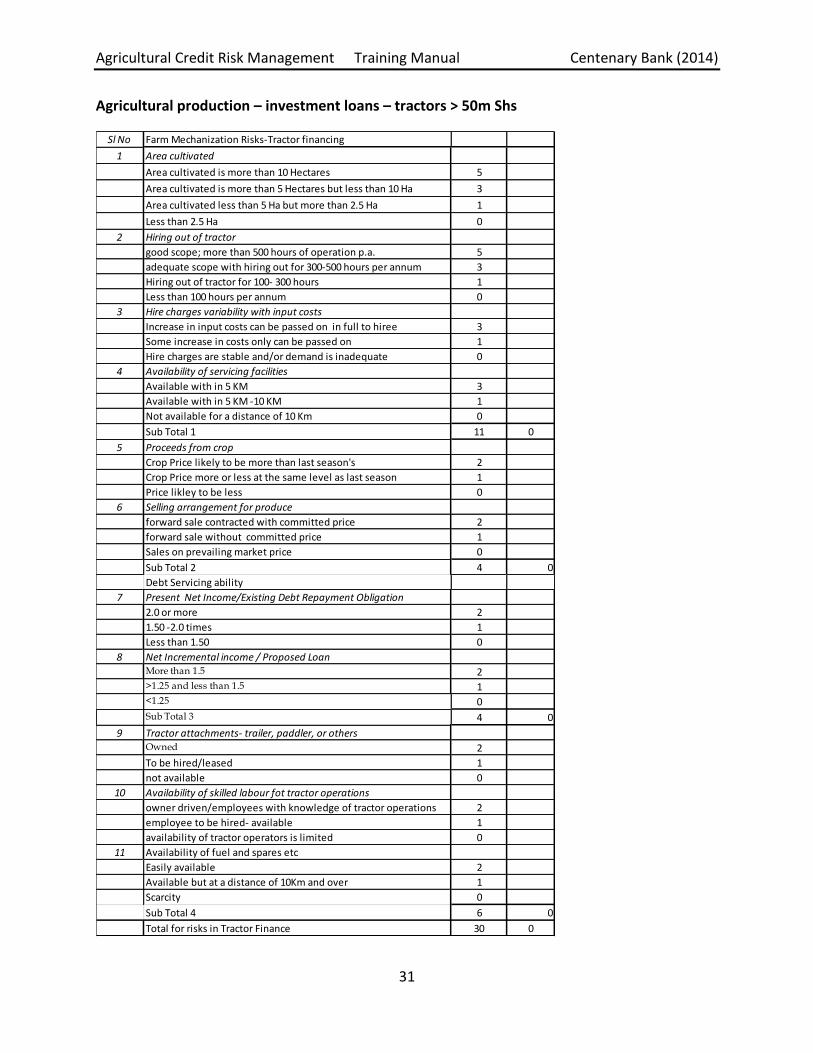
Agricultural production – investment loans – tractors > 50m Shs
Sl No Farm Mechanization Risks-Tractor financing
1 Area cultivated
Area cultivated is more than 10 Hectares 5
Area cultivated is more than 5 Hectares but less than 10 Ha 3
Area cultivated less than 5 Ha but more than 2.5 Ha 1
Less than 2.5 Ha 0
2 Hiring out of tractor
good scope; more than 500 hours of operation p.a. 5
adequate scope with hiring out for 300-500 hours per annum 3
Hiring out of tractor for 100- 300 hours 1
Less than 100 hours per annum 0
3 Hire charges variability with input costs
Increase in input costs can be passed on in full to hiree 3
Some increase in costs only can be passed on 1
Hire charges are stable and/or demand is inadequate 0
4 Availability of servicing facilities
Available with in 5 KM 3
Available with in 5 KM -10 KM 1
Not available for a distance of 10 Km 0
Sub Total 1 11 0
5 Proceeds from crop
Crop Price likely to be more than last season's 2
Crop Price more or less at the same level as last season 1
Price likley to be less 0
6 Selling arrangement for produce
forward sale contracted with committed price 2
forward sale without committed price 1
Sales on prevailing market price 0
Sub Total 2 4 0
Debt Servicing ability
7 Present Net Income/Existing Debt Repayment Obligation
2.0 or more 2
1.50 -2.0 times 1
Less than 1.50 0
8 Net Incremental income / Proposed Loan More than 1.5 2>1.25 and less than 1.5 1<1.25 0
Sub Total 3 4 0
9 Tractor attachments- trailer, paddler, or othersOwned 2
To be hired/leased 1
not available 0
10 Availability of skilled labour fot tractor operations
owner driven/employees with knowledge of tractor operations 2
employee to be hired- available 1
availability of tractor operators is limited 0
11 Availability of fuel and spares etc
Easily available 2
Available but at a distance of 10Km and over 1
Scarcity 0
Sub Total 4 6 0
Total for risks in Tractor Finance 30 0

Agricultural Credit Risk Management Training Manual Centenary Bank (2014)
32
Agricultural production – investment loans – other than tractors > 50 m Shs
Farm Mechanization/Investment Risks-Other than tractorsSprayers, drip irrigation, sprinklers, green houses, oil engines &
pumpsets, tillers, other farm equipments like paddle, thresher
1 Land Area
Area cultivated >5 Ha 5
Area cultivated 2.5 Ha -5 Ha 2
Area cultivated is >1.5 Ha and <2.5 Ha 1
Area cultivated <1.5Ha 0
2 Hire charges from hiring out equipment where possible
Estimated Hire charges in a year is 50% or more of instalment 5
Hire charges in a year >35% but less than 50% of instalment 2
Hire charges is 25%- 35% of instalment 1
Estimated Hire charges <25% of instalment payable 0
In cases of drip/sprinklers/green houses which cannot be
hired out being permanent fixtures
3 Estimated increase in production may be used as a parameter
Increase in production is 75% and more due to equipment 5
Increase in production is 50% -75% 2
Increase in production 20% -50% 1
Increase is below 20% 0
4 Availability of Servicing facilities
Servicing facility available with in 5 Km 2
Servicing facility available with in 5 Km-10Km 1
Servicing facility not available or available beyond 10 Km 0
5 Input risks
Quality inputs -seeds, fertilisers , pesticides available 1
Quality inputs difficult to procure 0
6 Technical advisory services
technical assistance- farm extension services available 1
technical assistance not available nearby 0
Sub Total Business risk 14
7 Price risk
Crop Price likely to be more than last season's 3
Crop Price more or less at the same level as last season 2
Price likley to be less 0
8 Off take risk
forward sale contracted with committed price 2
forward sale without committed price 1
Sales on prevailing market price 0
Sub Total Price risk 5
Debt Servicing Capacity
9 Present Net Income/Existing Debt Repayment Obligation
Ratio is more than 2 2
1.5 times to 2 1
<1.5 times 0
10 Net Incremental income / Proposed Loan
Ratio is more than 2 2
1.5 times to 2 1
<1.5 times 0
11 Value of land owned/Total Debt (exsiting +proposed)
Ratio is more than 2 2
1.5 times to 2 1
<1.5 times 0
Sub Total 3 6
12 Ease of operation & maintenance
Easy to operate & maintain; 2
Easy to operate but maintenace requires skilled mechanics 1
Difficult to operate and maintain 0
13 Operating costs
Negligible as manual operation 3
Low -electric power 1
High as operates on fossil fuels 0
Sub Total 4 5
Total risks score 30

Agricultural Credit Risk Management Training Manual Centenary Bank (2014)
33
Agricultural production – farm & land development > 50m Shs
Farm Development Loans
These are term credits for tenors > 3 years and are intended to facilitate irrigation
potential or bring additional land acreage into agricultural production of long duration
/perennial/cash crops such as coffee/tea/cocoa etc
For Bore well/dug well Max score Assigned
1 Existing Area under production
10 Ha and above 5
5 Ha- 10 Ha 2
Below 5 Ha 0
2 Availability of Sub Soil water
Established availability through testing 5
Expected availability- presence of wells in nearby areas 2
No knowledge about ground water resources - taking a chance 0
3 Yield increase or income increase due to bore/dug well
increase above 75% 5
increase 50%-75% of current yield without irrigation 2
increase 35%-50% 1
increase <35% 0
4 Increase in cultivated area due to irrigation
additional area-50% and above of existing cultivated area 5
25% -50% of existing area 2
>15% but Less than 25% 1
Less than 15% increase 0
5 Usage of land for additional crop resulting in enhanced income
Income increase 75% and above of current net income 5
Income increase 50% -75% 2
Income increase 30% -50% 1
Less than 30% 0
6 Water distribution arrangement
Sprinklers/drip irrigation system 5
through pump and channels 3
manual watering 0
Business Risk for Land development - Bore/Dug well 30 0
For Other Land Development activities
1 Existing Area under production Max score Assigned
10 Ha and above 5
5 Ha- 10 Ha 2
Below 5 Ha 1
2 Proposed Additional acerage to Existing area
75% and above 5
50% - 75% 2
> 25% but Less than 50% of existing 1
less than 25% 0
3 Suitability of additional land for agri production
Suitable ; requires some clearing and levelling 3
Suitable but requires moderate clearing and levelling 1
all others 0
4 Availability of good quality seedlings/plantlings
Certified quality planting material available 3
Available without quality certification 1
Short supply 0
5 Availability of water
Ample water supply- irrigation facility available 3
Adequate- rain fall is sufficient after certain stage of growth 1
Inadequate rainfall- no regular source of water 0
6 Availability of inputs -fertiliser/pesticide/farmyard manure
Available 2
Suplly not consistent 0
7 Technical Services
Farm extension technical services available within 25 Km distance 2
Not available/distance too much 0
8 Ease of access to market and demand for produce
good access and growing demand 2
fair access and growing demand 1
poor acces and /or slack demand 0
9 Debt Servicing Ability with current income=DSCR =N/D
N=Current Net Income before interest and depreciation
D= (Interest on loans + Instalments payable) during one year
DSCR >2.5 times 5
1.75-2.5 times 2
1.50-1.75 1
Below1.5 0
Business Risk for Land development - other than Bore/Dug well 30 0

Agricultural Credit Risk Management Training Manual Centenary Bank (2014)
34
Livestock > 50m Shs
Sl No Agri Production -Live Stock Financing Risks
1 Adequacy of Land/shed/cage/ barn/ sty etc Max
Ample land for grazing/housing of livestock 3
Adequate for the population of livestock existing +addition proposed 1
Inadequate for proposed population of livestock 0
2 Availability of water
This applies to advances for Dairy farming, poultry farming, Adequate and regular water sources 3
Adequate but shortage now and then 1
Inadequate for proposed population of livestock 0
3 Availability of feed and feed supplements
Available without interruption 4
Available with shortage now and then 2
Frequent shortages 0
4 Pass through of cost escalation in feed and nutrient prices
100% pass thorugh (Pl see note below) 3
Partial pass through of 50% or more 2
Pass through of cost escalation less than 50% 0
5 Availability of Services of Veterinary Doctor
Available and regular screening of live stock for diseases 2
Irregular screening but experienced staff know to treat minor outbreaks 1
Services not available easily 0
6 Vulnerability to diseases
Vaccination where applicable done regularly 1
No preventive steps taken 0
7 Availability of veterinary medicines
Available easily within 10 Km radius 1
Not easily available 0
8 Volatility (downside) in price realisation during last 12 months
Observed volatility <10% /stable prices 4
Observed Downside volatility between 10%-20% 2
Downside volatility >20% but less than 30% 1
More than 30% 0
9 Selling and Distribution arrangements
Has set up own retail distribution 2
supplies to established clientele like department stores/restaurants etc 1
no formal distribution arrangement 0
10 Cold Storage and Cold Chain for supplies
Has cold storage and refrigerated vans for supplies 2
Only cold storage at place of business 1
no cold storage for preservation 0
11 Credit Sales
Maximum of 7 days credit to established customers 3
Credit period upto 30 days for established customers 1
Credit period exceeding 30 days 0
12 Secondary sources of income
Regular & > 25% of main business income 2
regular & between 15%-25% of main business income 1
irregular or less than 15% of main business income 0
30
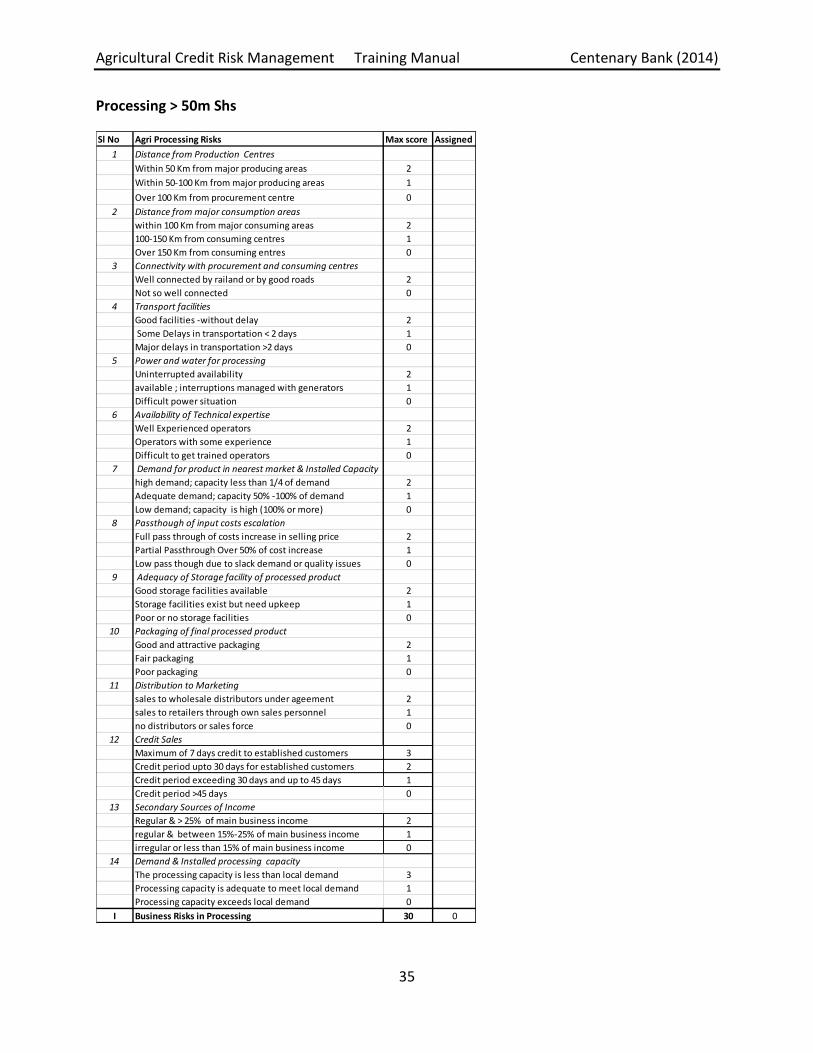
Agricultural Credit Risk Management Training Manual Centenary Bank (2014)
35
Processing > 50m Shs
Sl No Agri Processing Risks Max score Assigned
1 Distance from Production Centres
Within 50 Km from major producing areas 2
Within 50-100 Km from major producing areas 1
Over 100 Km from procurement centre 0
2 Distance from major consumption areas
within 100 Km from major consuming areas 2
100-150 Km from consuming centres 1
Over 150 Km from consuming entres 0
3 Connectivity with procurement and consuming centres
Well connected by railand or by good roads 2
Not so well connected 0
4 Transport facilities
Good facilities -without delay 2
Some Delays in transportation < 2 days 1
Major delays in transportation >2 days 0
5 Power and water for processing
Uninterrupted availability 2
available ; interruptions managed with generators 1
Difficult power situation 0
6 Availability of Technical expertise
Well Experienced operators 2
Operators with some experience 1
Difficult to get trained operators 0
7 Demand for product in nearest market & Installed Capacity
high demand; capacity less than 1/4 of demand 2
Adequate demand; capacity 50% -100% of demand 1
Low demand; capacity is high (100% or more) 0
8 Passthough of input costs escalation
Full pass through of costs increase in selling price 2
Partial Passthrough Over 50% of cost increase 1
Low pass though due to slack demand or quality issues 0
9 Adequacy of Storage facility of processed product
Good storage facilities available 2
Storage facilities exist but need upkeep 1
Poor or no storage facilities 0
10 Packaging of final processed product
Good and attractive packaging 2
Fair packaging 1
Poor packaging 0
11 Distribution to Marketing
sales to wholesale distributors under ageement 2
sales to retailers through own sales personnel 1
no distributors or sales force 0
12 Credit Sales
Maximum of 7 days credit to established customers 3
Credit period upto 30 days for established customers 2
Credit period exceeding 30 days and up to 45 days 1
Credit period >45 days 0
13 Secondary Sources of Income
Regular & > 25% of main business income 2
regular & between 15%-25% of main business income 1
irregular or less than 15% of main business income 0
14 Demand & Installed processing capacity
The processing capacity is less than local demand 3
Processing capacity is adequate to meet local demand 1
Processing capacity exceeds local demand 0
I Business Risks in Processing 30 0

Agricultural Credit Risk Management Training Manual Centenary Bank (2014)
36
Marketing > 50m Shs
Sl No Agri Marketing Risks Maximum Assigned
1 Procurement
Purchases under firm contracts for sale 3
Purchase against regular but uncommitted sale orders 2
Purchases with speculative intent 1
2 Diversification of Produce marketing
Dealing in multi products with many customers 3
Dealing in single product with many customers 2
Dealing in single product with limited clients 1
3 Business Premises
Business Premises in major consuming centre 1
Business premises out of major consuming centre 0
4 Selling arrangement
Buys, stores and sells 2
Buys and sells immediately without storing 1
5 Storage Facility
Owns easily accessible & good storage facility of capacity 3
Rents easily accessible & good storage facilty 1
Storage facility of poor quality irrespective of access 0
6 Types of customers
Government departments, corporates, institutions, departmental stores etc 3
Dealers/Retailers who are regular customers 2
Retail to consumers 1
7 Cleaning & Repackaging of produce
Undertakes cleaning and repacking in small packs 2
Undertakes cleaning but sells without repacking in smaller packets 1
Sells as received 0
8 Credit Sales-days
Maximum seven days for long standing customers 3
Credit to long standing good clients of maximum 30 days 2
Credit >30 days- 45 days 1
Credit extended over 45 days 0
9 Accounts Maintenance
Proper books of accounts maintained upto date 2
Books of accounts kept but updated weekly 1
Books of accounts not updated regularly ; only bills/invoices kept 0
10 Sales and distribution
Wholesaler 4
Retailer with a number of outlets 2
Retailerwith single outlet 1
11 Retail outlet/s location
Outlet/s in upmarket location/s attracting good footfall 2
Outlet/s in good location/s attracting reasonable footfall 1
Outlet/s in not so well developed location/ NO OUTLETS 0
12 Potential for export
Export demand being tapped 2
Exports in small way; yet to pick up 1
No exports ; only domestic sales 0
Total Business Risks in Agri-Marketing 30 0