Embed Size (px)
Citation preview

Agricultural Block Trade Analysis
A Report by Staff of the Market Intelligence Branch
Division of Market Oversight
U.S. Commodity Futures Trading Commission
July 2018
DISCLAIMER
This is a report by staff of the U.S. Commodity Futures Trading Commission. Any views expressed in this report are
solely the views of staff, and do not necessarily represent the position or views of any Commissioner or the
Commission.
Table of Contents
Significance of Block Trades .......................................................................................................................... 1
Key Questions and Answers .......................................................................................................................... 2
Methodology Overview ................................................................................................................................ 2
Block Trades and the Central Limit Order Book ............................................................................................ 7
Conclusions and Takeaways .......................................................................................................................... 9
Staff Contributors ....................................................................................................................................... 10

List of Exhibits
Exhibit 1: Block Trades Percentage ................................................................................................ 3
Exhibit 2: High Block Volume Days ................................................................................................ 4
Exhibit 3: All Futures and Options Combined (AFOC) .................................................................... 5
Exhibit 4: Nearby versus Deferred Blocks ...................................................................................... 6
Exhibit 5: Blocks Offset in the Central Limit Order Book (CLOB) ................................................... 7
Exhibit 6: Block Pricing ................................................................................................................... 8

1
Significance of Block Trades The Chicago Mercantile Exchange (“CME”) launched block trading for the full suite of agricultural futures and options on futures products on January 8, 2018. Prior to this action, the CME had allowed block trades for only eleven products in the agricultural asset class. Block trading is an important issue for the CFTC because of DCM Core Principle 9 of the Commodity Exchange Act which states that “[t]he board of trade shall provide a competitive, open, and efficient market and mechanism for executing transactions that protects the price discovery process of trading in the centralized market of the board of trade.”1 Prior to the CME’s January launch of block trading, the CFTC heard various concerns from some members of the industry – most importantly, that block trades could reduce liquidity from the central limit order book (“CLOB”) and could reduce price transparency. Since January’s implementation of block trading, Division of Market Oversight (“DMO”) staff has heard additional concerns that block trades are occurring in liquid front months and prices of some block trades appear to be outside the range of current prices. DMO staff has also heard that there have been instances of delays in reporting block trades2 and conflicting block data displayed on two pages of CME’s website.3 DMO staff has taken these concerns seriously and made recommendations to the CME. DMO staff has also undertaken a data-driven analysis of all futures block trades from January 2018 through March 2018 in order to keep the Commission and industry participants informed on this issue.
1 7 U.S.C. 7(d)(9).
2 CME Rule 526 specifies a 5 or 15 minute reporting requirement depending on the product.
3 Block trades are posted on CME’s website at this link.

2
Key Questions and Answers
DMO staff designed its analysis to answer several questions related to industry concerns. A summary of the questions and answers follows. How large is agricultural block trade volume relative to total agricultural volume? Block trades are insignificant compared to total volume, but the analysis shows block trades can be a significant percent of the total volume in an individual contract month on specific days. Are agricultural block trades displacing total agricultural volume?
DMO staff observed no increase in block trade volume relative to total volume. Are agricultural block trades occurring in nearby months? Over 75% of block volume is in the nearby months. Are agricultural block trades pulling liquidity away from the CLOB?
Almost 65% of block futures volume is being offset in the CLOB for the same contract expiration on the same day. Are block trades being executed at “fair and reasonable” levels in accordance with CME rules? Yes; they are in compliance with CME rules.
Methodology Overview
DMO staff analyzed all grain, oilseed, and livestock transactions from January 8 through March 31. DMO staff sourced the block trade and position data from proprietary data submitted to the CFTC. DMO staff sourced order book, market volume, and price data from Vertex and DTN. Additionally, DMO staff used the CME Advisory Notice (RA1719-5R) and CME Rule 526 to evaluate the “fair and reasonable” price standard for block trades. DMO staff identified 131 futures blocks (12 outright and 119 spreads) and 87 options on futures blocks. Each apparent spread transaction was counted as two separate legs because that is how they are cleared. The reason for the odd number on the legged spreads results from a corn/ethanol spread block. Since ethanol is not part of this study, DMO staff excluded it from

3
the analysis. One of the reasons traders sometimes execute block trades is for these more exotic spread trades, such as this corn/ethanol spread. For this study, DMO staff included futures and options in the volume summary statistics which are displayed in Exhibits 1 to 4 below. DMO staff focused the detailed pricing and liquidity analysis in Exhibits 5 and 6 below on futures-only block trades, due to the complexity of options and the relatively small value of options on a delta adjusted basis.
Exhibit 1: Block Trades Percentage (Futures and Options)
Similar to what the CME showed at the CFTC Agricultural Advisory Committee meeting in April, blocks are an extremely small percentage of total futures and options volume. The middle column of Exhibit 1 compares block volume to all volume. Every agricultural commodity’s share of block trades is well below one percent with an average of about 1/6 of one percent. This demonstrates that block trading is not a significant share of the market and that blocks could not consistently impact price discovery. The right column of Exhibit 1 displays block volume on days when blocks actually occur. On 25% of the trade days, no block trades are executed in any of the agricultural markets analyzed, so the prevalence of many “zero” observances skews the data downward. When removing the dates with no block trades from each commodity and then comparing block volume with total volume, block trades are still very small, averaging about 1.5% of total volume. However, that total volume is about 10 times larger than the “all days” column. The 1.5% is also not concerning, but it is important to note that blocks are larger than what other analyses may present.
4
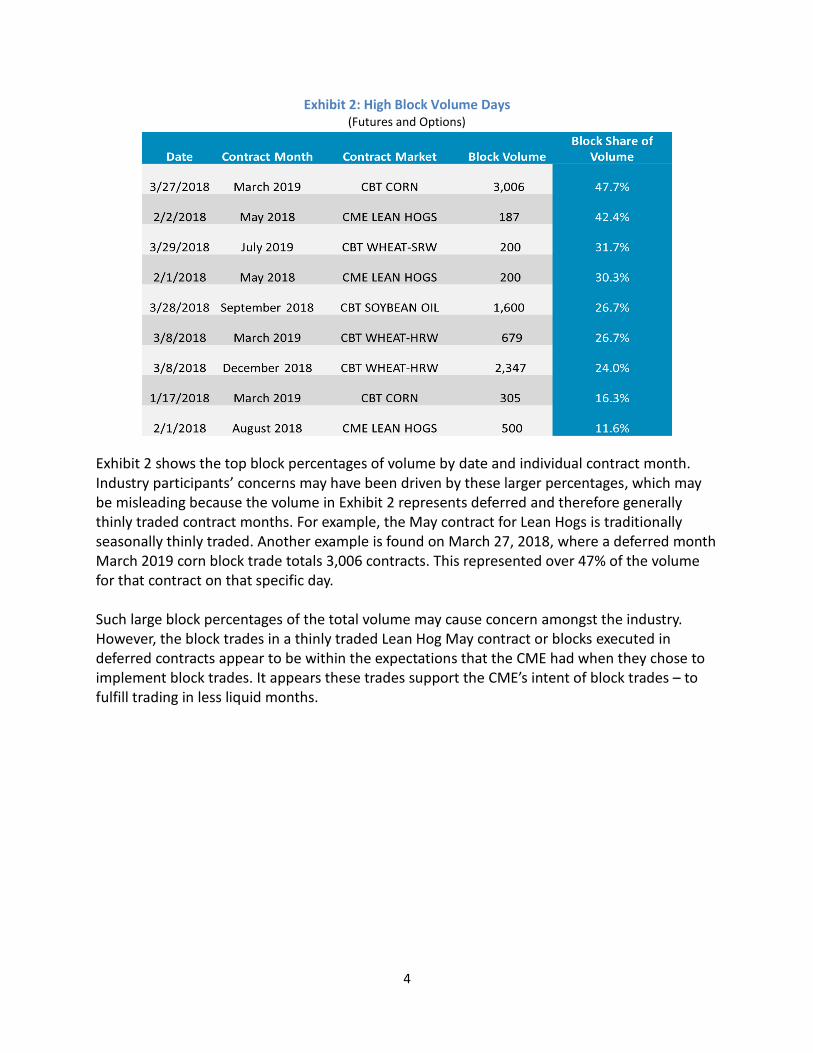
Exhibit 2: High Block Volume Days (Futures and Options)
Exhibit 2 shows the top block percentages of volume by date and individual contract month. Industry participants’ concerns may have been driven by these larger percentages, which may be misleading because the volume in Exhibit 2 represents deferred and therefore generally thinly traded contract months. For example, the May contract for Lean Hogs is traditionally seasonally thinly traded. Another example is found on March 27, 2018, where a deferred month March 2019 corn block trade totals 3,006 contracts. This represented over 47% of the volume for that contract on that specific day. Such large block percentages of the total volume may cause concern amongst the industry. However, the block trades in a thinly traded Lean Hog May contract or blocks executed in deferred contracts appear to be within the expectations that the CME had when they chose to implement block trades. It appears these trades support the CME’s intent of block trades – to fulfill trading in less liquid months.

5
Exhibit 3: All Futures and Options Combined (AFOC) (Futures and Options)
Contracts Percent
Exhibit 3 shows agricultural block volume (red line using the left axis) versus agricultural block volume as a percent of total agricultural volume (blue line using right axis). In a recent Wall Street Journal article, the National Grain and Feed Association expressed a wariness “of increasing futures volume moving into blocks… [fearing] if volumes grow too large it could limit market participation, especially for relatively smaller hedgers.”4 Three months is probably too small of a data set to determine if agricultural blocks add or subtract from total volume. However, the data shows that the number of block trades is not increasing and, as Exhibit 3 demonstrates, the block volume and block share of volume are also not increasing. Of note, the large record block volume of almost 30,000 contracts on February 8, 2018 was primarily due to two large block corn spread trades. On this day, block trade volume was the highest percentage observed to date at 1.2% of total agricultural volume on that day, about 4% of the March corn volume, and 6% of the May corn volume. DMO staff will continue monitoring this situation and report any significant changes.
4 Benjamin Parkin and Jacob Bunge, Livestock and Grain Traders Navigate Murkier Market, The Wall Street Journal,
April 8, 2018, WSJ link.

6
Exhibit 4: Nearby (< 90 days) versus Deferred Blocks
(Futures and Options)
Exhibit 4 shows over 75% of the agricultural block trades are occurring in the front two (most liquid) months of agricultural contracts. For example, the share of corn block volume associated with the nearby months is 78%. The industry concern is that block trades are pulling volume from liquid contracts. As an example, on February 8th the March-May corn spread volume was about 125,000 contracts for the day. Of that specific spread volume, there were two large block trades that accounted for almost 14,000 contracts. This concerned the industry because the use of block trades in liquid contracts appears to conflict with the expectations set by the CME in the pre-launch of block trades. Prior to the launch of agricultural block trading, the CME publicly opined that blocks would primarily be traded in deferred and thinly traded contracts. There is no rule violation in trading nearby block months but due to these statements and industry expectations, nearby month block trades are likely getting the industry’s attention. The takeaway is that the block trades are still occurring mainly in the nearby months, as they were when DMO staff first examined them in February. DMO staff notes that some of the nearby block volume occurs due to the large number of apparent spread trades where institutional traders are executing a nearby leg with a deferred leg on a spread. Nearby block volume is three times that of deferred block volume, but a large portion of these nearby month legs are being traded as blocks because of the thinly traded deferred month leg. About 90% of block trades are apparent spread trades.

7
Block Trades and the Central Limit Order Book
Block trade sizes can be large relative to the available liquidity in the CLOB. Generally, if a large order is entered into an illiquid market that market could experience price and volume spikes that could trigger both stop logic and/or velocity logic events. The impact of a large order could trigger prices of resting orders to be traded through rapidly, only to snap right back – possibly even causing a flash crash. Because the liquidity in some markets is not large enough to accommodate the execution of larger sized orders, participants may be harmed. Offsetting a block trade over time could help to buffer sudden wide price moves in thinly traded markets. Some industry participants, particularly hedgers, who have expressed concerns that block trades take liquidity away from the CLOB, may be discounting the buffering effect that block trade offsetting can have on sudden price swings.
DMO staff analyzed this concern by focusing on identifying and measuring the block trades that are being offset in the CLOB. DMO staff took a conservative approach to measuring which block trades are being offset in the CLOB. For this study, the term “offset” means a trader transacted the opposite side of their block trade in the CLOB on the same day, same contract, and same month as the block trade. DMO staff opted to keep a narrow offset methodology to assure the offsets are not overstated.
Exhibit 5: Blocks Offset in the CLOB (Futures Only - No Options)
The far right column in Exhibit 5 shows the percentage of blocks offset into the CLOB by product. DMO staff observed a fairly large range from 41% to 87%. The average percent offset in the CLOB for all agricultural products examined is 64%, which means, if two participants execute a block, 64% of that volume hits the CLOB for that trade date. The market maker of those participants execute in the CLOB with trades opposite the side that they filled in the block. DMO staff also learned, through trader interviews, that some traders use blocks in place of swaps and
8
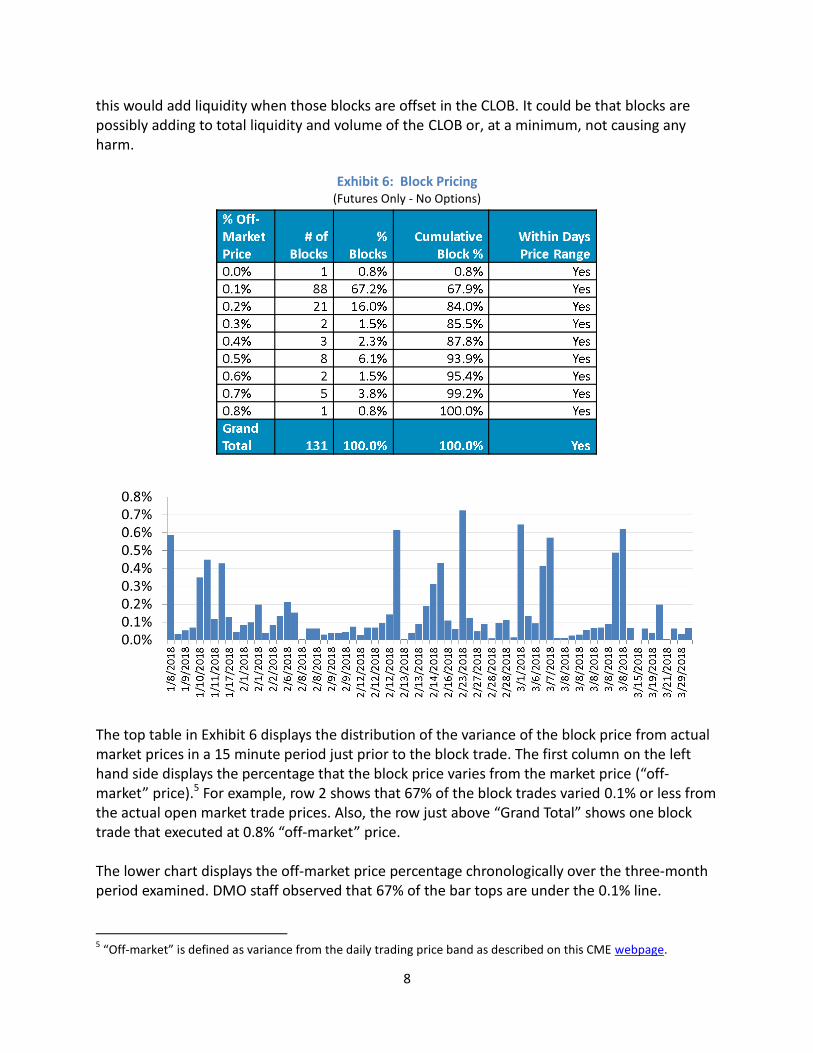
this would add liquidity when those blocks are offset in the CLOB. It could be that blocks are possibly adding to total liquidity and volume of the CLOB or, at a minimum, not causing any harm.
Exhibit 6: Block Pricing (Futures Only - No Options)
The top table in Exhibit 6 displays the distribution of the variance of the block price from actual market prices in a 15 minute period just prior to the block trade. The first column on the left hand side displays the percentage that the block price varies from the market price (“off-market” price).5 For example, row 2 shows that 67% of the block trades varied 0.1% or less from the actual open market trade prices. Also, the row just above “Grand Total” shows one block trade that executed at 0.8% “off-market” price. The lower chart displays the off-market price percentage chronologically over the three-month period examined. DMO staff observed that 67% of the bar tops are under the 0.1% line.
5 “Off-market” is defined as variance from the daily trading price band as described on this CME webpage.

9
The CME requires trades to be executed at a fair and reasonable price. One of the main components of the “fair and reasonable” rule is that block trades must be executed within the day’s trading range. All the futures block prices that DMO staff analyzed were executed within the trade date’s trading range which, during any given day, can be quite wide. DMO staff makes no judgment on the CME rule, but is confident the analysis shows the rule is being enforced correctly.
Conclusions and Takeaways
Block trades in the agricultural space are a very small portion of the overall volume, but are somewhat more significant on specific dates and for certain contract months.
Block trades are primarily occurring in nearby months. Market makers appear to be offsetting much of the block volume into the CLOB.
The prices of blocks appear to be priced within the CME rule for “fair and reasonable” prices. DMO staff will continue to monitor block trades, looking for examples of:
Block prices outside the normal trade range.
Liquidity being pulled away from the front months.
Block trade volume being offset in the CLOB. DMO staff regularly speaks to the agricultural community through trader calls and will continue to engage the industry as block trades have been a large concern since the expansion earlier this year.

10
Staff Contributors
David Amato, Supervisory Market Analyst, Market Intelligence Branch Twan Dixon, Market Analyst, Market Intelligence Branch Gene Kunda, Market Analyst, Market Intelligence Branch Jerry Lavin, Market Analyst, Market Intelligence Branch Bob Penksa, Market Analyst, Market Intelligence Branch Rahul Varma, Acting Deputy Director, Market Intelligence Branch