Embed Size (px)
Citation preview
Agricultural Biodiversity for Better
Nutrition and Improved Livelihoods in
sub-Saharan Africa – the case of Forest
Foods in Congo Basin
By
Robert Fungo, PhD
Independent Consultant
Presented to Members of the Agriculture, Nutrition and Health Academy and the African
Nutrition Society on 28th February 2016
About the Presenter
• Former Nutrition and Food Security Expert, at UNFAO June 2016 - Dec 2017
• Nutritionist, Bioversity International, May 2010-Dec 2015.
• Secretary General, African Nutrition Society (ANS). Oct 2012- Oct 2016
• Vice President, Federation of African Nutrition Societies (FANUS) Dec 2017 to date.
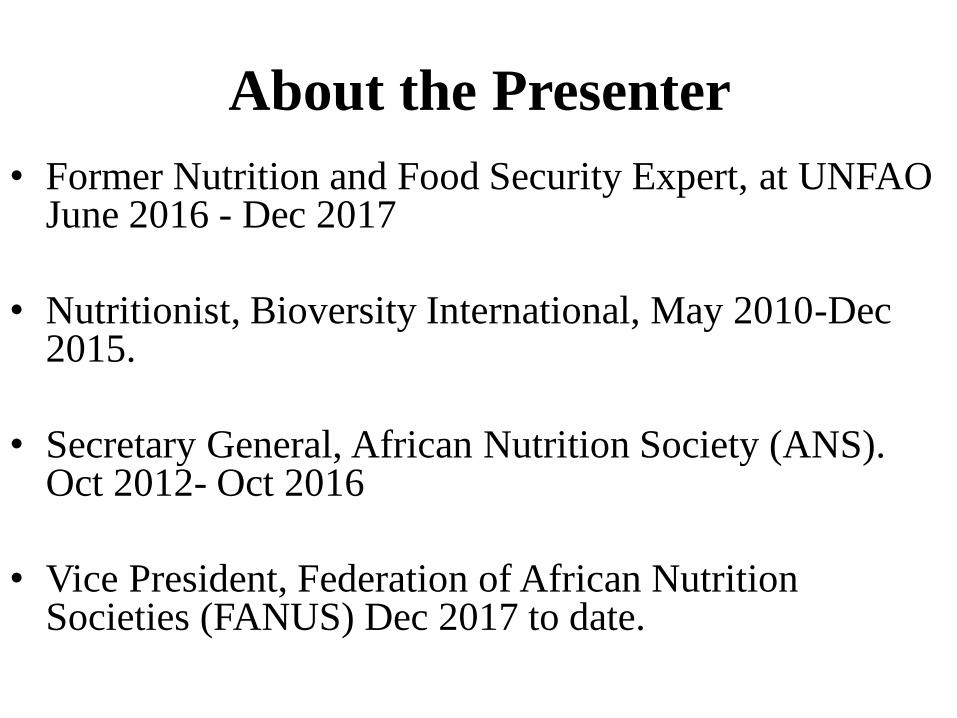
Congo Basin Forest Countries
Definitions
• Agrobiodiversity – the variety and variability of animals, plants and micro-organisms used directly or indirectly for food and agriculture.
• Dietary diversity – the number of unique foods consumed over a given period of time.
• Nutritional status – the condition of health of a person that is influenced by the intake and utilization of nutrients.
• Linkages are often assumed to be automatic
• Worked with six key institutions in Cameroon, DR Congo and Gabon.
Focus on:
i. Assessment of genetic diversity of forest foods
ii. Document database of locally valued priority species threatened by logging,
iii. Assess ecological, nutritional and genetic data for selected food species
iv. Forest management models to reconcile timber and non-timber production
designed
v. Recommendations provided for forestry legislation and social responsibility
contracts
Background
Beyond Timber: Reconciling the needs of the
Logging Industry with those of Forest-
Dependent People (2011-2013)
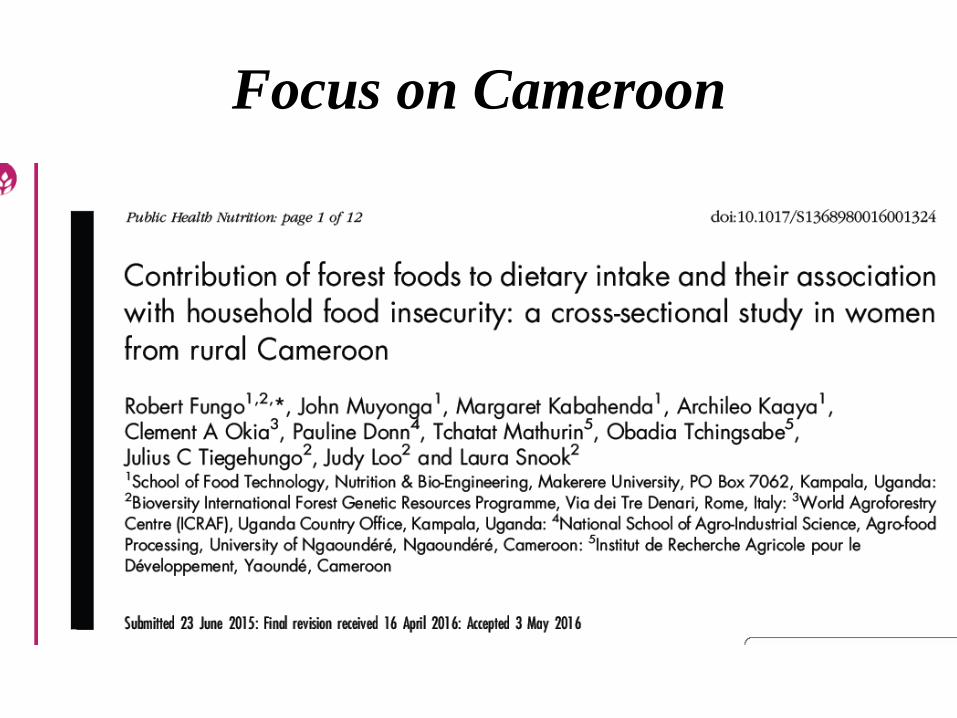
Focus on Cameroon
Background
• More than 50% of infancy deaths in Cameroon, are associated with
under nutrition.
– Stunting (37%) in Cameroonian children is about 15 times the levels expected
in a normal healthy population (CDHS, 2011).
• Consequence for not taking action results in a 10% loss of lifetime
earnings of an individual and 3% reduction in gross domestic
product (GDP) (World Bank, 2006).
• Interventions to prevent health disorders related to malnutrition,
would best be addressed through food based strategies, such as
dietary diversification including consumption of forest foods.
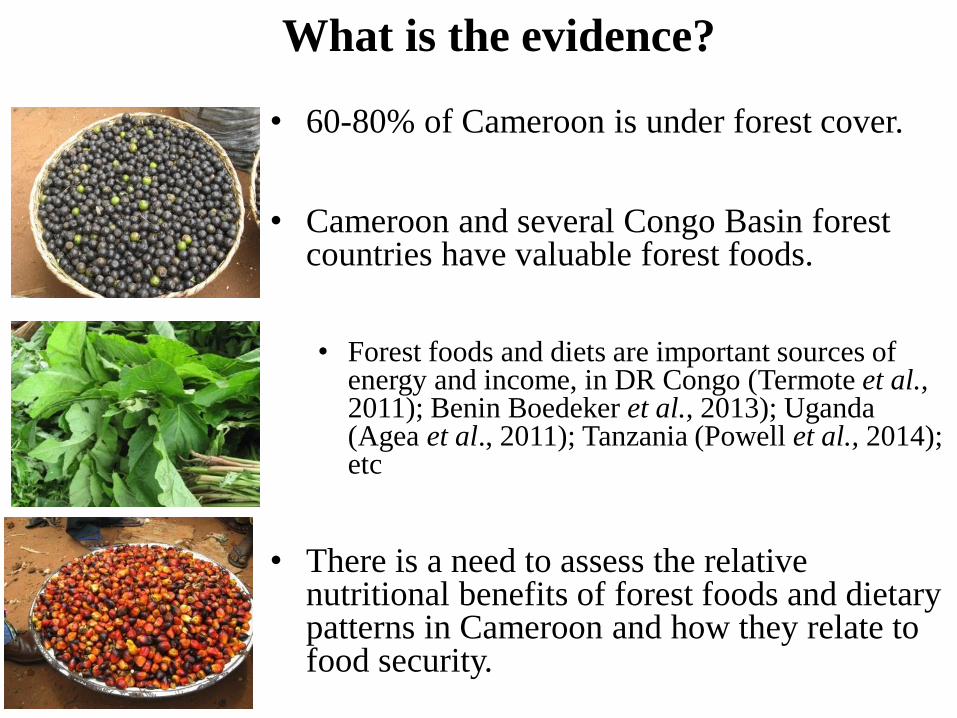
What is the evidence?
• 60-80% of Cameroon is under forest cover.
• Cameroon and several Congo Basin forest countries have valuable forest foods.
• Forest foods and diets are important sources of energy and income, in DR Congo (Termote et al., 2011); Benin Boedeker et al., 2013); Uganda (Agea et al., 2011); Tanzania (Powell et al., 2014); etc
• There is a need to assess the relative nutritional benefits of forest foods and dietary patterns in Cameroon and how they relate to food security.
General objective
• To establish the contribution of forest foods to
household nutrient intake and food security in
Cameroon.
Research questions
i. What are the most important forest food species
consumed?
ii. To what extent do forest foods contribute to
household nutrient and dietary intake and food
security?
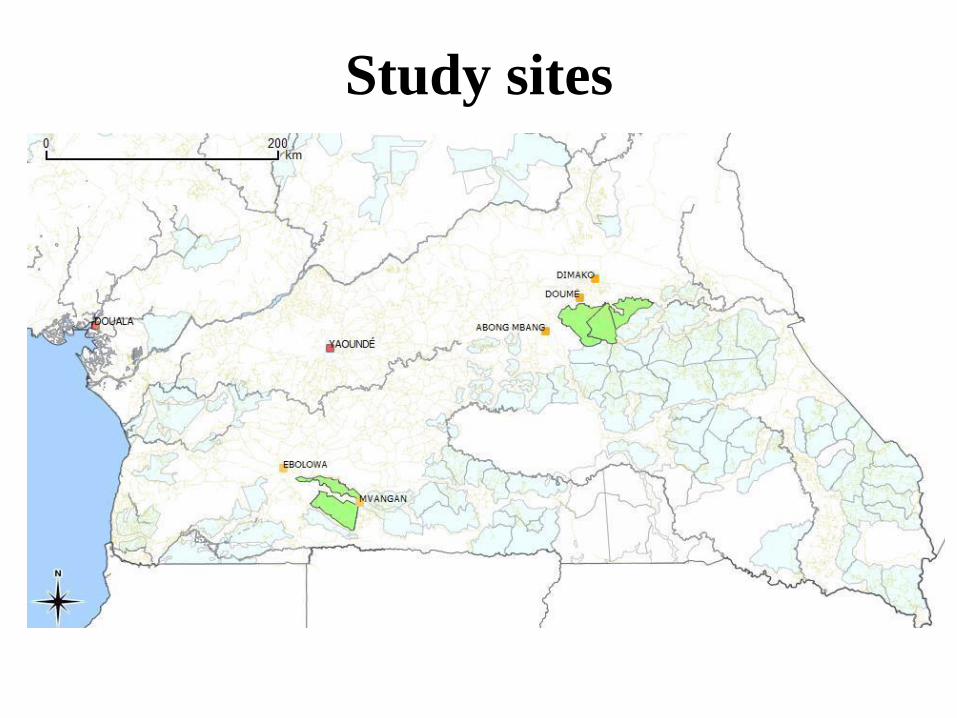
Study sites
Study design
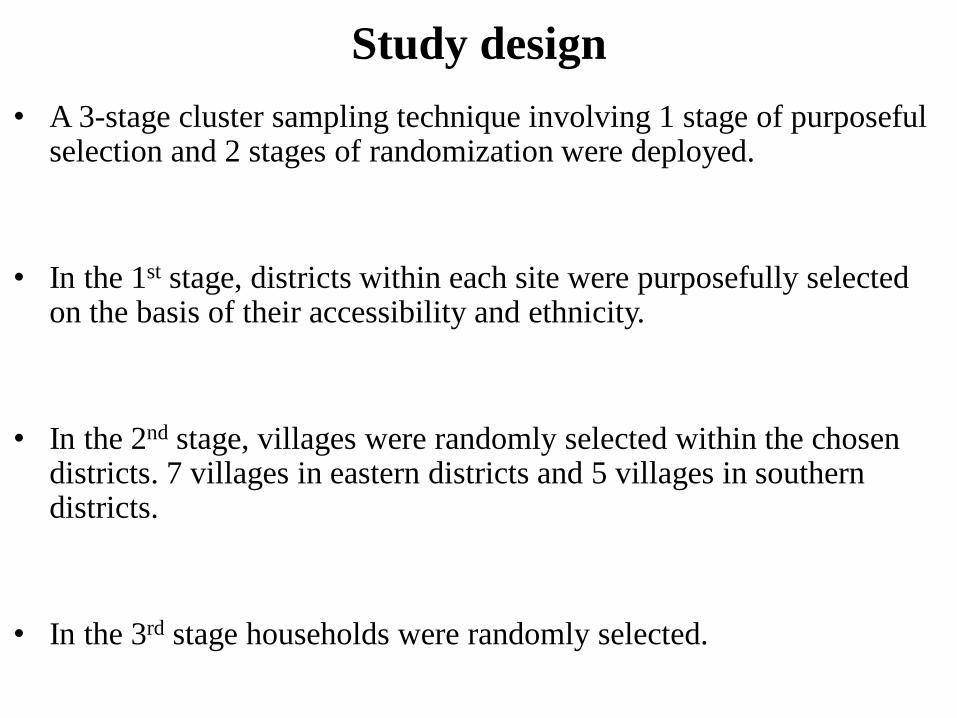
• A 3-stage cluster sampling technique involving 1 stage of purposeful selection and 2 stages of randomization were deployed.
• In the 1st stage, districts within each site were purposefully selected on the basis of their accessibility and ethnicity.
• In the 2nd stage, villages were randomly selected within the chosen districts. 7 villages in eastern districts and 5 villages in southern districts.
• In the 3rd stage households were randomly selected.
Household sample size calculation
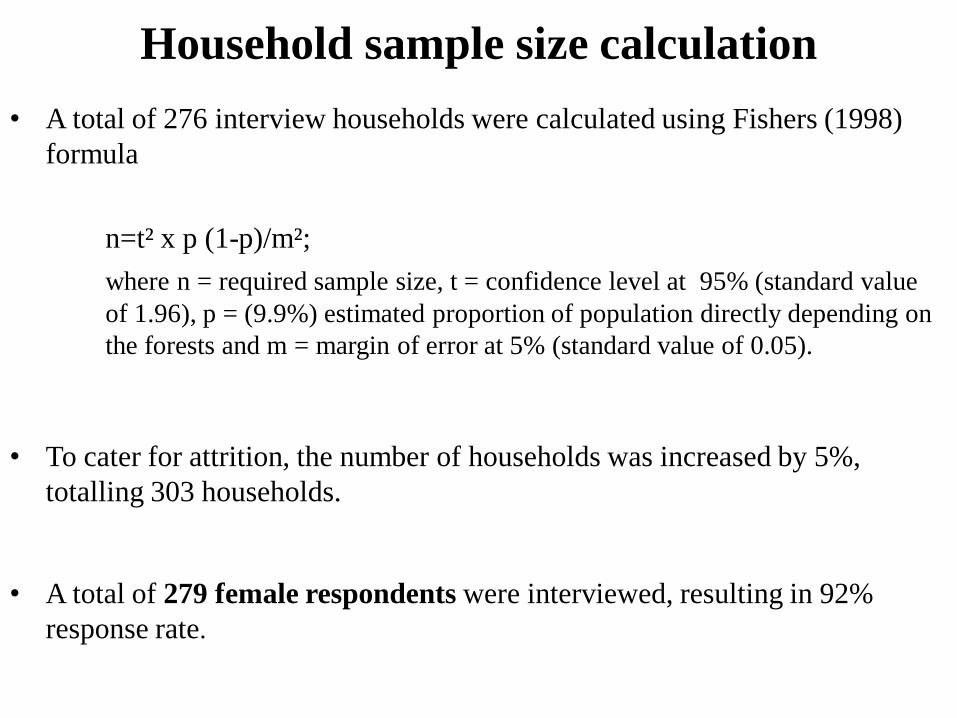
• A total of 276 interview households were calculated using Fishers (1998)
formula
n=t² x p (1-p)/m²;
where n = required sample size, t = confidence level at 95% (standard value
of 1.96), p = (9.9%) estimated proportion of population directly depending on
the forests and m = margin of error at 5% (standard value of 0.05).
• To cater for attrition, the number of households was increased by 5%,
totalling 303 households.
• A total of 279 female respondents were interviewed, resulting in 92%
response rate.
Data collected
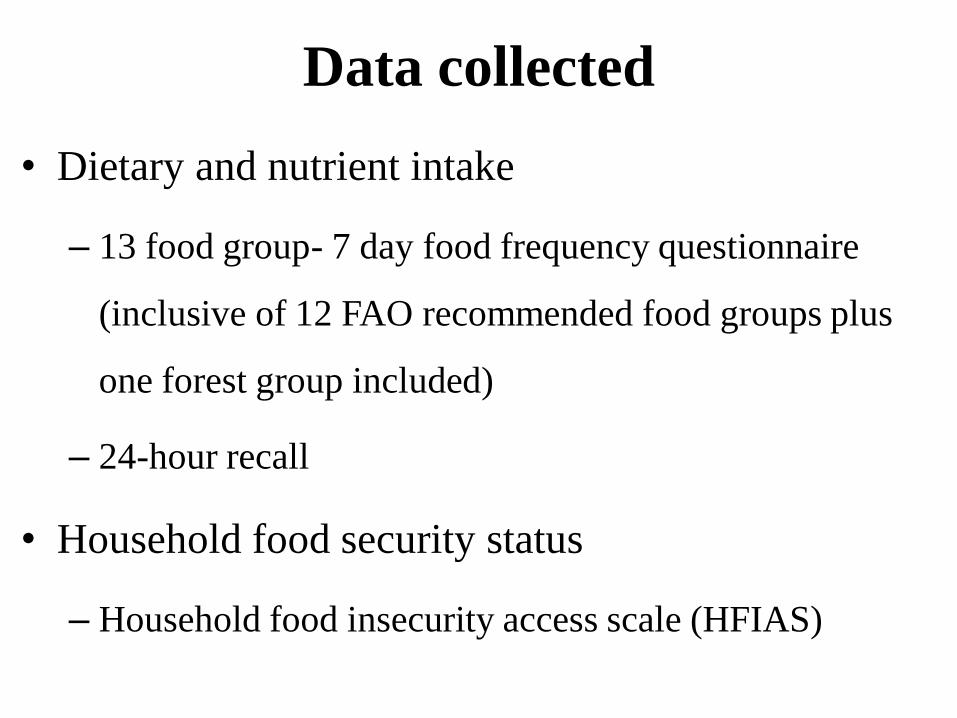
• Dietary and nutrient intake
– 13 food group- 7 day food frequency questionnaire
(inclusive of 12 FAO recommended food groups plus
one forest group included)
– 24-hour recall
• Household food security status
– Household food insecurity access scale (HFIAS)
Data analysis
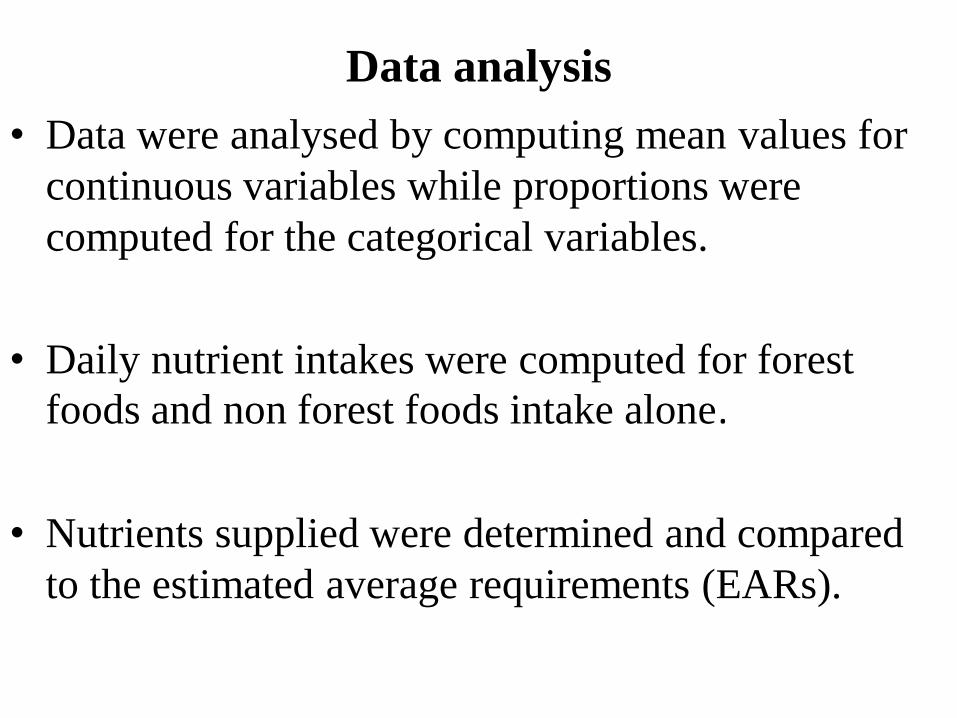
• Data were analysed by computing mean values for
continuous variables while proportions were
computed for the categorical variables.
• Daily nutrient intakes were computed for forest
foods and non forest foods intake alone.
• Nutrients supplied were determined and compared
to the estimated average requirements (EARs).
Results
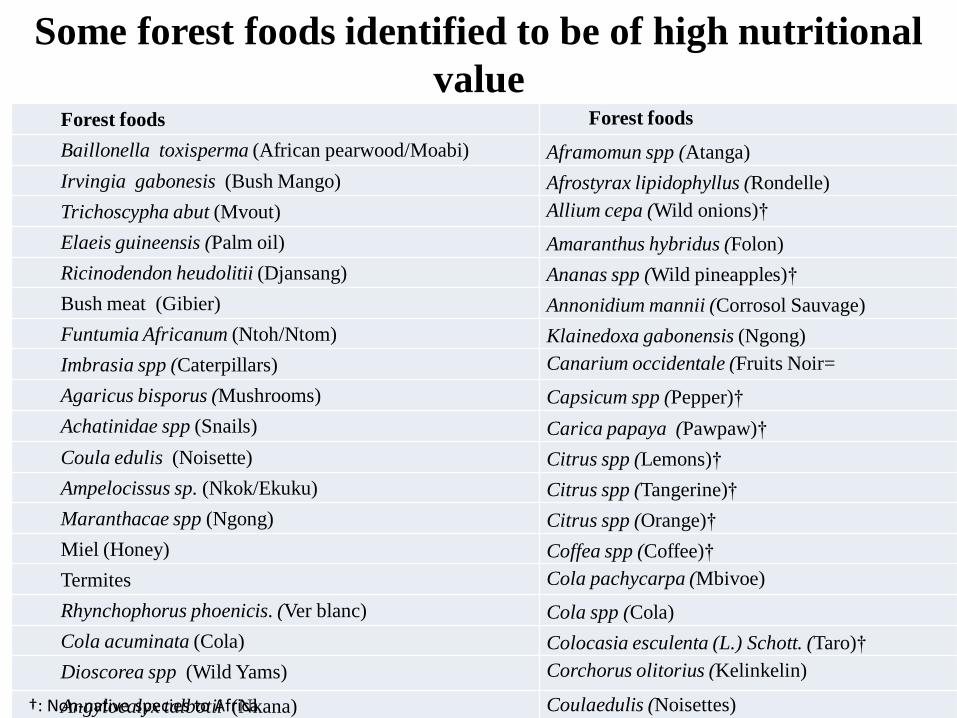
Some forest foods identified to be of high nutritional
value Forest foods Forest foods
Baillonella toxisperma (African pearwood/Moabi) Aframomun spp (Atanga)
Irvingia gabonesis (Bush Mango) Afrostyrax lipidophyllus (Rondelle)
Trichoscypha abut (Mvout) Allium cepa (Wild onions)†
Elaeis guineensis (Palm oil) Amaranthus hybridus (Folon)
Ricinodendon heudolitii (Djansang) Ananas spp (Wild pineapples)†
Bush meat (Gibier) Annonidium mannii (Corrosol Sauvage)
Funtumia Africanum (Ntoh/Ntom) Klainedoxa gabonensis (Ngong)
Imbrasia spp (Caterpillars) Canarium occidentale (Fruits Noir=
Agaricus bisporus (Mushrooms) Capsicum spp (Pepper)†
Achatinidae spp (Snails) Carica papaya (Pawpaw)†
Coula edulis (Noisette) Citrus spp (Lemons)†
Ampelocissus sp. (Nkok/Ekuku) Citrus spp (Tangerine)†
Maranthacae spp (Ngong) Citrus spp (Orange)†
Miel (Honey) Coffea spp (Coffee)†
Termites Cola pachycarpa (Mbivoe)
Rhynchophorus phoenicis. (Ver blanc) Cola spp (Cola)
Cola acuminata (Cola) Colocasia esculenta (L.) Schott. (Taro)†
Dioscorea spp (Wild Yams) Corchorus olitorius (Kelinkelin)
Angylocalyx talbotii (Nkana) Coulaedulis (Noisettes)†: Non-native species to Africa
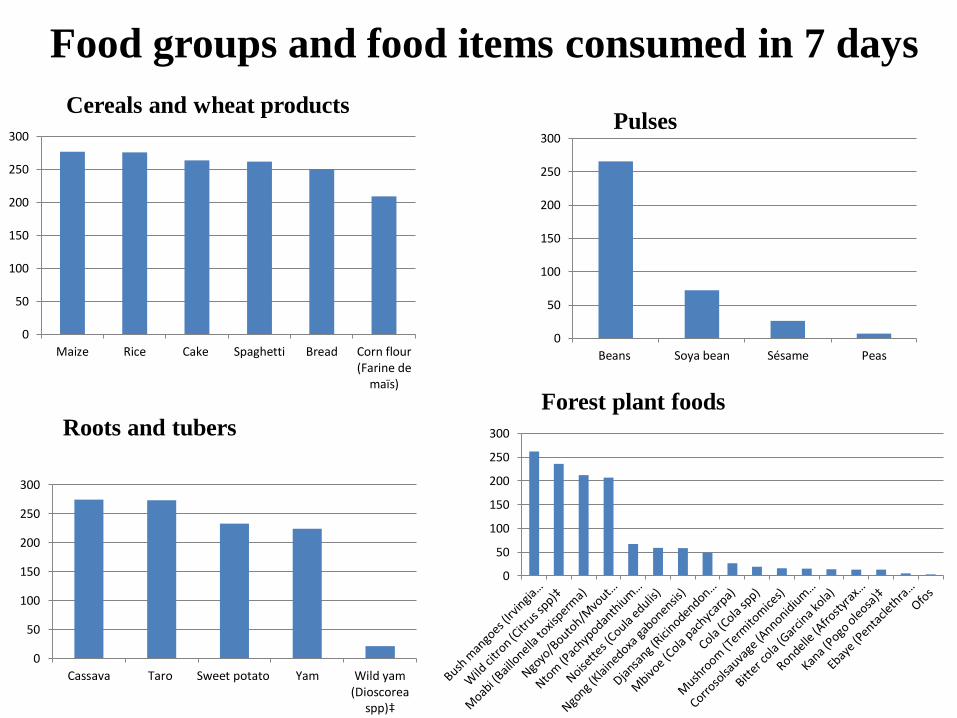
Food groups and food items consumed in 7 days
0
50
100
150
200
250
300
Maize Rice Cake Spaghetti Bread Corn flour(Farine de
maïs)
0
50
100
150
200
250
300
Beans Soya bean Sésame Peas
0
50
100
150
200
250
300
Cassava Taro Sweet potato Yam Wild yam (Dioscorea
spp)‡
Cereals and wheat productsPulses
Forest plant foodsRoots and tubers
0
50
100
150
200
250
300
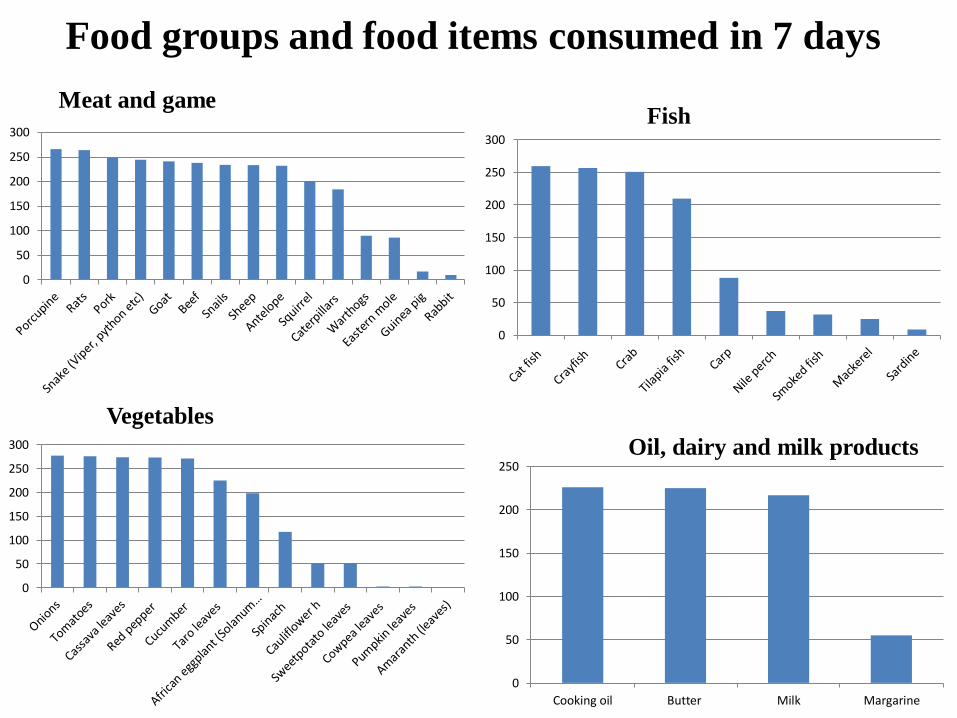
Food groups and food items consumed in 7 days
0
50
100
150
200
250
300
0
50
100
150
200
250
300
0
50
100
150
200
250
300
0
50
100
150
200
250
Cooking oil Butter Milk Margarine
Meat and gameFish
Oil, dairy and milk products
Vegetables
Dietary diversity score, forest food consumption score
and food varieties consumedDDS FFCS FVS
Number of food
groups consumed
% of total
(n=278)
Number of forest
food items
consumed
% of total
(n=272)
Number of food items
consumed
% of total
(n=278)
≤ 9 0.4 1 2.6 ≤11 0.4
10 1.1 2 9.6 12 1.1
11 4.3 3 32.0 13 1.1
12 34.2 4 19.5 14 5.0
13 60.1 5 15.8 15 5.8
6 14.7 16 10.1
7 4.4 17 14.4
8 1.5 18 19.1
19 17.6
20 12.2
21 9.0
22 2.9
23 1.4
Average 3.96 18.0
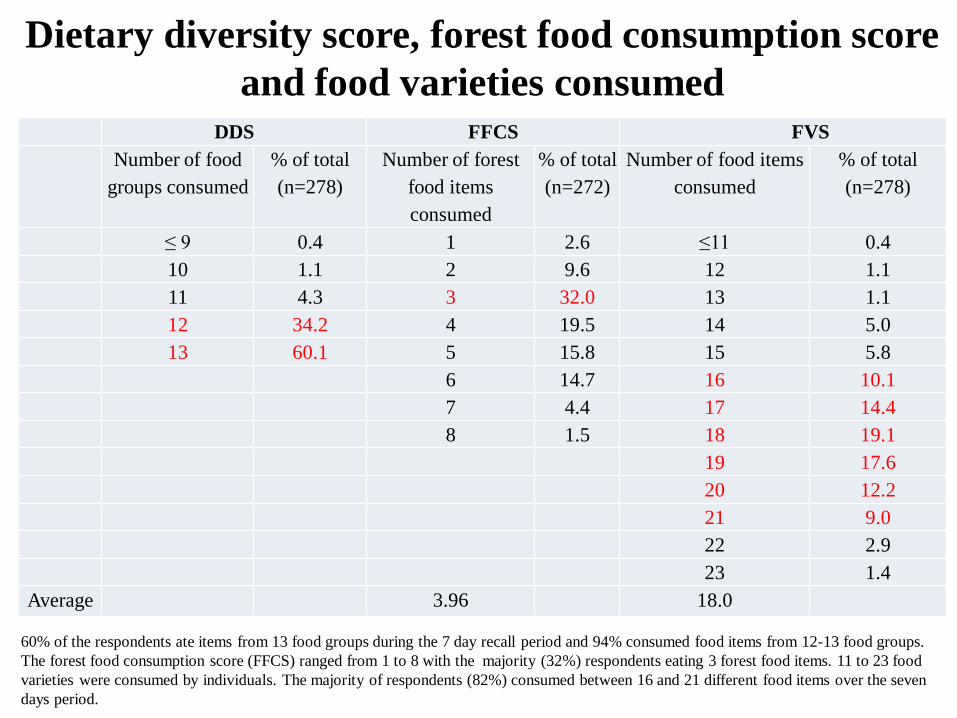
60% of the respondents ate items from 13 food groups during the 7 day recall period and 94% consumed food items from 12-13 food groups.
The forest food consumption score (FFCS) ranged from 1 to 8 with the majority (32%) respondents eating 3 forest food items. 11 to 23 food
varieties were consumed by individuals. The majority of respondents (82%) consumed between 16 and 21 different food items over the seven
days period.
Food insecurity among forest foods
consumers and non-forest foods consumers
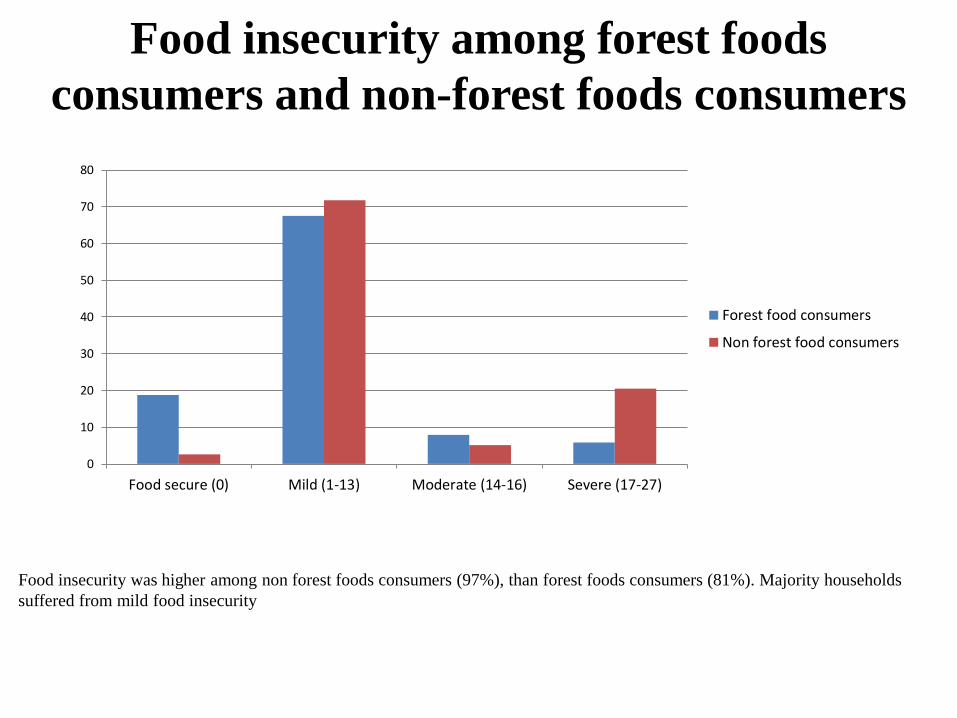
Food insecurity was higher among non forest foods consumers (97%), than forest foods consumers (81%). Majority households
suffered from mild food insecurity
0
10
20
30
40
50
60
70
80
Food secure (0) Mild (1-13) Moderate (14-16) Severe (17-27)
Forest food consumers
Non forest food consumers
Spearman’s correlation matrix of food
security indicators for forest communities
Household food security Household
dietary
diversity score
Forest food
consumption
score
Food variety
score
Household food
insecurity access scale
score
Household dietary diversity
score1 0.006* 0.560** -0.029*
Forest food consumption score 1 0.091* -0.169**
Food variety score 1 -0.005
Household food insecurity access
scale score1
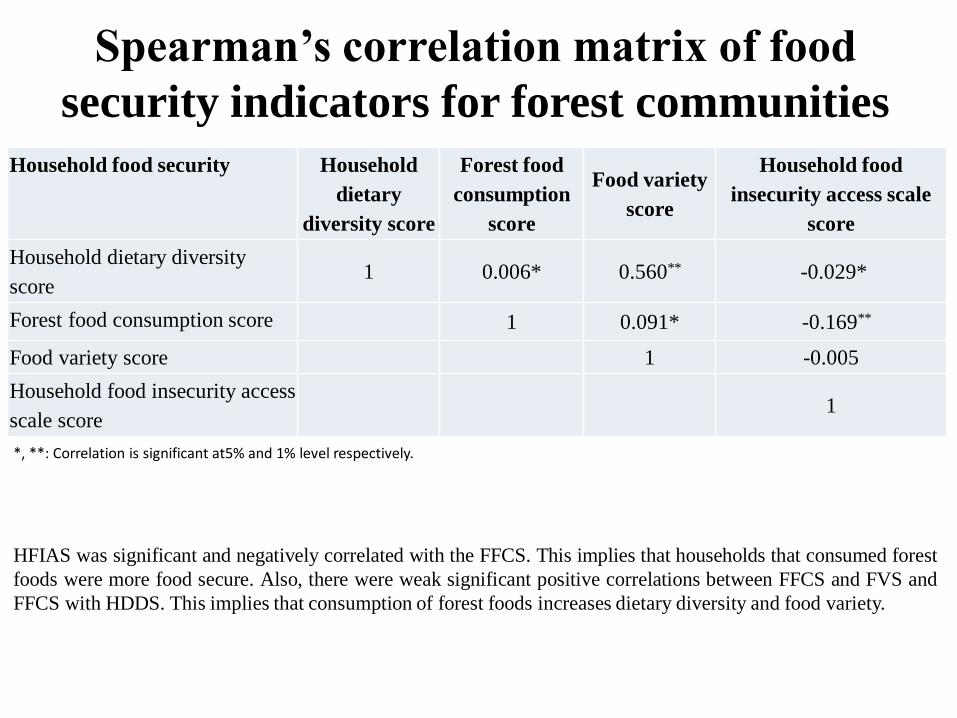
HFIAS was significant and negatively correlated with the FFCS. This implies that households that consumed forest
foods were more food secure. Also, there were weak significant positive correlations between FFCS and FVS and
FFCS with HDDS. This implies that consumption of forest foods increases dietary diversity and food variety.
*, **: Correlation is significant at5% and 1% level respectively.
Contribution of forest foods and non-forest foods to
nutrient intake of non-pregnant, non-lactating women Nutrient Forest foods consumed in two non-consecutive 24 hour recalls
Forest Foods Consumers (n=46) Non Forest Foods Consumer (n=233)
Nutrient intake SD % of women below EAR Nutrient intake SD % of women below
EAR
P value
Weight (gms) 1116.9 34.4 1311.3 b 131.3 ˂0.0001
Energy (KJ) 11339.1 20656.8 51.9 7805.3 b 3477.7 36.2 ˂0.0001
Energy (Kcal) 2710.1 4937.1 1865.5 831.2
Protein (g) 79.1 198.5 47.4 31.9 b 127.5 41.3 ˂0.0001
Fat (g) 77.7 249.8 35.5 20.9 b 20.9 40.7 ˂0.0001
Carbohydrate (g) 141.2 350.2 67.0 320.7 b 909.2 41.3 ˂0.0001
Dietary fiber (g) 35.5 234.9 72 36.2 b 126.8 49.1 0.192
Vitamin A (µg) 6155.3 4907.3 7.1 1801.7 b 944.3 10.8 0.033
Vitamin E
(Eq.)/Mg
8.4 46.9 38.2 4.4 b 15.3 48.3 0.041
Vitamin C (Mg) 81.8 255.7 21.3 228.8 b 710.3 16.5 0.013
Sodium (Mg) 448.5 161.6 0.00 130.1 b 167.5 0.00 ˂0.0001
Potassium (Mg) 54818.1 32286.2 28.0 14059.9b 2341.4 13.2 ˂0.0001
Calcium (Mg) 1466.4 9313.8 11.2 541.9 b 508.2 19.3 ˂0.0001
Magnesium (Mg) 2110.5 1631.9 11.4 965.8 b 740.8 1.1 ˂0.0001
Phosphorus (Mg) 5681.5 5234.6 44.9 1821.1 b 2352.0 41.8 ˂0.0001
Iron (Mg) 27.8 116.7 15.4 13.1 b 32.1 10.2 ˂0.0001
Zinc (Mg) 55.3 418.6 12.0 42.3 b 265.9 2.9 ˂0.0001
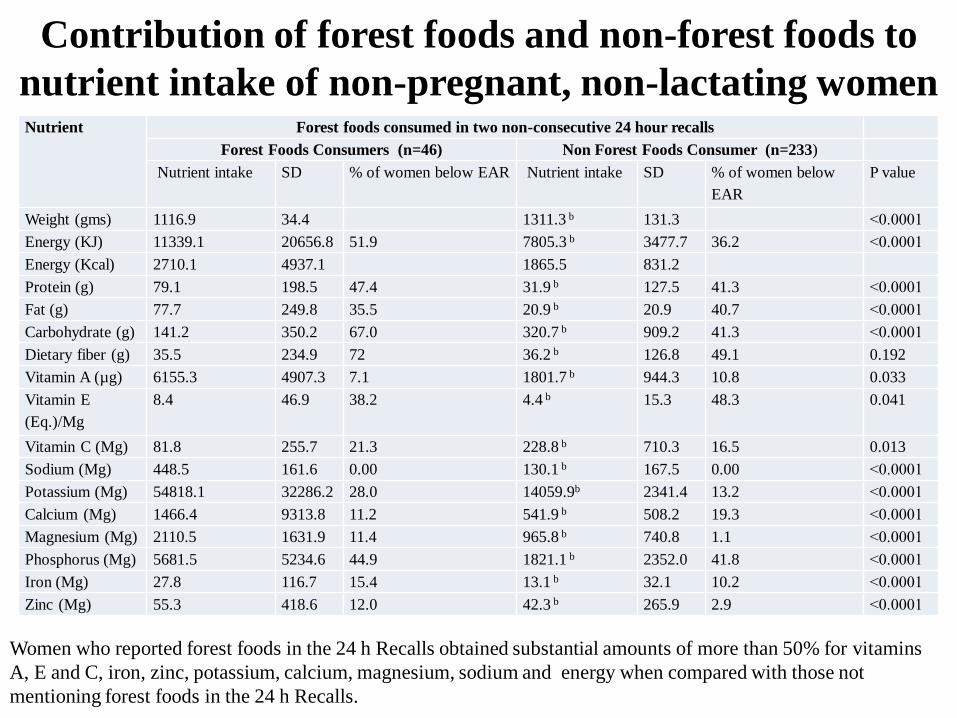
Women who reported forest foods in the 24 h Recalls obtained substantial amounts of more than 50% for vitamins
A, E and C, iron, zinc, potassium, calcium, magnesium, sodium and energy when compared with those not
mentioning forest foods in the 24 h Recalls.
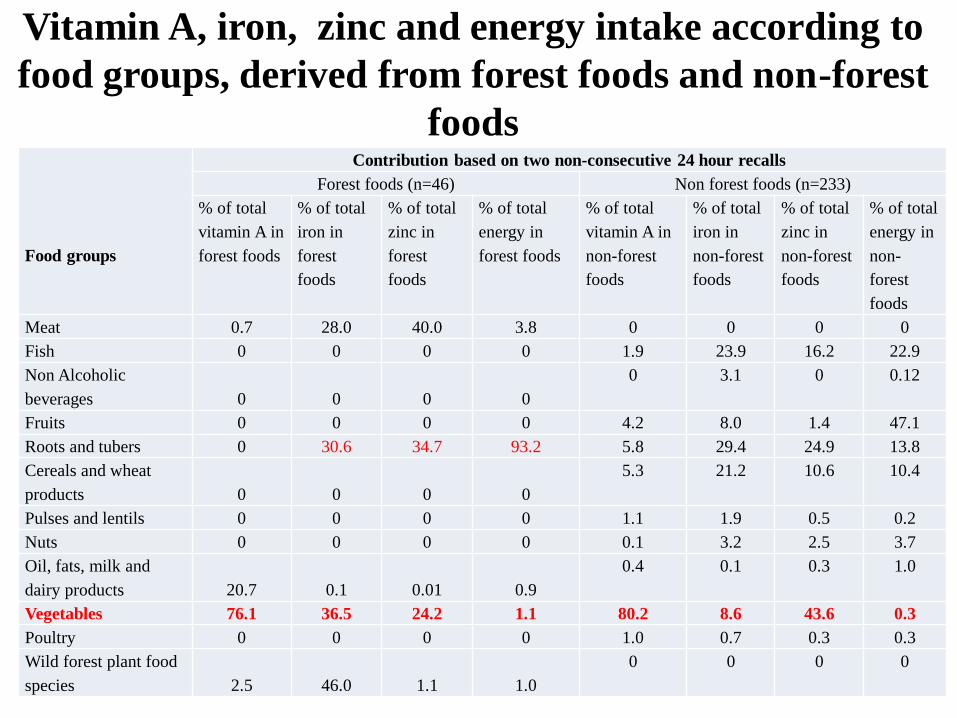
Vitamin A, iron, zinc and energy intake according to
food groups, derived from forest foods and non-forest
foods
Food groups
Contribution based on two non-consecutive 24 hour recalls
Forest foods (n=46) Non forest foods (n=233)
% of total
vitamin A in
forest foods
% of total
iron in
forest
foods
% of total
zinc in
forest
foods
% of total
energy in
forest foods
% of total
vitamin A in
non-forest
foods
% of total
iron in
non-forest
foods
% of total
zinc in
non-forest
foods
% of total
energy in
non-
forest
foods
Meat 0.7 28.0 40.0 3.8 0 0 0 0
Fish 0 0 0 0 1.9 23.9 16.2 22.9
Non Alcoholic
beverages 0 0 0 0
0 3.1 0 0.12
Fruits 0 0 0 0 4.2 8.0 1.4 47.1
Roots and tubers 0 30.6 34.7 93.2 5.8 29.4 24.9 13.8
Cereals and wheat
products 0 0 0 0
5.3 21.2 10.6 10.4
Pulses and lentils 0 0 0 0 1.1 1.9 0.5 0.2
Nuts 0 0 0 0 0.1 3.2 2.5 3.7
Oil, fats, milk and
dairy products 20.7 0.1 0.01 0.9
0.4 0.1 0.3 1.0
Vegetables 76.1 36.5 24.2 1.1 80.2 8.6 43.6 0.3
Poultry 0 0 0 0 1.0 0.7 0.3 0.3
Wild forest plant food
species 2.5 46.0 1.1 1.0
0 0 0 0
Conclusions
• As a result of the high incidence of food insecurity
(83.5%), food and nutrition insecurity in Cameroon can
not be alleviated by access to a large biodiverse number of
nutritious forest foods.
• Forest foods, if consumed in adequate quantities, have the
potential to improve dietary diversity, food security and
nutrient adequacy for forest communities in Cameroon.
• Forest foods contribute significantly to the intakes of
vitamins A, E and C and minerals of iron, zinc and
sodium.

Recommendations
• Domestication of the nutrient rich forest
foods should be explored, as a possible
strategy to ensure reliable supply of these
foods.
• There is need to develop and promote
policies that integrate forest foods into
smallholder cropping systems and home
gardens.
Acknowledgements
The Congo Basin Forest Fund (CBFF) of the
African Development Bank and the CGIAR
Research Programme on Forests, Trees and
Agroforestry for funding support.