Embed Size (px)
Citation preview
Contents lists available at ScienceDirect
Agricultural and Forest Meteorology
journal homepage: www.elsevier.com/locate/agrformet
Evapotranspiration from the understory of a tropical dry deciduous forest in Cambodia Shin'ichi Iidaa,⁎, Takanori Shimizua, Koji Tamaia, Naoki Kabeyab, Akira Shimizub, Eriko Itoc, Yasuhiro Ohnukid, Sophal Channe, Delphis F. Leviaf
a Forestry and Forest Products Research Institute, Tsukuba, Ibaraki, Japan b Kyushu Research Center, Forestry and Forest Products Research Institute, Kumamoto, Kumamoto, Japan c Hokkaido Research Center, Forestry and Forest Products Research Institute, Sapporo, Hokkaido, Japan d Tohoku Research Center, Forestry and Forest Products Research Institute, Morioka, Iwate, Japan e Institute of Forest and Wildlife Research and Development, Forestry Administration, Phnom Penh, Cambodia f Department of Geography & Spatial Sciences and Department of Plant & Soil Sciences, University of Delaware, Newark, DE, United States
A R T I C L E I N F O
Keywords: Tropical dry deciduous forest Understory vegetation Evapotranspiration Leaf area index Sap flux density
A B S T R A C T
The water balance of tropical dry deciduous forests is less well understood than some other forest ecosystems. To help close this knowledge gap, we separately measured the evapotranspiration from the whole ecosystem (ETW), transpiration (TR) and interception loss (IL) from overstory trees, and evapotranspiration from the understory vegetation (ETU) in a tropical dry deciduous forest in Cambodia. It was found that ETW was equivalent to 73.7% of rainfall (P) at the annual scale. In the dry season, ETW corresponded to 120.1% of P, which indicates the utilization of soil water replenished during the wet season. The sum of transpiration estimated by the thermal dissipation (TD) method with the original coefficient (TRG), IL, and ETU was smaller than ETW, except for the middle of the dry season, due to an underestimation of TRG. Although recently reported calibration coefficients can reasonably correct TRG, future calibrations of the TD method are highly recommended for the precise evaluation of single-tree-scale transpiration in tropical dry forests. The annual contribution of the understory vegetation to ETW (ETU/ETW) was 34.6%, leading to the conclusion that the understory vegetation cannot be ignored when trying to gain a comprehensive understanding of the hydrologic cycle in tropical dry forests. The seasonal variations in ETU/ETW were mainly controlled by the leaf area index (LAI) of overstory trees, resulting from the overall stability of ETW and decreasing trend of ETU with increasing LAI in the wet season, with the opposite holding true in the dry season, i.e., decreasing ETW with the decline of LAI and less variations of ETU. Thus, LAI influenced both the seasonality and the annual contribution in ETU/ETW, exerting a notable influence on hydrological cycling in this forest.
1. Introduction
Tropical dry forests occupy more than 40% of the world's tropical forest area, and cover 19% of the global forested area (Brown and Lugo, 1982; Farrick and Branfireun, 2013). The annual evapotranspiration from watersheds covered by tropical dry forests are equivalent to more than 70% of annual rainfall (Farrick and Branfireun, 2013). This biome is one of the active drivers of water vapor circulation between the at-mosphere and land surface in the tropics. Despite the importance of tropical dry forests, Miles et al. (2006) reported that tropical dry forests are one of the most threatened forest ecosystems in the world. The ef-fects of deforestation on hydrological phenomena have been reported for tropical dry forests in the Indochina Peninsula. For example, the
expansion of deforested area has reduced the local circulation of water vapor, resulting in the decrease of rainfall amount in September, which corresponds to the middle or late rainy season in Thailand (Kanae et al., 2001). Although understanding of the evapotranspiration process is key to revealing the hydrologic cycle in tropical dry forests, the number of evapotranspiration measurements in this forest biome are exceedingly limited (Reyes-Garcia et al., 2012).
Cambodia is located in the southern part of the Indochina Peninsula, and has a higher ratio of forested area (54%) compared to neighboring countries, such as Thailand (32%) or Vietnam (48%) (FAO, 2015). Natural forests, which have already been deforested in neighboring countries, are still found in Cambodia (Tani et al., 2007). These forests appear in areas with high seasonality of rainfall including a few of
https://doi.org/10.1016/j.agrformet.2020.108170 Received 12 June 2020; Received in revised form 27 August 2020; Accepted 2 September 2020
⁎ Corresponding author. E-mail address: [email protected] (S. Iida).
Agricultural and Forest Meteorology 295 (2020) 108170
0168-1923/ © 2020 Elsevier B.V. All rights reserved.
T
months with no rainfall (e.g., Miles et al., 2006), which results in the abundance of deciduous forests (Farrick and Branfireun, 2013), but with coexistence of evergreen forests in areas with deeper soils (Tanaka et al., 2008; Ohnuki et al., 2008). The FAO (2015) reported that 44% and 34% of total forested area in Cambodia are covered with deciduous and evergreen forests, respectively. Tanaka et al. (2008) reviewed the studies that examined evapotranspiration around the Indochina Pe-ninsula, but found no measurements carried out in natural dry decid-uous forests (as of the date of its publication).
Iida et al. (2016) clarified the seasonal changes in transpiration activity of a natural dry deciduous forests in Cambodia based on sap flux density measurements using the thermal dissipation (TD) method (Granier, 1985). The deciduous trees shed their leaves in the middle of the dry season, and soon after generate a flush of new leaves, thereby resuming transpiration under severely dry soil conditions prior to the start of the first monsoon rain. This early leaf flush seems counter-intuitive due to the limited amount of soil water available for uptake by the root system at this time; thus, it is referred to as the "paradox" of leaf phenology in tropical dry forests (e.g., Elliott et al., 2006). Early leaf flushing under drier conditions could, however, maximize the photo-synthetic production with a longer foliated period (e.g., Rivera et al., 2002; Elliott et al., 2006) and minimize the effects of herbivorous in-sects on young leaves (e.g., Aide, 1992; Rivera et al., 2002). The unique timing of this leaf flush also likely raises the risk of maintaining this ecosystem under the changing rainfall regime corresponding to climate change, which is projected to decrease the amount of rainfall (Endo et al., 2009; Farrick and Branfireun, 2013). Given the paucity of mea-surements of evapotranspiration in tropical dry deciduous forests, it is difficult to assess the vulnerability of the dry deciduous forests to cli-mate change-induced stress.
Tropical dry deciduous forests are typified as having a sparse overstory with an open canopy and a dense understory (Fig. 1). Thus, the evapotranspiration from the whole ecosystem (ETW) can be the sum of the components, that is, transpiration from overstory trees (TR), interception loss from overstory trees (IL), and evapotranspiration from the understory vegetation (ETU) (refer to Table 1 for the list of evapo-transpiration components). Although the species are different between boreal and tropical dry forests, it is well known that a dense understory is generally found under the sparse overstory canopy in boreal forests (e.g., Blanken et al., 2001; Iida et al., 2009). The contribution of the understory vegetation to the evapotranspiration (ETU/ETW) was eval-uated by the eddy covariance method as 30 to 50% in the boreal forests, whose leaf area index (LAI) of overstory trees is < 2 m2 m−2 (Kelliher et al., 1997, 1998; Moore et al., 2000; Iida et al., 2009). The fact that LAI is ∼1 m2 m−2 in the dry deciduous forest investigated by Iida et al.
(2016) (Fig. 1) strongly implies that the understory vegetation may represent a considerable proportion to the total evapotranspiration. Yet, no quantification of the contribution of the understory vegetation to the whole-ecosystem evapotranspiration has been conducted. Thus, sepa-rate evaluations of the components of ETW (i.e., TR, IL, and ETU) are necessary to develop a more comprehensive understanding of the water balance in tropical dry deciduous forests. The understory contribution of 23.6% was recently reported for the tropical wet forest (Jiménez- Rodríguez et al., 2020).
Although the sap flux density measurements with the TD method have been widely used for the evaluation of transpiration in forests (e.g., Wilson et al., 2001), recent papers pointed out its underestimation of sap flux density (e.g., Steppe et al., 2010; Peters et al., 2018). However, the field evidence of the uncertainty in transpiration esti-mations with the TD method is limited due to the requirements of se-parate evaluations of ETW components. To judge the validity of TR estimations by the TD method in forests (TRG), we need to investigate the balance among ETW, TRG, IL, and ETU (e.g., Iida et al., 2019, 2020). Wilson et al. (2001) reported the underestimation of TRG based on the comparison of TRG and the individual components of evapotranspira-tion, while the consistencies among the components were found in Iida et al. (2006b), Oishi et al. (2008), Shimizu et al. (2015) and Tie et al. (2018), thereby indicating a reasonable estimation of TRG. These pre-vious measurements were conducted in temperate forests (Iida et al., 2006b; Oishi et al., 2008; Shimizu et al., 2015) and a subhumid forest (Tie et al., 2018). For tropical forests, there are no known studies evaluating the validity of TRG based on the consistency among ETW
components, and, thus, careful investigation of the possibility of the underestimation of TRG is necessary for precise understanding the forest water balance.
Here, we evaluated ETW, TRG, IL, and ETU separately in a tropical dry deciduous forest in Cambodia for about a year (from June 2010 to June 2011). In this forest, the transpiration and phenology of overstory trees were described in Iida et al. (2016), but there was no investigation of evapotranspiration from the dense understory vegetation. To further knowledge of evapotranspiration of tropical dry forests, this study builds on prior work of Iida et al. (2016) and examines the contribution of the understory vegetation to ETW for tropical dry forests. Our study objectives are to: (i) quantify the annual amount of ETW, TRG, IL, and ETU to reveal the contribution of the understory to ETW (ETU/ETW); (ii) clarify the seasonal trend in ETU/ETW and its governing factors; (iii) evaluate the uncertainty of TRG quantitatively based on the balance of evapotranspiration components; and (iv) investigate the factors af-fecting the validity of TRG by the TD method. Data from this study will provide deeper insights into the evapotranspirational losses from tro-pical dry deciduous forests that impart a better understanding of the hydrological cycle of these forests to facilitate their conservation under a changing climate.
2. Methods
2.1. Site description
All measurements were carried out in a tropical dry deciduous forest in Kratie Province, Cambodia (12°55′N, 106°11′E). Details for this stand have been described in Iida et al. (2016). The mean air temperature was 26.9 °C from February 2009 to January 2010, and mean annual rainfall (P) recorded in 2004, 2007 and 2008 ranged from 1500 to 1700 mm (Iida et al., 2012; 2016). Iida et al. (2016) analyzed the onset and cessation of the wet season based on the method proposed by Wang and LinHo (2002). They divided a year into 73 pentads (i.e., 5-day period), and defined the relative pentad mean rainfall as the difference between pentad rainfall and the January mean rainfall. The wet season started on 22 April 2010, and ended on 22 October 2010. The soils underlying the forest are Plinthosols, and the depth of the soil layer ranges from 100 to 300 cm (Ohnuki et al., 2008).
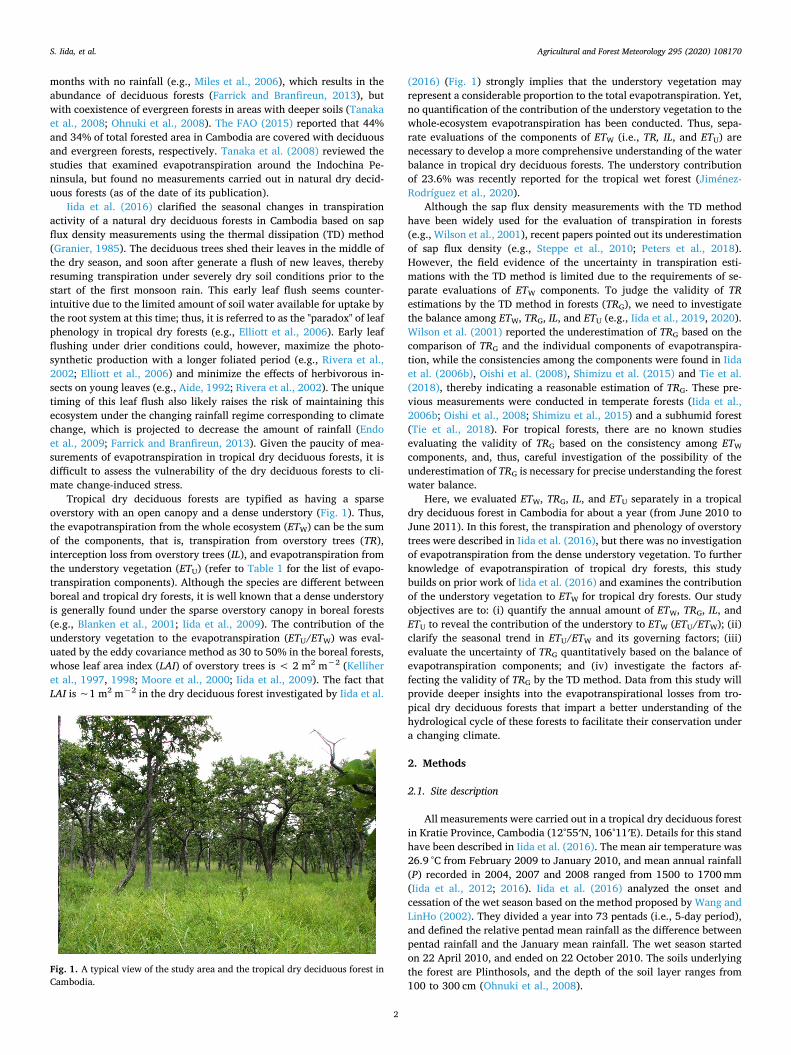
Fig. 1. A typical view of the study area and the tropical dry deciduous forest in Cambodia.
S. Iida, et al. Agricultural and Forest Meteorology 295 (2020) 108170
2

The forest consists of deciduous trees, comprised of gurjuntree (Dipterocarpus tuberculatus), Indian laurel (Terminalia alata), Siamese Sal (Shorea obtusa) and Burma ironwood (Xylia xylocarpa) (Table 2), and dense understory vegetation of dwarf bamboo grass (Vietnamosasa pu-silla) (Fig. 1). The leaf area index (LAI, m2 m−2) of the overstory canopy was typically around 1 m2 m−2 during fully mature leaf conditions as estimated by a LAI-2000 Plant Canopy Analyzer (Li-Cor, Lincolin, NE, USA) (Iida et al., 2016). The mean tree height (TH) and diameter at breast height (DBH) of overstory trees was 11.6 m and 25.7 cm, re-spectively (Table 2). Among the twelve trees shown in Table 2, all shed their leaves in the middle of the dry season, and soon after ten of these
trees, excluding the two glabrous Indian laurel trees (Iida et al., 2016), had an early flush of new leaves before the onset of the first monsoon rain. The stand density was 438 trees ha−1 in a 30 m × 80 m area surrounding the observation tower (Iida et al., 2016), in which the mean TH and DBH of mature trees was 11.6 m and 22.8 cm, respec-tively, coinciding nicely with the subset of trees utilized for transpira-tion measurements. Understory trees inhabiting canopy gaps within this area, accounting for a mere 2% of the basal area, had a mean TH 4.2 m and a mean DBH 7.4 cm. Nonetheless, given the striking similarity in TH and DBH between the twelve trees measured for transpiration and the mature trees in the forest surrounding the tower, the flux footprint would be comparable.
The understory vegetation, V. pusilla, is a perennial grass, which experiences the dieback of its aboveground portion before the middle of the dry season. The leaf flush of the understory vegetation occurs after the early leaf expansion of the overstory trees. The maximum above-ground biomass at the start of the dry season was observed for the dense understory (598.7 g m−2). The leaf area index of the understory, measured using a LAI-2000 Plant Canopy Analyzer, was 2.9 m2 m−2 at the beginning of dry season.
2.2. Micrometeorological and soil moisture measurements
A 30-m-high tower, erected on a north-facing gentle slope (gradient ranging from 2° to 3°) and surrounded by an 8 km × 8 km area of de-ciduous forest, was utilized to measure net all-wave radiation (Rn-W), photosynthetic photon flux density (PPFDW), and dry and wet bulb temperatures above the canopy of overstory trees (Table 3; Iida et al., 2016). The soil heat flux (G) was measured at two locations within the stand, and their mean value was used for the analysis (Table 3). The gross rainfall (P) was measured by a 0.5-mm tipping-bucket rain gauge (type OW-34-BP, Ota Keiki Seisakusho, Tokyo, Japan) mounted on the roof of observation house near the tower. We sampled these variables every 10 s and 10-min averages (or 10-min totals in the case of P) were recorded with a datalogger coupled with a multiplexer (types CR1000 and AM16/32B, Campbell Scientific, Logan, UT, USA).
Table 1 List of parameters related to the compenents of evapotranspiration.
Parameters Description
ETW Evapotranspiration from whole ecosystem ETU Evapotranspiration from understory vegetation IL Interception loss from overstory trees TF Throughfall measured above understory vegetation SF Stemflow from overstory trees TR Transpiration from overstory trees TRRES TR estimated as the residual of evapotranspiration components, ETW – (IL + ETU) TRF TR measured with the thermal dissipation method with the parameter proposed by Fuchs et al. (2017) TRG TR measured with the thermal dissipation method with the original parameter (Granier, 1985) TRO TR measured with the thermal dissipation method with the parameter proposed by Ouyang et al. (2018) U Unknown portion of evapotranspirational balance, ETW – (TRG + IL + ETU)
Table 2 Details of test trees from which sap flux density and stemflow measurements were taken.
Tree ID Species DBH (cm) TH (m) SW (cm) SA (cm2)
1 Gurjuntree (Dipterocarpus tuberculatus)
25.8 13.8 1.9 107
2 gurjuntree 27.4 13.9 1.8 117 3 gurjuntree 28.3 13.2 2.5 179 4 Siamese Sal (Shorea obtusa) 19.3 9.5 1.9 86 5 Siamese Sal 23.1 10.1 1.5 88 6 Siamese Sal 24.8 11.6 1.5 89 7 Siamese Sal 25.2 8.5 1.8 116 8 Siamese Sal 36.4 14.2 1.2 113 9 Indian laurela (Terminalia
alata) 25.4 10.9 1.5 91
10 Indian laurelb 23.3 11.0 1.4 81 11 Indian laurelb 25.9 13.8 1.0 59 12 Burma ironwood (Xylia
xylocarpa) 24.0 8.8 1.8 121
average 25.7 11.6 – – total – – – 1246
DBH: diameter at breast height, TH: tree height, SW: sapwood width, SA: sap-wood area.
a hairy type. b glabrous type.
Table 3 List of instruments employed in meteorological and soil moisture measurements.
Observed items Height (m) Sensor type
Sensible heat flux above the canopy (HW) 30.3 CSAT3, Campbell Scientific, USA Latent heat flux above the canopy (λETW) 30.3 HMP-45A, Vaisara, Finland Downward shortwave radiation above the canopy 29.9 CMP3, Kipp&Zonen, The Netherlands Downward photosynthetic photon flux density above the canopy (PPFDW) 29.9 ML-020, Eko Seiki, Japan Dry bulb and wet bulb temperatures 18.0 MH-020T, Eko Seiki, Japan Net all-wave radiation above the canopy (Rn-W) 15.5 Q-7, REBS, USA Sensible heat flux under the canopy (HU) 5.5 SAT-540, Sonic, Japan Latent heat flux under the canopy (λETU) 5.5 HMP-45A, Vaisala, Finland Downward photosynthetic photon flux density above the forest floor (PPFDU) 1.5 PAR02, Prede, Japan Soil heat flux (G) −0.05 MF-180M, Eko Seiki, Japan Volumetric soil water content (θ) −0.1, −0.2, −0.4, −0.6 CS-616, Campbell Scientific, USA
S. Iida, et al. Agricultural and Forest Meteorology 295 (2020) 108170
3
The PPFD was measured above the forest floor at four locations by four sensors within the forest, and the mean value was computed (PPFDU). The mean of the measurements among the four locations in this study was similar to that of 42 locations above the forest floor measured by Iida et al. (2016). Daily LAI was estimated based on Beer's law with its extinction coefficient (k = 1.18) calculated from the twelve sets of PPFDU/PPFDW measurements and measured LAI (Iida et al., 2016). The all-wave net radiation above the forest floor (Rn-U) was obtained by the following equation (e.g., Granier and Loustau, 1994; Tateishi et al., 2010; Iida et al., 2016):
=R kLAI Rexp( )· .n-U n-W (1)
We calculated Penman's potential evaporation (PET) for whole- ecosystem using the following equation:
=+
+PET R G G C VPD1( )
[ ( ) ],n-W a P (2)
where λ is the latent heat of vaporization, Δ is the rate of change in saturation water vapor pressure with temperature, γ is the psychro-metric constant, ρ is the density of moist air, and CP is the specific heat of air at constant pressure, and VPD is the vapor pressure deficit. The aerodynamic conductance (Ga) was derived from the following equa-tion (e.g., Brutsaert, 1982):
=G uu* ,a
2
(3)
where u⁎ is the friction velocity and u is the wind velocity, which were calculated from three-dimensional wind speeds measured by a sonic anemo-thermometer (SAT) above the overstory canopy (Table 3).
Volumetric soil water content (θ) at depths of 0.1, 0.2, 0.4, and 0.6 m were measured every 10-min (type CS-616, Campbell Scientific) and the 30-min averages were recorded using a datalogger (type CR10X, Campbell Scientific). Following our previous analysis, we ob-tained the weighted-mean value of θ from the depth of 0 to 0.6 m (θ0-
60). The relative extractable soil water content (REW) was obtained as (Iida et al., 2016):
=REW ,0-60 0-60 min
0-60 max 0-60 min (4)
where θ0-60max and θ0-60 min are the maximum and the minimum values of θ0-60 during the analysis period.
2.3. Calculations and quality controls of evapotranspiration from the whole ecosystem and understory vegetation
The evapotranspiration from the whole ecosystem (ETW) and the understory vegetation (ETU) were measured separately as the 30-min latent heat fluxes by the band-pass eddy covariance method with SAT and a capacitance hygrometer installed at each height, 30.3 m and 5.5 m, respectively (Table 3). The band-pass eddy covariance method allows an estimate of the latent heat flux (λET) using a slow response sensor within a force-ventilated radiation shield (here, capacitance hygrometer HMP-45A, Vaisala, Finland), on the assumption of spectral similarity between sonic temperature (Ts) and water vapor (q) (e.g., Hicks and McMillen, 1988; Högström et al., 1989). In the original band- pass eddy covariance method, ΣSwq(f) / ΣSwTs (f) in the high frequency region was assumed to be proportional to that in the low frequency region where no signal loss occurred, where S(f) is co-spectra of vertical wind speed w and scalars, with f representing a certain frequency. Building on Watanabe et al. (2000), our method was improved by stabilizing the value of calculated water vapor flux. We assumed that co-spectral similarity holds in the frequency (f) 0.0025 Hz - 0.005 Hz. Cross spectral Cwq(f) in f = 0.005 – 0.1 Hz was corrected with the fol-lowing first order transfer function FC(f):
=FC f f j( ) 1/(1 2 ), (5)
where j is a unit imaginary number. The parameter τ was experimen-tally determined as τ = 2.8 from a monthly comparison of Cwq with the capacitance hygrometer and Cwq with the infrared gas analyzer (IRGA) (LI-7500, Li-COR, USA) in 0.005Hz-0.1 Hz at a dry evergreen forest in Cambodia. Note that the band-pass method using Eq. (5) with τ = 2.8 reproduced λET measured with SAT and IRGA at the evergreen site quite well. After the correction, we calculated the ratio of ΣSwq(f) / ΣSwTs (f) for the range of 0.025Hz-0.1 Hz and applied the value for f > 0.01 Hz range as the original band-pass eddy covariance method, to estimate both λETW and λETU.
The quality controls on the latent (λET) and sensible heat (H) fluxes were applied following the similar criteria used in Iida et al. (2009). Briefly, the monthly quadratic regression equations were derived be-tween net radiation and both H and λET, and the differences between observed and predicted fluxes were calculated. Then, latent and sen-sible heat fluxes were removed from the dataset when the differences exceeded two standard deviations. The gaps in the dataset, representing 18.5% and 18.6% for λETW and HW, and 16.7% and 17.2% for λETU and HU, respectively, were filled by the Multiple Imputation method using "NORM" software (Hui et al., 2004; Iida et al., 2009: Shimizu et al., 2015). Net radiation, downward shortwave radiation, wind speed, air temperature and vapor pressure deficit were used to impute gaps of latent and sensible heat fluxes (e.g., Iida et al., 2009). The relationship between the available energy and the sum of latent and sensible heat fluxes was fitted without an intercept for the whole ecosystem (HW + λETW = 0.743 ⋅ (Rn-W − G), R2 = 0.87) and the understory ve-getation (HU + λETU = 0.990 ⋅ (Rn-U − G), R2 = 0.61). Considering the energy closure for the whole ecosystem and the understory vegetation, the corrections were carried out for daily accumulated fluxes assuming the same Bowen ratios (= H / λET) for the fluxes after the applications on a daily scale (e.g., Kosugi et al., 2007; Shimizu et al., 2015). The latent and sensible heat fluxes during rainfall were excluded from the computation of any averaged and accumulated daily values.
2.4. Estimation of transpiration from overstory trees by sap flux density measurements
The plot of sap flux density measurements was set-up near the ob-servation tower, utilizing all twelve deciduous trees within the desig-nated plot (Table 2; Iida et al., 2016). For all trees, sap flux densities (FD) were measured by custom-made sensors adhering to the thermal dissipation (TD) method (Granier, 1985; Kumagai et al., 2005; Iida et al., 2016). A pair of probes, which spanned 15 cm vertically, was inserted into each test tree, with the upper probes constantly generating the heat (0.2 W) adjusted by the regulator (type GN-P, Environmental Measurement Japan, Fukuoka, Japan). The temperature difference be-tween probes (ΔT) was measured every 10 s and 10-min averages were recorded by dataloggers coupled with multiplexers (type CR1000 and AM16/32B, Campbell Scientific). The sap flux density (FD, cm3 cm−2
h −1) detected by a sensor was calculated as:
=F T TT
· 0D (6)
where ΔT0 is the ΔT when FD = 0, and we assumed the daily maximum value of ΔT is the same as ΔT0 (e.g., Iida et al., 2016). Granier (1985) reported the original set of coefficients, α = 42.84 and β = 1.231. In the case, where the sapwood width (SW) was smaller than the probe length (i.e., < 2.0 cm), the correction proposed by Clearwater et al. (1999) was applied (Table 2).
The stand transpiration of overstory trees (TRG) was calculated as:
=TR J AA
,G SS-stand
G (7)
where JS is the mean value of FD among the 12 trees, AS-stand is the total sapwood area of the twelve experimental trees (1246 cm2, Table 2), and AG is the plot area (274 m2). Note that the TRG is estimated from the FD
S. Iida, et al. Agricultural and Forest Meteorology 295 (2020) 108170
4

measurements with the original coefficients of α and β (Granier et al., 1985), distinguishing it from TRF and TRO, which were calculated by using calibration coefficients of α = 78.12 and β = 1.622 (Fuchs et al., 2017) and α = 91.08 and β = 1.2259 (Ouyang et al., 2018), respec-tively.
Iida et al. (2016) found that the daily mean FD of each tree showed a very high positive correlation with the daily amount of PET during the wet season. Thus, to fill the measurement failures of FD in the wet season, which constituted 212 data points among the twelve trees with
a gap ratio of 8.3%, we employed a linear regression between FD and PET. In the dry season, gaps of FD were found for only a single tree (a Siamese Sal tree with 174 missing data points over the whole dry season), and were filled by the linear regression derived from the comparison with measurements of other Siamese Sal trees.
2.5. Measurements of rainfall interception process
Within the same plot as sap flux density measurements, we mea-sured throughfall (TF) and stemflow (SF) and estimated the interception loss (IL) based on the water balance of the overstory canopy as IL = P − (TF + SF) (e.g., Carlyle-Moses et al., 2018; Iida et al., 2018). We collected throughfall above the understory by using circular throughfall collectors with an area of 1 m2, and quantified the water flow using a 200-mL tipping bucket flow meter, where one tip is equivalent to 0.2 mm resolution (type UIZ-TB200, Uizin, Tokyo, Japan). A total of three sets of collectors (3 m2 of capturing area) were posi-tioned within the plot, and their average was used as TF.
Stemflow was collected from each of the twelve trees using a ur-ethane mat fixed around the tree boles. Stemflow intensity was mea-sured with 15.7-mL tipping-bucket flow meters (type OW-34-BP). The stand-scale stemflow (SF) was calculated by dividing the sum of stem-flow from all twelve trees by the plot area (AG).
All tipping pulses generated by throughfall and stemflow were re-corded every 150 s by a datalogger with multiplexers (type CR1000 and SDM-SW8a, Campbell Scientific). To correct the systematic under-estimation of tipping-bucket rain gauges and flow meters, we applied static and dynamic calibrations to all measurements of P, TF, and SF (Iida et al., 2012, 2020). During the analysis period, some measure-ments of TF and SF failed due to the inlets of equipment being plugged with fallen leaves and branches. Altogether, data were unavailable for 347.0 mm of rain, which accounted for 24.0% of the total P over the whole study. To fill these IL data gaps, we applied regression equations between P and interception ratio (IL/P) based on the available data.
2.6. Definition of evapotranspiration and its components
The measurement of evapotranspiration from the whole ecosystem (ETW) and its components is expressed in equation form as:
= + +ET TR IL ET .W U (8)
The evapotranspiration from the understory vegetation (ETU) is defined as the sum of transpiration and interception loss from the un-derstory vegetation and evaporation from the soil surface.
The transpiration from overstory trees can be obtained alternatively as:
= +TR ET IL ET( ).RES W U (9)
If an underestimation of TRG was found at this site (e.g., Steppe et al., 2010; Peters et al., 2018), the unknown portion (U) of the eva-potranspiration balance would be calculated as:
= + +U ET TR IL ET( ).W G U (10)
The whole-ecosystem evapotranspiration and its components were summed for three measurement periods within each month: the early measurement period from the 1st to 10th, the middle measurement period from the 11th to 20th, and the late measurement period from the 21st to the end of month. The period of analysis was from June 2010 to June 2011, although there were no ET measurements in September 2010 due to an electrical issue with the capacitance hygrometer. In total, data were available for 354 days.
Fig. 2. Time series of accumulated or averaged values for each measurement period. A) gross rainfall (P) and vapor pressure deficit (VPD), B) net radiation above the overstory canopy (Rn-W) and forest floor (Rn-U), C) relative extractable soil water content from the depth of 0 to 60 cm (REW0-60), D) leaf area index (LAI) of the overstory canopy, E) - evapotranspiration from the whole ecosystem (ETW) and the understory vege-tation (ETU), F) the ratio of ETU and ETW (ETU / ETW) and G) transpiration estimated from sap flux density measurements (TRG) and obtained as the re-sidual of ETW and its components (TRRES), and interception loss (IL). The dry season is denoted by the area shaded in gray.
S. Iida, et al. Agricultural and Forest Meteorology 295 (2020) 108170
5
3. Results
3.1. Seasonal changes in micrometeorological factors and evapotranspiration
The total amount of P was 1443.9 mm with 1090.8 mm and 353.1 mm, which were equivalent to 75.5 and 24.5% of total P, re-corded in the wet and dry seasons, respectively (Fig. 2A, Table 4). The VPD gradually increased after the cessation of the wet season, and was at its maximum in late February (Fig. 2A). REW0-60 was close to its minimum in late December, but LAI kept a relatively high value (Fig. 2C
and D). Then, LAI decreased rapidly in January with a minimum value observed in early February (Fig. 2D), and soon thereafter increased before the first monsoon rain despite severe soil water conditions (Fig. 2C).
The time series of the wet season ETW was similar with Rn-W in the wet season (Fig. 2B and E). While in the dry season, temporal variations in ETW corresponded with those of LAI (Fig. 2D and E). ETU was clearly smaller than ETW (Fig. 2E), and ETU/ETW was in the range from 0.25 to 0.40 during the period when ETW was more than 3 mm day−1 (Fig. 2F). In the dry season, especially when LAI changed dramatically, ETU/ETW
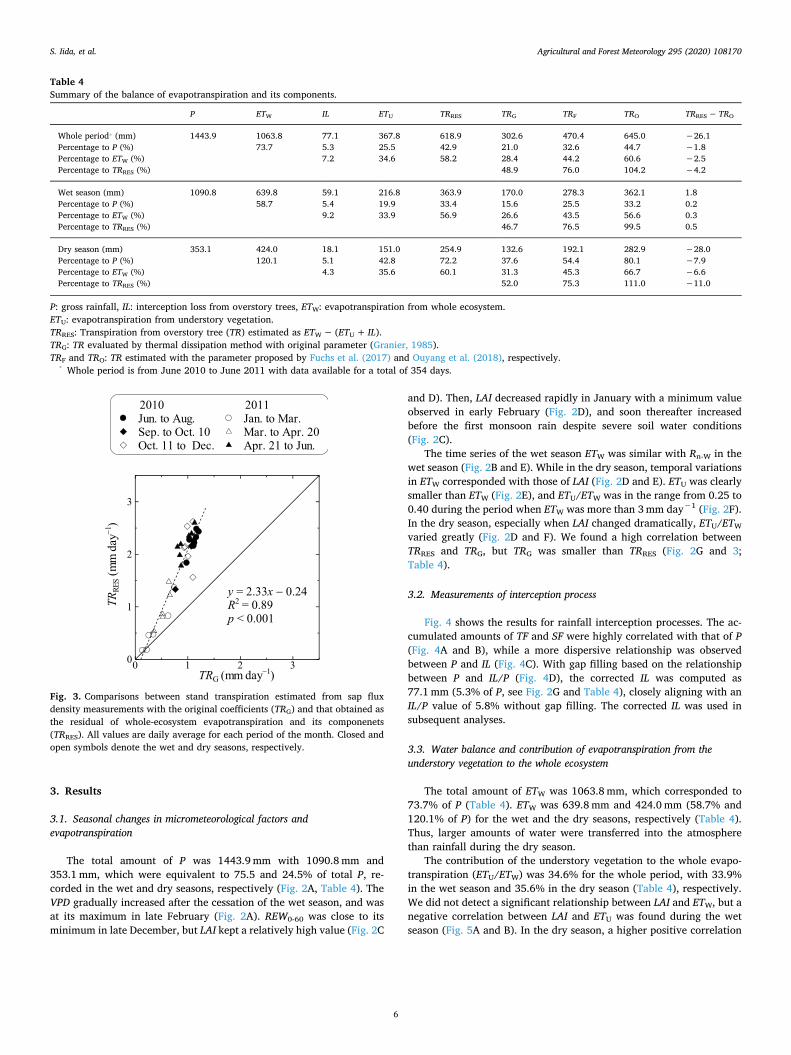
varied greatly (Fig. 2D and F). We found a high correlation between TRRES and TRG, but TRG was smaller than TRRES (Fig. 2G and 3; Table 4).
3.2. Measurements of interception process
Fig. 4 shows the results for rainfall interception processes. The ac-cumulated amounts of TF and SF were highly correlated with that of P (Fig. 4A and B), while a more dispersive relationship was observed between P and IL (Fig. 4C). With gap filling based on the relationship between P and IL/P (Fig. 4D), the corrected IL was computed as 77.1 mm (5.3% of P, see Fig. 2G and Table 4), closely aligning with an IL/P value of 5.8% without gap filling. The corrected IL was used in subsequent analyses.
3.3. Water balance and contribution of evapotranspiration from the understory vegetation to the whole ecosystem
The total amount of ETW was 1063.8 mm, which corresponded to 73.7% of P (Table 4). ETW was 639.8 mm and 424.0 mm (58.7% and 120.1% of P) for the wet and the dry seasons, respectively (Table 4). Thus, larger amounts of water were transferred into the atmosphere than rainfall during the dry season.
The contribution of the understory vegetation to the whole evapo-transpiration (ETU/ETW) was 34.6% for the whole period, with 33.9% in the wet season and 35.6% in the dry season (Table 4), respectively. We did not detect a significant relationship between LAI and ETW, but a negative correlation between LAI and ETU was found during the wet season (Fig. 5A and B). In the dry season, a higher positive correlation
Table 4 Summary of the balance of evapotranspiration and its components.
P ETW IL ETU TRRES TRG TRF TRO TRRES − TRO
Whole period⁎ (mm) 1443.9 1063.8 77.1 367.8 618.9 302.6 470.4 645.0 −26.1 Percentage to P (%) 73.7 5.3 25.5 42.9 21.0 32.6 44.7 −1.8 Percentage to ETW (%) 7.2 34.6 58.2 28.4 44.2 60.6 −2.5 Percentage to TRRES (%) 48.9 76.0 104.2 −4.2
Wet season (mm) 1090.8 639.8 59.1 216.8 363.9 170.0 278.3 362.1 1.8 Percentage to P (%) 58.7 5.4 19.9 33.4 15.6 25.5 33.2 0.2 Percentage to ETW (%) 9.2 33.9 56.9 26.6 43.5 56.6 0.3 Percentage to TRRES (%) 46.7 76.5 99.5 0.5
Dry season (mm) 353.1 424.0 18.1 151.0 254.9 132.6 192.1 282.9 −28.0 Percentage to P (%) 120.1 5.1 42.8 72.2 37.6 54.4 80.1 −7.9 Percentage to ETW (%) 4.3 35.6 60.1 31.3 45.3 66.7 −6.6 Percentage to TRRES (%) 52.0 75.3 111.0 −11.0
P: gross rainfall, IL: interception loss from overstory trees, ETW: evapotranspiration from whole ecosystem. ETU: evapotranspiration from understory vegetation. TRRES: Transpiration from overstory tree (TR) estimated as ETW − (ETU + IL). TRG: TR evaluated by thermal dissipation method with original parameter (Granier, 1985). TRF and TRO: TR estimated with the parameter proposed by Fuchs et al. (2017) and Ouyang et al. (2018), respectively.
⁎Whole period is from June 2010 to June 2011 with data available for a total of 354 days.
Fig. 3. Comparisons between stand transpiration estimated from sap flux density measurements with the original coefficients (TRG) and that obtained as the residual of whole-ecosystem evapotranspiration and its componenets (TRRES). All values are daily average for each period of the month. Closed and open symbols denote the wet and dry seasons, respectively.
S. Iida, et al. Agricultural and Forest Meteorology 295 (2020) 108170
6
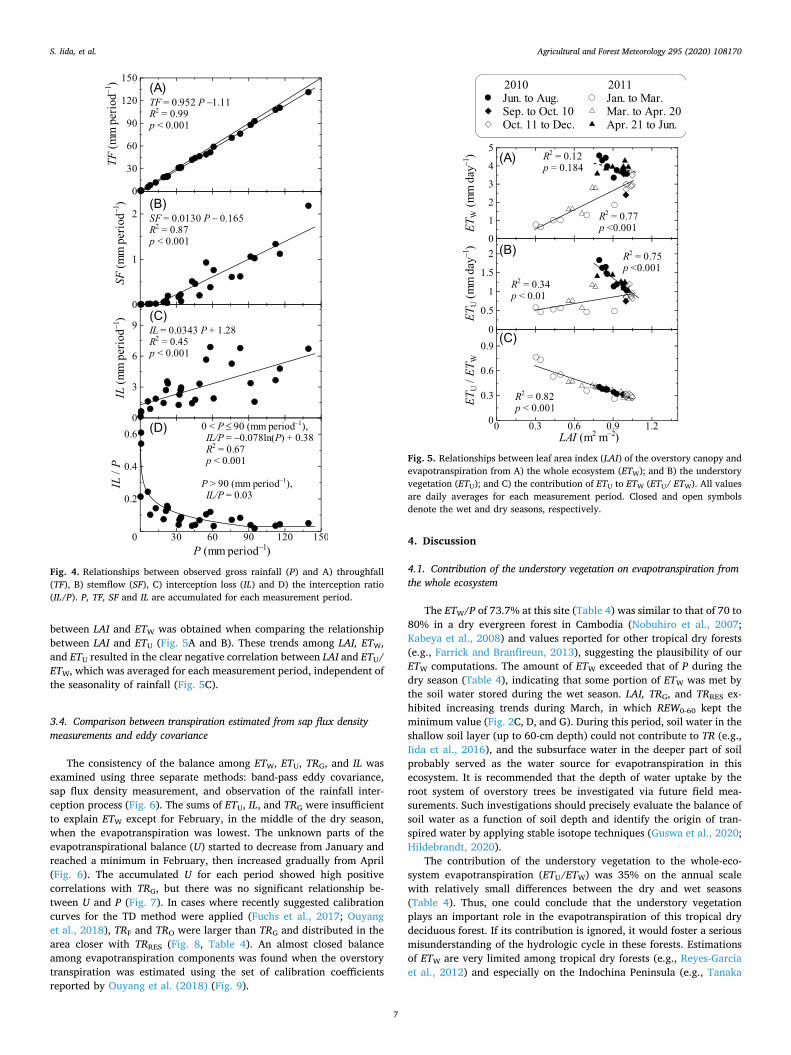
between LAI and ETW was obtained when comparing the relationship between LAI and ETU (Fig. 5A and B). These trends among LAI, ETW, and ETU resulted in the clear negative correlation between LAI and ETU/ ETW, which was averaged for each measurement period, independent of the seasonality of rainfall (Fig. 5C).
3.4. Comparison between transpiration estimated from sap flux density measurements and eddy covariance
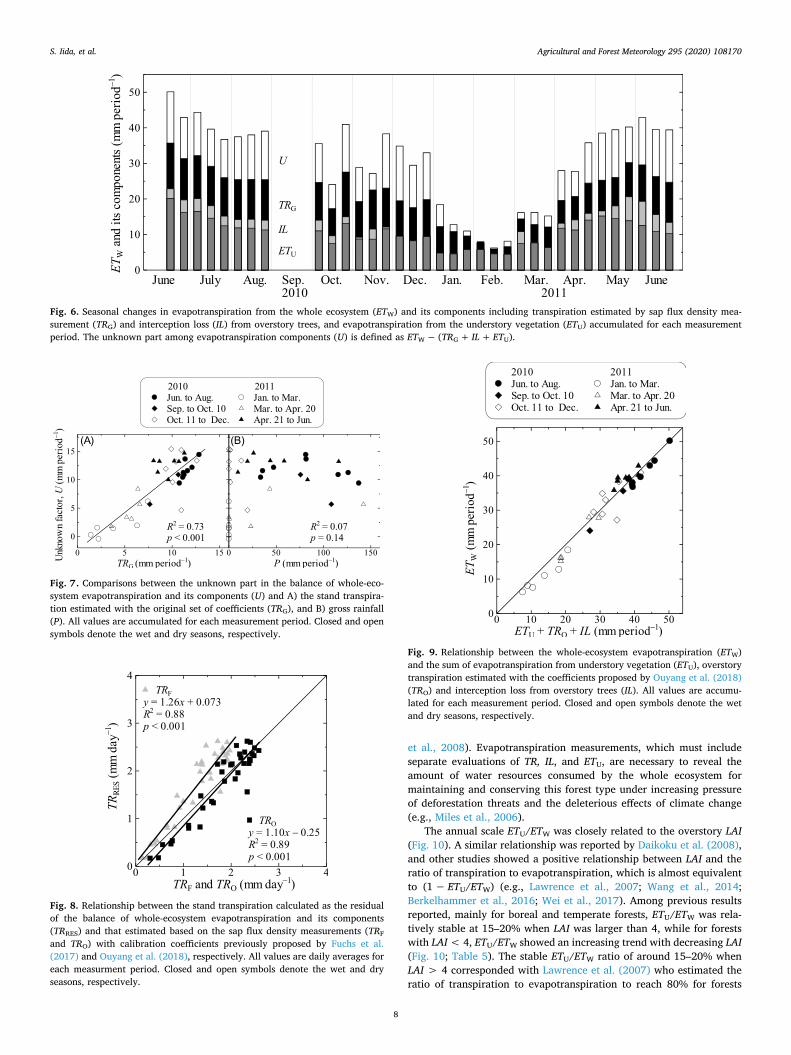
The consistency of the balance among ETW, ETU, TRG, and IL was examined using three separate methods: band-pass eddy covariance, sap flux density measurement, and observation of the rainfall inter-ception process (Fig. 6). The sums of ETU, IL, and TRG were insufficient to explain ETW except for February, in the middle of the dry season, when the evapotranspiration was lowest. The unknown parts of the evapotranspirational balance (U) started to decrease from January and reached a minimum in February, then increased gradually from April (Fig. 6). The accumulated U for each period showed high positive correlations with TRG, but there was no significant relationship be-tween U and P (Fig. 7). In cases where recently suggested calibration curves for the TD method were applied (Fuchs et al., 2017; Ouyang et al., 2018), TRF and TRO were larger than TRG and distributed in the area closer with TRRES (Fig. 8, Table 4). An almost closed balance among evapotranspiration components was found when the overstory transpiration was estimated using the set of calibration coefficients reported by Ouyang et al. (2018) (Fig. 9).
4. Discussion
4.1. Contribution of the understory vegetation on evapotranspiration from the whole ecosystem
The ETW/P of 73.7% at this site (Table 4) was similar to that of 70 to 80% in a dry evergreen forest in Cambodia (Nobuhiro et al., 2007; Kabeya et al., 2008) and values reported for other tropical dry forests (e.g., Farrick and Branfireun, 2013), suggesting the plausibility of our ETW computations. The amount of ETW exceeded that of P during the dry season (Table 4), indicating that some portion of ETW was met by the soil water stored during the wet season. LAI, TRG, and TRRES ex-hibited increasing trends during March, in which REW0-60 kept the minimum value (Fig. 2C, D, and G). During this period, soil water in the shallow soil layer (up to 60-cm depth) could not contribute to TR (e.g., Iida et al., 2016), and the subsurface water in the deeper part of soil probably served as the water source for evapotranspiration in this ecosystem. It is recommended that the depth of water uptake by the root system of overstory trees be investigated via future field mea-surements. Such investigations should precisely evaluate the balance of soil water as a function of soil depth and identify the origin of tran-spired water by applying stable isotope techniques (Guswa et al., 2020; Hildebrandt, 2020).
The contribution of the understory vegetation to the whole-eco-system evapotranspiration (ETU/ETW) was 35% on the annual scale with relatively small differences between the dry and wet seasons (Table 4). Thus, one could conclude that the understory vegetation plays an important role in the evapotranspiration of this tropical dry deciduous forest. If its contribution is ignored, it would foster a serious misunderstanding of the hydrologic cycle in these forests. Estimations of ETW are very limited among tropical dry forests (e.g., Reyes-Garcia et al., 2012) and especially on the Indochina Peninsula (e.g., Tanaka
Fig. 4. Relationships between observed gross rainfall (P) and A) throughfall (TF), B) stemflow (SF), C) interception loss (IL) and D) the interception ratio (IL/P). P, TF, SF and IL are accumulated for each measurement period.
Fig. 5. Relationships between leaf area index (LAI) of the overstory canopy and evapotranspiration from A) the whole ecosystem (ETW); and B) the understory vegetation (ETU); and C) the contribution of ETU to ETW (ETU/ ETW). All values are daily averages for each measurement period. Closed and open symbols denote the wet and dry seasons, respectively.
S. Iida, et al. Agricultural and Forest Meteorology 295 (2020) 108170
7
et al., 2008). Evapotranspiration measurements, which must include separate evaluations of TR, IL, and ETU, are necessary to reveal the amount of water resources consumed by the whole ecosystem for maintaining and conserving this forest type under increasing pressure of deforestation threats and the deleterious effects of climate change (e.g., Miles et al., 2006).
The annual scale ETU/ETW was closely related to the overstory LAI (Fig. 10). A similar relationship was reported by Daikoku et al. (2008), and other studies showed a positive relationship between LAI and the ratio of transpiration to evapotranspiration, which is almost equivalent to (1 − ETU/ETW) (e.g., Lawrence et al., 2007; Wang et al., 2014; Berkelhammer et al., 2016; Wei et al., 2017). Among previous results reported, mainly for boreal and temperate forests, ETU/ETW was rela-tively stable at 15–20% when LAI was larger than 4, while for forests with LAI < 4, ETU/ETW showed an increasing trend with decreasing LAI (Fig. 10; Table 5). The stable ETU/ETW ratio of around 15–20% when LAI > 4 corresponded with Lawrence et al. (2007) who estimated the ratio of transpiration to evapotranspiration to reach 80% for forests
Fig. 6. Seasonal changes in evapotranspiration from the whole ecosystem (ETW) and its components including transpiration estimated by sap flux density mea-surement (TRG) and interception loss (IL) from overstory trees, and evapotranspiration from the understory vegetation (ETU) accumulated for each measurement period. The unknown part among evapotranspiration components (U) is defined as ETW − (TRG + IL + ETU).
Fig. 7. Comparisons between the unknown part in the balance of whole-eco-system evapotranspiration and its components (U) and A) the stand transpira-tion estimated with the original set of coefficients (TRG), and B) gross rainfall (P). All values are accumulated for each measurement period. Closed and open symbols denote the wet and dry seasons, respectively.
Fig. 8. Relationship between the stand transpiration calculated as the residual of the balance of whole-ecosystem evapotranspiration and its components (TRRES) and that estimated based on the sap flux density measurements (TRF
and TRO) with calibration coefficients previously proposed by Fuchs et al. (2017) and Ouyang et al. (2018), respectively. All values are daily averages for each measurment period. Closed and open symbols denote the wet and dry seasons, respectively.
Fig. 9. Relationship between the whole-ecosystem evapotranspiration (ETW) and the sum of evapotranspiration from understory vegetation (ETU), overstory transpiration estimated with the coefficients proposed by Ouyang et al. (2018) (TRO) and interception loss from overstory trees (IL). All values are accumu-lated for each measurement period. Closed and open symbols denote the wet and dry seasons, respectively.
S. Iida, et al. Agricultural and Forest Meteorology 295 (2020) 108170
8
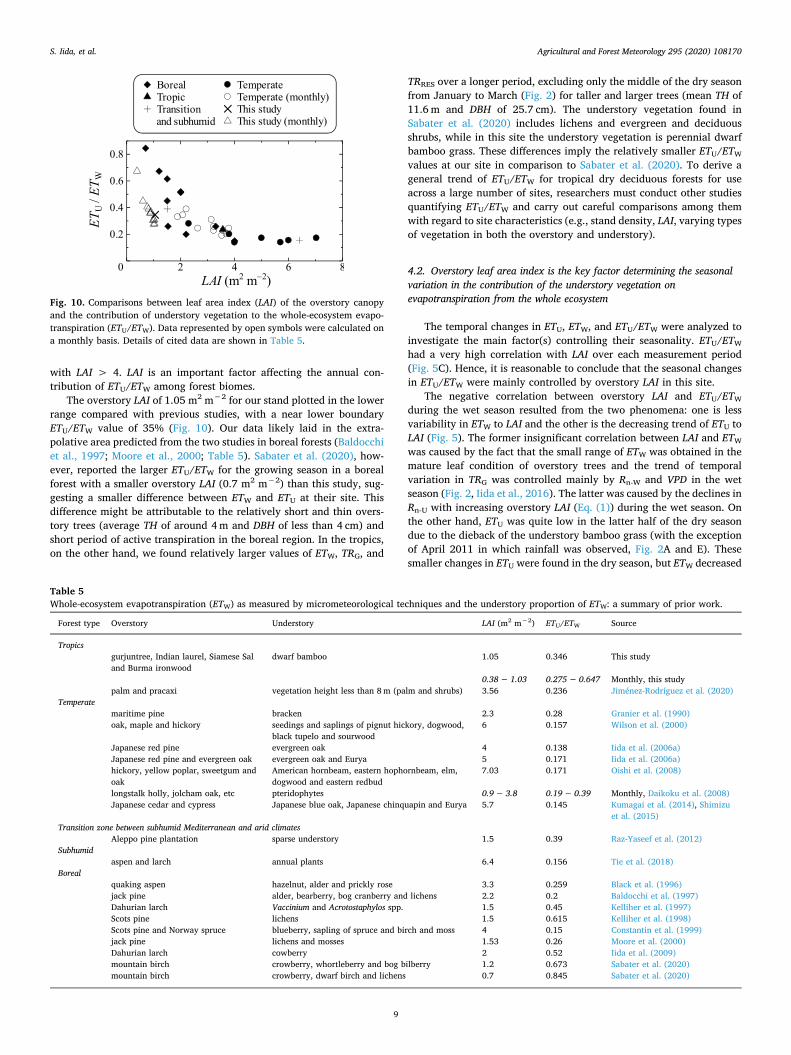
with LAI > 4. LAI is an important factor affecting the annual con-tribution of ETU/ETW among forest biomes.
The overstory LAI of 1.05 m2 m−2 for our stand plotted in the lower range compared with previous studies, with a near lower boundary ETU/ETW value of 35% (Fig. 10). Our data likely laid in the extra-polative area predicted from the two studies in boreal forests (Baldocchi et al., 1997; Moore et al., 2000; Table 5). Sabater et al. (2020), how-ever, reported the larger ETU/ETW for the growing season in a boreal forest with a smaller overstory LAI (0.7 m2 m−2) than this study, sug-gesting a smaller difference between ETW and ETU at their site. This difference might be attributable to the relatively short and thin overs-tory trees (average TH of around 4 m and DBH of less than 4 cm) and short period of active transpiration in the boreal region. In the tropics, on the other hand, we found relatively larger values of ETW, TRG, and
TRRES over a longer period, excluding only the middle of the dry season from January to March (Fig. 2) for taller and larger trees (mean TH of 11.6 m and DBH of 25.7 cm). The understory vegetation found in Sabater et al. (2020) includes lichens and evergreen and deciduous shrubs, while in this site the understory vegetation is perennial dwarf bamboo grass. These differences imply the relatively smaller ETU/ETW
values at our site in comparison to Sabater et al. (2020). To derive a general trend of ETU/ETW for tropical dry deciduous forests for use across a large number of sites, researchers must conduct other studies quantifying ETU/ETW and carry out careful comparisons among them with regard to site characteristics (e.g., stand density, LAI, varying types of vegetation in both the overstory and understory).
4.2. Overstory leaf area index is the key factor determining the seasonal variation in the contribution of the understory vegetation on evapotranspiration from the whole ecosystem
The temporal changes in ETU, ETW, and ETU/ETW were analyzed to investigate the main factor(s) controlling their seasonality. ETU/ETW
had a very high correlation with LAI over each measurement period (Fig. 5C). Hence, it is reasonable to conclude that the seasonal changes in ETU/ETW were mainly controlled by overstory LAI in this site.
The negative correlation between overstory LAI and ETU/ETW
during the wet season resulted from the two phenomena: one is less variability in ETW to LAI and the other is the decreasing trend of ETU to LAI (Fig. 5). The former insignificant correlation between LAI and ETW
was caused by the fact that the small range of ETW was obtained in the mature leaf condition of overstory trees and the trend of temporal variation in TRG was controlled mainly by Rn-W and VPD in the wet season (Fig. 2, Iida et al., 2016). The latter was caused by the declines in Rn-U with increasing overstory LAI (Eq. (1)) during the wet season. On the other hand, ETU was quite low in the latter half of the dry season due to the dieback of the understory bamboo grass (with the exception of April 2011 in which rainfall was observed, Fig. 2A and E). These smaller changes in ETU were found in the dry season, but ETW decreased
Fig. 10. Comparisons between leaf area index (LAI) of the overstory canopy and the contribution of understory vegetation to the whole-ecosystem evapo-transpiration (ETU/ETW). Data represented by open symbols were calculated on a monthly basis. Details of cited data are shown in Table 5.
Table 5 Whole-ecosystem evapotranspiration (ETW) as measured by micrometeorological techniques and the understory proportion of ETW: a summary of prior work.
Forest type Overstory Understory LAI (m2 m−2) ETU/ETW Source
Tropics gurjuntree, Indian laurel, Siamese Sal and Burma ironwood
dwarf bamboo 1.05 0.346 This study
0.38 − 1.03 0.275 − 0.647 Monthly, this study palm and pracaxi vegetation height less than 8 m (palm and shrubs) 3.56 0.236 Jiménez-Rodríguez et al. (2020)
Temperate maritime pine bracken 2.3 0.28 Granier et al. (1990) oak, maple and hickory seedings and saplings of pignut hickory, dogwood,
black tupelo and sourwood 6 0.157 Wilson et al. (2000)
Japanese red pine evergreen oak 4 0.138 Iida et al. (2006a) Japanese red pine and evergreen oak evergreen oak and Eurya 5 0.171 Iida et al. (2006a) hickory, yellow poplar, sweetgum and oak
American hornbeam, eastern hophornbeam, elm, dogwood and eastern redbud
7.03 0.171 Oishi et al. (2008)
longstalk holly, jolcham oak, etc pteridophytes 0.9 − 3.8 0.19 − 0.39 Monthly, Daikoku et al. (2008) Japanese cedar and cypress Japanese blue oak, Japanese chinquapin and Eurya 5.7 0.145 Kumagai et al. (2014), Shimizu
et al. (2015) Transition zone between subhumid Mediterranean and arid climates
Aleppo pine plantation sparse understory 1.5 0.39 Raz-Yaseef et al. (2012) Subhumid
aspen and larch annual plants 6.4 0.156 Tie et al. (2018) Boreal
quaking aspen hazelnut, alder and prickly rose 3.3 0.259 Black et al. (1996) jack pine alder, bearberry, bog cranberry and lichens 2.2 0.2 Baldocchi et al. (1997) Dahurian larch Vaccinium and Acrotostaphylos spp. 1.5 0.45 Kelliher et al. (1997) Scots pine lichens 1.5 0.615 Kelliher et al. (1998) Scots pine and Norway spruce blueberry, sapling of spruce and birch and moss 4 0.15 Constantin et al. (1999) jack pine lichens and mosses 1.53 0.26 Moore et al. (2000) Dahurian larch cowberry 2 0.52 Iida et al. (2009) mountain birch crowberry, whortleberry and bog bilberry 1.2 0.673 Sabater et al. (2020) mountain birch crowberry, dwarf birch and lichens 0.7 0.845 Sabater et al. (2020)
S. Iida, et al. Agricultural and Forest Meteorology 295 (2020) 108170
9

significantly with the shedding of leaves from overstory trees (Fig. 2D and E). These contrasting phenomena led to the negative correlation between LAI and ETU/ETW during the dry season. Especially in Feb-ruary, we found predominant values of ETU/ETW, which suggested that most of ETW was attributable to evaporation from the soil surface as judged from the minimums of ETW, TRG, TRRES, and LAI (Fig. 2D, E, and G) and the dieback of the aboveground portion of the understory ve-getation. After that, the observed decreases in ETU/ETW followed through to the early leaf flushing and the restart of transpiration ac-tivity of overstory trees (Fig. 2D, F, and G).
Although there are rather few of papers that have examined the relationship between overstory LAI and ETU/ETW on a monthly scale using field measurements, we compared our monthly data in the tro-pical dry forest with those in the temperate mixed forest reported by Daikoku et al. (2008). On the monthly scale, ETU/ETW was negatively correlated with LAI in this site, and the sensitivity of ETU/ETW to LAI was steeper than that for temperate forests (Fig. 10). The mixed forest studied by Daikoku et al. (2008) included some evergreen species, and, thus, some trees kept transpiring when the deciduous species were dormant. Therefore, the ETU/ETW did not rise to a larger value in the winter season with lower LAI, thereby dulling the response of ETU/ETW
in mixed temperate forests. Regardless, additional measurements of ETW, its components, and overstory LAI are necessary to acquire a comprehensive picture of ETW for tropical dry forests at monthly (or shorter) scales, and to distinguish differences in relation to other biomes.
4.3. Evaluation uncertainty of evapotranspiration components
The sum of ETU, TRG, and IL was found to be smaller than ETW
(Fig. 6). In addition, the annual value of TRG was 302.6 mm, corre-sponding to 48.9% of TRRES = 618.9 mm (Table 4). An analysis of these imbalances was conducted to discover the main reasons explaining the unknown portion among evapotranspiration components (U) at this site (Fig. 7 and 8). Although the accuracy of latent heat fluxes would be affected by a wetted SAT and capacitance hygrometer, the validity of ETW and ETU values were confirmed by the insignificant relationship between U and P (Fig. 7B), probably resulting from the fact that rainfall mainly occurred from evening to the early morning at this site (e.g., Nobuhiro et al., 2008; Tsujimoto et al., 2018). Moreover, it is unlikely that a notable proportion of U was attributable to the slightly larger DBH of the twelve test trees as compared to those in the forest sur-rounding the tower.
On the other hand, a clear positive relationship between TRG and U was found in this site (Fig. 7A), which strongly suggests that the un-derestimation of TRG and FD by the TD method (e.g., Steppe et al., 2010). We searched calibration coefficients of the TD method and ap-plied two sets of parameters (Fuchs et al., 2017; Ouyang et al., 2018), whose correction degrees were higher among the recently published papers (c.f., Iida et al., 2020), to our measurement data (Fig. 8). As a result, TRF and TRO calculated from the two sets of calibration coeffi-cients distributed near the measurements of TRRES (Fig. 8). The total amounts of TRF and TRO were 470.4 mm and 645.0 mm, respectively, and they corresponded to 76.0% and 104.2% of total amount of TRRES
(Table 4). We compared the evapotranspiration components, including TRO which is the closest to TRRES, and found high correspondence with ETW independent of seasonality (Fig. 9). The difference between ETW
and the sum of IL, ETU, and TRO (ETW – (IL + ETU + TRO) = TRRES – TRO) was –26.1 mm (–4.2% of TRRES) for the whole study period, 1.8 mm (0.5%) for the wet season, and –28.0 mm (–11.0%) for the dry season (Table 4). Therefore, it can be concluded that the stand-scale transpiration is reasonably estimated as TRO by the TD method at this site by applying the set of calibration coefficients suggested by Ouyang et al. (2018). We should emphasize that a clear linear relationship was found between TRG and TRRES (Fig. 3), and, thus, the TD method could sufficiently detect the relative changes in transpiration activity at this
site. The underestimation in TRG was likely the result of uncertainty of the FD measurements by the TD method with the original coefficients proposed by Granier (1985).
It should be noted that the sets of coefficients applied in this study were derived from the calibrations for European birch (Fagus sylvatica) by Fuchs et al. (2017) and Chinese fir (Cunninghamia lancelata) by Ouyang et al. (2018). Although Fig. 8 showed the relatively close cor-respondences between TRRES vs TRF and TRRES vs TRO, careful attention should be paid to the fact that these two sets of coefficients were ap-plied to four species found in the tropical dry forest studied here, which are quite different from European birch and Chinese fir. We emphasize that future studies need to be conducted to formulate new calibrations to obtain the suitable sets of coefficients for tree species of tropical dry forests.
5. Conclusions
We measured the whole-ecosystem evapotranspiration (ETW) and its components including transpiration from overstory trees (TR), inter-ception loss from overstory trees (IL), and evapotranspiration from the understory vegetation (ETU) in a tropical dry deciduous forest in Cambodia. The annual contribution of the understory vegetation to ETW
(ETU/ETW) was 34.6%, and ETU/ETW did not have a large difference between the dry (33.9%) and wet (35.6%) seasons. It is concluded that the understory vegetation is a critical factor to include when calculating the forest water balance of tropical dry deciduous forests. ETU/ETW
showed a negative correlation with overstory LAI, and its seasonal trend could be controlled by LAI at this site. Compared with other forest biomes, we found an increasing trend of annual ETU/ETW with de-creasing LAI for forests having LAI of less than 4 m2 m−2. The annual transpiration calculated by the original coefficients of the thermal dis-sipation (TD) method (TRG) was 302.6 mm, corresponding to 48.9% of that derived from the residual balance of the evapotranspiration com-ponents. A significant clear positive correlation between TRG and the unknown part among evapotranspiration components strongly sug-gested that the underestimation in TRG was due to the uncertainty of the thermal dissipation method. We have demonstrated that TR can reasonably be estimated by the TD method when a suitable set of ca-libration coefficients are applied.
The quantitative evaluation of the contribution of the understory vegetation is quite important to gain a comprehensive understanding of the water balance for tropical dry deciduous forests. The measurement of evapotranspirational processes has been limited in this biome, and, hence, we recommend further investigations that separately evaluate the different components of evapotranspiration, which specifically take into account the possibility of underestimation of sap flux density by the thermal dissipation method. In conjunction with future studies, this work could form an important database on evapotranspirational losses from tropical dry deciduous forests that will be necessary to better forecast and predict the impact of climate change over part of the tropics where these forests exist.
Declaration of Competing Interest
The authors declare that they have no known competing financial interests or personal relationships that could have appeared to influ-ence the work reported in this paper.
Acknowledgements
We appreciate to supports for field measurements by the staff of the Institute of Forest and Wildlife Research and Development, Forestry Administration, Cambodia. Part of this work was supported by JSPS KAKENHI Grant Numbers JP21710021 and JP19K06135. This study was partially conducted under the projects entitled, ‘Establishment of
S. Iida, et al. Agricultural and Forest Meteorology 295 (2020) 108170
10
the Integrated Forest Ecosystem Observation Site and Network in the Lower Mekong (2008–2011)’ funded by the Ministry of the Environment of Japan, and ‘Estimation and Simulation of Carbon Stock Change of Tropical Forests in Asia (2011–2014)’ funded by the Ministry of Agriculture, Forestry and Fisheries of Japan.
References
Aide, T.M., 1992. Dry season leaf production: an escape from herbivory. Biotropica 24, 532–537. https://doi.org/10.2307/2389016.
Baldocchi, D.D., Vogel, C.A., Hall, B., 1997. Seasonal variation of energy and water vapor exchange rates above and below a boreal jack pine forest canopy. J. Geophys. Res.: Atmospheres 102 (D24), 28939–28951. https://doi.org/10.1029/96JD03325.
Berkelhammer, M., Noone, D.C., Wong, T.E., Burns, S.P., Knowles, J.F., Kaushik, A., Blanken, P.D., Williams, M.W., 2016. Convergent approaches to determine an eco-system's transpiration fraction. Global Biogeochem. Cycles 30, 933–951. https://doi. org/10.1002/2016GB005392.
Black, T.A., Den Hartog, G., Neumann, H.H., Blanken, P.D., Yang, P.C., Russell, C., Nesic, Z., Lee, X., Chen, S.G., Staebler, R., Novak, M.D., 1996. Annual cycles of water vapour and carbon dioxide fluxes in and above a boreal aspen forest. Glob. Chang. Biol. 2, 219–229. https://doi.org/10.1111/j.1365-2486.1996.tb00074.x.
Blanken, P.D., Black, T.A., Neumann, H.H., den Hartog, G., Yang, P.C., Nesic, Z., Lee, X., 2001. The seasonal water and energy exchange above and within a boreal aspen forest. J. Hydrol. (Amst) 245, 118–136. https://doi.org/10.1016/S0022-1694(01) 00343-2.
Brown, S., Lugo, A.E., 1982. The storage and production of organic matter in tropical forests and their role in the global carbon cycle. Biotropica 14, 161–187. https://doi. org/10.2307/2388024.
Brutsaert, W., 1982. Evaporation Into the Atmosphere: Theory, History, and Applications. D. Reidel Publishing Company, Boston, Massachusetts.
Carlyle-Moses, D.E., Iida, S., Germer, S., Llorens, P., Michalzik, B., Nanko, K., Tischer, A., Levia, D.F., 2018. Expressing stemflow commensurate with its ecohydrological im-portance. Adv. Water Resour. 121, 472–479. https://doi.org/10.1016/j.advwatres. 2018.08.015.
Clearwater, M.J., Meinzer, F.C., Andrade, J.L., Goldstein, G., Holbrook, N.M., 1999. Potential errors in measurement of nonuniform sap flow using heat dissipation probes. Tree Physiol. 19, 681–687. https://doi.org/10.1093/treephys/19.10.681.
Constantin, J., Grelle, A., Ibrom, A., Morgenstern, K., 1999. Flux partitioning between understorey and overstorey in a boreal spruce/pine forest determined by the eddy covariance method. Agric. For. Meteorol. 98, 629–643. https://doi.org/10.1016/ S0168-1923(99)00129-X.
Daikoku, K., Hattori, S., Deguchi, A., Aoki, Y., Miyashita, M., Matsumoto, K., Akiyama, J., Iida., S., Toba, T., Fujita, Y., Ohta, T., 2008. Influence of evaporation from the forest floor on evapotranspiration from the dry canopy. Hydrol. Process 22, 4083–4096. https://doi.org/10.1002/hyp.7010.
Elliott, S., Baker, P.J., Borchert, R., 2006. Leaf flushing during the dry season: the paradox of Asian monsoon forests. Global Ecol. Biogeogr. 15, 248–257. https://doi.org/10. 1111/j.1466-8238.2006.00213.x.
Endo, N., Matsumoto, J., Lwin, T., 2009. Trends in precipitation extremes over Southeast Asia. SOLA 5, 168–171. https://doi.org/10.2151/sola.2009-043.
FAO, 2015. Global Forest Resources Assessment 2015. Food and Agriculture Organization of the United Nations, Rome.
Farrick, K.K., Branfireun, B.A., 2013. Left high and dry: a call to action for increased hydrological research in tropical dry forests. Hydrol. Process. 27, 3254–3262. https://doi.org/10.1002/hyp.9935.
Fuchs, S., Leuschner, C., Link, R., Coners, H., Schuldt, B., 2017. Calibration and com-parison of thermal dissipation, heat ratio and heat field deformation sap flow probes for diffuse-porous trees. Agric. For. Meteorol. 244, 151–161. https://doi.org/10. 1016/j.agrformet.2017.04.003.
Granier, A., 1985. Une nouvelle méthod pour la mesure du flux de sève brute dans le tronc des arbres. Annales des Sci. Forestières 42, 193–200 [Granier, A. 1985. A new method of sap flow measurement in tree trunks. English translation by Gash JHC, Granier A. 2007. In Evaporation, Benchmark Papers in Hydrology 2. Gash JHC, Shuttleworth, WJ (eds). IAHS Press: Oxfordshire; 61–63].
Granier, A., Bobay, V., Gash, J.H.C., Gelpe, J., Saugier, B., Shuttleworth, W.J., 1990. Vapour flux density and transpiration rate comparisons in a stand of Maritime pine (Pinus pinaster Ait.) in Les Landes forest. Agric. For. Meteorol. 51, 309–319. https:// doi.org/10.1016/0168-1923(90)90115-M.
Granier, A., Loustau, D., 1994. Measuring and modelling the transpiration of a maritime pine canopy from sap-flow data. Agric. For. Meteorol. 71, 61–81. https://doi.org/10. 1016/0168-1923(94)90100-7.
Guswa, A.J., Tetzlaff, D., Selker, J.S., Carlyle-Moses, D.E., Boyer, E.W., Bruen, M., Cayuela, C., Creed, I.F., van de Giesen, N., Grasso, D., Hannah, D.M., Hudson, J.E., Hudson, S.A., Iida, S., Jackson, R.B., Katul, G.G., Kumagai, T., Llorens, P., Ribeiro, F.L., Michalzik, B., Nanko, K., Oster, C., Pataki, D.E., Peters, C.A., Rinaldo, A., Carretero, D.S., Trifunovic, B., Zalewski, M., Haagsma, M., Levia, D.F., 2020. Advancing ecohydrology in the 21st century: a convergence of opportunities. Ecohydrology e2208. https://doi.org/10.1002/eco.2208.
Hicks, B.B., McMillen, R.T., 1988. On the measurement of dry deposition using imperfect sensors and in non-ideal terrain. Boundary Layer Meteorol. 42, 79–94. https://doi. org/10.1007/BF00119876.
Hildebrandt, A., 2020. Root-water relations and interactions in mixed forest settings. In: Levia, D.E., Carlyle-Moses, D.E., Iida, S., Michalzik, B., Nanko, K., Tischer, A. (Eds.),
Forest-Water Interactions. Ecological Studies Series. Springer Nature, Cham, Switzerland AG, pp. 319–348. https://doi.org/10.1007/978-3-030-26086-6_14.
Högström, U., Bergström, H., Smedman, A., Halldin, S., Lindroth, A., 1989. Turbulent exchange above a pine forest, I: fluxes and gradients. Boundary Layer Meteorol. 49, 197–217. https://doi.org/10.1007/BF00116411.
Hui, D., Wan, S., Su, B., Katul, G., Monson, R., Luo, Y., 2004. Gap-filling missing data in eddy covariance measurements using multiple imputation (MI) for annual estimation. Agric. For. Meteorol. 121, 93–111. https://doi.org/10.1016/S0168-1923(03) 00158-8.
Iida, S., Tanaka, T., Sugita, M., 2006a. Change of evapotranspiration components due to the succession from Japanese red pine to evergreen oak. J. Hydrol. 326, 166–180. https://doi.org/10.1016/j.jhydrol.2005.11.002.
Iida, S., Nakatani, S., Tanaka, T., 2006b. Evaluation of transpiration from a natural de-ciduous broad-leaved forest located at a headwater catchment based on measurement of sap flux density. J. Jpn Soc. Hydrol. Water Res. 19, 7–16. https://doi.org/10.3178/ jjshwr.19.7. (in Japanese with English abstract).
Iida, S., Ohta, T., Matsumoto, K., Nakai, T., Kuwada, T., Kononov, A.V., Maximov, T.C., van der Molen, M.K., Dolman, H., Tanaka, H., Yabuki, H., 2009. Evapotranspiration from understory vegetation in an eastern Siberian boreal larch forest. Agric. For. Meteorol. 149, 1129–1139. https://doi.org/10.1016/j.agrformet.2009.02.003.
Iida, S., Shimizu, T., Kabeya, N., Nobuhiro, T., Tamai, K., Shimizu, A., Ito, E., Ohnuki, Y., Abe, T., Tsuboyama, Y., Chann, S., Keth, N., 2012. Calibration of tipping-bucket flow meters and rain gauges to measure gross rainfall, throughfall, and stemflow applied to data from a Japanese temperate coniferous forest and a Cambodian tropical de-ciduous forest. Hydrol. Process. 26, 2445–2454. https://doi.org/10.1002/hyp.9462.
Iida, S., Shimizu, T., Tamai, K., Kabeya, N., Shimizu, A., Ito, E., Ohnuki, Y., Chann, S., Keth, N., 2016. Interrelationships among dry season leaf fall, leaf flush and tran-spiration: insights from sap flux measurements in a tropical dry deciduous forest. Ecohydrology 9, 472–486. https://doi.org/10.1002/eco.1650.
Iida, S., Levia, D.F., Nanko, K., Sun, X., Shimizu, T., Tamai, K., Shinohara, Y., 2018. Correction of canopy interception loss measurements in temperate forests: a com-parison of necessary adjustments among three different rain gauges based on a dy-namic calibration procedure. J. Hydrometeorol. 19, 547–553. https://doi.org/10. 1175/jhm-d-17-0124.1.
Iida, S., Tamai, K., Noguchi, S., Kobayashi, M., 2019. Advancing our understanding of hydrologic processes in forests: knowledge obtained with plot-scale to catchment- scale methods and future perspectives. J. Jpn. Assoc. Hydrol. Sci. 49, 135–159. https://doi.org/10.4145/jahs.49.135. (in Japanese with English abstract).
Iida, S., Shimizu, T., Shinohara, Y., Takeuchi, S., Kumagai, T., 2020. The Necessity of sensor calibration for the precise measurement of water fluxes in forest ecosystems. In: Levia, D.E., Carlyle-Moses, D.E., Iida, S., Michalzik, B., Nanko, K., Tischer, A. (Eds.), Forest-Water Interactions. Ecological Studies Series. Springer Nature, Cham, Switzerland AG, pp. 29–54. https://doi.org/10.1007/978-3-030-26086-6_2.
Jiménez-Rodríguez, C.D., Coenders-Gerrits, M., Wenninger, J., Gonzalez-Angarita, A., Savenije, H., 2020. Contribution of understory evaporation in a tropical wet forest during the dry season. Hydrol. Earth Sys. Sci. 24, 2179–2206. https://doi.org/10. 5194/hess-24-2179-2020.
Kabeya, N., Shimizu, A., Nobuhiro, T., Tamai, K., 2008. Preliminary study of flow regimes and stream water residence times in multi-scale forested watersheds of central Cambodia. Paddy and Water Envir. 6, 25–35. https://doi.org/10.1007/s10333-008- 0104-3.
Kanae, S., Oki, T., Musiake, K., 2001. Impact of deforestation on regional precipitation over the Indochina Peninsula. J. Hydrometeorol. 2, 51–70. https://doi.org/10.1175/ 1525-7541(2001)002&3C0051:IODORP&3E2.0.CO;2.
Kelliher, F.M., Hollinger, D.Y., Schulze, E.-.D., Vygodskaya, N.N., Byers, J.N., Hunt, J.E., McSeveny, T.M., Milukova, I., Sogatchev, A., Varlagin, A., Ziegler, W., Arneth, A., Bauer, B., 1997. Evaporation from an eastern Siberian larch forest. Agric. For. Meteorol. 85, 135–147. https://doi.org/10.1016/S0168-1923(96)02424-0.
Kelliher, F.M., Lloyd, J., Arneth, A., Byers, J.N., McSeveny, T.M., Milukova, I., Grigoriev, S., Panfyorov, M., Sogatchev, A., Varlargin, A., Ziegler, W., Bauer, G., Schulze, E.-.D., 1998. Evaporation from a central Siberian pine forest. J. Hydrol. 205, 279–296. https://doi.org/10.1016/S0022-1694(98)00082-1.
Kosugi, Y., Takanashi, S., Tanaka, H., Ohkubo, S., Tani, M., Yano, M., Katayama, T., 2007. Evapotranspiration over a Japanese cypress forest. I. Eddy covariance fluxes and surface conductance characteristics for 3 years. J. Hydrol. 337, 269–283. https://doi. org/10.1016/j.jhydrol.2007.01.039.
Kumagai, T., Aoki, S., Nagasawa, H., Mabuchi, T., Kubota, K., Inoue, S., Utsumi, Y., Otsuki, K., 2005. Effects of tree-to-tree and radial variations on sap flow estimates of transpiration in Japanese cedar. Agric. For. Meteorol. 135, 110–116. https://doi.org/ 10.1016/j.agrformet.2005.11.007.
Kumagai, T., Tateishi, M., Miyazawa, Y., Kobayashi, M., Yoshifuji, N., Komatsu, H., Shimizu, T., 2014. Estimation of annual forest evapotranspiration from a coniferous plantation watershed in Japan (1): water use components in Japanese cedar stands. J. Hydrol. 508, 66–76. https://doi.org/10.1016/j.jhydrol.2013.10.047.
Lawrence, D.M., Thornton, P.E., Oleson, K.W., Bonan, G.B., 2007. The partitioning of evapotranspiration into transpiration, soil evaporation, and canopy evaporation in a GCM: impacts on land–atmosphere interaction. J. Hydrometeorol. 8, 862–880. https://doi.org/10.1175/JHM596.1.
Miles, L., Newton, A.C., DeFries, R.S., Ravilious, C., May, I., Blyth, S., Kapos, V., Gordon, J.E., 2006. A global overview of the conservation status of tropical dry forests. J. Biogeogr. 33, 491–505. https://doi.org/10.1111/j.1365-2699.2005.01424.x.
Moore, K.E., Fitzjarrald, D.R., Sakai, R.K., Freedman, J.M., 2000. Growing season water balance at a boreal jack pine forest. Water Resour. Res. 36, 483–493. https://doi.org/ 10.1029/1999WR900275.
Nobuhiro, T., Shimzu, A., Kabeya, N., Tsuboyama, Y., Kubota, T., Abe, T., Araki, M., Tamai, K., Chann, S., Keth, N., 2007. Year-round observation of evapotranspiration in
S. Iida, et al. Agricultural and Forest Meteorology 295 (2020) 108170
11

an evergreen broadleaf forest in Cambodia. In: Sawada, H., Araki, M., Chappell, N.A., LaFrankie, J.V., Shimizu, A. (Eds.), Forest Environments in the Mekong River Basin. SpringerTokyo, pp. 75–86. https://doi.org/10.1007/978-4-431-46503-4_7.
Nobuhiro, T., Shimizu, A., Kabeya, N., Iida, S., Tsuboyama, Y., 2008. Diurnal variation of rainfall in an evergreen broadleaf forest, Cambodia. Kanto J. Forest Res. 59, 321–322.
Ohnuki, Y., Kimhean, C., Shinomiya, Y., Toriyama, J., 2008. Distribution and char-acteristics of soil thickness and effects upon water storage in forested areas of Cambodia. Hydrol. Process. 22, 1272–1280. https://doi.org/10.1002/hyp.6937.
Oishi, A.C., Oren, R., Stoy, P.C., 2008. Estimating components of forest evapotranspira-tion: a footprint approach for scaling sap flux measurements. Agric. For. Meteorol. 148, 1719–1732. https://doi.org/10.1016/j.agrformet.2008.06.013.
Ouyang, S., Xiao, K., Zhao, Z., Xiang, W., Xu, C., Lei, P., Deng, X., Li, J., 2018. Stand transpiration estimates from recalibrated parameters for the Granier equation in a Chinese Fir (Cunninghamia lanceolata) plantation in southern China. Forests 9, 162. https://doi.org/10.3390/f9040162.
Peters, R.L., Fonti, P., Frank, D.C., Poyatos, R., Pappas, C., Kahmen, A., Carraro, V., Prendin, A.L., Schneider, L., Baltzer, J.L., Baron-Gafford, G.A., Dietrich, L., Heinrich, I., Minor, R., Sonnentag, O., Matheny, A.M., Wightman, M.G., Steppe, K., 2018. Quantification of uncertainties in conifer sap flow measured with the thermal dis-sipation method. New Phytol. 219, 1283–1299. https://doi.org/10.1111/nph.15241.
Raz-Yaseef, N., Yakir, D., Schiller, G., Cohen, S., 2012. Dynamics of evapotranspiration partitioning in a semi-arid forest as affected by temporal rainfall patterns. Agric. For. Meteorol. 157, 77–85. https://doi.org/10.1016/j.agrformet.2012.01.015.
Reyes-García, C., Andrade, J.L., Simá, J.L., Us-Santamaría, R., Jackson, P.C., 2012. Sapwood to heartwood ratio affects whole-tree water use in dry forest legume and non-legume trees. Trees 26, 1317–1330. https://doi.org/10.1007/s00468-012- 0708-5.
Rivera, G., Elliott, S., Caldas, L.S., Nicolossi, G., Coradin, V.T., Borchert, R., 2002. Increasing day-length induces spring flushing of tropical dry forest trees in the ab-sence of rain. Trees 16, 445–456. https://doi.org/10.1007/s00468-002-0185-3.
Sabater, A.M., Ward, H.C., Hill, T.C., Gornall, J.L., Wade, T.J., Evans, J.G., Prieto-Blanco, A., Disney, M., Phoenix., G.K., Williams, M., Huntley, B., Baxter, R., Mencuccini, M., Poyatos, R., 2020. Transpiration from subarctic deciduous woodlands: environmental controls and contribution to ecosystem evapotranspiration. Ecohydrology e2190. https://doi.org/10.1002/eco.2190.
Shimizu, T., Kumagai, T., Kobayashi, M., Tamai, K., Iida, S., Kabeya, N., Ikawa, R., Tateishi, M., Miyazawa, Y., Shimizu, A., 2015. Estimation of annual forest evapo-transpiration from a coniferous plantation watershed in Japan (2): comparison of eddy covariance, water budget and sap-flow plus interception loss. J. Hydrol. 522, 250–264. https://doi.org/10.1016/j.jhydrol.2014.12.021.
Steppe, K., De Pauw, D.J., Doody, T.M., Teskey, R.O., 2010. A comparison of sap flux
density using thermal dissipation, heat pulse velocity and heat field deformation methods. Agric. For. Meteorol. 150, 1046–1056. https://doi.org/10.1016/j. agrformet.2010.04.004.
Tanaka, N., Kume, T., Yoshifuji, N., Tanaka, K., Takizawa, H., Shiraki, K., Tantasirin, C., Tangtham, N., Suzuki, M., 2008. A review of evapotranspiration estimates from tropical forests in Thailand and adjacent regions. Agric. For. Meteorol. 148, 807–819. https://doi.org/10.1016/j.agrformet.2008.01.011.
Tani, A., Ito, E., Kanzaki, M., Ohta, S., Khorn, S., Pith, P., Tith, B., Pol, S., Lim, S., 2007. Principal forest types of three regions of Cambodia: kampong Thom, Kratie, and Mondolkiri. In: Sawada, H., Araki, M, Chappell, N.A., LaFrankie, J.V., Shimizu, A. (Eds.), Forest Environments in the Mekong River Basin. Springer, Tokyo, pp. 201–213. https://doi.org/10.1007/978-4-431-46503-4_18.
Tateishi, M., Kumagai, T., Suyama, Y., Hiura, T., 2010. Differences in transpiration characteristics of Japanese beech trees, Fagus crenata. Japan. Tree physiol. 30, 748–760. https://doi.org/10.1093/treephys/tpq023.
Tie, Q., Hu, H., Tian, F., Holbrook, N.M., 2018. Comparing different methods for de-termining forest evapotranspiration and its components at multiple temporal scales. Sci. Total Environ. 633, 12–29. https://doi.org/10.1016/j.scitotenv.2018.03.082.
Tsujimoto, K., Ohta, T., Aida, K., Tamakawa, K., Im, M.S., 2018. Diurnal pattern of rainfall in Cambodia: its regional characteristics and local circulation. Progress in Earth and Planetary Sci. 5, 1–18. https://doi.org/10.1186/s40645-018-0192-7.
Wang, B., LinHo, 2002. Rainy season of the Asian–Pacific summer monsoon. J. Clim. 15, 386–398. https://doi.org/10.1175/1520-0442(2002)015&3C0386:RSOTAP&3E2.0. CO;2.
Wang, L., Good, S.P., Caylor, K.K., 2014. Global synthesis of vegetation control on eva-potranspiration partitioning. Geophys. Res. Lett. 41, 6753–6757. https://doi.org/10. 1002/2014GL061439.
Watanabe, T., Yamanoi, K., Yasuda, Y., 2000. Testing of the bandpass eddy covariance method for a long-term measurement of water vapour flux over a forest. Boundary Layer Meteorol. 96, 473–491. https://doi.org/10.1023/A:1002642028984.
Wei, Z., Yoshimura, K., Wang, L., Miralles, D.G., Jasechko, S., Lee, X., 2017. Revisiting the contribution of transpiration to global terrestrial evapotranspiration. Geophys. Res. Lett. 44, 2792–2801. https://doi.org/10.1002/2016GL072235.
Wilson, K.B., Hanson, P.J., Baldocchi, D.D., 2000. Factors controlling evaporation and energy partitioning beneath a deciduous forest over an annual cycle. Agric. For. Meteorol. 102, 83–103. https://doi.org/10.1016/S0168-1923(00)00124-6.
Wilson, K.B., Hanson, P.J., Mulholland, P.J., Baldocchi, D.D., Wullschleger, S.D., 2001. A comparison of methods for determining forest evapotranspiration and its compo-nents: sap-flow, soil water budget, eddy covariance and catchment water balance. Agric. For. Meteorol. 106, 153–168. https://doi.org/10.1016/S0168-1923(00) 00199-4.
S. Iida, et al. Agricultural and Forest Meteorology 295 (2020) 108170
12