Embed Size (px)
Citation preview
PUBLIC
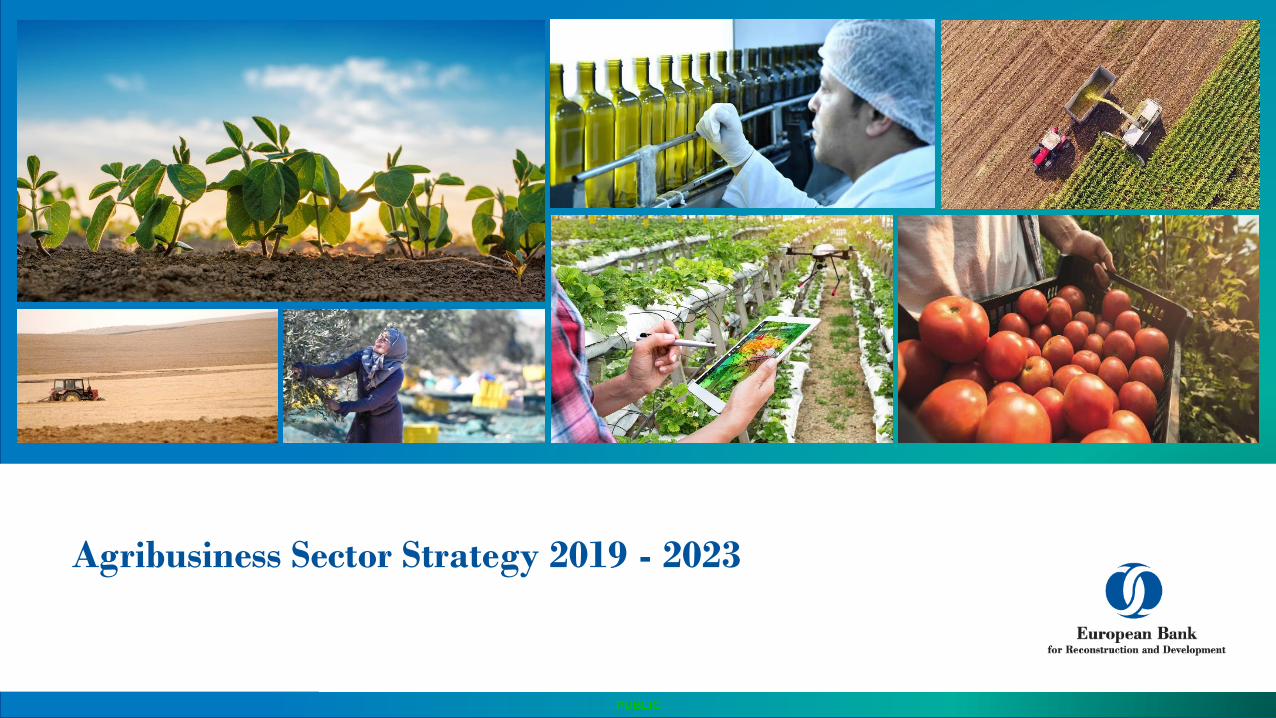
Agribusiness Sector Strategy 2019 - 2023
President’s Recommendation
2PUBLIC
Food is at the core of human existence. It plays a fundamental role by not only
providing nutrition to all, but also jobs and income to as many as 1.1 billion people
worldwide. The ingenuity of farmers and entrepreneurs in the agribusiness sector
shapes human communities over time, building upon local traditions and culture
while responding to the increasingly diverse needs of the global population.
The sector is facing growing challenges. Population growth and higher incomes
are predicted to lead to a 50 per cent increase in food demand by 2050. Dietary
and consumption patterns are changing, with increasing levels of protein
consumption. At the same time, the stock of finite natural resources needs to be
better managed to improve the sector’s impact on the environment, climate,
people and communities that depend on it.
The EBRD Agribusiness Sector Strategy 2019-2023 is a response to this changing
environment. It recognises that a responsible, innovative and sustainable
approach is needed for food production of the future. It highlights the need for
balance in order to simultaneously meet three competing needs: efficiently closing
the food gap to provide all people with the food they need; preserving natural
resources; and improving the social and environmental impacts of the sector.
The Strategy recognises the structural vulnerabilities of the region as well as the
remaining transition challenges in the economies where the EBRD invests. It is
anchored to the EBRD’s six transition qualities with the following key areas of
focus: enhancing productivity and value addition (competitiveness); sustainable
agribusiness (green); inclusive value chains (Inclusive); strengthened market links
(integrated); innovative and affordable financing (resilient); and improved business
conduct and standards (well-governed).
A strong, sustainable and inclusive agribusiness sector needs to encompass
farmers and companies of all sizes along the entire food value chain. The
EBRD’s tailored and innovative finance coupled with technical assistance can
catalyse private sector investments to provide public goods. Greater public and
private coordination – including through policy dialogue – can increase
transparency and policy outcomes to advance transition.
The Strategy acknowledges the diversity of markets and stages of development in
the sector and therefore emphasises that activities spanning the whole value
chain from farming, processing and trading to food distribution, packaging and
retail are required, with tailored approaches via different financing instruments.
The Strategy will be implemented with a tailored approach to respond to specific
transition challenges as set out in the respective Country Diagnostics and Country
Strategy documents of the EBRD.
The EBRD is the largest provider of finance to the sector in its region of
operations. The Strategy calls for more cooperation with a wide number of
partners, IFIs, development agencies and agribusiness sector associations,
knowledge/research centres and universities, all of which the EBRD is committed
to working with. Food is deeply rooted in our lives and our success critically
depends on our ability to work together towards a sustainable food future for all.
I recommend that the Board of Directors approve the five-year Agribusiness Sector
Strategy for 2019-2023.
Suma Chakrabarti
PUBLIC 3
A. Overview: Agribusiness Strategy 2019-2023slide 4
B. Implementation of previous strategy – experience and lessons learnedslides 5-8
C. Sector context and transition challengesslides 9-16
D. Proposed strategic directions - focus areasslides 17-22
E. Performance monitoring frameworkslides 23-25
F. EBRD position vis-a-vis other IFIs and partners slides 26-30
G. Annexesslides 31-41
Table of contents
Overview: Agribusiness Strategy 2019-2023
4PUBLIC
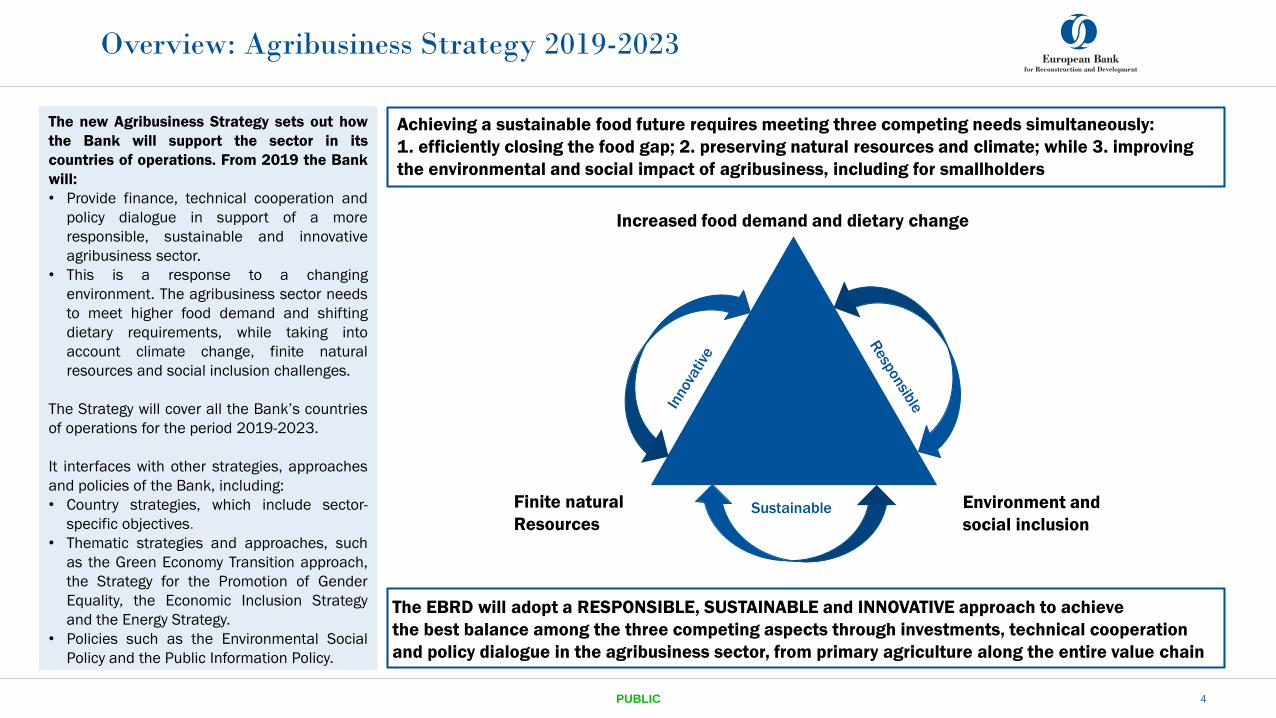
The new Agribusiness Strategy sets out how
the Bank will support the sector in its
countries of operations. From 2019 the Bank
will:
• Provide finance, technical cooperation and
policy dialogue in support of a more
responsible, sustainable and innovative
agribusiness sector.
• This is a response to a changing
environment. The agribusiness sector needs
to meet higher food demand and shifting
dietary requirements, while taking into
account climate change, finite natural
resources and social inclusion challenges.
The Strategy will cover all the Bank’s countries
of operations for the period 2019-2023.
It interfaces with other strategies, approaches
and policies of the Bank, including:
• Country strategies, which include sector-
specific objectives.
• Thematic strategies and approaches, such
as the Green Economy Transition approach,
the Strategy for the Promotion of Gender
Equality, the Economic Inclusion Strategy
and the Energy Strategy.
• Policies such as the Environmental Social
Policy and the Public Information Policy.
The EBRD will adopt a RESPONSIBLE, SUSTAINABLE and INNOVATIVE approach to achieve
the best balance among the three competing aspects through investments, technical cooperation
and policy dialogue in the agribusiness sector, from primary agriculture along the entire value chain
Increased food demand and dietary change
Environment and
social inclusion
Finite natural
ResourcesSustainable
Achieving a sustainable food future requires meeting three competing needs simultaneously:
1. efficiently closing the food gap; 2. preserving natural resources and climate; while 3. improving
the environmental and social impact of agribusiness, including for smallholders
PUBLIC 5
Implementation of the previous strategy – experience and lessons learned
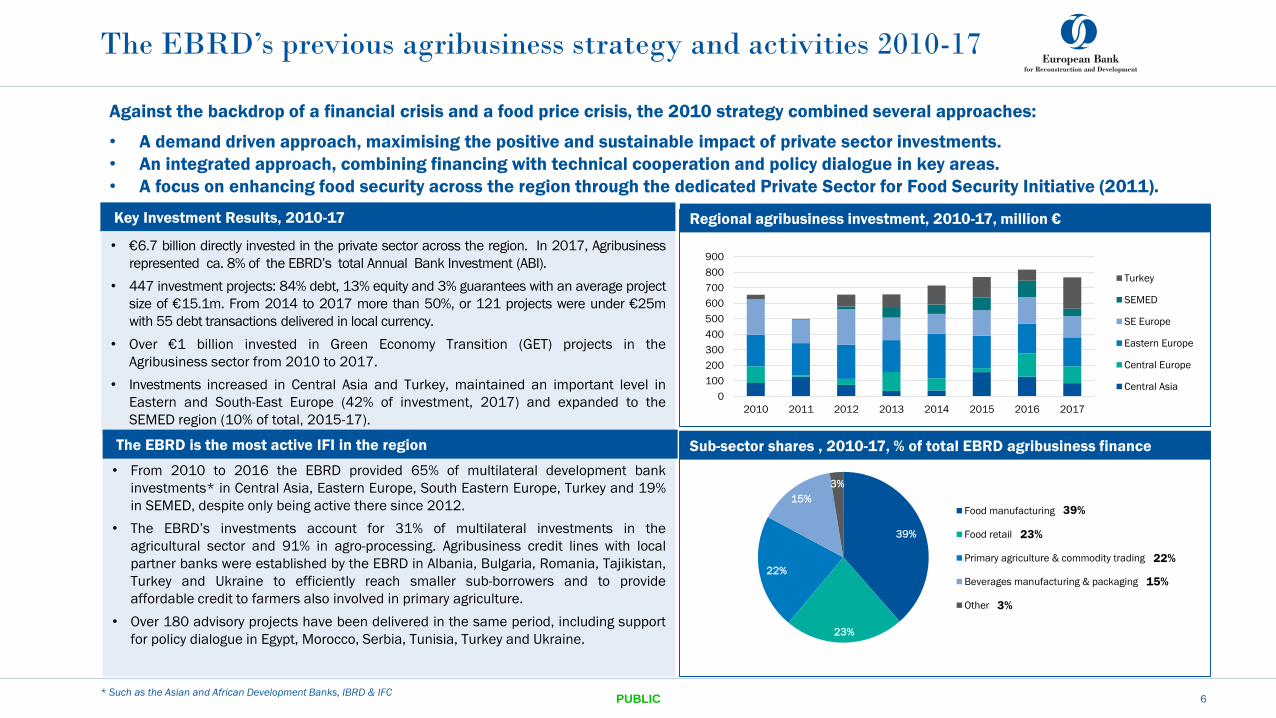
Against the backdrop of a financial crisis and a food price crisis, the 2010 strategy combined several approaches:
• A demand driven approach, maximising the positive and sustainable impact of private sector investments.
• An integrated approach, combining financing with technical cooperation and policy dialogue in key areas.
• A focus on enhancing food security across the region through the dedicated Private Sector for Food Security Initiative (2011).
PUBLIC 6
Key Investment Results, 2010-17
The EBRD’s previous agribusiness strategy and activities 2010-17
* Such as the Asian and African Development Banks, IBRD & IFC
• €6.7 billion directly invested in the private sector across the region. In 2017, Agribusiness
represented ca. 8% of the EBRD’s total Annual Bank Investment (ABI).
• 447 investment projects: 84% debt, 13% equity and 3% guarantees with an average project
size of €15.1m. From 2014 to 2017 more than 50%, or 121 projects were under €25m
with 55 debt transactions delivered in local currency.
• Over €1 billion invested in Green Economy Transition (GET) projects in the
Agribusiness sector from 2010 to 2017.
• Investments increased in Central Asia and Turkey, maintained an important level in
Eastern and South-East Europe (42% of investment, 2017) and expanded to the
SEMED region (10% of total, 2015-17).
• From 2010 to 2016 the EBRD provided 65% of multilateral development bank
investments* in Central Asia, Eastern Europe, South Eastern Europe, Turkey and 19%
in SEMED, despite only being active there since 2012.
• The EBRD’s investments account for 31% of multilateral investments in the
agricultural sector and 91% in agro-processing. Agribusiness credit lines with local
partner banks were established by the EBRD in Albania, Bulgaria, Romania, Tajikistan,
Turkey and Ukraine to efficiently reach smaller sub-borrowers and to provide
affordable credit to farmers also involved in primary agriculture.
• Over 180 advisory projects have been delivered in the same period, including support
for policy dialogue in Egypt, Morocco, Serbia, Tunisia, Turkey and Ukraine.
39%
23%
22%
15%
3%
Food manufacturing
Food retail
Primary agriculture & commodity trading
Beverages manufacturing & packaging
Other
0
100
200
300
400
500
600
700
800
900
2010 2011 2012 2013 2014 2015 2016 2017
Turkey
SEMED
SE Europe
Eastern Europe
Central Europe
Central Asia
Regional agribusiness investment, 2010-17, million €
Sub-sector shares , 2010-17, % of total EBRD agribusiness financeThe EBRD is the most active IFI in the region
39%
23%
22%
15%
3%
PUBLIC 7
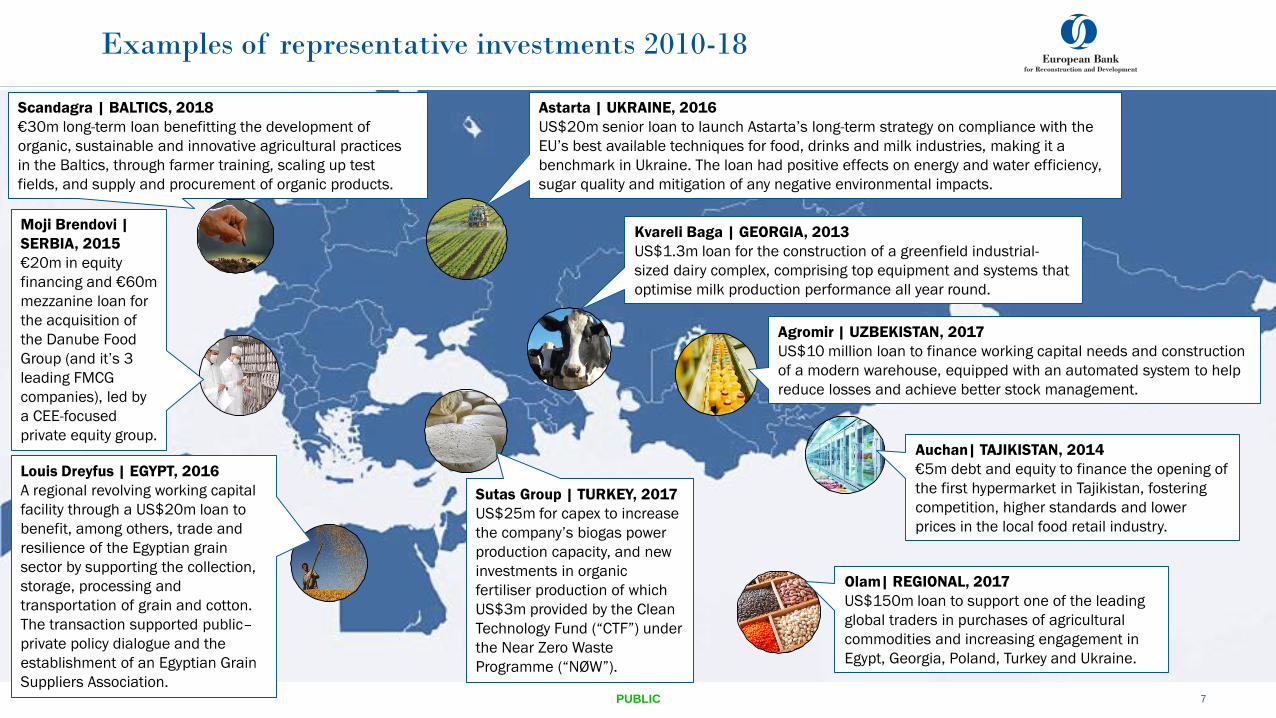
Astarta | UKRAINE, 2016
US$20m senior loan to launch Astarta’s long-term strategy on compliance with the
EU’s best available techniques for food, drinks and milk industries, making it a
benchmark in Ukraine. The loan had positive effects on energy and water efficiency,
sugar quality and mitigation of any negative environmental impacts.
Kvareli Baga | GEORGIA, 2013
US$1.3m loan for the construction of a greenfield industrial-
sized dairy complex, comprising top equipment and systems that
optimise milk production performance all year round.
Louis Dreyfus | EGYPT, 2016
A regional revolving working capital
facility through a US$20m loan to
benefit, among others, trade and
resilience of the Egyptian grain
sector by supporting the collection,
storage, processing and
transportation of grain and cotton.
The transaction supported public–
private policy dialogue and the
establishment of an Egyptian Grain
Suppliers Association.
Moji Brendovi |
SERBIA, 2015
€20m in equity
financing and €60m
mezzanine loan for
the acquisition of
the Danube Food
Group (and it’s 3
leading FMCG
companies), led by
a CEE-focused
private equity group.
Sutas Group | TURKEY, 2017
US$25m for capex to increase
the company’s biogas power
production capacity, and new
investments in organic
fertiliser production of which
US$3m provided by the Clean
Technology Fund (“CTF”) under
the Near Zero Waste
Programme (“NØW”).
Auchan| TAJIKISTAN, 2014
€5m debt and equity to finance the opening of
the first hypermarket in Tajikistan, fostering
competition, higher standards and lower
prices in the local food retail industry.
Examples of representative investments 2010-18
Agromir | UZBEKISTAN, 2017
US$10 million loan to finance working capital needs and construction
of a modern warehouse, equipped with an automated system to help
reduce losses and achieve better stock management.
Scandagra | BALTICS, 2018
€30m long-term loan benefitting the development of
organic, sustainable and innovative agricultural practices
in the Baltics, through farmer training, scaling up test
fields, and supply and procurement of organic products.
Olam| REGIONAL, 2017
US$150m loan to support one of the leading
global traders in purchases of agricultural
commodities and increasing engagement in
Egypt, Georgia, Poland, Turkey and Ukraine.
PUBLIC 8
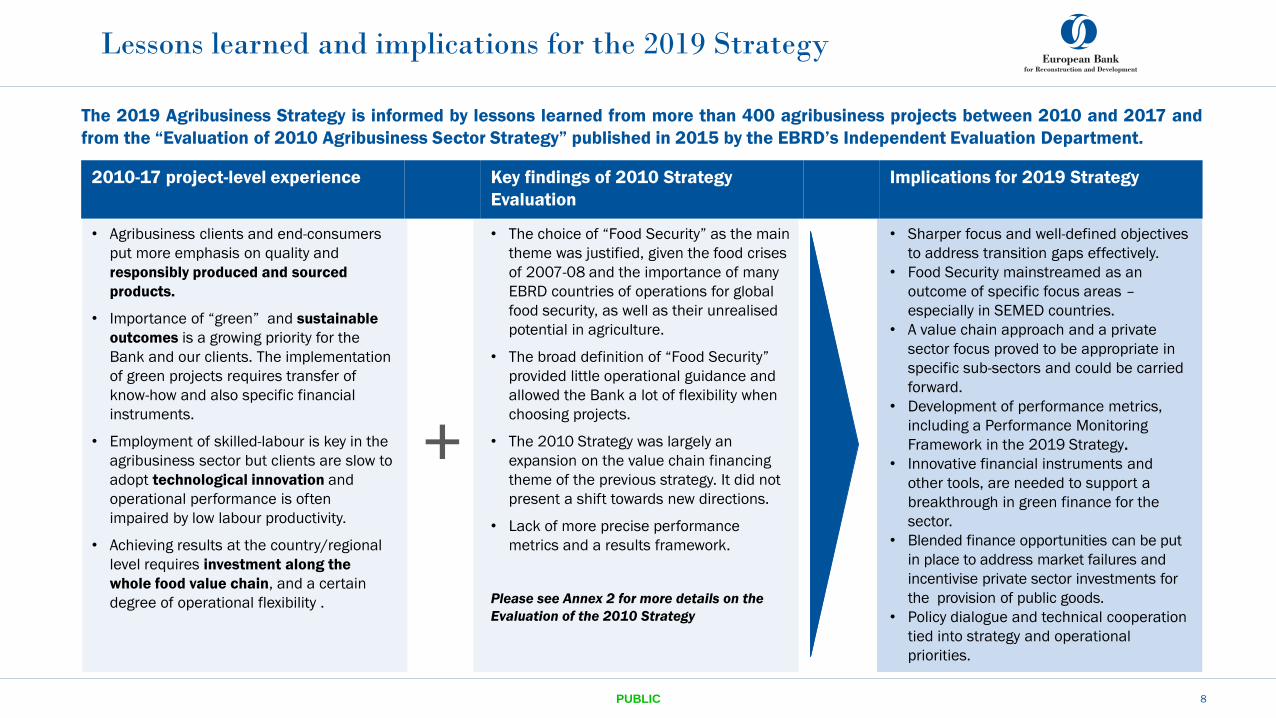
The 2019 Agribusiness Strategy is informed by lessons learned from more than 400 agribusiness projects between 2010 and 2017 and
from the “Evaluation of 2010 Agribusiness Sector Strategy” published in 2015 by the EBRD’s Independent Evaluation Department.
Lessons learned and implications for the 2019 Strategy
2010-17 project-level experience Key findings of 2010 Strategy
Evaluation
Implications for 2019 Strategy
• Agribusiness clients and end-consumers
put more emphasis on quality and
responsibly produced and sourced
products.
• Importance of “green” and sustainable
outcomes is a growing priority for the
Bank and our clients. The implementation
of green projects requires transfer of
know-how and also specific financial
instruments.
• Employment of skilled-labour is key in the
agribusiness sector but clients are slow to
adopt technological innovation and
operational performance is often
impaired by low labour productivity.
• Achieving results at the country/regional
level requires investment along the
whole food value chain, and a certain
degree of operational flexibility .
+
• The choice of “Food Security” as the main
theme was justified, given the food crises
of 2007-08 and the importance of many
EBRD countries of operations for global
food security, as well as their unrealised
potential in agriculture.
• The broad definition of “Food Security”
provided little operational guidance and
allowed the Bank a lot of flexibility when
choosing projects.
• The 2010 Strategy was largely an
expansion on the value chain financing
theme of the previous strategy. It did not
present a shift towards new directions.
• Lack of more precise performance
metrics and a results framework.
Please see Annex 2 for more details on the
Evaluation of the 2010 Strategy
• Sharper focus and well-defined objectives
to address transition gaps effectively.
• Food Security mainstreamed as an
outcome of specific focus areas –
especially in SEMED countries.
• A value chain approach and a private
sector focus proved to be appropriate in
specific sub-sectors and could be carried
forward.
• Development of performance metrics,
including a Performance Monitoring
Framework in the 2019 Strategy.
• Innovative financial instruments and
other tools, are needed to support a
breakthrough in green finance for the
sector.
• Blended finance opportunities can be put
in place to address market failures and
incentivise private sector investments for
the provision of public goods.
• Policy dialogue and technical cooperation
tied into strategy and operational
priorities.
PUBLIC 9
Sector context and transition challenges
1. Sector context and transition challenges: Increased demand for food and
dietary changes
10
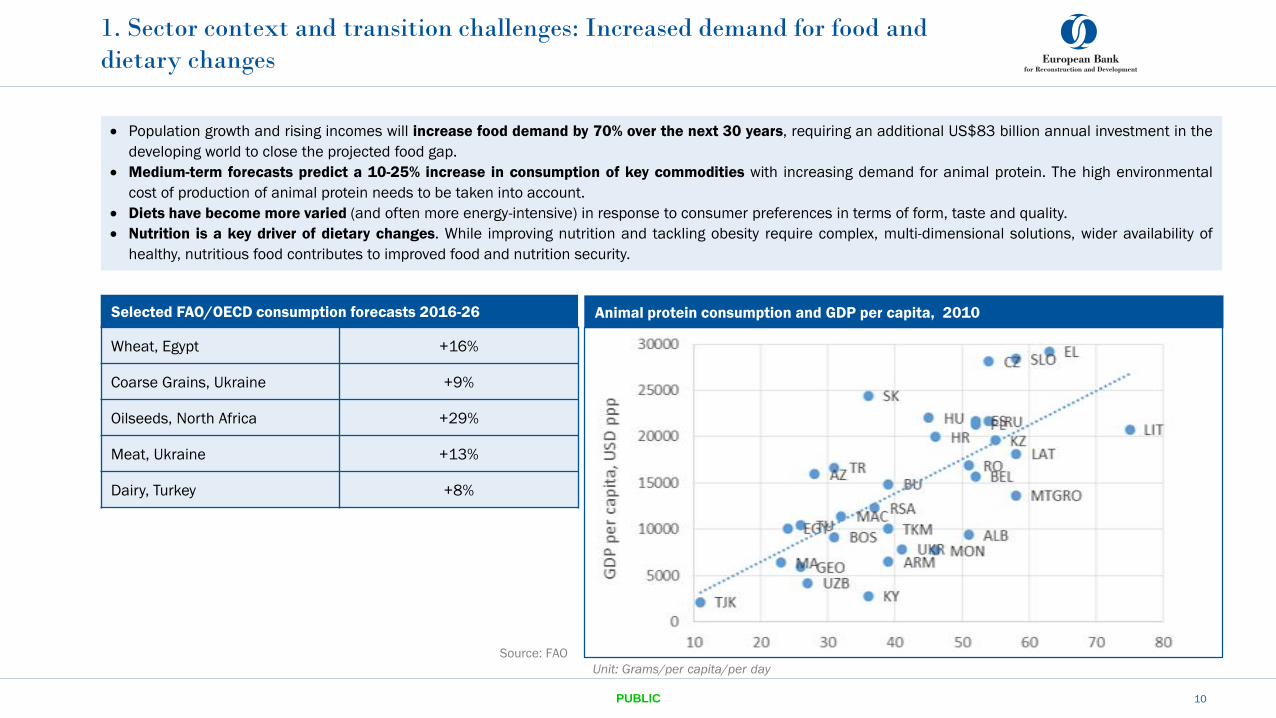
Population growth and rising incomes will increase food demand by 70% over the next 30 years, requiring an additional US$83 billion annual investment in the
developing world to close the projected food gap.
Medium-term forecasts predict a 10-25% increase in consumption of key commodities with increasing demand for animal protein. The high environmental
cost of production of animal protein needs to be taken into account.
Diets have become more varied (and often more energy-intensive) in response to consumer preferences in terms of form, taste and quality.
Nutrition is a key driver of dietary changes. While improving nutrition and tackling obesity require complex, multi-dimensional solutions, wider availability of
healthy, nutritious food contributes to improved food and nutrition security.
Wheat, Egypt +16%
Coarse Grains, Ukraine +9%
Oilseeds, North Africa +29%
Meat, Ukraine +13%
Dairy, Turkey +8%
Source: FAO
Animal protein consumption and GDP per capita, 2010Selected FAO/OECD consumption forecasts 2016-26
Unit: Grams/per capita/per day
PUBLIC
2. Sector context and transition challenges: Trade polarisation
11
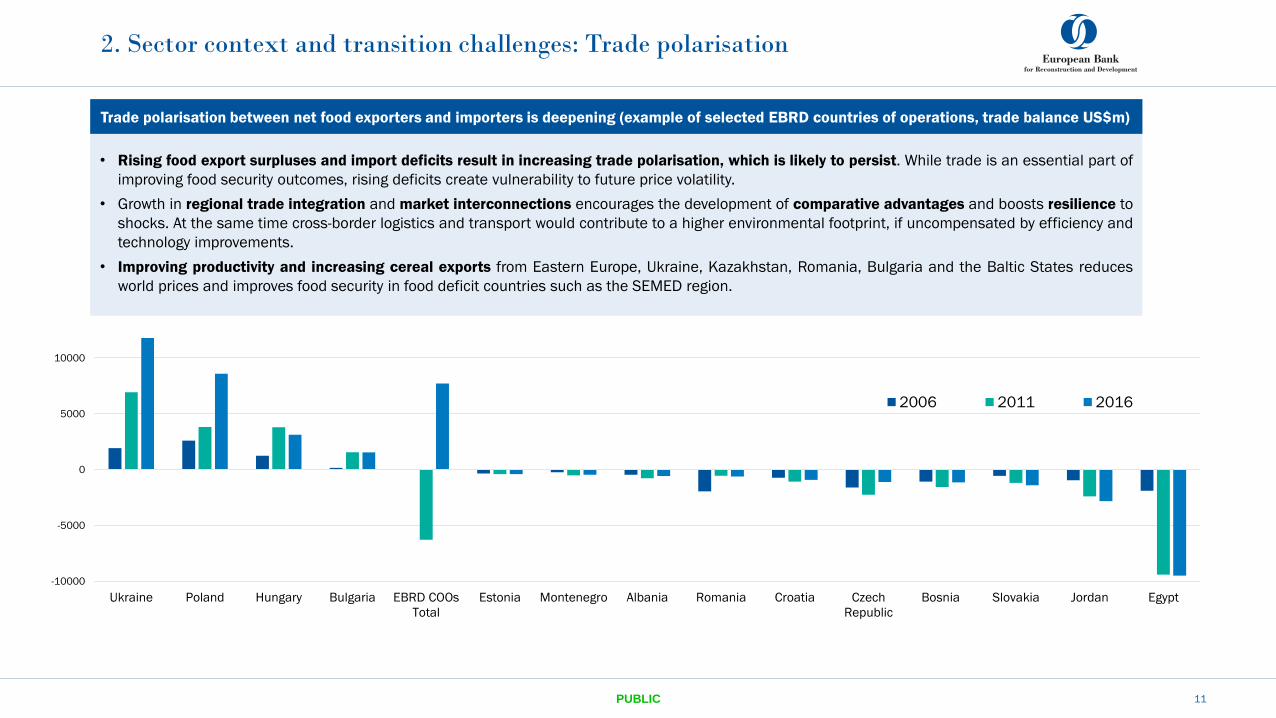
-10000
-5000
0
5000
10000
Ukraine Poland Hungary Bulgaria EBRD COOs
Total
Estonia Montenegro Albania Romania Croatia Czech
Republic
Bosnia Slovakia Jordan Egypt
2006 2011 2016
• Rising food export surpluses and import deficits result in increasing trade polarisation, which is likely to persist. While trade is an essential part of
improving food security outcomes, rising deficits create vulnerability to future price volatility.
• Growth in regional trade integration and market interconnections encourages the development of comparative advantages and boosts resilience to
shocks. At the same time cross-border logistics and transport would contribute to a higher environmental footprint, if uncompensated by efficiency and
technology improvements.
• Improving productivity and increasing cereal exports from Eastern Europe, Ukraine, Kazakhstan, Romania, Bulgaria and the Baltic States reduces
world prices and improves food security in food deficit countries such as the SEMED region.
Trade polarisation between net food exporters and importers is deepening (example of selected EBRD countries of operations, trade balance US$m)
PUBLIC
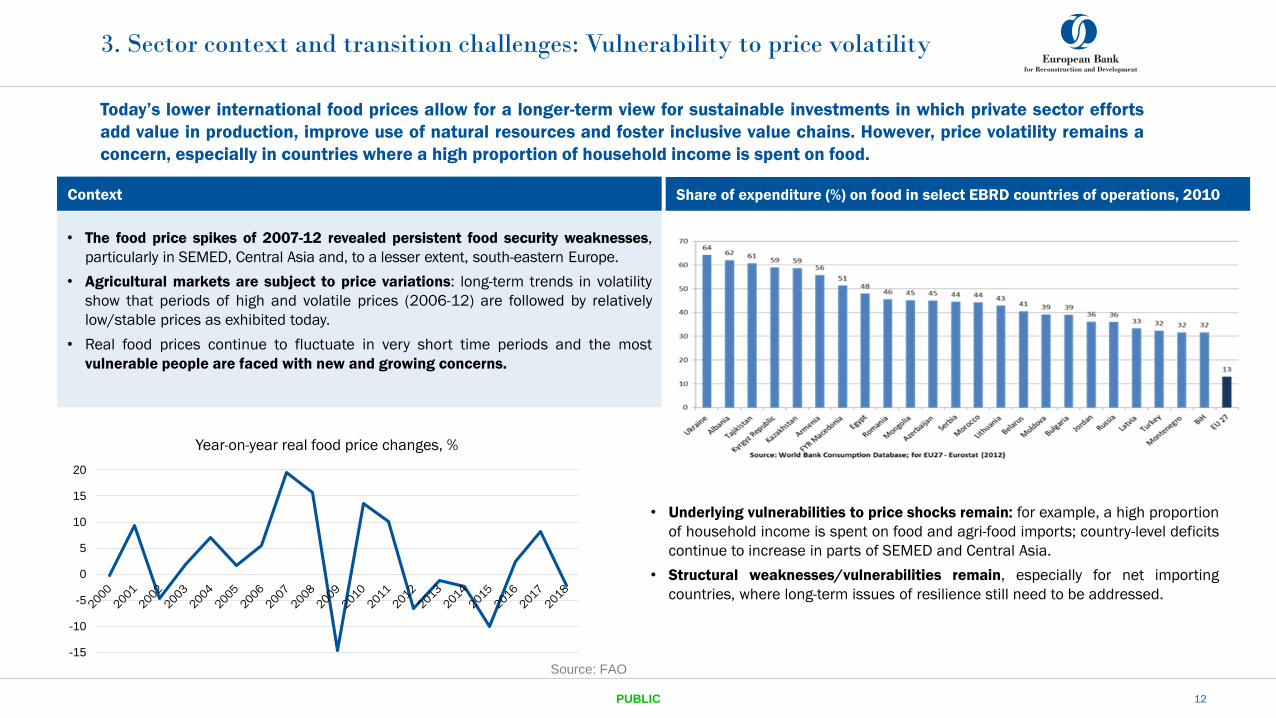
-15
-10
-5
0
5
10
15
20
Year-on-year real food price changes, %
3. Sector context and transition challenges: Vulnerability to price volatility
12
Context
Today’s lower international food prices allow for a longer-term view for sustainable investments in which private sector efforts
add value in production, improve use of natural resources and foster inclusive value chains. However, price volatility remains a
concern, especially in countries where a high proportion of household income is spent on food.
Source: FAO
• The food price spikes of 2007-12 revealed persistent food security weaknesses,
particularly in SEMED, Central Asia and, to a lesser extent, south-eastern Europe.
• Agricultural markets are subject to price variations: long-term trends in volatility
show that periods of high and volatile prices (2006-12) are followed by relatively
low/stable prices as exhibited today.
• Real food prices continue to fluctuate in very short time periods and the most
vulnerable people are faced with new and growing concerns.
Share of expenditure (%) on food in select EBRD countries of operations, 2010
• Underlying vulnerabilities to price shocks remain: for example, a high proportion
of household income is spent on food and agri-food imports; country-level deficits
continue to increase in parts of SEMED and Central Asia.
• Structural weaknesses/vulnerabilities remain, especially for net importing
countries, where long-term issues of resilience still need to be addressed.
PUBLIC
4. Sector context and transition challenges: Finite natural resources and
climate change
13
Food systems depend on natural resources such as land and water. The
agricultural production and output availability are influenced by weather and
climate. The sector is very vulnerable to climate change risks and the region
may be subject to adverse impacts:
• Greater water stress, intensity and recurrence of floods/droughts.
• Reduction in crop yields, greater output variability, including increased livestock
vulnerability.
• Reduction in available agricultural land in the SEMED region.
These may lead to reduction in the affordability of food and/or increased
volatility of food prices, particularly in low-income and food-importing countries.
• The agribusiness sector accounts for 30% of total energy use and over 20% of
greenhouse gas emissions. Without any mitigation, agricultural greenhouse gas
emissions are expected to rise to 30% by 2050.
• An estimated 14.5% of GHG emissions are due to livestock production.
Switching to more resource-efficient production and technologies, for example,
by improving feed conversion efficiency, can reduce emissions by up to 30%.
• An estimated 60% of global terrestrial biodiversity loss is related to food
production. An estimated 33% of soils are degraded due to erosion, nutrient
depletion, acidification, salinisation, compaction and chemical pollution.
• There is inefficient resource use (including water, energy and waste
management) and limited standards and traceability along the production chain
alongside limited private sector capacity to measure, address and mitigate
environmental and social risks.
Limited natural resources and climate change have a deep and varied impact
across the region
At the same time agricultural systems contribute to climate change and they
have a large impact on natural resource use:
Albania Armenia
Azerbaijan
Belarus
Egypt, Arab Rep
Greece Hungary
Jordan
Kazakhstan
Kyrgyz Rep Latvia
Mongolia
Morocco
Poland
Romania
Ukraine
Uzbekistan
-
5
10
15
20
25
30
35
- 10,000 20,000 30,000 40,000
Ag
ric
ult
ura
l E
mis
sio
ns
(C
O2
e
qu
iva
len
t, m
illi
on
to
ns
)
Agricultural GVA (millions, constant 2010 US Dollar)
2016 Agricultural Gross Value Added vs. Agricultural Emissions, Selected EBRD countries of operations
Source: World Bank for Agricultural GVA, FAOSTAT for emissionsPUBLIC
00.5
11.5
22.5
33.5
4
Isra
el
U.S
.
Slo
ve
nia
Cze
ch
R.
Hu
nga
ry
Bu
lga
ria
Esto
nia
Tu
rke
y
Po
lan
d
Cro
ati
a
Uk
rain
e
Be
laru
s
Slo
va
kia
Lit
hu
an
ia
Se
rbia
Ro
ma
nia
Mo
rocco
La
tvia
Mo
nte
ne
gro
Tu
nis
ia
Mo
ldo
va
Cyp
rus
Bo
sn
ia
Ka
zak
hsta
n
Egyp
t
Kyr
gyz
sta
n
Mo
ngo
lia
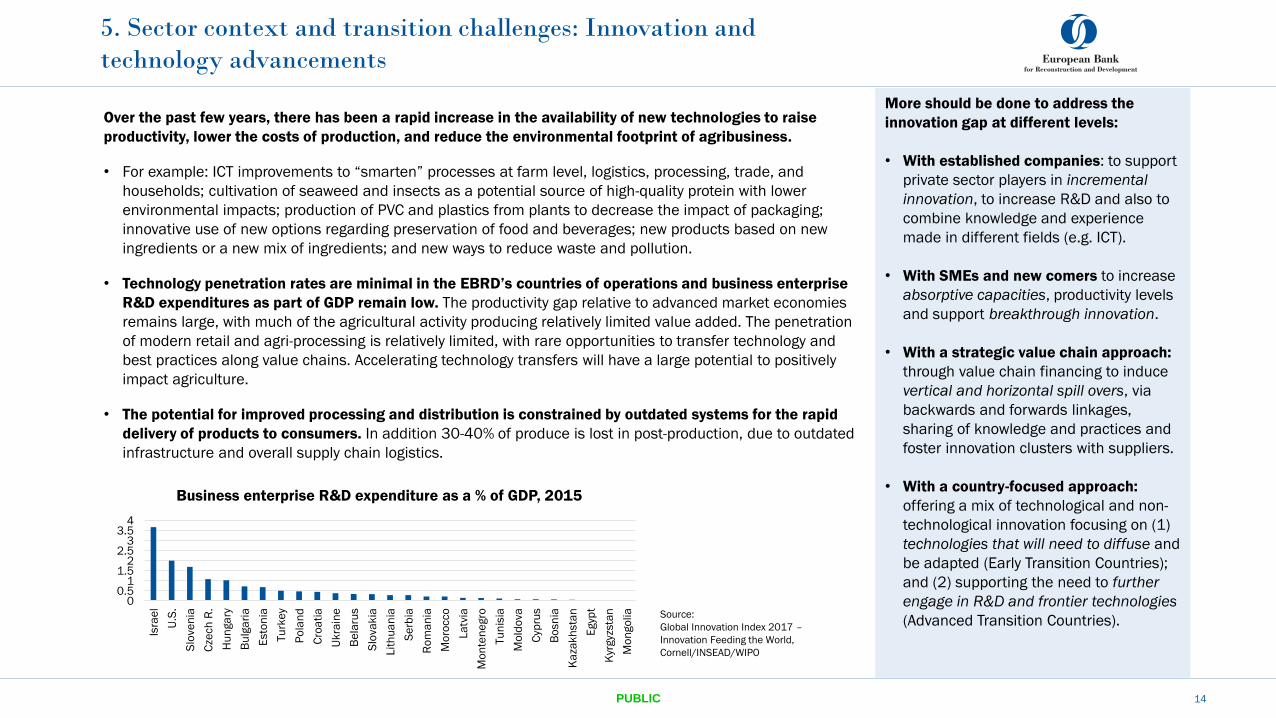
Business enterprise R&D expenditure as a % of GDP, 2015
5. Sector context and transition challenges: Innovation and
technology advancements
14
Over the past few years, there has been a rapid increase in the availability of new technologies to raise
productivity, lower the costs of production, and reduce the environmental footprint of agribusiness.
• For example: ICT improvements to “smarten” processes at farm level, logistics, processing, trade, and
households; cultivation of seaweed and insects as a potential source of high-quality protein with lower
environmental impacts; production of PVC and plastics from plants to decrease the impact of packaging;
innovative use of new options regarding preservation of food and beverages; new products based on new
ingredients or a new mix of ingredients; and new ways to reduce waste and pollution.
• Technology penetration rates are minimal in the EBRD’s countries of operations and business enterprise
R&D expenditures as part of GDP remain low. The productivity gap relative to advanced market economies
remains large, with much of the agricultural activity producing relatively limited value added. The penetration
of modern retail and agri-processing is relatively limited, with rare opportunities to transfer technology and
best practices along value chains. Accelerating technology transfers will have a large potential to positively
impact agriculture.
• The potential for improved processing and distribution is constrained by outdated systems for the rapid
delivery of products to consumers. In addition 30-40% of produce is lost in post-production, due to outdated
infrastructure and overall supply chain logistics.
Source:
Global Innovation Index 2017 –
Innovation Feeding the World,
Cornell/INSEAD/WIPO
More should be done to address the
innovation gap at different levels:
• With established companies: to support
private sector players in incremental
innovation, to increase R&D and also to
combine knowledge and experience
made in different fields (e.g. ICT).
• With SMEs and new comers to increase
absorptive capacities, productivity levels
and support breakthrough innovation.
• With a strategic value chain approach:
through value chain financing to induce
vertical and horizontal spill overs, via
backwards and forwards linkages,
sharing of knowledge and practices and
foster innovation clusters with suppliers.
• With a country-focused approach:
offering a mix of technological and non-
technological innovation focusing on (1)
technologies that will need to diffuse and
be adapted (Early Transition Countries);
and (2) supporting the need to further
engage in R&D and frontier technologies
(Advanced Transition Countries).
PUBLIC
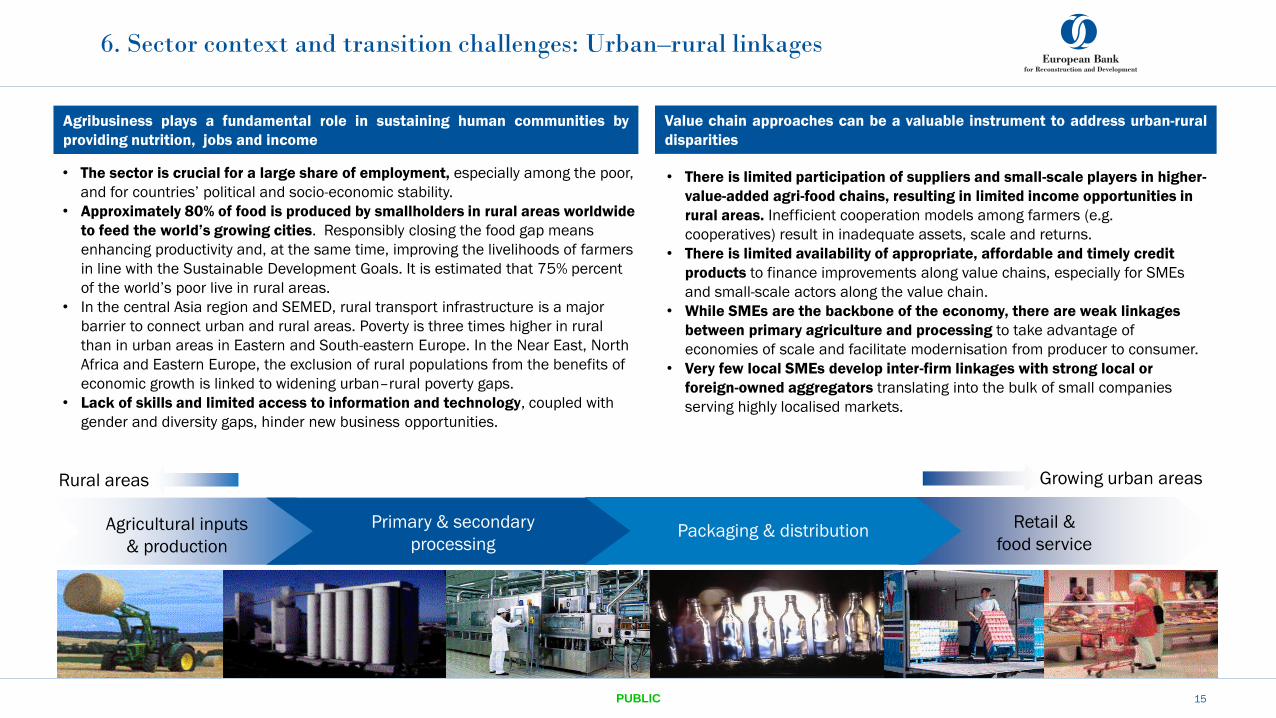
Agricultural inputs
& production
Primary & secondary
processingPackaging & distribution
Retail &
food service
Growing urban areasRural areas
• The sector is crucial for a large share of employment, especially among the poor,
and for countries’ political and socio-economic stability.
• Approximately 80% of food is produced by smallholders in rural areas worldwide
to feed the world’s growing cities. Responsibly closing the food gap means
enhancing productivity and, at the same time, improving the livelihoods of farmers
in line with the Sustainable Development Goals. It is estimated that 75% percent
of the world’s poor live in rural areas.
• In the central Asia region and SEMED, rural transport infrastructure is a major
barrier to connect urban and rural areas. Poverty is three times higher in rural
than in urban areas in Eastern and South-eastern Europe. In the Near East, North
Africa and Eastern Europe, the exclusion of rural populations from the benefits of
economic growth is linked to widening urban–rural poverty gaps.
• Lack of skills and limited access to information and technology, coupled with
gender and diversity gaps, hinder new business opportunities.
6. Sector context and transition challenges: Urban–rural linkages
15
• There is limited participation of suppliers and small-scale players in higher-
value-added agri-food chains, resulting in limited income opportunities in
rural areas. Inefficient cooperation models among farmers (e.g.
cooperatives) result in inadequate assets, scale and returns.
• There is limited availability of appropriate, affordable and timely credit
products to finance improvements along value chains, especially for SMEs
and small-scale actors along the value chain.
• While SMEs are the backbone of the economy, there are weak linkages
between primary agriculture and processing to take advantage of
economies of scale and facilitate modernisation from producer to consumer.
• Very few local SMEs develop inter-firm linkages with strong local or
foreign-owned aggregators translating into the bulk of small companies
serving highly localised markets.
Agribusiness plays a fundamental role in sustaining human communities by
providing nutrition, jobs and income
Value chain approaches can be a valuable instrument to address urban-rural
disparities
PUBLIC
Sector context and transition challenges: Key transition challenges*
16
Note: Depending on subsector and project context, a specific challenge or intervention may be attributable to different qualities
* For further details on transition qualities please visit : http://www.ebrd.com/our-values/transition.html
Competitive
Enhanced productivity: The major challenge for the agribusiness sector will be to produce more with less; meeting consumer demand for healthy, affordable food, both in domestic and
export markets, in a context of limited resources. In order to achieve higher productivity and added value, investments supporting innovation, product quality and safety and standards
are required. In this context, strong value chains can create linkages between different parties, promoting improvements in efficiency, product quality, raising skills and standards along
the agribusiness supply chain.
Liberalised markets: Agribusiness includes sub-sectors that are highly protected, including through tariffs, lack of market orientation and government control or influence. Open
agribusiness markets stimulate innovation and promote productivity improvements, pushing costs down and increasing added value. Technology together with greater exposure to
national and international competition can also play a role in encouraging higher added value output.
Well-governedFirm’s governance: Poor corporate level governance is a major impediment to the competitiveness of agribusiness companies and private sector investment. Corporate governance
improvements in line with international best practices increase transparency and unlock revenue generation potential. Well-governed companies employ rules and practices that balance
the interests of stakeholders, provide proper internal controls and disclosure and display high standards of integrity and sound and ethical environmental and social practices.
Resilient
Price volatility: The food price spikes of 2007 and 2011-12 revealed the fragile agribusiness sector resilience of many countries, exacerbated by the high levels of income spent on
food. A resilient agribusiness sector has markets and institutions that are better able to resist the price, economic and production shocks that can negatively impact on food security.
Access to finance: Access to finance, in particular to small and medium sized enterprises operating in agriculture, is often problematic given the sector’s specific risks and needs.
Promoting access to finance, including long-term working capital needs, pre-financing and collateralisation options, is necessary to ensure a resilient agribusiness sector.
Integrated
Cross-border trade and improved connectivity: A poorly integrated agribusiness sector lacks an adequate transport and logistics infrastructure; policies to support trade and the
capacity to realise comparative advantages, to export added value production and to access needed capital. Inadequacies in port and trade infrastructure can impede sectoral
development and create higher consumer prices, particularly in food-deficit regions. Supporting intra and inter country integration through infrastructure investments, open trade and FDI
can result in lower costs and better quality in product and service markets.
Inclusive
Equal opportunities along the value chain: Economic and employment opportunities are not equal for all players along agribusiness value chains. Given that the agri-food sector plays a
large role in employment in most EBRD countries of operations, it offers huge opportunities to strengthen value chain linkages (for example, between primary agriculture and agro-
processing) and to enhance employment, entrepreneurship and skills, in particular for women, youth and remote regions, for instance by collaborating with education providers and
agribusiness companies.
Green
Sustainable agribusiness: Climate change will have a significant impact on the agribusiness sector, as the sector is both a large contributor of GHG emissions and is significantly
affected by extreme weather conditions. In order to address these challenges, improvements in productivity and resource use efficiency should be encouraged, together with the uptake
of new technology and innovation; and ultimately contributing to mitigating and adapting to the impact of climate change. A more circular economy can promote sustainable resource
use, reducing waste and costs, while developing new income streams and sub-sectors.
PUBLIC
PUBLIC 17
Proposed strategic directions – focus areas
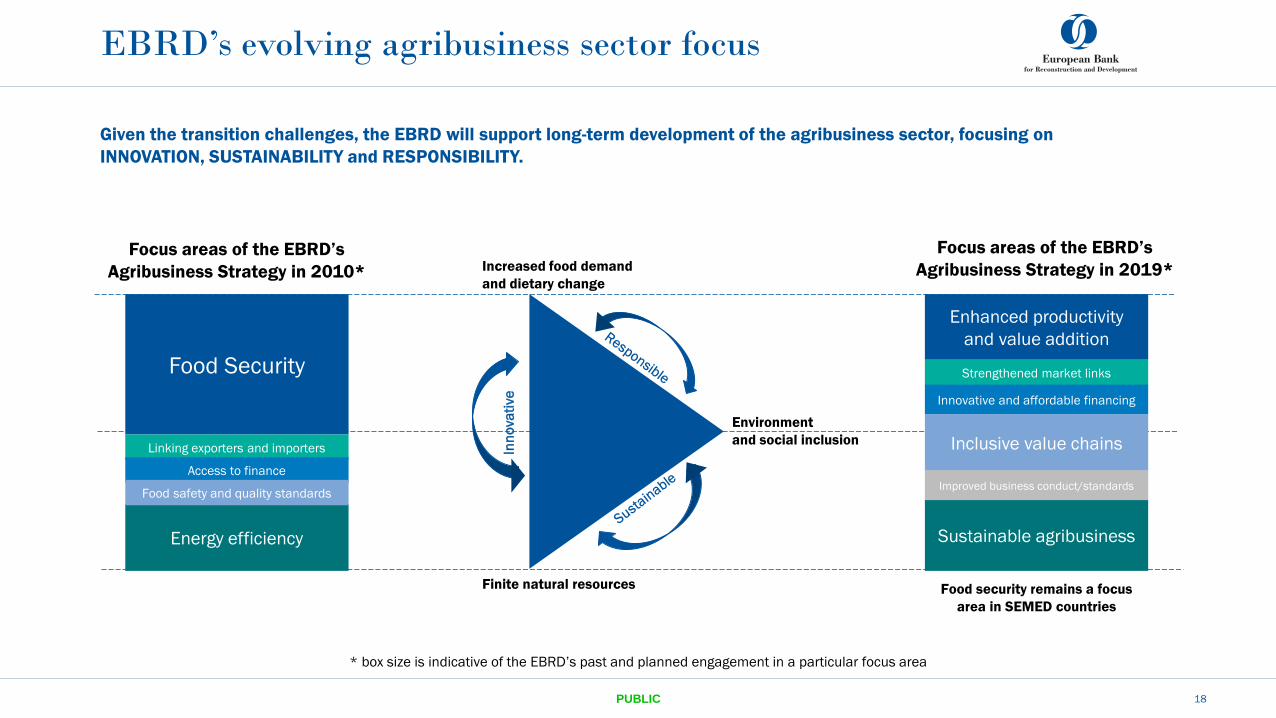
EBRD’s evolving agribusiness sector focus
PUBLIC 18
Increased food demand
and dietary change
Finite natural resources
Environment
and social inclusion
Focus areas of the EBRD’s
Agribusiness Strategy in 2010*
Focus areas of the EBRD’s
Agribusiness Strategy in 2019*
Food Security
Linking exporters and importers
Energy efficiency
Access to finance
Food safety and quality standards
Sustainable agribusiness
Enhanced productivity
and value addition
Strengthened market links
Innovative and affordable financing
Inclusive value chains
Given the transition challenges, the EBRD will support long-term development of the agribusiness sector, focusing on
INNOVATION, SUSTAINABILITY and RESPONSIBILITY.
Improved business conduct/standards
Inn
ova
tive
* box size is indicative of the EBRD’s past and planned engagement in a particular focus area
Food security remains a focus
area in SEMED countries
19PUBLIC
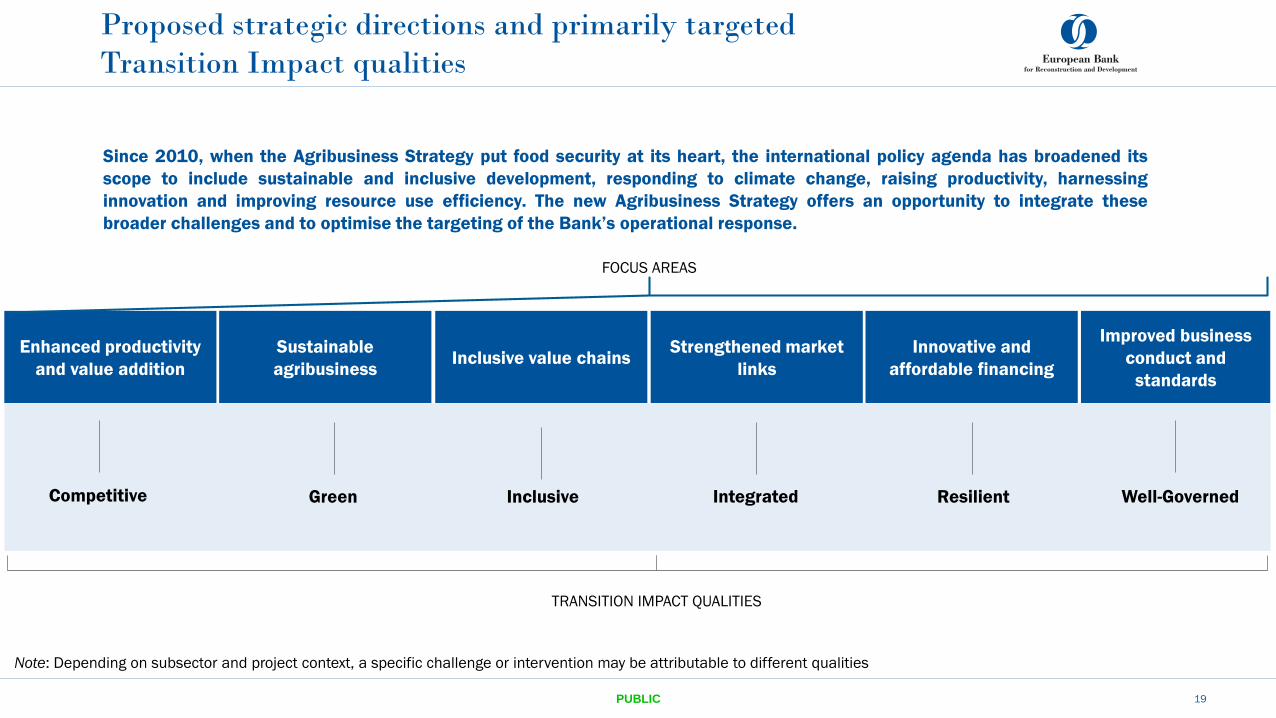
Since 2010, when the Agribusiness Strategy put food security at its heart, the international policy agenda has broadened its
scope to include sustainable and inclusive development, responding to climate change, raising productivity, harnessing
innovation and improving resource use efficiency. The new Agribusiness Strategy offers an opportunity to integrate these
broader challenges and to optimise the targeting of the Bank’s operational response.
Enhanced productivity
and value addition
Sustainable
agribusinessInclusive value chains
Strengthened market
links
Innovative and
affordable financing
Competitive Green Inclusive Integrated Resilient
Improved business
conduct and
standards
Well-Governed
Proposed strategic directions and primarily targeted
Transition Impact qualities
Note: Depending on subsector and project context, a specific challenge or intervention may be attributable to different qualities
FOCUS AREAS
TRANSITION IMPACT QUALITIES
20PUBLIC
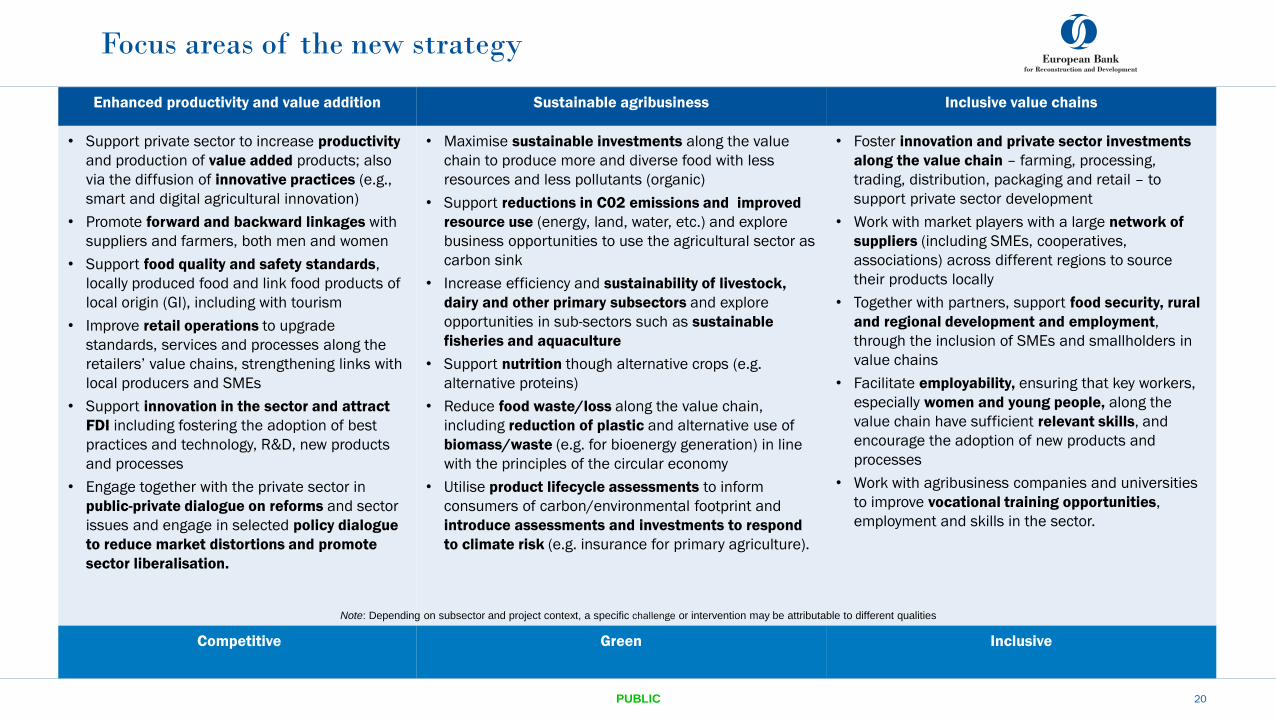
Enhanced productivity and value addition Sustainable agribusiness Inclusive value chains
• Support private sector to increase productivity
and production of value added products; also
via the diffusion of innovative practices (e.g.,
smart and digital agricultural innovation)
• Promote forward and backward linkages with
suppliers and farmers, both men and women
• Support food quality and safety standards,
locally produced food and link food products of
local origin (GI), including with tourism
• Improve retail operations to upgrade
standards, services and processes along the
retailers’ value chains, strengthening links with
local producers and SMEs
• Support innovation in the sector and attract
FDI including fostering the adoption of best
practices and technology, R&D, new products
and processes
• Engage together with the private sector in
public-private dialogue on reforms and sector
issues and engage in selected policy dialogue
to reduce market distortions and promote
sector liberalisation.
• Maximise sustainable investments along the value
chain to produce more and diverse food with less
resources and less pollutants (organic)
• Support reductions in C02 emissions and improved
resource use (energy, land, water, etc.) and explore
business opportunities to use the agricultural sector as
carbon sink
• Increase efficiency and sustainability of livestock,
dairy and other primary subsectors and explore
opportunities in sub-sectors such as sustainable
fisheries and aquaculture
• Support nutrition though alternative crops (e.g.
alternative proteins)
• Reduce food waste/loss along the value chain,
including reduction of plastic and alternative use of
biomass/waste (e.g. for bioenergy generation) in line
with the principles of the circular economy
• Utilise product lifecycle assessments to inform
consumers of carbon/environmental footprint and
introduce assessments and investments to respond
to climate risk (e.g. insurance for primary agriculture).
• Foster innovation and private sector investments
along the value chain – farming, processing,
trading, distribution, packaging and retail – to
support private sector development
• Work with market players with a large network of
suppliers (including SMEs, cooperatives,
associations) across different regions to source
their products locally
• Together with partners, support food security, rural
and regional development and employment,
through the inclusion of SMEs and smallholders in
value chains
• Facilitate employability, ensuring that key workers,
especially women and young people, along the
value chain have sufficient relevant skills, and
encourage the adoption of new products and
processes
• Work with agribusiness companies and universities
to improve vocational training opportunities,
employment and skills in the sector.
Competitive Green Inclusive
Focus areas of the new strategy
Note: Depending on subsector and project context, a specific challenge or intervention may be attributable to different qualities
21PUBLIC
Strengthened market links Innovative and affordable financing Improved business conduct and standards
• Support value chain integration and
internationalisation for companies with cross-
border operations
• Support value added exports and SMEs along
the value chains with innovative products to
improve standards and support SMEs
integration in higher value added food chains
• Improve agribusiness trade infrastructure for
both domestic and international markets and
optimise infrastructure solutions to reduce key
agribusiness infrastructure gaps
• Improve distribution and logistics segments of
agri-food value chains and minimise
environmental impact across value chains
• Help accelerate technology transfers across
EBRD countries of operations to support
innovation convergence regionally -also by
establishing clusters and facilitating university-
industry interactions.
• Support local companies and transactions to develop
local capital markets (debt and equity)
• Increase access to finance, especially for capex
investments, while supporting working capital needs,
and provide tailored finance including in local currency
• Support pre-financing and collateralisation options
for agribusiness products
• Provide risk management and finance trade
facilitation products and develop risk sharing facilities
to reach smaller actors involved in primary agriculture
• Provide acquisition finance and private equity
investments. Help increase entrepreneurship and
venture capital approaches in agribusiness
• Promote innovative direct and indirect financing
mechanisms (e.g. guarantees, sustainable impact
lending) targeting SMEs and larger companies
• Engage in selected sovereign lending in the
agricultural sector to support public investments that
crowd in productive private investments (e.g. water
management, infrastructure, biodiversity).
• Improve corporate governance, HR, labour, equal
opportunities, business standards and conduct at
company level in line with the Principle For
Responsible Agricultural Investments (RAIs)
• Promote animal welfare standards in line with
national regulatory requirements, relevant EU
animal welfare standards and good international
standards (GIP), as per the EBRD Environmental
and Social Policy
• Promote voluntary and/or public labels protecting
origin, local culture and biodiversity
• Increase reporting on sustainability in line with
best available practices including climate risk
assessments and disclosure
• Foster collaborative approaches to induce a better
governance in the sector by working with industry
representatives (associations, main private sector
market players) and the relevant government
authorities.
Integrated Resilient Well-governed
Focus areas of the new strategy
Note: Depending on subsector and project context, a specific challenge or intervention may be attributable to different qualities
Central
Eastern EuropeSEMED Western Balkans Turkey
Armenia, Azerbaijan,
Belarus, Georgia,
Moldova, Ukraine
Central Asia
(incl. Mongolia)
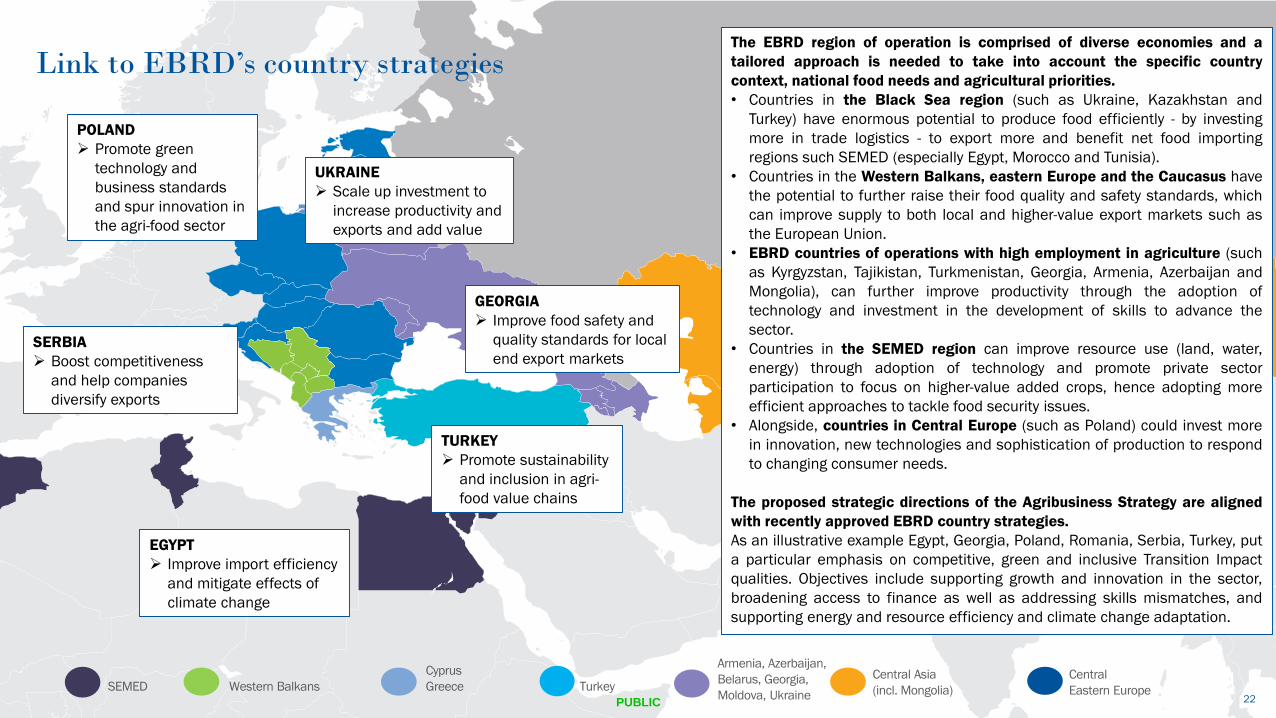
Link to EBRD’s country strategies
Cyprus
Greece22PUBLIC
The EBRD region of operation is comprised of diverse economies and a
tailored approach is needed to take into account the specific country
context, national food needs and agricultural priorities.
• Countries in the Black Sea region (such as Ukraine, Kazakhstan and
Turkey) have enormous potential to produce food efficiently - by investing
more in trade logistics - to export more and benefit net food importing
regions such SEMED (especially Egypt, Morocco and Tunisia).
• Countries in the Western Balkans, eastern Europe and the Caucasus have
the potential to further raise their food quality and safety standards, which
can improve supply to both local and higher-value export markets such as
the European Union.
• EBRD countries of operations with high employment in agriculture (such
as Kyrgyzstan, Tajikistan, Turkmenistan, Georgia, Armenia, Azerbaijan and
Mongolia), can further improve productivity through the adoption of
technology and investment in the development of skills to advance the
sector.
• Countries in the SEMED region can improve resource use (land, water,
energy) through adoption of technology and promote private sector
participation to focus on higher-value added crops, hence adopting more
efficient approaches to tackle food security issues.
• Alongside, countries in Central Europe (such as Poland) could invest more
in innovation, new technologies and sophistication of production to respond
to changing consumer needs.
The proposed strategic directions of the Agribusiness Strategy are aligned
with recently approved EBRD country strategies.
As an illustrative example Egypt, Georgia, Poland, Romania, Serbia, Turkey, put
a particular emphasis on competitive, green and inclusive Transition Impact
qualities. Objectives include supporting growth and innovation in the sector,
broadening access to finance as well as addressing skills mismatches, and
supporting energy and resource efficiency and climate change adaptation.
UKRAINE
Scale up investment to
increase productivity and
exports and add value
EGYPT
Improve import efficiency
and mitigate effects of
climate change
TURKEY
Promote sustainability
and inclusion in agri-
food value chains
GEORGIA
Improve food safety and
quality standards for local
end export marketsSERBIA
Boost competitiveness
and help companies
diversify exports
POLAND
Promote green
technology and
business standards
and spur innovation in
the agri-food sector
PUBLIC 23
Performance monitoring framework
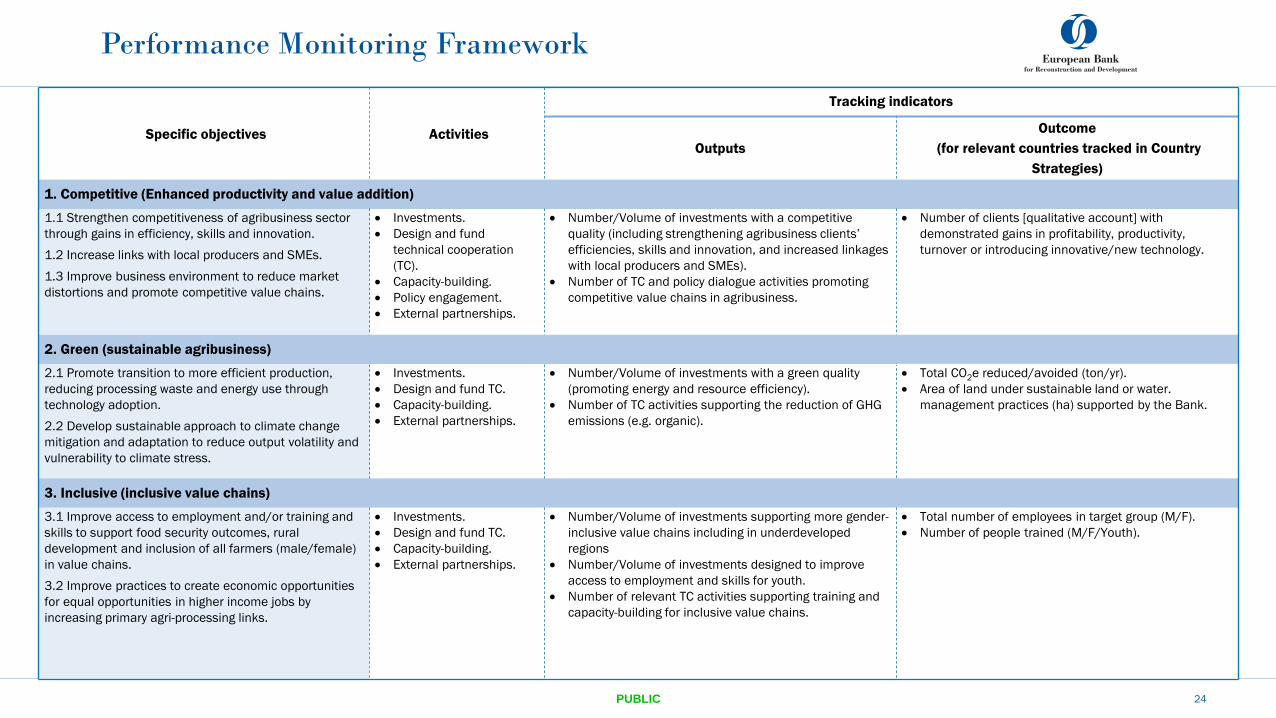
24PUBLIC
Specific objectives Activities
Tracking indicators
Outputs
Outcome
(for relevant countries tracked in Country
Strategies)
1. Competitive (Enhanced productivity and value addition)
1.1 Strengthen competitiveness of agribusiness sector
through gains in efficiency, skills and innovation.
1.2 Increase links with local producers and SMEs.
1.3 Improve business environment to reduce market
distortions and promote competitive value chains.
Investments.
Design and fund
technical cooperation
(TC).
Capacity-building.
Policy engagement.
External partnerships.
Number/Volume of investments with a competitive
quality (including strengthening agribusiness clients’
efficiencies, skills and innovation, and increased linkages
with local producers and SMEs).
Number of TC and policy dialogue activities promoting
competitive value chains in agribusiness.
Number of clients [qualitative account] with
demonstrated gains in profitability, productivity,
turnover or introducing innovative/new technology.
2. Green (sustainable agribusiness)
2.1 Promote transition to more efficient production,
reducing processing waste and energy use through
technology adoption.
2.2 Develop sustainable approach to climate change
mitigation and adaptation to reduce output volatility and
vulnerability to climate stress.
Investments.
Design and fund TC.
Capacity-building.
External partnerships.
Number/Volume of investments with a green quality
(promoting energy and resource efficiency).
Number of TC activities supporting the reduction of GHG
emissions (e.g. organic).
Total CO2e reduced/avoided (ton/yr).
Area of land under sustainable land or water.
management practices (ha) supported by the Bank.
3. Inclusive (inclusive value chains)
3.1 Improve access to employment and/or training and
skills to support food security outcomes, rural
development and inclusion of all farmers (male/female)
in value chains.
3.2 Improve practices to create economic opportunities
for equal opportunities in higher income jobs by
increasing primary agri-processing links.
Investments.
Design and fund TC.
Capacity-building.
External partnerships.
Number/Volume of investments supporting more gender-
inclusive value chains including in underdeveloped
regions
Number/Volume of investments designed to improve
access to employment and skills for youth.
Number of relevant TC activities supporting training and
capacity-building for inclusive value chains.
Total number of employees in target group (M/F).
Number of people trained (M/F/Youth).
Performance Monitoring Framework
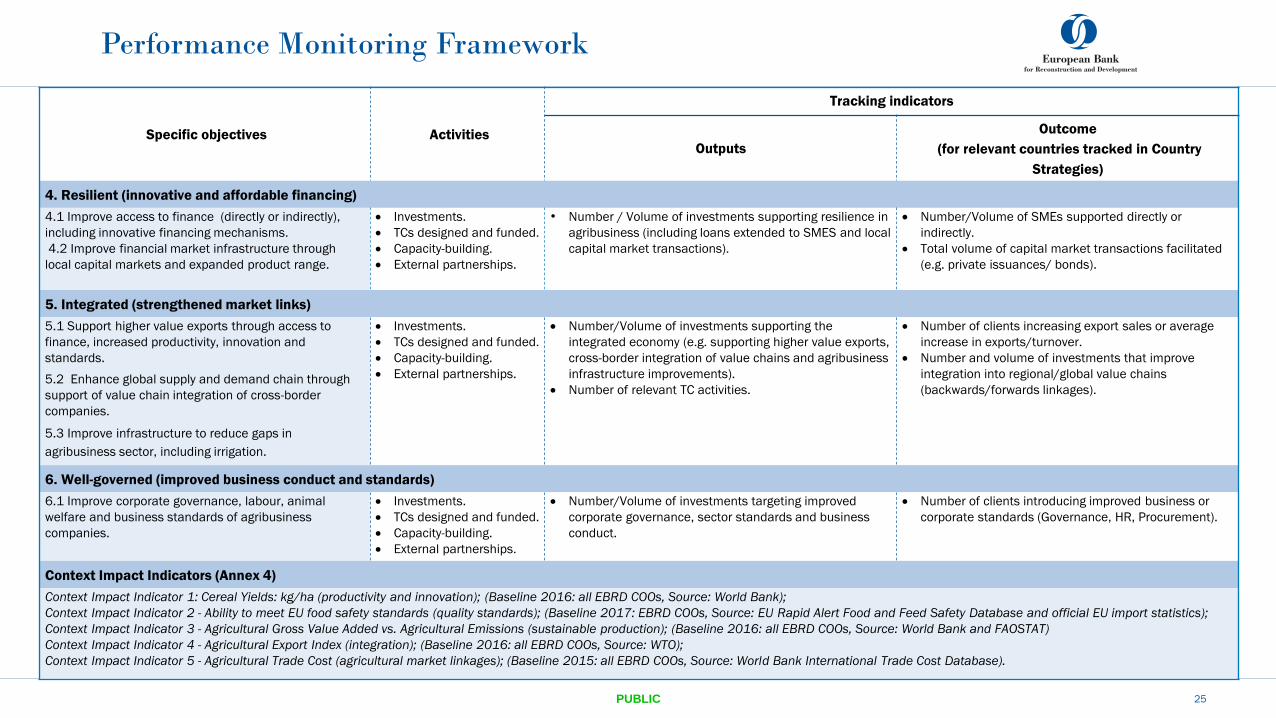
25PUBLIC
Specific objectives Activities
Tracking indicators
Outputs
Outcome
(for relevant countries tracked in Country
Strategies)
4. Resilient (innovative and affordable financing)
4.1 Improve access to finance (directly or indirectly),
including innovative financing mechanisms.
4.2 Improve financial market infrastructure through
local capital markets and expanded product range.
Investments.
TCs designed and funded.
Capacity-building.
External partnerships.
• Number / Volume of investments supporting resilience in
agribusiness (including loans extended to SMES and local
capital market transactions).
Number/Volume of SMEs supported directly or
indirectly.
Total volume of capital market transactions facilitated
(e.g. private issuances/ bonds).
5. Integrated (strengthened market links)
5.1 Support higher value exports through access to
finance, increased productivity, innovation and
standards.
5.2 Enhance global supply and demand chain through
support of value chain integration of cross-border
companies.
5.3 Improve infrastructure to reduce gaps in
agribusiness sector, including irrigation.
Investments.
TCs designed and funded.
Capacity-building.
External partnerships.
Number/Volume of investments supporting the
integrated economy (e.g. supporting higher value exports,
cross-border integration of value chains and agribusiness
infrastructure improvements).
Number of relevant TC activities.
Number of clients increasing export sales or average
increase in exports/turnover.
Number and volume of investments that improve
integration into regional/global value chains
(backwards/forwards linkages).
6. Well-governed (improved business conduct and standards)
6.1 Improve corporate governance, labour, animal
welfare and business standards of agribusiness
companies.
Investments.
TCs designed and funded.
Capacity-building.
External partnerships.
Number/Volume of investments targeting improved
corporate governance, sector standards and business
conduct.
Number of clients introducing improved business or
corporate standards (Governance, HR, Procurement).
Context Impact Indicators (Annex 4)
Context Impact Indicator 1: Cereal Yields: kg/ha (productivity and innovation); (Baseline 2016: all EBRD COOs, Source: World Bank);
Context Impact Indicator 2 - Ability to meet EU food safety standards (quality standards); (Baseline 2017: EBRD COOs, Source: EU Rapid Alert Food and Feed Safety Database and official EU import statistics);
Context Impact Indicator 3 - Agricultural Gross Value Added vs. Agricultural Emissions (sustainable production); (Baseline 2016: all EBRD COOs, Source: World Bank and FAOSTAT)
Context Impact Indicator 4 - Agricultural Export Index (integration); (Baseline 2016: all EBRD COOs, Source: WTO);
Context Impact Indicator 5 - Agricultural Trade Cost (agricultural market linkages); (Baseline 2015: all EBRD COOs, Source: World Bank International Trade Cost Database).
Performance Monitoring Framework
PUBLIC 26
EBRD position vis-a-vis other IFIs and partners
27PUBLIC
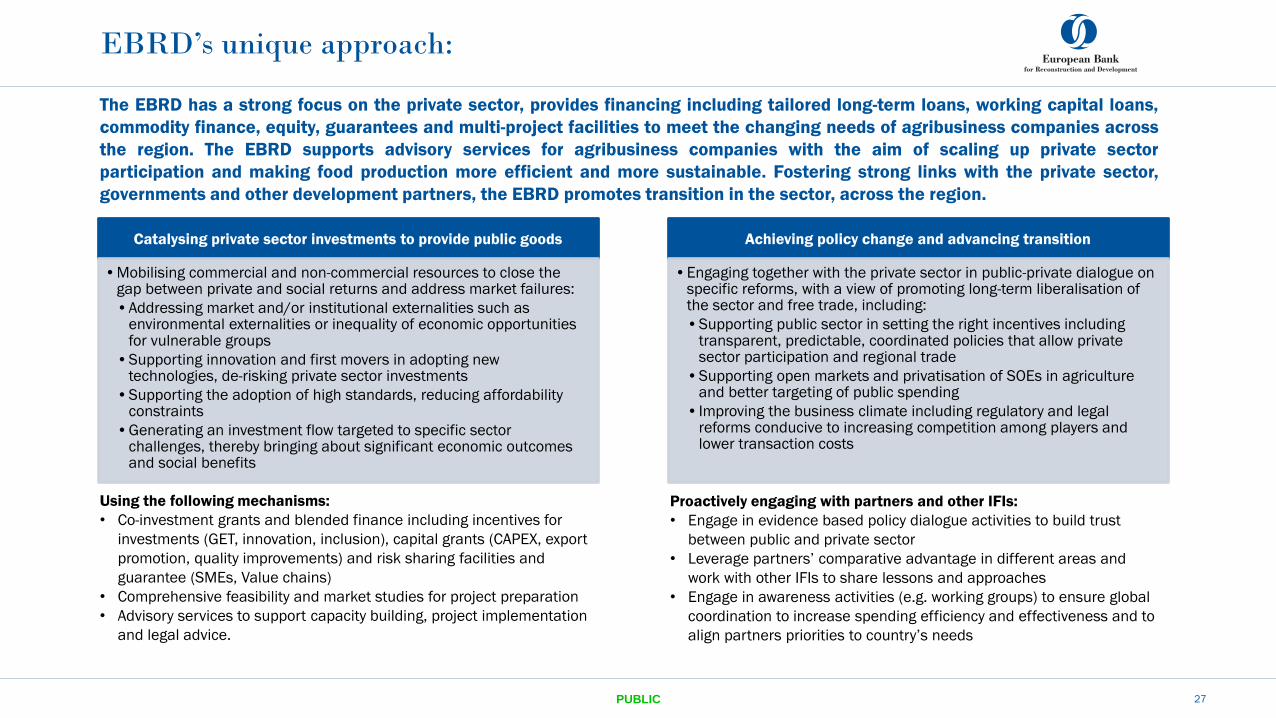
EBRD’s unique approach:
Using the following mechanisms:
• Co-investment grants and blended finance including incentives for
investments (GET, innovation, inclusion), capital grants (CAPEX, export
promotion, quality improvements) and risk sharing facilities and
guarantee (SMEs, Value chains)
• Comprehensive feasibility and market studies for project preparation
• Advisory services to support capacity building, project implementation
and legal advice.
Proactively engaging with partners and other IFIs:
• Engage in evidence based policy dialogue activities to build trust
between public and private sector
• Leverage partners’ comparative advantage in different areas and
work with other IFIs to share lessons and approaches
• Engage in awareness activities (e.g. working groups) to ensure global
coordination to increase spending efficiency and effectiveness and to
align partners priorities to country’s needs
Catalysing private sector investments to provide public goods
•Mobilising commercial and non-commercial resources to close the gap between private and social returns and address market failures:
•Addressing market and/or institutional externalities such as environmental externalities or inequality of economic opportunities for vulnerable groups
•Supporting innovation and first movers in adopting new technologies, de-risking private sector investments
•Supporting the adoption of high standards, reducing affordability constraints
•Generating an investment flow targeted to specific sector challenges, thereby bringing about significant economic outcomes and social benefits
Achieving policy change and advancing transition
•Engaging together with the private sector in public-private dialogue on specific reforms, with a view of promoting long-term liberalisation of the sector and free trade, including:
•Supporting public sector in setting the right incentives including transparent, predictable, coordinated policies that allow private sector participation and regional trade
•Supporting open markets and privatisation of SOEs in agriculture and better targeting of public spending
• Improving the business climate including regulatory and legal reforms conducive to increasing competition among players and lower transaction costs
The EBRD has a strong focus on the private sector, provides financing including tailored long-term loans, working capital loans,
commodity finance, equity, guarantees and multi-project facilities to meet the changing needs of agribusiness companies across
the region. The EBRD supports advisory services for agribusiness companies with the aim of scaling up private sector
participation and making food production more efficient and more sustainable. Fostering strong links with the private sector,
governments and other development partners, the EBRD promotes transition in the sector, across the region.
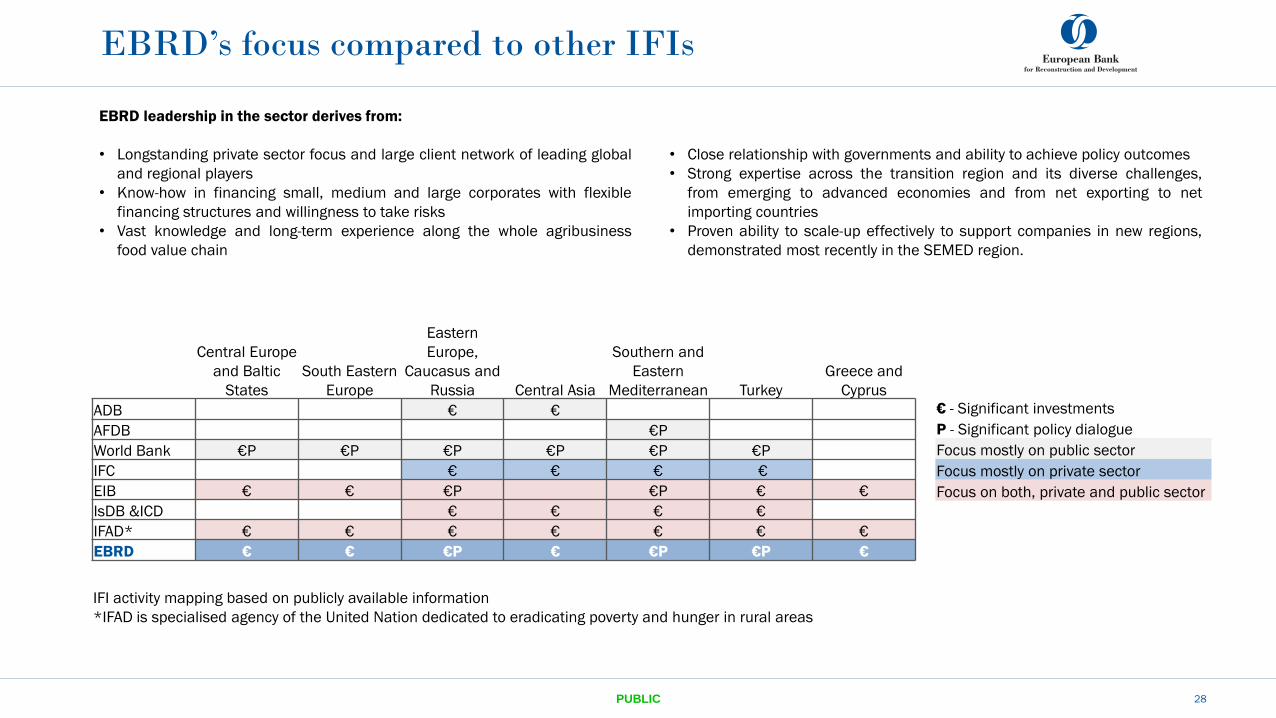
EBRD’s focus compared to other IFIs
28PUBLIC
€ - Significant investments
P - Significant policy dialogue
Focus mostly on public sector
Focus mostly on private sector
Focus on both, private and public sector
EBRD leadership in the sector derives from:
• Longstanding private sector focus and large client network of leading global
and regional players
• Know-how in financing small, medium and large corporates with flexible
financing structures and willingness to take risks
• Vast knowledge and long-term experience along the whole agribusiness
food value chain
• Close relationship with governments and ability to achieve policy outcomes
• Strong expertise across the transition region and its diverse challenges,
from emerging to advanced economies and from net exporting to net
importing countries
• Proven ability to scale-up effectively to support companies in new regions,
demonstrated most recently in the SEMED region.
IFI activity mapping based on publicly available information
*IFAD is specialised agency of the United Nation dedicated to eradicating poverty and hunger in rural areas
Central Europe
and Baltic
States
South Eastern
Europe
Eastern
Europe,
Caucasus and
Russia Central Asia
Southern and
Eastern
Mediterranean Turkey
Greece and
Cyprus
ADB € €
AFDB €P
World Bank €P €P €P €P €P €P
IFC € € € €
EIB € € €P €P € €
IsDB &ICD € € € €
IFAD* € € € € € € €
EBRD € € €P € €P €P €
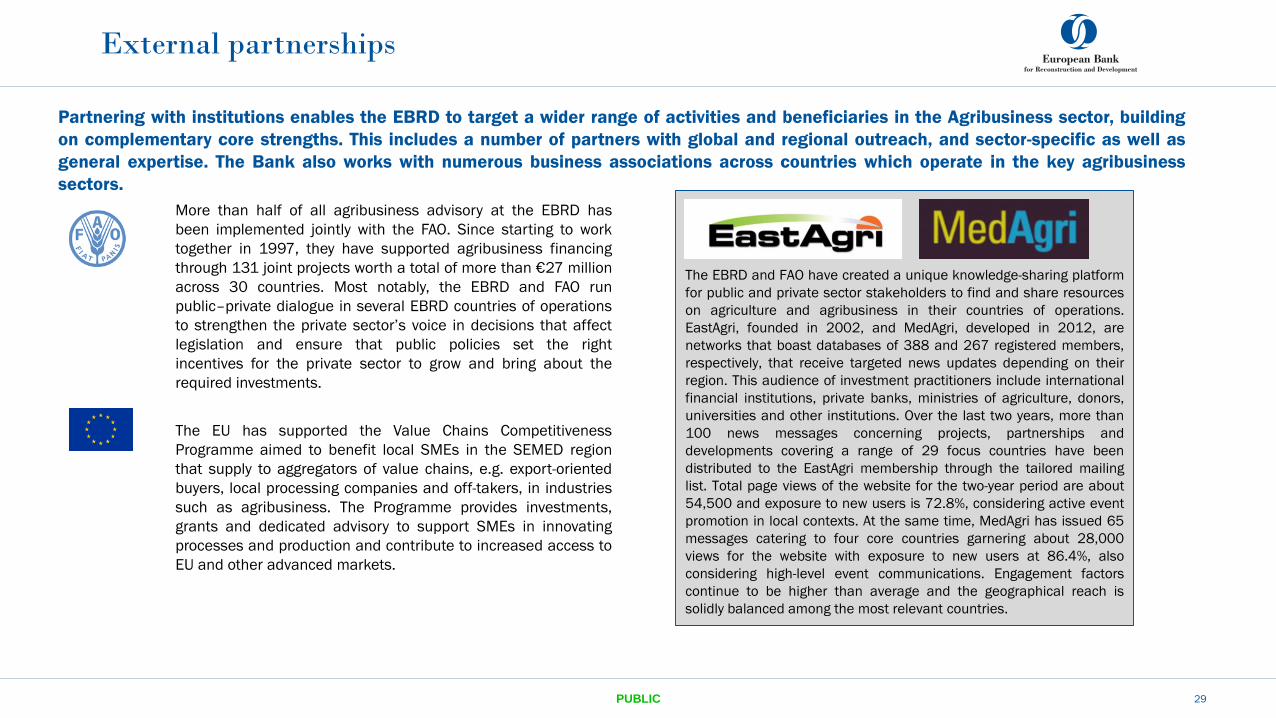
More than half of all agribusiness advisory at the EBRD has
been implemented jointly with the FAO. Since starting to work
together in 1997, they have supported agribusiness financing
through 131 joint projects worth a total of more than €27 million
across 30 countries. Most notably, the EBRD and FAO run
public–private dialogue in several EBRD countries of operations
to strengthen the private sector’s voice in decisions that affect
legislation and ensure that public policies set the right
incentives for the private sector to grow and bring about the
required investments.
The EU has supported the Value Chains Competitiveness
Programme aimed to benefit local SMEs in the SEMED region
that supply to aggregators of value chains, e.g. export-oriented
buyers, local processing companies and off-takers, in industries
such as agribusiness. The Programme provides investments,
grants and dedicated advisory to support SMEs in innovating
processes and production and contribute to increased access to
EU and other advanced markets.
29PUBLIC
Partnering with institutions enables the EBRD to target a wider range of activities and beneficiaries in the Agribusiness sector, building
on complementary core strengths. This includes a number of partners with global and regional outreach, and sector-specific as well as
general expertise. The Bank also works with numerous business associations across countries which operate in the key agribusiness
sectors.
External partnerships
The EBRD and FAO have created a unique knowledge-sharing platform
for public and private sector stakeholders to find and share resources
on agriculture and agribusiness in their countries of operations.
EastAgri, founded in 2002, and MedAgri, developed in 2012, are
networks that boast databases of 388 and 267 registered members,
respectively, that receive targeted news updates depending on their
region. This audience of investment practitioners include international
financial institutions, private banks, ministries of agriculture, donors,
universities and other institutions. Over the last two years, more than
100 news messages concerning projects, partnerships and
developments covering a range of 29 focus countries have been
distributed to the EastAgri membership through the tailored mailing
list. Total page views of the website for the two-year period are about
54,500 and exposure to new users is 72.8%, considering active event
promotion in local contexts. At the same time, MedAgri has issued 65
messages catering to four core countries garnering about 28,000
views for the website with exposure to new users at 86.4%, also
considering high-level event communications. Engagement factors
continue to be higher than average and the geographical reach is
solidly balanced among the most relevant countries.
Cross-sectoral linkages
30PUBLIC
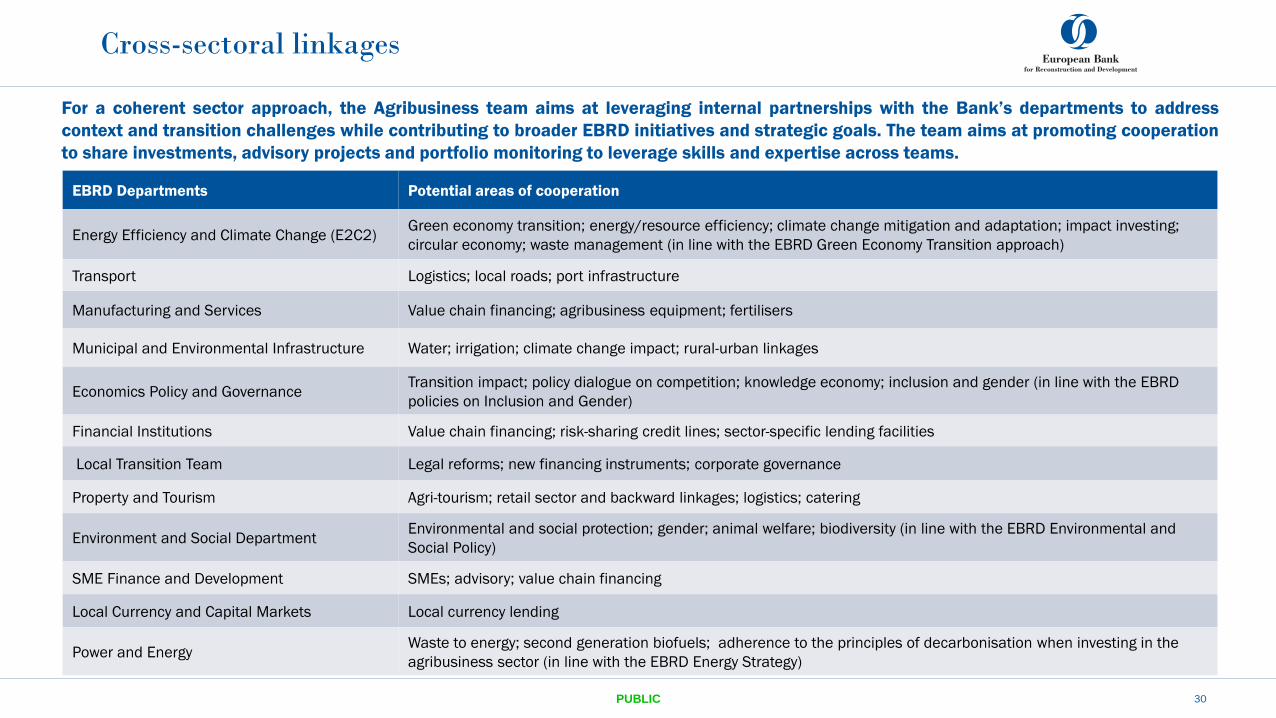
EBRD Departments Potential areas of cooperation
Energy Efficiency and Climate Change (E2C2)Green economy transition; energy/resource efficiency; climate change mitigation and adaptation; impact investing;
circular economy; waste management (in line with the EBRD Green Economy Transition approach)
Transport Logistics; local roads; port infrastructure
Manufacturing and Services Value chain financing; agribusiness equipment; fertilisers
Municipal and Environmental Infrastructure Water; irrigation; climate change impact; rural-urban linkages
Economics Policy and GovernanceTransition impact; policy dialogue on competition; knowledge economy; inclusion and gender (in line with the EBRD
policies on Inclusion and Gender)
Financial Institutions Value chain financing; risk-sharing credit lines; sector-specific lending facilities
Local Transition Team Legal reforms; new financing instruments; corporate governance
Property and Tourism Agri-tourism; retail sector and backward linkages; logistics; catering
Environment and Social Department Environmental and social protection; gender; animal welfare; biodiversity (in line with the EBRD Environmental and
Social Policy)
SME Finance and Development SMEs; advisory; value chain financing
Local Currency and Capital Markets Local currency lending
Power and EnergyWaste to energy; second generation biofuels; adherence to the principles of decarbonisation when investing in the
agribusiness sector (in line with the EBRD Energy Strategy)
For a coherent sector approach, the Agribusiness team aims at leveraging internal partnerships with the Bank’s departments to address
context and transition challenges while contributing to broader EBRD initiatives and strategic goals. The team aims at promoting cooperation
to share investments, advisory projects and portfolio monitoring to leverage skills and expertise across teams.
PUBLIC 31
Annexes
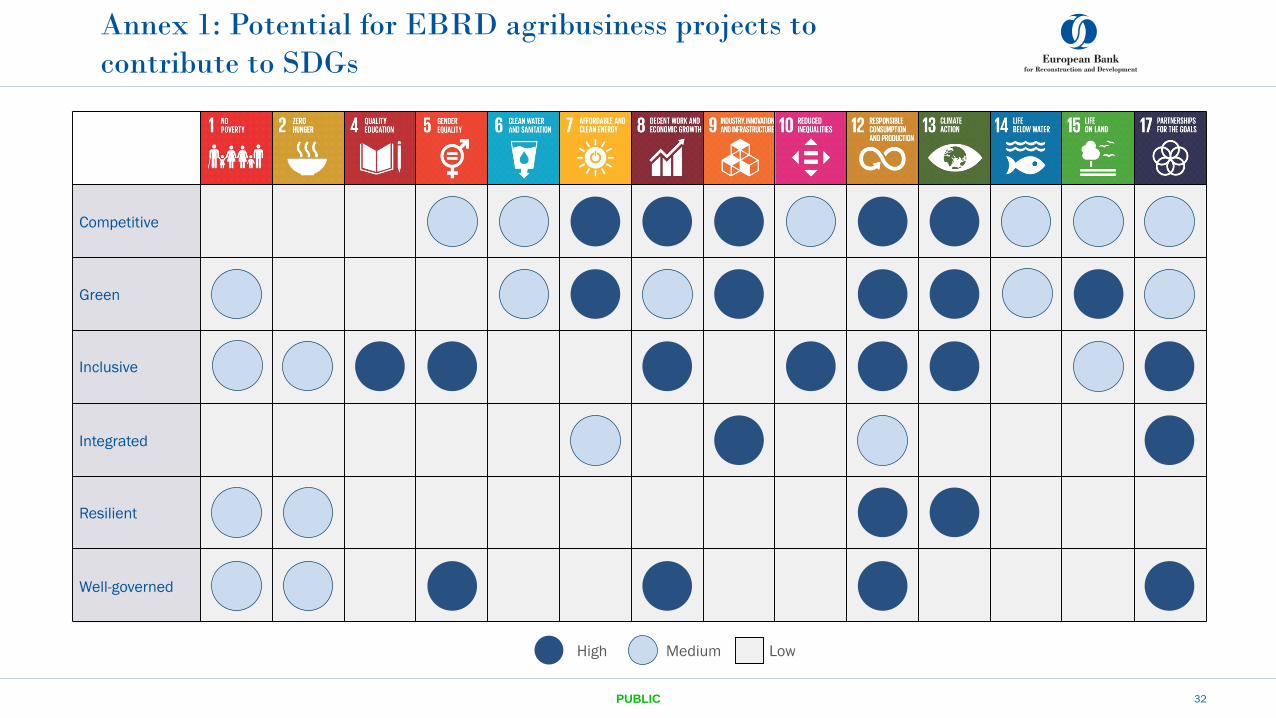
1 2 4 5 6 7 8 9 10 12 13 14 15 17
Competitive
Green
Inclusive
Integrated
Resilient
Well-governed
PUBLIC
Annex 1: Potential for EBRD agribusiness projects to
contribute to SDGs
32
High Medium Low
33
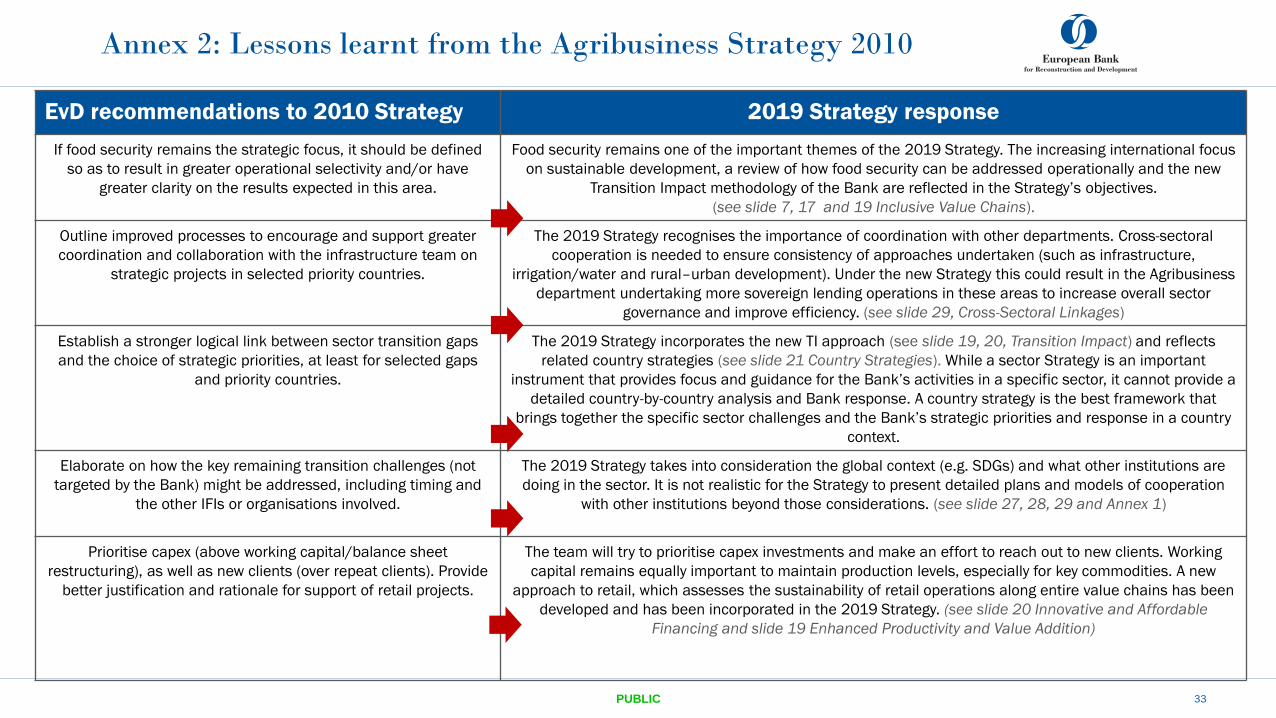
EvD recommendations to 2010 Strategy 2019 Strategy response
If food security remains the strategic focus, it should be defined
so as to result in greater operational selectivity and/or have
greater clarity on the results expected in this area.
Food security remains one of the important themes of the 2019 Strategy. The increasing international focus
on sustainable development, a review of how food security can be addressed operationally and the new
Transition Impact methodology of the Bank are reflected in the Strategy’s objectives.
(see slide 7, 17 and 19 Inclusive Value Chains).
Outline improved processes to encourage and support greater
coordination and collaboration with the infrastructure team on
strategic projects in selected priority countries.
The 2019 Strategy recognises the importance of coordination with other departments. Cross-sectoral
cooperation is needed to ensure consistency of approaches undertaken (such as infrastructure,
irrigation/water and rural–urban development). Under the new Strategy this could result in the Agribusiness
department undertaking more sovereign lending operations in these areas to increase overall sector
governance and improve efficiency. (see slide 29, Cross-Sectoral Linkages)
Establish a stronger logical link between sector transition gaps
and the choice of strategic priorities, at least for selected gaps
and priority countries.
The 2019 Strategy incorporates the new TI approach (see slide 19, 20, Transition Impact) and reflects
related country strategies (see slide 21 Country Strategies). While a sector Strategy is an important
instrument that provides focus and guidance for the Bank’s activities in a specific sector, it cannot provide a
detailed country-by-country analysis and Bank response. A country strategy is the best framework that
brings together the specific sector challenges and the Bank’s strategic priorities and response in a country
context.
Elaborate on how the key remaining transition challenges (not
targeted by the Bank) might be addressed, including timing and
the other IFIs or organisations involved.
The 2019 Strategy takes into consideration the global context (e.g. SDGs) and what other institutions are
doing in the sector. It is not realistic for the Strategy to present detailed plans and models of cooperation
with other institutions beyond those considerations. (see slide 27, 28, 29 and Annex 1)
Prioritise capex (above working capital/balance sheet
restructuring), as well as new clients (over repeat clients). Provide
better justification and rationale for support of retail projects.
The team will try to prioritise capex investments and make an effort to reach out to new clients. Working
capital remains equally important to maintain production levels, especially for key commodities. A new
approach to retail, which assesses the sustainability of retail operations along entire value chains has been
developed and has been incorporated in the 2019 Strategy. (see slide 20 Innovative and Affordable
Financing and slide 19 Enhanced Productivity and Value Addition)
PUBLIC
Annex 2: Lessons learnt from the Agribusiness Strategy 2010
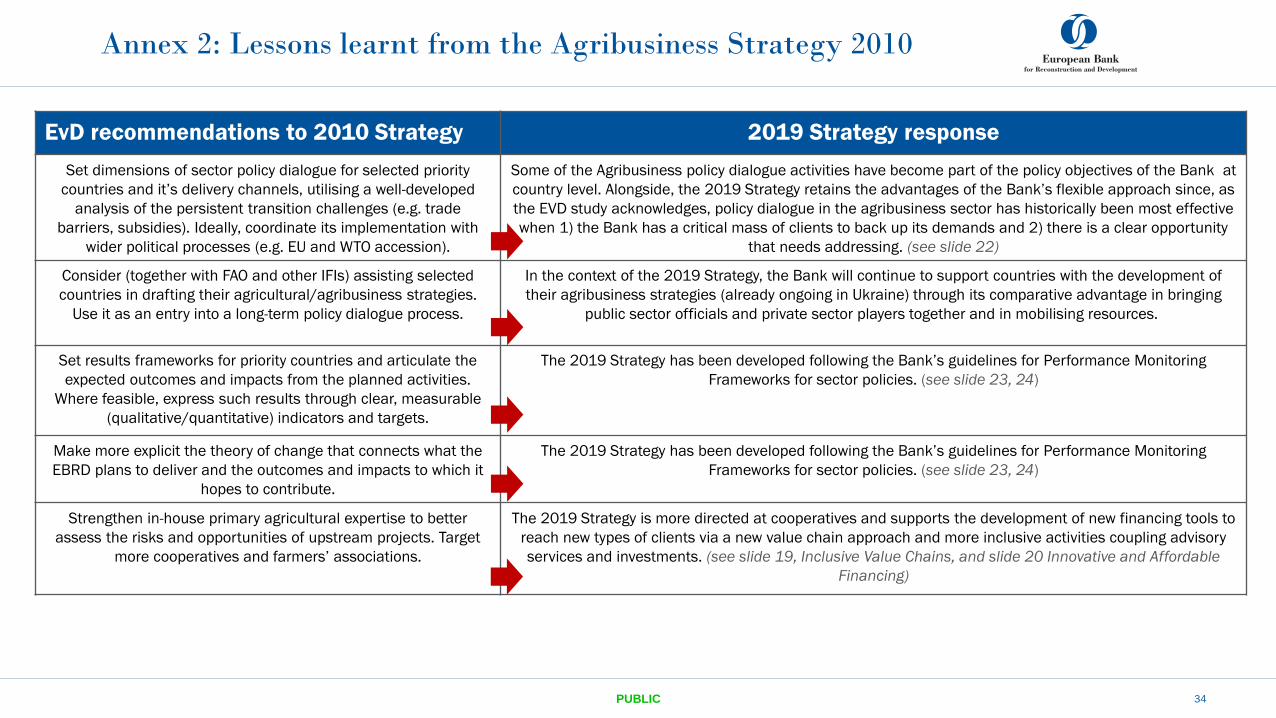
EvD recommendations to 2010 Strategy 2019 Strategy response
Set dimensions of sector policy dialogue for selected priority
countries and it’s delivery channels, utilising a well-developed
analysis of the persistent transition challenges (e.g. trade
barriers, subsidies). Ideally, coordinate its implementation with
wider political processes (e.g. EU and WTO accession).
Some of the Agribusiness policy dialogue activities have become part of the policy objectives of the Bank at
country level. Alongside, the 2019 Strategy retains the advantages of the Bank’s flexible approach since, as
the EVD study acknowledges, policy dialogue in the agribusiness sector has historically been most effective
when 1) the Bank has a critical mass of clients to back up its demands and 2) there is a clear opportunity
that needs addressing. (see slide 22)
Consider (together with FAO and other IFIs) assisting selected
countries in drafting their agricultural/agribusiness strategies.
Use it as an entry into a long-term policy dialogue process.
In the context of the 2019 Strategy, the Bank will continue to support countries with the development of
their agribusiness strategies (already ongoing in Ukraine) through its comparative advantage in bringing
public sector officials and private sector players together and in mobilising resources.
Set results frameworks for priority countries and articulate the
expected outcomes and impacts from the planned activities.
Where feasible, express such results through clear, measurable
(qualitative/quantitative) indicators and targets.
The 2019 Strategy has been developed following the Bank’s guidelines for Performance Monitoring
Frameworks for sector policies. (see slide 23, 24)
Make more explicit the theory of change that connects what the
EBRD plans to deliver and the outcomes and impacts to which it
hopes to contribute.
The 2019 Strategy has been developed following the Bank’s guidelines for Performance Monitoring
Frameworks for sector policies. (see slide 23, 24)
Strengthen in-house primary agricultural expertise to better
assess the risks and opportunities of upstream projects. Target
more cooperatives and farmers’ associations.
The 2019 Strategy is more directed at cooperatives and supports the development of new financing tools to
reach new types of clients via a new value chain approach and more inclusive activities coupling advisory
services and investments. (see slide 19, Inclusive Value Chains, and slide 20 Innovative and Affordable
Financing)
34PUBLIC
Annex 2: Lessons learnt from the Agribusiness Strategy 2010
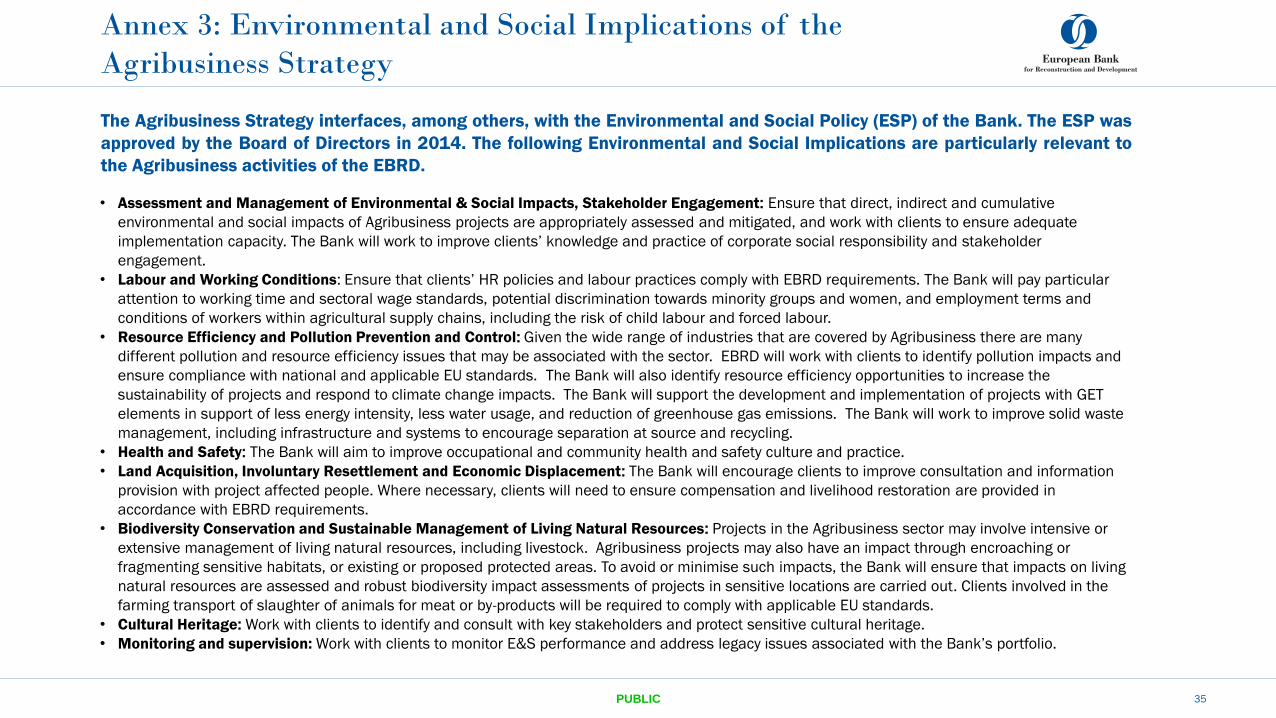
Annex 3: Environmental and Social Implications of the
Agribusiness Strategy
35PUBLIC
• Assessment and Management of Environmental & Social Impacts, Stakeholder Engagement: Ensure that direct, indirect and cumulative
environmental and social impacts of Agribusiness projects are appropriately assessed and mitigated, and work with clients to ensure adequate
implementation capacity. The Bank will work to improve clients’ knowledge and practice of corporate social responsibility and stakeholder
engagement.
• Labour and Working Conditions: Ensure that clients’ HR policies and labour practices comply with EBRD requirements. The Bank will pay particular
attention to working time and sectoral wage standards, potential discrimination towards minority groups and women, and employment terms and
conditions of workers within agricultural supply chains, including the risk of child labour and forced labour.
• Resource Efficiency and Pollution Prevention and Control: Given the wide range of industries that are covered by Agribusiness there are many
different pollution and resource efficiency issues that may be associated with the sector. EBRD will work with clients to identify pollution impacts and
ensure compliance with national and applicable EU standards. The Bank will also identify resource efficiency opportunities to increase the
sustainability of projects and respond to climate change impacts. The Bank will support the development and implementation of projects with GET
elements in support of less energy intensity, less water usage, and reduction of greenhouse gas emissions. The Bank will work to improve solid waste
management, including infrastructure and systems to encourage separation at source and recycling.
• Health and Safety: The Bank will aim to improve occupational and community health and safety culture and practice.
• Land Acquisition, Involuntary Resettlement and Economic Displacement: The Bank will encourage clients to improve consultation and information
provision with project affected people. Where necessary, clients will need to ensure compensation and livelihood restoration are provided in
accordance with EBRD requirements.
• Biodiversity Conservation and Sustainable Management of Living Natural Resources: Projects in the Agribusiness sector may involve intensive or
extensive management of living natural resources, including livestock. Agribusiness projects may also have an impact through encroaching or
fragmenting sensitive habitats, or existing or proposed protected areas. To avoid or minimise such impacts, the Bank will ensure that impacts on living
natural resources are assessed and robust biodiversity impact assessments of projects in sensitive locations are carried out. Clients involved in the
farming transport of slaughter of animals for meat or by-products will be required to comply with applicable EU standards.
• Cultural Heritage: Work with clients to identify and consult with key stakeholders and protect sensitive cultural heritage.
• Monitoring and supervision: Work with clients to monitor E&S performance and address legacy issues associated with the Bank’s portfolio.
The Agribusiness Strategy interfaces, among others, with the Environmental and Social Policy (ESP) of the Bank. The ESP was
approved by the Board of Directors in 2014. The following Environmental and Social Implications are particularly relevant to
the Agribusiness activities of the EBRD.
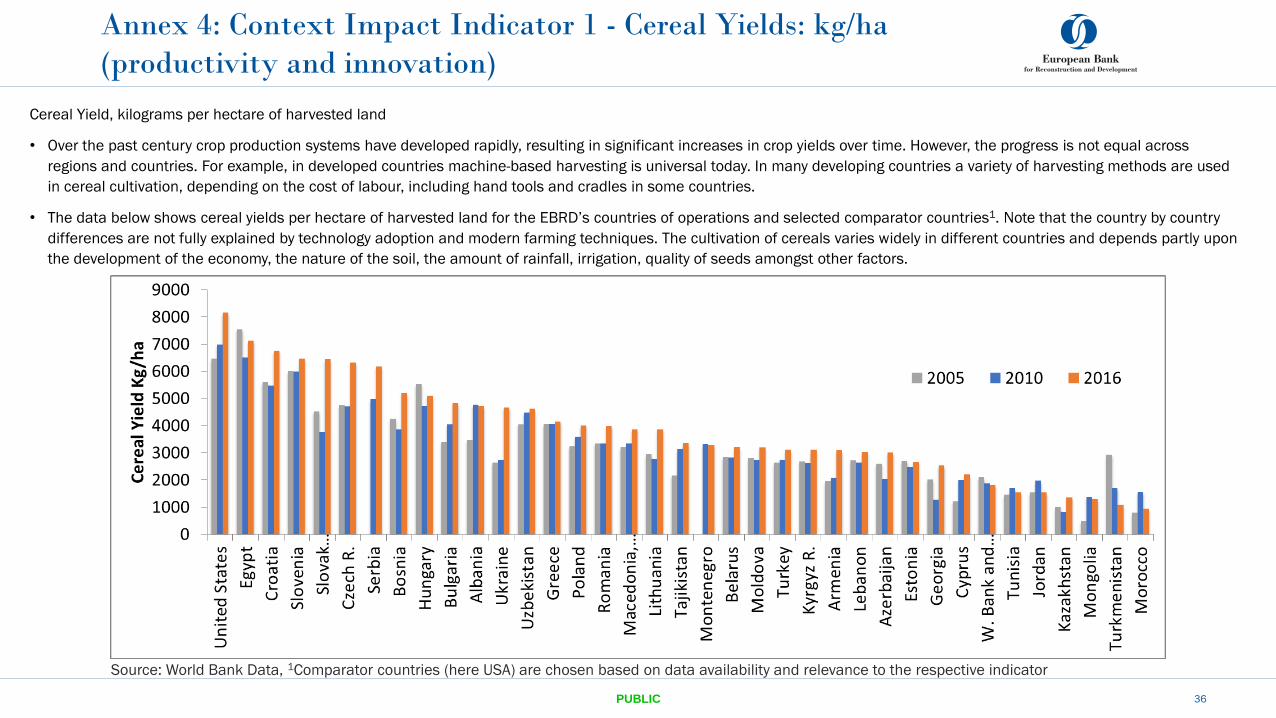
Cereal Yield, kilograms per hectare of harvested land
• Over the past century crop production systems have developed rapidly, resulting in significant increases in crop yields over time. However, the progress is not equal across
regions and countries. For example, in developed countries machine-based harvesting is universal today. In many developing countries a variety of harvesting methods are used
in cereal cultivation, depending on the cost of labour, including hand tools and cradles in some countries.
• The data below shows cereal yields per hectare of harvested land for the EBRD’s countries of operations and selected comparator countries1. Note that the country by country
differences are not fully explained by technology adoption and modern farming techniques. The cultivation of cereals varies widely in different countries and depends partly upon
the development of the economy, the nature of the soil, the amount of rainfall, irrigation, quality of seeds amongst other factors.
Annex 4: Context Impact Indicator 1 - Cereal Yields: kg/ha
(productivity and innovation)
36PUBLIC
Source: World Bank Data, 1Comparator countries (here USA) are chosen based on data availability and relevance to the respective indicator
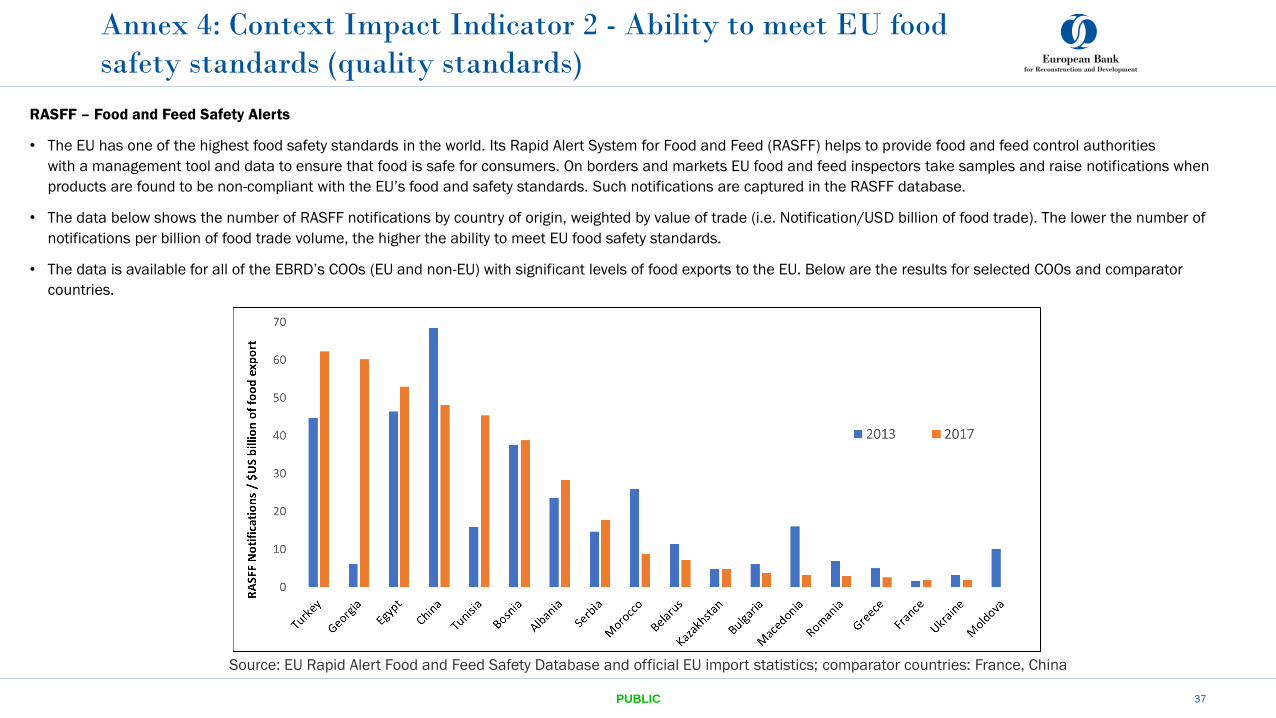
Annex 4: Context Impact Indicator 2 - Ability to meet EU food
safety standards (quality standards)
PUBLIC 37
Source: EU Rapid Alert Food and Feed Safety Database and official EU import statistics; comparator countries: France, China
RASFF – Food and Feed Safety Alerts
• The EU has one of the highest food safety standards in the world. Its Rapid Alert System for Food and Feed (RASFF) helps to provide food and feed control authorities
with a management tool and data to ensure that food is safe for consumers. On borders and markets EU food and feed inspectors take samples and raise notifications when
products are found to be non-compliant with the EU’s food and safety standards. Such notifications are captured in the RASFF database.
• The data below shows the number of RASFF notifications by country of origin, weighted by value of trade (i.e. Notification/USD billion of food trade). The lower the number of
notifications per billion of food trade volume, the higher the ability to meet EU food safety standards.
• The data is available for all of the EBRD’s COOs (EU and non-EU) with significant levels of food exports to the EU. Below are the results for selected COOs and comparator
countries.
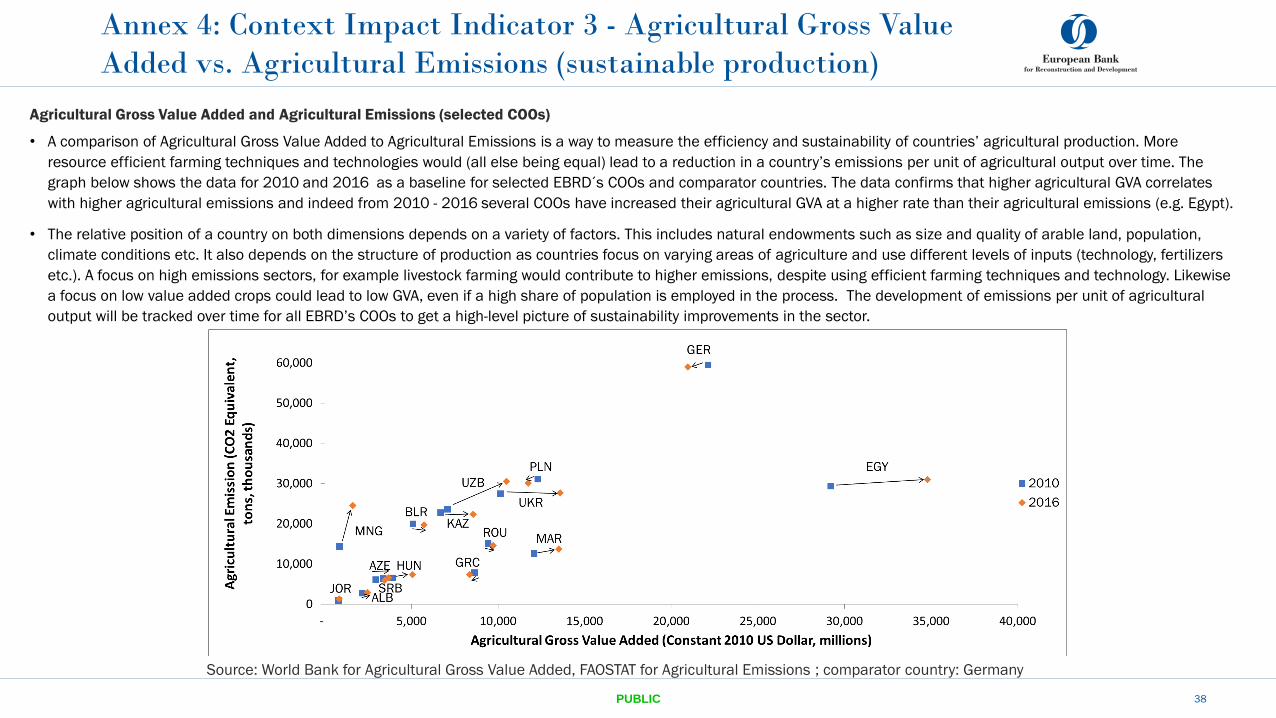
Agricultural Gross Value Added and Agricultural Emissions (selected COOs)
• A comparison of Agricultural Gross Value Added to Agricultural Emissions is a way to measure the efficiency and sustainability of countries’ agricultural production. More
resource efficient farming techniques and technologies would (all else being equal) lead to a reduction in a country’s emissions per unit of agricultural output over time. The
graph below shows the data for 2010 and 2016 as a baseline for selected EBRD´s COOs and comparator countries. The data confirms that higher agricultural GVA correlates
with higher agricultural emissions and indeed from 2010 - 2016 several COOs have increased their agricultural GVA at a higher rate than their agricultural emissions (e.g. Egypt).
• The relative position of a country on both dimensions depends on a variety of factors. This includes natural endowments such as size and quality of arable land, population,
climate conditions etc. It also depends on the structure of production as countries focus on varying areas of agriculture and use different levels of inputs (technology, fertilizers
etc.). A focus on high emissions sectors, for example livestock farming would contribute to higher emissions, despite using efficient farming techniques and technology. Likewise
a focus on low value added crops could lead to low GVA, even if a high share of population is employed in the process. The development of emissions per unit of agricultural
output will be tracked over time for all EBRD’s COOs to get a high-level picture of sustainability improvements in the sector.
Annex 4: Context Impact Indicator 3 - Agricultural Gross Value
Added vs. Agricultural Emissions (sustainable production)
38PUBLIC
Source: World Bank for Agricultural Gross Value Added, FAOSTAT for Agricultural Emissions ; comparator country: Germany
39PUBLIC
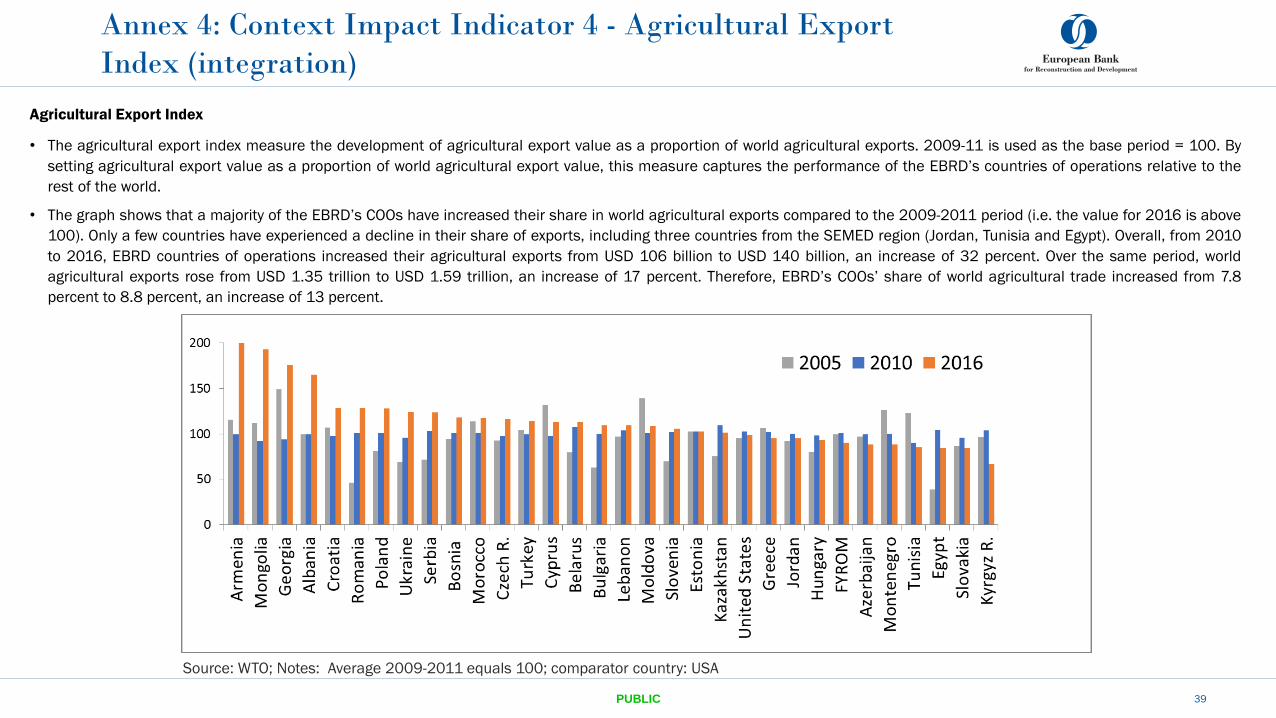
Annex 4: Context Impact Indicator 4 - Agricultural Export
Index (integration)
Source: WTO; Notes: Average 2009-2011 equals 100; comparator country: USA
Agricultural Export Index
• The agricultural export index measure the development of agricultural export value as a proportion of world agricultural exports. 2009-11 is used as the base period = 100. By
setting agricultural export value as a proportion of world agricultural export value, this measure captures the performance of the EBRD’s countries of operations relative to the
rest of the world.
• The graph shows that a majority of the EBRD’s COOs have increased their share in world agricultural exports compared to the 2009-2011 period (i.e. the value for 2016 is above
100). Only a few countries have experienced a decline in their share of exports, including three countries from the SEMED region (Jordan, Tunisia and Egypt). Overall, from 2010
to 2016, EBRD countries of operations increased their agricultural exports from USD 106 billion to USD 140 billion, an increase of 32 percent. Over the same period, world
agricultural exports rose from USD 1.35 trillion to USD 1.59 trillion, an increase of 17 percent. Therefore, EBRD’s COOs’ share of world agricultural trade increased from 7.8
percent to 8.8 percent, an increase of 13 percent.
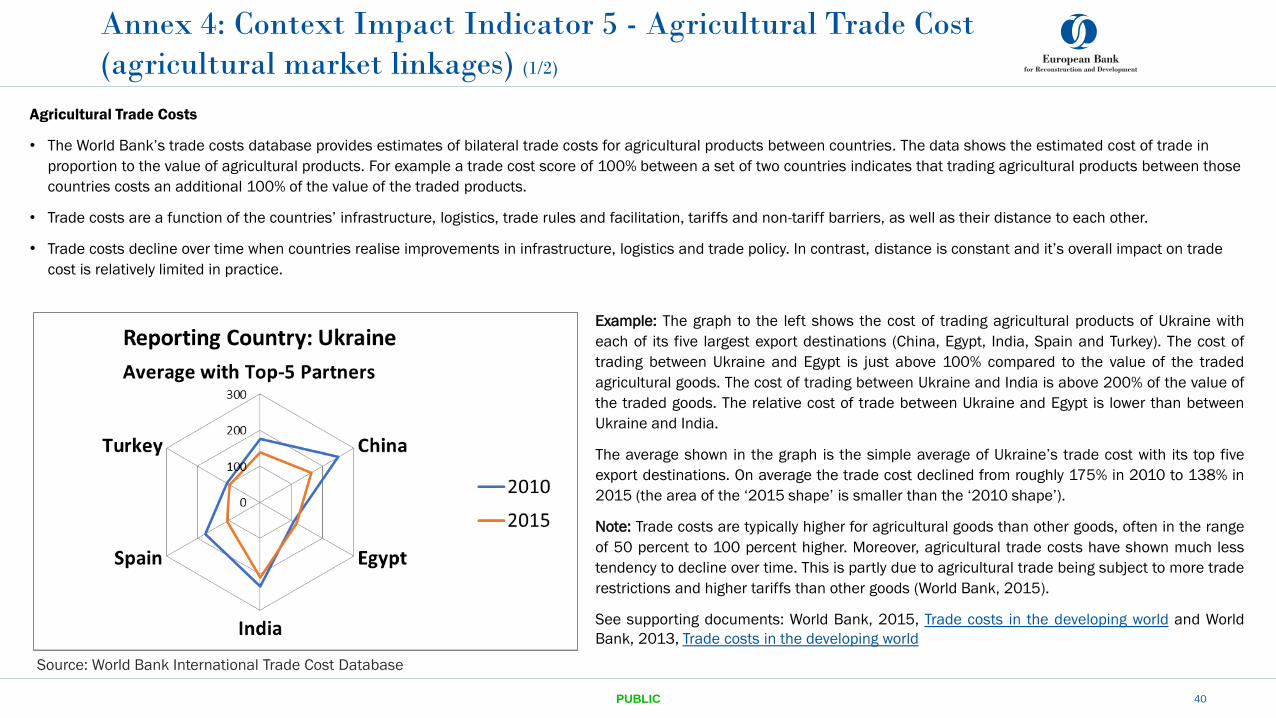
Agricultural Trade Costs
• The World Bank’s trade costs database provides estimates of bilateral trade costs for agricultural products between countries. The data shows the estimated cost of trade in
proportion to the value of agricultural products. For example a trade cost score of 100% between a set of two countries indicates that trading agricultural products between those
countries costs an additional 100% of the value of the traded products.
• Trade costs are a function of the countries’ infrastructure, logistics, trade rules and facilitation, tariffs and non-tariff barriers, as well as their distance to each other.
• Trade costs decline over time when countries realise improvements in infrastructure, logistics and trade policy. In contrast, distance is constant and it’s overall impact on trade
cost is relatively limited in practice.
40PUBLIC
Annex 4: Context Impact Indicator 5 - Agricultural Trade Cost
(agricultural market linkages) (1/2)
Source: World Bank International Trade Cost Database
Example: The graph to the left shows the cost of trading agricultural products of Ukraine with
each of its five largest export destinations (China, Egypt, India, Spain and Turkey). The cost of
trading between Ukraine and Egypt is just above 100% compared to the value of the traded
agricultural goods. The cost of trading between Ukraine and India is above 200% of the value of
the traded goods. The relative cost of trade between Ukraine and Egypt is lower than between
Ukraine and India.
The average shown in the graph is the simple average of Ukraine’s trade cost with its top five
export destinations. On average the trade cost declined from roughly 175% in 2010 to 138% in
2015 (the area of the ‘2015 shape’ is smaller than the ‘2010 shape’).
Note: Trade costs are typically higher for agricultural goods than other goods, often in the range
of 50 percent to 100 percent higher. Moreover, agricultural trade costs have shown much less
tendency to decline over time. This is partly due to agricultural trade being subject to more trade
restrictions and higher tariffs than other goods (World Bank, 2015).
See supporting documents: World Bank, 2015, Trade costs in the developing world and World
Bank, 2013, Trade costs in the developing world
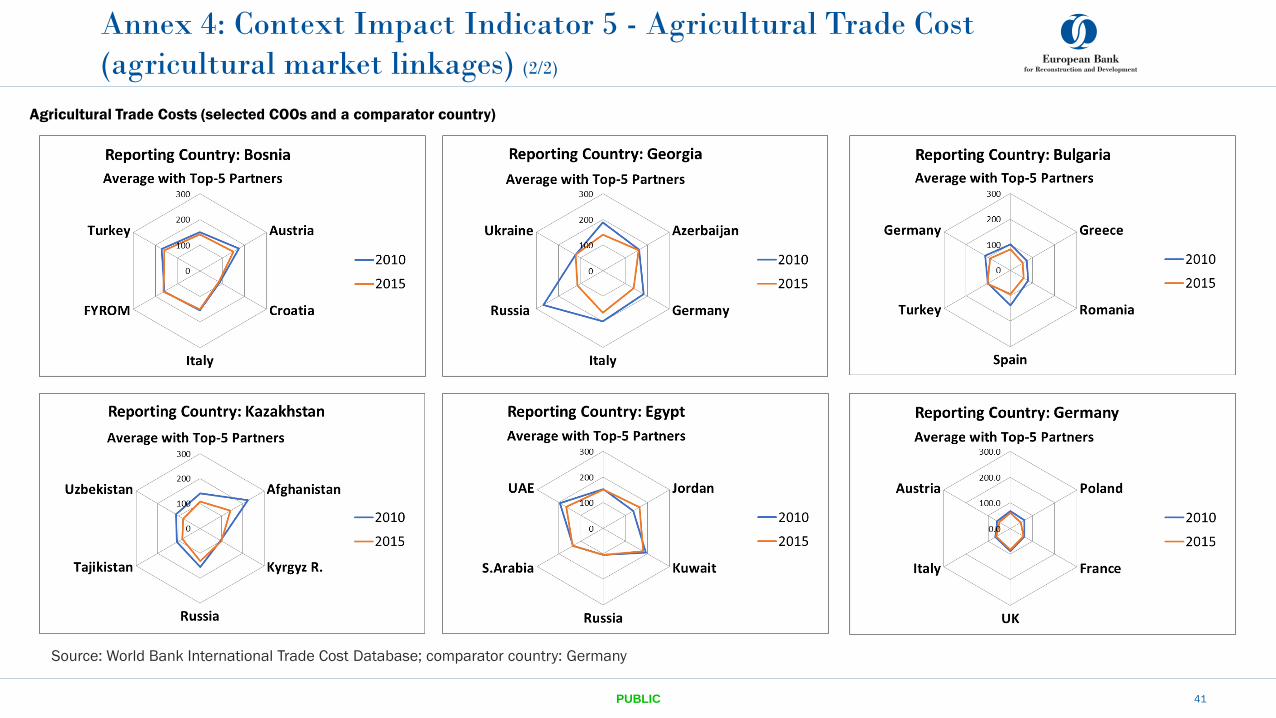
41PUBLIC
Annex 4: Context Impact Indicator 5 - Agricultural Trade Cost
(agricultural market linkages) (2/2)
Source: World Bank International Trade Cost Database; comparator country: Germany
Agricultural Trade Costs (selected COOs and a comparator country)