Embed Size (px)
Citation preview

Jou
rnal o
f Ag
ribu
sine
ss in D
eve
lop
ing
and
Em
erg
ing
Ec
on
om
ies
Vo
lum
e 9
Nu
mb
er 1 2
019
em
erald
pu
blish
ing
.co
m
www.emeraldinsight.com/loi/jadee
Volume 9 Number 1 2019 ISSN 2044-0839Volume 9 Number 1 2019
Journal of
Agribusiness in Developing and Emerging Economies
Number 1
Agribusiness and food security in AfricaGuest Editor: Charles B. Moss
1 Editorial boards
2 Guest editorial
4 Contribution of policy change on maize varietal development and yields in KenyaLatha Nagarajan, Anwar Naseem and Carl Pray
22 Building African agribusiness through trust and accountabilityKristin Franklin and James Oehmke
44 Political will and public will for climate-smart agriculture in Senegal: opportunities for agricultural transformationEric D. Raile, Linda M. Young, Adama Sarr, Samba Mbaye, Amber N.W. Raile, Lena Wooldridge, Diaminatou Sanogo and Lori Ann Post
63 Farmers’ usage preferences for Rwanda’s Volcanoes National ParkIldephonse Musafili, Jean Chrysostome Ngabitsinze, Fidèle Niyitanga and Dave Weatherspoon
78 Distribution of agricultural productivity gains in selected Feed the Future African countriesCharles B. Moss and Andrew Schmitz
ISBN 978-1-78973-841-4
Journal of
Agribusiness in Developing and
Emerging Economies Agribusiness and food security
in Africa
Guest Editor: Charles B. Moss
Quarto trim size: 174mm x 240mm
GUEST EDITORCharles B. MossUniversity of Florida, USA
EDITORSProfessor Ashok K. MishraArizona State University, USAE-mail [email protected]
ASSOCIATE EDITORSProfessor M.K. AwasthiIndian Institute of Management, Lucknow, IndiaProfessor Hung-Hao ChangNational Taiwan University, TaiwanDr Steven HaggbladeMichigan State University, USADr Getu HailuUniversity of Guelph, Canada Dr Stefan HirschETH, Switzerland Dr Anjani KumarInternational Food Policy Research Institute, South Asia Office, India Professor Sergio LenceIowa State University, USA Dr Khondoker MottalebInternational Maize and Wheat Improvement Center (CIMMYT), MexicoDr Sapna A. Narula TERI University, IndiaProfessor Anthony RezitisUniversity of Helsinki, FinlandAdjunct Professor Hugo S. de Figueiredo JrUniversidade Federal do Ceará, BrazilAssociate Professor Saleem ShaikNorth Dakota State University, USA
PUBLISHERValerie RobillardE-mail [email protected]
CONTENT EDITORSimon BuckleyE-mail [email protected]
ISBN 978-1-78973-841-4ISSN 2044-0839© 2019 Emerald Publishing Limited
Emerald Publishing LimitedHoward House, Wagon Lane,Bingley BD16 1WA, United KingdomTel +44 (0) 1274 777700; Fax +44 (0) 1274 785201E-mail [email protected] more information about Emerald’s regional offices please go tohttp://www.emeraldgrouppublishing.com/officesCustomer helpdesk :Tel +44 (0) 1274 785278; Fax +44 (0) 1274 785201E-mail [email protected], subscription and missing claims enquiries:E-mail [email protected] +44 (0) 1274 777700; Fax +44 (0) 1274 785201
Missing issue claims will be fulfilled if claimed within six months of date of despatch. Maximum of one claim per issue.Hard copy print backsets, back volumes and back issues of volumes prior to the current and previous year can be ordered from Periodical Service Company. Tel +1 518 537 4700; E-mail [email protected] For further information go to www.periodicals.com/emerald.html
Reprints and permissions serviceFor reprint and permission options please see the abstract page of the specific article in question on the Emerald web site (www.emeraldinsight.com), and then click on the “Reprints and permissions” link. Or contact:E-mail [email protected] Publisher and Editors cannot be held responsible for errors or any consequences arising from the use of information contained in this journal; the views and opinions expressed do not necessarily reflect those of the Publisher and Editors, neither does the publication of advertisements constitute any endorsement by the Publisher and Editors of the products advertised.
No part of this journal may be reproduced, stored in a retrieval system, transmitted in any form or by any means electronic, mechanical, photocopying, recording or otherwise without either the prior written permission of the publisher or a licence permitting restricted copying issued in the UK by The Copyright Licensing Agency and in the USA by The Copyright Clearance Center. Any opinions expressed in the articles are those of the authors. Whilst Emerald makes every effort to ensure the quality and accuracy of its content, Emerald makes no representation implied or otherwise, as to the articles’ suitability and application and disclaims any warranties, express or implied, to their use.
Emerald is a trading name of Emerald Publishing LimitedPrinted by CPI Group (UK) Ltd, Croydon, CR0 4YY
Journal of Agribusiness in Developing and Emerging Economies is indexed and abstracted in:Cabell's Directory of Publishing OpportunitiesEconLitInspecRePEc: Research Papers in Economics Summon Is ranked by:ABDC (Australia) Polish Scholarly Bibliography (PBN)
The Journal of Agribusiness in Developing and Emerging Economies (JADEE) showcases research about the farm-to-fork value chain and its implications for economic and societal development in Asia, Africa, Latin America and Eastern Europe. JADEE interprets agribusiness as a discipline that studies the food and agriculture system – the individual elements and their interdependencies.
Quarto trim size: 174mm x 240mm
Guidelines for authors can be found at:www.emeraldgrouppublishing.com/jadee.htm
EDITORIAL ADVISORY BOARD
Dr Per Pinstrup-AndersenCornell University, USADr S. AyyappanIndian Council of Agricultural Research, IndiaDr Elizabeth M.M.Q FarinaUniversidade de Sao Paulo, BrazilDr Gershon FederInternational Food Policy Research Institute, USADr Wenge FuChina Agricultural University, People’s Republic ofChinaProfessor Kevin HollandCardiff Business School, University of Cardiff, UK
Professor Mark ManfredoArizona State University, USADr Bharat RamaswamiIndian Statistical Institute Delhi, India
Dr Thomas ReardonMichigan State University, USADr Johan SwinnenKu Leuven, BelgiumDr Calum G. TurveyCornell University, USAK. VijayaraghavanSathguru Management Consultants, IndiaDr Xian XinChina Agricultural University, People’s Republic ofChina
EDITORIAL REVIEW BOARD
Dr Atanu AdhikariIndian Institute of Management Kozhikode, IndiaDr Pratap BirthalNational Centre for Agricultural Economics andPolicy Research, IndiaDr Kris ByronSyracuse University, USADr Arshinder KaurCurtin University, AustraliaDr Bart MintenInternational Food Policy Research Institute,EthiopiaDr Gopal NaikIIM Bangalore, IndiaDr Devesh RoyInternational Food Policy Research Institute, USADr Raja P. VeluSyracuse University, USA
Journal of Agribusiness inDeveloping and Emerging
EconomiesVol. 9 No. 1, 2019
p. 1r Emerald Publishing Limited
2044-0839
1
Editorialboards
Quarto trim size: 174mm x 240mm
Guest editorial
Impact analysis of interventions in feed the future countries in AfricaThe papers in this issue examine the impact of a variety of Feed the Future efforts inNorth Africa. The first paper (Nagarajan, Naseem and Pray) examines the impact of maizedevelopment policies in Kenya. Maize yields in Kenya have been stagnant since the 1980s.While a variety of issues from macroeconomic considerations to shifts in the importance oftrade liberalization has been identified, a large portion of the stagnation can be attributedto the slow adoption of new varieties. Nagarajan, Naseem and Pray examine the extent towhich the slow adoption of new varieties of maize can be attributed to changes ingovernment policy. They find that past R&D efforts have made marginal contributions toincrease the yield. In fact, the largest impact appears to be the introduction of plant breederrights. Based on these findings, they suggest that the R&D efforts in Kenya be directed tothe adoption of new varieties that target the replacement of old varieties. In particular, thefocus should be on traits that manage biotic and abiotic stresses.
Franklin and Oehmke develop a model of trust in building agribusiness channels in Africa.The “hold-up” models found in Oliver Williamson’s research are well known in a developedeconomy context. In these models, the uncertainty of valuation in a vertical marketing channelcan be overcome by one firm purchasing ownership in the next firm in the marketing channel.However, in a development context as developed in the models of Elinor Ostrom, the firms inthe vertical channel lack access to capital so vertical integration is not an option. As a result,some other social convention – such as trust – must be used in place of integration. Franklinand Oehmke examine the use of trust, accountability and mutual accountability and theimplementation of each factor to establish a marketing channel in African agribusiness. As acase study, they analyze the quality channel for Rwandan coffee. In general, the coffee channeldeveloped within the context of two USAID efforts – the Partnership to Enhance Agriculturein Rwanda through Linkages and Sustainable Partnerships to Enhance Rural Enterprises andAgricultural Development. During the active intervention by USAID, trust and accountabilitywere easier to maintain. However, the study finds that after the termination of the programs,the international market price for higher valued coffee softened and the gains in trust andaccountability were more difficult to maintain.
The paper by Raile et al. takes a somewhat different approach to impact analysis.Specifically, this paper examines both the political and public will required to make a policycommitment in a developing economy. Specifically, Raile et al. examine whether the political orpublic will is sufficient in Senegal to make the policy commitment for Climate SmartAgriculture (CSA). From a political will perspective, Senegal has a well-defined system ofleadership and that leadership has a common understanding of the problem. However, theremay be a disconnect between the state problem – adoption of agricultural technologies thatare resistant to climate variations and will not contribute to further climatic degradation – andthe perceived political program which is the need for Senegal to be self-sufficient in rice. Whilerice production is a component of CSA, increased production of rice may have an adverseimpact on some climate dimensions (i.e. increased production of rice will probably implyincreased irrigation which means increased use of energy (and, hence, carbon emissions), andincreased use of chemical fertilizers). Similarly, there may difficulties in defining a smallnumber of policy prescriptions. Raile et al. find that there are 200 different efforts led bydifferent donors and other agencies which purport to represent CSA.
Musafili et al. examine the willingness of farmers in the area around Rwanda’s VolcanoesNational Park to adopt production rules, which benefit the environmental quality of the
Journal of Agribusiness inDeveloping and EmergingEconomiesVol. 9 No. 1, 2019pp. 2-3© Emerald Publishing Limited2044-0839DOI 10.1108/JADEE-09-2018-0128
2
JADEE9,1
Quarto trim size: 174mm x 240mm
national park. The Volcanoes National Park is located in Northern Rwanda on the border withUganda. It is probably best known for its Mountain Gorillas. Agriculture in the area of thepark yields several different crops from Pyrethrum (a pesticide derived fromchrysanthemum), mushrooms, jatropha and honey. The environmental consequences ofeach production process can be managed to a greater or lesser extent by a variety ofproduction systems. Using a choice experiment, Musafili et al. examine the willingnessof farmers in the area to adopt these modified production systems.
Moss and Schmitz take a more traditional welfare approach to examine the implicationsof investments in supply chains in developing countries. Specifically, Moss and Schmitzexamine the export vs domestic market scenario to examine the potential benefits and costsof a variety of potential interventions. They begin by examining the costs and gains ofcassava improvements in Uganda. First, they assume that cassava is largely consumed as afood stuff in the local market. These results are contrasted with the possibility thatimprovements in cassava production are used in the production of ethanol. Building on theconcept of domestic demand vs export demand, they develop an extensive model of Rwandacoffee. In this framework, high-valued coffee is exported. Hence, the gains within theeconomy are improved income to coffee producers.
Charles B. MossFood and Resource Economics Department, University of Florida,
Gainesville, Florida, USA
3
Guest editorial
Contribution of policy change onmaize varietal development and
yields in KenyaLatha Nagarajan
International Fertilizer Development Center, Washington,District of Columbia, USA, and
Anwar Naseem and Carl PrayDepartment of Agricultural, Food and Resource Economics,
Rutgers, The State University of New Jersey, New Brunswick, New Jersey, USA
AbstractPurpose – Since the start of seed and other market reforms in the 1990s, the annual number of improvedvarietal releases for maize in Kenya has increased substantially. Prior to the reforms, private firms wererestricted in introducing new varieties, could not protect their intellectual property and farmers had to relyexclusively on improved seeds developed and marketed by the public sector. Reforms have resulted in notonly private firms entering the market and releasing improved varieties, but also an increase in varietalreleases by the public sector. The purpose of this paper is to review some of the key policy reforms related tomaize in Kenya, and their impacts on varietal development and yields.Design/methodology/approach – The authors estimate a yield model that relates national maize yields toa number of input policy variables. The authors employ a two-stage least square regression, as one of theexplanatory variables – the number of varietal releases – is likely endogenous with yield. The authorsuse policy variables such as public R&D, the number of plant breeder’s rights issued, and the years sinceprivate varieties have been introduced as instrument variables to estimate their influence new varietalreleases directly, and then new varieties, inputs and other policies to measure their impact on yields.Findings – The results show that policy changes such as the introduction of intellectual property rights had animportant impact on the number of improved maize varieties released. However, the outcomes of the policychange such as the number of varieties and the share of area under improved varieties has no impact onincreasing maize yields. The authors argue that this is because farmers continue to use older improved varietiesbecause of the dominance of a parastatal in the maize, seed market and that newer improved varieties may nothave the assumed yield advantage. Future policy and programs should be directed toward increasing theadoption of improved varieties rather than simply releasing them.Originality/value – This paper provides evidence that while policy change may lead to new varietaldevelopment and release, its aggregate productivity impacts may be limited without additional reformsand intervention.Keywords Kenya, Maize, Policy impact, Private sector developmentPaper type Research paper
1. IntroductionRaising productivity is essential to sustain economic and income growth. In turn, technicalchange is the main driver of increased productivity, underlining the ongoing importance offocusing on technology as a primary change agent. The experience of industrializedcountries confirms this insight where empirical findings consistently show that technicaladvances have been the main contributor to growth. This has also been the case withinagriculture where rapid increase in productivity is often due to the adoption of specifictechnologies, such as hybrid maize, genetically modified crops, mechanization and the use ofchemical inputs.
Despite the recognition that technology is important for growth, it remains under utilizedin many countries, particularly in Sub-Saharan Africa (SSA). Modern input use remains low,exemplified by the low rates of fertilizer application. For SSA, fertilizer use intensity averagedless than 16 kg/ha of arable land in 2014, whereas it averaged 160, 345 and 130 kg/ha for
Journal of Agribusiness inDeveloping and EmergingEconomiesVol. 9 No. 1, 2019pp. 4-21© Emerald Publishing Limited2044-0839DOI 10.1108/JADEE-01-2018-0013
Received 25 January 2018Revised 6 July 2018Accepted 20 July 2018
The current issue and full text archive of this journal is available on Emerald Insight at:www.emeraldinsight.com/2044-0839.htm
4
JADEE9,1
Quarto trim size: 174mm x 240mm
South Asia, East Asia and Latin America, respectively (FAO, 2018). The use of improved seedvarieties (IVs) – a key ingredient to the success of the Asian Green Revolution – is also low,accounting for 35 percent of all food crops grown in SSA in 2010 (Walker and Alwang, 2015).
The low use of farm inputs in SSA is at odds with the considerable farm-level evidencethat shows SSA farmers benefit when they use improved varieties, especially for maize(Doss et al., 2003; Evenson and Gollin, 2003; Renkow and Byerlee, 2010; Mathenge et al.,2014; Fuglie and Marder, 2015). Evenson and Gollin (2003) estimate that 88 percent of thecereal yield growth in Asia between 1960 and 1986 was due to crop genetic improvementsand the use of IVs, but only 28 percent for SSA, reflecting the limited role that IVs haveplayed in yield growth in SSA.
There are many reasons for the low use of modern inputs and technology in Africanagriculture, and significant differences exist across and even within countries (e.g. Sheahan andBarrett, 2017). Ultimately, the non-adoption of productivity improving technologies rests on acombination of economic (the technology is not profitable), institutional (regulatory barriers andpoor governance may limit availability) and social constraints. Policy – or lack thereof – can alsobe an important determinant of technology adoption. Providing subsidies and other incentivesare the most direct ways that governments encourage IV adoption. More subtle are policiesrelated to market competition and innovations that can lower input prices and increase choicesfor farmers to suit their specific economic and agro-ecological needs.
Whether or not a given a policy or a set of policies has the desired outcome is anempirical question and is the focus of this study. Specifically, our interest is to understandthe role that policy changes have had on the supply of improved maize varieties in Kenyaand maize productivity. In particular, we examine whether market-friendly policiesdesigned to encourage private sector participation in Kenya’s seed sector have contributedto improvements in maize productivity. Since the late 1990s, Kenya’s market reforms haveresulted in the entry of a number of private firms in the maize seed market and a markedincrease in the number of IVs that have been released (Swanckaert, 2012). As shown in thefollowing sections, of the 354 IVs of maize released between 1964 and 2015, 333 (94 percent)were introduced after 1999. Identifying the role of policy change in increasing the number ofmaize IVs and changing maize yields is the main objective of this paper.
Such an analysis is important for a number of reasons. First, the main rationale forliberalizing agricultural input markets has been to encourage competition, innovation andhigher productivity. An analysis of productivity trends before and after liberalization willhelp establish whether this occurred in Kenya. Second, some have suggested that theliberalization policies for Kenya’s seed markets have only been partially implemented asevidenced by the continued dominance of the Kenya Seed Company (KSC) (a public sectorfirm) in the market (Swanckaert, 2012) and the presence of older maize varieties (Smale andOlwande, 2014). If it can be shown that there is an association between the number of newmaize varieties released and increased productivity, it would lend support to further reformsthat enable greater varietal releases in Kenya, as well as in other countries. For example,Gisselquist et al. (2013) contend that regulatory hurdles discourage firms from releasing newvarieties in Africa, with the implication that it limits productivity. Finally, while there are anumber of studies that assess the impacts of modern inputs, nearly all have been at thefarm-level, seeking to understand either farm impacts or determinants of farm adoption.To our knowledge, there has been no macro-level assessment of productivity changes frompolicies designed to increase input use in SSA.
As such in this paper, the macro-level determinants of maize productivity in Kenya areexamined, with a focus on policies to encourage private sector participation and the role ofimproved varieties. The analysis consists of first examining production and yield trends tosee whether yields changed post-liberalization by employing a yield model to relate nationalmaize yields with a number of exogenous factors. One of the explanatory variables – the
5
Contribution ofpolicy change
number of varieties – is likely endogenous with yield. As a result, public research anddevelopment (R&D), the number of plant breeder’s rights (PBRs) issued, and the years sincethe introduction of varieties as instrumental variables for the number of varieties aredeployed in a two-stage least square (2SLS) regression.
This paper proceeds by providing a background to maize production in Kenya, inparticular a description of the maize seed system and policies and institutions affectingmaize development. Section 3 presents the empirical model relating policy change ioninnovation and maize productivity to innovation. The results are discussed in Section 4.Section 5 concludes the paper.
2. Background2.1 Maize in KenyaMaize is the main staple in Kenya, accounting for nearly 40 percent of the cultivated area,2.4 percent of Kenya’s GDP and 12.65 percent of the agricultural GDP (FAO, 2018). More than75 percent of the maize production comes from small farms, although only 20 percent of whatis produced by smallholders is sold in the market (Chemonics, 2010). Kenya’s per-capita maizeconsumption (measured in kilograms (kg)) is estimated to average 103 kg/person/year(average for 2012–2014), compared to 73 kg/person/year for Tanzania, 52 kg/person/year forEthiopia, and 31 kg/person/year for Uganda (FAO, 2018).
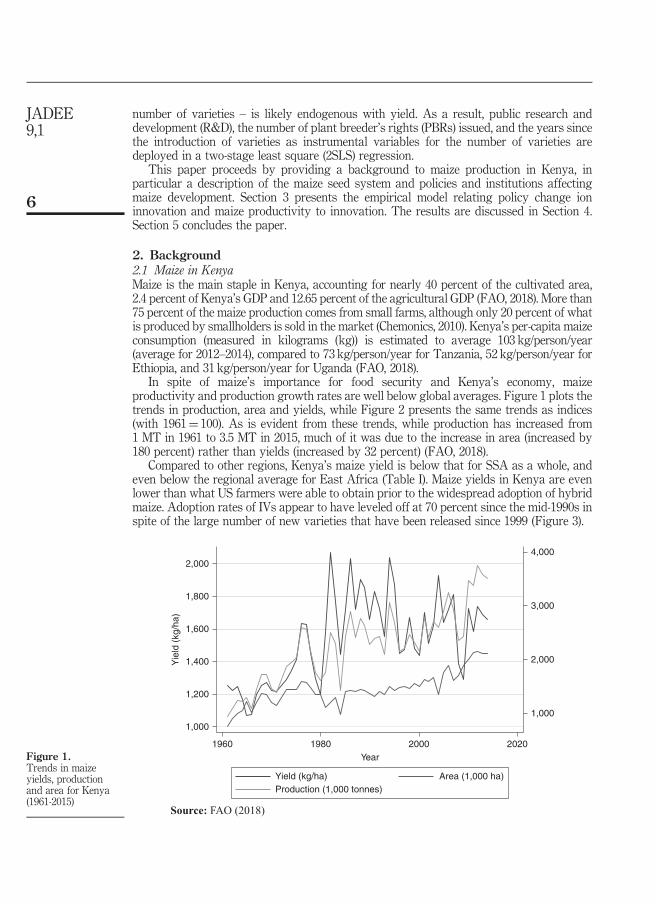
In spite of maize’s importance for food security and Kenya’s economy, maizeproductivity and production growth rates are well below global averages. Figure 1 plots thetrends in production, area and yields, while Figure 2 presents the same trends as indices(with 1961¼ 100). As is evident from these trends, while production has increased from1 MT in 1961 to 3.5 MT in 2015, much of it was due to the increase in area (increased by180 percent) rather than yields (increased by 32 percent) (FAO, 2018).
Compared to other regions, Kenya’s maize yield is below that for SSA as a whole, andeven below the regional average for East Africa (Table I). Maize yields in Kenya are evenlower than what US farmers were able to obtain prior to the widespread adoption of hybridmaize. Adoption rates of IVs appear to have leveled off at 70 percent since the mid-1990s inspite of the large number of new varieties that have been released since 1999 (Figure 3).
1,000
2,000
3,000
4,000
1,000
1,200
1,400
1,600
1,800
2,000
Yie
ld (
kg/h
a)
1960 1980 2000 2020Year
Area (1,000 ha)Yield (kg/ha)Production (1,000 tonnes)
Source: FAO (2018)
Figure 1.Trends in maizeyields, productionand area for Kenya(1961-2015)
6
JADEE9,1
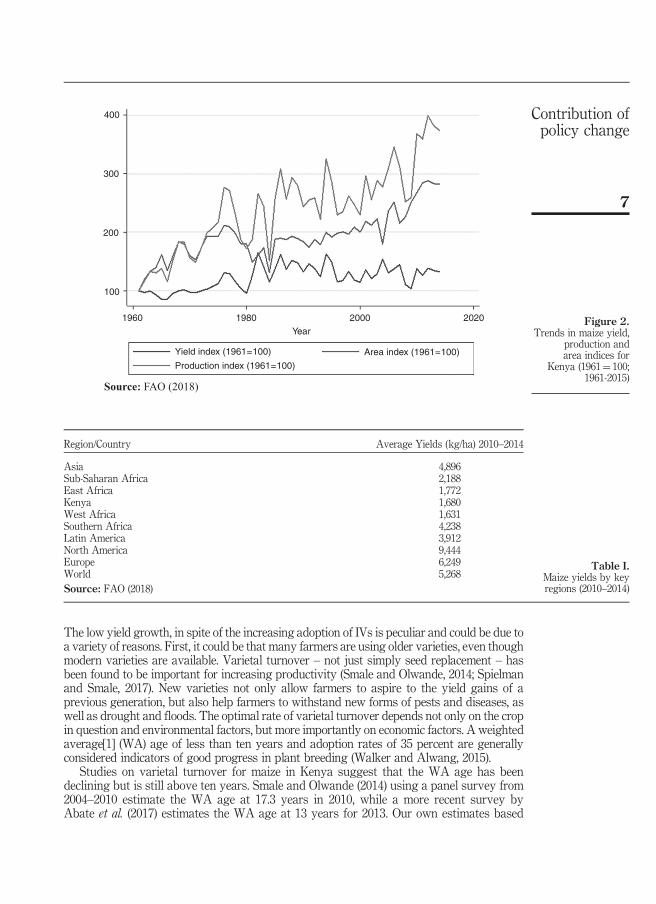
The low yield growth, in spite of the increasing adoption of IVs is peculiar and could be due toa variety of reasons. First, it could be that many farmers are using older varieties, even thoughmodern varieties are available. Varietal turnover – not just simply seed replacement – hasbeen found to be important for increasing productivity (Smale and Olwande, 2014; Spielmanand Smale, 2017). New varieties not only allow farmers to aspire to the yield gains of aprevious generation, but also help farmers to withstand new forms of pests and diseases, aswell as drought and floods. The optimal rate of varietal turnover depends not only on the cropin question and environmental factors, but more importantly on economic factors. A weightedaverage[1] (WA) age of less than ten years and adoption rates of 35 percent are generallyconsidered indicators of good progress in plant breeding (Walker and Alwang, 2015).
Studies on varietal turnover for maize in Kenya suggest that the WA age has beendeclining but is still above ten years. Smale and Olwande (2014) using a panel survey from2004–2010 estimate the WA age at 17.3 years in 2010, while a more recent survey byAbate et al. (2017) estimates the WA age at 13 years for 2013. Our own estimates based
400
300
200
100
1960 1980Year
Yield index (1961=100) Area index (1961=100)
Production index (1961=100)
2000 2020
Source: FAO (2018)
Figure 2.Trends in maize yield,
production andarea indices for
Kenya (1961¼ 100;1961-2015)
Region/Country Average Yields (kg/ha) 2010–2014
Asia 4,896Sub-Saharan Africa 2,188East Africa 1,772Kenya 1,680West Africa 1,631Southern Africa 4,238Latin America 3,912North America 9,444Europe 6,249World 5,268Source: FAO (2018)
Table I.Maize yields by keyregions (2010–2014)
7
Contribution ofpolicy change

on 2009 survey data from DIIVA[2] suggest the WA age at 19 years, with nearly 43 percentof the area cultivated by varieties that are 10 years old or less (Table II).
Second, the new varieties that are adopted may not significantly improve yieldscompared to those of the varieties they are intended to replace. Karanja (1996) found for
0.8 50
40
30
20
10
0
0.6
0.4
0.2
0.0
1960Year
20001980
Sha
re o
f mai
ze a
rea
due
to IV
Share of maize area due to IV
Number of improved varieties released
Num
ber
of im
prov
ed v
arie
ties
rele
ased
2020
Source: Authors based on data from CGIAR (2015) and Kenya Plant HealthInspectorate Service (KEPHIS) (2017)
Figure 3.Adoption of IV ofmaize and release ofnew maize varieties(1961-2014)
1993 2009Variety % Area Variety % Area
By varietyH614D 41.8 H614D 22.6H625 22.9 SC DUMA 411 7.2H626 12.8 H624 4.7H511 7.2 Katumani 3.8Katumani 5.3 H6210 3.1Rest (5 var) 7.6 Rest (60 var) 35.5Total 97.6 Total 76.9
By type (public vs private)Public(KARI/KSC) 100 74.8
Private 25.2Seedco 9.8Pannar seed 7.3Pioneer 3.9Western seed company 3.8Monsanto 3.7
By ageo10 years 55.4 42.710–20 years 14.2W20 years 42.8 43.1Weighted age 23 19
Source: Hassan and Karanja (1997) for 1993 and CGIAR (2015) for 2009
Table II.Maize varietaladoption in Kenya(1993 and 2009)
8
JADEE9,1
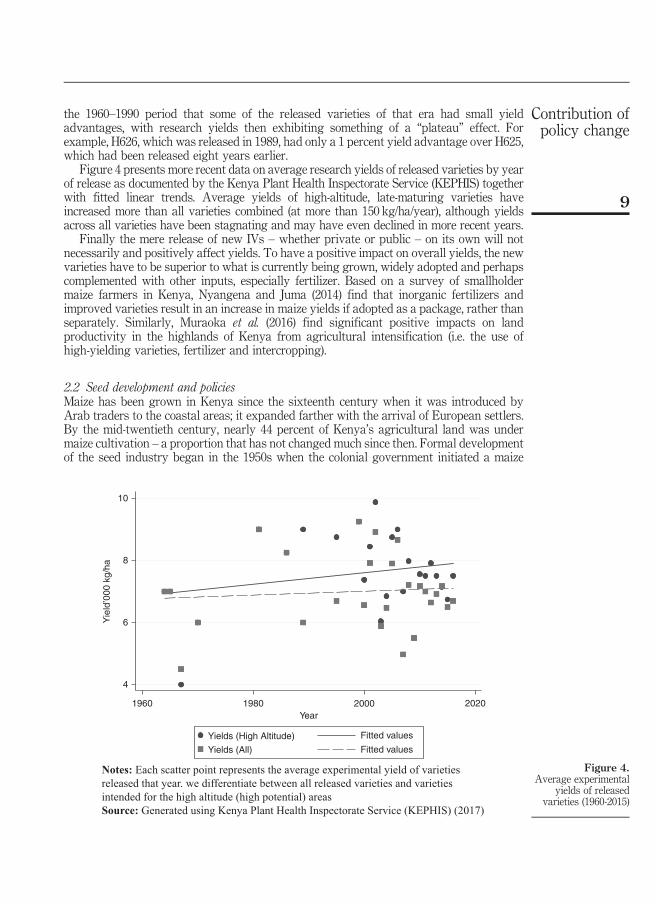
the 1960–1990 period that some of the released varieties of that era had small yieldadvantages, with research yields then exhibiting something of a “plateau” effect. Forexample, H626, which was released in 1989, had only a 1 percent yield advantage over H625,which had been released eight years earlier.
Figure 4 presents more recent data on average research yields of released varieties by yearof release as documented by the Kenya Plant Health Inspectorate Service (KEPHIS) togetherwith fitted linear trends. Average yields of high-altitude, late-maturing varieties haveincreased more than all varieties combined (at more than 150 kg/ha/year), although yieldsacross all varieties have been stagnating and may have even declined in more recent years.
Finally the mere release of new IVs – whether private or public – on its own will notnecessarily and positively affect yields. To have a positive impact on overall yields, the newvarieties have to be superior to what is currently being grown, widely adopted and perhapscomplemented with other inputs, especially fertilizer. Based on a survey of smallholdermaize farmers in Kenya, Nyangena and Juma (2014) find that inorganic fertilizers andimproved varieties result in an increase in maize yields if adopted as a package, rather thanseparately. Similarly, Muraoka et al. (2016) find significant positive impacts on landproductivity in the highlands of Kenya from agricultural intensification (i.e. the use ofhigh-yielding varieties, fertilizer and intercropping).
2.2 Seed development and policiesMaize has been grown in Kenya since the sixteenth century when it was introduced byArab traders to the coastal areas; it expanded farther with the arrival of European settlers.By the mid-twentieth century, nearly 44 percent of Kenya’s agricultural land was undermaize cultivation – a proportion that has not changed much since then. Formal developmentof the seed industry began in the 1950s when the colonial government initiated a maize
10
Yie
ld’0
00 k
g/ha
8
6
4
19801960
Yields (High Altitude)
Yields (All) Fitted values
Fitted values
2000 2020Year
Notes: Each scatter point represents the average experimental yield of varietiesreleased that year. we differentiate between all released varieties and varietiesintended for the high altitude (high potential) areasSource: Generated using Kenya Plant Health Inspectorate Service (KEPHIS) (2017)
Figure 4.Average experimental
yields of releasedvarieties (1960-2015)
9
Contribution ofpolicy change
research program in western Kenya. Since then the industry has gone through distinctdevelopment phases that can be delineated by productivity growth[3].
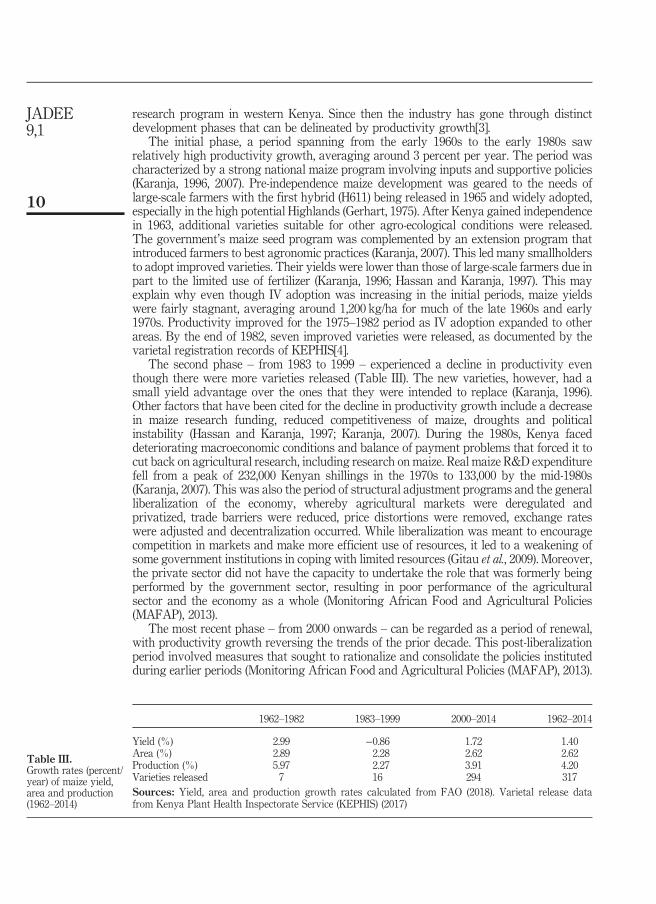
The initial phase, a period spanning from the early 1960s to the early 1980s sawrelatively high productivity growth, averaging around 3 percent per year. The period wascharacterized by a strong national maize program involving inputs and supportive policies(Karanja, 1996, 2007). Pre-independence maize development was geared to the needs oflarge-scale farmers with the first hybrid (H611) being released in 1965 and widely adopted,especially in the high potential Highlands (Gerhart, 1975). After Kenya gained independencein 1963, additional varieties suitable for other agro-ecological conditions were released.The government’s maize seed program was complemented by an extension program thatintroduced farmers to best agronomic practices (Karanja, 2007). This led many smallholdersto adopt improved varieties. Their yields were lower than those of large-scale farmers due inpart to the limited use of fertilizer (Karanja, 1996; Hassan and Karanja, 1997). This mayexplain why even though IV adoption was increasing in the initial periods, maize yieldswere fairly stagnant, averaging around 1,200 kg/ha for much of the late 1960s and early1970s. Productivity improved for the 1975–1982 period as IV adoption expanded to otherareas. By the end of 1982, seven improved varieties were released, as documented by thevarietal registration records of KEPHIS[4].
The second phase – from 1983 to 1999 – experienced a decline in productivity eventhough there were more varieties released (Table III). The new varieties, however, had asmall yield advantage over the ones that they were intended to replace (Karanja, 1996).Other factors that have been cited for the decline in productivity growth include a decreasein maize research funding, reduced competitiveness of maize, droughts and politicalinstability (Hassan and Karanja, 1997; Karanja, 2007). During the 1980s, Kenya faceddeteriorating macroeconomic conditions and balance of payment problems that forced it tocut back on agricultural research, including research on maize. Real maize R&D expenditurefell from a peak of 232,000 Kenyan shillings in the 1970s to 133,000 by the mid-1980s(Karanja, 2007). This was also the period of structural adjustment programs and the generalliberalization of the economy, whereby agricultural markets were deregulated andprivatized, trade barriers were reduced, price distortions were removed, exchange rateswere adjusted and decentralization occurred. While liberalization was meant to encouragecompetition in markets and make more efficient use of resources, it led to a weakening ofsome government institutions in coping with limited resources (Gitau et al., 2009). Moreover,the private sector did not have the capacity to undertake the role that was formerly beingperformed by the government sector, resulting in poor performance of the agriculturalsector and the economy as a whole (Monitoring African Food and Agricultural Policies(MAFAP), 2013).
The most recent phase – from 2000 onwards – can be regarded as a period of renewal,with productivity growth reversing the trends of the prior decade. This post-liberalizationperiod involved measures that sought to rationalize and consolidate the policies institutedduring earlier periods (Monitoring African Food and Agricultural Policies (MAFAP), 2013).
1962–1982 1983–1999 2000–2014 1962–2014
Yield (%) 2.99 −0.86 1.72 1.40Area (%) 2.89 2.28 2.62 2.62Production (%) 5.97 2.27 3.91 4.20Varieties released 7 16 294 317Sources: Yield, area and production growth rates calculated from FAO (2018). Varietal release datafrom Kenya Plant Health Inspectorate Service (KEPHIS) (2017)
Table III.Growth rates (percent/year) of maize yield,area and production(1962–2014)
10
JADEE9,1
Munyi and Jonge (2015) document 131 pieces of legislation that have been overhauled since2000, many of them through a consultative process of the different stakeholders involved asnoted by Gitau et al. (2009). Some of these changes were part of the government’s Strategyfor Revitalizing Agriculture (SRA) that was initiated in 2005. There were two notable shiftsthat occurred under SRA (Monitoring African Food and Agricultural Policies (MAFAP),2013; Poulton and Kanyinga, 2014). First, Kenya was to move away from the goal ofachieving food self-sufficiency (the objective that guided much of the agricultural policy inearlier periods) to one that emphasized wealth creation and employment generation as away to ensure food security. Second, private and public sectors were to play complementaryroles to ensure efficient functioning of markets and optimal resource allocation. Under SRA,the public sector was to provide a limited number of goods and services, and a reduced butmore focused approach to regulating the market that likely cannot be achieved throughprivate self-regulation (Alila and Atieno, 2006; Monitoring African Food and AgriculturalPolicies (MAFAP), 2013).
Policies that directly affect the supply and demand of improved maize varieties have alsoevolved over the years. Many of these policies relate to varietal trade, registration andeventual release of varieties to farmers as most varieties are developed abroad and need to beimported. Prior to liberalization, while foreign germplasm and knowledge transfer wasencouraged, the import of maize varieties was severely restricted. Like many importsubstitution policies, the goal was to promote the development of a local seed industry, but inreality only the KSC – a government-owned parastatal created in 1956 – benefited. It hadexclusive rights to market maize varieties developed by the (then) Kenyan AgriculturalResearch Institute (KARI). Even to this day almost two decades after liberalization,KSCmaintains exclusive rights to popular varieties and hybrids developed by public breedingprograms. Nevertheless, by 2015, there were 19 companies that had released 157 varieties andaccounted for 32 percent of the market share (The African Seed Access Index (TASAI), 2016).
The focus of policy reform has been on the ease and speed by which new varieties aremade available to farmers. In Kenya, the introduction of new varieties is regulated under the1972 Seed and Plant Varieties Act (SPVA) and its subsequent amendments, which requirethat firms submit them for official tests for value in cultivation and use. Varietal testing andregistration is meant to ensure the genetic identity of a variety while protecting consumers,farmers and the environment from inferior varieties. Prior to liberalization, the approval andcertification process was under the domain of KARI’s National Seed Quality and ControlBoard. Reforms during the late 1990s relegated this responsibility to KEPHIS – a newlycreated independent regulatory body.
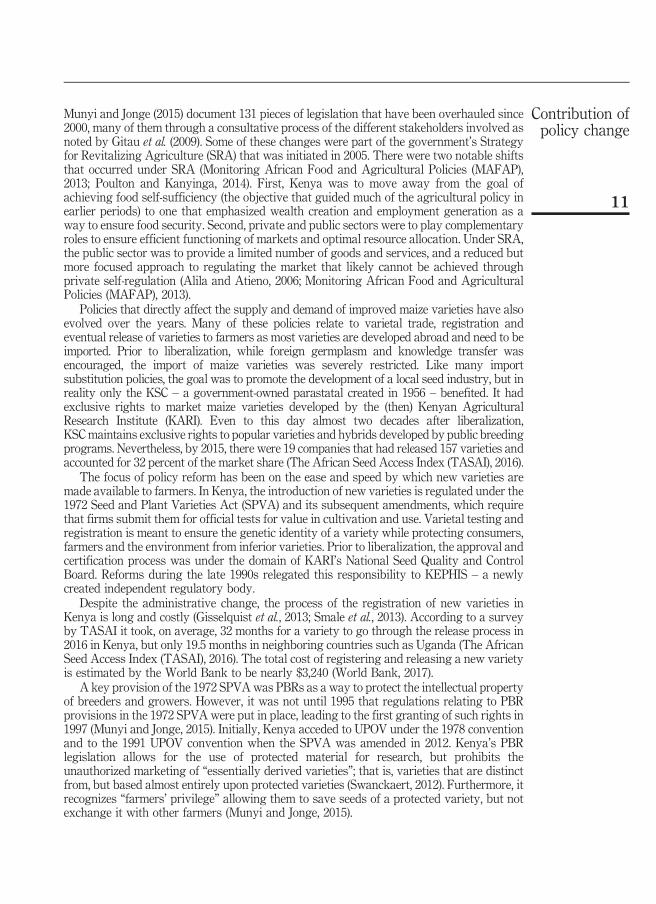
Despite the administrative change, the process of the registration of new varieties inKenya is long and costly (Gisselquist et al., 2013; Smale et al., 2013). According to a surveyby TASAI it took, on average, 32 months for a variety to go through the release process in2016 in Kenya, but only 19.5 months in neighboring countries such as Uganda (The AfricanSeed Access Index (TASAI), 2016). The total cost of registering and releasing a new varietyis estimated by the World Bank to be nearly $3,240 (World Bank, 2017).
A key provision of the 1972 SPVA was PBRs as a way to protect the intellectual propertyof breeders and growers. However, it was not until 1995 that regulations relating to PBRprovisions in the 1972 SPVA were put in place, leading to the first granting of such rights in1997 (Munyi and Jonge, 2015). Initially, Kenya acceded to UPOV under the 1978 conventionand to the 1991 UPOV convention when the SPVA was amended in 2012. Kenya’s PBRlegislation allows for the use of protected material for research, but prohibits theunauthorized marketing of “essentially derived varieties”; that is, varieties that are distinctfrom, but based almost entirely upon protected varieties (Swanckaert, 2012). Furthermore, itrecognizes “farmers’ privilege” allowing them to save seeds of a protected variety, but notexchange it with other farmers (Munyi and Jonge, 2015).
11
Contribution ofpolicy change
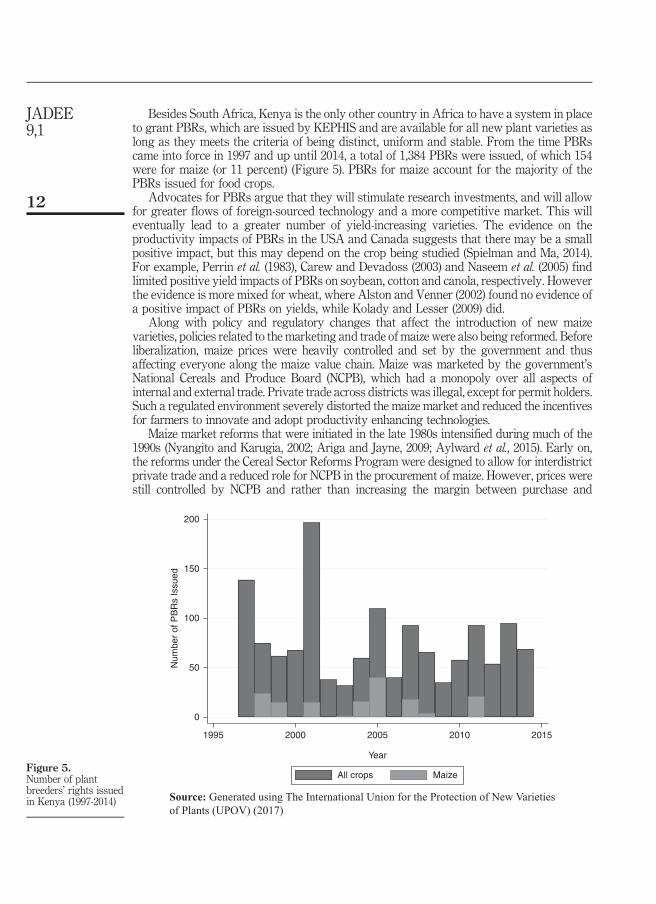
Besides South Africa, Kenya is the only other country in Africa to have a system in placeto grant PBRs, which are issued by KEPHIS and are available for all new plant varieties aslong as they meets the criteria of being distinct, uniform and stable. From the time PBRscame into force in 1997 and up until 2014, a total of 1,384 PBRs were issued, of which 154were for maize (or 11 percent) (Figure 5). PBRs for maize account for the majority of thePBRs issued for food crops.
Advocates for PBRs argue that they will stimulate research investments, and will allowfor greater flows of foreign-sourced technology and a more competitive market. This willeventually lead to a greater number of yield-increasing varieties. The evidence on theproductivity impacts of PBRs in the USA and Canada suggests that there may be a smallpositive impact, but this may depend on the crop being studied (Spielman and Ma, 2014).For example, Perrin et al. (1983), Carew and Devadoss (2003) and Naseem et al. (2005) findlimited positive yield impacts of PBRs on soybean, cotton and canola, respectively. Howeverthe evidence is more mixed for wheat, where Alston and Venner (2002) found no evidence ofa positive impact of PBRs on yields, while Kolady and Lesser (2009) did.
Along with policy and regulatory changes that affect the introduction of new maizevarieties, policies related to the marketing and trade of maize were also being reformed. Beforeliberalization, maize prices were heavily controlled and set by the government and thusaffecting everyone along the maize value chain. Maize was marketed by the government’sNational Cereals and Produce Board (NCPB), which had a monopoly over all aspects ofinternal and external trade. Private trade across districts was illegal, except for permit holders.Such a regulated environment severely distorted the maize market and reduced the incentivesfor farmers to innovate and adopt productivity enhancing technologies.
Maize market reforms that were initiated in the late 1980s intensified during much of the1990s (Nyangito and Karugia, 2002; Ariga and Jayne, 2009; Aylward et al., 2015). Early on,the reforms under the Cereal Sector Reforms Program were designed to allow for interdistrictprivate trade and a reduced role for NCPB in the procurement of maize. However, prices werestill controlled by NCPB and rather than increasing the margin between purchase and
200
Num
ber
of P
BR
s Is
sued
150
100
50
0
1995 20052000 2010 2015
Year
All crops Maize
Source: Generated using The International Union for the Protection of New Varietiesof Plants (UPOV) (2017)
Figure 5.Number of plantbreeders’ rights issuedin Kenya (1997-2014)
12
JADEE9,1
selling price to encourage private participation, margins declined (Sheahan et al., 2016).Further reforms were implemented in the mid-1990s that allowed for the free movement ofmaize, and the removal of both price controls and direct subsidies to millers.
The private sector was allowed to import maize but faced a changing tariff structure.Initially, the maize import tariff was removed in 1993, but was reimposed in 1995.Jayne et al. (2008) find that the maize import tariff over the 1995–2004 period raised averagedomestic prices by roughly 4 percent, although in several particular years, the import tariffcaused domestic prices to increase by well over 10 percent. More recent trade measures haveincluded the removal of tariff barriers with neighboring countries. Nevertheless, thegovernment continues to impose tariffs and export bans often in an unpredictable fashion.
Alongside reforms specific to the maize market, the fertilizer market has also beensubject to considerable policy changes. Before market reforms, the market was controlled bygovernment-run agencies with limited private trade and controlled (subsidized) prices. Dueto mismanagement, weak distribution networks and poor coordination, fertilizer did notreach many farmers. Reforms introduced in the early 1990s sought to address this asrestrictions on private traders, tariffs and price controls were either abolished orconsiderably relaxed. As a result, by 1996, there were 12 major importers, 500 wholesalersand nearly 5,000 retailers (Ariga and Jayne, 2011). Fertilizer consumption grew at nearly 10percent per year between 1990 and 2005, nearly double the rate 15 years prior (FAO, 2018).
More recent policies and programs directed at maize and fertilizer markets have soughtto target resource-poor smallholders, often by providing input subsidies. In particular,after the 2008 world food price crisis and 2009 post-election violence, the governmentintervened to aid farmers. Nearly 30,000 tonnes of fertilizer were imported and distributedvia NCPB branches and private retailers at a 40 percent subsidy. However, the subsidiesthrough NCPB have been found to lack clear targeting criteria and have been diverted tonon-targeted beneficiaries by as much as 33 percent ( Jayne et al., 2013).
3. Empirical analysisCrop productivity is a function of a number of exogenous factors, such as the types andamount of inputs used, agro-climatic conditions, technology employed and the incentives/disincentives created by the policy environment. It is hypothesized that the policy reformsthat led to the opening of markets, technology development (in the form of new varietalreleases) and PBRs all had an impact on maize yields. Testing this hypothesis, however, ischallenging for a number of reasons. First, the process of reforms takes time and its effectsmay not be evident until years later. As discussed earlier, liberalization of the agriculturalsector in Kenya began in the late 1980s but was enacted slowly and with considerablehesitancy, especially with regards to maize marketing and trade. Second, policy reform is abroad concept that involves changes to a number of different specific policies that may ormay not have an impact on productivity. It is unclear, for example, whether reforms directedat removing price distortions (price policy) have the same impact on productivity as thosethat seek to improve farmer access to technology (technology policy). If technology policy ismore important to increasing productivity than price policy and the latter is implementedfirst in the reform process, then the impacts of policy reforms may not be evident until afterthe technology policy comes into force. As such, there needs to be clarity in terms of what ismeant by policy reforms and when a specific policy change occurs. Third, data required toperform such a hypothesis test may not be available. For example, in a model that relatesnational maize yields to input use over time would require actual inputs (fertilizer,pesticides, labor) used by maize farmers, details on their use of improved varieties (how old,whether private or public, whether hybrid or not) and the agro-climactic conditions faced.Although farm-level surveys of input use have been carried out by different researchers,consistent aggregate-level data specific for maize production are not available.
13
Contribution ofpolicy change
With these considerations in mind, the following general yield model can be used:
Yt ¼ b0tþb1tRAINFALLtþb2tFERTILIZERtþb3t IV_MAIZEt
þb4tP_MAIZEt�1þb5tVAR_MAIZEtþut ; (1)
where Yt is the national maize yield for Kenya in kg/ha in year t. RAINFALLt is the totalannual rainfall amount (mm) for Kenya in year t. Almost all agricultural production inKenya is rainfed, since less than 0.5 percent of the arable land is irrigated. While rainfall isan important factor in yield, the aggregate nature of this specific variable may misrepresentthe actual rainfall received in maize-growing regions located in the western (Highlands) partof the country, which are likely to be higher, as they benefit from bi-modal rainfall patterns(from short and long rain seasons). In the absence of such more detailed micro-level rainfalldata for the time period under study, total annual rainfall is used as a proxy. FERTILIZERtis the amount of total fertilizer consumed (kg/ha of maize area) in year t and is constructedby dividing the approximated total fertilizer nutrient (NPK) applied on maize by the maizearea. The variable FERTILIZERt is an approximation for the actual fertilizer used by maizefarmers as consumption data are not disaggregated by crop. However since 50 percent ofthe fertilizer consumption is for maize (Oseko and Dienya, 2015) and maize is the mostwidely grown crop by area, we divide total fertilizer consumption by 2 and divide it by themaize area in year t. We feel this is a reasonable approximation and indeed closelycorresponds to those reported in farm-level surveys (Ariga and Jayne, 2011). Application offertilizer may not be a linear relationship as implied by our specification, as there may bediminishing returns after a certain amount is applied. However, we do not feel this to be aconcern given that application rates are fairly low and the maximum amount is stillconsiderably less than for other maize-growing regions around the world. IV_MAIZEt isthe share of maize area under improved varieties. The data for this variable come from theDIIVA project, which uses secondary sources and survey data to create a time series of areaunder modern varieties for different crops. It is assumed that the share for all years betweenthe two survey points is constant, resulting in the step-wise logistic curve as depicted inFigure 3. Including both FERTILIZERt and IV_MAIZEt raises that the possibility ofbicollinearity (the correlation coefficient between the two is 0.8). As such we estimate themodel with these two variables separately. Total maize area (AREAt) is used as analternative measure of maize cultivation when FERTILIZERt is used as one of theexplanatory variable. P_MAIZEt−1, which is the average producer price of maize in yeart−1. Finally, VAR_MAIZEt is the total number of new maize varieties released in year t.We assume that newer varieties are likely to be as productive (if not more) than varietiescurrently grown, and hypothesize that the greater the number of varieties released in agiven year the greater the impact on yield in subsequent years.
There are three issues with the last of these variables that need further elaboration. First,the number of maize varieties released provides little information on their adoption, as manyreleased varieties may never get adopted. Data limitations prevent obtaining an annualestimate of how many of the released varieties are being adopted, but estimates from DIIVAfrom 2009 provide some indication. Of the 204 varieties that had been released and approvedfor cultivation up to that year, only 65 varieties were being grown. Of these, five varietiesaccounted for 65 percent of the cultivated area (see Table II). Furthermore even if thevarieties are adopted, the impact may not be contemporaneous, and it is likely the case thatit takes a year or longer for a variety to be sown after its introduction. To account for this,we introduce lags and cumulative number of varieties registered with KEPHIS in any givenyear in our specification.
A second issue is that VAR_MAIZEt is likely to be endogenous in Equation (1) andthe point estimates will be biased and inconsistent. Endogeneity is suspected here
14
JADEE9,1
because there may be unobservable factors that jointly determine yield (Y t) as wellas the number of varieties released (VAR_MAIZEt). For example, greater spending onresearch and technology development would lead to an increase in higher yieldingvarieties, and to more varieties and varietal choice. In order to control for suchendogeneity, a two-stage least squares (2SLS) regression approach is used to introduceinstrumental variables that are determinants of the number of varietal releases, but maynot affect maize yields directly.
A two-stage least squares estimation involves a first-stage regression of VAR_MAIZEt –appropriately lagged – on all exogenous variables plus variables to be used as instruments.Some candidates for exclusion restrictions are: R&D expenditures related to maizedevelopment (or alternatively the number of researchers), varieties released by privatefirms and varieties protected by PBRs. All three variables are also related to policychange. Greater R&D – both public and private – would be suggestive of a policy shift thatseeks to focus on increasing the productivity of agriculture and maize specifically.Unfortunately, a continuous time series for private R&D is fairly recent. Even so, theamount of private R&D expenditure is estimated to be extremely small relative to publicR&D ($1.6–$3.2m vs $263m in 2008 as reported by Pray et al. (2011). We also do not haveresearch expenditures by commodity. Given these limitations, total agricultural R&Dexpenditures bin year t is used as one of the instruments (denoted as RESEARCHtmeasuredin constant 2011 USmillion dollars). The RESEARCHt variable used here includesexpenditures by not only the Kenyan government, but also spending by donors and CGcenters. We also use research spending by CGIAR centers with mandates on maize research(notably CIMMYT and IITA).
As noted earlier, in the pre-reform period, there were no private firms developing ormarketing maize seeds. This changed around 1996 with the first private variety beingreleased. The presence of private firms is captured by a dummy variable (PRIVATEt) toindicate the release of varieties by private firms since 1996 (1 for ⩾1996; 0 otherwise).Finally, PBRs – a policy tool in its own right – would also indicate the availability ofproductive and valuable varieties. Kenya has been providing PBRs since 1996, issuing154 PBRs for maize between 1996 and 2014. However, not all PBR-protected varietiesare released and not all released varieties have a PBR associated with them. Since onlyreleased varieties could directly impact productivity, we use the cumulative numberof released varieties with PBRs in year t as the instrument (denoted as PBRt).
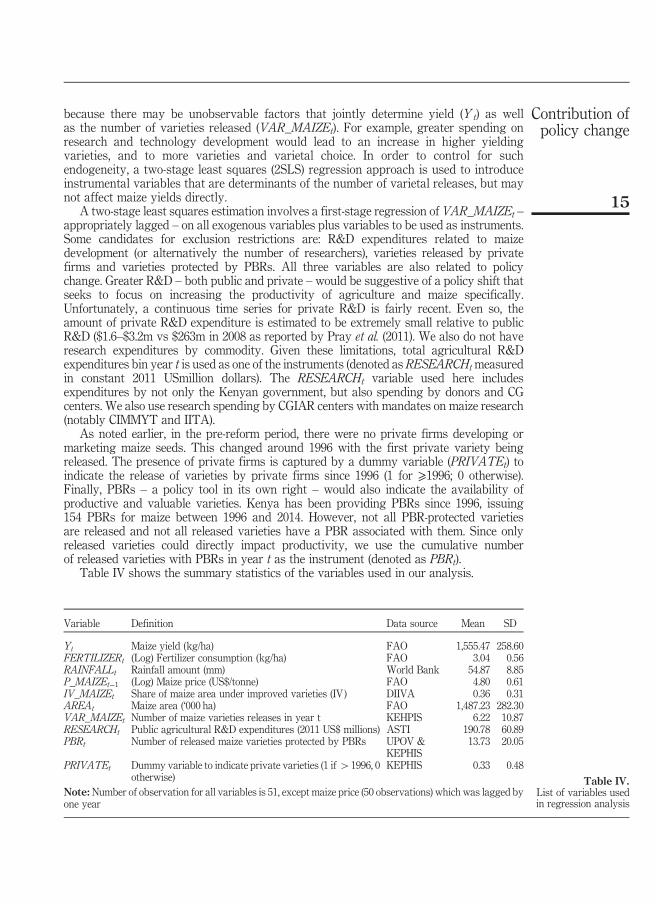
Table IV shows the summary statistics of the variables used in our analysis.
Variable Definition Data source Mean SD
Yt Maize yield (kg/ha) FAO 1,555.47 258.60FERTILIZERt (Log) Fertilizer consumption (kg/ha) FAO 3.04 0.56RAINFALLt Rainfall amount (mm) World Bank 54.87 8.85P_MAIZEt−1 (Log) Maize price (US$/tonne) FAO 4.80 0.61IV_MAIZEt Share of maize area under improved varieties (IV ) DIIVA 0.36 0.31AREAt Maize area (‘000 ha) FAO 1,487.23 282.30VAR_MAIZEt Number of maize varieties releases in year t KEHPIS 6.22 10.87RESEARCHt Public agricultural R&D expenditures (2011 US$ millions) ASTI 190.78 60.89PBRt Number of released maize varieties protected by PBRs UPOV &
KEPHIS13.73 20.05
PRIVATEt Dummy variable to indicate private varieties (1 if W1996, 0otherwise)
KEPHIS 0.33 0.48
Note:Number of observation for all variables is 51, except maize price (50 observations) which was lagged byone year
Table IV.List of variables usedin regression analysis
15
Contribution ofpolicy change
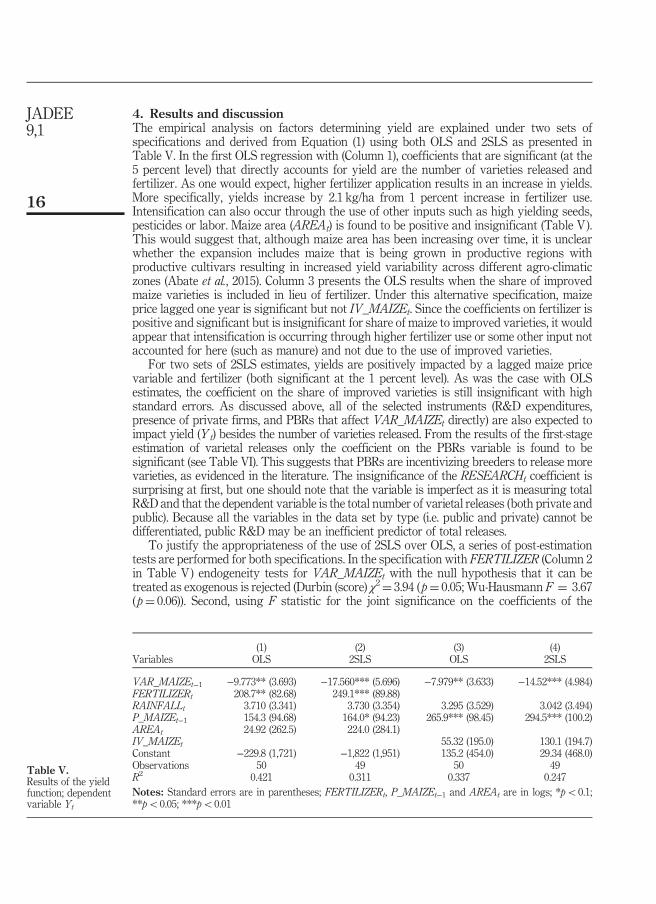
4. Results and discussionThe empirical analysis on factors determining yield are explained under two sets ofspecifications and derived from Equation (1) using both OLS and 2SLS as presented inTable V. In the first OLS regression with (Column 1), coefficients that are significant (at the5 percent level) that directly accounts for yield are the number of varieties released andfertilizer. As one would expect, higher fertilizer application results in an increase in yields.More specifically, yields increase by 2.1 kg/ha from 1 percent increase in fertilizer use.Intensification can also occur through the use of other inputs such as high yielding seeds,pesticides or labor. Maize area (AREAt) is found to be positive and insignificant (Table V).This would suggest that, although maize area has been increasing over time, it is unclearwhether the expansion includes maize that is being grown in productive regions withproductive cultivars resulting in increased yield variability across different agro-climaticzones (Abate et al., 2015). Column 3 presents the OLS results when the share of improvedmaize varieties is included in lieu of fertilizer. Under this alternative specification, maizeprice lagged one year is significant but not IV_MAIZEt. Since the coefficients on fertilizer ispositive and significant but is insignificant for share of maize to improved varieties, it wouldappear that intensification is occurring through higher fertilizer use or some other input notaccounted for here (such as manure) and not due to the use of improved varieties.
For two sets of 2SLS estimates, yields are positively impacted by a lagged maize pricevariable and fertilizer (both significant at the 1 percent level). As was the case with OLSestimates, the coefficient on the share of improved varieties is still insignificant with highstandard errors. As discussed above, all of the selected instruments (R&D expenditures,presence of private firms, and PBRs that affect VAR_MAIZEt directly) are also expected toimpact yield (Yt) besides the number of varieties released. From the results of the first-stageestimation of varietal releases only the coefficient on the PBRs variable is found to besignificant (see Table VI). This suggests that PBRs are incentivizing breeders to release morevarieties, as evidenced in the literature. The insignificance of the RESEARCHt coefficient issurprising at first, but one should note that the variable is imperfect as it is measuring totalR&D and that the dependent variable is the total number of varietal releases (both private andpublic). Because all the variables in the data set by type (i.e. public and private) cannot bedifferentiated, public R&D may be an inefficient predictor of total releases.
To justify the appropriateness of the use of 2SLS over OLS, a series of post-estimationtests are performed for both specifications. In the specification with FERTILIZER (Column 2in Table V) endogeneity tests for VAR_MAIZEt with the null hypothesis that it can betreated as exogenous is rejected (Durbin (score) χ2¼ 3.94 (p¼ 0.05; Wu-Hausmann F ¼ 3.67(p¼ 0.06)). Second, using F statistic for the joint significance on the coefficients of the
(1) (2) (3) (4)Variables OLS 2SLS OLS 2SLS
VAR_MAIZEt−1 −9.773** (3.693) −17.560*** (5.696) −7.979** (3.633) −14.52*** (4.984)FERTILIZERt 208.7** (82.68) 249.1*** (89.88)RAINFALLt 3.710 (3.341) 3.730 (3.354) 3.295 (3.529) 3.042 (3.494)P_MAIZEt−1 154.3 (94.68) 164.0* (94.23) 265.9*** (98.45) 294.5*** (100.2)AREAt 24.92 (262.5) 224.0 (284.1)IV_MAIZEt 55.32 (195.0) 130.1 (194.7)Constant −229.8 (1,721) −1,822 (1,951) 135.2 (454.0) 29.34 (468.0)Observations 50 49 50 49R2 0.421 0.311 0.337 0.247Notes: Standard errors are in parentheses; FERTILIZERt, P_MAIZEt−1 and AREAt are in logs; *po0.1;**po0.05; ***po0.01
Table V.Results of the yieldfunction; dependentvariable Yt
16
JADEE9,1

additional instruments F(3,41)¼ 10.10 with p¼ 0.000, the null hypothesis that theinstruments are weakly identified can be rejected. Finally, in the test for over-identifyingrestriction, under the null hypothesis that the instrument set is valid and the model iscorrectly specified, the p-values for both the Sargan (score) ( χ2¼ 2.7378; p¼ 0.2544)and Basmann ( χ2¼ 2.4264; p¼ 0.2973) are greater than 10 percent, suggesting that thestatistical model is indeed valid. Similar post-estimation results are obtained whenIV_MAIZEt is used.
The key question to answer here is what is one to make of the negative but significantcoefficient on the number of maize varieties released over years VAR_MAIZEt in all thespecifications and the relationship to yield levels of maize. Taken at face value, anadditional varietal release decreases yields by 8–17.5 kg/ha; which suggests a disconnectbetween yield gains and new cultivar releases. As has been suggested previously, thiscould be because newer varieties offer small yield advantages over the previously releasedimproved varieties (Ariga and Jayne, 2011), and that not many varieties were developed toaddress the agro-ecological concerns, including issues related to varieties suitable formaize-based intercropping resulting in poor genetic gains. Furthermore, since not allreleased varieties are adopted and lags may be much greater than we had specified, thenegative coefficient is likely to account for the non-adoption of new varieties. Note thatthat the share of maize area sown to improved varieties while positive is insignificant.Since the share has not changed much over the past 20 years and already is above70 percent, the yield gains from increasing improved varietal share are not going to belarge if the same (older) varieties are going to be adopted.
It should be noted that a number of alternative specifications (not reported here) weretried but gave similar results. These included lagging the VAR_MAIZEt by two years andusing a cumulative number of maize varieties available. In both these instances the numberof varieties was found to be a negative predictor of yield. Additionally, we employeddifferent measure of R&D, including one that accounted for R&D by CGIAR centers(notably CIMMYT and IITA that have maize research programs) in SSA but that too wasfound to be insignificant.
5. ConclusionsSince the early 1990s, Kenya has undertaken a number of reforms to liberalize itsagricultural markets with a view of improving productivity. Agricultural input markets thatwere previously heavily regulated with little private sector participation have undergonedramatic changes, especially the maize seed market. Since 1999, for example, 333 improved
Variables (1) (2)
FERTILIZERt 2.382 (3.0426) −11.255 (10.5498)RAINFALLt −0.024 (0.1134) −0.0195 (0.1121)P_MAIZEt−1 −0.5248 (3.5148) 0.3332 (3.2665)IV_MAIZEtAREA −2.565 (9.5646)RESEARCHt−2 −0.0228 (0.0328) 0.0263 (0.0486)PBRt−1 0.35054*** (0.1377) 0.4410*** (0.1493)PRIVATEt−1 6.8322 (5.2640) 5.114854 (5.4111)Constant 17.9035 (67.8163) −2.6334 (14.4103)Observations 49 49R2 0.7051 0.695Notes: Standard errors are in parentheses; FERTILIZERt, P_MAIZEt−1 and AREAt are in logs; PBRt−1 is thecumulative number of PBR granted in year t−1; ***po0.01
Table VI.Reduced form
(first-stage) estimates;dependent variable
VAR_MAIZEt−1
17
Contribution ofpolicy change

varieties have been released, compared to 21 in all the years prior. Nearly half of thevarieties released since 1999 have been due to private firms.
While policy reforms have been largely focused on improving the supply of new varietiesand varietal development, it is yet unclear whether it has had the desired productivityimpact. In this paper, this question is addressed directly by relating Kenya’s national maizeyields to a number of exogenous factors, including those that are influenced by policychanges. The results of the 2SLS regression – where the first stage relates how differentpolicies impact the development of new varieties and second stage on how those varietiesinfluence yields – suggest that the release of new varieties has not yet affected yieldspositively to a measurable extent. The lack of a quantifiable increase in yield due to newvarietal releases may seem surprising, considering newer releases are usually regarded asbeing more productive than the older ones they replace.
However, the results are not really surprising when one considers that the adoption ofthe released varieties has not been widespread and that the yield advantage for many of thereleased varieties (over existing varieties) has likely been quite small under prevailing farmpractice. Given the inherent variability in Kenyan maize yields, and the tentativenessof the relationships being quantified in the analyses reported, there are highly limitedpolicy-relevant conclusions that can be drawn. One is that there is seemingly a need for bothpatience and persistence in investing in R&D to improve the productivity of new varietiesand incorporate traits for better managing biotic and abiotic stresses. Patient investors canbe comforted by the vast global experience that investment eventually pays off, and mostlyhandsomely (e.g. Alston et al., 2000). For Kenya, as it pursues crop improvement as anongoing challenge, effort needs to be directed toward encouraging the adoption of newreally improved varieties. This requires concerted extension and dissemination effortssupported by the Ministry of Agriculture and the private sector.
Notes
1. WA age is defined asP
ipitAit , where pit is the proportion of the crop’s area cultivated in varietyi in year t.
2. DIIVA – or the Diffusion and Impact of Improved Varieties in Africa – is a CGIAR led project thatseeks to collect improved varietal adoption data in Africa. Details about the project and associateddata set is available from www.asti.cgiar.org/diiva
3. Hassan and Karanja (1997) also characterize Kenya’s maize industry going through differentphases, but for different periods of time since their analysis was only up to 1991.
4. There are some discrepancies in the literature as to how many varieties were released. Data fromKEPHIS suggest 7 varieties were released between 1962 and 1982, while Karanja (2007) reports 17were released and Hassan and Karanja (1997) report 13 were released.
References
Abate, T., Mugo, S., Groote, H.D. and Ragasa, C. (2015), “Maize in Kenya: chance for getting back toformer glory?”, DT Maize: A Quarterly Bulletin of the Drought Tolerant Maize for Africa Project(DTMA), CIMMYT-Kenya, Nairobi, Vol. 4 No. 3.
Abate, T., Fisher, M., Abdoulaye, T., Kassie, G.T., Lunduka, R., Marenya, P. and Asnake, W. (2017),“Characteristics of maize cultivars in Africa: how modern are they and how many dosmallholder farmers grow?”, Agriculture & Food Security, Vol. 6 No. 1, pp. 1-17.
Alila, P.O. and Atieno, R. (2006), “Agricultural policy in Kenya: issues and processes”, paper presentedat the Future Agricultures Consortium Workshop, Nairobi.
Alston, J.M. and Venner, R.J. (2002), “The effects of the US plant variety protection act on wheat geneticimprovement”, Research Policy, Vol. 31 No. 4, pp. 527-542.
18
JADEE9,1
Alston, J., Chan-Kang, C., Marra, M., Pardey, P. and Wyatt, T. (2000), A Meta-Analysis of Rates ofReturns to Agricultural R&D, International Food Policy Research Institute, Washington, DC.
Ariga, J. and Jayne, T.S. (2009), Private Sector Responses to Public Investments and Policy Reforms:The Case of Fertilizer and Maize Market Development in Kenya, IFPRI Discussion Paper 00921,International Food Policy Research Institute, Washington, DC.
Ariga, J. and Jayne, T.S. (2011), “Fertilizer in Kenya: factors driving the increase in usage bysmallholder farmers”, in Chuhan-Pole, P. and Angwafo, M. (Eds), Yes Africa Can: Success Storiesfrom a Dynamic Continent, The World Bank, Washington, DC.
Aylward, C., Biscaye, P., Harris, K.P., LaFayetter, M., True, Z., Anderson, C.L. and Reynolds, T. (2015),“Maize yield trends and agricultural policy in East Africa: macro-level literature review forsix countries”, Evans School Policy Analysis and Research (EPAR), Technical Report No. 310,Evans School of Public Policy and Governance, Universality of Washington, Seattle, WA.
Carew, R. and Devadoss, S. (2003), “Quantifying the contribution of plant breeders’ rights andtransgenic varieties to canola yields: Evidence fromManitoba”, Canadian Journal of AgriculturalEconomics, Vol. 51 No. 3, pp. 371-395.
CGIAR (2015), “CGIAR’s DIIVA project: a consolidated database of crop varietal releases, adoption,and research capacity in Africa south of the Sahara”, available at: www.asti.cgiar.org/diiva(accessed July 6, 2018).
Chemonics (2010), “Staple foods value chain analysis: country report Kenya”, Chemonics International,Washington, DC.
Doss, C., Mwangi, W., Verkuijl, H. and De Groote, H. (2003), “Adoption of maize and wheat technologiesin east Africa: synthesis of east African adoption studies”, CIMMYT Economics Working Paper03-01, CIMMYT.
Evenson, R.E. and Gollin, D. (2003), “Assessing the impact of the green revolution, 1960 to 2000”,Science, Vol. 300 No. 5620, p. 758.
FAO (2018), “FAOSTAT”, available at: www.fao.org/faostat/en/#home (accessed June 15, 2018).
Fuglie, K. andMarder, J. (2015), “The diffusion and impact of improved food crop varieities in Sub-SaharanAfrica”, in Walker, T.S. and Alwang, J. (Eds), Crop Improvement, Adoption and Impact of ImprovedVarietie in Food Crops, CGIAR and CAB International, Oxfordshire and Boston, MA.
Gerhart, J. (1975), The Diffusion of Hybrid Maize in Western Kenya, CIMMYT, Mexico City.
Gisselquist, D., Pray, C., Nagarajan, L. and Spielman, D. (2013), “An obstacle to Africa’s greenrevolution: too few new varieties”, SSRN, available at: https://ssrn.com/abstract=2263042;http://dx.doi.org/10.2139/ssrn.226304
Gitau, R., Kimenju, S., Kibaara, B., Nyoro, J., Bruntrup, M. and Zimmermann, R. (2009), AgriculturalPolicy-Making in Sub Saharan Africa: Kenya’s Past Policies, Tegemeo Institute of AgriculturalPolicy and Development, Nairobi.
Hassan, R.M. and Karanja, D.D. (1997), “Increasing maize production in Kenya: technology, institutionsand policy”, in Byerlee, D. and Eicher, C.K. (Eds), Africa’s Emerging Mziae Revolution, LynneReinner Publishers, Boulder, CO and London, pp. 81-94.
Jayne, T.S., Myers, R.J. and Nyoro, J. (2008), “The effects of NCPB marketing policies on maize marketprices in Kenya”, Agricultural Economics, Vol. 38 No. 3, pp. 313-325.
Jayne, T.S., Mather, D., Mason, N. and Ricker-Gilbert, J. (2013), “How do fertilizer subsidy programsaffect total fertilizer use in sub-Saharan Africa? Crowding out, diversion, and benefit/costassessments”, Agricultural Economics, Vol. 44 No. 6, pp. 687-703.
Karanja, D.D. (1996), An Economic and Institutional Analysis of Maize Research in Kenya, MichiganState University, International Development Working Paper No. 57, Economics, Michigan StateUniversity, East Lansing, MI.
Karanja, D.D. (2007), “The impact of public investment in maize research in Kenya”, inAnandajayasekeram, P., Rukani, M., Babu, S., Liebenberg, F. and Keswani, C.L. (Eds), Impactof Science on African Agriculture and Food Security, CABI, Wallingford, pp. 103-115.
19
Contribution ofpolicy change
Kenya Plant Health Inspectorate Service (KEPHIS) (2017), “National crop variety list – Kenya”,available at: www.kephis.org/images/Uploads/UPNVLIST.pdf (accessed April 11, 2017).
Kolady, D.E. and Lesser, W. (2009), “But are they meritorious? Genetic productivity gains under plantintellectual property rights”, Journal of Agricultural Economics, Vol. 60 No. 1, pp. 62-79.
Mathenge, M.K., Smale, M. and Olwande, J. (2014), “The impacts of hybrid maize seed on the welfare offarming households in Kenya”, Food Policy, Vol. 44, pp. 262-271.
Monitoring African Food and Agricultural Policies (MAFAP) (2013), Review of Food and AgriculturalPolicies in Kenya, MAFAP Country Report Series, FAO, Rome.
Munyi, P. and Jonge, B.D. (2015), “Seed system support in Kenya: consideration for an integrated seedsector development approach”, Journal of Sustainable Development, Vol. 8 No. 2, pp. 161-173.
Muraoka, R., Matsumoto, T., Jin, S. and Otsuka, K. (2016), “On the possibility of a maize greenrevolution in the highlands of Kenya: an assessment of emerging intensive farming systems”,in Otsuka, K. and Larson, D.F. (Eds), Pursuit of an African Green Revolution, Springer, Tokyo.
Naseem, A., Oehmke, J.F. and Schimmelpfennig, D.E. (2005), “Does plant variety intellectual propertyprotection improve farm productivity? Evidence from cotton varieties”, AgBioforum, Vol. 8Nos 2/3, pp. 100-107.
Nyangena, W. and Juma, O.M. (2014), “Impact of improved farm technologies on yields the case ofimproved maize varieties and inorganic fertilizer in Kenya”, Environment for DevelopmentDiscussion Paper 14-02, Sweden University of Gothenburg, Gothenburg.
Nyangito, H.O. and Karugia, J.T. (2002), “The impact of recent policy changes on the agricultural sectorand public agricultural research in Kenya”, in Bigman, D. (Ed.), Globalization and the DevelopingCountries: Emerging Strategies for Rural Development and Poverty Alleviation, CABI, Wallingford,pp. 135-153.
Oseko, E. and Dienya, T. (2015), “Fertilizer consumption and fertilizer use by crop (FUBC) in Kenya”,available at: https://africafertilizer.org/wp-content/uploads/2017/05/FUBC-Kenya-final-report-2015.pdf (accessed July 8, 2018).
Perrin, R.K., Hunnings, K.A. and Ilhnen, L.A. (1983), Some Effects of the US Plant Variety Protection Actof 1970, North Carolina State University Department of Economics and Business, Raleigh, NC.
Poulton, C. and Kanyinga, K. (2014), “The politics of revitalising agriculture in Kenya”, DevelopmentPolicy Review, Vol. 32 No. S2, pp. S151-S172.
Pray, C., Gisselquist, D. and Nagarajan, L. (2011), “Private investment in agricultural research andtechnology transfer in Africa”, paper presented at the ASTI/IFPRI-FARA Conference, Accra.
Renkow, M. and Byerlee, D. (2010), “The impacts of CGIAR research: a review of recent evidence”, FoodPolicy, Vol. 35 No. 5, pp. 391-402.
Sheahan, M. and Barrett, C.B. (2017), “Ten striking facts about agricultural input use in Sub-SaharanAfrica”, Food Policy, Vol. 67, pp. 12-25, available at: https://doi.org/10.1016/j.foodpol.2016.09.010
Sheahan, M., Ariga, J. and Jayne, T.S. (2016), “Modeling the effects of input market reforms on fertiliserdemand and maize production: a case study from Kenya”, Journal of Agricultural Economics,Vol. 67 No. 2, pp. 420-447.
Smale, M. and Olwande, J. (2014), “Demand for maize hybrids and hybrid change on smallholder farmsin Kenya”, Agricultural Economics, Vol. 45 No. 4, pp. 409-420.
Smale, M., Byerlee, D. and Jayne, T. (2013), “Maize revolutions in Sub-Saharan Africa”, in Otsuka, K.and Larson, D.F. (Eds), An African Green Revolution: Finding Ways to Boost Productivity onSmall Farms, Springer Netherlands, Dordrecht, pp. 165-195.
Spielman, D. and Ma, X. (2014), Intellectual Property Rights, Technology Diffusion, and AgriculturalDevelopment: Cross-Country Evidence, IFPRI, Washington, DC.
Spielman, D. and Smale, M. (2017), “Policy options to accelerate variety change among smallholderfarmers in South Asia and Africa South of the Sahara”.
Swanckaert, J. (2012), “Effects of the Liberalization on Maize Production System in Kenya: 1990-2010”,Master of Bioscience Engineering: Agriculture, Ghent University, Ghent.
20
JADEE9,1
The International Union for the Protection of New Varieties of Plants (UPOV) (2017), “PLUTO: plantvariety database”, available at: www3.wipo.int/pluto/user/en/index.jsp (accessed April 10, 2017).
The African Seed Access Index (TASAI) (2016), “Kenya brief 2016 – the African seed access index”,available at: https://tasai.org/wp-content/uploads/TASAI-Brief-Kenya-2016-LR-CIRC-1.pdf(accessed June 12, 2018).
Walker, T.S. and Alwang, J. (Eds) (2015), Crop Improvement, Adoption, and Impact of ImprovedVarieties in Food Crops in Sub-Saharan Africa, CGIAR and CAB International, Osfordshire andBoston, MA.
World Bank (2017), “Enabling the business of agriculture 2017” World Bank, Washington, DC,doi: 10.1596/978-1-4648-1021-3.
Corresponding authorAnwar Naseem can be contacted at: [email protected]
For instructions on how to order reprints of this article, please visit our website:www.emeraldgrouppublishing.com/licensing/reprints.htmOr contact us for further details: [email protected]
21
Contribution ofpolicy change

Building African Agribusinessthrough Trust and Accountability
Kristin Franklin and James OehmkeBureau for Food Security,
USAID, Washington, District of Columbia, USA
AbstractPurpose – The purpose of this paper is to analyze the social institutions of trust, accountability and corporateshared value in creating an enabling environment for private sector investment in African agricultural andfood systems.Design/methodology/approach – This paper uses mixed methods. A value chain framework modelsinteractions among stakeholders in the agriculture, agribusiness and food sectors. The social institutions ofaccountability and trust are introduced into the model, followed by a Rwanda premium coffee value chaincase study.Findings – The conceptual and case study results show that best practices can increase smallholder farmer,agricultural service provider, financial intermediary, and food processor investments in and benefits from theagriculture sector.Research limitations/implications – Further research is needed on the economic foundations ofdevelopment cooperation based on trust, accountability and shared values, best practices and the link withdesired societal outcomes, such as the sustainable development goals.Social implications – Mutual accountability processes, as they are maturing in Africa, are at the cuttingedge of creating processes where multiple stakeholders, including agribusiness, can come together to makejoint commitments to a shared development agenda, and where stakeholders hold themselves and othersaccountable for meeting these commitments.Originality/value – This is the first paper to bring together cutting-edge advances in corporate sharedvalues, trust and accountability in the context of African agricultural and agribusiness development.Keywords Trust, Africa, Agribusiness, Value chain, Corporate shared value, Feed the Future,Mutual accountabilityPaper type Research paper
1. IntroductionCurrent agricultural and agribusiness development thought has undergone a paradigm shiftfrom state-directed development to private sector leadership of inclusive growth processes. Asthey are maturing, African mutual accountability processes emphasize including agribusinessas a full partner on the basis of shared values – this is one of the most exciting developmentinnovations of this decade. This paper explores how such processes are emerging, in terms ofcooperation for development based on trust, mutual accountability and corporate shared value.
Global governance bodies have long recognized the need for cooperation to advance a unifiedglobal development agenda on international growth and poverty reduction, but the approach hasmorphed over time from an emphasis on governments as the key driver of development to thebroad recognition of the private sector as essential to achieving development goals. After theSecondWorld War, the establishment of the United Nations and the elevation of development toa global objective emphasized cooperation among governments, be they country-level orinternational governance bodies. In the 1960s, the United States Agency for InternationalDevelopment (USAID) was established, with an emphasis on individual empowerment.Development continued to advance on the global agenda through a series of high-level forumsfocused on modernizing, deepening and broadening development cooperation and the effectiveJournal of Agribusiness in
Developing and EmergingEconomiesVol. 9 No. 1, 2019pp. 22-43© Emerald Publishing Limited2044-0839DOI 10.1108/JADEE-01-2018-0005
Received 12 January 2018Revised 10 August 2018Accepted 14 August 2018
The current issue and full text archive of this journal is available on Emerald Insight at:www.emeraldinsight.com/2044-0839.htm
All opinions are those of the authors and do not necessarily reflect the opinions of USAID. The authorsthank David Hong of One Acre Fund, and Dan Clay and David Ortega of Michigan State University foruseful discussions and sharing information.
22
JADEE9,1
Quarto trim size: 174mm x 240mm
delivery of aid – the first High Level Forum on Aid Effectiveness was held in Rome in 2003,followed by Paris in 2005 and Accra in 2008. These forums introduced mutual accountability fordevelopment effectiveness and an increasing role for non-state development partners.The Fourth High Level Forum on Aid Effectiveness in 2011 led to the signing of the BusanPartnership for Effective Development Cooperation, which squarely emphasized the importanceof the private sector as a development partner. The importance of partnering is now codified inSustainable Development Goal 17: Partnerships for the Goals.
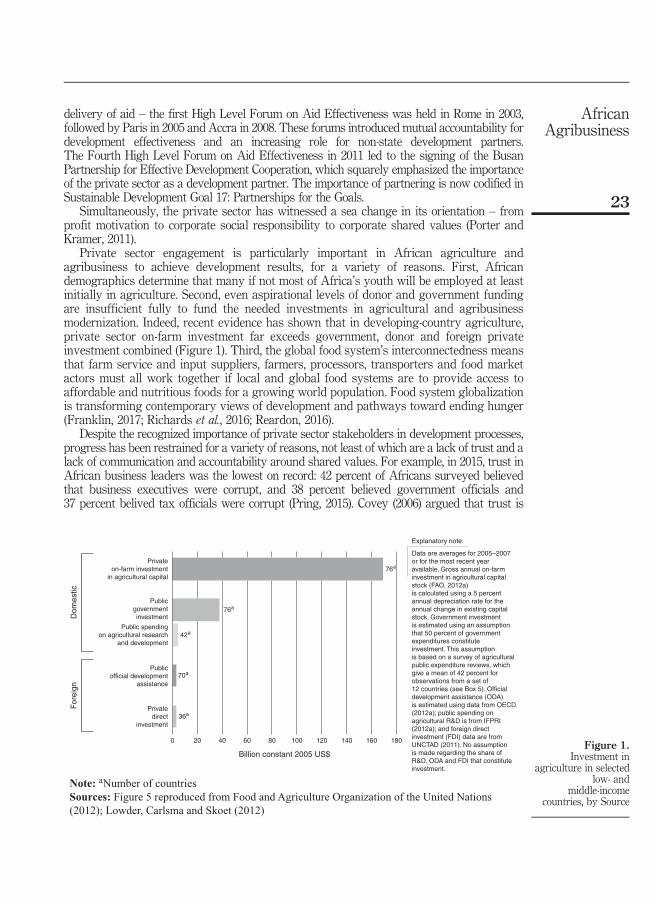
Simultaneously, the private sector has witnessed a sea change in its orientation – fromprofit motivation to corporate social responsibility to corporate shared values (Porter andKramer, 2011).
Private sector engagement is particularly important in African agriculture andagribusiness to achieve development results, for a variety of reasons. First, Africandemographics determine that many if not most of Africa’s youth will be employed at leastinitially in agriculture. Second, even aspirational levels of donor and government fundingare insufficient fully to fund the needed investments in agricultural and agribusinessmodernization. Indeed, recent evidence has shown that in developing-country agriculture,private sector on-farm investment far exceeds government, donor and foreign privateinvestment combined (Figure 1). Third, the global food system’s interconnectedness meansthat farm service and input suppliers, farmers, processors, transporters and food marketactors must all work together if local and global food systems are to provide access toaffordable and nutritious foods for a growing world population. Food system globalizationis transforming contemporary views of development and pathways toward ending hunger(Franklin, 2017; Richards et al., 2016; Reardon, 2016).
Despite the recognized importance of private sector stakeholders in development processes,progress has been restrained for a variety of reasons, not least of which are a lack of trust and alack of communication and accountability around shared values. For example, in 2015, trust inAfrican business leaders was the lowest on record: 42 percent of Africans surveyed believedthat business executives were corrupt, and 38 percent believed government officials and37 percent belived tax officials were corrupt (Pring, 2015). Covey (2006) argued that trust is
Privateon-farm investment
in agricultural capital
Publicgovernmentinvestment
Public spendingon agricultural research
and development
Publicofficial development
assistance
Privatedirect
investment
0 20 40 60 80
76a
100
Explanatory note:
Data are averages for 2005–2007 or for the most recent year available. Gross annual on-farm investment in agricultural capital stock (FAO, 2012a)is calculated using a 5 percent annual depreciation rate for the annual change in existing capital stock. Government investmentis estimated using an assumption that 50 percent of government expenditures constitute investment. This assumptionis based on a survey of agricultural public expenditure reviews, which give a mean of 42 percent for observations from a set of12 countries (see Box 5). Official development assistance (ODA)is estimated using data from OECD (2012a); public spending on agricultural R&D is from IFPRI (2012a); and foreign direct investment (FDI) data are from UNCTAD (2011). No assumptionis made regarding the share of R&D, ODA and FDI that constituteinvestment.
Billion constant 2005 US$
76a
42a
70a
36a
For
eign
Dom
estic
180160140120
Note: aNumber of countriesSources: Figure 5 reproduced from Food and Agriculture Organization of the United Nations(2012); Lowder, Carlsma and Skoet (2012)
Figure 1.Investment in
agriculture in selectedlow- and
middle-incomecountries, by Source
23
AfricanAgribusiness
necessary for business effectiveness, and Rademakers (2000) found that trust is the essentialingredient in effective African agricultural value chains.
More generally, Porter and Kramer (2011) argued that corporations that share values withsociety and invest accordingly both perform better as profitmaking corporations and helpadvance the economic and social conditions in communities where the corporation operates.Blodgett et al. (2014) found that “companies’ socially responsible acts are positively associatedwith overall firm value and financial performance.” Moreover, by operating on corporateshared value principles, the business community can “unleash a wave of innovation andgrowth” for the benefit of all stakeholders (Porter and Kramer, 2011). Rebuilding trust inbusiness begins with the private sector making voluntary public commitments to actions insupport of shared values, responsible execution of those commitments, improved corporateperformance and improved sector performance.
Given the clear need for improved agriculture and food sector performance in Africa, thisbegs the question: How can stakeholders restore and build accountability and trust inAfrican agricultural and food systems?
This paper examines exciting new interventions in African agriculture and agribusinessthat help to build accountability and trust in the context of furthering shared values foragricultural and food systems development. This examination includes both conceptualunderpinnings and programmatic examples. The next section provides the Africanagribusiness context. Next is a section on trust and accountability – defining these conceptsand placing them in the Africa agribusiness and food system context and the correspondingliterature. This is followed by a fascinating case study of the Rwanda fully washed-coffeevalue chain, which not only evolved into one of the highest quality premium coffee valuechains in the world and enabled thousands of smallholders to emerge from poverty, but alsohelped build trust and healing in the aftermath of the Rwanda genocide on the shared valuesof reconciliation and growth. The final section presents conclusions.
2. African agricultural and agribusiness contextMany sub-Saharan economies are based primarily on agriculture. For countries withoutsignificant oil or mineral revenues, agriculture is the largest contributor to GDP and thelargest source of employment. For example, in Tanzania, agriculture contributes 31 percentof GDP and 68 percent of employment; even in oil-producing Nigeria, agriculture contributes21 percent of GDP and 31 percent of employment, and in mineral-producing Zambia,agriculture still employs 56 percent of the population (World Bank, 2019). In 2016, even indrought-stricken Ethiopia, agriculture provided 37 percent of GDP, although this was downover 10 percentage points from the recent pre-drought high rate of 48 percent in 2012.
Over the past two decades, sub-Saharan Africa has been a star agricultural performer,outpacing even Brazil, Russia, India and China in value-added agriculture, food productionand economic growth (Figure 2). Hunger has diminished. Despite rapidly growingpopulations, the food deficit in the region was halved, from 250 kcal/person-day in 1992 to130 kcal/person-day in 2016.
Despite this noticeable progress over the past two decades, food insecurity, hunger andundernourishment remain significant problems through large parts of the region.Undernourishment – the inability to acquire sufficient food to meet minimum caloricrequirements throughout the year (FAO et al., 2017) – exceeds 40 percent in some countries(Figure 3). Meeting nutritional needs is even harder, for example the prevalence of anemia amongSub-Saharan children under five was 60 percent in 2016, a decline of only 12 percentage pointsfrom 2002. Stunting rates among children under five almost halved between 1990 and 2015 and,yet, nearly one in four children today is stunted (World Bank, 2019).
Africa’s difficulty in continuing to make progress against hunger is not unique. After yearsof seeing a steady decline in global hunger, the 2017 State of Food Security and Nutrition in
24
JADEE9,1

10.0%
9.0%
8.0%
7.0%
6.0%
5.0%
4.0%
3.0%
2.0%
1.0%
0.0%Agric. Value Added Food production Nat’l Income
SSA BRIC World
Source: Oehmke (2017)
Figure 2.Annualized rate of
increase inagricultural value
added, foodproduction and
national income forsub-Saharan Africa,
BRIC Countriesand the World,
1996 to 2013–2015
30–40 20–30 10–20 0–10 No data40 or more
Copyright 2017. ReSAKSS (Regional Strategic Analsis and Knowledge Support System)http://www/resakss.org/Retrieved: 2017-11-04
Figure 3.Prevalence of
undernourishment(percent of population)
25
AfricanAgribusiness

the World report concluded that “global hunger appears to be on the rise, affecting 11 percentof the global population,” resulting in an increase in the number of chronically undernourishedpeople by approximately 30 million from 2015 to 2016 (FAO et al., 2017). In addition, droughtsand famines are hitting regions harder than before – the El Niño-induced Ethiopian droughtthat started in 2015 is the worst in a generation, and diseases such as fall armyworm aretaking away food from already strained and hungry populations.
In response to this situation, African governments and donors have elevated attention toimproving food systems, through greater engagement with the private sector. Feeding hungrypopulations is not just a moral imperative, it is not just a development necessity, but there arealso significant budgetary and political implications of an underfed lower class (Resnick, 2014;Resnick and Thurlow, 2014). Covic and Hendricks (2016) quantified the annual costs ofundernutrition in a study of seven African countries and found that costs ranged from3.1 percent of GDP in Swaziland to 16.5 percent in Ethiopia. The response is to seek systemicapproaches to accelerate agricultural growth including agro-processing because this istypically the most inclusive growth process in agricultural economies (Dorosh and Thurlow,2014). The African Union’s Malabo Declaration, the Comprehensive Africa AgriculturalDevelopment Programme 2025 Implementation Plan and the US Government’s Global FoodSecurity Strategy all emphasized systemic change in agricultural and food systems toaccelerate inclusive agricultural and agribusiness growth, based on partnerships with theprivate sector.
The elevation of the global food system has transformed the way pathways are viewedtoward ending hunger, but the challenges remain as large as ever. Particularly challenging ishow to catalyze, sustain and orient systemic change in food systems to achieve both privateand societal goals – in other words, how to move forward on the basis of shared values.
3. Trust and accountabilityTo be successful, aligned and complementary actions taken by different enterprises and otherdevelopment stakeholders in pursuit of shared values require a degree of trust in the otherstakeholders as well as a degree of accountability that the necessary actions will be responsiblyexecuted. This section delves into trust and accountability as they influence agricultural andfood systems.
3.1 TrustTrust is a pervasive component of positive, enduring relationships, including businessrelationships. Covey (2006) argues that trust is the “one thing that is common to everyindividual, relationship, team, family, organization, nation, economy, and civilizationthroughout the world – one thing which, if removed, will destroy the most powerfulgovernment, the most successful business, the most thriving economy […].” Nobel laureateKenneth Arrow (1972) noted that “virtually every commercial transaction has within itselfan element of trust, certainly any transaction conducted over a period of time. It can beplausibly argued that much of the economic backwardness in the world can be explained bythe lack of mutual confidence” (p. 357). The basic issue is that in developing countries (andto a large extent in developed countries as well), formal contracts are unavailable and/orincomplete and, often, unenforceable or enforceable only with high costs to the plaintiff.This suggests that trust has a role both in informal systems and in improving theeffectiveness of formal contracts, which is supported by the literature (Makombe, 2018).
The importance of trust in developing-country agribusiness is established in a small butinformative literature. Wilson (2000) argued that social capital and trust have significantinfluence in agribusiness: trust can alter terms of trade and create transactional andresource efficiencies. The result that trust can affect terms of trade in agribusiness dealsclearly demonstrates that impersonal price signals in and of themselves are not sufficient in
26
JADEE9,1

complex interactions. For example, Theron et al. concluded that trust and satisfaction arecritical components of decisions to stay in business-to-business relationships in the financialservices industry. Downing and Campbell (2014) argued that a common characteristic ofeffective agricultural input supply systems is that they are perceived as fair, based on “trustand transparency […] in addition to valued goods and services […] to ensure that thesmallholder customer has a good experience as a result of the transaction.” In Vietnam, theinstitutional framework limits long-term investments by small and medium agribusiness;instead of formal mechanisms, these businesses rely on trust-based friendship networks(Thai and Hjortso, 2015). Trust is also an important component of social capital withinsmallholder cooperatives in Vietnam. In the Vietnamese apple industry, trust is animportant component of the enforceability of formal contracts (Cai and Ma, 2015). Batt andRexha (2000) found that trust replaced third-party quality verification in Asian potato seedindustries. As in most cases, the quality of potato seed is not fully ascertainable uponpurchase, and, in this case, no third-party verification was available. However, smallholdertrust relationships with seed suppliers allowed the market to function. Franklin andOehmke (2018) provided a categorization of the trust relationships important inagribusiness and food systems.
In the African agribusiness context, Lyon (2006) in Ghana and Lyon and Porter (2009) inNigeria demonstrated the importance of trust among farmers, traders and input suppliers in theabsence of fully enforceable legal contracts. The conclusion was that trust in agribusinessdealings can replace formal contracts, but only if that trust is linked to a deep set of culturalmores and behaviors. Dowla (2006) described the Grameen Bank’s success in microfinance as“fostering a new level of social trust to solve the collective action problems of poor people’s accessto capital” (p. 102). Paul et al. (2016) conducted social capital experiments in Ethiopia, determiningthat stronger trust facilitates smallholder contributions to social goods that facilitate adaptationto climate change for all. Turyahikayo and Edson (2016) found that a lack of smallholder trustlimited the effectiveness of private sector extension provision in Uganda. Nandonde et al. (2017)conducted case studies of the Tanzanian fresh meat and processed peanut butter value chains intwo parts of Tanzania, concluding that the establishment of trust between small agribusinessentrepreneurs and modern food helps small-scale agribusinesses access modern food supplychains. Growiec and Growiec reformulated the poverty trap issue as a “low trust trap” (p. 282):the solution to the poverty trap is, thus, to increase the level of trust and associated social capital.Conversely, it is important to note that exclusion or marginalization of individuals from the socialcapital and trust process can lead to poverty traps for these individuals and/or a vicious cycle ofincreasing inequality perpetuating greater exclusion perpetuating further inequality (Growiecand Growiec, 2014; Gould and Hijzen, 2016; Levien, 2015).
However, there is also surely a relationship between trust and prices received: Susantyet al. (2017) showed that dairy farmers’ trust had a positive effect on their loyalty assuppliers and that price satisfaction had a positive effect on trust. In case studies of sugar inSwaziland and timber in South Africa, Sartorius and Kirsten (2007) found that trust madethe formal contracting mechanism between the smallholder and the processor operate moreeffectively – and conversely in the absence of trust.
The establishment of trust is linked to four core competencies in an individual or anorganization, as follows: integrity, intent, capabilities and results.
Often believed to be the underpinning for trust, integrity is the foundation upon which asystem of trust is established. Covey (2006) emphasizes that without integrity, an individualcan more easily lose trust, leading the other cores of trust to fall short. To signal integrity, anindividual or an organization should not only establish of a set of guiding principles and valuesbut adhere to them daily. Integrity should be seen as more than following the rules or doingwhat they should do. Some organizations try to force integrity upon their employees’ actionsthrough policies, trainings and procedure manuals which, in the long term, do not help
27
AfricanAgribusiness

establish trust. Integrity is deeper than just going along with the outlined or mandatedprinciples, integrity is being consistent in your actions and humbly choosing what is right. Thisis how character is built. Choosing what is right takes courage as it may not be what isimmediately best for an individual. Individuals and organizations who instill this deep level ofcharacter show no disconnect between what they intend to do and their eventual behavior,which is a key signal of integrity. They say, act, feel and think with consistency and with onevoice. These types of interactions are reflected within the food system context throughthe adherence to quality controls, fair trade guidelines, or other standards – even if it costs theenterprise money to maintain their integrity. Intent as a core competency is observable throughan individual’s or organization’s motives, as well as their actions when pursuing a collaborativeagenda or determining a mutually beneficial solution. This demonstration of a motive based ona shared value is effective in signaling trustworthiness and respect for the other party.Behavior and communication are critical components of intent. Communicating your intent toact can build trust within a relationship. However, trust can just as quickly be lost if integrity isdamaged or true intent questioned, should an individual not follow through on theirdeclaration. Demonstrated through building a reputation based on excellence, capability is thethird core competency of trust. Capability is not a static characteristic, as leaders and strongorganizations constantly work to improve, advance and adapt. It is through this ability toinspire and adapt that capable leaders build trust. Leaders know themselves and theirorganizations and strive to work in line with their talents, attitudes, skills and knowledge. Theyunderstand within a given opportunity what their company’s situational capability is as well asthe other roles and interests across the system. They are humble enough to understandweaknesses as well and pursue courses of action in alignment with the other three corescompetencies. Results are vital; thus, the achievement of results is the final core competency.Companies and individuals who fail to deliver results fall short of establishing partnershipsbuilt on trust. Results, when pursued in alignment with the other cores, establish leadershipand capability within a given field. However, not all results begin from positive outcomes.Leadership is being able to celebrate positive results as well as being able to reflect on negativeor unexpected outcomes. This dimension is important to growth as lessons learned fromnegative situations can be turned into positive results. True leadership and trust can be builtthrough the humility to learn from the outcome and the integrity of your actions movingforward. Trust is personal, in that it must be earned and extended to another party to beestablished within the relationship. Trust requires both individuals to signal their interest inmutual engagement and partnership through a level of vulnerability. This vulnerability is oftenrewarded because, once established, trust leads to increased accountability and a reduced fearof risk. Trust can build and create value through accelerated growth, enhanced innovation,improved collaboration, stronger partnering, better execution and heightened loyalty (Covey,2006). The lack of trust manifests itself in negative results and consequences (Covey, 2006).
When trust and accountability systems become part of everyday interactions, changeand innovation can be catalytic. To build on the concept of infusing trust into systems,individuals should not look at systems of trust as one dimensional. Instead, trust can be seenas fluid and moving throughout the system. For instance, think about all the otherinteractions throughout the food system – from the shop owner who sells seeds and thefarmer who relies on the quality of seeds to ensure a large yield at the end of the season, tothe exporter who relies on the consistency of regional policies to ship their products outsidetheir country. All these relationships require a certain level of trust and engagementthroughout the system. Trust that the system can consistently deliver a good qualityproduct is derived from the flow of trust through each part of the production and processingchain, with reciprocating trust that the consumer dollar will flow back down the value chainin a fair manner that rewards each participant for their efforts to preserve and enhance theintegrity of the value chain.
28
JADEE9,1
3.2 AccountabilityAccountability is the counterpart of trust. An enterprise may trust its suppliers to grow produceaccording to specified consumer standards, but ultimately the suppliers and the enterprise areaccountable for meeting the standards. “Even though trust is the oil that allows commercialmachinery to turn, blind trust is a risky proposition in commercial relationships. Amore prudentapproach is to ‘trust but verify’ ” (Microlinks, n.d.b). Accountability is a verification process.
Accountability can take various forms – formal or informal mechanisms such as legalproceedings or third-party verification – or more casual approaches such as online productreviews. Accountability processes can be “top down,” e.g. tort law mandated by the state, or“bottom up,” such as agreements between farmers’ organizations and consumer groups. Themaxim “say what you are going to do, then do what you said you would do” is a key part ofbuilding trust Covey (2006), but it is really an accountability mechanism based on a statedcommitment and the responsible execution of that commitment.
One option for the agribusiness value chain is formal contracting with enforcement bylegal mechanisms. Gow Streeter and Swinnen (2000) find that most developing countrieslack formal, public, contract-enforcement institutions. When legal enforcement exists, it maybe lengthy and expensive (Mkhabela, 2018). Moreover, it is particularly hard to establishefficient contracts in commodities where both quality and quantity are important. Forexample, Rwanda has experimented with two-part payments including a quality premiumin its premium coffee value chain, which corresponds to what economic theory tells us is theincentive-compatible solution to the principal-agent problem (Milgrom and Roberts, 1992).Mkhabela (2018) examined formal contracting in a principal-agent model where both theprincipal and the agent contribute to the quality of the final product, and where quantity isimportant, as is the case in coffee. There are two issues. First, when an individual has morethan two tasks to perform and performance is not well measurable, using incentives leads toa misallocation of effort (Holmstrom and Milgrom, 1991). Second, when both principal andagent have moral hazard, investment in quality by one leads to a decrease in investment inquality by the other (Mkhabela, 2018). Wessen and Oehmke (2001) documented thesetradeoffs in the Cameroon premium coffee value chain: when the government parastatalacted as the principal (owner of rents) farmers did not have incentives to invest in quality,exacerbated by organizational problems within the parastatal. With liberalization, farmersbecame the principal with processors contracting services to cooperatives, but thenprocessors had an incentive to ignore quality and focus instead on economies of scale. Moregenerally, this phenomenon may explain why differentiated agricultural products rarelyhave contracts conditioned on retail price (Mkhabela, 2018). The cocoa value chain is anexception: a differentiated product with farm gate prices based on a single, uniform contracttraded in London. In contrast, retail-based pricing has been tried in Rwanda’s premiumcoffee value chain, but with mixed results.
In environments when contracts and contract enforceability are limited options, thequestion becomes how can the value chain be organized in an effective and fair way? In areview of USAID experience with value chain programming, Dunn argues that a bestpractice is to facilitate “mutually beneficial relationships that build trust and rewardcooperation” (Dunn, 2012). Trust can be strengthened both by building on existing trustand by introducing trusted facilitation especially when creating new relationships(Microlinks, n.d.a). In the absence of formal contracts, self-enforcing arrangements canbe effective and trust plays an important role in these self-enforcing arrangements(Gow et al., 2000). Oehmke et al. (2018) introduced trust into a behavioral model ofcooperative behavior and mutual accountability, finding that both trust in individuals andsystemic trust lead to cooperative behavior with self-enforcing accountability. Thequestion then morphs to what sort of mutual, self-enforcing mechanisms help to organizevalue chains – or the agricultural sector – in an effective and fair way?
29
AfricanAgribusiness
3.3 Mutual accountabilityMutual accountability is the critical trust building and accountability concept in today’s Africanagricultural and agribusiness. Mutual accountability appeared in the Paris Declaration as a toolto manage aid effectiveness, but at that point it was largely a financial agreement betweendonors and partner-country governments. Donors agreed to align their off-budget support withcountry needs and priorities, and countries agreed to improve financial accounting to ensure thattheir public agricultural expenditures were actually being spent on agriculture. Since Paris, themutual accountability concept has been maturing and currently recognizes that agricultural andfood systems development is a complex process requiring both systemic and thematic changeand involves stakeholders well beyond donors and governments, including civil society and theprivate sector. As articulated in the Malabo Declaration and the associated implementationdocuments, mutual accountability is now a process that seeks to improve all stakeholders’commitment, alignment, contribution and accountability to inclusive agricultural growthprocesses. Stakeholder actions are expected to be taken for both the benefit of the individualstakeholder and for mutual benefit.
As currently implemented in African agriculture and agribusiness at the country level,the mutual accountability process has four essential components:
(1) country ownership of an agreed plan for accelerating inclusive agricultural growthand other sectoral goals such as increased trade, job growth and reductions in hunger;
(2) voluntary, specific and public commitments by all stakeholders to take actionsconsistent with stakeholder missions and contributory to the plan;
(3) responsible execution of individual commitments and verifiable reporting out onsuch execution; and
(4) joint responsibility to ensure that the set of commitments is sufficient to accelerateinclusive growth and make progress toward other sector goals (Oehmke, 2017).
African agricultural input supply issues provide an illustrative example of the potential ofmutual accountability. Africa’s low smallholder productivity illustrates mutualaccountability’s power. Low smallholder productivity stems from limited adoption ratesof improved inputs among smallholders. Despite a vast literature explaining these limitedadoption rates, remedies have been scarce. Governments often adopt input subsidies,which usually work well as long as the subsidy is in place, but eventually budgetconstraints curtail the subsidies and dis-adoption follows. An alternative approach is tofocus on the broader system or socio-economic ecology in which the smallholder operates.Governments, the fertilizer industry, the financial sector, smallholders and otherstakeholders may play significant roles in this ecology. The financial industry may limitcredit because it does not trust smallholders to repay on time. The fertilizer industry maylimit quantities because it does not trust smallholders to have sufficient cash or credit tobuy large quantities. The government may regulate heavily because it does not trust thefertilizer industry to price competitively, especially with limited supply. Smallholders maynot pay credit back regularly because of limited and late fertilizer delivery, depressingyields, and limiting their ability to earn cash at harvest. No single stakeholder group cansolve this problem. The mutual accountability solution is one of coordinated commitmentsby all stakeholders to an integrated plan, with all stakeholders holding themselves andothers accountability for successful execution of their commitments. For example,smallholders commit to repaying loans, agribusiness commits to delivering fertilizer ontime, the financial sector commits to improving credit availability and governmentcommits to an enabling policy environment. Stakeholders jointly hold themselvesaccountable for the portfolio of commitments to be sufficient to generate improved returnsfor all stakeholders. For instance, smallholders can repay loans because their harvest
30
JADEE9,1
improved, they got their fertilizer on time and the financial sector provided credit, thegovernment guaranteed payment in the case of drought, etc. This process can then driveinterest in continued increases in the supply and adoption of modern inputs, leading to avirtuous upward spiral (Oehmke, 2017).
The need for inclusive stakeholder engagement is critical to the solution of any complexproblem. “A key conclusion of much of the literature about wicked policy problems is thateffectively engaging the full range of stakeholders in the search for solutions is crucial”(Australian Public Service Commission, 2007). This engagement is most successful if builton the foundations of shared values, trust and mutual accountability.
3.4 Implementing mutual accountability at a country levelAt the country level, there are a few key components of the mutual accountability processes.The first is the national agricultural investment plan. When constructed on the foundation ofevidence-based, inclusive dialog, this is the agreed plan for organizing stakeholder contributionsto the sector. Unlike previous agriculture sector plans, the current version of the nationalagricultural investment plan includes priorities for public and private investment, for publicpolicy changes, and other actions necessary to accelerate sector growth.
Under the Comprehensive Africa Agriculture Development Programme guidelines, thenational agricultural investment plan is followed by a business plan, which enumerates thestrategies employed and the specific actions to be taken to implement these strategies. Forthe current round of planning, the ensuing business plan is to include commitments toactions by the government, donors, private sector and civil society. In the sense of Ostromand Basurto (2011), commitments can be made to take actions that directly support the planand can be made to take actions that are in the best interest of the committing organizationbut nonetheless help the sector move forward in alignment with the plan, and commitmentscan be made to operate in ways that avoid negative consequences, such as commitments tothe Principles for Responsible Agricultural Investment.
Commitments are most effective when they are voluntary, public and SMART – specific,measureable, achievable, relevant (sometimes results-oriented) and time-bound. SMARTcommitments help to create complementarities and synergies – for example, a governmentmaking credible and SMART commitments to ease import regulations for agricultural inputscreates synergies with agro-inputs suppliers who wish to expand their businesses. Explicitcommitment is important because writing down your goals and sharing them increases thelikelihood of success by 70 percent (Mathews, n.d.; Locke et al., 1981; Dawson and Guare,2016). SMART commitments are important because they define success in the context ofenterprise and societal goals and because they are measurable; successful execution of thecommitment can be confirmed and used to build trust for the next round of commitments.
3.5 Implementing mutual accountability at a micro levelMutual accountability can also be a grassroots process, that is, created not by governmentbut by enterprises and civic society. For example, Uganda’s AgVerify (www.agverify.net/)is an enterprise established by a consortium of private sector, agro-input serviceproviders, in conjunction with civil society, to provide trustworthy services for farmers(and others) by building a voluntary quality standard and by providing third-partyverification that inputs supplied by their members meet this standard. Their motto is“Farming Inputs, Food Products, and Ag Services you can trust.” By providing theseservices, they intend to “act as a catalyst for growth in the African seed and agribusinesssector.” In essence, this is an industry organization that provides a form of mutualaccountability and third-party verification that an individual firm alone cannot provideand that the government of Uganda is unable to provide.
31
AfricanAgribusiness
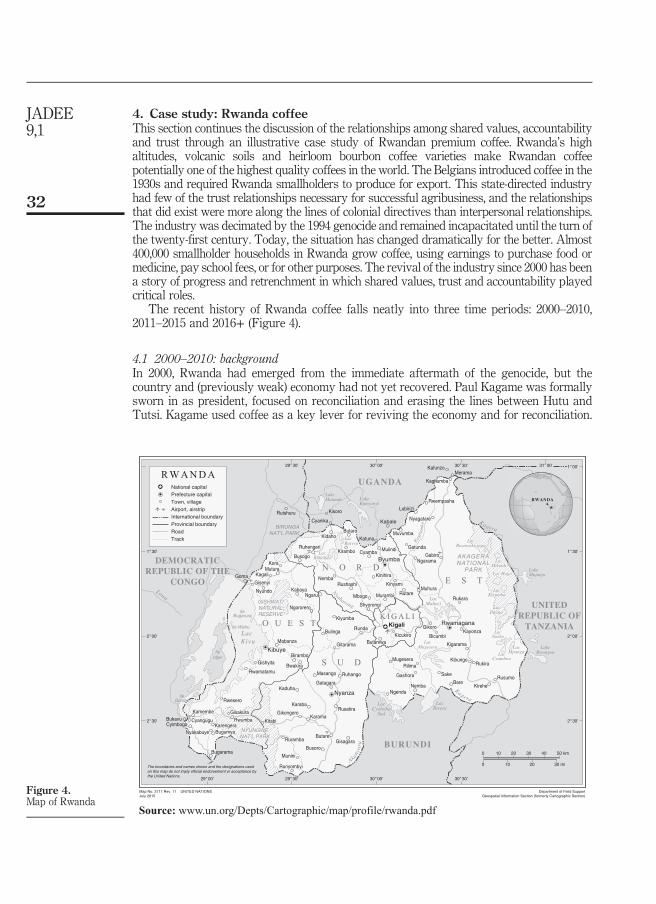
4. Case study: Rwanda coffeeThis section continues the discussion of the relationships among shared values, accountabilityand trust through an illustrative case study of Rwandan premium coffee. Rwanda’s highaltitudes, volcanic soils and heirloom bourbon coffee varieties make Rwandan coffeepotentially one of the highest quality coffees in the world. The Belgians introduced coffee in the1930s and required Rwanda smallholders to produce for export. This state-directed industryhad few of the trust relationships necessary for successful agribusiness, and the relationshipsthat did exist were more along the lines of colonial directives than interpersonal relationships.The industry was decimated by the 1994 genocide and remained incapacitated until the turn ofthe twenty-first century. Today, the situation has changed dramatically for the better. Almost400,000 smallholder households in Rwanda grow coffee, using earnings to purchase food ormedicine, pay school fees, or for other purposes. The revival of the industry since 2000 has beena story of progress and retrenchment in which shared values, trust and accountability playedcritical roles.
The recent history of Rwanda coffee falls neatly into three time periods: 2000–2010,2011–2015 and 2016+ (Figure 4).
4.1 2000–2010: backgroundIn 2000, Rwanda had emerged from the immediate aftermath of the genocide, but thecountry and (previously weak) economy had not yet recovered. Paul Kagame was formallysworn in as president, focused on reconciliation and erasing the lines between Hutu andTutsi. Kagame used coffee as a key lever for reviving the economy and for reconciliation.
Source: www.un.org/Depts/Cartographic/map/profile/rwanda.pdf
Figure 4.Map of Rwanda
32
JADEE9,1
USAID began support for the fully washed-coffee industry in 2001 through the Partnershipto Enhance Agriculture in Rwanda through Linkages (PEARL) program, and from 2006 to2010 through the SPREAD program.
The key to reestablishing the industry was to access the fully washed-coffee market.In 2000, all of Rwanda’s coffee was sold as “C grade” or below, meaning at best the lowestgrade of internationally tradable coffee, yet fully washed coffee could be sold at asignificant premium on world markets (Moss, Oehmke, and Lyambabaje, 2016). Today’sfully washed-coffee value chain in Rwanda begins with the smallholder farmers, whogrow coffee trees and who pick the coffee “cherries” by hand to preserve quality ( for moredetail, see Bihogo et al., 2011). Coffee grows as a bright, berry-like fruit known as a cherrythat is hand-picked by smallholders – usually women – to preserve quality. Coffee ripensin “flushes” over a four- to six-month period and is harvested by hand so that only the ripecherries are picked. The pit of this cherry is the bean that is roasted and becomesthe coffee we drink. To preserve the quality of the bean, the cherry must be brought on theday of harvest to the next link in the value chain, the washing station. The typicalwashing station provides services for 2,000–5,000 smallholders. At the washing station,the cherry is cleaned and sorted, the cherry pulp is removed from the bean, and the beansare washed and dried. Delays in this process allow the cherry pulp to begin to ferment,introducing unwanted tastes into the bean (Moss, Oehmke and Lyambabaje, 2016). At thewashing station, the highest quality beans from one or a few farmers can be handledseparately to provide a localized branded product, or aggregated with other beans ofsimilar quality.
The fully washed-coffee value chain begins with the input suppliers. In Rwanda, theEuropean Union provided free seedlings. The National Agricultural Export DevelopmentBoard (NAEB) and its predecessors were responsible for fertilizer supplies to smallholder coffeegrowers, but delivery was episodic. The next link in the value chain is the smallholders.Smallholders can choose to sell their cherries as “ordinary” coffee, that is, international C gradeor below. Should they choose to sell into the fully washed-coffee value chain (Figure 5), they gothrough the more labor-intensive harvesting, transport and sorting described above.
The third link in the value chain is the coffee washing station. Because of Rwanda’srough terrain, limited transport and need for rapid washing of harvested coffee,smallholders typically choose to sell into the fully washed-coffee value chain only if there isa nearby washing station, and then they typically don’t have a choice ( for logistics reasons)of which washing station. There are two types of washing stations in Rwanda: those thatare cooperatively owned by a group of smallholder coffee farmers, and those that areprivately owned either by an integrated international coffee retailer or by a private investorsuch as a domestic roasting company.
The roaster is the fourth link in the value chain. There are two main types of roastingenterprise in Rwanda. The first is the vertically integrated roaster, which is part of a largerexporting and retailing company and may invest in and own one or more coffee washingstations. Some international retailers fit this profile. In this case, the coffee flows from theroaster through the vertically integrated company to the consumer. The second type ofroasting enterprise is a self-contained enterprise, purchasing and roasting specialty,branded coffees usually for wholesale distribution. In either case, the roaster may buymost or all of the coffee from a particular washing station, and because of the quality willstill sell it as premium coffee but as the core entry into this premium market segment.Alternatively, the roaster may buy a small, high-quality lot for use in premium brands andhigh-end retail spaces within the premium market segment. For example, both GreenMountain Roasters and Starbucks offer Reserve coffees, which often include a selectionfrom Rwanda. Finally, a small amount of Rwandan coffee does sell at international auction(not through a roaster) for reserve brands featuring only the rarest and most exotic coffees
33
AfricanAgribusiness

and commanding top dollar – prices in the Rwanda Cup of Excellence auction typicallyreach $20–$30/lb. (“green” or unroasted) or more for the winning lot.
However, in 2000, none of this fully washed-coffee value chain was in place.The recent development of the fully washed-coffee value chain began with a smallholder
cooperative called Abahuzamugambi ba kawa ya Maraba (AKM). Abahuzamugambi is aKinyarwanda word meaning people who work together toward a common goal (Fraser,2006). The AKM cooperative was started in 1999 by 220 coffee smallholders who wanted toimprove quality. In 2001, PEARL provided support for AKM’s construction of the first,modern, small-scale coffee washing station in Rwanda, which began operation in 2002.Under PEARL, smallholders harvested their coffee and brought it to the washing stationsthat same day, many on “coffee bikes” that PEARL had designed and distributedspecifically to move heavy loads of coffee over Rwanda’s hilly terrain. In 2002, AKM sold37,500 pounds of coffee under the brand name Maraba to Community Coffee, a Louisianacoffee roaster and retailer (Fraser, 2006).
The Government of Rwanda was strongly enabling of the industry because of thepotential of the fully washed-coffee industry in Rwanda both to facilitate rapid increases insmallholder income throughout the country, and as part of the reconciliation process andreconstruction of Rwanda’s social fabric. The shared values were the cultural more ofindividual responsibility and accountability for the common good: “We won’t achieve unityand progress unless, in the exercise of our freedoms, we are able to think about the interestsof others and not just think about ourselves. There comes a point when every one of us hasto be responsible and accountable to each other” (Kagame, 2015). Kagame explicitly
Input Suppliers/NAEB
Smallholder Coffee Producers
Cooperative Washing Station
“Ordinary Coffee”
Private Washing Station
Vertically
Integrated
Washing/
Roasting/
Exporting/
Retailing
Roaster
Exporter/Wholesaler
Fully Washed Coffee
Retail
Cup of E
xcellence
Branded C
offee
NAEB Pricing
Figure 5.Fully-washed-coffeevalue chain
34
JADEE9,1

followed a strategy of building social cohesion and unity through building successfulbusiness relationships and successful businesses:
Sometimes direct and simple conversations make a difference […] People grasp it very quickly.They start valuing each other. They say, “Oh, I need him for what I don’t have and he needs me forwhat he doesn’t have.” That’s creating an awareness in society like never before: Yes, we need eachother. We are more similar than different. It helps the society to move forward […] At the end of theday we’re just human beings. You want food and you want it for your family. Plus, you really needdignity, to be able to do something on your own and benefit from it. And there’s nothing that doesthat better than being able to do business. (Paul Kagame, quoted in Fox, 2013)
In the 2002 National Coffee Strategy, the Government of Rwanda explicitly committed todeveloping the fully washed-coffee industry.
Coffee played a key role in both income growth and reconciliation. Talking about the earlyrole of coffee, Kagame stated that “Some of the best coffee in the world is produced byRwanda. We have worked to make this industry more productive and beneficial to citizens,who had previously given up on growing coffee because there wasn’t much coming from it.Now they’re involved in growing coffee and they add value by washing the coffee beforeexporting it. We are now beginning to roast our coffee as well.” Cooperatives and washingstations were also significant contributors to the country’s reconciliation plan because atwashing stations and elsewhere in the fully washed-coffee value chain, “genocide widowswork side by side with women whose husbands are in jail for participating in the killing”(Fraser, 2006). The smallholder became engaged because the government encouraged them tothink not about problems or differences, but about what they could accomplish by working inunison, and people trusted this vision (Kagame, 2015). Tobias and Boudreaux (2011) foundstatistically significant correlations between economic outcomes and positive attitudes towardreconciliation, “especially where intergroup contact has increased alongside new incentives forcollaboration across group boundaries” (p. 217) including in cooperatives; cooperatives werealso found to reduce distrust. Kamola (2008) and Koss (2016) also put forth the contrapositivehypothesis – deterioration of the Rwanda coffee market after the collapse of the InternationalCoffee Agreement in 1989 significantly increased the risk of systemic collapse in Rwanda andcontributed to the conditions leading up to the genocide.
The AKMwashing station and coffee were a great success on several fronts. First, they wereable to access the international premium coffee market with its higher prices (Government ofRwanda, 2006), often earning premiums of 100 percent or more over conventional (partiallywashed) coffee (Figure 6). Second, they were able to pass on the income from the higher prices tomember smallholders. Third, they were able to assure consistent quality and sell some of theircoffee at retail under the newly created Maraba brand. Fourth, they were able to increasemembership and production rapidly; by 2006, there were over 2,000 members and thecooperative sold about 161,000 lbs of premium quality coffee.
With government attention to coffee, donor support and the success of AKM and otherearly washing stations, the fully washed-coffee industry in Rwanda grew rapidly throughoutthe remainder of the decade. Other smallholders sought assistance to organize cooperatives andestablish washing stations. Internationally known retailers such as Green Mountain CoffeeRoasters, Starbucks, Costco and others began sourcing coffee in Rwanda, and some evenstarted their own washing stations. These and other companies both engaged in corporateshared values, and, in turn, shared these values with their consumers. For example, GreenMountain has made its reputation in part on the basis of “fair trade” coffee. And at the time ofwriting, the Starbucks Reserve website is offering a Rwandan coffee from theMusasa washingstation. The offer states in part, “For these Rwandan coffee farmers, Musasa is a gatheringplace, a coming together, a symbol of collaboration and trust. Farmers are accountable to eachother; the quality of the coffee depends on everyone delivering beans of superb quality. Thisdynamic brings people together, helping strengthen the community and build a sustainable
35
AfricanAgribusiness
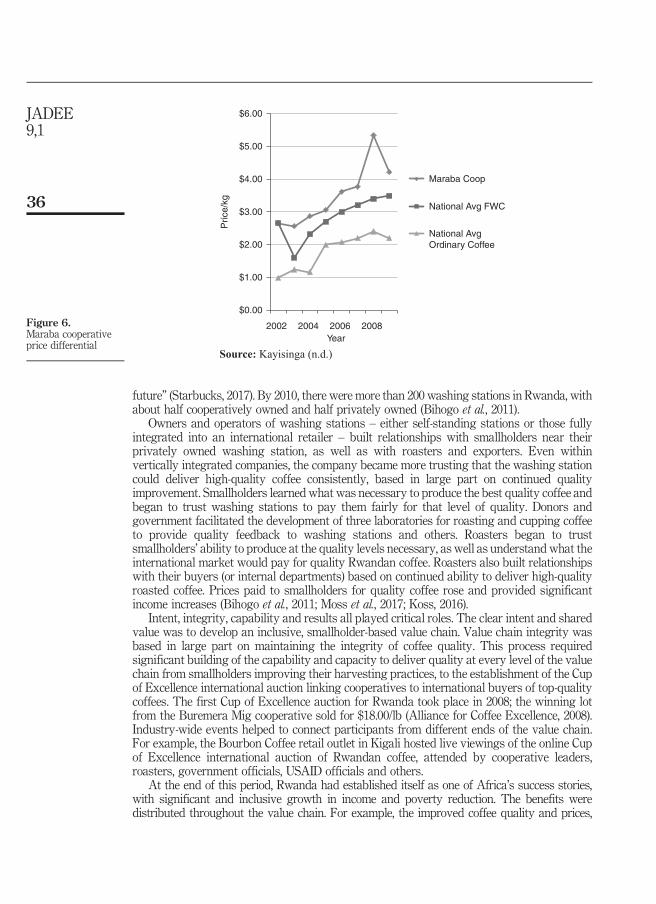
future” (Starbucks, 2017). By 2010, there were more than 200 washing stations in Rwanda, withabout half cooperatively owned and half privately owned (Bihogo et al., 2011).
Owners and operators of washing stations – either self-standing stations or those fullyintegrated into an international retailer – built relationships with smallholders near theirprivately owned washing station, as well as with roasters and exporters. Even withinvertically integrated companies, the company became more trusting that the washing stationcould deliver high-quality coffee consistently, based in large part on continued qualityimprovement. Smallholders learned what was necessary to produce the best quality coffee andbegan to trust washing stations to pay them fairly for that level of quality. Donors andgovernment facilitated the development of three laboratories for roasting and cupping coffeeto provide quality feedback to washing stations and others. Roasters began to trustsmallholders’ ability to produce at the quality levels necessary, as well as understand what theinternational market would pay for quality Rwandan coffee. Roasters also built relationshipswith their buyers (or internal departments) based on continued ability to deliver high-qualityroasted coffee. Prices paid to smallholders for quality coffee rose and provided significantincome increases (Bihogo et al., 2011; Moss et al., 2017; Koss, 2016).
Intent, integrity, capability and results all played critical roles. The clear intent and sharedvalue was to develop an inclusive, smallholder-based value chain. Value chain integrity wasbased in large part on maintaining the integrity of coffee quality. This process requiredsignificant building of the capability and capacity to deliver quality at every level of the valuechain from smallholders improving their harvesting practices, to the establishment of the Cupof Excellence international auction linking cooperatives to international buyers of top-qualitycoffees. The first Cup of Excellence auction for Rwanda took place in 2008; the winning lotfrom the Buremera Mig cooperative sold for $18.00/lb (Alliance for Coffee Excellence, 2008).Industry-wide events helped to connect participants from different ends of the value chain.For example, the Bourbon Coffee retail outlet in Kigali hosted live viewings of the online Cupof Excellence international auction of Rwandan coffee, attended by cooperative leaders,roasters, government officials, USAID officials and others.
At the end of this period, Rwanda had established itself as one of Africa’s success stories,with significant and inclusive growth in income and poverty reduction. The benefits weredistributed throughout the value chain. For example, the improved coffee quality and prices,
$0.00
$1.00
$2.00
$3.00
$4.00
$5.00
$6.00
2002 2004 2006 2008
Pric
e/kg
Year
Maraba Coop
National Avg FWC
National AvgOrdinary Coffee
Source: Kayisinga (n.d.)
Figure 6.Maraba cooperativeprice differential
36
JADEE9,1
passed through to smallholders, helped reduce Rwandan poverty by 14 percentage points overthe 2005–2010 period (Moss et al., 2017). This success was based on a technical agriculturaldevelopment strategy that featured reinvigorating the fully washed-coffee industry. Butperhaps more importantly, the industry’s development was a relationship-building process thatstarted with commercial relationships but extended well beyond into the country’s social fabric.In other words, this success was based in part by strengthening relationships amongindividuals and organizations participating in the value chain, by strengthening trust andaccountability, and the pursuit of shared values.
4.2 2011‐2015: changes in RwandaFrom 2010 to 2016, Rwanda witnessed important changes in that reverberated throughoutits fully washed-coffee industry.
International coffee prices peaked at over $6.00/lb in 2011, and, by the end of 2013, it hadfallen to less than half of that level. In 2012, donors reduced or delayed aid in response toRwandan support of a rebel group operating in the Democratic Republic of the Congo. At thispoint, donor investment in sustaining the fully washed-coffee value chain had essentiallyvanished. In 2014, the significant emergence of potato taste defect caused by a combination ofinsects, bacteria and possibly mold raised issues about the quality of Rwandan coffee,especially because the defect is not observable until the coffee is roasted and cupped.
During this period, the Government of Rwanda began to refocus its attention on foodsecurity and self-sufficiency. This decision was based, in part, on a belief that as the privatesector was investing heavily in coffee washing stations, the fully washed-coffee value chaincould sustain its growth rate with a much smaller level of government and donor intervention(Bihogo et al., 2011). It was also partly a response to the empirical finding that even in localitieswith significant poverty reduction, nutritional improvements did not necessarily follow quickly(Moss, Oehmke, Lyambabaje, and Schmitz, 2016). The Government of Rwanda elevatedattention to its crop intensification program, initiated in 2007, which, in the 2010–2016 period,began full-scale implementation with emphasis on monocropping maize, beans or Irish potato.
The NAEB was reconstituted in 2011 by consolidating pre-existing government agenciesand had nominal control over coffee pricing and fertilizer distribution to coffee smallholdersbut remained weak throughout this period. As a consequence of the emphasis on sustainedvalue chain growth through private sector investment and continued NAEB weakness, thesocial more developed that only the roasters and exporters understood the internationalmarket and so the exporters had to be kept happy or Rwanda would lose its foothold in themarket. This change was a significant departure from the social mores of shared value thatwas pervasive in the earlier period. By 2015, NAEB had established a minimum farm pricefor coffee of $1.36/kg, based on a consensus of coffee exporters about what price theyneeded to protect themselves from both international price fluctuations and declines, andfrom potentially lower quality coffee from potato taste defect.
By 2016, farmers’ compensation had deteriorated and coffee production saw a significantdecline. Many cooperative managers had been successful and hired away by non-coffee,private sector firms, but others had never reached the needed competency level to operate thecooperative efficiently. Even when farmers were growing high-quality coffee, sometimes itwas poorly processed by the washing station. Nor was all coffee delivered to a washingstation fully washed and graded as specialty coffee, for example, in 2015, only 68 percent andin 2016 only 71 percent of coffee delivered to a washing station was sold as premium coffee.This situation led to low prices and diminishing incentives for smallholders to producehigh-quality coffee. Many farmers abandoned their trees and shifted their resources to othercrops. Farmer sales of high-quality, specialty coffee were low, coffee washing station capacitywas underutilized, and some roasters and exporters struggled to find sufficient quantities ofhigh-quality coffee. In short, the value chain had lost trust and accountability. The fully
37
AfricanAgribusiness

washed-coffee industry, which, just a few years earlier, had helped to heal the wounds of thegenocide and contributed to massive poverty reduction, was threatened.
4.3 2016-present: present-day RwandaChurch (2017) Africa Great Lakes Region Coffee Support Program (AGLC) was initiated inOctober 2015 with two objectives: to reduce antestia bug/potato taste defect and to raisecoffee productivity. The approach was to delineate, in conjunction with stakeholders in thefully washed-coffee value chain, the key issues and then discuss proposed solutions ininclusive, evidence-based dialogs. The pricing dialog is especially relevant, as it directlyraised the issue of designing pricing and other mechanisms that incentivized production andprocessing of fully washed-coffee for the specialty coffee market.
The first critical question was whether farmers were receiving a fair payment especiallyfor their high-quality coffee – one that enabled them to earn a positive return from theircoffee plantations and in turn ensured that they would produce an adequate supply of coffeefor a successful export industry. AGLC conducted detailed research and analysis to addressthe issues. This process included gathering and analyzing data on farmer’s cost ofproduction, quality premiums, and returns to farmer labor. A primary result quantifiedfarmer costs of production of $1.41/kg, 5 cents above the designated floor price. In contrast,the exporters’ total costs at a purchase price of $1.36/kg totaled about $1.81/kg, leaving47 percent of the average export price of $3.40/kg or $1.59/kg as profit for exporters,whereas farmers were losing an average of 5 cents on every kg. A second critical issue wasthat even though some farmers received a small premium for higher quality coffee, thecompensation was too little to compensate for the extra work in producing the higherquality and returns to labor declined as coffee quality improved (Church, 2017).
Results and findings were introduced via policy roundtable dialogues among farmers’cooperatives, coffee washing station owners including both cooperatives and privateowners, exporters and NAEB officials. Evidence-based, inclusive dialogues are a criticalpart of trust building on the basis of common commitments to improving the coffeeindustry and holding one another accountable for those commitments. The questionbecame one of how to distribute compensation throughout the high-quality, coffee valuechain in a way that was “fair” and also met farmer needs for consistent and transparentmarkets for their coffee and exporter needs for consistent quantity and quality andensured that both farmers and exporters earned profits. Both top-down and bottom-upapproaches were implemented.
In a top-down approach, the NAEB set the minimum farm gate price in 2017 at $1.92/kg,sufficient to cover the farmer’s cost of production with a little profit for the farmer but stillleaving exporters with a 30 percent profit margin. In the bottom-up approach, severalprivately owned firms and cooperatives voluntarily addressed the problem of low farmerincentives by working with their smallholder suppliers to provide them with even bettervalue for quality coffee. Actions included one or more of the following: establishing a farmgate purchase price of $2.39/kg; transparent quality assessment at the washing station;rejecting low-quality coffee; training farmers on quality; and providing overall improvedfarmer compensation, including second payments based on the exporter’s final sale price(Church, 2017 AGLC Support Program, AGLC Policy Roundtable).
The 2017 Rwanda coffee harvest is complete and initial results are positive. Soon the finalresults will show how farmers have started to respond to the new (higher) pricing. Because coffeeis a perennial crop, the effect should be even bigger next year, assuming the higher floor pricesand quality premiums can be maintained. Continued adoption of innovative quality-pricingmechanisms along the entire high-quality coffee value chain could generate a distribution ofpayments that is both more equitable and more opportunistic in creating a value for bothfarmers and exporters.
38
JADEE9,1
5. ConclusionsToday, the development profession recognizes that agriculturally led development is a complexproblem affecting multiple stakeholders through a variety of relationships and connections.Successfully tackling this complex problem requires that the multiple stakeholders workcooperatively. Of particular current interest are processes for greater private sector involvementwith actions that further both the goals of the private sector enterprise and society.
A conceptual review of such practices as they apply to the inclusion of Africanagribusiness in development processes provides evidence of three key components,namely, trust, accountability and corporate shared values. Trust, long understood as a keyto business and social dynamics, is a critical piece in building successful institutions,partnerships and relationships among organizations and stakeholders within the Africanagro-food system. Accountability goes hand-in-hand with trust, specifying exactly whatother stakeholders are being trusted to do and holding them societally accountable forexecuting these actions. Corporate shared values define the set of corporate actions thathelp both the corporation and society achieve mutual goals. Mutual accountabilityprocesses as they are maturing in Africa are at the cutting edge of creating processeswhere multiple stakeholders, including agribusiness, can come together to make jointcommitments to a shared development agenda and where stakeholders hold themselvesand others accountable for meeting these commitments.
This paper has also illustrated the power of this multi-stakeholder approach based ontrust, accountability and shared values in the context of the development of the Rwanda fullywashed-coffee value chain. The development of this value chain on the basis of shared valuesnot only helped tens of thousands of Rwandans emerge from poverty, but it also helped thesociety heal after the genocide. The ups and down of this value chain development are directlyassociated with stronger or weaker levels of trust and accountability.
The conclusion from both the conceptual foundation and the case study is that mutualaccountability processes are the tool of choice for accelerating multi-stakeholder developmentefforts including the acceleration of inclusive agricultural growth. The policy implications aredonors and governments elevate attention to and invest in strengthening mutualaccountability processes, and agribusiness and civil society engage in these processes asthey offer new and more productive opportunities for creating shared value.
A clear limitation of this paper is that it has not analyzed alternative approaches apartfrom formal contracting – i.e. alternative informal approaches that could be successfuleven where trust is lacking. Whether or not such alternatives exist and/or are as effectiveas mutual accountability remains a topic for future research.
There are three critical thrusts of future research within the context of mutualaccountability. First, further work is needed on delineating and disseminating best practices,from both successful and less successful cases. Second, basic research is needed on theeconomic foundations of development cooperation based on trust, accountability and sharedvalues. This research will help provide a solid foundation against which to evaluate new andinnovative practices that are emerging in African agriculture. Third, empirical validation of thelinks between mutual accountability processes and societal outcomes will help institutionalizethese processes and guide future investment.
References
Alliance for Coffee Excellence (2008), “Cup of excellence: countries: Rwanda 2008”, available at: https://www.allianceforcoffeeexcellence.org/en/cup-of-excellence/country-programs/rwanda-program/2008/auction-results/ (accessed December 1, 2017).
Arrow, K.J. (1972), “Gifts and exchanges”, Philosophy and Public Affairs, Vol. 1 No. 4, pp. 343-362.
39
AfricanAgribusiness

Australian Public Service Commission (2007), Tackling Wicked Problems: A Public Policy Perspective,Commonwealth of Australia, Canberra.
Batt, P.J. and Rexha, N. (2000), “Building trust in agribusiness supply chains”, Journal of InternationalFood & Agribusiness Marketing, Vol. 11 No. 1, pp. 1-17, doi: 10.1300/J047v11n01_01.
Bihogo, E., Weatherspoon, D.D. and Oehmke, J.F. (2011), The Impact of Pearl and Spread Projects on theDevelopment of the Rwandan Coffee Sector, USAID, Kigali.
Blodgett, M.S., Hoitash, R. and Markelevich, A.S. (2014), “Sustaining the financial value of global CSR:reconciling corporate and stakeholder interests in a less regulated environment”, Business andSociety Review, Vol. 119 No. 1, pp. 95-124, doi: 10.1111/basr.12026.
Cai, R. and Ma, W. (2015), “Trust, transaction costs, and contract enforcement: evidence from applefarmers in China”, British Food Journal, Vol. 117 No. 10, pp. 2598-2608, available at: https://doi.org/10.1108/BFJ-10-2014-0335
Church, R.A. (2017), Designing mechanisms that connect coffee price to quality: Feed the Future AfricaGreat Lakes Region Coffee Support Program (AGLC) Policy Roundtable, Michigan StateUniversity, East Lansing, MI, available at: www.canr.msu.edu/fsp/outreach/presentations/RoundTable.Price-Quality.v012.toBePrintedShared.pdf
Covey, S.M.R. (2006), The Speed of Trust, Free Press, New York, NY.
Covic, N. and Hendricks, S. (2016), “Achieving a nutrition revolution for Africa: the road to healthierdiets and optimal nutrition”, in Covic, N. and Hendricks, S. (Eds), Achieving a NutritionRevolution for Africa: The Road to Healthier Diets and Optimal Nutrition, IFPRI, Washington,DC, 282p.
Dawson, P. and Guare, R. (2016), The Smart but Scattered Guide to Success: How to Use Your Brain’sExecutive Skills to Keep up, Stay Calm, and Get Organized at Work and at Home, The GuilfordPress, New York, NY.
Dorosh, P. and Thurlow, J. (2014), “Beyond agriculture versus nonagriculture: decomposing sectoralgrowth–poverty linkages in five African countries”, in Dorosh, P. and Thurlow, J. (Eds), BeyondAgriculture Versus Nonagriculture: Decomposing Sectoral Growth–Poverty Linkages in FiveAfrican Countries, IFPRI, Washington, DC, 32p.
Dowla, A. (2006), “In credit we trust: building social capital by Grameen bank in Bangladesh”, TheJournal of Socio-Economics, Vol. 35 No. 1, pp. 102-122, available at: https://doi.org/10.1016/j.socec.2005.12.006
Downing, J. and Campbell, R. (2014), “East & Southern Africa markets systems development regionalpeer-learning events: highlights & recommendations (annotated powerpoint)”, available at:www.acdivoca.org/2015/05/market-systems-development-regional-peer-learning-events-highlights-and-recommendations-downing-campbell/
Dunn, E.G. (2012), “Facilitating systemic change in value chains: lessons learned for strengtheningcountry systems”.
FAO, IFAD, UNICEF, WFP and WHO (2017), “The state of food security and nutrition in the world2017”, Building Resilience for Peace and Food Security, FAO, Rome, available at: www.fao.org/3/a-i7695e.pdf
Food and Agriculture Organization of the United Nations (2012), “The state of food and agriculture:investing in agriculture for a better future”, in Food and Agriculture Organization of theUnited Nations (Ed.), The State of Food and Agriculture: Investing in Agriculture for a BetterFuture, Rome, 166p.
Fox, J. (2013), “Why president Kagame runs Rwanda like a business”, Harvard Business Review,available at: https://hbr.org/2013/04/why-president-kagame-runs-rwanda
Franklin, K. (2017), Trust as a Catalyst for Development: Infusing Sustainable Change into the GlobalFood System, M. Pub. Admin, Columbia University, New York City.
Franklin, K. and Oehmke, J.F. (2018), “Ecological model: approach and application for food systems”,Presentation at the 30th International Conference of Agricultural Economists, Agency forInternational Development, July 28–August 2, Vancouver.
40
JADEE9,1
Fraser, L. (2006), “Coffee, and hope, grow in Rwanda”, New York Times, New York City, p. BU1.
Gould, E.D. and Hijzen, A. (2016), “Growing apart, losing trust? The impact of inequality on socialcapital”, IMF Working Paper No. 16/176, International Monetary Fund.
Government of Rwanda (2006), “President Kagame commends Maraba coffee farmers”, Governmentof Rwanda, available at: https://web.archive.org/web/20061003172701/http://www.gov.rw/government/062802.html (accessed November 19, 2017).
Gow, H.R., Streeter, D.H. and Swinnen, J.F.M. (2000), “How private contract enforcement mechanismscan succeed where public institutions fail: the case of Juhocukor a.s”, Agricultural Economics,Vol. 23 No. 3, pp. 253-265.
Growiec, K. and Growiec, J. (2014), “Social capital, trust, and multiple equilibria in economicperformance”, Macroeconomic Dynamics, Vol. 18 No. 2, pp. 282-315, doi: 10.1017/S136510051200034Xorg/10.1016/j.socec.2005.12.006.
Holmstrom, B. and Milgrom, P. (1991), “Multitask principal-agent analyses: incentive contracts, assetownership, and job design”, Journal of Law, Economics and Organization, Vol. 7 Special Issue,pp. 24-52, available at: https://doi.org/10.1093/jleo/7.special_issue.24
Kagame, P.P. (2015), “ ‘Reinventing Rwanda’: a conversation with president Paul Kagame”, in Klein, K.(Ed.), University of Pennsylvania, Philadelphia, available at: https://knowledge.wharton.upenn.edu/article/president-paul-kagame-on-rwandas-reinvention/
Kamola, I.A. (2008), “Coffee and genocide”, Transition, Vol. 99, pp. 54-72, available at:www.jstor.org/stable/20204261
Kayisinga, J.C. (n.d.), “Sustaining partnership to enhance rural enterprises and agribusinessdevelopment”, available at: www.value-chains.org/dyn/bds/bds2search.details2?p_phase_id=803&p_lang=en&p_phase_type_id=3 (accessed November 23, 1017).
Koss, E.J. (2016), Does Coffee Matter?: Women and Development in Rwanda, Northeastern University,Boston.
Levien, M. (2015), “Social capital as obstacle to development: brokering land, norms, and trust in ruralIndia”, World Development, Vol. 74 No. C, pp. 77-92, available at: https://doi.org/10.1016/j.worlddev.2015.04.012
Locke, E.A., Shaw, K.N., Saari, L.M. and Latham, G.P. (1981), “Goal setting and task performance:1969–1980”, Psychological Bulletin, Vol. 90 No. 1, pp. 125-152.
Lyon, F. and Porter, G. (2009), “Market institutions, trust and norms: exploring moral economies inNigerian food systems”, Cambridge Journal of Economics, Vol. 33 No. 5, pp. 903-920,available at: https://doi.org/10.1093/cje/bem008
Lyon, F. (2006), “Managing co-operation: trust and power in Ghanaian associations”, OrganizationStudies, Vol. 27 No. 1, pp. 31-52, available at: https://doi.org/10.1177/0170840605056392
Makombe, T. (2018), “Mutual accountability in theory and practice”, Presentation at the 30thInternational Conference of Agricultural Economists, International Food Policy Research Institute,Vancouver, July 28–August 2.
Mathews, G. (n.d.), Goals Research Summary, Domincan University, San Rafael.
Microlinks (n.d.a), “2.7 inter-firm relationships”, USAID, available at: https://microlinks.org/good-practice-center/value-chain-wiki/inter-firm-relationships-in-depth (accessed November 30, 2017).
Microlinks (n.d.b), “2.7.6. trust in inter-firm relationships”, USAID, available at: https://microlinks.org/good-practice-center/value-chain-wiki/trust-inter-firm-relationships (accessed November 30, 2017).
Milgrom, P. and Roberts, J.D. (1992), Economics, Organization and Management, Prentice Hall,Englewood Cliffs, NJ.
Mkhabela, T. (2018), “Dual moral hazard and adverse selection in South African agribusiness: it takes twoto Tango”, International Food and Agribusiness Management Review, Vol. 21 No. 3, pp. 391-406.
Moss, C.B., Lyambabaje, A. and Oehmke, J.F. (2017), “An economic evaluation of spread on Rwanda’srural population”, Applied Economics, Vol. 49 No. 36, pp. 3636-3644, doi: 10.1080/00036846.2016.1265076.
41
AfricanAgribusiness
Moss, C.B., Oehmke, J.F. and Lyambabaje, A. (2016), “Food security, subsistence agriculture, andworking’s model”, in Schmitz, A., Kennedy, P.L. and Schmitz, T.G. (Eds), Food Security in a FoodAbundant World (Frontiers of Economics and Globalization), Emerald Group PublishingLimited, Bingley, pp. 19-32.
Moss, C.B., Oehmke, J.F., Lyambabaje, A. and Schmitz, A. (2016), “Distribution of budget shares forfood: an application of quantile regression to food security”, Econometrics, Vol. 4 No. 2, pp. 1-12.
Nandonde, F.A., Liana, P.J. and Sachs, P.R. (2017), “Agribusiness CSR practices on the establishment ofunderdeveloped supply chains: evidence from Tanzania”, in Vertigans, S. and Idowu, S. (Eds),Corporate Social Responsibility: CSR, Sustainability, Ethics & Governance, Springer, Cham, pp. 83-100.
Oehmke, J.F., Kagniniwa, B. and Franklin, K. (2018), “Trust and accountability: an evolutionary model”,Presentation at the 30th International Conference of Agricultural Economists, Agency forInternational Development, July 28–August 2, Vancouver.
Oehmke, J. (2017), “Mutual accountability opens private-sector opportunities in African agriculture”, Choices,available at: www.choicesmagazine.org/choices-magazine/submitted-articles/mutual-accountability-opens-private-sector-opportunities-in-african-agriculture
Ostrom, E. and Basurto, X. (2011), “Crafting analytical tools to study institutional change”, Journal ofInstitutional Economics, Vol. 7 No. 3, pp. 317-343, doi: 10.1017/S1744137410000305.
Paul, C.J., Weinthal, E.S., Bellemare, M.F. and Jeuland, M.A. (2016), “Social capital, trust, and adaptationto climate change: evidence from rural Ethiopia”, Global Environmental Change, Vol. 36,pp. 124-138, available at: https://doi.org/10.1016/j.gloenvcha.2015.12.003
Porter, M.E. and Kramer, M.R. (2011), “Creating shared value”, Harvard Business Review, January-February, available at: https://hbr.org/2011/01/the-big-idea-creating-shared-value
Pring, C. (2015), “People and corruption: Africa survey 2015”, Global Corruption Barometer, availableat: www.transparency.org/whatwedo/publication/people_and_corruption_africa_survey_2015
Rademakers, M.F.L. (2000), “Agents of trust: business associations in agri-food supply systems”,The International Food and Agribusiness Management Review, Vol. 3 No. 2, pp. 139-153.
Reardon, T. (2016), “Growing food for growing cities: transforming food systems in an urbanizingworld”, in Reardon, T. (Ed.), Growing Food for Growing Cities: Transforming Food Systems in anUrbanizing World, Chicago, IL, 124p.
Resnick, D. and Thurlow, J. (2014), “The political economy of Zambia’s recovery: structural changewithout transformation”?, SSRN Electronic Journal, doi: 10.2139/ssrn.2405715.
Resnick, D. (2014), Urban Poverty and Party Populism in African Democracies, Cambridge UniversityPress, New York, NY.
Richards, P., Reardon, T., Tschirley, D., Jayne, T., Atwood, D. and Oehmke, J. (2016), “Cities and thefuture of agriculture and food security: a policy and programmatic roundtable”, Food Security,Vol. 8 No. 4, pp. 871-877.
Sartorius, K. and Kirsten, J. (2007), “A framework to facilitate institutional arrangements forsmallholder supply in developing countries: an agribusiness perspective”, Food Policy, Vol. 32Nos 50-6, pp. 640-655, available at: https://doi.org/10.1016/j.foodpol.2007.03.001
Starbucks (2017), “Starbucks reserve Rwanda Musasa”, available at: www.starbucks.com.sg/coffee/our-coffees/starbucks-reserve-coffee/starbucks-reserve-rwanda-musasa (accessed November 30, 2017).
Susanty, A., Bakhtiar, A., Jie, F. and Muthi, M. (2017), “The empirical model of trust, loyalty, andbusiness performance of the dairy milk supply chain: a comparative study”, British FoodJournal, Vol. 119 No. 12, pp. 2765-2787, available at: https://doi.org/10.1108/BFJ-10-2016-0462
Thai, T.M. and Hjortsø, C.N.P. (2015), “How institutions influence SME innovation and networkingpractices”, Journal of Small Business Management, Vol. 53 No. S1, pp. 209-228, available at:http://doi.org/10.1111/jsbm.12189
Tobias, J.M. and Boudreaux, K.C. (2011), “Entrepreneurship and conflict reduction in the post-genocideRwandan coffee industry”, Journal of Small Business & Entrepreneurship, Vol. 24 No. 2,available at: https://doi.org/10.1080/08276331.2011.10593535
42
JADEE9,1
Turyahikayo, W. and Edson, K. (2016), “Trust, perception, and effectiveness of extension services inUganda: a case of National Agricultural Advisory Services (NAADS)”, Journal of AgriculturalExtension and Rural Development, Vol. 8 No. 11, pp. 224-231, doi: 10.5897/JAERD2016.0806.
Wessen, P.D. and Oehmke, J.F. (2001), “Privatizing markets for heterogenous, experience goods: coffeein Northwest Cameroon”, Staff Paper No. 11620, Michigan State University, Department ofAgricultural, Food, and Resource Economics, East Lansing.
Wilson, P.N. (2000), “Social capital, trust, and the agribusiness of economics”, Journal of Agriculturaland Resource Economics, Vol. 25 No. 1, pp. 1-13.
World Bank (2019), “Databank: world development indicators”, available at: https://datacatalog.worldbank.org/dataset/world-development-indicators
Further reading
Fouepe, G.H.F., Nguekeng, B. and Kenfack Essougong, U.P. (2017), “Crise caféière et déclin descoopératives agricoles à l’Ouest Cameroun: La difficile relance de la Coopérative Agricole desPlanteurs de la Menoua (CAPLAME)”, International Journal of Innovation and Applied Studies,ISSR Journals, Vol. 19 No. 3, pp. 668-680.
Ha, T.M., Bosch, O.J.H. and Nguyen, N.C. (2015), “Necessary and sufficient conditions for agribusinesssuccess of small-scale farming systems in Northern Vietnam”, Business and ManagementStudies, Vol. 1 No. 2, pp. 36-44.
Ma, Y.-N. and Huang, S. (2014), “The collaboration pattern, trust relationship, and transferring andlearning willingness: evidence of China’s agribusiness and farmers”, International Journal ofServices Technology and Management, Vol. 20 Nos 1-3, pp. 31-46.
Minh, T.T. and Hjortsø, C.N. (2015), “How institutions influence SME innovation and networkingpractices: the case of Vietnamese agribusiness”, Journal of Small Business Management, Vol. 53,pp. 209-228, doi: 10.1111/jsbm.12189.
Momo-Lekane, G. (2016), “Coffee cooperatives in Cameroon: an assessment of the causes of coffeecooperatives’ collapse in the post-adjustment period”, in Okem, A. (Ed.), Theoretical andEmpirical Studies on Cooperatives: Springer Briefs in Geography, Springer, Cham, pp. 63-70.
Theron, E., Terblanche, N., Boshoff, C. and Spyropoulou, S. (2015), “The role of trust in relationshipmarketing in business-to-business financial services”, in Robinson, L. Jr. (Ed.), Proceedings of the2008 Academy of Marketing Science (AMS) Annual Conference: Developments in MarketingScience: Proceedings of the Academy of Marketing Science, Springer, Cham, pp. 209-213.
Zak, P.J. and Knack, S. (2001), “Trust and growth”,The Economic Journal, Vol. 111 No. 470, pp. 295-321,doi: 10.1111/1468-0297.00609.
Corresponding authorJames Oehmke can be contacted at: [email protected]
For instructions on how to order reprints of this article, please visit our website:www.emeraldgrouppublishing.com/licensing/reprints.htmOr contact us for further details: [email protected]
43
AfricanAgribusiness
Political will and public willfor climate-smart agriculture
in SenegalOpportunities for agricultural transformation
Eric D. Raile and Linda M. YoungDepartment of Political Science,
Montana State University, Bozeman, Montana, USAAdama Sarr
Center for Ecological Monitoring, Dakar, SenegalSamba Mbaye
Universite Gaston Berger, Saint-Louis, SenegalAmber N.W. Raile
Jake Jabs College of Business & Entrepreneurship,Montana State University, Bozeman, Montana, USA
Lena WooldridgeDepartment of Political Science,
Montana State University, Bozeman, Montana, USADiaminatou Sanogo
National Center for Forestry Research, Dakar, Senegal, andLori Ann Post
Buehler Center for Health Policy and Economics,Northwestern University, Evanston, Illinois, USA
AbstractPurpose – Agriculture must transform as climate change progresses. The international community haspromoted climate-smart agriculture (CSA) as a set of solutions. Previous analyses of opportunities for scalingup CSA have not looked closely at building political and social support for policies, practices and programs.The purpose of this paper is to fill that gap in the case study country of Senegal.Design/methodology/approach – The study applies the conceptual definitions, operationalizations andassessment targets from the political will and public will (PPW) approach to social change. Semi-structuredinterviews and documents constitute the sources of data and information.Findings – The analysis identifies opportunities to generate political will for supplying an enablingenvironment for the widespread adoption of CSA. On the public will side, the analysis identifies opportunitiesto generate and channel demand for CSA.Research limitations/implications – Researchers investigated some definitional components morecompletely than others due to resource and access constraints. Further, the context specificity of thecomponents limits generalizability of certain findings.Social implications – Social structures may need to change for successful adoption of certain CSAinnovations, but improved agricultural outcomes are likely to result.
Journal of Agribusiness inDeveloping and EmergingEconomiesVol. 9 No. 1, 2019pp. 44-62© Emerald Publishing Limited2044-0839DOI 10.1108/JADEE-01-2018-0003
Received 10 January 2018Revised 31 May 2018Accepted 8 June 2018
The current issue and full text archive of this journal is available on Emerald Insight at:www.emeraldinsight.com/2044-0839.htm
Funding support for this research came from the US Agency for International Development andUS Department of Agriculture. Additional support came from the National Institutes of Healthvia Montana INBRE and the HELPS Lab at Montana State University. The views and conclusions inthis paper are those of the authors and do not necessarily represent the positions of thesesponsoring organizations.
44
JADEE9,1
Quarto trim size: 174mm x 240mm
Originality/value – This examination of crucial elements for scaling up CSA efforts constitutes the mostextensive application of the PPW approach to date, thus providing an example of this generalizable method.Keywords Africa, Community development, Climatic hazards, Senegal, Adoption of innovations,Agricultural transformation, Climate-smart agriculture, Political will and public willPaper type Research paper
1. IntroductionThe need to transform agriculture to adapt to climate change is already urgent for somelow-income countries. Senegal, for example, is suffering from rising temperatures, floodingand greater variability in precipitation and seasons ( Jalloh et al., 2013; National Agency forCivil Aviation and Meteorology of Senegal et al., 2013; Bonilla-Findj et al., 2016; Feed theFuture, 2016). Over one-half of households in Senegal are living in multidimensionalpoverty, about one-third in “severe” multidimensional poverty, and about one-third on adaily income below the US equivalent of $1.25 per day (UNDP, 2016). Ultimately, manySenegalese are living on the edge of survival and are quite vulnerable to perturbations.At its core, climate change is a set of serious perturbations. For households and populationsgrowing their own food, these perturbations become even more immediately dangerous.
As a consequence, experts assert that countries like Senegal need to take advantage ofopportunities to enhance their food security. In recent years, the global community hasbegun using the term “climate-smart agriculture” (CSA) to label various agriculturalpolicies, practices and programs aimed at dealing with climate variability (FAO, 2013). Thecurrent project applies the political will and public will (PPW) approach for evaluating socialchange (Post et al., 2010; Raile et al., 2014; Raile, Raile and Post, 2018) to the examination ofopportunities and obstacles as they relate to CSA. The primary aim of this study is toaddress the following research question:
RQ1. What opportunities exist for generating PPW for the adoption of CSA practicesand policies in Senegal?
Secondary questions examine what would be required to scale up CSA efforts, as well as thepotential roles for policy and agribusiness entrepreneurs in doing so. Widespread adoption ofCSA would constitute a fundamental transformation in the practice of agriculture in Senegal.
The methods and approach for this study are relatively unconventional for agriculturaleconomics. The primary methods are interviews and the examination of documents, with thegoal of assessing information against the definitional components within the PPW approach.The study applies a descriptive analytical framework but also includes case study and actionresearch elements. While more quantitative analysis underlies parts of the larger project, thisparticular piece focuses on identification of opportunities for transformation. Consequently,this piece emphasizes more comprehensive listings of problem and solution understandings.Without the resources for a mass survey, the goal here is more in line with contextualunderstanding than generalization of results. The former is a goal that is typical of qualitativeresearch (see Bryman, 2016). However, the overall subject matter is firmly within the domainof economics. For various reasons (e.g. limited information, input supply difficulties,infrastructure problems, risk aversion, tradition, etc.), a widespreadmarket for CSA is unlikelyto emerge quickly on its own. Governmental supply of an enabling environment might helpconsiderably. Further, while experts might see benefits clearly outpacing costs for adoption ofCSA, the case will need to be made to producers. What are the opportunities for stimulatingpublic demand for such an enabling environment? More conventionally, opportunities mayalso exist for stimulating demand for the information, goods and services necessary totransform agriculture along CSA lines.
The prospective benefits of this research extend to theory and methods and to globalimprovement of food security. This study provides an example for applying the PPW
45
PPW for CSA
approach, which can be employed by researchers and practitioners as action research forachieving systemic change (Raile, Raile and Post, 2018). Other authors have used thedefinitions and certain elements of the PPW approach in subject areas like inter-ethnicviolence (Fiedler, 2018) and corruption (Hope, 2017). However, this study represents themost complete application of the PPW definitions and elements to date. Further, thoughcontexts are highly important, the examination of PPW for CSA efforts in Senegal shouldenhance understanding of problem–solution linkages and agenda crowding more generally.
2. BackgroundConceptual definitions of political will (Post et al., 2010) and public will (Raile et al., 2014) are thefoundation of the PPW approach. The authors provide operationalizations, assessment targetsand ideas about measurement for each of the definitional components. Application of the PPWapproach enables identification of specific strengths and insufficiencies in political and publicsupport for social change. However, the approach also recognizes that PPW can vary acrossgeographic areas, issue areas, specific initiatives and groups of people. Further, the PPWapproach focuses on participatory communication processes and emphasizes the importance ofstakeholders sharing common problem and solution definitions in order to achieve social change.
Attracting significant attention is often crucial for innovations to produce social change(see Post et al., 2008). Scholars have sometimes differentiated between the public agenda onthe one hand and the formal governmental agenda on the other (e.g. Cobb et al., 1976;Eyestone, 1978; Kingdon, 2003). The former is the list of issues or conditions to which thegeneral public is paying close attention, while the latter is the list of problems thegovernment intends to address somehow. Importantly, these agendas have limited carryingcapacity due to the logistics of governance and limits in mass attention (Carmines andStimson, 1986; McCombs and Zhu, 1995). The limited carrying capacity of these agendas is aform of scarcity that generates a highly competitive environment for attention.
Scarcity and competition are conditions under which entrepreneurs can profit – whethermore traditional business entrepreneurs or “policy entrepreneurs” or “claims makers”(Spector and Kitsuse, 2000; Mintrom andNorman, 2009). Policy entrepreneurs might workwithbusiness entrepreneurs or might pursue ideological, public interest or humanitarian goals. Oneprominent role of policy entrepreneurs is helping to set or build an agenda, which means toestablish the agenda items and their ordering (Eyestone, 1978; Baumgartner and Jones, 1993;Kingdon, 2003). Getting an issue to achieve “problem” status (i.e. somethingmust be done) witha spot on the agenda typically involves “problem definition” and linking the problem to aspecific solution via a broader “issue frame.” Issue framing simplifies an issue area byconstructing a model that excludes certain considerations and emphasizes others, therebyinfluencing perception of a problem (Entman, 1993; Druckman, 2004; Crow and Lawlor, 2016).Problem understandings can shift dramatically when a skilled issue framer is at work.
A policy entrepreneur trying to get a problem on the agenda usually has an associatedsolution in mind. The problem–solution linkage is important and should be relatively directand logical. While problems precede solutions in traditional views of policymaking (e.g.deLeon, 1999), other scholars have allowed for solutions preceding problems (e.g.Zahariadis, 2014). Joining problems and solutions on the agenda requires waiting fornecessary “focusing events” to occur or requires more proactive creation of “windows ofopportunity” (Kingdon, 2003). Delays can create unfortunate situations in which the publicrealizes the severity and consequences of problems too late (Downs, 1972). Such a delaycould have catastrophic consequences for the people of Senegal based on their vulnerabilityto the serious perturbations of climate change.
The potential solutions considered in this study are CSA solutions. The three elements ofCSA generally recognized by the international community are “(1) sustainably increasingagricultural productivity and incomes; (2) adapting and building resilience to climate
46
JADEE9,1

change; and (3) reducing and/or removing greenhouse gas emissions, where appropriate”(FAO, 2013, p. ix). CSA is a systems approach to managing crops, livestock, forests andfisheries, both on the farm and in a broader institutional context; this approach calls formanagement of landscapes as well as adaptation of technologies, practices and policies tolocal conditions (FAO, 2013). CSA advocates have differentiated the concept from“conservation” or “sustainable” agriculture by pointing to its broader, more general nature(Shreeg, 2015). The prospective answer for reconciling the goals of greater agriculturalproductivity and reduced greenhouse gas emissions is agricultural “intensification,” orgreater production per unit of inputs. This balance is particularly challenging in places likeSub-Saharan Africa, where input use (like inorganic fertilizers) is relatively low andproduction must increase dramatically to feed growing populations.
3. MethodsThis case study of Senegal and certain regions within the country employed a mix ofmethods, including semi-structured interviews and the examination of documents. Theprimary purpose in collecting this data and information was to supply the materialnecessary for applying the definitional components of PPW. This research also used certainelements of stakeholder analysis (Brugha and Varvasovszky, 2000; Schmeer, 2000), asidentification of stakeholders is a core task in the PPW approach (Raile, Raile and Post,2018). Researchers reviewed documents and worked with in-country experts to identify“priority” stakeholders (Schmeer, 2000), who are also deemed experts in their respectivedomains. The sampling approach emphasized speaking with a variety of different types ofpriority stakeholders in diverse areas of the country.
Researchers conducted semi-structured interviews during two separate field researchtrips in Senegal. The first trip, in late 2015, focused on the capital of Dakar and multiplecommunities along the Senegal River Valley in the north of the country. Over five days,researchers conducted 21 semi-structured interviews involving approximately 35 speakingparticipants, with an average interview length under 1 h. Attendees at each interviewincluded two researchers, an interpreter and occasionally a facilitator. The follow-up trip inlate 2016 focused again on Dakar but also on the central part of the country, including theregions of Kaolack, Kaffrine, Diourbel and Thiès. Speaking with people in different parts ofthe country was essential because the climate-driven agricultural problems, the types ofcrops grown, the growing methods and a number of other factors differ from one area toanother. Over five days, researchers conducted 18 semi-structured interviews involving 40speaking participants. The average interview length was again less than 1 h. Attendees ateach interview included four researchers and an interpreter.
Researchers gathered data from the same four stakeholder groups on each trip: nationaland local government employees (12 interviews); government and other researchers(8 interviews); agricultural producers (8 interviews); and non-governmental organizations(NGOs; 5 interviews). However, the second trip also added a category for CSA projectadministrators (six interviews). Researchers took field notes during the interviews andtypically made audio recordings, which a few research participants refused as they wereinformed they could do.
The sets of questions in the semi-structured interview protocols differed somewhat acrossthe two field research trips. The Appendix supplies language for most of these questions. In2015, the relevant questions emphasized interviewee perspectives of major climate-drivenagriculture problems, social and economic problems and nutritional problems in the country.The questions also asked about priorities and decision makers at different levels ofgovernment. In 2016, the questions again included perspectives of problems and governmentpriorities. However, the questions this time focusedmore on CSA projects and their linkages toproblems as understood. Consequently, the protocol included questions regarding knowledge
47
PPW for CSA

of the CSA projects, messaging and information about CSA projects, and perceptions aboutproblems addressed or potentially addressed by CSA projects.
Transcripts of the audio recordings were uploaded into qualitative analysis software(NVivo) for coding purposes. When transcripts were not available, researchers uploaded thetypewritten field notes instead. Coding proceeded using a mixture of deductive andinductive approaches (Miles et al., 2014). Questions in the semi-structured interviewprotocols derived directly from elements in the PPW approach. The coding nodes thentracked from these PPW elements in a deductive manner (e.g. a node for solutionunderstandings). Within each node, however, responses from the interviewees themselveswere the basis for the construction of subnodes in an inductive process (e.g. subnodes forimproved water use and for organic fertilizers within solution understandings). Researcherscollaboratively refined these subnodes in multiple rounds of work by reconciling anydifferences and by combining subnodes when possible.
4. Political will findingsThe analysis begins with political will for CSA in Senegal. The formal definition of politicalwill includes four components:
1. A sufficient set of decision makers
2. With a common understanding of a particular problem on the formal agenda
3. Is committed to supporting
4. A commonly perceived, potentially effective policy solution (Post et al., 2010, p. 659).
The following subsections discuss operationalization and assessment for each of thesedefinitional components.
4.1 Sufficient set of decision makersThe first component of political will is a sufficient set of decision makers, or anycombination of decision makers with the ability on their own to approve and implement thenecessary policies in an issue area (Post et al., 2010). Assessment involves looking atinstitutions and factions. Senegal, a presidential republic with elements of federalism, hastaken important steps toward democracy since achieving independence from France in1960. However, the current president’s party, the Alliance for the Republic, dominates thelegislature with about 80 percent of the seats. The executive office remains relativelypowerful and must be part of any sufficient set of decision makers.
The researchers asked stakeholders about entities or persons important in making publicdecisions and establishing priorities. Stakeholders agree with the influence of the president andhis government (i.e. the cabinet and other important advisors), with several intervieweesidentifying them as being by far the most influential. Stakeholders also identify a variety of othermeaningful actors. Officials at government ministries have a role in making and implementingpolicy. However, stakeholders sometimes see a disconnect between such centralized decisionmaking and what happens at the district and local levels due to capacity shortages and differentneeds across localities. Decision-making processes sometimes include domestic NGOs, thoughsome stakeholders express skepticism about the meaningfulness of this participation.Stakeholders also point to local decision makers like chiefs, wise men, imams, mayors and socialregulators as being important. The inclusion of religious figures in this list is crucial, as someexperts assert that the greatest political power resides in the “leaders of the country’s Islamic Sufibrotherhoods” (Polity IV, 2010, p. 2). Influential decision makers at all levels tend to be men. Insummary, the crucial actors appear to be the president’s government and local leaders.
48
JADEE9,1
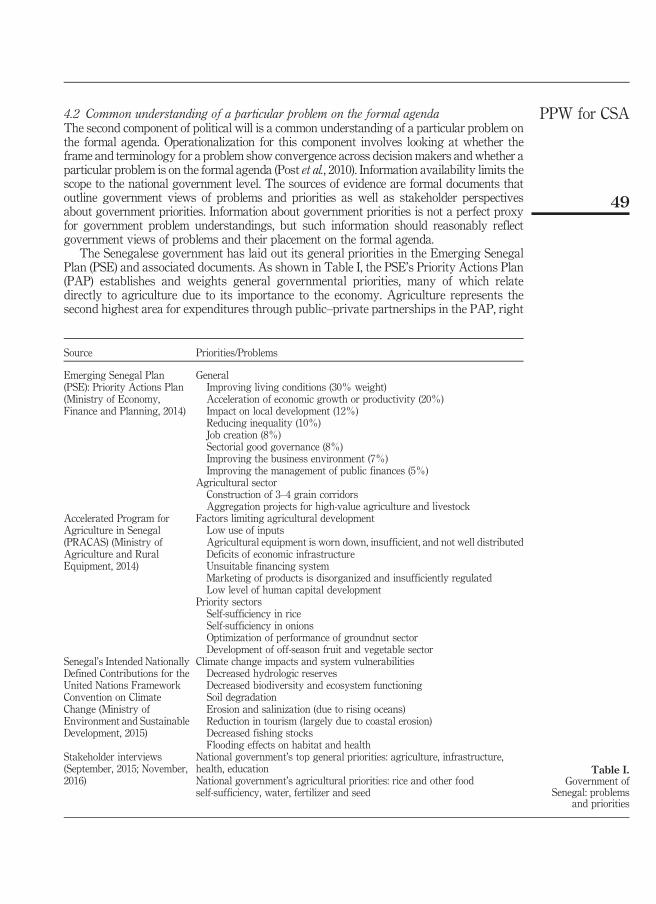
4.2 Common understanding of a particular problem on the formal agendaThe second component of political will is a common understanding of a particular problem onthe formal agenda. Operationalization for this component involves looking at whether theframe and terminology for a problem show convergence across decision makers andwhether aparticular problem is on the formal agenda (Post et al., 2010). Information availability limits thescope to the national government level. The sources of evidence are formal documents thatoutline government views of problems and priorities as well as stakeholder perspectivesabout government priorities. Information about government priorities is not a perfect proxyfor government problem understandings, but such information should reasonably reflectgovernment views of problems and their placement on the formal agenda.
The Senegalese government has laid out its general priorities in the Emerging SenegalPlan (PSE) and associated documents. As shown in Table I, the PSE’s Priority Actions Plan(PAP) establishes and weights general governmental priorities, many of which relatedirectly to agriculture due to its importance to the economy. Agriculture represents thesecond highest area for expenditures through public–private partnerships in the PAP, right
Source Priorities/Problems
Emerging Senegal Plan(PSE): Priority Actions Plan(Ministry of Economy,Finance and Planning, 2014)
GeneralImproving living conditions (30% weight)Acceleration of economic growth or productivity (20%)Impact on local development (12%)Reducing inequality (10%)Job creation (8%)Sectorial good governance (8%)Improving the business environment (7%)Improving the management of public finances (5%)
Agricultural sectorConstruction of 3–4 grain corridorsAggregation projects for high-value agriculture and livestock
Accelerated Program forAgriculture in Senegal(PRACAS) (Ministry ofAgriculture and RuralEquipment, 2014)
Factors limiting agricultural developmentLow use of inputsAgricultural equipment is worn down, insufficient, and not well distributedDeficits of economic infrastructureUnsuitable financing systemMarketing of products is disorganized and insufficiently regulatedLow level of human capital development
Priority sectorsSelf-sufficiency in riceSelf-sufficiency in onionsOptimization of performance of groundnut sectorDevelopment of off-season fruit and vegetable sector
Senegal’s Intended NationallyDefined Contributions for theUnited Nations FrameworkConvention on ClimateChange (Ministry ofEnvironment and SustainableDevelopment, 2015)
Climate change impacts and system vulnerabilitiesDecreased hydrologic reservesDecreased biodiversity and ecosystem functioningSoil degradationErosion and salinization (due to rising oceans)Reduction in tourism (largely due to coastal erosion)Decreased fishing stocksFlooding effects on habitat and health
Stakeholder interviews(September, 2015; November,2016)
National government’s top general priorities: agriculture, infrastructure,health, educationNational government’s agricultural priorities: rice and other foodself-sufficiency, water, fertilizer and seed
Table I.Government of
Senegal: problemsand priorities
49
PPW for CSA
behind infrastructure and transport services. The Accelerated Program for Agriculture inSenegal (PRACAS) reveals government views about problems and priorities morespecifically in the agricultural sector. The factors discussed as limiting agriculturaldevelopment in this document (e.g. insufficient agricultural equipment and inappropriatefinancing system) are often not ones that CSA can solve directly. Also worth noting here isthat rice self-sufficiency (i.e. growing all domestically consumed rice in the country) oftenoccupies a prominent spot in formal documents. Political actors in Senegal are acutely awareof the threat of not having a sufficient supply of affordable rice for the country’s residents(see Seck et al., 2010). The real problem leading to the high-priority status of riceself-sufficiency is that a shortfall of affordable rice for consumption could destabilize thegovernment. Being subject to the swings of international food markets is a related problem.
Table I also provides information about government views of problems related to climatechange. Senegal has been active in defining its intended nationally defined contributions forthe United Nations Framework Convention on Climate Change (UNFCC). Institutionalsupport for climate change initiatives comes from Senegal’s National Climate ChangeCommittee and from the National Science-Policy Dialogue Platform for the Adaptation ofAgriculture and Food Security to Climate Change (see Feed the Future, 2016). Though notshown in Table I, PRACAS and the PAP for PSE talk about various risks related to climatechange and measures to deal with them.
The researchers also asked stakeholders about their perceptions of the nationalgovernment’s priorities. In terms of comment frequency, stakeholders see agriculture assharing high-priority status with infrastructure, health and education. Stakeholders oftenobserve that agriculture (including food security) appears to be the first priority and thatcertain other areas (like infrastructure) are necessary for agricultural success. Otherstakeholders see the primary positioning of agriculture as mostly rhetorical and believe thatagriculture does not feel like the first priority at the local level. Some stakeholders believethat much of the government’s expenditure on agriculture goes toward administration andsubsidies. Further, some question the accuracy of decision makers’ knowledge abouttechnical problems due to a lack of effective communication with technicians, scientists andother researchers. In sum, though agriculture appears to hold a prominent spot, it is subjectto considerable agenda competition from other sectors. As stated by one interviewee, “Thereality is that everything is the top priority in Africa.”
Among agricultural priorities, stakeholders believe that rice self-sufficiency is at the top forthe government, claiming that strong consumer preferences make rice a good strategic crop.Stakeholders also point out that agricultural problem understandings and priorities sometimesdiffer between the national and local levels. According to these stakeholders, such differencesarise when intermediaries legitimately defend their own interests or when government doesnot consult with farmers about problems. An example of such failure is families selling oreating certified seeds subsidized and distributed by the government. Stakeholders disagreeabout the level of government concern over climate change in the agricultural arena.
4.3 A commonly perceived, potentially effective solutionA third definitional component of political will is a commonly perceived, potentially effectivesolution. Operationalization begins with examining whether the frame and terminology forthe solution show convergence across decision makers (Post et al., 2010). Evidence takes theform of government policies and programs and stakeholder perspectives. Given thisproject’s focus on CSA, the emphasis here is on government views of CSA as a solution. Thiscomponent appears out of order in relation to the previous list due to the need to understandthe identities of solutions before evaluating commitment to them.
Competition among agricultural programs is considerable. Stakeholders note that over 200food security projects are currently active in Senegal, many of them driven by donors and
50
JADEE9,1
other external entities. Based on stakeholder observations, the government agriculturalprograms with the greatest visibility are in the areas of irrigation, quality and storage offertilizer, access to machinery, access to certified seeds, processing facilities for crops andgiving women opportunities and resources in agriculture. Overall, stakeholders disagree abouthow much the national government is promoting CSA solutions. However, governmentrepresentatives see a marked increase in CSA components in recent projects. Among the moreprominent projects discussed, Senegal participates in the West Africa AgriculturalProductivity Program, which has a subprogram on CSA technical adoption. Additionally,the Ministry of Agriculture and Rural Equipment is working with the Senegalese AgriculturalResearch Institute (ISRA) on producing seed varieties better adapted to climate change andhas a national program on climate change. In conjunction with external entities, the NationalCivil Aviation and Meteorological Authority (ANACIM) has been working on a project thatuses radios to get weather information to producers (Ndiaye et al., 2013; CCAFS, 2015). Asdiscussed later, national government entities have worked closely with the climate-smartvillage (CSV) at Daga-Birame near Kaffrine. Finally, the government has developed adaptationoptions for agriculture in its intended nationally defined contributions document for theUNFCC (Ministry of Environment and Sustainable Development, 2015, p. 15).
Given the importance of rice self-sufficiency, the natural question concerns its fit withCSA. Some stakeholders see the use of irrigation to grow rice as a reasonable adaptation toclimate change. This is particularly true as the world moves into an era of greater climateuncertainty and as rice growing conditions improve in the Senegal River Valley due toshorter winters. Domestic production of rice could serve as a buffer against internationalmarket perturbations that are likely to result from climate change. However, otherstakeholders emphasize opportunity costs and negative impacts. Such stakeholders mentiondeforestation (thereby eliminating income- and food-producing trees), loss of biodiversity,potential water overuse and the heavy demands on soil as concerns. Additionally, somebelieve irrigated rice systems produce too many greenhouse gases via fuel for irrigationpumps and heavy use of inorganic fertilizers. Some stakeholders also see sustainabilityproblems with the plan and worry about increased climate vulnerability as a consequence oflesser diversification in crops. In short, many of the downsides of rice self-sufficiency maywork to worsen climate-related agricultural problems and vulnerabilities.
Operationalization of a “potentially effective” solution involves looking at capacity andresources for making the solution work (Post et al., 2010). On the one hand, the governmentprovides some level of support for institutions like ISRA and ANACIM that are working onCSA initiatives. On the other hand, stakeholders identify coordination and fundingproblems and difficulties with scaling up successful programs. The national governmentlacks the capacity to manage, coordinate and communicate about all these projects,particularly given the involvement of so many external actors. Many of these projects haveshort time horizons, and stakeholders observe that continuing or scaling up successfulprojects is a challenge once external funding is gone. The national government is working toovercome these administrative difficulties by holding coordination meetings, attempting toreduce project overlap and developing innovation platforms.
4.4 Commitment to supportThe final definitional component of political will is the level of commitment by the relevantpolitical actors to support the identified solution(s). Operationalization here emphasizes thecredibility and level of obligation produced by statements about particular solutions, as wellas the incentives and disincentives for the political actors (Post et al., 2010). Overall, Senegalin recent years has met its obligation under 2003s Maputo Declaration on Agriculture andFood Security to devote over 10 percent its national budget to agriculture (Ministry ofAgriculture, 2013), which provides general evidence of commitment. More specifically, the
51
PPW for CSA
public claims about rice self-sufficiency are highly visible and come from the mostprominent officials in the national government. Rice self-sufficiency has long had thebacking of an influential figure – Papa Abdoulaye Seck (Mohapatra, 2014). The former headof the Africa Rice Center, Seck, is now the Minister of Agriculture and Rural Equipment. Asfor the public claims being binding, the latest plan for rice self-sufficiency is built on top of aseries of failed attempts, including 2008s Grand Offensive for Agriculture. Conversely,programs more explicitly about CSA have not received as much publicity from the nationalgovernment to this point. In terms of incentives, strong consumer preferences for affordablerice and widespread agreement about the wisdom of the plan for rice self-sufficiency putpressure on policymakers to follow through with the plan. Pressure for CSA programs is notso cohesive. In short, then, the commitment to rice self-sufficiency is a clear and meaningfulone, while commitments to CSA programs are presently weaker and more ambiguous.
5. Public will findingsThe analysis continues with public will for CSA in Senegal. The formal definition for publicwill includes five components that run roughly parallel to those for political will:
1. Social system
2. Shared recognition of a particular problem
3. Resolve to address the situation
4. In a particular way
5. Through sustained collective action (Raile et al., 2014, p. 111).
The following subsections discuss operationalization and assessment for each of thedefinitional components.
5.1 Social systemThe first component of public will is the existence of a social system, or “a set of interrelated unitsthat are engaged in joint problem solving to accomplish a common goal” (Rogers, 2003, p. 23).Operationalization of this component involves looking for “interconnected people, groups,organizations, or subsystems” (Raile et al., 2014, p. 112). Building large social systems in adeveloping country is often challenging due to obstacles for flows of information, money oranything else linking members. In Africa, local language differences can also constitute a barrier.Though broad social systems might be ideal for adopting CSA innovations in a widespreadmanner that would constitute agricultural transformation, presently the social systems operatingin this issue area in Senegal tend to be local or externally driven or a combination of the two.
Assessment of this component typically involves looking at association of people throughinformation or other flows and examining social identities and cleavages (Raile et al., 2014).The country is multiethnic and multilingual, with Wolof, Pular and Serer ethnic groupsmaking up significant portions of the population. The country is almost entirely Muslim.Village-level organization is common, with leadership assuming various forms: chiefs, mayors,religious authorities, etc. When examining developing countries, the analyst must alsoconsider the participation of outside entities like multilateral organizations, internationalnon-governmental organizations and donor countries. Based on the interviews, stakeholdersgenerally see little direct influence of external entities on priorities and decision making at thenational level in Senegal. However, stakeholders do see strong roles for external entities inimplementing programs locally. Such implementation work represents an opportunity toinfluence priorities and decisions by becoming part of locally based social systems.
Despite the difficulties of building broader social systems, community radio constitutes asuccess story in Senegal. In total, 7m Senegalese people in rural areas can access climate
52
JADEE9,1
information provided in local languages (Sanogo et al., 2016). The researchers interviewedpersonnel from multiple radio stations, some of which grew out of local development projects.The radio stations serve as platforms for experts, local technicians and practitioners tocommunicate about effective agricultural practices and to share scientific, marketing and otherforms of information. Additionally, the information provided by the earlier-mentionedANACIM radio project includes forecasts and rainy season predictions – information alsoshared via text messages to mobile phones. In short, community radio stations are very muchcreating social systems given the way they are linking populations through information flows,though some stakeholders have concerns about politicization of community radio.
5.2 Shared recognition of a particular problemThe second component of public will is shared recognition of a particular problem.Operationalization starts with “a common belief something should be done about thesituation” and the use of a “similar frame and terminology” for the problem (Raile et al., 2014,p. 112). Assessment can proceed by looking at “attitudes and beliefs about problem status,”the “nature and volume of expressions of concern” and converging “beliefs about thesituation and its causes” (Raile et al., 2014, p. 112). As this component is the in-depth focus ofa recently published companion paper (Raile, Young, Bonabana-Wabbi, Kirinya, Mbaye,Wooldridge, Raile and Post, 2018), the current paper spends less time on it.
Based on the first-round interview data, inadequate rainfall and variability in precipitationand seasons are the climate-driven agricultural problems most “ripe” to be addressed based onfrequency and breadth of mentions among stakeholders who could form potential publics (Raile,Young, Bonabana-Wabbi, Kirinya, Mbaye, Wooldridge, Raile and Post, 2018). However, theseproblems compete with a number of other climate-driven agricultural problems like seawaterintrusion, deforestation and loss of biodiversity (Raile, Young, Bonabana-Wabbi, Kirinya, Mbaye,Wooldridge, Raile and Post, 2018). All these problems also compete for public agenda space withsocioeconomic and infrastructure problems like urban migration, insufficient irrigation, lack ofmechanization, access to water and persistence of traditional agricultural methods (Raile, Young,Bonabana-Wabbi, Kirinya, Mbaye, Wooldridge, Raile and Post, 2018). The researchers asked thesame types of questions during the second round of field research, and perceptions of theforemost climate-driven agricultural problems again center on inconsistent and insufficient watersupply for crops. According to the second-round stakeholders, competing socioeconomic andinfrastructure problems include the spotty availability of high-quality seed and fertilizer,unemployment, poverty and disadvantages for women in agriculture.
Table II supplies a comprehensive list of the problems mentioned by stakeholders, as dividedinto the following four categories: agricultural practice, socioeconomic and infrastructure,communication and administration and nutrition. These four categories emerged through a team-based, iterative coding process. The table demonstrates the degree of competition for attention onpublic agendas. The other noteworthy aspect of the table is that CSA could feasibly addressmany of the problems listed if linked effectively to the types of solutions discussed in Section 5.4(e.g. using drought- or flood-resistant seeds to deal with precipitation variability). Again, acomprehensive listing seems more appropriate here to the goal of identifying opportunities.
5.3 Resolve to address the situationThe third component of public will is resolve to address the situation. “Perceived collectiveefficacy” (i.e. what groups believe they can achieve) and “willingness to commit significantresources” are means of operationalizing this component (Raile et al., 2014, p. 112).Assessment of the latter can involve evaluation of “credible commitments to expendresources” and “stakeholder incentives and motivations” (Raile et al., 2014, p. 112).According to stakeholders, the problem of sustaining programs or projects after donorfunding or technical assistance has disappeared can detract from collective efficacy for
53
PPW for CSA

social systems. Conversely, the success of community radio and of some local demonstrationprojects has clearly empowered some social systems. In terms of credible commitments, theresearchers observe willingness on the part of families and villages to make sacrifices toenable program success. They are willing to contribute labor and to make investments andchanges to working structures. Individuals and families risk a lot by reorganizing workstructures and practices. The incentives and motivations for families or villages can becomplex, but the consequences of inaction here potentially include starvation. Thoughresistance to change and risk aversion can be common among agricultural families, the needfor food security and for a basic income are strong motivators.
Agricultural practice Socioeconomic and infrastructureBiodiversity loss Crop marketing/trading difficultiesCrops Education quality and availabilityLow quality Gender relatedLow yields/productivity Childcare responsibilities
Deforestation Marginalization of womenEcological fragility Physical exhaustionInputs (seeds, fertilizer) Healthcare (quality and availability)Adulteration Housing (quality and availability)Limited availability Inadequate investment
Livestock Irrigation capacity and priceDiseases Lack of agricultural mechanizationFlooding deaths Lack of crop insuranceInsufficient food/grazing land Lack of crop refrigeration and storage
Pests increasing (species, numbers) Lack of repair capacity for machinerySoil erosion Potable water shortagesSoil quality low/degrading PovertyTemperatures increasing Rural-urban migrationUse of traditional agricultural methods SanitationWater Transportation and distribution difficultiesIncreased evaporation Unemployment and low wagesIncreased variability in rainfallInsufficient rainfallSalinization as sea levels rise
Communication and administration NutritionCoordination across projects/programs Food qualityExcess government overhead costs Food quantityFarmer participation in projects Iron deficiencyLack of buy-in and ownership Lack of variety in diet
Flawed government statistics LethargyGovernment subsidization of export crops Months without foodInability to communicate problems upward Protein deficiencyInability to communicate solutions upward UndernourishmentInappropriate use of government funds Vegetable deficiencyInter-institutional cooperation difficultiesLack of farmer organizationsLack of women’s organizationsLow funding for researchMarketing information shortfallsNGOs’ focus on own employeesSubsidized inputs (seeds, fertilizer)Insufficient quantities distributedLow qualityResold or eaten
Translation of science/researchTransmission of knowledge
Table II.Stakeholder problemunderstandingsrelated to agriculture(comprehensivealphabetical listing)
54
JADEE9,1
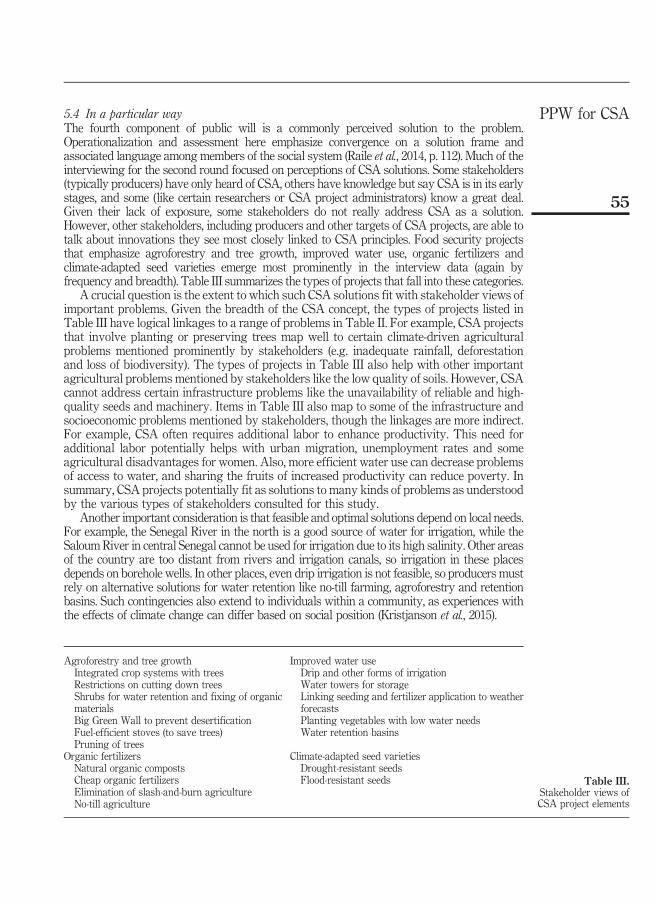
5.4 In a particular wayThe fourth component of public will is a commonly perceived solution to the problem.Operationalization and assessment here emphasize convergence on a solution frame andassociated language among members of the social system (Raile et al., 2014, p. 112). Much of theinterviewing for the second round focused on perceptions of CSA solutions. Some stakeholders(typically producers) have only heard of CSA, others have knowledge but say CSA is in its earlystages, and some (like certain researchers or CSA project administrators) know a great deal.Given their lack of exposure, some stakeholders do not really address CSA as a solution.However, other stakeholders, including producers and other targets of CSA projects, are able totalk about innovations they see most closely linked to CSA principles. Food security projectsthat emphasize agroforestry and tree growth, improved water use, organic fertilizers andclimate-adapted seed varieties emerge most prominently in the interview data (again byfrequency and breadth). Table III summarizes the types of projects that fall into these categories.
A crucial question is the extent to which such CSA solutions fit with stakeholder views ofimportant problems. Given the breadth of the CSA concept, the types of projects listed inTable III have logical linkages to a range of problems in Table II. For example, CSA projectsthat involve planting or preserving trees map well to certain climate-driven agriculturalproblems mentioned prominently by stakeholders (e.g. inadequate rainfall, deforestationand loss of biodiversity). The types of projects in Table III also help with other importantagricultural problems mentioned by stakeholders like the low quality of soils. However, CSAcannot address certain infrastructure problems like the unavailability of reliable and high-quality seeds and machinery. Items in Table III also map to some of the infrastructure andsocioeconomic problems mentioned by stakeholders, though the linkages are more indirect.For example, CSA often requires additional labor to enhance productivity. This need foradditional labor potentially helps with urban migration, unemployment rates and someagricultural disadvantages for women. Also, more efficient water use can decrease problemsof access to water, and sharing the fruits of increased productivity can reduce poverty. Insummary, CSA projects potentially fit as solutions to many kinds of problems as understoodby the various types of stakeholders consulted for this study.
Another important consideration is that feasible and optimal solutions depend on local needs.For example, the Senegal River in the north is a good source of water for irrigation, while theSaloum River in central Senegal cannot be used for irrigation due to its high salinity. Other areasof the country are too distant from rivers and irrigation canals, so irrigation in these placesdepends on borehole wells. In other places, even drip irrigation is not feasible, so producers mustrely on alternative solutions for water retention like no-till farming, agroforestry and retentionbasins. Such contingencies also extend to individuals within a community, as experiences withthe effects of climate change can differ based on social position (Kristjanson et al., 2015).
Agroforestry and tree growth Improved water useIntegrated crop systems with trees Drip and other forms of irrigationRestrictions on cutting down trees Water towers for storageShrubs for water retention and fixing of organicmaterials
Linking seeding and fertilizer application to weatherforecasts
Big Green Wall to prevent desertification Planting vegetables with low water needsFuel-efficient stoves (to save trees) Water retention basinsPruning of trees
Organic fertilizers Climate-adapted seed varietiesNatural organic composts Drought-resistant seedsCheap organic fertilizers Flood-resistant seedsElimination of slash-and-burn agricultureNo-till agriculture
Table III.Stakeholder views ofCSA project elements
55
PPW for CSA

5.5 Through sustained collective actionThe final component of public will is an intention to sustain collective action to implementchange. Operationalization for this component involves looking at “commitment to collectiveaction” and “intention to sustain collective action” (Raile et al., 2014, p. 112). Targets forassessment are “evidence of group formalization and identification,” “stability over time ofbeliefs and attitudes” and “level of publicity of commitments” (Raile et al., 2014, p. 112). At thelocal level, social systems are often pre-existing, though external actors may become part ofthese local social systems. Assessing the stability of beliefs and attitudes related to CSAsolutions would require more time, especially given the relative newness of CSA. However,project participants have clear incentives (e.g. food security) to remain engaged. Producersplace a lot of weight on successful demonstration projects for CSA practices and techniquesthat require little capital to implement. This support seems likely to persist, though reversionto old ways is possible. The level of publicity of commitments looks different in the developingworld given the limited forums for proclaiming views. However, the willingness of villagers tospread news of CSA innovations to neighboring villages, a phenomenon witnessed onmultiple occasions, does serve as an important public statement of sorts.
Sustained collective action may be unnecessary if adoption of CSA practices happens inpiecemeal fashion. A farmer only needs to learn about a smaller innovation somehow –whetherfrom watching a neighbor or from listening to community radio or an agricultural extensionagent. Sustained use of such an innovation also requires the producer seeing profit in theactivity. This model of change would not require public will but is worth mentioning here.
6. The Daga-Birame climate-smart villageThis section provides a brief discussion of the Daga-Birame CSV in Senegal as a concreteapplication for some of the findings and ideas in the previous sections. The researchers spokewith Daga-Birame villagers, associated researchers from ISRA, and other stakeholdersconcerned with the project. The CSV is an example of a project that meets local needs in aholistic manner, involving both new agricultural practices and a commitment to social change(see Sanogo et al., 2016). The robust involvement of the national government via entities likeISRA and ANACIM indicates a considerable level of political will for this specific CSA project.The willingness of the chief of Daga-Birame to donate his own land to enable success of theCSV is a clear manifestation of political will at the local level.
In terms of building a social system, the project has demonstrated a substantialcommitment to participatory research in that villagers have had strong input from the startand testing of techniques has proceeded in inclusive ways. The broader social systemappears to be strong, with villagers praising the involvement of ISRA in particular. As aresult of training efforts, the villagers have significantly altered their production practices,and have adopted new crops. They have a good working knowledge of climate-drivenagricultural problems and of the ways in which the CSV is addressing these problems(i.e. problem–solution linkages). The project’s components include creation of a villagedevelopment plan, use of local knowledge and institutions, use of a variety of climate-smarttechnologies and use of climate information services (Sanogo et al., 2016). In terms of resolveand sustainability, the villagers identify rather strongly with the project and frequentlymention the importance of the shared, collective work. The substantial changes made towork structures suggest a new equilibrium that is unlikely to change easily.
While the CSV clearly has much working in its favor in terms of PPW, what is required toscale up this approach in Senegal and beyond?While others have usefully considered the issueof scaling up the CSV (Sanogo et al., 2016), they have not done so through the PPW lens.Clearly, political support would need to remain and likely grow given an increased workloadfor organizations like ISRA and ANACIM. Policy entrepreneurs would need to ensure that keypolitical leaders understand the problem–solution linkages and their own incentives.
56
JADEE9,1
Further injection of external resources would also be necessary. International actors like theCGIAR Research Program on Climate Change, Agriculture and Food Security; the WorldAgroforestry Centre; and the International Crops Research Institute for the Semi-Arid Tropicshave worked with the Daga-Birame CSV. The project is seeking an additional $10m to expandthe project to 100 more villages in Senegal (Sanogo et al., 2016). Supporting this type of programwould fit with recommendations to scale up local demonstration programs that have proveneffective (e.g. see Easterly, 2006; Karlan and Appel, 2012) and with a recent major evaluation ofthe US government’s Feed the Future initiative (USAID, 2016). If properly incentivized, theprivate agribusiness sector (e.g. information providers, equipment suppliers and financiers)could drive some of the expansion and could pick up when donor funding diminishes.
In terms of other PPW elements, a participatory, bottom-up approach adds to socialsystem development and the consequent likelihood of success. Effective training anddissemination of information are also crucial for building public will. These activities caninform and persuade producers about problem–solution linkages in the climate-agricultureissue area, which also helps build supportive social systems. However, scaling upinformational and training activities will require resources. Truly diffusing CSA will alsorequire commitment on the part of local producers. Economic benefits might be enough ontheir own for change to persist, but transformative change like that undertaken by the CSVrequires a significant commitment from farm households.
7. Conclusion and implicationsThis final section of the paper considers opportunities for agricultural transformation viaCSA in Senegal, beginning with a summary of the findings and discussion of therelationship between political will and public will. The section then discusses opportunitiesfor policy and agribusiness entrepreneurs. The paper ends with consideration of potentialresearch extensions and of the usefulness of the PPW approach.
7.1 SummaryIn terms of political will for CSA in Senegal, agriculture is an important priority for thenational government. Agriculture competes with economics/finance, infrastructure, healthand education for space on the formal agenda but also has strong linkages to such areas.Senegal has participated actively in international efforts and has supported domesticinstitutions and programs working on climate-related agriculture problems. Consequently,the government has created something of an enabling environment for addressing thesetypes of problems. However, rice self-sufficiency (which in some ways does not fit well withCSA) appears to be the single most important agricultural priority, and some agriculturalproblems listed in prominent government documents are not directly solvable with CSA.Additionally, some stakeholders remain skeptical of the real importance to the nationalgovernment of agriculture (apart from a few select commodities) and of dealing with climatechange. Government work with CSA programs has increased, but stakeholders worry abouttradeoffs and the capacity of government to do it all.
Looking next at public will, social systems supportive of CSA can emerge despitelogistical obstacles. Stakeholders identify a variety of climate-driven agricultural problemsand often hold views of CSA projects consistent with solving those problems. Given thestakes, commitments to these solutions can be strong and ongoing even when they carrysignificant costs. However, collective efficacy is sometimes lacking due to resource andadministrative shortfalls. Additionally, local needs will determine whether solving theseproblems is as important as a priority like rice self-sufficiency.
CSA provides a good example of political will and public will complementing oneanother, with each contributing different necessary elements. Some of the necessarysupport emerges from national policies and programs, while other support emerges from
57
PPW for CSA
local publics. The national government supplies important goods (e.g. technical advice,support for community radio, channeling of funding from donors and inputs like seeds) thatfit with CSA objectives. In a complementary manner, communities can demonstrate publicwill through flexible implementation and willingness to take risks and adopt innovations.Many local stakeholders have problems that may motivate them to do so. External actorscan provide technical assistance and funding as demonstrations of their support.
7.2 Opportunities for entrepreneursOpportunities exist for policy entrepreneurs and agribusiness entrepreneurs in this issuearea. Despite heavy competition, CSA approaches and the types of problems they canaddress make strong claims for agenda status. Policy entrepreneurs have opportunities tojoin prominent problems and CSA solutions and to generate corresponding political supportfor such initiatives, especially if they focus on problems like drought and variableprecipitation. Based on the interview data, policy entrepreneurs should also promoteunderstanding of the linkages between environmental problems and poverty. Additionally,policy entrepreneurs are likely to find greater success if they use effective messengersalready in place, such as community radio and ISRA. Producers may receive informationfrom a variety of sources, and figuring out which ones they trust most is important.
Policy entrepreneurs should also be aware of obstacles like agenda competition andcoordinating across projects. Further, policy entrepreneurs must be aware of the dangers ofdilution and the fact that CSA is not a viable solution for all the problems on the public andpolitical agendas. CSA is many different things – a variety of strategies, policies andtechniques (Steenwerth et al., 2014) – and some are bound to work better than others for aparticular locality. As a result, participatorymethods and techniques (Odugbemi and Jacobson,2008; Hacker, 2013) that involve local populations from the start are more likely to be effective.This means empowering local populations and having them participate in the demonstrationof solutions. Despite the initial upfront costs, the overall cost effectiveness of such participatoryprograms may be better in the long run – if supported by appropriate technical assistance.
Agribusiness entrepreneurs, on the other hand, can look toward supplying the goods,services and information that producers need to solve their problems. Table II, with itsstakeholder-generated list of problem understandings, should provide useful information inthis respect. Table III provides more direct ideas about the types of goods and services thatagribusiness entrepreneurs might supply. More traditional opportunities exist in providinggoods like irrigation equipment, solar panels for water pumps, trees and shrubs, climate-adapted seeds and organic fertilizers. The provision of financing for the adoption of new CSAtechnologies represents another opportunity. Less orthodox opportunities are also evident.Much of CSA amounts to learning new practices. Though agribusiness entrepreneurs wouldneed to earn the trust of producers, the dissemination of information about CSA practicesacross the entire country will be a tremendous job. On-site training and demonstration plotswill be necessary, though community radio can also disseminate information. Donors willwant to invest in solutions that the private sector can provide as CSA efforts scale up, whichmeans that donor funding could be available now for solid problem/solution pairings.
7.3 Research extensions and usefulnessThis study is subject to certain limitations but provides opportunities for future work. First,resource and access restraints prevented researchers from investigating some componentsas completely as others. For example, assessing the stability of beliefs and attitudes overtime would require more of a longitudinal study. A more systematic review of promotionalmaterials for CSA programs could yield extra insights, as well. Calculations that comparethe cost effectiveness of bottom-up and holistic programs against other types of programsseem potentially useful, as well. Second, the analysis has generated additional questions for
58
JADEE9,1

the researchers. For example, how does political will interact across different levels (e.g.international, national, regional and local)? Also, what does it mean to have political willwhen some influential actors are external? The PPW approach has not yet addressed suchsovereignty questions. Finally, the context specificity of the components limitsgeneralizability of certain findings. Similar research in other contexts would provideuseful information about the degree of generalizability.
Overall, application of the analytical framework for PPW has proved useful as a meansof evaluating a social change project and identifying ways to move forward. The frameworkallows for the integration of existing data and newly collected data in a way that provides aclearer picture of the opportunities for social change in a specific context. The PPWapproach helps in sorting through the congruence between a crowded agenda forgovernment decision makers and a multiplicity of problems experienced by citizens. Theapproach also recognizes features of human behavior in ways that should facilitatelong-lasting changes. Finally, application of the PPW approach has enabled identification ofopportunities for agricultural transformation and the potential roles for policy andagribusiness entrepreneurs in such transformation.
References
Baumgartner, F.R. and Jones, B.D. (1993), Agendas and Instability in American Politics, University ofChicago Press, Chicago, IL.
Bonilla-Findj, O., Zougmore, R., Henry, K., Schreeg, L. and Jarvis, A. (2016), “CCAFS deep dive assessmentof climate-smart agriculture (CSA) in the Feed the Future portfolio in Senegal”, available at: https://cgspace.cgiar.org/rest/bitstreams/113934/retrieve (accessed November 27, 2017).
Brugha, R. and Varvasovszky, Z. (2000), “Stakeholder analysis: a review”, Health Policy and Planning,Vol. 15 No. 3, pp. 239-246.
Bryman, A. (2016), Social Research Methods, 5th ed., Oxford University Press, Oxford.
Carmines, E.G. and Stimson, J.A. (1986), “On the structure and sequence of issue evolution”, AmericanPolitical Science Review, Vol. 80 No. 3, pp. 901-920.
CCAFS (2015), “The impact of climate information services in Senegal”, available at: https://cgspace.cgiar.org/rest/bitstreams/59295/retrieve (accessed November 27, 2017).
Cobb, R., Ross, J. and Ross, M. (1976), “Agenda building as a comparative political process”, AmericanPolitical Science Review, Vol. 70 No. 1, pp. 126-138.
Crow, D.A. and Lawlor, A. (2016), “Media in the policy process: using frames and narratives tounderstand policy influences”, Review of Policy Research, Vol. 33 No. 5, pp. 472-491.
deLeon, P.A. (1999), “The stages approach to the policy process: what has it done? Where is it going?”,in Sabatier, P. (Ed.), Theories of the Policy Process, Westview Press, Boulder, CO, pp. 19-32.
Downs, A. (1972), “Up and down with ecology: the issue-attention cycle”, The Public Interest, Vol. 28,pp. 38-50.
Druckman, J.N. (2004), “Political preference formation: competition, deliberation, and the (ir)relevanceof framing effects”, American Political Science Review, Vol. 98 No. 4, pp. 671-686.
Easterly, W. (2006), The White Man’s Burden: Why the West’s Efforts to Aid the Rest Have Done SoMuch Ill and So Little Good, Penguin, New York, NY.
Entman, R.M. (1993), “Framing: toward clarification of a fractured paradigm”, Journal ofCommunication, Vol. 43 No. 4, pp. 51-58.
Eyestone, R. (1978), From Social Issues to Public Policy, Wiley, New York, NY.
FAO (2013), Climate-Smart Agriculture Sourcebook, FAO, Rome.
Feed the Future (2016), “Climate-smart agriculture in Senegal”, available at: https://montana.app.box.com/file/118472576350 (accessed November 27, 2017).
59
PPW for CSA

Fiedler, C. (2018), “On the effects of international support to peace and democracy in Kenya andKyrgyzstan in the aftermath of interethnic violence”, Journal of Asian and African Studies,Vol. 53 No. 2, pp. 314-329.
Hacker, K. (2013), Community Based Participatory Research, Sage, Thousand Oaks, CA.
Hope, K.R.S. (2017), “Fighting corruption in developing countries: some aspects of policy from lessonsfrom the field”, Journal of Public Affairs, Vol. 17 No. 4.
Jalloh, A., Nelson, G.C., Thomas, T.S., Zougmoré, R. and Roy-Macauley, H. (Eds) (2013), WesternAfrican Agriculture and Climate Change: A Comprehensive Analysis, International Food PolicyResearch Institute, Washington, DC, available at: www.ifpri.org/publication/west-african-agriculture-and-climate-change-comprehensive-analysis (accessed November 27, 2017).
Karlan, D. and Appel, J. (2012), More than Good Intentions: Improving the Ways the World’s PoorBorrow, Save, Farm, and Stay Healthy, Plume, New York, NY.
Kingdon, J.W. (2003), Agendas, Alternatives, and Public Policies, 2nd ed., Addison-Wesley EducationalPublishers, New York, NY.
Kristjanson, P., Bernier, Q., Bryan, E., Ringler, C., Meinzen-Dick, R.S. and Ndour, Y.B. (2015),“Implications of gender-focused research in Senegal for farmer’s adaption to climate change”,available at: www.ifpri.org/publication/implications-gender-focused-research-senegal-farmers-adaption-climate-change (accessed November 27, 2017).
McCombs, M. and Zhu, J. (1995), “Capacity, diversity, and volatility of the public agenda: trends from1954 to 1994”, Public Opinion Quarterly, Vol. 59 No. 4, pp. 495-525.
Miles, M.B., Huberman, A.M. and Saldaña, J. (2014), Qualitative Data Analysis: A Methods Sourcebook,3rd ed., Sage, Los Angeles, CA.
Ministry of Agriculture (2013), “Basic agricultural public expenditure diagnostic review”, available at:http://documents.worldbank.org/curated/en/634781468193489188/pdf/895120WP0P11940LIC00Senegal0PER0ENG.pdf (accessed November 27, 2017).
Ministry of Agriculture and Rural Equipment (2014), “Accelerated Program for Agriculture inSenegal”, available at: www.ipar.sn/IMG/pdf/pracas_version_finale_officiele.pdf (accessedNovember 27, 2017).
Ministry of Economy, Finance and Planning (2014), “Emergent Senegal Plan: priority Actions Plan2014-2018”, available at: www.finances.gouv.sn/en/Docpdf/PAP_2014-2018_of%20PSE.pdf(accessed November 27, 2017).
Ministry of Environment and Sustainable Development (2015), “Intended nationally determinedcontributions”, available at: www4.unfccc.int/Submissions/INDC/Published%20Documents/Senegal/1/CPDN%20-%20S%C3%A9n%C3%A9gal.pdf (accessed November 27, 2017).
Mintrom, M. and Norman, P. (2009), “Policy entrepreneurship and policy change”, Policy StudiesJournal, Vol. 37 No. 4, pp. 649-667.
Mohapatra, S. (2014), “Papa Abdoulaye Seck: an advocate of research for Africa’s development”, RiceToday, Vol. 13 No. 1, pp. 36-37.
National Agency for Civil Aviation and Meteorology of Senegal; World Food Program Office forClimate Change, Environment and Disaster Risk Reduction; World Food Program Food SecurityAnalysis Service; Columbia University’s International Research Institute for Climate andSociety; and the World Food Program Country Office in Senegal (2013), “Climate risk and foodsecurity in Senegal: analysis of climate impacts on food security and livelihoods”, available at:www.wfp.org/content/climate-risk-and-food-security-senegal-analysis-climate-impacts-food-security-and-livelihoods (accessed November 27, 2017).
Ndiaye, O., Moussa, A., Seck, M., Zougmoré, R. and Hansen, J. (2013), “Communicating seasonalforecasts to farmers in Kaffrine, Senegal for better agricultural management”, available at:https://cgspace.cgiar.org/rest/bitstreams/19668/retrieve (accessed November 27, 2017).
Odugbemi, S. and Jacobson, T. (Eds) (2008), Governance Reform under Real-World Conditions: Citizens,Stakeholders, and Voice, The World Bank, Washington, DC.
60
JADEE9,1
Polity IV (2010), “Polity IV country report 2010: Senegal”, available at: www.systemicpeace.org/polity/Senegal2010.pdf (accessed November 27, 2017).
Post, L.A., Raile, A.N.W. and Raile, E.D. (2010), “Defining political will”, Politics & Policy, Vol. 38 No. 4,pp. 653-676.
Post, L.A., Salmon, C.T. and Raile, A.N.W. (2008), “Using public will to secure political will”, inJacobson, T. and Odugbemi, S. (Eds), Governance Reform under Real-World Conditions: Citizens,Stakeholders, and Voice, World Bank Press, Washington, DC, pp. 113-124.
Raile, A.N.W., Raile, E.D. and Post, L.A. (2018), “The political will and public will approach:participatory action research for social change”, Action Research, available at: https://doi.org/10.1177/1476750318772662
Raile, E.D., Raile, A.N.W., Salmon, C.T. and Post, L.A. (2014), “Defining public will”, Politics & Policy,Vol. 42 No. 1, pp. 103-130.
Raile, E.D., Young, L.M., Bonabana-Wabbi, J., Kirinya, J., Mbaye, S., Wooldridge, L., Raile, A.N.W. andPost, L.A. (2018), “Agriculture in shifting climates: the configuration and ripeness of problemunderstandings in Uganda and Senegal”, Review of Policy Research, Vol. 35 No. 2, pp. 302-325.
Rogers, E.M. (2003), Diffusion of Innovations, 5th ed., Free Press, New York, NY.
Sanogo, D., Dayamba, D.S., Ouédraogo, M., Zougmoré, R., Bayala, J., Ndiaye, O., Sall, M., Diop, M.,Camara, B.A., Ndour, Y., Sangaré, S.K., Ky-Dembele, C., Partey, S., Ouédraogo, J.S., Jarvis, A. andCampbell, B.M. (2016), “The climate-smart village approach: what research and insights fromimplementation in Daga-Birame CSV in Senegal?”, available at: https://cgspace.cgiar.org/rest/bitstreams/92496/retrieve (accessed November 27, 2017).
Schmeer, K. (2000), “Section 2: stakeholder analysis guidelines”, available at: www.who.int/workforcealliance/knowledge/toolkit/33.pdf?ua=1 (accessed November 27, 2017).
Seck, P.A., Tollens, E., Wopereis, M.C.S., Diagne, A. and Bamba, I. (2010), “Rising trends and variability ofrice prices: threats and opportunities for Sub-Saharan Africa”, Food Policy, Vol. 35 No. 5, pp. 403-411.
Shreeg, L. (2015), “Reflections on climate-smart agriculture in Feed the Future”, available at: www.feedthefuture.gov/article/reflections-climate-smart-agriculture-feed-future (accessed November27, 2017).
Spector, M. and Kitsuse, J.I. (2000), Constructing Social Problems, Transaction Publishers, Piscataway, NJ.
Steenwerth, K.L., Hodson, A.K., Bloom, A.J., Carter, M.R., Cattaneo, A., Chartres, C.J., Hatfield, J.L.,Henry, K., Hopmans, J.W., Horwath, W.R., Jenkins, B.M., Kebreab, E., Leemans, R., Lipper, L.,Lubell, M.N., Msangi, S., Prabhu, R., Reynolds, M.P., Solis, S.S., Sischo, W.M., Springborn, M.,Tittonell, P., Wheeler, S.M., Vermeulen, S.J., Wollenberg, E.K., Jarvis, L.S. and Jackson, L.E.(2014), “Climate-smart agriculture global research agenda: scientific basis for action”,Agriculture & Food Security, Vol. 3 No. 11, available at: https://doi.org/10.1186/2048-7010-3-11
UNDP (2016), “Human development report 2016: Senegal”, available at: http://hdr.undp.org/sites/all/themes/hdr_theme/country-notes/SEN.pdf (accessed November 27, 2017).
USAID (2016), “Synthesis of evaluations related to the Feed the Future learning agenda”, available at:https://agrilinks.org/sites/default/files/resource/files/Final%20KDAD%20Evaluation%20Sythesis.pdf (accessed November 27, 2017).
Zahariadis, N. (2014), “Ambiguity and multiple streams”, in Sabatier, P.A. and Weible, C.M. (Eds),Theories of the Policy Process, 3rd ed., Westview Press, Boulder, CO, pp. 25-58.
Appendix. Examples of semi-structured interview questionsNotes: Due to space limitations, this appendix does not list all interview questions. For example, thislist excludes questions about the spread of information and certain obstacles to adoption. Completequestion sets are available from the authors upon request. “F1” indicates the question was used in thefirst field research trip, while “F2” indicates the second trip. Questions differed somewhat acrossstakeholder groups on the second trip. Questions for CSA project administrators (generally not listedbelow) focused on: the nature of the project, the populations and problems targeted, language used indiscussing problems and solutions, and resource and capacity issues.
61
PPW for CSA
Problems
• F1: what do you think are major climate problems related to agriculture in your country, if any,either now or in the future? (Question repeated for: nutrition problems, economic problemsrelated to agriculture and social problems related to agriculture)
• F2 (government, project administrators): what are the biggest problems facing the people ofSenegal?
• F2 (producers): what are the biggest problems for you and your family personally on a dailybasis? (Question repeated for producers’ region of Senegal and country as a whole and foragriculture-related problems at all three levels)
Priorities
• F1: where does agriculture fit among government priorities? (Question repeated for CSA)
• F2 (government): what are the biggest priorities overall for the government of Senegal rightnow? (Question repeated for agricultural priorities)
• F2 (producers): what are the biggest priorities overall for the government of Senegal right now?What problems does the government see as most important to solve? (Question repeated foragricultural priorities of government)
• F2 (all groups): what are the priorities against which CSA projects are competing for attentionor resources at the national level? At the regional or local level?
• F2 (government): how do government priorities differ across the national and regional levels?
CSA as solution
• F1: what do you think about what you hear the term “climate-smart agriculture?”
• F1: what types of agricultural problems do you think CSA innovations might help to lessen, ifany? (Question repeated for economic and social problems)
• F2 (government): are you familiar with CSA projects in Senegal? If so, what do you know aboutthese projects?
• F2 (project participants): how is the CSA project helping you with the problems facing you andyour family? What problems do you think the project will help to reduce or solve?
Important actors
• F1: what organization or people are most influential in determining where agriculture fitsamong government priorities?
• F1: who do you think are crucial people or organizations in making decisions about theadoption of agricultural innovations?
• F2 (government): how influential are external donors in shaping government priorities?
Corresponding authorEric D. Raile can be contacted at: [email protected]
For instructions on how to order reprints of this article, please visit our website:www.emeraldgrouppublishing.com/licensing/reprints.htmOr contact us for further details: [email protected]
62
JADEE9,1

Farmers’ usage preferencesfor Rwanda’s Volcanoes
National ParkIldephonse Musafili
NM_Research and Training Center, Kigali, RwandaJean Chrysostome Ngabitsinze and Fidèle NiyitangaDepartment of Rural Development and Agricultural Economics,
University of Rwanda, Kigali, Rwanda, andDave Weatherspoon
Department of Agricultural, Food and Resource Economics,Michigan State University, East Lansing, Michigan, USA
AbstractPurpose – Policymakers and stakeholders lack empirical evidence on the effectiveness of communityparticipatory management for agribusiness development and environmental conservation. The purposeof this paper is to assess the management preferences, approaches and practices of farm communities inRwanda’s Volcanoes National Park (VNP).Design/methodology/approach – Primary data collected from 191 farmers were used. A choiceexperiment on current and potential park management practices and utilization levels was conducted alongwith a survey on socioeconomic, farm and institutional behavior characteristics.Findings – Results show that farmers prefer preserving VNP resources for the production of agribusinesscrops that are low input and environmental friendly and provide high income to farmers in addition tohandcraft production to enhance cultural, plant and wild animal tourism development. Farmers highly valueintegrated stakeholder participatory decision making about the parks natural resources. High-income farmersprefer to restore traditional cultural heritage park sites for recreation, and ancestral intellectual and culturalproperty rights.Research limitations/implications – The sample size limited the analysis to a conditional logit model.Originality/value – This is the first study to assess the management preferences of farm communities in theVNP area.Keywords Farm management, Rwanda, Choice experiment, Community managementPaper type Research paper
1. IntroductionRural communities worldwide depend on forest resources as their main source of livelihood.It is estimated that 600m indigenous people depend on forests, 350m among them highlydepend on forests for subsistence (World Bank, 2004). However, these communities oftenlose access when local forests are designated strict nature reserves. Demand on forestresources for products and services continue to rise as Sub-Saharan Africa’s population,urbanization and industrialization increase. Rwanda is a primary example of the enormousdemands being placed on the forests and national parks where population pressure,prevalence of poverty, traditional religious practices and cultural heritage usage and thenumber of small farms adjacent to the parks are all increasing along with the parkdegradation rates (Katerere et al., 2009; RDB, 2013). Agribusiness including agri-productsand services, sustainable agriculture, forest products and agrotourism can play a crucialrole in preserving national park resources in the face of competing demands.
Traditionally, long before the prehistoric period, community user groups managed forestsin Eastern Africa (Sackey, 2007). Up to the colonial period (1900–1960), forest administrationconcentrated on the conservation of wildlife and plant biodiversity, protection of water
Journal of Agribusiness inDeveloping and Emerging
EconomiesVol. 9 No. 1, 2019
pp. 63-77© Emerald Publishing Limited
2044-0839DOI 10.1108/JADEE-01-2018-0004
Received 12 January 2018Revised 9 April 2018
Accepted 30 April 2018
The current issue and full text archive of this journal is available on Emerald Insight at:www.emeraldinsight.com/2044-0839.htm
63
Rwanda’sVolcanoes
National Park
Quarto trim size: 174mm x 240mm
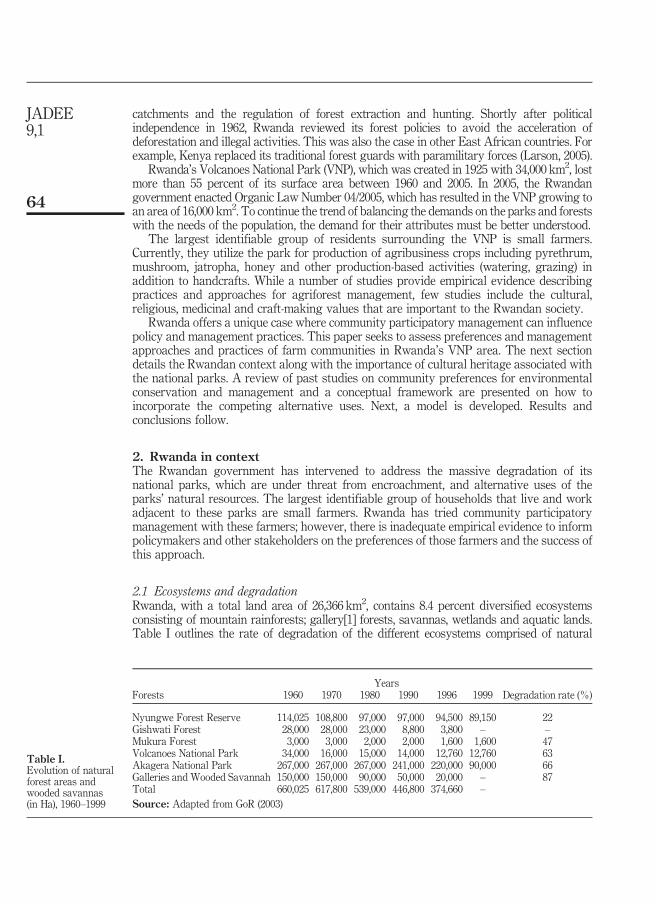
catchments and the regulation of forest extraction and hunting. Shortly after politicalindependence in 1962, Rwanda reviewed its forest policies to avoid the acceleration ofdeforestation and illegal activities. This was also the case in other East African countries. Forexample, Kenya replaced its traditional forest guards with paramilitary forces (Larson, 2005).
Rwanda’s Volcanoes National Park (VNP), which was created in 1925 with 34,000 km2, lostmore than 55 percent of its surface area between 1960 and 2005. In 2005, the Rwandangovernment enacted Organic Law Number 04/2005, which has resulted in the VNP growing toan area of 16,000 km2. To continue the trend of balancing the demands on the parks and forestswith the needs of the population, the demand for their attributes must be better understood.
The largest identifiable group of residents surrounding the VNP is small farmers.Currently, they utilize the park for production of agribusiness crops including pyrethrum,mushroom, jatropha, honey and other production-based activities (watering, grazing) inaddition to handcrafts. While a number of studies provide empirical evidence describingpractices and approaches for agriforest management, few studies include the cultural,religious, medicinal and craft-making values that are important to the Rwandan society.
Rwanda offers a unique case where community participatory management can influencepolicy and management practices. This paper seeks to assess preferences and managementapproaches and practices of farm communities in Rwanda’s VNP area. The next sectiondetails the Rwandan context along with the importance of cultural heritage associated withthe national parks. A review of past studies on community preferences for environmentalconservation and management and a conceptual framework are presented on how toincorporate the competing alternative uses. Next, a model is developed. Results andconclusions follow.
2. Rwanda in contextThe Rwandan government has intervened to address the massive degradation of itsnational parks, which are under threat from encroachment, and alternative uses of theparks’ natural resources. The largest identifiable group of households that live and workadjacent to these parks are small farmers. Rwanda has tried community participatorymanagement with these farmers; however, there is inadequate empirical evidence to informpolicymakers and other stakeholders on the preferences of those farmers and the success ofthis approach.
2.1 Ecosystems and degradationRwanda, with a total land area of 26,366 km2, contains 8.4 percent diversified ecosystemsconsisting of mountain rainforests; gallery[1] forests, savannas, wetlands and aquatic lands.Table I outlines the rate of degradation of the different ecosystems comprised of natural
YearsForests 1960 1970 1980 1990 1996 1999 Degradation rate (%)
Nyungwe Forest Reserve 114,025 108,800 97,000 97,000 94,500 89,150 22Gishwati Forest 28,000 28,000 23,000 8,800 3,800 – –Mukura Forest 3,000 3,000 2,000 2,000 1,600 1,600 47Volcanoes National Park 34,000 16,000 15,000 14,000 12,760 12,760 63Akagera National Park 267,000 267,000 267,000 241,000 220,000 90,000 66Galleries and Wooded Savannah 150,000 150,000 90,000 50,000 20,000 – 87Total 660,025 617,800 539,000 446,800 374,660 –
Source: Adapted from GoR (2003)
Table I.Evolution of naturalforest areas andwooded savannas(in Ha), 1960–1999
64
JADEE9,1
forests and wooded savannas in Rwanda. The impact of this degradation on rural livelihood,global environmental protection and cultural heritage is not fully understood (GoR, 2003).
Galleries and Wooded Savannas, Akagera National Park and the VNP receive thehighest level of protection, but have the highest degradation rates estimated at 87, 66 and 63percent, respectively. Degradation is a result of rapid population increases that creategreater pressure on the parks in terms of encroachment and deforestation. In addition, therehas been land conversion for pyrethrum production, and the resettlement of returnees fromthe civil war (GoR, 2003).
VNP is the major contributor to the national economy, with mountain gorilla-based tourismas the third source of income for the country (Gray, 2011; Martin et al., 2011; Mukanjari et al.,2013). VNP is located in the volcano forest area comprising both Virunga National Park in theDemocratic Republic of the Congo and Mgahinga Gorilla National Park in Uganda (Nkuutuet al., 2012). The park area extends to four districts[2]: Burera, Musanze, Nyabihu and Rubavu.This zone has the highest population densities in the country (500–1,041 inhabitants per km2).The adjacent communities have little opportunity for diversification into agribusiness andother off-farm activities, and have limited investments in the tourism business and cultureindustry (Plumptre et al., 2003). Policies that promote the development of agribusiness andecotourism activities in this area are crucial to help farmers diversify livelihood options andimprove sustainable growth in the area.
Fauna and flora in the VNP is comprised of a total of 86 mammals, 258 birds and 878plants species that are protected at national and international levels (Bush et al., 2010). Thepark is well known for its warm climate, which is favorable for mushroom production (wellsuited to smallholders due to its improved phytonutrient intake), beekeeping production(important to reduce the National Poverty Index estimated at 40.9 percent in the area) andJatropha for biofuel production (GoR, 2009b; Pavageau et al., 2013). VNP’s water is a keyecological resource in the region and provides irrigation for crops and livestock watering.VNP is important for the natural production of medicinal plants, and to traditional religiousheritage as well as for intellectual and cultural property rights. The medicinal plants, andtraditional and cultural products and services are central to job creation, development ofnew infrastructure and the sales of handcraft products in the region. The degradationof VNP’s ecosystems due to natural and anthropogenic activities continues to be a source ofpublic and policy debate.
VNP lost more than one-half of its surface area between 1960 and 2005. Thegovernment enacted Organic Law Number 04/2005 in 2005, which has reversed thisnegative trend. The park is rich in fauna and flora, which are protected under Rwandabiodiversity and wildlife policies (GoR, 2011) and are classified as endemic or threatenedby the International Union for the Conservation of Nature (Plumptre et al., 2003). With theestablishment of the law in 2005, people employed as guides and as gorilla group andanti-poaching teams have been deployed in the five protected sectors. In addition, theestimated 800 community members involved in day-to-day park management activitiesbenefit from temporary employment and revenue-sharing support (GoR, 2009b). Twoumbrella associations for park protection (Amizero or Hope) and community developmentactivities (Iby’Iwacu) are supported by the International Gorilla Conservation Program,CARE International, and SNV Netherland Development Organization. Since 2007,Rwandan tourism has attracted more than 16,000 tourists at estimated earnings of $42m,which has boosted the local economy by providing a source of hard currency (Bush et al.,2010). About 90 percent of the tourism revenues are driven by mountain gorilla trekking(a gorilla permit costs $1,500 per person per trek with a portion of the permit costs goingto the conservation of the mountain gorillas, GoR, 2009b). In spite of all these investments,progress in conservation has been slow and erratic, a situation partially attributed to theexclusion of local people from the decision-making process.
65
Rwanda’sVolcanoes
National Park
Farmers’ participation in the protection, conservation and recovery of biodiversityspecies of national and global importance is a key strategy to investment and tourismdevelopment. By 2020, the number of employees in the tourism sector is estimated toincrease to 23,000, which does not include restaurant, transportation and retail tradeemployment (NISR, 2012).
2.2 Cultural heritage, medicinal plants and handcrafts in the VNPA substantial portion of the United Nation’s World Heritage Sites (WHS) can be found indeveloping countries. The sites attract an increasing number of tourists and income to thosecountries (Tuan and Navrud, 2009). UNESCO has designated 135 WHS in Africa whichinclude the VNP[3]. In 2013, Africa received approximately 3 percent of the world’s tourismreceipts and 5 percent of tourist arrivals (African Tourism Monitor, 2013).
Cultural tourism is important in Rwanda because it improves cultural exchanges andraises the living standards for the local people. Through cultural tourism, cultural heritageincludes the creation of jobs and new infrastructure for the sale of handcraft products. Morerecent, gorilla trekking also became part of cultural tourism through the gorilla namingceremonies (Kwita Izina). Celebrities from around the world participate in these annualevents. The revenue from the Rwandan tourism sector increased from $175m in 2009 to$281.8m in 2012, with revenue from cultural tourism activities increasing by 18 percentduring the same period (RDB, 2013).
The government has taken the position that destroying heritage amounts to violating theconscience and mind of the nation, rendering its history and identity indistinguishable (GoR,2011). The park is at great risk of degradation if cultural heritage is not accommodated in itsconservation practices. There exists the political will and international support from theInternational Centre for Preservation of the Cultural Property and UNESCO to safeguardand promote Rwanda’s cultural heritage through promotion of cultural practices andtraditional techniques recognized as meeting the expectations of the community as anexpression of their cultural identity.
The majority of Africans depend on traditional African medicine despite revolutionaryprogress made in the field of healthcare. Rwanda cannot ignore the important roletraditional medicine plays in maintaining the health of its population since an estimated80 percent of the rural population relies on traditional medicine for their healthcare as partof their socioeconomic and sociocultural heritage (GoR, 2010). This is an untappedopportunity for the government to promote agribusiness and pharmaceuticals based on theVNP natural resource base.
Handcraft products have been identified by the Government of Rwanda’s vision 2020 asone of the key priority export sectors. Handcrafts are being positioned to positively impacteconomic development and reduce the share of agriculture’s contribution to GDP from 95percent to 50 percent (RDB, 2013). In addition, the national tourism policy recognizes thepotential of the handcraft sector in wealth creation for the rural population, especially forwomen, youth and people with disabilities (GoR, 2009a). Rwanda has already surpassed the50,000 targeted tourist goal (GoR, 2009a), with few tourists leaving the country without ahandcraft souvenir procured from roadside vendors or more formal markets such as theNational Museum or the craft villages/centers (GoR, 2009a). While the handcraft strategy,Small and Medium Enterprises policies and the five-year handcraft strategic plan (2009–2013) have assisted in achieving these goals, Rwanda’s tourism and hospitality sectorrequires further development to sustain this growth.
3. Environmental conservation and management preferencesThe formulation of forest management policies involves asking communities about theirpreferences for hypothetical transformations through management approaches and practices.
66
JADEE9,1

One approach is using choice experiment (CE) techniques to value nature conservationprograms and attributes such as cultural heritage and agricultural production activities. Theinclusion of such attributes in this study provides a more accurate estimate of the existingnature of the park and the benefit of attributes in the park.
Little is known about environmental and park management studies using CE indeveloping countries such as Rwanda. The literature includes only a few empirical CEstudies from African countries, such as the marketing research in Ethiopia by Kassie et al.(2009) and Otieno et al. (2011) in Kenya. Kassie et al. (2009) identified and estimated therelative weight assigned to the preferred traits of indigenous cows in Central Ethiopia. Theresults show that fertility, disease resistance and calf vigor traits are at least as important asmilk and that the origin of the cows matter. Otieno et al. (2011) analyzed cattle farmers’preferences for disease-free zones (DFZ). Findings show that farmers prefer to pay toparticipate in a DFZ where recordkeeping and disease monitoring are required; marketinformation is provided; sales contract opportunities are guaranteed; adequate training isprovided on pasture development; cattle are properly labeled for ease of identification; andsome monetary compensation is provided in the event that cattle die due to severe diseaseoutbreaks. Both studies suggest that CE methods can be used to value the ecologicalattributes of the VNP.
In environmental economics, valuation is a policy-oriented discipline that puts monetaryvalues on environmental goods and services, many of which have no observed marketprices. This requires the use of non-market valuation methods which is distinct fromneoclassical price theory of market goods, whereby buyers and sellers reveal theirpreferences directly through their actions, which create the price of the commodity.Adamowicz et al. (1998) classified non-market values into use and passive use values.Passive values include option use (uncertainty over future demand as per direct andindirect), existence and bequest (such as the intrinsic value) values, and other values nottypically expressed through any market. Empirical approaches to non-market valuationmethods involve comparing the economic benefits using revealed preference (RP) or statedpreference (SP) methods.
RP methods, which include travel costs and hedonic pricing, rely on the analysis ofobservable behavior and are applied primarily to use values such as direct and indirect uses.This approach is limited to analyzing only existing alternatives. SPs methods, includingcontingent valuation (CVM) and CE methods are capable of overcoming the limitation of RPmethods. While CVM has two alternatives, CE has increasingly become its extension orvariant. CE employs a series of questions to elicit responses for the estimation of preferenceover attributes of an environmental state with more than two alternatives.
In this study, particular care is taken to incorporate cultural, religious, medicinal andcraft-making values of the park that are linked to potential participatory managementapproaches. Accommodating these values inform future management decisions regardingsustainable park resources and cultural heritage conservation.
4. Conceptual framework and methodologyIn developing countries, where access to and use of natural resources are highly contestedand are vital to rural livelihoods, improving management practices and use of publicresources through cooperation is increasingly seen as a critical factor for sustainableconservation. Participatory management builds on the institutional analysis anddevelopment model by Ostrom (2005) and Poteete et al. (2010). It is based on the theoryof collective action (CA). The CA requires the involvement of a group of people sharing thesame action in pursuing shared interest. Its contextual background integrates three broadsets of attributes related to park resources, user resources and governance arrangement.The attributes of the park describe the biophysical conditions and trends. These entail
67
Rwanda’sVolcanoes
National Park
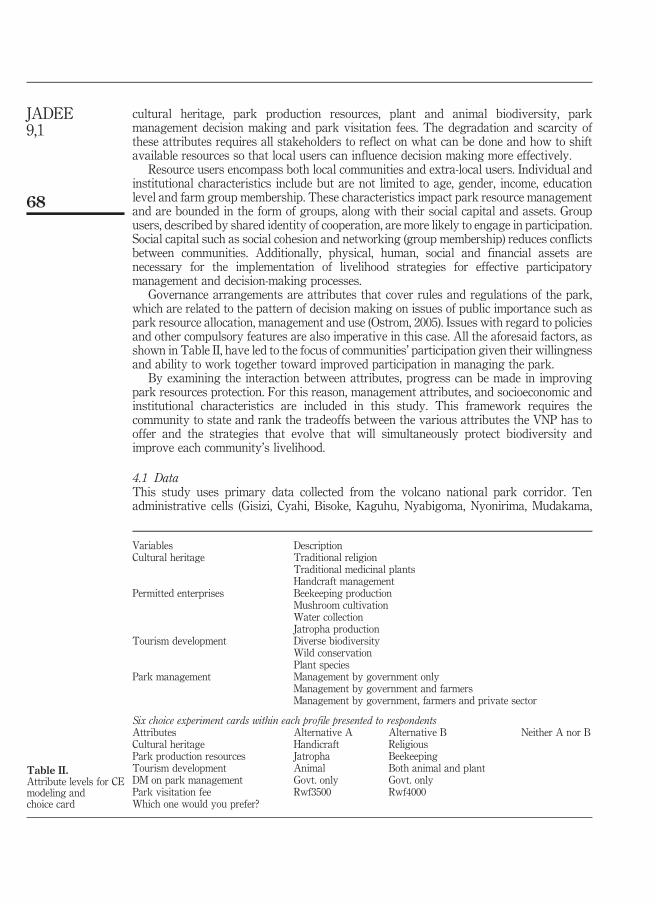
cultural heritage, park production resources, plant and animal biodiversity, parkmanagement decision making and park visitation fees. The degradation and scarcity ofthese attributes requires all stakeholders to reflect on what can be done and how to shiftavailable resources so that local users can influence decision making more effectively.
Resource users encompass both local communities and extra-local users. Individual andinstitutional characteristics include but are not limited to age, gender, income, educationlevel and farm group membership. These characteristics impact park resource managementand are bounded in the form of groups, along with their social capital and assets. Groupusers, described by shared identity of cooperation, are more likely to engage in participation.Social capital such as social cohesion and networking (group membership) reduces conflictsbetween communities. Additionally, physical, human, social and financial assets arenecessary for the implementation of livelihood strategies for effective participatorymanagement and decision-making processes.
Governance arrangements are attributes that cover rules and regulations of the park,which are related to the pattern of decision making on issues of public importance such aspark resource allocation, management and use (Ostrom, 2005). Issues with regard to policiesand other compulsory features are also imperative in this case. All the aforesaid factors, asshown in Table II, have led to the focus of communities’ participation given their willingnessand ability to work together toward improved participation in managing the park.
By examining the interaction between attributes, progress can be made in improvingpark resources protection. For this reason, management attributes, and socioeconomic andinstitutional characteristics are included in this study. This framework requires thecommunity to state and rank the tradeoffs between the various attributes the VNP has tooffer and the strategies that evolve that will simultaneously protect biodiversity andimprove each community’s livelihood.
4.1 DataThis study uses primary data collected from the volcano national park corridor. Tenadministrative cells (Gisizi, Cyahi, Bisoke, Kaguhu, Nyabigoma, Nyonirima, Mudakama,
Variables DescriptionCultural heritage Traditional religion
Traditional medicinal plantsHandcraft management
Permitted enterprises Beekeeping productionMushroom cultivationWater collectionJatropha production
Tourism development Diverse biodiversityWild conservationPlant species
Park management Management by government onlyManagement by government and farmersManagement by government, farmers and private sector
Six choice experiment cards within each profile presented to respondentsAttributes Alternative A Alternative B Neither A nor BCultural heritage Handicraft ReligiousPark production resources Jatropha BeekeepingTourism development Animal Both animal and plantDM on park management Govt. only Govt. onlyPark visitation fee Rwf3500 Rwf4000Which one would you prefer?
Table II.Attribute levels for CEmodeling andchoice card
68
JADEE9,1
Ninda, Kabeza and Kareba) from the six sectors were randomly selected. The sectors[4] arelocated in three districts adjacent to the park (Burera, Musanze and Nyabihu). Informationfor the selected districts and sectors include the number and percent of farmers, access toroads and the number of administrative cells located within them. Consultations andmeetings with local government at the sector and cell levels were held to obtain insights intothe socioeconomics of the population in those cells. The cell leaders provided a list offarmers to form a sampling frame. The list used in each administrative cell was obtainedusing the available list for the last national population and housing survey (NISR, 2012) atthe sector level. The households interviewed were then randomly selected from thepopulation in the cell by selecting every sixth household. In total, 211 farmers wereinterviewed, with a total of 191 surveys being usable for this analysis.
The data collected consist of park management attributes and levels utilizing a CE surveyin addition to socioeconomic, farm and institutional behavior and characteristics ofrespondents. The management attributes include cultural heritage, park production resources,tourism development, park management decision making and park visitation fees.
4.2 Choice experiment methodThe first step of the CE experiment was to define the good to be valued in terms ofpark management attributes and their levels. CE then involved selecting attributes andtheir levels, experimental design, formation of choice sets and measurement of preferences.Attributes were selected via focus group discussions and direct questioning. Parkmanagement attributes were classified as mandatory or optional. The mandatory attributesare the laws and policies (environment, forestry, land use, wildlife, and biodiversity)regarding environmental protection that does not vary.
The CE utilizes statistical design theory to combine the levels of the attributes intoalternative management scenarios or profiles that were presented to respondents. Factorialdesigns were used to study the effects of these attributes and their levels. A fractionalfactorial design was used to reduce the size of problems involving either small numbers ofattributes, or levels, or both by selecting a particular subset or sample of complete factorials.During the survey, an orthogonal design of 36 scenarios was administered to 72respondents for a preliminary survey. The 36 scenarios were divided into groups of six, witheach group/profile being shown to 12 respondents (see Table II). This design ensured thatthe attributes presented to respondents were varied independently from one another and theeffect of each attribute level was isolated to avoid multicollinearity between attributes.
After the 36 paired choice, scenarios were grouped into six profiles, each with sixchoice tasks, farmers were randomly assigned to one of the six choice sets. Using a CE card,each choice task was used to describe two improved park management alternatives(A and B) and a baseline alternative (C) that defined the current management of the park.An improvement of current park management status through a stakeholder (government,famers, agribusiness and NGOs) participatory approach was suggested. Respondents wereasked to choose the best management approach they preferred by clearly explaining theattributes and levels. Each farmer was then presented with a profile containing a series ofsix choice sets.
The CE survey presented respondents with a number of attributes and asked them tochoose their most preferred attribute. Positive preferences were expected from farmers whoshowed the dissatisfaction of the current management policy and demonstrated a highdesire to improve most of the park features. Data on socioeconomic and institutionalcharacteristics were collected from farmers to help characterize park managementapproaches and practices. The information from these variables are hypothesized toinfluence preferences on improving the physical characteristics (or management attributes)of the park.
69
Rwanda’sVolcanoes
National Park
Following authors Lancaster (1966), Hoffman and Duncan (1988) and Train (1998), aconditional logit model was used to operationalize the model where explanatory variablesinclude attributes of the choice alternatives as well as characteristics of the individualsmaking the choices. These attributes are related to management approaches and practicescompared to socioeconomic and institutional characteristics of the individuals making thechoices (such as the communities adjacent to the VNP). Suppose that Yi represents a discretechoice among JJ alternatives. Let Uij represent the value or utility of the jth choice to the ithindividual and where Uij are independent random variables with a systematic component V(Z j, Si) and a random component ε(Z j, Si) such that (Manski and Lerman, 1977):
Uij ¼ V Zj; Si� �þe Z j; Si
� �: (1)
We assume that communities act rationally and seek to maximize their utility. Thus,respondent i will choose alternative j if Uij is the largest of Ui1,…,UiJ. For any respondent i,a given level of utility is associated with management attributes (Z j), socioeconomic andinstitutional characteristics of respondents (Si). The choices made between alternatives as arandom component are a function of the probability that the utility associated with aparticular option j is higher than that of i. The probability of choosing a given managementoption depends on the choice between alternative A or B and the current managementscenario referred to as 0, neither A or B, can be represented in the following equation:
Pr
ik ¼ 0
ij ¼ A
ij ¼ B
8><
>:¼ Pr V Z ij; Si
� �þe Z ij; Si� �� �
4Pr V Z ik; Sið Þþe Z ij; Si� �� �
: (2)
The random term, e(Z ij, Si), cannot be observed, hence it is assumed to have a standardType I extreme value distributions, where:
Pij ¼exp V Zij; Si
� �� �
PkACexp V Zik; Sið Þð Þ: (3)
The model was specified assuming that the observable utility function follows a strictlyadditive form:
Vij ¼ bþb1Z 1þb2Z 2þ � � �bnZnþd1S1þd2S2þ � � � þdlSm; (4)
where β is the alternative-specific constant (ASC) which captured the effects on utility of anyattribute not included in the choice specific attributes.
Equation (5)[5] describes the dependent variable as the choice between the currentmanagement scenario and the improved management scenarios (A and B). The probabilityof selecting a given the park management approach was a function of management featuresand communities characteristics. The ASC was equal to 1 when either managementapproach A or B was chosen, or 0 when the current management was selected. Explanatoryvariables are VNP management or respondents’ characteristics:
Pr y ¼ 0½ �Pr y ¼ A½ �Pr y ¼ B½ �
¼ b0þbi farmer characteristics þbj park charcteristicsþmi; (5)
where β0 is the ASC, β1,…, β20 are utility parameter coefficients and Zn is a set of parkmanagement attributes from attribute j to n.
70
JADEE9,1
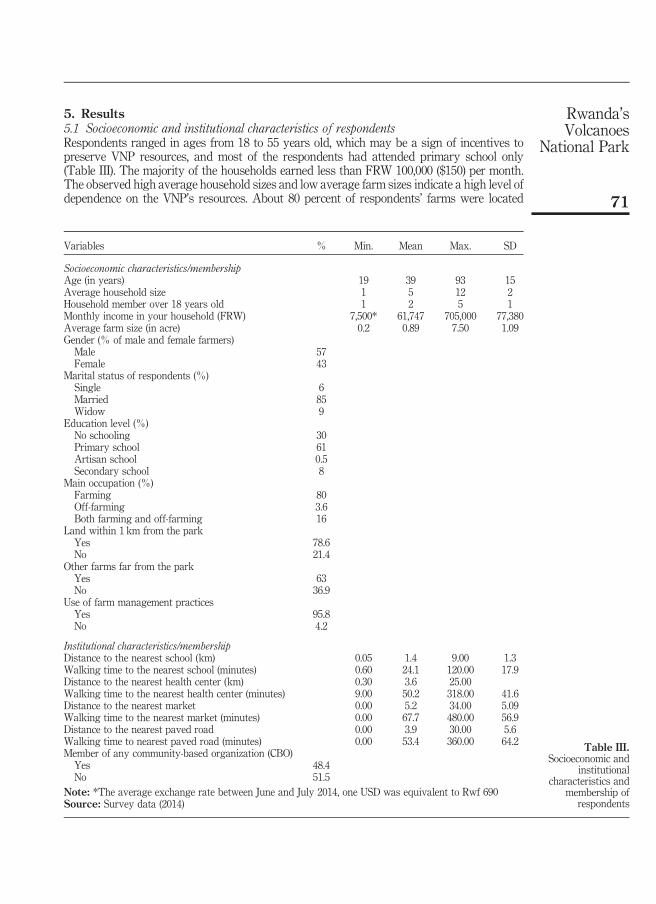
5. Results5.1 Socioeconomic and institutional characteristics of respondentsRespondents ranged in ages from 18 to 55 years old, which may be a sign of incentives topreserve VNP resources, and most of the respondents had attended primary school only(Table III). The majority of the households earned less than FRW 100,000 ($150) per month.The observed high average household sizes and low average farm sizes indicate a high level ofdependence on the VNP’s resources. About 80 percent of respondents’ farms were located
Variables % Min. Mean Max. SD
Socioeconomic characteristics/membershipAge (in years) 19 39 93 15Average household size 1 5 12 2Household member over 18 years old 1 2 5 1Monthly income in your household (FRW) 7,500* 61,747 705,000 77,380Average farm size (in acre) 0.2 0.89 7.50 1.09Gender (% of male and female farmers)Male 57Female 43
Marital status of respondents (%)Single 6Married 85Widow 9
Education level (%)No schooling 30Primary school 61Artisan school 0.5Secondary school 8
Main occupation (%)Farming 80Off-farming 3.6Both farming and off-farming 16
Land within 1 km from the parkYes 78.6No 21.4
Other farms far from the parkYes 63No 36.9
Use of farm management practicesYes 95.8No 4.2
Institutional characteristics/membershipDistance to the nearest school (km) 0.05 1.4 9.00 1.3Walking time to the nearest school (minutes) 0.60 24.1 120.00 17.9Distance to the nearest health center (km) 0.30 3.6 25.00Walking time to the nearest health center (minutes) 9.00 50.2 318.00 41.6Distance to the nearest market 0.00 5.2 34.00 5.09Walking time to the nearest market (minutes) 0.00 67.7 480.00 56.9Distance to the nearest paved road 0.00 3.9 30.00 5.6Walking time to nearest paved road (minutes) 0.00 53.4 360.00 64.2Member of any community-based organization (CBO)Yes 48.4No 51.5
Note: *The average exchange rate between June and July 2014, one USD was equivalent to Rwf 690Source: Survey data (2014)
Table III.Socioeconomic and
institutionalcharacteristics and
membership ofrespondents
71
Rwanda’sVolcanoes
National Park
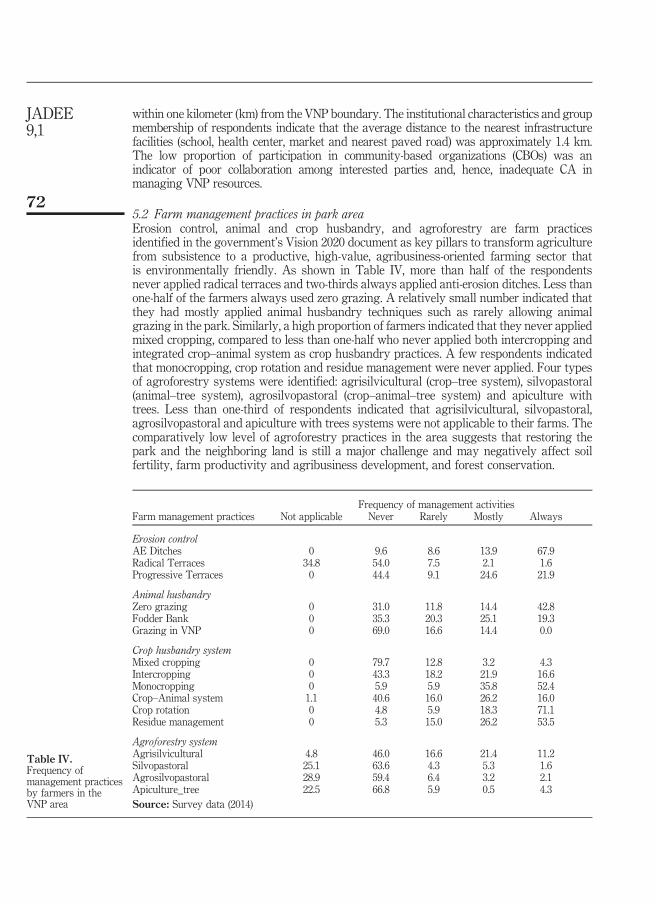
within one kilometer (km) from the VNP boundary. The institutional characteristics and groupmembership of respondents indicate that the average distance to the nearest infrastructurefacilities (school, health center, market and nearest paved road) was approximately 1.4 km.The low proportion of participation in community-based organizations (CBOs) was anindicator of poor collaboration among interested parties and, hence, inadequate CA inmanaging VNP resources.
5.2 Farm management practices in park areaErosion control, animal and crop husbandry, and agroforestry are farm practicesidentified in the government’s Vision 2020 document as key pillars to transform agriculturefrom subsistence to a productive, high-value, agribusiness-oriented farming sector thatis environmentally friendly. As shown in Table IV, more than half of the respondentsnever applied radical terraces and two-thirds always applied anti-erosion ditches. Less thanone-half of the farmers always used zero grazing. A relatively small number indicated thatthey had mostly applied animal husbandry techniques such as rarely allowing animalgrazing in the park. Similarly, a high proportion of farmers indicated that they never appliedmixed cropping, compared to less than one-half who never applied both intercropping andintegrated crop–animal system as crop husbandry practices. A few respondents indicatedthat monocropping, crop rotation and residue management were never applied. Four typesof agroforestry systems were identified: agrisilvicultural (crop–tree system), silvopastoral(animal–tree system), agrosilvopastoral (crop–animal–tree system) and apiculture withtrees. Less than one-third of respondents indicated that agrisilvicultural, silvopastoral,agrosilvopastoral and apiculture with trees systems were not applicable to their farms. Thecomparatively low level of agroforestry practices in the area suggests that restoring thepark and the neighboring land is still a major challenge and may negatively affect soilfertility, farm productivity and agribusiness development, and forest conservation.
Frequency of management activitiesFarm management practices Not applicable Never Rarely Mostly Always
Erosion controlAE Ditches 0 9.6 8.6 13.9 67.9Radical Terraces 34.8 54.0 7.5 2.1 1.6Progressive Terraces 0 44.4 9.1 24.6 21.9
Animal husbandryZero grazing 0 31.0 11.8 14.4 42.8Fodder Bank 0 35.3 20.3 25.1 19.3Grazing in VNP 0 69.0 16.6 14.4 0.0
Crop husbandry systemMixed cropping 0 79.7 12.8 3.2 4.3Intercropping 0 43.3 18.2 21.9 16.6Monocropping 0 5.9 5.9 35.8 52.4Crop–Animal system 1.1 40.6 16.0 26.2 16.0Crop rotation 0 4.8 5.9 18.3 71.1Residue management 0 5.3 15.0 26.2 53.5
Agroforestry systemAgrisilvicultural 4.8 46.0 16.6 21.4 11.2Silvopastoral 25.1 63.6 4.3 5.3 1.6Agrosilvopastoral 28.9 59.4 6.4 3.2 2.1Apiculture_tree 22.5 66.8 5.9 0.5 4.3Source: Survey data (2014)
Table IV.Frequency ofmanagement practicesby farmers in theVNP area
72
JADEE9,1

5.3 Farmers’ preferences for volcanoes park management attributesTable V shows the results of the conditional logit model for assessing farmers’ preferencesfor participating in the management and decision making for the VNP. The log likelihoodvalue of 829 suggests a strong significance of the model, which implies that utilityparameters for attribute levels were statistically different from one another. The PseudoR2 of 0.34 indicates overall good model fitness.
The CL results show that farmers had positive and significant preferences for handcraftinputs over both traditional religious heritage and medicinal plants. Handcrafts contributeto promoting cultural tourism, increasing rural incomes and strengthening collaborationsamong rural communities and other stakeholders. It is also a coping strategy by farmers tomitigate risk and vulnerability from climate stress. Farmers preferred to protectagribusiness crops as production resources in the VNP which include Jatropha, beekeepingand mushroom. Jatropha helps combat the greenhouse effect, stop soil erosion, createadditional income for the rural poor and provide a major source of energy (Wahl et al., 2009).The strong link between forests and traditional beekeeping create opportunities forpromoting beekeeping as an incentive for sustainable forest management. Preferences formushroom production results in increasing and diversifying business and employmentopportunities, and provide income opportunities for disadvantaged groups, including smallfamily farms in rural areas. Its cultivation offers benefits to vegetables and fruits that aregrown for sale when it is integrated into the existing production systems.
Management variablesa Coefficients SE t-ratios
Traditional religion heritage 0.19 0.54 0.35Handcraft materials 0.32* 0.21 1.50Jatropha production 1.53*** 0.47 3.25Handcraft management 1.50*** 0.47 3.20Mushroom collection 1.37*** 0.42 3.22Diverse biodiversity 1.45*** 0.19 7.61Plant species −0.08 0.19 −0.40Management by government only 1.52*** 0.16 9.79Management by government and farmers 1.68*** 0.47 3.58Income × Traditional religion heritage 0.36*** 0.13 2.79Income × Water collection 0.74*** 0.15 4.82Age × Traditional religion heritage −0.45*** 0.17 −2.57Gender × Traditional religion heritage 0.07 0.08 0.96Education × Traditional religion heritage 0.12 0.12 1.06Education × Water collection 0.11 0.13 0.79Education × Management by government/farmers/private sector 0.22* 0.13 1.75CBOME × Water collection 0.37** 0.18 2.03CBO × Management by government/farmers/private sector 0.31* 0.19 1.60Log likelihood −834.025Pseudo R2 0.34Number of respondents 192
Notes: aTMEPL, traditional medicinal plants; HAMA, handcraft materials; MUCO, mushroomcollection; DIBIO, diverse biodiversity; WACO, water collection; JAPRO, Jatropha production; WICO, wildlifeconservation; PLASPE, plant species; COGO, conservation by government; COGOF, conservation bygovernment and farmers; COGOFP, conservation by government, farmers and private sector; AGE, age of therespondents; EDUC, education level of the respondent; GE, gender of the respondent; INCOME, monthlyincome levels; FAMP, farm management practices; CBOME, membership in community-based organizations;INFRA, infrastructure development. *,**,***Significant at 0.1, 0.05 and 0.01 levels, respectivelySource: Authors
Table V.Conditional logit
results for farmers’preferences for
VNP managementattributes
73
Rwanda’sVolcanoes
National Park
Interactions between income and traditional religious heritage as well as between incomeand water resources were positive and significant. High-income farmers prefer to restoreand preserve the traditional cultural heritage for personal and public enjoyment andrecreational purposes, and as a source of intellectual and cultural property rights in theirformer ancestral territories. Farmers with high incomes prefer to have safe and clean waterrather than extract water resources from the park. The interaction term between gender andreligious heritage was negative. Compared to the men, women had limited awareness ofnatural resource preservation and often lacked detailed knowledge of their localenvironment, which meant that they often engaged in harmful environmental practices.Rwanda’s women lack control over key resources or gender-based divisions of laborexacerbate this issue (Bush et al., 2010).
Interactions between education and decision making by all the stakeholders on parkmanagement are positive. Highly educated farmers have high levels of environmentalconsciousness, and therefore have high participation levels in decision making. Similarly,user groups such as farmer groups and other cooperatives recognize the great need toconserve and improve the forest. Thus, membership in a farmer organization is positivelycorrelated with preserving VNP for water resources through CA.
6. ConclusionsThis study assessed the management approaches and practices of farm communities inRwanda’s National Volcano Park. Rwanda is dominated by traditional subsistence farming.Due to high population densities, farming land per household is decreasing and most of thesoils have been exhausted. As a result, cultivation has moved into marginal areas, particularlyin steep slopes, leading to widespread landslides, soil erosion and high salinity levels.These negative impacts within the natural resources domain are putting severe pressure onwhat the government perceives as the life-support systems of the country. The national park’sflora, fauna and animals provide more than an ecosystem; they also provide products andservices that farmers need to increase their income. Understanding the preferences andmanagement practices of farmers and agribusinesses who use the resources of the VNP is thefirst step to creating policies, programs and incentives to address income needs and thedegradation of the park. In this study, particular care is taken to incorporate cultural, religious,medicinal and craft-making values of the park that are linked to potential participatorymanagement approaches. Accommodating these values informs future management decisionsregarding sustainable park resources and cultural heritage conservation.
The development of sustainable forest management and agribusiness managementpractices are important to the conservation of VNP resources. Agribusinesses provide manyproducts for the VNP region including food, fiber and animal feed. The study finds thatfarmers prefer to preserve the park for handcraft production to enhance and preservecultural tourism and knowledge. Farmers also prefer to protect both plants and animalbiodiversity for tourism development. Household and institutional characteristics thatinfluence preferences suggest that high-income farmers prefer to improve current parkmanagement for religious heritage and water resources. This may increase the quality of lifesuch as recreational activities and improved water quality in the area. The study findingsalso indicate that educated people and CBO members prefer to improve the currentmanagement of the VNP through an integrated decision-making process. Therefore,membership in a CBO or social group improves farmers’ participation in CA for parkresource management.
6.1 PoliciesThis paper adds to the policy discussion on how to improve the management of naturalresources in Rwanda while growing the agribusiness sector. The study directly contributes
74
JADEE9,1
to the government’s Vision 2020 forestry strategic plan to improve forest and park practicessuch that land restoration occurs. Farmers’ preferences to protect park production resources(jatropha and mushroom) provide the government options to promote agricultural programsand agribusinesses that are environmentally friendly, low input and scalable, whilesimultaneously improving income, food production and consumption, nutrition, and health.
The key finding that farmers highly value participation in integrated stakeholderdecision making to enhance self-responsibility in planning, management and use of thesenatural resources allows policymakers to partner with local farmers. Organic Law Number04/2005 can be enhanced by using an integrated participatory decision-making approach.This is important because illegal activities (poaching, overuse of water resources) continueto be a major source of park degradation. The integrated approach would help improveproduction, processing and marketing of agribusiness products (mushroom and beekeepingproduction). This approach will reduce the government’s high exclusion cost related toinformation, monitoring and enforcement. Farmers’ preferences to preserve VNP encouragepolicymakers to incorporate them into buffer-zone production activities of cooperatives toensure sustainable use and management of the park. To formalize the current government-sponsored, revenue-sharing program (5 percent of park tourism dollars are reallocated tosupport community projects to compensate farmers for not abusing the VNP, that is,opportunity cost of park usage), participating farmers could share in the revenues fromtourism while being held accountable for negative outcomes (e.g. forest fires, killing wildanimals and tree harvesting).
Farmers recognize there is value in the flora and fauna in the VNP; however, there arefew mechanisms that formally convert those resources into consistent revenue streams.Rwanda’s plant and animal biodiversity policy as well as the cultural heritage policies lacksprotocols that designate specific plant and animal (other than gorillas) for touristattractions. Cultural heritage, especially through its main attractions of cultural tourism, isincreasingly being seen as a resource for cultural promotion and economic growth for theregion. Emphasis beyond gorilla tourism requires further cultural heritage development toincrease conservation of the park. Preferences for preserving the traditional culturalheritage is an indication of how deeply these communities value traditions as a source ofintellectual and cultural property rights with respect to their ancestral territories.
The laws and strategies governing human-wildlife conflict compensation andemployment provision in the area are not well established. Farmers’ preferences toprotect plant and animal biodiversity should translate into protection, conservation,management and utilization by community user groups to meet current and futureresource demands. There should also be alternative investment opportunities in thepark that combine tourism, culture and agribusiness development. Moreover, thefarmers’ desire to protect biodiversity informs the Ministry of Agriculture and AnimalResources and the Ministry of Forestry and Land Management in designing environmentalprotection programs.
6.2 Study limitationsOne limitation to this study was the survey sample size which limited our analysis to aconditional logit model (Train, 1998; Christiadi and Cushing, 2007). The CL was themost appropriate method that yielded improved estimates over the multinomial logit(Haan, 2006). Further research should focus on preference heterogeneity in managementconservation of available national parks in Rwanda. Studies should be conducted on thecost-benefit analysis of human-wildlife conflict compensation because farmers showeddesire to collaborate with other stakeholders to protect both plants and animals. Finally,studies on cultural heritage aspects of the park should be conducted since farmers haveshown preferences for them.
75
Rwanda’sVolcanoes
National Park

Notes
1. Galleries are forests that form corridors along rivers or wetlands and project into landscapes arelocated in Eastern Rwanda; these galleries comprise four forest blocks: Muvumba, Ibanda-Makera,Rugomero and Rwakivunji.
2. A district is an administrative unit with a population estimated at between 350,000 and 400,000rural inhabitants.
3. Rwanda participates in UNESCO’s Man and the Biosphere Programme, and has one biospherereserve, the Volcanoes National Park (UNEP, GA and MOP2, 2011).
4. A sector is an administration unit with a population estimated to be between 25,000 and 35,000 in arural area.
5. See Table III for specific variables.
References
Adamowicz, W., Boxall, P., Williams, M. and Louviere, J. (1998), “Stated preference approaches formeasuring passive use values: choice experiments and contingent valuation”, American Journalof Agricultural Economics, Vol. 80 No. 1, pp. 64-75.
African Tourism Monitor (2013), “African Development Bank Group”, Vol. 1 No. 1, available at:www.afdb.org/fileadmin/uploads/afdb/Documents/Publications/September_2013_-_Africa_Tourism_Monitor.pdf (accessed November 15, 2018).
Bush, G.K., Ikirezi, M., Daconto, G., Gray, M. and Fawcett, K. (2010), Assessing Impacts fromCommunity Conservation Interventions around Parc National des Volcans, Dian Fossey GorillaFund International, Ruhergeri.
Christiadi, A. and Cushing, B. (2007), “Conditional logit, IIA, and alternatives for estimating models ofinterstate migration”, Working Paper No. 2007–4, West Virginia University, Morgantown, WV.
GoR (2003), Constitution, Government of Rwanda, Kigali.
GoR (2009a), “Handcraft Strategic Plan Five Years (2009-2013)”, Government of Rwanda, Kigali.
GoR (2009b), “Rwanda Tourism Policy”, Government of Rwanda, Kigali.
GoR (2010), “Rwanda Demographic and Health Survey 2010”, Government of Rwanda, Kigali.
GoR (2011), “Ministry of Culture and Sports (MINISPOC)”, Policy on Cultural Heritage, Kigali.
Gray, M. (2011), “20 years of IGCP: lessons learned in mountain gorilla conservation”, WorldDevelopment, Vol. 28 No. 11, pp. 1979-2003.
Haan, P. (2006), “Much ado about nothing: conditional logit vs. random coefficient models forestimating labour supply elasticities”, Applied Economics Letters, Vol. 13 No. 4, pp. 251-256.
Hoffman, S.D. and Duncan, G.J. (1988), “Multinomial and conditional logit discrete-choice models indemography”, Demography, Vol. 25 No. 3, pp. 415-427.
Kassie, G.T., Abdulai, A. and Wollny, C. (2009), Valuing Traits of Indigenous Cows in Central Ethiopia,FAO, Rome.
Katerere, Y., Minang, P.A. and Vanhanen, H. (Eds) (2009), Making Sub Saharan African Forests Workfor People and Nature: Policy Approaches in a Changing Global Environment, ISBN 978-92-9059-256-3, Digital Process Works, Nairobi.
Lancaster, K.J. (1966), “A new approach to consumer theory”, Journal of Political Economy, Vol. 74No. 2, pp. 132-157.
Larson, A.M. (2005), “Democratic decentralization in the forestry sector: lessons learned from Africa,Asia, and Latin America”, in Pierce-Colfer, C.J. and Capisrano, D. (Eds), The Politics ofDecentralization: Forests, Power, and People, Earthscan/James and James, London, pp. 32-62.
Manski, C.F. and Lerman, S.R. (1977), “The estimation of choice probabilities for choice-based samples”,Econometrica, Vol. 45 No. 8, pp. 1977-1988.
76
JADEE9,1

Martin, A., Rutagarama, E., Gray, M., Asuma, S., Bana, M., Basabose, A. and Mwine, M. (2011),“Linking development interventions to conservation: perspectives from partners in theInternational Gorilla Conservation Programme”, Society and Natural Resources, Vol. 24 No. 6,pp. 626-636.
Mukanjari, S., Bednar‐Friedl, B., Muchapondwa, E. and Zikhali, P. (2013), “Evaluating the prospects ofbenefit sharing schemes in protecting mountain gorillas in Central Africa. Natural resourcemodeling”, International Journal of Biodiversity and Conservation, Vol. 26 No. 4, pp. 455-479.
NISR (2012), Statistical Year Book 2012, National Institute of Statistics of Rwanda, Kigali.Nkuutu, O.D., Kujirakwinja, D., Liengola, I., Plumptre, A., Nsanzurwimo, A., Fawcett, K., Gray, M. and
McNeilage, A. (2012), “The biodiversity of the Virunga volcanoes”, Wildlife ConservationSociety, available at: https://programs.wcs.org/portals/49/media/file/volcanoes_biodiv_survey.pdf (accessed October 24, 2018).
Ostrom, E. (2005), Understanding Institutional Diversity, Princeton University Press, Princeton, NJ.Otieno, D.J., Ruto, E. and Hubbard, L. (2011), “Cattle farmers’ preferences for disease-free zones in
Kenya: an application of the choice experiment method”, Journal of Agricultural Economics,Vol. 62 No. 1, pp. 207-224.
Pavageau, C., Butterfield, R. and Tiani, A.M. (2013), Current Vulnerability in the Virunga Landscape,Rwanda, Center for International Forestry Research, Bogor.
Plumptre, A.J., Behangana, M., Davenport, T., Kahindo, C., Kityo, R., Ndomba, E., Nkuutu, D., Owiunji, I.,Ssegawa, P. and Eilu, G. (2003), “The biodiversity of the Albertine rift”, Albertine Rift TechnicalReport No. 3, Wildlife Conservation Society, New York, NY.
Poteete, A.R., Janssen, M.A. and Ostrom, E. (2010),Working Together: Collective Action, the Commons,and Multiple Methods in Practice, Princeton University Press, Princeton, NJ.
RDB (2013), “Annual report: 2012 year and achievements”, Rwanda Development Board, Kigali.Sackey, A. (2007), “Assessment of forest management practices in Ghana – a case study of some forest
districts in Ghana”, IMRE Journal, Vol. 1 No. 2, pp. 1-18.Train, K. (1998), “Recreation demand models with taste variation”, Land Economics, Vol. 74 No. 5,
pp. 230-239.Tuan, T.H. and Navrud, S. (2009), “Applying the dissonance-minimising format to value cultural
heritage in developing countries”, Australian Journal of Agricultural and Resource Economics,Vol. 53 No. 3, pp. 327-343.
UNEP, GA and MOP2 (2011), “Agreement on the conservation of gorillas and their habitats. Secondmeeting of the parties”, Bergen, November 26-27.
Wahl, N., Jamnadass, R., Baur, H., Munster, C. and Iiyama, M. (2009), Economic Viability of JatrophaCurcas L Plantations in Northern Tanzania, World Agroforestry Centre, Dar es Salama.
World Bank (2004), Sustaining Forests: A Development Strategy, World Bank, Washington, DC.
Corresponding authorDave Weatherspoon can be contacted at: [email protected]
For instructions on how to order reprints of this article, please visit our website:www.emeraldgrouppublishing.com/licensing/reprints.htmOr contact us for further details: [email protected]
77
Rwanda’sVolcanoes
National Park
Distribution of agriculturalproductivity gains in selected
Feed the Future African countriesCharles B. Moss and Andrew SchmitzDepartment of Food and Resource Economics,University of Florida, Gainesville, Florida, USA
AbstractPurpose – The purpose of this paper is to examine investments in selected Feed the Future countries in Africa.Design/methodology/approach – The authors examine three investments in Feed the Future countries(e.g. Rwanda and Uganda) in the context of non-traded goods, exports and imports. These investmentsinclude research and development in Ugandan cassava production, a value chain intervention in the coffeemarket channel in Rwanda and a program to increase the use of fertilizer for maize production in Rwanda.The authors also stress the importance of distributional impacts in terms of policymaking.Findings – The results show that while there can be net gains from each investment discussed, thedistributional effects of each are very different.Originality/value – The findings will be useful for the development community and agribusiness policymaking.Keywords Coffee, Maize, Cassava, Benefit-cost analysis, Distributional effects, Input subsidiesPaper type Research paper
1. IntroductionPresident Barrack Obama pledged at least $3.5bn over three years in response to the globalhunger crisis in 2009 at the G8 conference in L’Aquila, Italy. This pledge led to the USGovernment’s Feed the Future initiative which was implemented with the US Agency forInternational Development (USAID) as the lead agency (Bahn and Lane, 2012). Feed theFutures’ goal is to “sustainably reduce global poverty and hunger.” Feed the Futurecountries are Ethiopia, Ghana, Kenya, Liberia, Malawi, Mali, Mozambique, Rwanda,Senegal, Tanzania, Uganda and Zambia in Africa; Bangladesh, Cambodia, Nepal andTajikistan in Asia; and Guatemala, Haiti and Honduras in the Americas. Feed the Futureefforts have focused on staple food value chains and the disruptions that occur, but there isan ongoing dialog over whether the focus should include smallholder cash crops as a criticalintervention for reducing poverty. For example, the USAID invests in marketing channelssuch as the Sustainable Partnerships to Enhance Rural Enterprises and AgribusinessDevelopment (SPREAD) in Rwanda. In turn, SPREAD then invests in the marketingchannel for coffee and pyrethrum (a natural pesticide).
Typically, these interventions or investments are to be evaluated using cost-benefitanalysis (CBA). The UNIDO Guidelines for Project Evaluation (Dasgupta et al., 1972)provides a basic framework for its application in a development context. USAID (2017)renewed its focus on CBA to analyze proposed investments in developing countries dueto both a general decline in the rate of official development assistance (ODA) donor fundingin addition to the commitment to end extreme poverty under the Feed the Future initiative(USAID, 2017). According to Mason (2012), between 1990 and 2012, total ODA to lower-income and middle-income countries grew at an annual rate of only about 4 percent,while foreign direct investment (FDI) concurrently increased annually by about 16.5 percent.By 2012, FDI flows to the developing world were nearly five times larger than all ODAflows combined.
Journal of Agribusiness inDeveloping and EmergingEconomiesVol. 9 No. 1, 2019pp. 78-90© Emerald Publishing Limited2044-0839DOI 10.1108/JADEE-01-2018-0009
Received 17 January 2018Revised 23 July 2018Accepted 9 August 2018
The current issue and full text archive of this journal is available on Emerald Insight at:www.emeraldinsight.com/2044-0839.htm
JEL Classification — D61, O22, D63, O13
78
JADEE9,1
Quarto trim size: 174mm x 240mm
Despite the emphasis on CBA analysis for projects in the Feed the Future Africancountries, little work has been done on assessing the payoff from various forms ofgovernment assistance from a theoretical perspective and how the expected results hinge ona theoretical basis. The purpose of this study is to demonstrate that the impact of varioustypes of investments hinges critically on the nature of the market studied. For example, formany African countries, it is inappropriate to assume that the interventions in value chainshave a terms of trade effect. Yet, these large-country assumption models are generallyassumed in the theoretical base for CBA. Also, this study examines the effect of differentmarket assumptions on the size and distribution of costs and benefits applied todevelopment programs in selected Feed the Future African countries. Ravallion (2016)recognized that the market system yields a high level of poverty (or inequality), which couldbe due to distributional inequalities in original factors of production. However, one of thegoals of many development interventions is to reduce the level of income inequality.We examine four case studies of development interventions in Africa, focusing primarily onthe large- vs small-country assumptions and the effect these assumptions will have on costsand benefits to these interventions. We show for many countries the assumptions that areappropriate yield far less gains from interventions than found in the literature based onlarge-country assumptions.
This study focuses on four different potential interventions in USAID Feed the Futurecountries. First, we quantify the expansion of the supply of cassava in Uganda based on a closedeconomy model. We analyze the investment in improved cultivars, which increased the overallproduction of cassava, yielding increased consumer and producer surplus. Under this scenario,both consumers and producers share the benefits of expanding the production of cassava.
Second, we expand this model by considering the implications of increasing the supply ofcassava given that some of the product is used to produce ethanol. In this case, extendingthe market to include ethanol production raises the concern that some of the consumer gainswould be eliminated.
Third, we consider the investment in marketing channels in Rwanda that allows farmersto sell higher quality coffee, considering both the small-country and large-country cases. Inthe small-country case, prices are unaffected by this investment. In general, moving coffeefrom low-quality markets to high-quality markets benefits producers who previously wereunable to sell high-quality coffee, while larger producers who were already able to sellhigh-quality coffee are hurt by the investment. In addition, most of the gains to consumersmay accrue outside the country of interest. Specifically, in the case of Rwanda, the consumergains may accrue in the USA and the European Union.
Fourth, we focus on maize production in Rwanda and the effect of fertilizer subsidies.Here the small-country assumption is critical as the world price of maize is unaffected bymaize production in Rwanda. In this case, we examine efforts to reduce the price of fertilizerthrough subsidies or investments in the fertilizer marketing channel. We show that there aresignificant gains to producers from fertilizer subsidies, recognizing that the cost of fertilizersubsidies may exceed these gains. However, consumers do not benefit because of the fixedworld market price for maize.
From these models, one can draw conclusions on the effect of development investmentsby country and commodity type. For example, the impact on food security of newdevelopments in cassava is likely much greater than improving coffee marketing channelsor subsidizing fertilizer for maize production.
From a policy perspective, if the objective is to lower food prices and increase foodconsumption, one strategy for investment in development projects might be to emphasizecommodities whose production affects prices. If investments are targeted at improvingonly farmers’ income, the focus might be on those commodities whose production does notaffect prices.
79
Feed theFuture
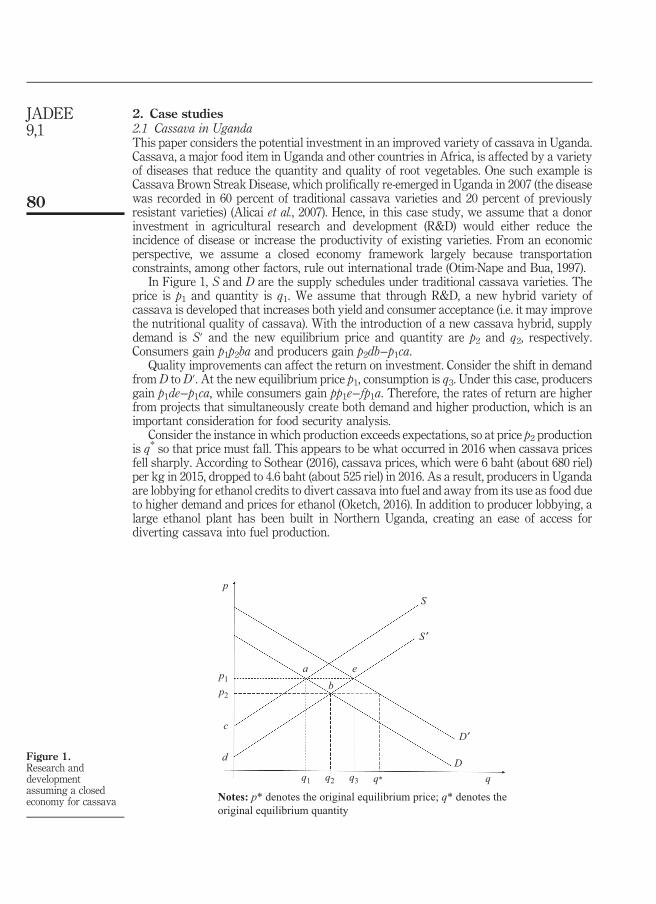
2. Case studies2.1 Cassava in UgandaThis paper considers the potential investment in an improved variety of cassava in Uganda.Cassava, a major food item in Uganda and other countries in Africa, is affected by a varietyof diseases that reduce the quantity and quality of root vegetables. One such example isCassava Brown Streak Disease, which prolifically re-emerged in Uganda in 2007 (the diseasewas recorded in 60 percent of traditional cassava varieties and 20 percent of previouslyresistant varieties) (Alicai et al., 2007). Hence, in this case study, we assume that a donorinvestment in agricultural research and development (R&D) would either reduce theincidence of disease or increase the productivity of existing varieties. From an economicperspective, we assume a closed economy framework largely because transportationconstraints, among other factors, rule out international trade (Otim-Nape and Bua, 1997).
In Figure 1, S and D are the supply schedules under traditional cassava varieties. Theprice is p1 and quantity is q1. We assume that through R&D, a new hybrid variety ofcassava is developed that increases both yield and consumer acceptance (i.e. it may improvethe nutritional quality of cassava). With the introduction of a new cassava hybrid, supplydemand is S′ and the new equilibrium price and quantity are p2 and q2, respectively.Consumers gain p1p2ba and producers gain p2db−p1ca.
Quality improvements can affect the return on investment. Consider the shift in demandfrom D to D′. At the new equilibrium price p1, consumption is q3. Under this case, producersgain p1de−p1ca, while consumers gain pp1e−fp1a. Therefore, the rates of return are higherfrom projects that simultaneously create both demand and higher production, which is animportant consideration for food security analysis.
Consider the instance in which production exceeds expectations, so at price p2 productionis q* so that price must fall. This appears to be what occurred in 2016 when cassava pricesfell sharply. According to Sothear (2016), cassava prices, which were 6 baht (about 680 riel)per kg in 2015, dropped to 4.6 baht (about 525 riel) in 2016. As a result, producers in Ugandaare lobbying for ethanol credits to divert cassava into fuel and away from its use as food dueto higher demand and prices for ethanol (Oketch, 2016). In addition to producer lobbying, alarge ethanol plant has been built in Northern Uganda, creating an ease of access fordiverting cassava into fuel production.
p
p1
q1 q2 q3 q* q
p2
c
d
a e
S ′
S
D′
D
b
Notes: p* denotes the original equilibrium price; q* denotes theoriginal equilibrium quantity
Figure 1.Research anddevelopmentassuming a closedeconomy for cassava
80
JADEE9,1
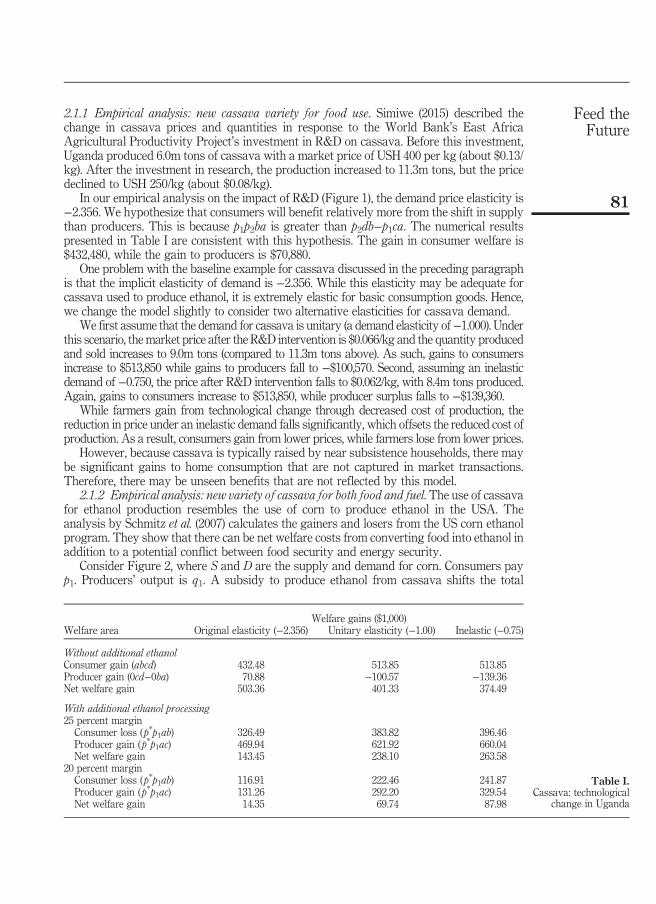
2.1.1 Empirical analysis: new cassava variety for food use. Simiwe (2015) described thechange in cassava prices and quantities in response to the World Bank’s East AfricaAgricultural Productivity Project’s investment in R&D on cassava. Before this investment,Uganda produced 6.0m tons of cassava with a market price of USH 400 per kg (about $0.13/kg). After the investment in research, the production increased to 11.3m tons, but the pricedeclined to USH 250/kg (about $0.08/kg).
In our empirical analysis on the impact of R&D (Figure 1), the demand price elasticity is−2.356. We hypothesize that consumers will benefit relatively more from the shift in supplythan producers. This is because p1p2ba is greater than p2db−p1ca. The numerical resultspresented in Table I are consistent with this hypothesis. The gain in consumer welfare is$432,480, while the gain to producers is $70,880.
One problem with the baseline example for cassava discussed in the preceding paragraphis that the implicit elasticity of demand is −2.356. While this elasticity may be adequate forcassava used to produce ethanol, it is extremely elastic for basic consumption goods. Hence,we change the model slightly to consider two alternative elasticities for cassava demand.
We first assume that the demand for cassava is unitary (a demand elasticity of−1.000). Underthis scenario, the market price after the R&D intervention is $0.066/kg and the quantity producedand sold increases to 9.0m tons (compared to 11.3m tons above). As such, gains to consumersincrease to $513,850 while gains to producers fall to −$100,570. Second, assuming an inelasticdemand of −0.750, the price after R&D intervention falls to $0.062/kg, with 8.4m tons produced.Again, gains to consumers increase to $513,850, while producer surplus falls to −$139,360.
While farmers gain from technological change through decreased cost of production, thereduction in price under an inelastic demand falls significantly, which offsets the reduced cost ofproduction. As a result, consumers gain from lower prices, while farmers lose from lower prices.
However, because cassava is typically raised by near subsistence households, there maybe significant gains to home consumption that are not captured in market transactions.Therefore, there may be unseen benefits that are not reflected by this model.
2.1.2 Empirical analysis: new variety of cassava for both food and fuel. The use of cassavafor ethanol production resembles the use of corn to produce ethanol in the USA. Theanalysis by Schmitz et al. (2007) calculates the gainers and losers from the US corn ethanolprogram. They show that there can be net welfare costs from converting food into ethanol inaddition to a potential conflict between food security and energy security.
Consider Figure 2, where S and D are the supply and demand for corn. Consumers payp1. Producers’ output is q1. A subsidy to produce ethanol from cassava shifts the total
Welfare gains ($1,000)Welfare area Original elasticity (−2.356) Unitary elasticity (−1.00) Inelastic (−0.75)
Without additional ethanolConsumer gain (abcd) 432.48 513.85 513.85Producer gain (0cd−0ba) 70.88 −100.57 −139.36Net welfare gain 503.36 401.33 374.49
With additional ethanol processing25 percent marginConsumer loss (p*p1ab) 326.49 383.82 396.46Producer gain (p*p1ac) 469.94 621.92 660.04Net welfare gain 143.45 238.10 263.58
20 percent marginConsumer loss (p*p1ab) 116.91 222.46 241.87Producer gain (p*p1ac) 131.26 292.20 329.54Net welfare gain 14.35 69.74 87.98
Table I.Cassava: technological
change in Uganda
81
Feed theFuture
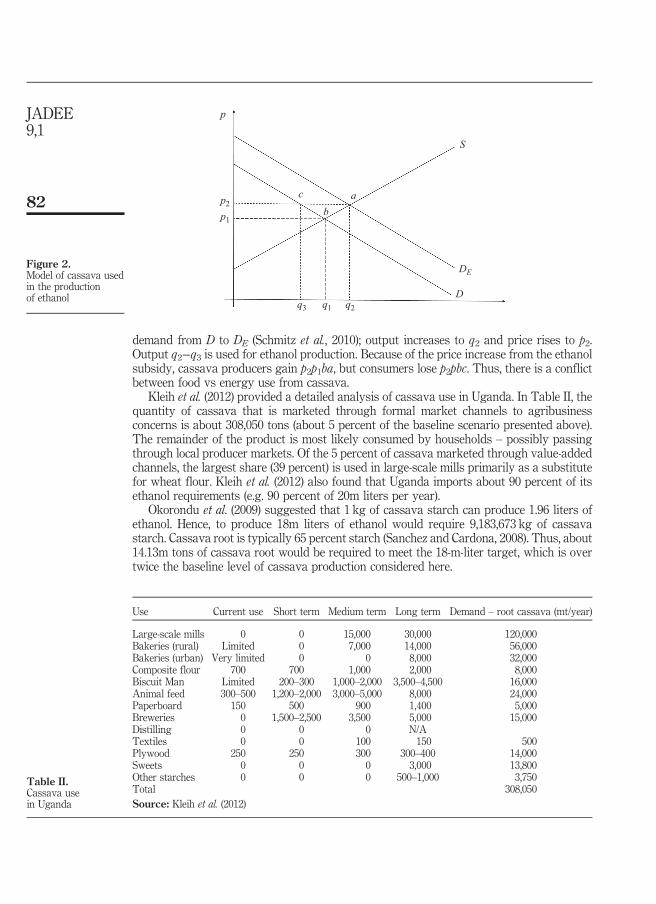
demand from D to DE (Schmitz et al., 2010); output increases to q2 and price rises to p2.Output q2−q3 is used for ethanol production. Because of the price increase from the ethanolsubsidy, cassava producers gain p2p1ba, but consumers lose p2pbc. Thus, there is a conflictbetween food vs energy use from cassava.
Kleih et al. (2012) provided a detailed analysis of cassava use in Uganda. In Table II, thequantity of cassava that is marketed through formal market channels to agribusinessconcerns is about 308,050 tons (about 5 percent of the baseline scenario presented above).The remainder of the product is most likely consumed by households – possibly passingthrough local producer markets. Of the 5 percent of cassava marketed through value-addedchannels, the largest share (39 percent) is used in large-scale mills primarily as a substitutefor wheat flour. Kleih et al. (2012) also found that Uganda imports about 90 percent of itsethanol requirements (e.g. 90 percent of 20m liters per year).
Okorondu et al. (2009) suggested that 1 kg of cassava starch can produce 1.96 liters ofethanol. Hence, to produce 18m liters of ethanol would require 9,183,673 kg of cassavastarch. Cassava root is typically 65 percent starch (Sanchez and Cardona, 2008). Thus, about14.13m tons of cassava root would be required to meet the 18-m-liter target, which is overtwice the baseline level of cassava production considered here.
p
p2
p1
c ab
DE
S
Dq3 q1 q2
Figure 2.Model of cassava usedin the productionof ethanol
Use Current use Short term Medium term Long term Demand – root cassava (mt/year)
Large-scale mills 0 0 15,000 30,000 120,000Bakeries (rural) Limited 0 7,000 14,000 56,000Bakeries (urban) Very limited 0 0 8,000 32,000Composite flour 700 700 1,000 2,000 8,000Biscuit Man Limited 200–300 1,000–2,000 3,500–4,500 16,000Animal feed 300–500 1,200–2,000 3,000–5,000 8,000 24,000Paperboard 150 500 900 1,400 5,000Breweries 0 1,500–2,500 3,500 5,000 15,000Distilling 0 0 0 N/ATextiles 0 0 100 150 500Plywood 250 250 300 300–400 14,000Sweets 0 0 0 3,000 13,800Other starches 0 0 0 500–1,000 3,750Total 308,050Source: Kleih et al. (2012)
Table II.Cassava usein Uganda
82
JADEE9,1
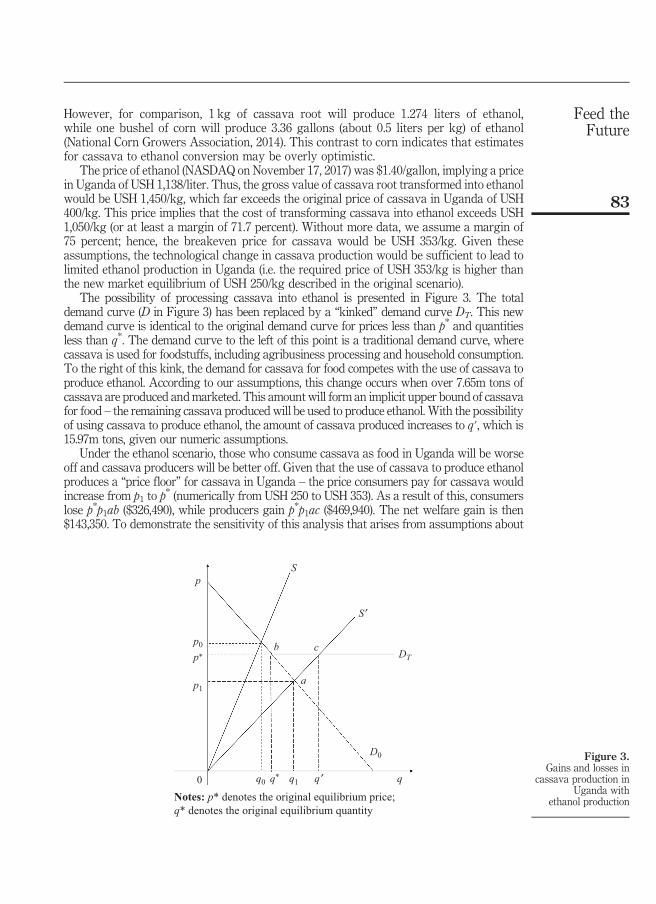
However, for comparison, 1 kg of cassava root will produce 1.274 liters of ethanol,while one bushel of corn will produce 3.36 gallons (about 0.5 liters per kg) of ethanol(National Corn Growers Association, 2014). This contrast to corn indicates that estimatesfor cassava to ethanol conversion may be overly optimistic.
The price of ethanol (NASDAQ on November 17, 2017) was $1.40/gallon, implying a pricein Uganda of USH 1,138/liter. Thus, the gross value of cassava root transformed into ethanolwould be USH 1,450/kg, which far exceeds the original price of cassava in Uganda of USH400/kg. This price implies that the cost of transforming cassava into ethanol exceeds USH1,050/kg (or at least a margin of 71.7 percent). Without more data, we assume a margin of75 percent; hence, the breakeven price for cassava would be USH 353/kg. Given theseassumptions, the technological change in cassava production would be sufficient to lead tolimited ethanol production in Uganda (i.e. the required price of USH 353/kg is higher thanthe new market equilibrium of USH 250/kg described in the original scenario).
The possibility of processing cassava into ethanol is presented in Figure 3. The totaldemand curve (D in Figure 3) has been replaced by a “kinked” demand curve DT. This newdemand curve is identical to the original demand curve for prices less than p* and quantitiesless than q*. The demand curve to the left of this point is a traditional demand curve, wherecassava is used for foodstuffs, including agribusiness processing and household consumption.To the right of this kink, the demand for cassava for food competes with the use of cassava toproduce ethanol. According to our assumptions, this change occurs when over 7.65m tons ofcassava are produced andmarketed. This amount will form an implicit upper bound of cassavafor food – the remaining cassava produced will be used to produce ethanol. With the possibilityof using cassava to produce ethanol, the amount of cassava produced increases to q′, which is15.97m tons, given our numeric assumptions.
Under the ethanol scenario, those who consume cassava as food in Uganda will be worseoff and cassava producers will be better off. Given that the use of cassava to produce ethanolproduces a “price floor” for cassava in Uganda – the price consumers pay for cassava wouldincrease from p1 to p
* (numerically from USH 250 to USH 353). As a result of this, consumerslose p*p1ab ($326,490), while producers gain p*p1ac ($469,940). The net welfare gain is then$143,350. To demonstrate the sensitivity of this analysis that arises from assumptions about
p
0 q0 q* q1 q ′ q
p0
p*
p1
b c
a
S
S ′
DT
D0
Notes: p* denotes the original equilibrium price;q* denotes the original equilibrium quantity
Figure 3.Gains and losses in
cassava production inUganda with
ethanol production
83
Feed theFuture
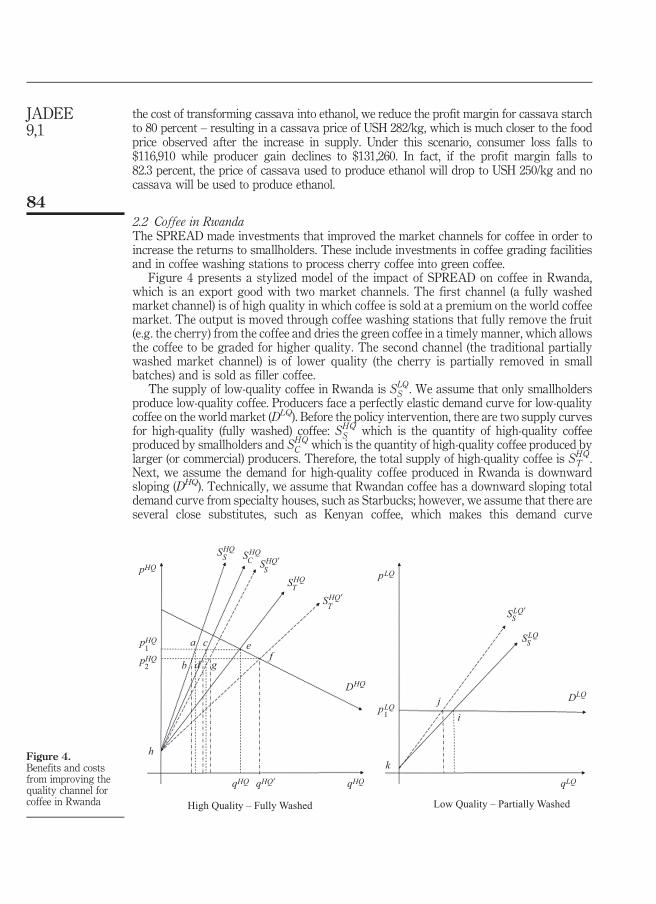
the cost of transforming cassava into ethanol, we reduce the profit margin for cassava starchto 80 percent – resulting in a cassava price of USH 282/kg, which is much closer to the foodprice observed after the increase in supply. Under this scenario, consumer loss falls to$116,910 while producer gain declines to $131,260. In fact, if the profit margin falls to82.3 percent, the price of cassava used to produce ethanol will drop to USH 250/kg and nocassava will be used to produce ethanol.
2.2 Coffee in RwandaThe SPREAD made investments that improved the market channels for coffee in order toincrease the returns to smallholders. These include investments in coffee grading facilitiesand in coffee washing stations to process cherry coffee into green coffee.
Figure 4 presents a stylized model of the impact of SPREAD on coffee in Rwanda,which is an export good with two market channels. The first channel (a fully washedmarket channel) is of high quality in which coffee is sold at a premium on the world coffeemarket. The output is moved through coffee washing stations that fully remove the fruit(e.g. the cherry) from the coffee and dries the green coffee in a timely manner, which allowsthe coffee to be graded for higher quality. The second channel (the traditional partiallywashed market channel) is of lower quality (the cherry is partially removed in smallbatches) and is sold as filler coffee.
The supply of low-quality coffee in Rwanda is SLQS . We assume that only smallholders
produce low-quality coffee. Producers face a perfectly elastic demand curve for low-qualitycoffee on the world market (DLQ). Before the policy intervention, there are two supply curvesfor high-quality (fully washed) coffee: SHQ
S which is the quantity of high-quality coffeeproduced by smallholders and SHQ
C which is the quantity of high-quality coffee produced bylarger (or commercial) producers. Therefore, the total supply of high-quality coffee is SHQ
T .Next, we assume the demand for high-quality coffee produced in Rwanda is downwardsloping (DHQ). Technically, we assume that Rwandan coffee has a downward sloping totaldemand curve from specialty houses, such as Starbucks; however, we assume that there areseveral close substitutes, such as Kenyan coffee, which makes this demand curve
pHQ pLQ
pLQ
k
SHQ SHQ
SHQ
DHQ
SHQ′
SHQ′
pHQ
pHQ
qHQ qHQ qLQqHQ′
h
S CS
T
T
1
2
a c ef
b d g
1
SLQ′S
SLQS
DLQ
High Quality – Fully Washed Low Quality – Partially Washed
ji
Figure 4.Benefits and costsfrom improving thequality channel forcoffee in Rwanda
84
JADEE9,1
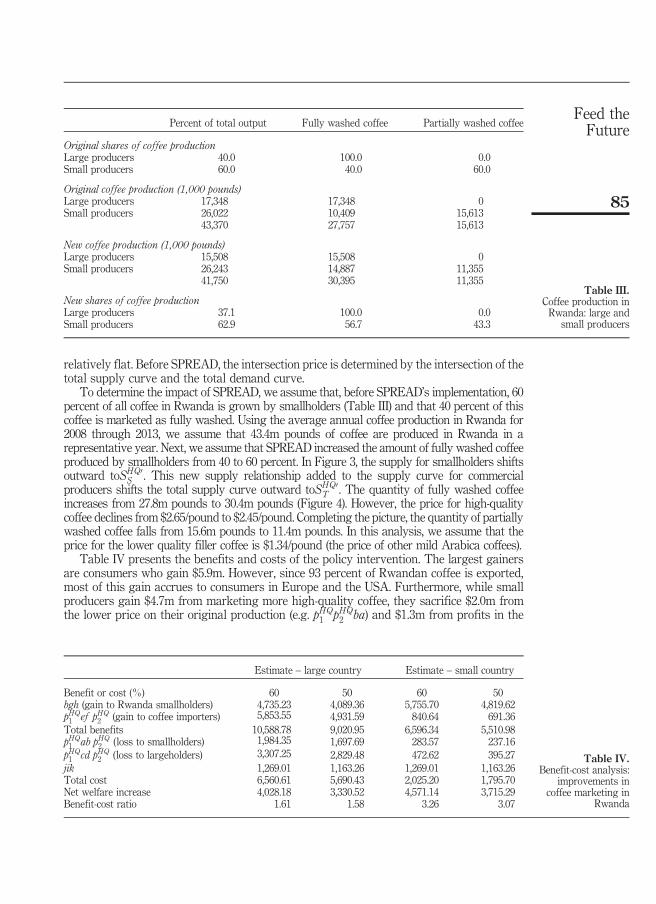
relatively flat. Before SPREAD, the intersection price is determined by the intersection of thetotal supply curve and the total demand curve.
To determine the impact of SPREAD, we assume that, before SPREAD’s implementation, 60percent of all coffee in Rwanda is grown by smallholders (Table III) and that 40 percent of thiscoffee is marketed as fully washed. Using the average annual coffee production in Rwanda for2008 through 2013, we assume that 43.4m pounds of coffee are produced in Rwanda in arepresentative year. Next, we assume that SPREAD increased the amount of fully washed coffeeproduced by smallholders from 40 to 60 percent. In Figure 3, the supply for smallholders shiftsoutward toSHQ0
S . This new supply relationship added to the supply curve for commercialproducers shifts the total supply curve outward toSHQ0
T . The quantity of fully washed coffeeincreases from 27.8m pounds to 30.4m pounds (Figure 4). However, the price for high-qualitycoffee declines from $2.65/pound to $2.45/pound. Completing the picture, the quantity of partiallywashed coffee falls from 15.6m pounds to 11.4m pounds. In this analysis, we assume that theprice for the lower quality filler coffee is $1.34/pound (the price of other mild Arabica coffees).
Table IV presents the benefits and costs of the policy intervention. The largest gainersare consumers who gain $5.9m. However, since 93 percent of Rwandan coffee is exported,most of this gain accrues to consumers in Europe and the USA. Furthermore, while smallproducers gain $4.7m from marketing more high-quality coffee, they sacrifice $2.0m fromthe lower price on their original production (e.g. pHQ
1 pHQ2 ba) and $1.3m from profits in the
Percent of total output Fully washed coffee Partially washed coffee
Original shares of coffee productionLarge producers 40.0 100.0 0.0Small producers 60.0 40.0 60.0
Original coffee production (1,000 pounds)Large producers 17,348 17,348 0Small producers 26,022 10,409 15,613
43,370 27,757 15,613
New coffee production (1,000 pounds)Large producers 15,508 15,508 0Small producers 26,243 14,887 11,355
41,750 30,395 11,355
New shares of coffee productionLarge producers 37.1 100.0 0.0Small producers 62.9 56.7 43.3
Table III.Coffee production inRwanda: large and
small producers
Estimate – large country Estimate – small country
Benefit or cost (%) 60 50 60 50bgh (gain to Rwanda smallholders) 4,735.23 4,089.36 5,755.70 4,819.62pHQ1 ef pHQ
2 (gain to coffee importers) 5,853.55 4,931.59 840.64 691.36Total benefits 10,588.78 9,020.95 6,596.34 5,510.98pHQ1 ab pHQ
2 (loss to smallholders) 1,984.35 1,697.69 283.57 237.16pHQ1 cd pHQ
2 (loss to largeholders) 3,307.25 2,829.48 472.62 395.27jik 1,269.01 1,163.26 1,269.01 1,163.26Total cost 6,560.61 5,690.43 2,025.20 1,795.70Net welfare increase 4,028.18 3,330.52 4,571.14 3,715.29Benefit-cost ratio 1.61 1.58 3.26 3.07
Table IV.Benefit-cost analysis:
improvements incoffee marketing in
Rwanda
85
Feed theFuture
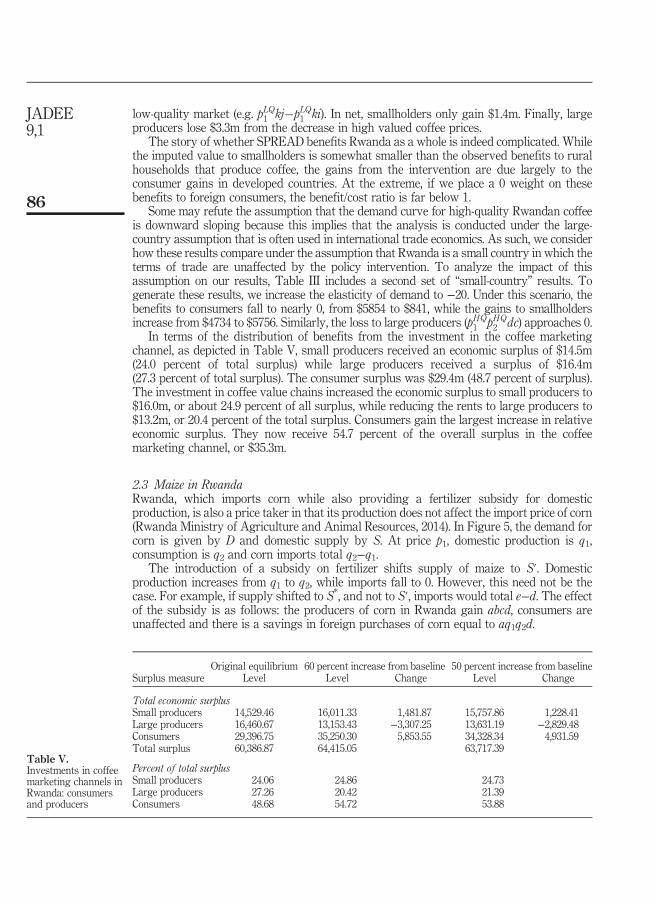
low-quality market (e.g. pLQ1 kj�pLQ1 ki). In net, smallholders only gain $1.4m. Finally, largeproducers lose $3.3m from the decrease in high valued coffee prices.
The story of whether SPREAD benefits Rwanda as a whole is indeed complicated. Whilethe imputed value to smallholders is somewhat smaller than the observed benefits to ruralhouseholds that produce coffee, the gains from the intervention are due largely to theconsumer gains in developed countries. At the extreme, if we place a 0 weight on thesebenefits to foreign consumers, the benefit/cost ratio is far below 1.
Some may refute the assumption that the demand curve for high-quality Rwandan coffeeis downward sloping because this implies that the analysis is conducted under the large-country assumption that is often used in international trade economics. As such, we considerhow these results compare under the assumption that Rwanda is a small country in which theterms of trade are unaffected by the policy intervention. To analyze the impact of thisassumption on our results, Table III includes a second set of “small-country” results. Togenerate these results, we increase the elasticity of demand to −20. Under this scenario, thebenefits to consumers fall to nearly 0, from $5854 to $841, while the gains to smallholdersincrease from $4734 to $5756. Similarly, the loss to large producers (pHQ
1 pHQ2 dc) approaches 0.
In terms of the distribution of benefits from the investment in the coffee marketingchannel, as depicted in Table V, small producers received an economic surplus of $14.5m(24.0 percent of total surplus) while large producers received a surplus of $16.4m(27.3 percent of total surplus). The consumer surplus was $29.4m (48.7 percent of surplus).The investment in coffee value chains increased the economic surplus to small producers to$16.0m, or about 24.9 percent of all surplus, while reducing the rents to large producers to$13.2m, or 20.4 percent of the total surplus. Consumers gain the largest increase in relativeeconomic surplus. They now receive 54.7 percent of the overall surplus in the coffeemarketing channel, or $35.3m.
2.3 Maize in RwandaRwanda, which imports corn while also providing a fertilizer subsidy for domesticproduction, is also a price taker in that its production does not affect the import price of corn(Rwanda Ministry of Agriculture and Animal Resources, 2014). In Figure 5, the demand forcorn is given by D and domestic supply by S. At price p1, domestic production is q1,consumption is q2 and corn imports total q2−q1.
The introduction of a subsidy on fertilizer shifts supply of maize to S′. Domesticproduction increases from q1 to q2, while imports fall to 0. However, this need not be thecase. For example, if supply shifted to S*, and not to S′, imports would total e−d. The effectof the subsidy is as follows: the producers of corn in Rwanda gain abcd, consumers areunaffected and there is a savings in foreign purchases of corn equal to aq1q2d.
Original equilibrium 60 percent increase from baseline 50 percent increase from baselineSurplus measure Level Level Change Level Change
Total economic surplusSmall producers 14,529.46 16,011.33 1,481.87 15,757.86 1,228.41Large producers 16,460.67 13,153.43 −3,307.25 13,631.19 −2,829.48Consumers 29,396.75 35,250.30 5,853.55 34,328.34 4,931.59Total surplus 60,386.87 64,415.05 63,717.39
Percent of total surplusSmall producers 24.06 24.86 24.73Large producers 27.26 20.42 21.39Consumers 48.68 54.72 53.88
Table V.Investments in coffeemarketing channels inRwanda: consumersand producers
86
JADEE9,1

From the above result, producers are the major beneficiary of fertilizer subsides, which isquite different from the usual case. Consider Figure 5, where S and D* are the supply anddemand for corn in a closed model setting. At price p1, corn production is q1. A subsidy onfertilizer shifts supply to S, causing price to decline to p3 and the quantity to falls to q3.Consumers gain p1p3fa. Producers gain p3cf−p1ba. Depending on the price elasticities ofboth demand and supply, consumers can end up with more of the gain from the importsubsidy than do producers (Schmitz et al., 2010).
Table VI presents an overview of Rwanda’s production, imports and exports of maize(Food and Agriculture Organization of the United Nations, 2017). In 2013, Rwandanproduction plus net imports amounted to 723,285 tons of maize. Of this total, productionaccounted for 92.3 percent. However, as recently as 2004, imports amounted to 26.8 percentof total maize in Rwanda. On average, between 2004 and 2013, domestic productionaccounted for 83.2 percent of maize consumed in Rwanda. Also, as shown in Table VI, themaize yield in Rwanda is quite low. The yield increased from 0.70 ton/ha in 2000 to 2.50
p
p1
p3
c
b
a eS*
D*
qq2q3q1
S
S ′
Ddf
Notes: p* denotes the original equilibrium price; q* denotes theoriginal equilibrium quantity
Figure 5.Fertilizer subsidies
YearYield(hg/ha)
Production(mt)
Area(ha)
Imports(mt)
Exports(mt)
Totalmaize (mt)
Corn price($/mt)
Urea price($/kg)
Yield(mt/ha)
2000 7,018 62,501 89,053 30,000 0 92,501 88.22 101.12 0.702001 7,671 80,979 105,560 4,002 0 84,981 89.61 95.32 0.772002 8,763 91,686 104,628 25,170 0 116,856 99.33 94.36 0.882003 7,672 78,886 102,820 16,957 1,510 94,333 105.19 138.90 0.772004 7,670 88,209 115,000 32,362 0 120,571 111.78 175.29 0.772005 8,889 97,251 109,400 16,385 5 113,631 98.41 219.02 0.892006 8,531 96,662 113,312 29,076 552 125,186 121.59 222.93 0.852007 7,201 101,659 141,168 45,207 1,465 145,401 163.26 309.40 0.722008 11,515 166,853 144,896 7,791 138 174,506 223.25 492.73 1.152009 19,503 286,946 147,129 52,957 175 339,728 165.54 249.58 1.952010 23,416 432,404 184,658 118,064 1,633 548,835 186.01 288.59 2.342011 23,529 525,679 223,414 66,559 1,691 590,547 291.78 420.96 2.352012 22,587 573,038 253,698 101,154 7,245 666,947 298.41 405.40 2.262013 22,845 667,833 292,326 62,940 7,488 723,285 258.96 340.12 2.282014 25,009 583,096 233,150 – – – 192.88 316.21 2.50
Table VI.Maize production in
Rwanda
87
Feed theFuture
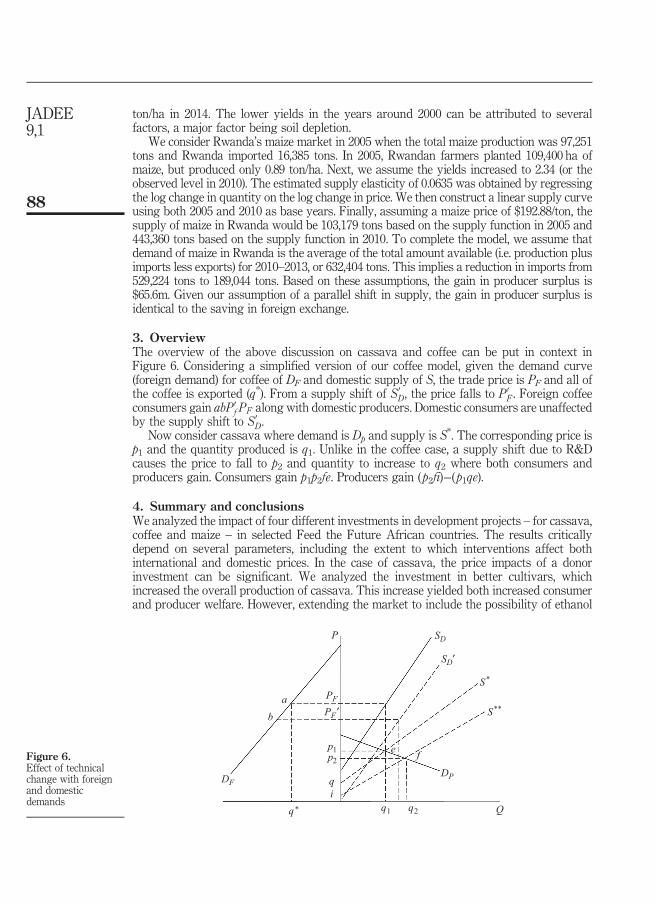
ton/ha in 2014. The lower yields in the years around 2000 can be attributed to severalfactors, a major factor being soil depletion.
We consider Rwanda’s maize market in 2005 when the total maize production was 97,251tons and Rwanda imported 16,385 tons. In 2005, Rwandan farmers planted 109,400 ha ofmaize, but produced only 0.89 ton/ha. Next, we assume the yields increased to 2.34 (or theobserved level in 2010). The estimated supply elasticity of 0.0635 was obtained by regressingthe log change in quantity on the log change in price. We then construct a linear supply curveusing both 2005 and 2010 as base years. Finally, assuming a maize price of $192.88/ton, thesupply of maize in Rwanda would be 103,179 tons based on the supply function in 2005 and443,360 tons based on the supply function in 2010. To complete the model, we assume thatdemand of maize in Rwanda is the average of the total amount available (i.e. production plusimports less exports) for 2010–2013, or 632,404 tons. This implies a reduction in imports from529,224 tons to 189,044 tons. Based on these assumptions, the gain in producer surplus is$65.6m. Given our assumption of a parallel shift in supply, the gain in producer surplus isidentical to the saving in foreign exchange.
3. OverviewThe overview of the above discussion on cassava and coffee can be put in context inFigure 6. Considering a simplified version of our coffee model, given the demand curve(foreign demand) for coffee of DF and domestic supply of S, the trade price is PF and all ofthe coffee is exported (q*). From a supply shift of S0
D , the price falls to P 0F . Foreign coffee
consumers gain abP 0f PF along with domestic producers. Domestic consumers are unaffected
by the supply shift to S0D .
Now consider cassava where demand is Dp and supply is S*. The corresponding price isp1 and the quantity produced is q1. Unlike in the coffee case, a supply shift due to R&Dcauses the price to fall to p2 and quantity to increase to q2 where both consumers andproducers gain. Consumers gain p1p2fe. Producers gain (p2fi)−(p1qe).
4. Summary and conclusionsWe analyzed the impact of four different investments in development projects – for cassava,coffee and maize – in selected Feed the Future African countries. The results criticallydepend on several parameters, including the extent to which interventions affect bothinternational and domestic prices. In the case of cassava, the price impacts of a donorinvestment can be significant. We analyzed the investment in better cultivars, whichincreased the overall production of cassava. This increase yielded both increased consumerand producer welfare. However, extending the market to include the possibility of ethanol
DF
PF
SDP
ab PF ′
p1p2
qi
DP
q1q* q2 Q
SD′
S*
S**
e fFigure 6.Effect of technicalchange with foreignand domesticdemands
88
JADEE9,1
production raised the concern that some of the consumer gains would be eliminated. Forcoffee, we examined the investment in marketing channels that allowed the farmers to sellhigher quality coffee. In this analysis, we considered both the small-country and large-country cases. In the small-country case, prices were unaffected by this investment. Thisanalysis highlights the complexity that may result from such interventions. Specifically,moving coffee from low markets to high-quality markets benefits producers who previouslywere unable to sell high-quality coffee, while larger producers who traditionally sold high-quality coffee are hurt by the investment. In addition, most of the gains to consumers mayaccrue outside the country of interest. Specifically, in the case of Rwanda, the consumergains may accrue in the USA and the European Union. Next, we examined the small-countrycase for maize where world prices are given and are unaffected by maize production inRwanda. In this case, we examined efforts to reduce the price of fertilizer either throughsubsidies or investments in the fertilizer marketing channel. In this scenario, we seesignificant gains to producers; however, we must recognize that the cost of fertilizersubsidies may exceed these gains. In addition, consumers do not benefit because of the fixedworld market price for maize. From these models, one can draw significant conclusions ofthe effect of development investments by country and commodity type. For example, thefood security impact of new development in cassava is likely much greater than improvingcoffee marketing channels or subsidizing fertilizer for maize production. Of course, there aremany other options, including the investment in human capital.
From a policy perspective, if the objective is to lower food prices and increase foodconsumption, one strategy for investment in development projects might be to emphasizecommodities, the production of which affects prices. However, if these investments aretargeted at improving producers’ income only, the focus might be on those commoditieswhere production does not affect prices.
A role of economics is to point out the optimal use of scarce resources. The efficientallocation of resources depends on how investments affect the distribution of benefits toconsumers and producers. A priori analysis of government actions such as interventions indeveloping economies yields insights into the potential payoffs from these investments.Ideally, in benefit-cost analysis, projects should be ranked before investments areundertaken. As our paper shows, the assumptions underlying the market structure providecritical information about ranking projects. Unfortunately, for many investments in Africancountries the payoff is relatively small because of the critical assumption that theseinvestments fall under “the small-country case” where these investments do not affectdomestic or international prices. Also, the distributional effect from investments and supplychains depends on the percentage of the good that is exported.
References
Alicai, T., Omongo, C.A., Maruthi, M.N., Hillocks, R.J., Bua, A., Otim-Nape, G.W. and Colvin, J. (2007),“Re-emergence of Cassava Brown Streak Disease in Uganda”, Plant Disease, Vol. 91 No. 1,pp. 24-29.
Bahn, R. and Lane, S. (2012), “Reclaiming economic analysis”, in Shah, R. and Radelet, S. (Eds), USAIDFrontiers in Development, USAID, Washington, DC, pp. 192-195.
Dasgupta, P.S., Marglin, S.A. and Sen, A.K. (1972), UNIDO Guidelines for Project Evaluation, UnitedNations, New York, NY.
Food and Agriculture Organization of the United Nations (2017), “FAOSTAT”, FAO, Rome, available at:www.fao.org/faostat/en/#data/QC (accessed November 20, 2017).
Kleih, U., Phillips, D., Jagwe, J. and Kirya, M. (2012), “Cassava market and value chain analysis: Ugandacase study”, Africa Innovations Institute, Bukoto and Kampala.
89
Feed theFuture
Mason, J. (2012), “Getting serious about investment appraisal: a call for building local capacity foreconomic analysis”, in Shah, R. and Unger, N. (Eds), USAID Frontiers in Development 2014:Ending Extreme Poverty, USAID, Washington, DC, pp. 76-80.
National Corn Growers Association (2014), “How much ethanol can come from corn?”, National CornGrowers Association, Chesterfield, MO, available at: www.cie.us/documents/HowMuchEthanol.pdf (accessed November 16, 2017).
Oketch, B. (2016), “Uganda: cassava production rises as farmers benefit from ethanol plant”, TheMonitor, May 25, available at: https://allafrica.com/stories/201605250380.html
Okorondu, S.I., Nedosa, I.V., Wesley, B. and Akujobi, C.O. (2009), “Ethanol production from cassava”,Current Topics in Biotechnology, Vol. 5, pp. 65-70, available at: www.cabdirect.org/cabdirect/abstract/20113024985
Otim-Nape, G.W. and Bua, A. (1997), “Cassava development in Uganda”, FAO, Rome.Ravallion, M. (2016), The Economics of Poverty: History, Measurement, and Policy, Oxford University
Press, Oxford.Rwanda Ministry of Agriculture and Animal Resources (2014), “National Fertilizer Policy”, Kigali,
available at: www.minagri.gov.rw/fileadmin/user_upload/documents/STRAT.PLC/FERTILIZER_POLICY_-FINAL.pdf (accessed November 16, 2017).
Sanchez, O.J. and Cardona, C.A. (2008), “Trends in biotechnological production of fuel ethanol fromdifferent feedstocks”, Bioresource Technology, Vol. 99 No. 3, pp. 5270-5295.
Schmitz, A., Moss, C.B. and Schmitz, T.G. (2007), “Ethanol: no free lunch”, Journal of Agricultural &Food Industrial Organization, Vol. 5 No. 2, available at: www.degruyter.com/downloadpdf/j/jafio.2007.5.2/jafio.2007.5.2.1186/jafio.2007.5.2.1186.pdf
Schmitz, A., Moss, C.B., Schmitz, T.G., Furtan, H.W. and Schmitz, H.C. (2010), Agricultural Policy,Agribusiness, and Rent-Seeking Behaviour, 2nd ed., University of Toronto Press, Toronto.
Simiwe, D.A. (2015), “Cassava growers in Uganda find market at ethanol plant”, The East African,March 14, available at: www.theeastafrican.co.ke/news/Cassava-growers-in-Uganda-find-market-at-ethanol-plant/2558-2653510-3knqbm/index.html
Sothear, K. (2016), “Cassava prices drop sharply amid low demand”, available at: www.cambodiadaily.com/business/cassava-prices-drop-sharply-amid-low-demand-108043/
USAID (2017), Cost-Benefit Analysis, United States Agency for International Development,Washington, DC, available at: www.usaid.gov/what-we-do/economic-growth-and-trade/promoting-sound-economic-policies-growth/working-more (accessed November 16, 2017).
Corresponding authorCharles B. Moss can be contacted at: [email protected]
For instructions on how to order reprints of this article, please visit our website:www.emeraldgrouppublishing.com/licensing/reprints.htmOr contact us for further details: [email protected]
90
JADEE9,1

insight
Backfiles CollectionsPreserving over 100 years of management research online
A lifetime investment for your institution, Emerald Backfi les will signifi cantly enhance your library’s o� ering by providing access to over 125,000 articles from more than 260 journals dating back to 1898.
Visit emeraldinsight.com
Get Backfi les Collections for your libraryRecommend Backfi les to your librarian today. Find out more: emeraldpublishing.com/backfi lescollections

insight
Get eBook Collections for your libraryRecommend eBooks to your librarian today. Find out more: emeraldpublishing.com/ebookcollections
Bringing together over 1,600 eBooks, the Emerald eBook collections are a cost-e� ective way of instantly expanding library holdings and increasing usage through an award winning platform alongside journals.
Visit emeraldinsight.com
eBook CollectionsResearch at your fingertips

GUEST EDITORCharles B. MossUniversity of Florida, USA
EDITORSProfessor Ashok K. MishraArizona State University, USAE-mail [email protected]
ASSOCIATE EDITORSProfessor M.K. AwasthiIndian Institute of Management, Lucknow, IndiaProfessor Hung-Hao ChangNational Taiwan University, TaiwanDr Steven HaggbladeMichigan State University, USADr Getu HailuUniversity of Guelph, Canada Dr Stefan HirschETH, Switzerland Dr Anjani KumarInternational Food Policy Research Institute, South Asia Office, India Professor Sergio LenceIowa State University, USA Dr Sapna A. Narula TERI University, IndiaProfessor Anthony RezitisUniversity of Helsinki, FinlandAdjunct Professor Hugo S. de Figueiredo JrUniversidade Federal do Ceará, BrazilAssociate Professor Saleem ShaikNorth Dakota State University, USA
PUBLISHERValerie RobillardE-mail [email protected]
CONTENT EDITORSimon BuckleyE-mail [email protected]
ISBN 978-1-78973-841-4ISSN 2044-0839© 2019 Emerald Publishing Limited
Emerald Publishing LimitedHoward House, Wagon Lane,Bingley BD16 1WA, United KingdomTel +44 (0) 1274 777700; Fax +44 (0) 1274 785201E-mail [email protected] more information about Emerald’s regional offices please go tohttp://www.emeraldgrouppublishing.com/officesCustomer helpdesk :Tel +44 (0) 1274 785278; Fax +44 (0) 1274 785201E-mail [email protected], subscription and missing claims enquiries:E-mail [email protected] +44 (0) 1274 777700; Fax +44 (0) 1274 785201
Missing issue claims will be fulfilled if claimed within six months of date of despatch. Maximum of one claim per issue.Hard copy print backsets, back volumes and back issues of volumes prior to the current and previous year can be ordered from Periodical Service Company. Tel +1 518 537 4700; E-mail [email protected] For further information go to www.periodicals.com/emerald.html
Reprints and permissions serviceFor reprint and permission options please see the abstract page of the specific article in question on the Emerald web site (www.emeraldinsight.com), and then click on the “Reprints and permissions” link. Or contact:E-mail [email protected] Publisher and Editors cannot be held responsible for errors or any consequences arising from the use of information contained in this journal; the views and opinions expressed do not necessarily reflect those of the Publisher and Editors, neither does the publication of advertisements constitute any endorsement by the Publisher and Editors of the products advertised.
No part of this journal may be reproduced, stored in a retrieval system, transmitted in any form or by any means electronic, mechanical, photocopying, recording or otherwise without either the prior written permission of the publisher or a licence permitting restricted copying issued in the UK by The Copyright Licensing Agency and in the USA by The Copyright Clearance Center. Any opinions expressed in the articles are those of the authors. Whilst Emerald makes every effort to ensure the quality and accuracy of its content, Emerald makes no representation implied or otherwise, as to the articles’ suitability and application and disclaims any warranties, express or implied, to their use.
Emerald is a trading name of Emerald Publishing LimitedPrinted by CPI Group (UK) Ltd, Croydon, CR0 4YY
Journal of Agribusiness in Developing and Emerging Economies is indexed and abstracted in:Cabell's Directory of Publishing OpportunitiesEconLitInspecRePEc: Research Papers in Economics Summon Is ranked by:ABDC (Australia) Polish Scholarly Bibliography (PBN)
The Journal of Agribusiness in Developing and Emerging Economies (JADEE) showcases research about the farm-to-fork value chain and its implications for economic and societal development in Asia, Africa, Latin America and Eastern Europe. JADEE interprets agribusiness as a discipline that studies the food and agriculture system – the individual elements and their interdependencies.
Quarto trim size: 174mm x 240mm
Guidelines for authors can be found at:www.emeraldgrouppublishing.com/jadee.htm

Jou
rnal o
f Ag
ribu
sine
ss in D
eve
lop
ing
and
Em
erg
ing
Ec
on
om
ies
Vo
lum
e 9
Nu
mb
er 1 2
019
em
erald
pu
blish
ing
.co
m
www.emeraldinsight.com/loi/jadee
Volume 9 Number 1 2019 ISSN 2044-0839Volume 9 Number 1 2019
Journal of
Agribusiness in Developing and Emerging Economies
Number 1
Agribusiness and food security in AfricaGuest Editor: Charles B. Moss
1 Editorial boards
2 Guest editorial
4 Contribution of policy change on maize varietal development and yields in KenyaLatha Nagarajan, Anwar Naseem and Carl Pray
22 Building African agribusiness through trust and accountabilityKristin Franklin and James Oehmke
44 Political will and public will for climate-smart agriculture in Senegal: opportunities for agricultural transformationEric D. Raile, Linda M. Young, Adama Sarr, Samba Mbaye, Amber N.W. Raile, Lena Wooldridge, Diaminatou Sanogo and Lori Ann Post
63 Farmers’ usage preferences for Rwanda’s Volcanoes National ParkIldephonse Musafili, Jean Chrysostome Ngabitsinze, Fidèle Niyitanga and Dave Weatherspoon
78 Distribution of agricultural productivity gains in selected Feed the Future African countriesCharles B. Moss and Andrew Schmitz
ISBN 978-1-78973-841-4
Journal of
Agribusiness in Developing and
Emerging Economies Agribusiness and food security
in Africa
Guest Editor: Charles B. Moss
Quarto trim size: 174mm x 240mm