Embed Size (px)
Citation preview

Agri Summit: Sustainable Agribusiness in Southern AfricaGlobal Competitiveness
PwC

Topics for discussion
1. International Agribusiness Environment 1. International Agribusiness Environment gg
2. Agribusiness in Brazil2. Agribusiness in Brazil
3. Brazil and South Africa 3. Brazil and South Africa
4. The way forward4. The way forward
2PwC

International Agribusiness Environment
• Factors affecting the international agribusiness environment :• Factors affecting the international agribusiness environment :
P l ti i d b i tiPopulation increase and urbanization
Economic growth and income distribution
Growing global demand for biofuelsGrowing global demand for biofuels
Investment Funds entering the sector
Global financial crisisGlobal financial crisis
The search for food security
A growing commitment to SustainabilityA growing commitment to Sustainability
PwC 3

Population Growth
3
World population between 2005 and 2025
7331
728
695
3905 44
13
AsiaEurope
North America
3733
4906
Africa2005
2025
646
561
124
90
33 39
OceaniaLatinAmerica
1990 2005 2025
World population (billion) 5,2 6,4 8,3
Demand for food (billion tonnes) 1 97 2 5 4
4PwCSource: ONU / MBAgro
Demand for food (billion tonnes) 1,97 2,5 4

Urbanization Rates
• Urbanization growth rate
Urbanpeop
le
UrbanPopulation
Bill
ion
p
As income rises, eating patterns tend to move to a diet withmore animal protein such as meat and dairy
5PwCSource: Agroanalysis, elaborated by PwC Research & Knowledge Center
p y

Income Distribution
• Growth and income distribution
Share in the global GDP – developed and emerging countries
58 0%
53.1% 51.9%54.7%55.0%
58.0%DESENVOLVIDOSDeveloped
49.6%50.3%
46 6%
49.7%
47.8%49.0%
52.0%
46.6%
45.3%
43.0%
46.0% HIPÓTESES: ALTERNATIVAS
Mundo Desenvolvidos Emergentes2009 -0.50% -3.30% 2.40%2010-2017 3.68% 2.50% 5.00%
EMERGENTESEmergent
40.0%
2008
2009
2010
2011
2012
2013
2014
2015
6PwCSource: FMI / DEPEC / Bradesco

The growing demand for biofuels
Ethanol's Potential Demand (billions of L)
Country Potencial demand
% ethanol in gasoline Deadline for changeg
USA 136 20 2022
China 13 10 2020
EU 9 5 2020EU 9 5 2020
Japan 6 5 2030
Australia 2 10 2011
Canada 2 5 2010
Source: 7PwCSource:
Canada 2 5 2010
EIA (Global Renewable Energy Policies and Measures); elaborated by PwC Research& Knowledge Center

The growing demand for biofuels
• Biofuels value proposition – why is it important?
Environmental Benefits•Carbon fixation•Global warming
Renewability• Short production cicle• Processes controlled by demand•Processes controlled by demand
Economic Aspects•New players in the fuel market• Trade balance impacts•Can be used to control soybean and corn overproduction
Social Aspects•Generation of jobs• Income distribution
Source: GVAgro 8PwCSource:
Income distribution

The short term perspective from investment funds
1600
1800
150
200SOJA
Net fundos Preço (US$c/bu)
- Price US$ (Soy)- Price US$ Sugar cane- Funds position
Soybean
1000
1200
1400
50
100
US$
c/bu
cont
rato
s líq
uido
Players in the agribusiness market strongly believe in increasing prices of commodities for the nexttu
re c
ontra
cts
400
600
800
-50
0
06 06 06 06 06 06 06 06 06 07 07 07 07 07 07 07 07 07 08 08 08 08 08 08 08 08 08 09 09 09 09 09 09
Mil
c prices of commodities for the next period.
1000
fut
jan-
0
fev-
0
mar
-0
mai
-0
jun-
0
ago-
0
set-0
out-0
dez-
0
jan-
0
fev-
0
abr-
0
mai
-0
jul-0
ago-
0
set-0
nov-
0
dez-
0
jan-
0
mar
-0
abr-
0
jun-
0
jul-0
ago-
0
out-0
nov-
0
dez-
0
fev-
0
mar
-0
mai
-0
jun-
0
jul-0
set-0
Fonte:CTFC, CBOT. Elaboração: MB Agro
20
22
24
26
200
250AÇÚCAR
Net fundos Preço (US$c/bu)
2006 2007 20092008 2010 Sugar
s
The increase in soybean price from 2006 to 2007 (over 100%) was related
12
14
16
18
20
50
100
150
US
$c/b
u
0 fu
ture
con
tract
s2006 to 2007 (over 100%) was related to speculation from investors
Over 200,000 future contracts were
6
8
10
-50
0
jan/
06
mar
/06
jun/
06
set/0
6
dez/
06
fev/
07
mai
/07
ago/
07
nov/
07
jan/
08
abr/0
8
jul/0
8
out/0
8
dez/
08
mar
/09
jun/
09
set/0
9
2006 2007 20092008 2010
100Over 200,000 future contracts were
traded betting on increasing price for sugar in 2010around the world
PwC
Fonte:CTFC, ICE. Elaboração: MB Agro
9Source: MBAgro, elaborated by PwC Research & Knowledge Center

International Financial Crisis
R$ 2.40R$ 2.60
Exchange rate (R$ per US$)The background
• Lack of credit worldwide
R$ 1 20R$ 1.40R$ 1.60R$ 1.80R$ 2.00R$ 2.20
R$/US$
• Lack of credit worldwide• Migration of investment funds to other alternatives• Overvaluation of the American Dollar in the tough period of the crisis as shown in the graphic.
R$ 1.20
25/06/2008
25/08/2008
25/10/2008
25/12/2008
25/02/2009
25/04/2009
25/06/2009
25/08/2009
25/10/2009
25/12/2009
Consequences for Agribusiness:
Gradual decrease in dollar value that followed in 2009 depreciating the terms of trade and causing aGradual decrease in dollar value that followed in 2009 depreciating the terms of trade and causing a decrease in competitiveness for agricultural exporters like Brazil
International investors migrate their money from the emerging markets to more secure investments such as U S Treasury Bondsas U.S Treasury Bonds
General decrease in commodity consumption and price
PwCSource: Brazilian Central Bank. 10
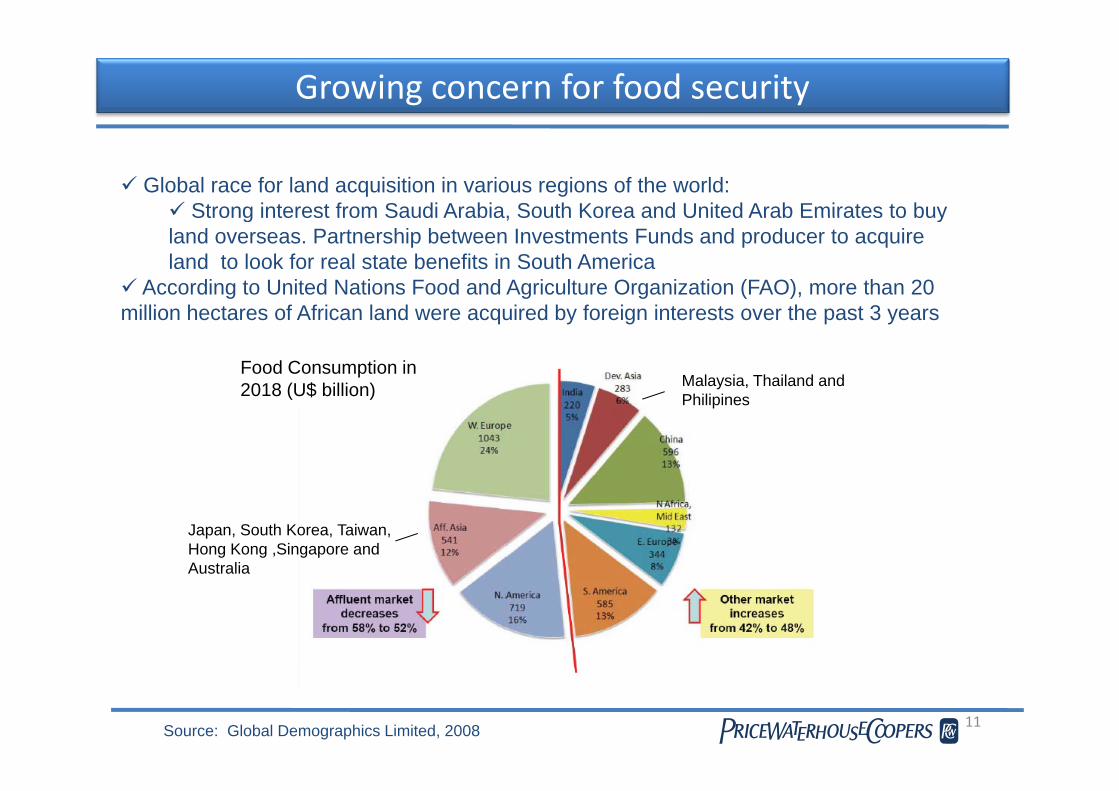
Growing concern for food security
Global race for land acquisition in various regions of the world:Strong interest from Saudi Arabia, South Korea and United Arab Emirates to buyStrong interest from Saudi Arabia, South Korea and United Arab Emirates to buy
land overseas. Partnership between Investments Funds and producer to acquire land to look for real state benefits in South America
According to United Nations Food and Agriculture Organization (FAO), more than 20 illi h t f Af i l d i d b f i i t t th t 3million hectares of African land were acquired by foreign interests over the past 3 years
Food Consumption in 2018 (U$ billion) Malaysia, Thailand and
Phili i2018 (U$ billion) Philipines
Japan, South Korea, Taiwan, Hong Kong ,Singapore and Australia
11PwCSource: Global Demographics Limited, 2008

Growing commitment to sustainability
Official Reports for sustainable practices : GRI, COP 15
Soybean Moratorium
Environmental pact of beef production with Greenpeace
Multistakeholders Associations
R d T bl R ibl S (RTRS)- Round Table Responsible Soy (RTRS)- Round Table on Sustainable Biofuels (RTSB)- Better Sugar Cane Initiative (BSI)- Round Table Responsible Palm Oil (RSPO)Round Table Responsible Palm Oil (RSPO)
12PwC

Topics for discussion
1. International Agribusiness Environment 1. International Agribusiness Environment gg
2. Agribusiness in Brazil2. Agribusiness in Brazil
3. Brazil and South Africa 3. Brazil and South Africa
4. The way forward4. The way forward
13PwC

Brazil´s positioning in the world
CancerCancer TropTrop
RússiaRússia
CancerCancer Trop. Trop. 30º N30º N
EquatorEquator LineLine ÍndiaÍndia
ChinaChina
CapricornCapricorn Trop.Trop.30º S30º S
BrasilBrasil
BricBric MembersMembers (40% of world population and 15% of global economy)
• China: 1 350
Population 2009(million inhabitants)
• Russia: 17 • China: 7 1
Area (million km2) GDP ‐ 2008 (US$ trillion)
• China: 1.350• India: 1.198• Brazil: 193 • Russia: 140
Russia: 17• China: 9, 6• Brazil: 8,5 • India: 3,3
• China: 7,1• India: 2,9 • Russia: 2,1• Brazil: 1,8
14Source: IBGE/ United Nations Statistics – 2009 / CIA PwC

Key Agribusiness Value Chains
Brazil has global leadership positions in the main agricultural products
ProductionParticipation in the world Exports
Participation in the world
Soybean (thousands tons) 60.000 25% 24.000 32%
Corn (thousands tons) 50.000 6% 7.870 6%
Beef (thousands tons) 9 205 15% 1 925 25%2
3
2
1
3
1
Beef (thousands tons) 9.205 15% 1.925 25%
Poultry (thousands tons) 11.033 15% 3.646 46%
Pork (thousands tons) 3.029 3% 529 8%
2
4
1
4
Sugar (thousands tons) 31.622 20% 19.472 38%
Ethanol (millions Liters) 26.681 40% 5.129 92%
1
2
1
1
1
1Coffee (thousands of bags 60kg) 45.992 34% 29.486 30%
Orange Juice (thousands tons) 1.165 50% 1.230 83%
1
1
1
1
PwCSource: USDA, adapted by PwC Research & Knowledge Center15

Brazil: a land of opportunities
Territory Distribution (million hectares)
Amazon Rain Forest 345
Breeding Pasture 170
Protected Areas 55
A l C lt 47Annual Cultures 47
Permanent Cultures 15
Cultivated Forest 5
Subtotal 707
Others 88Unexploited areas for agriculture 106
Total 851
16PwCSource: IBGE & CONAB, 2008; elaborated by PwC Research & Knowledge Center

Agribusiness is a key sector in the Brazilian economy
Agribusiness Participation in Brazil's GDP (US$ billion)
Agribusiness Share in the Economy (%)
Agribusiness accounts for 37% of allemployment in the countryemployment in the country
17PwCSource: IBGE, 2009

Brazil Trade Balance 1994‐2008
80
40
60
20
40
Bilio
n US$
‐20
0
1994 1995 1996 1997 1998 1999 2000 2001 2002 2003 2004 2005 2006 2007 2008‐60
‐40
Net Balance of other sectors ‐3 ‐15.5 ‐17.8 ‐21.9 ‐20 ‐16 ‐15.6 ‐16.4 ‐7.2 ‐1.1 ‐0.5 6.4 3.4 ‐9.7 ‐35.3
Net Balance of Agribusiness 13.4 12.2 8.9 15.2 13.5 14.8 14.9 19.1 20.3 25.9 34.1 38.4 42.7 49.7 60
Net Balance Brazil 10.4 ‐3.3 ‐8.9 ‐6.7 ‐6.5 ‐1.2 ‐0.7 2.7 13.1 24.8 33.6 44.8 46.1 40 24.7
PwCSource: SECEX (2008), elaborated by PwC Research & Knowledge Center 18

Some aspects of Brazilian agribusiness
• Leadership position in key value chainsp p y
• Strong inputs sector: fertilizers, machinery and implements
• Strong participation of family agriculture
• Participation of cooperatives
• Strong supporting science: technology transfer
S ti i lt l li i d titi• Supporting agricultural policies and entities
PwC 19

Key agribusiness value chains: sugarcane
Sugarcane producing areas situated away from the Amazon forest
• The main sugarcane producing areas of the country are about 2,500 Km south and 2,000 Km east of the Amazon
• There are large available areas for growth in the Midwest that are more suitable for cultivation
Q i k f t S 2009Quick facts – Sugarcane 2009
Harvested area: 7,5 million haProduction Mix: 45% sugar and 55% ethanol
Production: 612,2 millions of tons
Productivity: 81,5 ton/ha
Production Mix: 45% sugar and 55% ethanol
Sugar production: 34,6 millions of tons
Ethanol production: 25,9 billions of litres
Source: FAPRI, UNICA / elaborated by PwC Research & Knowledge Center 20PwC
Active sugarcane mills: 434t a o p oduct o 5,9 b o s o t es

Market Trends for sugarcane
• Launch of transgenic cultivars adapted to different regions by 2012
• Increase in productivity
• 16% of the sugarcane crushed in this harvest belong to foreign investors- 10 years ago the sector was controlled only by Brazilian companies10 years ago the sector was controlled only by Brazilian companies
• Brazil as a key country in determining the world´s future prices of sugar, remaining a leader in production, productivity and exports
H t h tf ll i I di d id bl i i i t ti l i• Harvest shortfall in India and considerable increase in international prices
• Greater dynamism in the sector due the increase of domestic consumption and exports
- Growing sales of Flex Fuel Vehicles (95% of the cars manufactured since 2008 were flexfuel, g (witch represents 39% of the total brazilian fleet)
- Discussion regarding USA tariff barriers (US$ 54 cents/L)
C ti T h l i l I ti Eth l f 2nd ti d di l d b• Continuous Technological Innovation: Ethanol of 2nd generation and diesel made by sugarcane
• Implementation of ducts for transportation
• Cogeneration: Long Term Contracts for energy supply
21
g g gy pp y
PwC

The competitiveness of ethanol from sugarcane
Ethanol’s production cost (US$ cents / L)p ( )
Competitiveness of ethanol from sugarcaneCompetitiveness of ethanol from sugarcane (L/ha)
22Source: International Energy Agency PwCSource:

Key agribusiness value chains: meat complex
Brazilian meat production (thousand tonnes)
Brazil: Share of Export vsMeat Production (%)
Year Poultry Cattle Pork2000 15% 9% 5%2001 19% 12% 10%2002 22% 13% 16%2002 22% 13% 16%2003 25% 17% 18%2004 29% 16% 19%2005 30% 20% 23%2006 29% 22% 18%
World Poultry & Pork production ( Thousand tons )2006 29% 22% 18%2007 32% 22% 17%2008 33% 18% 18%
23Source: Conab / Exame Agribusiness Yearbook PwCSource:

World meat production and Exports
Major beef producers (Thousand Tonnes) World Bovine Meat Exports (thousand tonnes)
ChinaEU (27)BrazilUSA
2008 1.500
2.000
2.500
Brazil
Australia
USA
AustraliaMexicoIndia
Argentina 2007
2006
0
500
1.000
00 01 02 03 04 05 06 07 08
USA
India
New Zeland
Argentina
0 5.000 10.000 15.000
200
200
200
200
200
200
200
200
200
Brazil could have exported US$ 2 billion more if it wasn´t for the european embargo t bli h d i 2007 hi h t il l d th b d f b ili t th EUestablished in 2007, which temporarily closed the borders for brazilian meat; the EU
demanded a full revision of the Brazilian traceability system (SISBOV)
The SISBOV is adopted to ensure that the product doesn´t come from deforestionThe SISBOV is adopted to ensure that the product doesn t come from deforestionareas and slave labour farms. The system´s challenge is huge considering states like Mato Grosso and Para, where the majority of farmers are small (80%)
PwC 24Source: USDA / SECEX, 2009

Key agribusiness value chains: Inputs Sector
Fertilizer Usage, Crop Productionand Harvest Area
Crop Production
Fertilizers
Harvested Area
Farm equipment and agricultural machinery (units)
PwCSource: Lafis 2009/Exame Agribusiness Yearbook 25

Family run Agribusiness
The concept of family Agriculture Properties up to 100 hectares.
- subsistence farming, small-scale production, or peasantry
Quick facts ‐ Brazil
In Brazil family agriculture represents:
89,3% of registered rural proprieties
20% of agricultural land
32% of agricultural GDP
9% of Brazilian Total GDP US$ 103 billion
CoffeeEmployer Agriculture
Family Agriculture
DairyEmployer Agriculture
Family Agriculture
46%54%
Family Agriculture
44%56%
Family Agriculture
PwCSource: IBGE , Anpec26

Cooperativism in Brazilian Agribusiness
Sales of Brazilian cooperatives reached US$ 83 billion in 2008 20% of Brazilian cooperatives are in the agribusiness sector
Name Segment Sales US$ Exports Product Share (%)
Share of Products Exported by Brazilian Agricultural Cooperatives ‐2008
Biggest Agribusiness Cooperatives in Brazil ‐ 2008
Name Segment Sales US$ (Million)
ExportsUS$ (Million) % of sales
Copersucar Sugar and Ethanol2.520 1.093 43
Coamo Vegetable Oil andFlour 1.869 435 23
Product Share (%)
Soybeans 32
Meat 21
C. Vale Poultry anb Pork791 148 19
Cooxupé Coffee712 259 36
Cooperativa Agrária
Cotton and Grain594 108 18
C l C tt d G i
Sugarcane 27
Coffee 9
Cotton 2
Carol Cotton and Grain582 177 30
Cocamar Vegetable Oil andFlour 576 119 21
Comigo Vegetable Oil andFlour 458 20 4
Milk 2
Fruits 1
Meat Preparations 1Cooperalfa Vegetable Oil and
Flour 449 20 4 Vegetables Products 1
The top 9 cooperatives accounted for US$ 8,4 billion in sales and US$ 2,4 billion in
PwCSource: OCB/MDIC/Secex and Anuario Exame, 2009 27
exports in 2008

Strong supporting science and technology transfer
The Brazilian Agriculture Research Institution (Embrapa) has an office in Accra (Capital of Ghana) and develops projects in 8 African countries (Angola Republic(Capital of Ghana) and develops projects in 8 African countries (Angola, Republic of Cape Verde, Senegal, Mozambique, Mali, Benin, Burkina Faso, Chade)
Empraba has sought to meet the demands of African countries to increase i lt l d ti ith t h l i d l d b th f th l t 20agricultural production with technologies developed by the company for the last 20
years (no longer protected by patents, already in the public domain)
Embrapa offices around the worldEmbrapa offices around the world
28PwC

Agribusiness and Politics
Agricultural Policies
R l C dit
Macroeconomic
- Monetary Policy- Rural Credit
- Minimum prices
- Inventory Regulators
y y
- Fiscal Policy
- Exchange Policyy g
- Trade Policy
Most policies were created in the 1970s
- Harvest Plan: A document that consolidates key government measures for the current crop
- Program that Guarantee Minimum Prices (PGPM): protection policy for the prices of agricultural produce
- Certificate for Farmers (CPR): title of future delivery of products traded over the counter, standardizing and regulating the operations of pre-sale
PwC 29

Agribusiness and Politics
Agricultural Policies
I t C t l
Macroeconomic
- Monetary Policy- Inventory Control
- Pricing control
- Family Agriculture
y y
- Fiscal Policy
- Exchange Policyy g
- Trade Policy
- Inventory Control: policy of inventory control by fluctuations in prices of agricultural products
P i i t l I ti f h b th d t di tl f th d ith- Pricing control: Incentive for anyone who buys the products directly from the producer with standard prices. The incentive is the difference between the prices and market prices
- National Program for Strengthening Family Agriculture (PRONAF) program to support g g g y g ( ) p g ppfamily agriculture with special lines of credit for financing
PwC 30

Agribusiness and Politics
Políticas Agrícolas
C édit R l
Políticas Macroeconômicas
- Política MonetáriaAgricultural Policies
R l C dit
Macroeconomic
- Monetary Policy- Crédito Rural
- Preços mínimos
- Estoques Reguladores
- Política Fiscal
- Política Cambial
- Rural Credit
- Minimum prices
- Inventory Regulators
y y
- Fiscal Policy
- Exchange rate q g
- Política Comercialy g
- Trade Policy
- Monetary Policy: financing the deficit versus availability of resources for agriculture
- Fiscal Policy: complex tax systemFiscal Policy: complex tax system
- Exchange rate Policy: overvaluation of the Real prejudice Brazilian exports in the international market Especially those of agricultural products
- Trade Policy: high tariffs for imported products
PwC 31

Agribusiness and Politics
Public Entities:
MAPA – Ministério da Agricultura, Pecuária e Abastecimento
• Formulates and implements policies for the development of agribusiness integrating• Formulates and implements policies for the development of agribusiness, integrating aspects of marketing, technological, scientific, organizational and environmental• Organization of the productive chain• Modernization of agricultural policiesg• Promotes the export incentive, the sustainable use of natural resources and social welfare
Conab Companhia Nacional de AbastecimentoConab – Companhia Nacional de Abastecimento
Conab is a government agency, responsible for managing the agricultural supply, to ensure the basic needs of society are fulfilled, preserving and encouraging market mechanisms
PwC 32
Agribusiness and Politics
Public Entities:
CNA – Confederação Nacional da Agricultura
• It brings together associations and rural leaders participating in decisions on agriculturalIt brings together associations and rural leaders, participating in decisions on agricultural policy• Interact with political leaders in Congress• Empowers a national policy and tax system more appropriate to farming
S h f l dit d t th ti f t h l i• Search for rural credit and support the generation of new technologies• Stimulates the creation of agro-industries
Regional SindicatesRegional Sindicates
• Entity representative of rural class• Works as an agribusiness political negotiator in the public sector strategic plan
P id t i i t f th h SENAR• Provides training to farmers through SENAR
PwC 33

Some concerning aspects of Brazilian agribusiness
• Inneficient logistcs: highway, railway and waterwayg g y y y
• Sustainability concerns: greenhouse emissions
• The Amazon Forest discussion
PwC 34

Brazilian Highway Commercial Transport
Brazil: Agribusiness Transport Flux – 2007
Brazil: Agribusiness Transport Flux ‐2023 (forecast after government plan)
Only 12% of Brazil's highway network is paved, and 74% of this group have some y g y gdeficiency in the pavement, signaling or geometry, wich restricts the integration with other modes, generating high operating costs (mechanical problems in vehicles)
Brazil spend about US$ 75 billion per year in logistics (higher costs of US$ 1 7 Billion overBrazil spend about US$ 75 billion per year in logistics (higher costs of US$ 1.7 Billion over the U.S. and Argentina only in soybeans sector)
PwCSource: ANEC and ANUT, 2007 35

Brazilian Rail Commercial Transport
Brazil – Railroad Map USA – Railroad Map
Freight Transport ComparativeFreight Transport ComparativeBrazil X USA (%)
Railway is responsible for 20% of Brazilian freight transport (90 thousand wagons and 2 500Railway is responsible for 20% of Brazilian freight transport (90 thousand wagons and 2.500 locomotives)
The biggest issue is the long time spent in each journeygg g p j y
The growth of the rail system depends on investments in infrastructure and incentives
PwCSource: Confederação Nacional de Transporte – CNT/ Banco Mundial 36

Brazilian Waterway Commercial Transport
PortAccess
Retroarea Waiting to berth(average hours)
Productivity rating(Conteiners per
hour)Waterway Terrestrial
1 – Pecém Excellent Excellent Appropriate 4 311 – Pecém Excellent Excellent Appropriate 4 312 – Suape Excellent Excellent Appropriate 4 293 – Salvador Satisfactory Satisfactory Critical 9 344 – Vitória Unsatisfactory Unsatisfactory Insufficient 9 395 Rio Satisfactory Unsatisfactory Appropriate 6 315 – Rio Satisfactory Unsatisfactory Appropriate 6 316 – Sepetiba Unsatisfactory Unsatisfactory Appropriate 9 397 – Santos Unsatisfactory Critical Critical 13 398 – Paranaguá Critical Unsatisfactory Appropriate 11 319 S F i d S l U ti f t U ti f t C iti l 14 359 - S. Francisco do Sul Unsatisfactory Unsatisfactory Critical 14 3510 – Itajaí Unsatisfactory Unsatisfactory Critical 20 2311 - Rio Grande Unsatisfactory Excellent Insufficient 7 41
1
2
3
Waterway is composed by 40 ports (oceanic andriverine), responsible for 13% of Brazilian freight
7 68
3
45
9
transport. Weakness: long wait for berthing of vessels, low
productivity
PwCSource: Hamburg & SUD, 2008
910
11
37

World and Brazil Emissions
Distribution of Greenhouse Gases (GHG) Emissions in 2005 (%)
Industrial Processes
Agribusiness Change of land use
LeavingsEnergy
PwCSource: Centro de Energia Nuclear na Agricultura - CENA 38

Producing regions away from the Amazon Forest
Coffee Sugar CaneCoffee
OrangeSoybeans
Amazon ForestSoybeans
Corn Cattle
39Source: Conab, 2007 PwCSource:

A SWOT Analysis of Agribusiness in Brazil
Strengths• Agribusiness is responsible for 37% of all employment in Brazil, 26% of GDP and 80% of g p p ythe trade balance surplus• International leadership in several agricultural commodities: orange juice, poultry meat, coffee, sugar, meat and soybeans• Significant area of land available for expansion approximately 106 million ha• Significant area of land available for expansion, approximately 106 million ha• Low labour cost• Diversified climate, long daylight hours and water availability• Nearly 13% of all fresh water of the planety
Opportunities• High productivity and technology adoption for main cultures and activities (soybean corn• High productivity and technology adoption for main cultures and activities (soybean, corn, coffee, sugar cane, orange)• Strong supporting science (Embrapa, renowed universities, private research)• Integration of agricultural and animal production systems• Large multinationals investing in Brazil• Strong participation of Cooperatives • Considered the world´s largest potential producer for food, fiber, feed and fuel (bio energy)
PwC 40

Brazil Agribusiness SWOT Analysis
Threats• Complex & inefficient tax structure
V l til h t• Volatile exchange rates• Environmental code review• Land use laws• High interest ratesg• Weak financing system for farmers
Weaknesses• Impact of input prices reducing farm profitability• Logistic issues:
- Road use (60% of total) in Brazil- Low use of rail and waterways for commercial transport- Brazilian ports have high cost, low capacity and efficiency
• Lack of financing and lack of insurance for farmers• Lack of financing and lack of insurance for farmers
PwC 41

Topics for discussion
1. International Agribusiness Environment 1. International Agribusiness Environment gg
2. Agribusiness in Brazil2. Agribusiness in Brazil
3. Brazil and South Africa 3. Brazil and South Africa
4. The way forward4. The way forward
42PwC
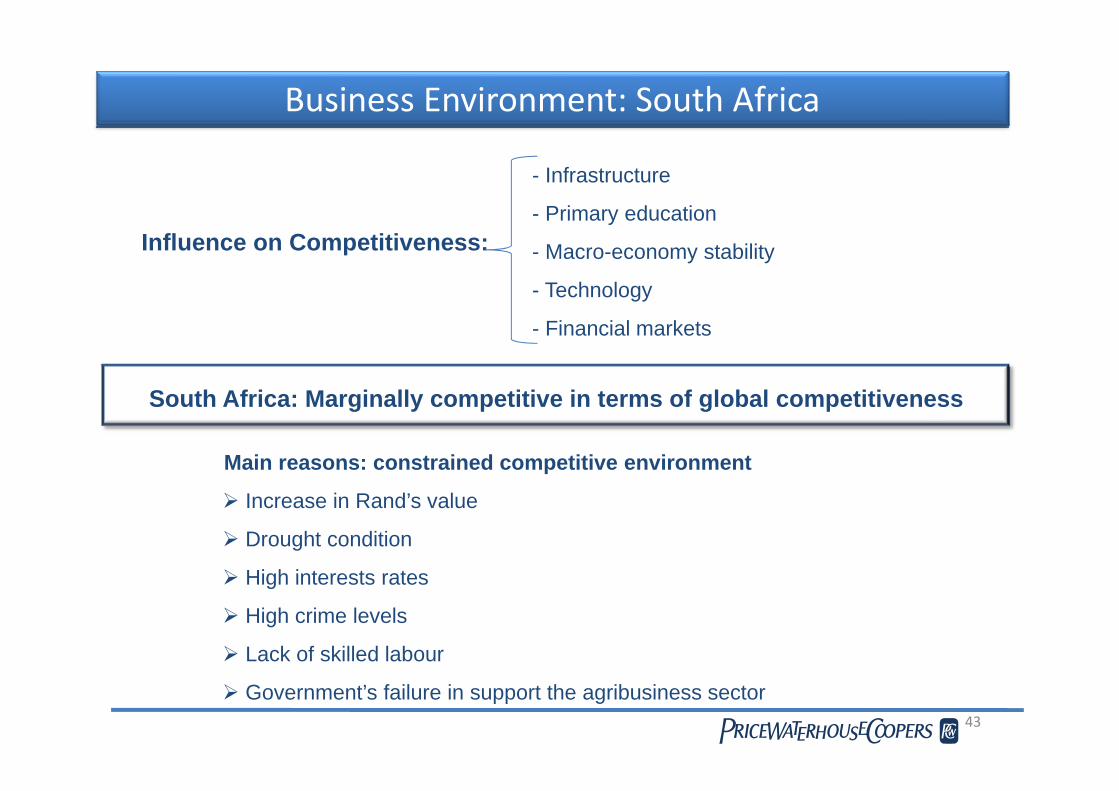
Business Environment: South Africa
- Infrastructure
- Primary educationInfluence on Competitiveness:
Primary education
- Macro-economy stability
- Technology
South Africa: Marginally competitive in terms of global competitiveness
- Financial markets
South Africa: Marginally competitive in terms of global competitiveness
Main reasons: constrained competitive environment
Increase in Rand’s value
Drought condition
High interests ratesHigh interests rates
High crime levels
Lack of skilled labour
PwC 43
Government’s failure in support the agribusiness sector

Business Environment: Brazil and South Africa
Strengths Weakness
Great availability of natural resources
Poor transport and storage infrastructureresources infrastructure
Un-expensive Waste along the chain
Economies of scale and ffi i
Lack of qualified laborefficiency
Research and development of new technologies
Informal economy
Comparative advantages in Complex tax system and high production interest rates
Strengths Weakness
Intense competition in local Crime and theftIntense competition in local market
Crime and theft
Availability of unskilled labor Inefficient government bureaucracy
High quality of products Inadequately educated workforce
Continuous innovation Restrictive labor regulations
Investments in Human Inadequate supply of
PwC 44
Investments in Human Resources
Inadequate supply of infrastructure
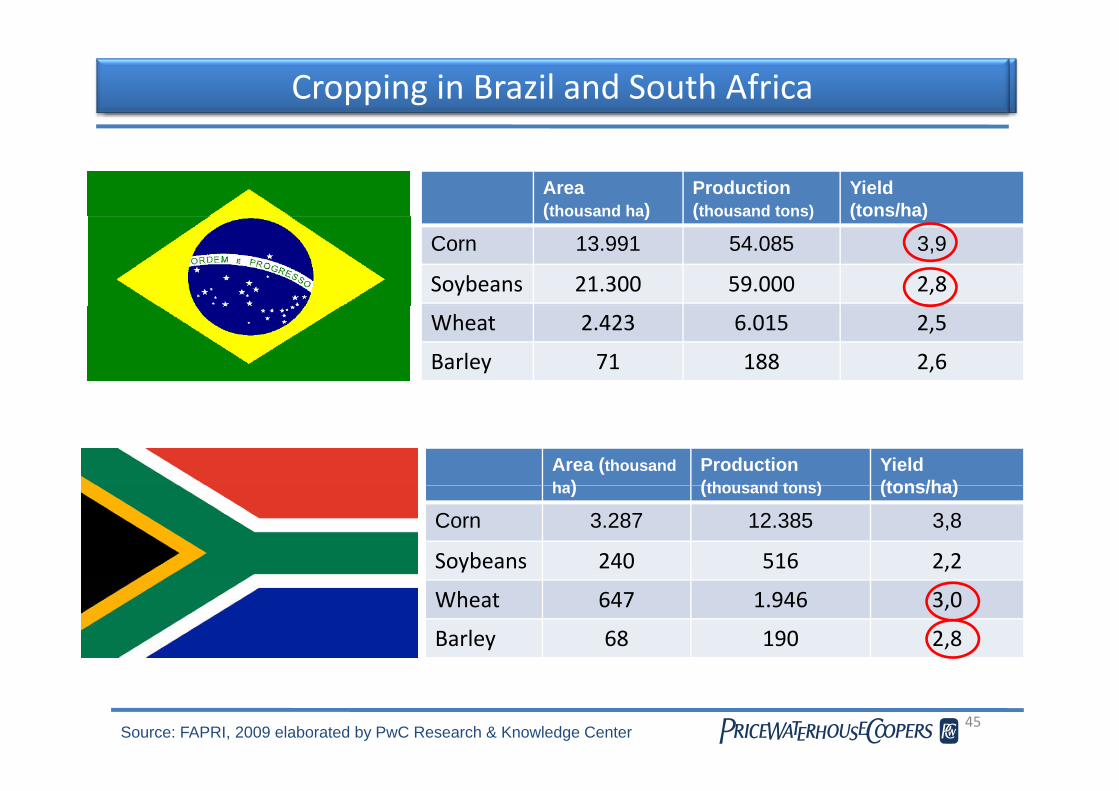
Cropping in Brazil and South Africa
Area(thousand ha)
Production(thousand tons)
Yield(tons/ha)(thousand ha) (thousand tons) (tons/ha)
Corn 13.991 54.085 3,9
Soybeans 21.300 59.000 2,8
Wheat 2.423 6.015 2,5
Barley 71 188 2,6
Area (thousandha)
Production(thousand tons)
Yield(tons/ha)ha) (thousand tons) (tons/ha)
Corn 3.287 12.385 3,8
Soybeans 240 516 2,2
Wheat 647 1.946 3,0
Barley 68 190 2,8
PwC 45Source: FAPRI, 2009 elaborated by PwC Research & Knowledge Center

Conclusions
Key major factors impacting international business environment:- Key major factors impacting international business environment: - Population growth, changing eating habits and demographics- Growing participation of investment funds- Drive and concern for sustainability- Drive and concern for sustainability- Drive and concern for food security
- Brazilian agribusiness is a major force nationally and internationally:Brazilian agribusiness is a major force, nationally and internationally:- Today accounts for approximately 1/3 of GDP and employment- Leadership in key value chains: orange juice, coffee, soybean, sugar, poultrypou t y- The Amazon Forest discussion- Strengths and Opportunities: scale, export drive, large domestic market, - Weaknesses and Threats: logistic bottleneck, taxation, human capital g p- Political organization: policies and institutions
PwC 46

The way forward
International Agreements:- International Agreements:- Multilateral and Bilateral Trade Agreements
- International Technology Transfer- International Technology Transfer- Science, production, education, human capital
- Governmental SupportGovernmental Support- Policies, institutions, tax regime
- Strong multinational organizationsSt o g u t at o a o ga at o s
- Participation of cooperatives: strong production base
PwC 47

PwC 48
© 2009 PricewaterhouseCoopers. All rights reserved. “PricewaterhouseCoopers” refers to the network of member firms of PricewaterhouseCoopers International Limited, each of which is a separate and independent legal entity.