Embed Size (px)
Citation preview
Agrarian Change In India: A Case Study 1
mySOCIETY VI (1-2), 2011, 1-26
©University of Mysore
Research Article http://mysociety.uni-mysore.ac.in
AGRARIAN CHANGE IN INDIA: A CASE STUDY
V. Anil Kumar
Abstract
In this article, we present a case study on agrarian change
contrasting the official secondary data with independently
collected primary data regarding some key aspects of agrarian
change in rural Andhra Pradesh, India. The main argument of the
paper is that while the official statistics on certain aspects are
reliable, on other aspects of agrarian change such as land holding
structure can be misleading when taken prima facie. In order to
get closer to the truth, we need disaggregated original primary
surveys, which can portray a nuanced picture of agrarian change
over time. This is particularly the case with the longitudinal data
pertaining to land ownership.
Introduction:
Capitalist development has been defined in various ways. Maurice Dobb, in
his discussion in Studies in the Development of Capitalism, reviewing the definitions
of capitalism, denotes employment of wage labour in the market as the ultimate
characteristic of capitalism1.
While employment of wage labour is an important indicator in itself, another
most important indicator, especially in agriculture, is the polarisation of the
class/agrarian structure. That is the concentration of means of production (in land in
Assistant Professor, Centre for Political Institutions, Governance and Development, Institute for Social
and Economic Change, VKRV Rao Road, Nagarabhavi, Bangalore 560 072, Karnataka, India, Web address:
www.isec.ac.in, E-mail: [email protected], [email protected]
2 V. Anil Kumar
particular) on one side and formation of absolutely landless labouring class on the
other. Exposition of this process came widely to be known as the polarisation thesis.
Polarisation thesis was first propounded by Marx in the volume-1 of Capital
in the chapter, ‘So Called Primitive Accumulation’, while dealing with the enclosure
movement in Britain. Later Lenin raises the issue in his The Development of
Capitalism in Russia.2 Lenin argues that land concentration inside Russian
countryside is taking place and that it is an inevitable process during the development
of capitalism – in any country. The small and middle peasants would be swept away
by the juggernaut of capitalism. In the Russian debate the process came to be called
the ‘depeasantisation’ process. The process otherwise has also came to be called the
proletarianisation process.
A variation on the theme was the German debate around the same time within
the SPD (Social Democratic Party) between Kaurl Kautsky and a group of Social
Democrats headed by Eduard David.3 In this debate while Kautsky believed that
Polarisation could be a long term tendency --- and not necessarily visible in the short
run --- Eduard David et al categorically held that small and middle peasants have
sufficient resilience to withstand the force of agrarian capitalism. David and his
group questioned the alleged superiority of large scale agriculture. Whether capitalist
or socialist they (David et al) held that small scale farming is more viable and more
rational than large scale farming. They felt small scale farming is an effective
alternative to collectivisation. While the debates are of great relevance in the context
of socialist agriculture they are also of significant importance in the context of the
study of capitalist agriculture. They provide insights into the understanding of
structural processes: on whose basis politics operate and evolve.
The Indian debate on ‘Mode of Production’ in agriculture too raises questions
about the definition of capitalism.4 The major bone of contention was whether to
limit the definition of capitalism to the employment of wage labour alone or to add
the criterion of accumulation and reinvestment (on the farm). It was argued by Utsa
Patnaik that while emergence of labour power as commodity is a necessary condition,
it is not a sufficient condition. She felt that reinvestment and accumulation are the
sufficient conditions; which means that Polarisation process --- which is in turn
product of reinvestment and accumulation --- is a definitive feature of capitalist
development in agriculture.

Agrarian Change In India: A Case Study 3
The concern of the present article is the examination of polarisation thesis and
entailing politics in particular empirical situations. The emergence of the above said
process is a complex phenomenon. As Lenin in the Russian context and noted
European historian Robert Brenner in the European context5 have noted: firstly, the
process is contingent on the specificity of the circumstances; and secondly, the
process takes place over longue duree, and depends on the long established socio-
historical structures. The above discussion though brief, covers the essentials of the
debate over the definition of agrarian capitalism.
In this article we examine the above proposition by contrasting secondary
official data provided by government with the independently collected primary data
regarding agrarian change over more than a period of two decades, and attempt to
compare the two and discuss the differences. The official data pertains to Nalgonda
district of Andhra Pradesh mainly from the Statistical Abstracts prepared by the
government of Andhra Pradesh6. Attempt in this article is to compare the district level
official data with data and information collected firsthand through primary survey;
and the contrasts between the two are sought to be discussed. This paper is divided
into three parts> In the first part of the paper we discuss the official data and the
findings from that data; and in the second part of the paper we discuss the findings of
our original field survey. Finally we attempt to see what implications these
differences hold for policy.
Firstly, the official data that we collected was taken from these Statistical
Abstracts of Nalgonda District, covering the period 1970-90.(Some of the official
data does begin at 1957 but this is not a computational problem as this data, such as,
area sown under food and non-food crops is only illustrative and does not affect the
central arguments of the paper). There were some limitations to this data; for example
we could not collect data on land reforms, as official information on the
implementation of land reforms is scanty, and difficult to get. Nowhere in the
government statistics do we find mention of either the land distributed or to be
distributed. The degree of reliability of official data varies within the secondary data
between different aspects. Information and data under certain aspects is more reliable
than the others and on certain matters only the government can provide data - such as
on rainfall, for example. At the same time crucial aspects such as the number of
agricultural labourers and cultivators in the district, the government data is quite
unreliable; from this it follows that while depending on the secondary data is
4 V. Anil Kumar
0
20000
40000
60000
80000
100000
120000
140000
160000
180000
1970-71 1976-77 1980-81 1986-87 1990-91
In T
housand H
ecto
rs
Years
Figure 1: Area Operated as per holding size (0-0.5 to 4.00-5.00)
0-0.5 0.5-1 1.00-2.00 2.00-3.00 3.00-4.00 4.00-5.00
inescapable in certain matters, it has to be taken with care in certain other matters.
Following this in the second part of the paper we discuss the results of primary
survey. In conclusion, we state our viewpoint that, particularly regarding agrarian
change, primary data collected through either survey or through qualitative methods
is imperative. Exclusive reliance on official statistics may not always provide a
correct reflection of the reality.
PART - I
2. Trends in the official agricultural data
The official data presented here is basically the district level data taking the
case of Nalgonda district in Andhra Pradesh. The trends within it are basically trends
at district level. Below an attempt is made to discuss the trends in different aspects of
the data for the years 1970-1990. Data on agrarian structure was basically collected
from the Statistical Abstracts as mentioned above. This agricultural data is collected
by the government as part of the World Agricultural Census (WAC).
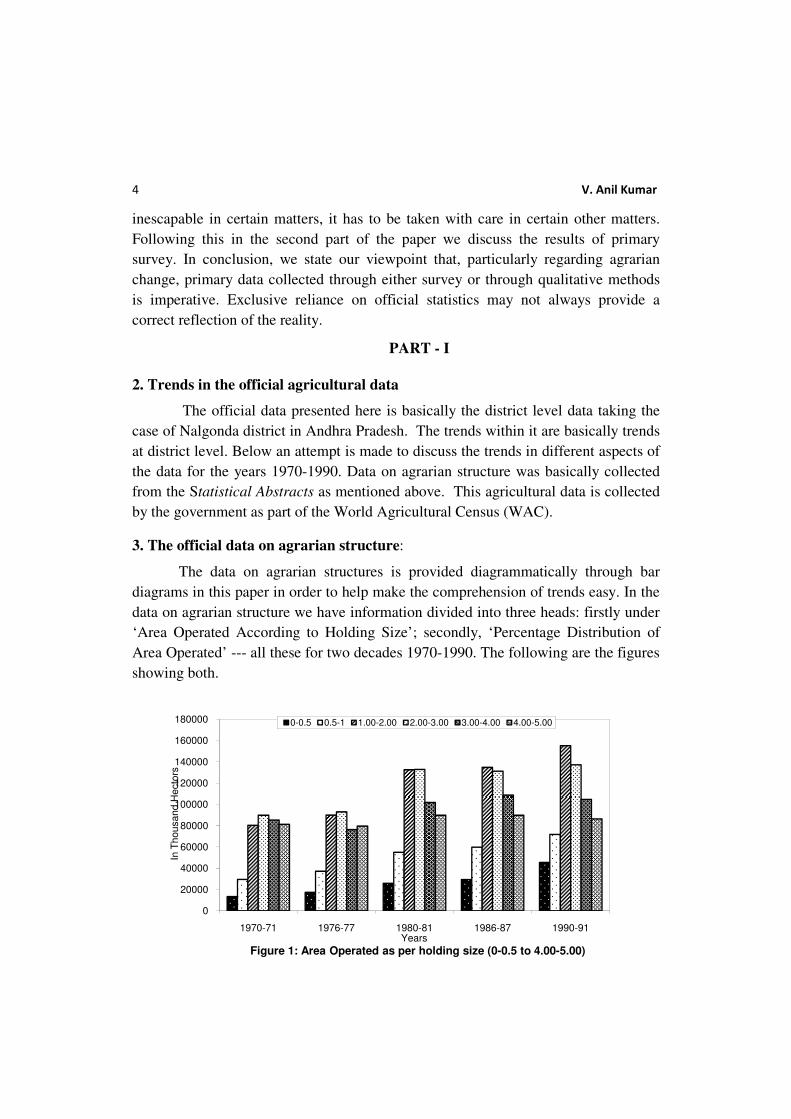
3. The official data on agrarian structure:
The data on agrarian structures is provided diagrammatically through bar
diagrams in this paper in order to help make the comprehension of trends easy. In the
data on agrarian structure we have information divided into three heads: firstly under
‘Area Operated According to Holding Size’; secondly, ‘Percentage Distribution of
Area Operated’ --- all these for two decades 1970-1990. The following are the figures
showing both.

Agrarian Change In India: A Case Study 5
For the years 1970-90 we can see that area operated in the holding sizes 0-
05. To 4-5 hectares has increased substantially. See that area operated under the
holding sizes 5-10 hectares to 50 plus hectares has declined drastically, which
means that over the years area operated under smallholdings has increased.
While the area operated under bigger holdings i.e., 5 hectares and above has
decreased. That means that smaller holdings of particularly of 1 to 4 hectares size
have increased rapidly at the expense of big holdings of (the size) five hectares
and above. This can safely be interpreted as a trend towards land fragmentation
rather than a trend towards land concentration. Particularly area operated has
increased at a very fast pace under the size holdings 1-2 hectares to 3-4 hectares.
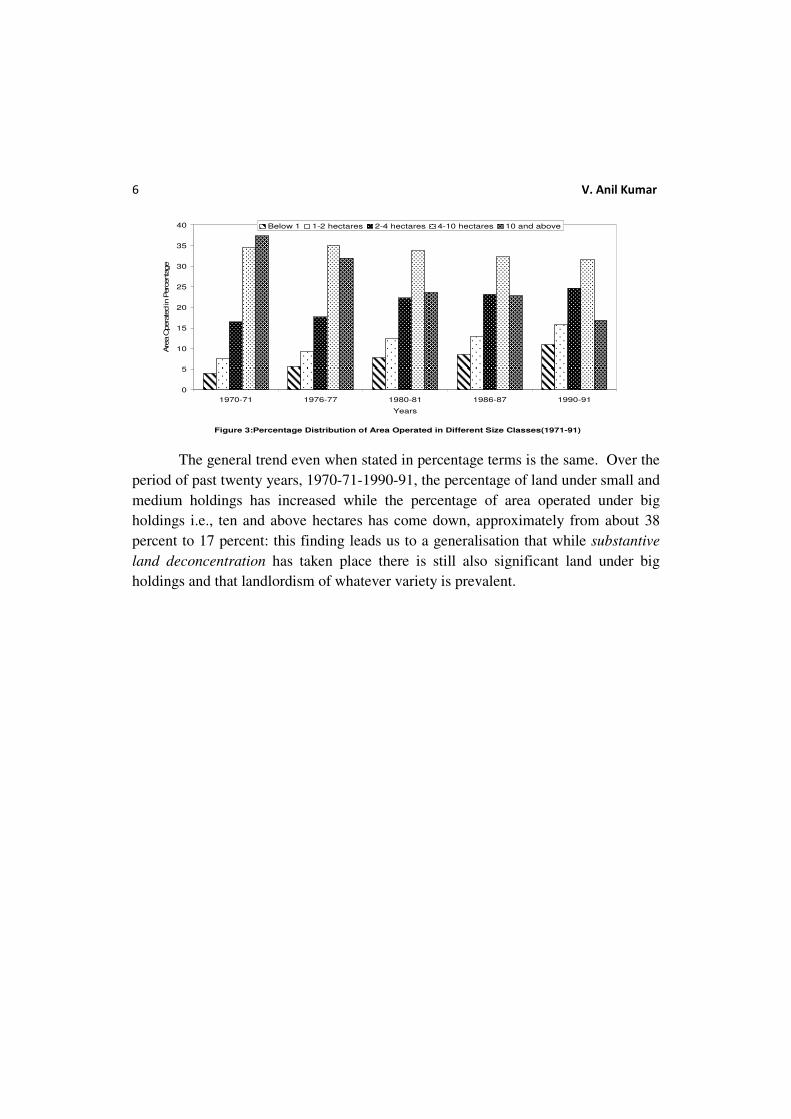
The percentage distribution of area operated in different size classes of
holdings also supports the above claim. But the bar diagrams present a slightly
different picture. According to this data while the percentage of area operated a
big holdings i.e., 10 hectares and above, has decreased, still a substantive amount
of area i.e., about 17-18 percent of the total arable area is operated in 1990-91 was
under big holdings of ten hectares and more. The figure is graphically presented
below in figure – 3.
0
50000
100000
150000
200000
250000
300000
1970-71 1976-77 1980-81 1986-87 1990-91
In T
ho
usa
nd
He
cto
rs
Years
Figure2: Area Operated as per holding size (5.00-10.00 to 50.00 +)
5.00-10.00 10.00-20.0 20-30 30-40 40-50 50+
6 V. Anil Kumar
Figure 3:Percentage Distribution of Area Operated in Different Size Classes(1971-91)
0
5
10
15
20
25
30
35
40
1970-71 1976-77 1980-81 1986-87 1990-91
Years
Are
a O
pera
ted in P
erc
enta
ge
Below 1 1-2 hectares 2-4 hectares 4-10 hectares 10 and above
The general trend even when stated in percentage terms is the same. Over the
period of past twenty years, 1970-71-1990-91, the percentage of land under small and
medium holdings has increased while the percentage of area operated under big
holdings i.e., ten and above hectares has come down, approximately from about 38
percent to 17 percent: this finding leads us to a generalisation that while substantive
land deconcentration has taken place there is still also significant land under big
holdings and that landlordism of whatever variety is prevalent.
Agrarian Change In India: A Case Study 7
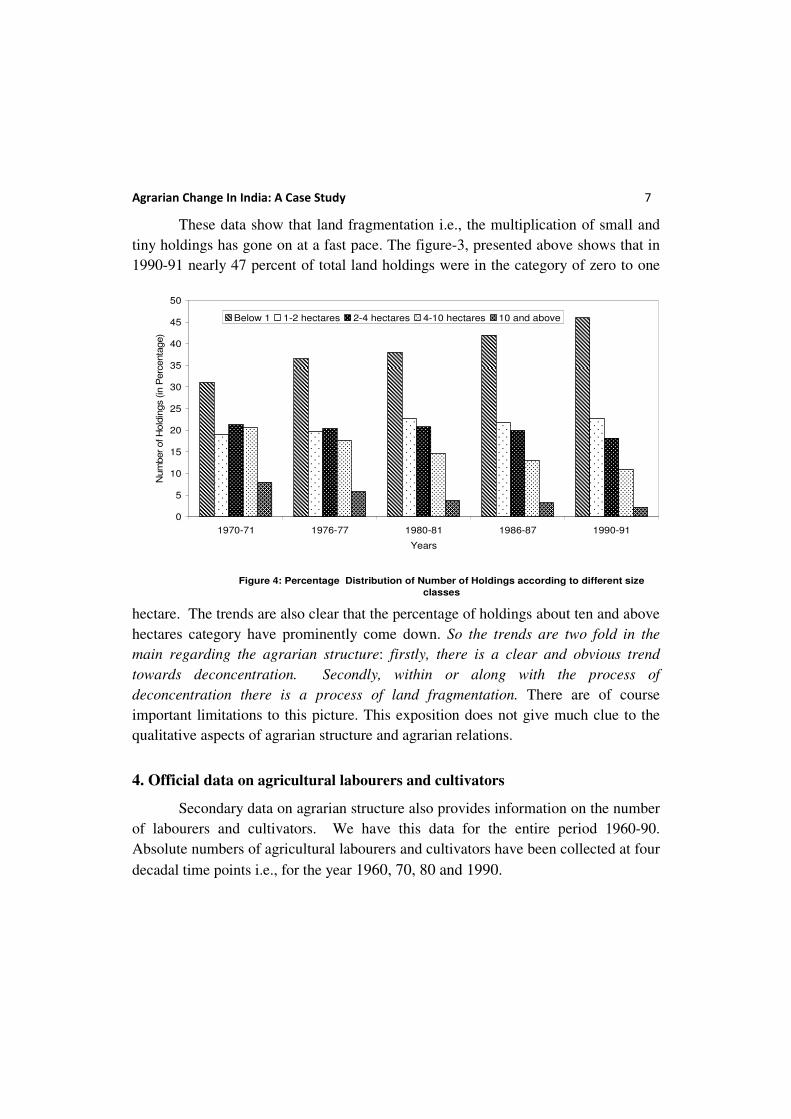
These data show that land fragmentation i.e., the multiplication of small and
tiny holdings has gone on at a fast pace. The figure-3, presented above shows that in
1990-91 nearly 47 percent of total land holdings were in the category of zero to one
hectare. The trends are also clear that the percentage of holdings about ten and above
hectares category have prominently come down. So the trends are two fold in the
main regarding the agrarian structure: firstly, there is a clear and obvious trend
towards deconcentration. Secondly, within or along with the process of
deconcentration there is a process of land fragmentation. There are of course
important limitations to this picture. This exposition does not give much clue to the
qualitative aspects of agrarian structure and agrarian relations.
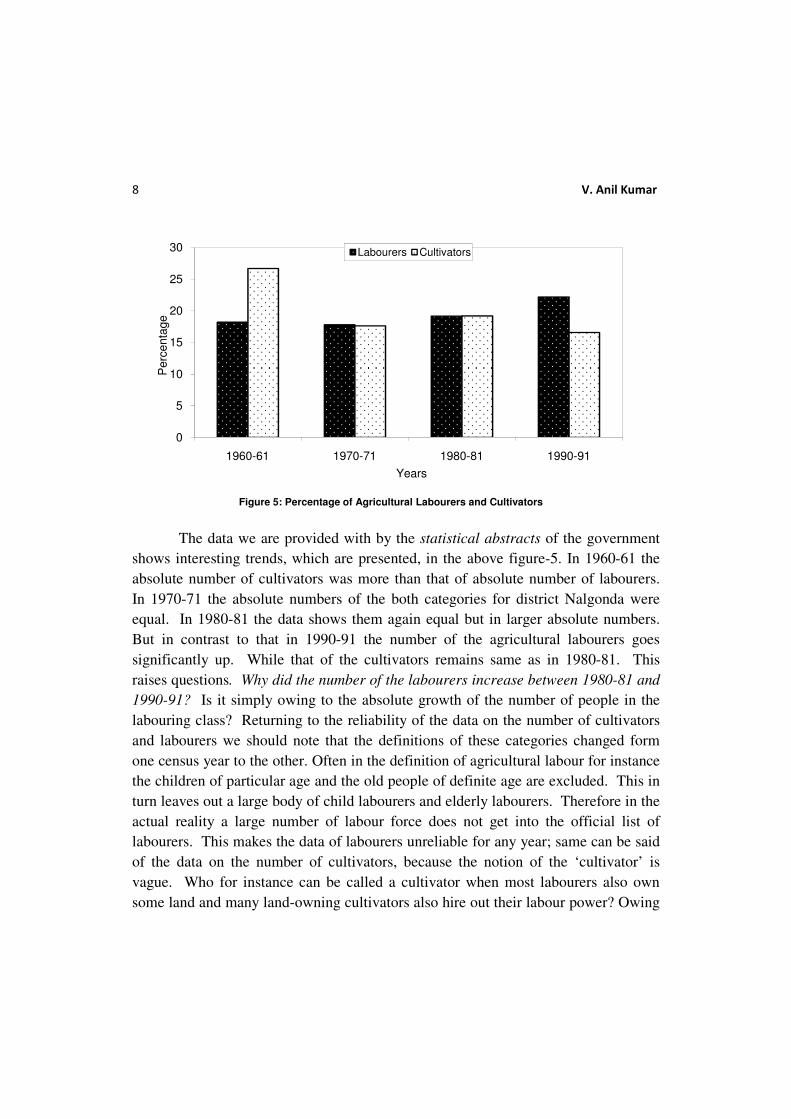
4. Official data on agricultural labourers and cultivators
Secondary data on agrarian structure also provides information on the number
of labourers and cultivators. We have this data for the entire period 1960-90.
Absolute numbers of agricultural labourers and cultivators have been collected at four
decadal time points i.e., for the year 1960, 70, 80 and 1990.
Figure 4: Percentage Distribution of Number of Holdings according to different size
classes
0
5
10
15
20
25
30
35
40
45
50
1970-71 1976-77 1980-81 1986-87 1990-91
Years
Num
ber of H
old
ings (in
Perc
enta
ge)
Below 1 1-2 hectares 2-4 hectares 4-10 hectares 10 and above
8 V. Anil Kumar
0
5
10
15
20
25
30
1960-61 1970-71 1980-81 1990-91
Perc
enta
ge
Years
Figure 5: Percentage of Agricultural Labourers and Cultivators
Labourers Cultivators
The data we are provided with by the statistical abstracts of the government
shows interesting trends, which are presented, in the above figure-5. In 1960-61 the
absolute number of cultivators was more than that of absolute number of labourers.
In 1970-71 the absolute numbers of the both categories for district Nalgonda were
equal. In 1980-81 the data shows them again equal but in larger absolute numbers.
But in contrast to that in 1990-91 the number of the agricultural labourers goes
significantly up. While that of the cultivators remains same as in 1980-81. This
raises questions. Why did the number of the labourers increase between 1980-81 and
1990-91? Is it simply owing to the absolute growth of the number of people in the
labouring class? Returning to the reliability of the data on the number of cultivators
and labourers we should note that the definitions of these categories changed form
one census year to the other. Often in the definition of agricultural labour for instance
the children of particular age and the old people of definite age are excluded. This in
turn leaves out a large body of child labourers and elderly labourers. Therefore in the
actual reality a large number of labour force does not get into the official list of
labourers. This makes the data of labourers unreliable for any year; same can be said
of the data on the number of cultivators, because the notion of the ‘cultivator’ is
vague. Who for instance can be called a cultivator when most labourers also own
some land and many land-owning cultivators also hire out their labour power? Owing

Agrarian Change In India: A Case Study 9
to these problems it is difficult to generalise on the agrarian change process relying on
the official data. Only a primary survey can give the true picture.
5. Impact of irrigation and water
Irrigation and availability of water is a major determinant of agrarian change
over time and the data on the pattern of irrigation too shows interesting trends. We
have data for the period 1957-1990. In Nalgonda district irrigation takes place
basically through three major means. They are: canals, tanks and open wells.
Though there is a boom of late in tube well sinking we do not have any data on that.
The canal irrigation in the district was minimal in 1957 and we see that it goes steeply
up during 1965-66. The land irrigated under canals increased rapidly during that
year. This is probably owing to the expansion of irrigation under the newly
constructed Nagarjuna Sagar Project. From 1966 onwards land irrigated through
canals remains steadily high, except during the year 1987-88 when canal irrigation
dips somewhat low. Otherwise there are only minor fluctuations in the canal
irrigation profile.
Irrigation under tanks on the other hand shows a decreasing trend. Not only
the land under tank irrigation declining, it is also prone to the greatest amount of
fluctuation. This is understandable because tanks are filled only by rainfall and the
rainfall fluctuates drastically for this district. We can see from the official statistics
that the land irrigated under the category ‘other wells’ is low but steadily increasing
during 1957-90. What appears from the above description of the trends is that for the
district as a whole the importance of tank irrigation has come down whereas the
importance of canal and electrified tube wells has increased. Which means that
besides canal irrigation there is increasing reliance on the ground water. A major
drawback with this data is that it does not give any scope for intra-district
comparisons. Given the fact that canals irrigate only a part of the district we are
compelled to understand that a major part of the district is exposed to vagaries of
nature.
6. The changes in crop pattern
Under the data on crop pattern we have the below figure-6. The trends in the
figure are for the period 1960-90. The graph showing the area sown under food and

10 V. Anil Kumar
non-food crops clearly tells that area under food crops is consistently larger than area
under non-food crops. While both are fluctuating over time, it appears that area under
food crops has fluctuated more than area under non-food crops. The data in the final
analysis tells that Nalgonda is a region where the growth of commercial or industrial
crops is much less when compared to the traditional food crops. The data also tells
that this has remained consistent over the period 1960-90. Though since early
eighties the gap has been closing in, it is still quite large.
One fact that stands out is that percentage of area under paddy cultivation
has gone up tremendously, while that of other food crop has come down. In
1960-61 the percentage of area under paddy cultivation was only around 17
percent, whereas in 1989-90 the percentage of area under paddy cultivation was
well above 37 percent. The percentage of area under jowar has steadily come
down since 1960. While in the percentage of area under jowar cultivation was
around 32 percent, the same in 1989-90 was around 12 percent. Among non-food
crops the percentage of area under castor cultivation has grown only modestly
from 15 percent to 23 percent. Considering the fact that castor is the only major
non-food commercial crop grown in the region increase in its production is
important.
From 1984-85 onwards there is slight, marginal appearance of cotton as
well on the scene. In 1989-90 the percentage of area under cotton cultivation of
the total area sown was around a moderate 20 percent: but this was a sign that in
future commercialisation of agriculture is going to play some role. The second
most important commercial crop grown in the region is groundnut. The
percentage of area under groundnut cultivation, though has seen an overall
increase, there has been much fluctuation in it: from 5 percent of the total area
sown in 1960 to groundnut cultivation rose to around 10 percent of the area in
1990. In between in 1978-79 groundnut cultivation has gone even up to 14
percent of the area but again fell down to around 7 percent of the area in 1984-85.
All in all, the trends in crop pattern for the district show that there has been a
marked increase in paddy cultivation. It has become a part-commercial part-food
crop. Other food crops such as bajra, jowar have declined in importance. This
indicates that in sum it is a food crop economy.

Agrarian Change In India: A Case Study 11
The discussion presented the macro trends in the district secondary data on
aspects of agrarian change as provided by official statistics; but do they reflect the
reality accurately? In order to ascertain an answer to this question, we conducted a
primary survey in semi- irrigated and irrigated parts of the district. The picture
that emerged is interesting and what emerges is quite contrasting to the one
presented above. In the following we discuss the data collected during the primary
survey and discuss its findings.
PART - II
6. A picture from primary statistical survey
To have a quantitative idea of the scenario of agrarian change, a primary
survey was conducted in four villages. A proportionate stratified random sample
of fifty households in each of the four villages in semi-irrigated region: Somaram
and Prajapalle, and in irrigated region, Yadpalle and Gudur, was taken7. The
sample comprised of five identified major agrarian classes: marginal peasants,
small peasants, middle peasants, rich peasants and landlords. The criterion for
defining classes was ownership of land8; The World Agricultural Census (WAC),
was the basis for the sample prepared. We like to reiterate here that it was the
sample based on WAC data not the entire data itself. The primary data was
collected by the scholar using interview schedule and interviewing peasants in the
field. WAC also provides data in acreage terms and the sample used herein is
based in the 1995-96 data of WAC for the region under study. This section of the
paper is dependent on oral history in a major way. The main sample was
prepared as a stratified proportionate random sample from the WAC data of
1995-96; and then, this sample derived from WAC data as peasant class holdings
in terms of land-holding was read backwards. That is, the sampled peasants were
asked to inform about their land ownership in 1960, 1970, 1980 and 1990. This
way the survey depends in a major way on recall data. While there might be some
looseness in recall data, this is the only way for us to collect primary data of land
ownership in the past. In that sense this section of the paper depends in a
significant way on oral history and peasant memory as presented in the recall
data.

12 V. Anil Kumar
The primary survey provides data on the above-mentioned aspects for
four decadal points (1960, 1970, 1980, 1990) covering the period, retrospectively
from 1960 to 1990. The primacy of primary survey can not be questioned because
primary data was collected from the field and was not borrowed from NSSO or,
Census and or from WAC.
While discussing the caste status of classes, which is discussed below, we
classified the different castes and sub castes into three categories: the Scheduled
Castes, the backward castes, and ‘other’ or upper castes. In the following we
present the discussion of survey results under four sub-headings, namely: i) Land
ownership pattern among different peasant classes; ii) Percentage distribution of
land among different peasant classes; iii) The average size of land holding among
different peasant classes and lastly, but importantly, iv). The caste composition of
different classes; Firstly we present the data for the semi-irrigated region then we
present the data for irrigated region.
Semi-irrigated region:
i) Pattern of land ownership among different classes in semi-irrigated region.
Basing on the data we generated during the primary survey we are able to
present two tables on pattern of land ownership and land control for both semi-
irrigated and irrigated regions: one, on land ownership pattern, the other, on
percentage distribution of land among various peasant classes. They are as follow.
Marginal peasants in the semi-irrigated region (33 sample households)
owned and controlled 26.38 acres in 1960 whereas in 1990 they owned and
controlled 33.28 acres. This is an increase of about 6.9 acres i.e., an increase of
about 20.9 percent.
Agrarian Change In India: A Case Study 13
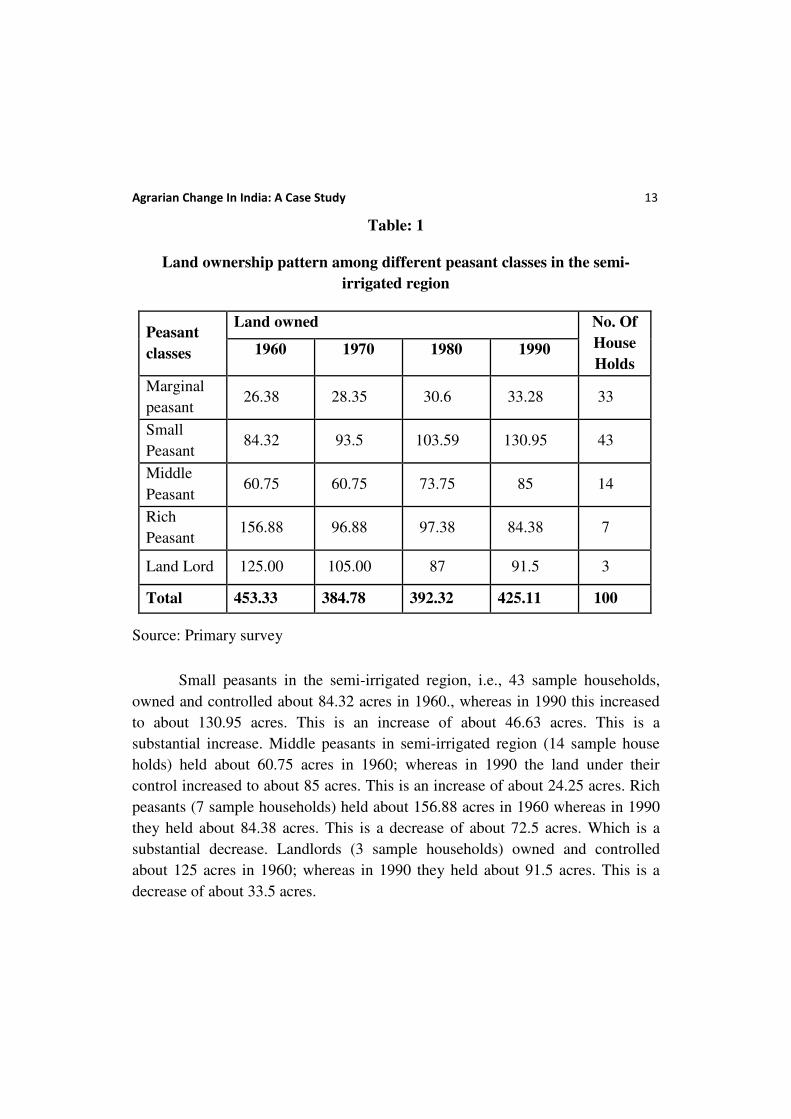
Table: 1
Land ownership pattern among different peasant classes in the semi-
irrigated region
Peasant
classes
Land owned No. Of
House
Holds 1960 1970 1980 1990
Marginal
peasant 26.38 28.35 30.6 33.28 33
Small
Peasant 84.32 93.5 103.59 130.95 43
Middle
Peasant 60.75 60.75 73.75 85 14
Rich
Peasant 156.88 96.88 97.38 84.38 7
Land Lord 125.00 105.00 87 91.5 3
Total 453.33 384.78 392.32 425.11 100
Source: Primary survey
Small peasants in the semi-irrigated region, i.e., 43 sample households,
owned and controlled about 84.32 acres in 1960., whereas in 1990 this increased
to about 130.95 acres. This is an increase of about 46.63 acres. This is a
substantial increase. Middle peasants in semi-irrigated region (14 sample house
holds) held about 60.75 acres in 1960; whereas in 1990 the land under their
control increased to about 85 acres. This is an increase of about 24.25 acres. Rich
peasants (7 sample households) held about 156.88 acres in 1960 whereas in 1990
they held about 84.38 acres. This is a decrease of about 72.5 acres. Which is a
substantial decrease. Landlords (3 sample households) owned and controlled
about 125 acres in 1960; whereas in 1990 they held about 91.5 acres. This is a
decrease of about 33.5 acres.

14 V. Anil Kumar
Certainly the above presented data shows that in the semi-irrigated region,
between 1960 and 1990 the first three peasant classes i.e., marginal peasants,
small peasants and middle peasants have increased land ownership while the rich
peasants and land lords have lost some land. The gains are substantial for small
and middle peasants while for marginal peasants the gain was not as substantive.
ii) Percentage distribution of land between classes in the semi-irrigated region
The marginal peasants of the semi-irrigated region in the sample owned
about 5.81percent of land in 1960. In1990 this increased to 7.82 percent. This was
a steady increase.
Table: 2
Percentage of distribution of land between various peasant classes in the
semi-irrigated region
Peasant classes 1960 1970 1980 1990
Marginal peasant 5.81 7.37 7.79 7.82
Small peasant 18.60 24.31 26.43 30.83
Middle Peasant 13.40 15.83 18.79 19.99
Rich Peasant 34.62 25.19 24.82 19.84
Land Lord 27.57 27.30 22.17 21.52
Total 100.00 100.00 100.00 100.00
Source: Primary survey
The small peasants of semi-irrigated region owned about 18.60 percent of
land in 1960; this increased to about 30.83percent in 1990.The middle peasants in
the semi-irrigated region owned land of about 13.40 percent in 1960 and this has
increased to about 19.99 percent in 1990.The rich peasants and landlords show a
Agrarian Change In India: A Case Study 15
different tendency. The rich peasants in the sample owned and controlled about
34.62 percent of land in 1960 and this has decreased to 19.84 percent in
1990.Landlords too have lost land. The landlords of the semi-irrigated region
were controlling land to the tune of 27.57 percent in 1960. This has decreased to
21.52 percent.
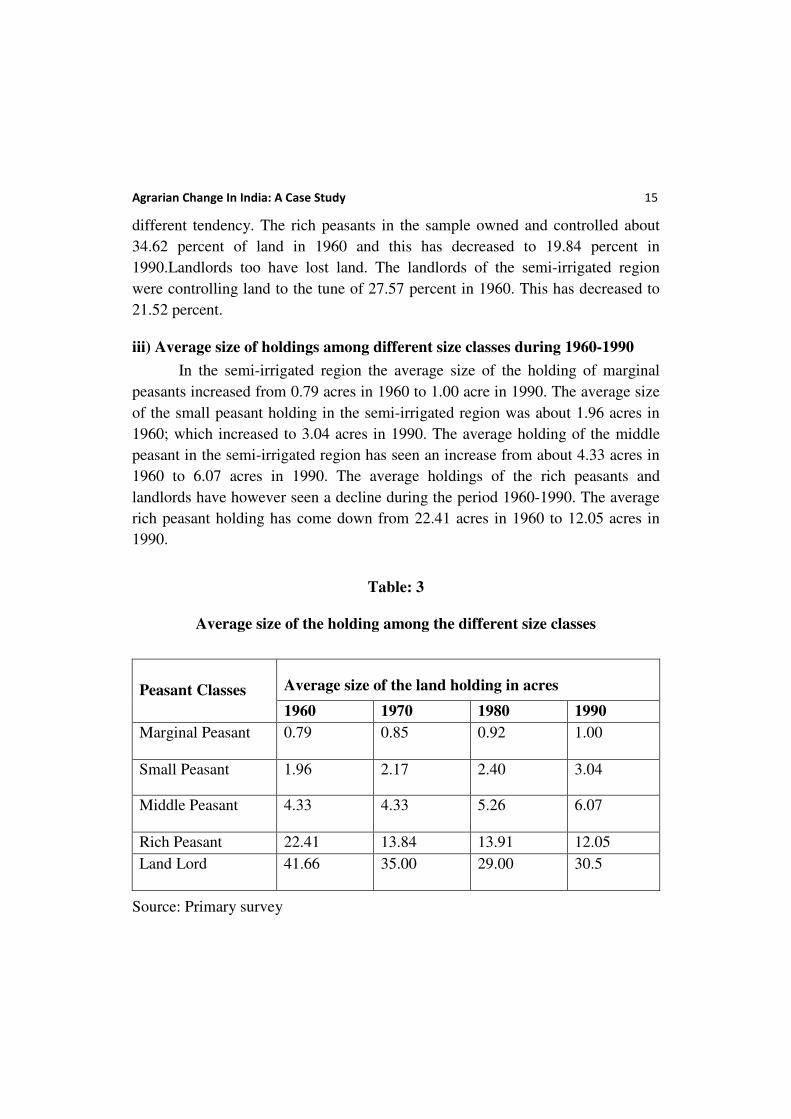
iii) Average size of holdings among different size classes during 1960-1990
In the semi-irrigated region the average size of the holding of marginal
peasants increased from 0.79 acres in 1960 to 1.00 acre in 1990. The average size
of the small peasant holding in the semi-irrigated region was about 1.96 acres in
1960; which increased to 3.04 acres in 1990. The average holding of the middle
peasant in the semi-irrigated region has seen an increase from about 4.33 acres in
1960 to 6.07 acres in 1990. The average holdings of the rich peasants and
landlords have however seen a decline during the period 1960-1990. The average
rich peasant holding has come down from 22.41 acres in 1960 to 12.05 acres in
1990.
Table: 3
Average size of the holding among the different size classes
Peasant Classes Average size of the land holding in acres
1960 1970 1980 1990
Marginal Peasant 0.79 0.85 0.92 1.00
Small Peasant 1.96 2.17 2.40 3.04
Middle Peasant 4.33 4.33 5.26 6.07
Rich Peasant 22.41 13.84 13.91 12.05
Land Lord 41.66 35.00 29.00 30.5
Source: Primary survey

16 V. Anil Kumar
The average size of the holding of the landlords too decreased from 41.66
acres in 1960 to 30.5 acres in 1990. These trends are consistent with the trends
discussed in the official data in the previous section.
iv. Class and caste composition in the semi-irrigated region
In the semi-irrigated region, among 33 marginal peasant households, 15
households belonged to scheduled castes and 18 households belonged to
backward castes. There was no single ‘other caste’ or upper caste household
among the marginal peasants. Marginal peasant class totally consisted of
scheduled castes and backward castes. Among the small peasant class house holds
(out of a total 43 house holds) 6 belonged to scheduled castes, 29 belonged to
backward caste grouping and 8 belonged to ‘other castes’ or upper castes.
Table: 4
Class/caste composition in the sample in the semi-irrigated region
Peasant
Class
Scheduled
Caste
Backward
Caste (classes)
Other Castes
(Forward
Castes)
Total
Househ
olds Househol
ds %
Househol
ds %
Househol
ds %
Marginal
Peasants 15 45.45 18 54.55 0 0 33
Small
Peasants 6 13.95 29 67.45 8
18.
60 43
Middle
Peasants 1 7.15 11 78.57 2
14.
28 14
Rich
Peasants 0 0 2 28.57 5
71.
43 7
Land Lords 0 0 0 0 3 100 3
Total 22 60 18 100
Source: Primary survey

Agrarian Change In India: A Case Study 17
Among the middle peasant class house holds in the semi-irrigated region
(out of the total sample 14 house holds) only one belonged to the scheduled caste,
11 belonged to the backward caste and 2 belonged to the ‘other castes’ or upper
castes. In the rich peasant class households (out of the 7 sample households) none
belonged to the scheduled caste and only 2 belonged to the backward castes. Rest
of the five belonged to the other or upper castes. Among the landlords the
presence of scheduled and backward castes is nil. All the three landlords
interviewed belonged to the ‘other’ or upper castes.
Irrigated region:
i) Land ownership pattern among different peasant classes
In the two villages of irrigated region discussed below the data we
gathered through primary survey shows different and mixed trends. Land
ownership pattern presented in Table -5 for five different classes shows that
marginal peasants in the irrigated region (39 sample households) owned and
controlled 24.9 acres in 1960; whereas in 1990 the land they controlled was about
25.70 acres. This was only a marginal increase of about 0.8 acres. Small peasants
(40 sample households) held about 77.7 acres in 1960. In1990 they held and
controlled about 67.32 acres. This is a drop of 10.37 acres. The small peasants
have in fact between 1960 and 1990 lost some of their land. Middle peasants (11
sample households) in the irrigated region owned and controlled land of about
30.78 acres in 1960. In 1990 they held land of about 39.94 acres. This is a gain by
middle peasants of about 9.16 acres. Rich peasants in the irrigated region (6
sample households) owned and controlled 113.52 acres in 1960; whereas in 1990
they controlled only 58.50 acres. Here is a drop of about 55.02 acres of land
ownership. Landlords in the irrigated region (4 sample households) controlled 84
acres in 1960; whereas in 1990 they controlled about 94 acres. This is a gain of
about 10 acres. Landlords have obviously gained during the period, 1960-1990 in
the irrigated region.
18 V. Anil Kumar
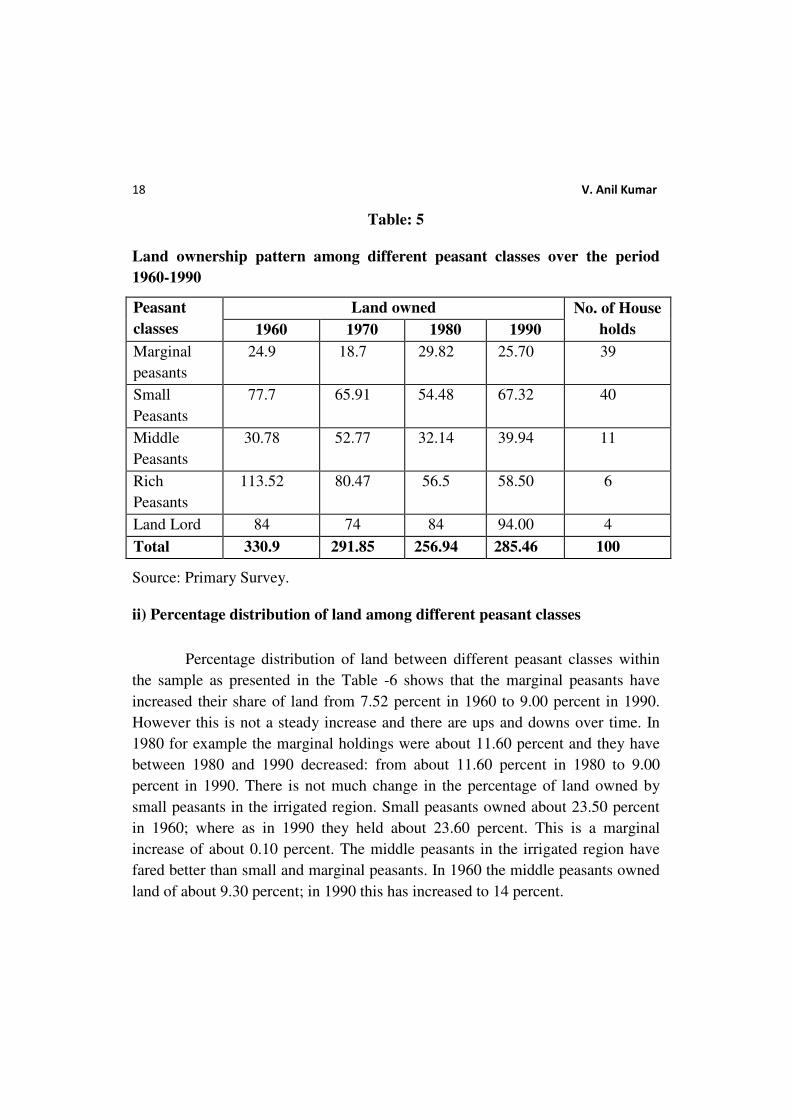
Table: 5
Land ownership pattern among different peasant classes over the period
1960-1990
Peasant
classes
Land owned No. of House
holds 1960 1970 1980 1990
Marginal
peasants
24.9 18.7 29.82 25.70 39
Small
Peasants
77.7 65.91 54.48 67.32 40
Middle
Peasants
30.78 52.77 32.14 39.94 11
Rich
Peasants
113.52 80.47 56.5 58.50 6
Land Lord 84 74 84 94.00 4
Total 330.9 291.85 256.94 285.46 100
Source: Primary Survey.
ii) Percentage distribution of land among different peasant classes
Percentage distribution of land between different peasant classes within
the sample as presented in the Table -6 shows that the marginal peasants have
increased their share of land from 7.52 percent in 1960 to 9.00 percent in 1990.
However this is not a steady increase and there are ups and downs over time. In
1980 for example the marginal holdings were about 11.60 percent and they have
between 1980 and 1990 decreased: from about 11.60 percent in 1980 to 9.00
percent in 1990. There is not much change in the percentage of land owned by
small peasants in the irrigated region. Small peasants owned about 23.50 percent
in 1960; where as in 1990 they held about 23.60 percent. This is a marginal
increase of about 0.10 percent. The middle peasants in the irrigated region have
fared better than small and marginal peasants. In 1960 the middle peasants owned
land of about 9.30 percent; in 1990 this has increased to 14 percent.

Agrarian Change In India: A Case Study 19
The rich peasants of the irrigated region however have shown a trend
different from that of middle peasants. In 1960 the rich peasants held land of
about 34.30 percent. In 1990 this has decreased to 20.50 percent. The landlords
however have increased their land ownership between 1960 and 1990. They held
about 25.38 percent in 1960. I n 1990 this was about 32.90 percent. That means
there is an increase in land ownership by landlords, particularly in the irrigated
region. The situation becomes clearer when we look at the average size of the
holding among the peasant classes.
Table: 6
Percentage of distribution of land between various peasant classes over the
period 1960-1990
Peasant Classes 1960 1970 1980 1990
Marginal Peasants 7.52 6.40 11.60 9.00
Small Peasants 23.50 22.60 22.20 23.60
Middle Peasants 9.30 18.08 12.53 14.00
Rich Peasants 34.30 27.57 21.98 20.50
Land Lords 25.38 25.35 32.69 32.90
Total 100 100 100 100
Source: Primary survey.
iii) The average size of holding among different peasant classes
The average size of holding among five peasant classes provided in Table -
7 shows that the average size of the holding among the marginal peasants of this
irrigated region has increased from 0.63 acres in 1960 to 0.65 acres in 1990.This
increase is too small to call it an increase indeed. The middle peasant holdings
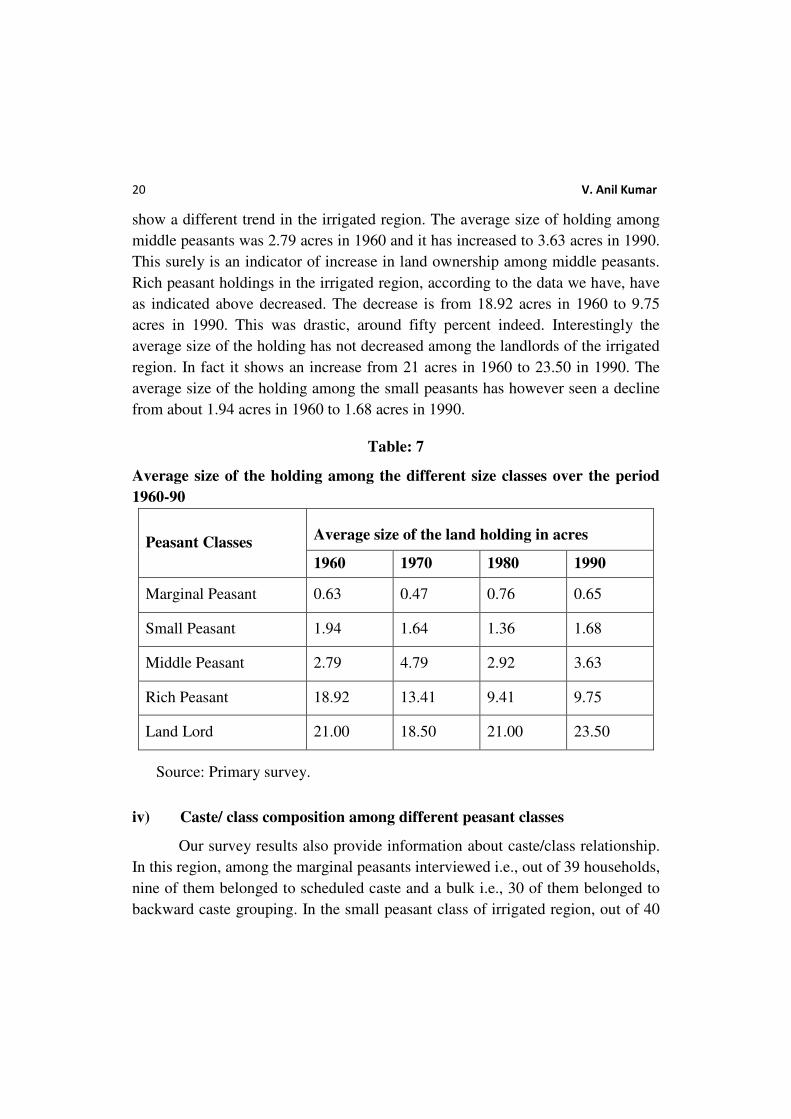
20 V. Anil Kumar
show a different trend in the irrigated region. The average size of holding among
middle peasants was 2.79 acres in 1960 and it has increased to 3.63 acres in 1990.
This surely is an indicator of increase in land ownership among middle peasants.
Rich peasant holdings in the irrigated region, according to the data we have, have
as indicated above decreased. The decrease is from 18.92 acres in 1960 to 9.75
acres in 1990. This was drastic, around fifty percent indeed. Interestingly the
average size of the holding has not decreased among the landlords of the irrigated
region. In fact it shows an increase from 21 acres in 1960 to 23.50 in 1990. The
average size of the holding among the small peasants has however seen a decline
from about 1.94 acres in 1960 to 1.68 acres in 1990.
Table: 7
Average size of the holding among the different size classes over the period
1960-90
Peasant Classes Average size of the land holding in acres
1960 1970 1980 1990
Marginal Peasant 0.63 0.47 0.76 0.65
Small Peasant 1.94 1.64 1.36 1.68
Middle Peasant 2.79 4.79 2.92 3.63
Rich Peasant 18.92 13.41 9.41 9.75
Land Lord 21.00 18.50 21.00 23.50
Source: Primary survey.
iv) Caste/ class composition among different peasant classes
Our survey results also provide information about caste/class relationship.
In this region, among the marginal peasants interviewed i.e., out of 39 households,
nine of them belonged to scheduled caste and a bulk i.e., 30 of them belonged to
backward caste grouping. In the small peasant class of irrigated region, out of 40
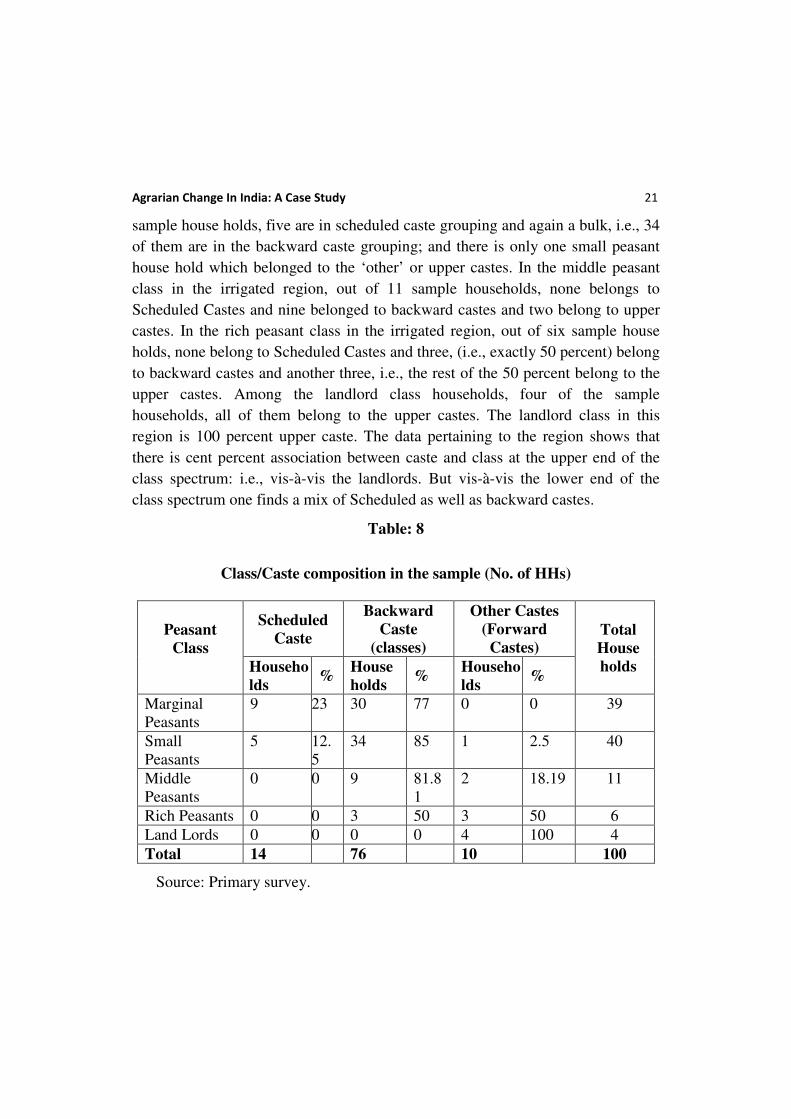
Agrarian Change In India: A Case Study 21
sample house holds, five are in scheduled caste grouping and again a bulk, i.e., 34
of them are in the backward caste grouping; and there is only one small peasant
house hold which belonged to the ‘other’ or upper castes. In the middle peasant
class in the irrigated region, out of 11 sample households, none belongs to
Scheduled Castes and nine belonged to backward castes and two belong to upper
castes. In the rich peasant class in the irrigated region, out of six sample house
holds, none belong to Scheduled Castes and three, (i.e., exactly 50 percent) belong
to backward castes and another three, i.e., the rest of the 50 percent belong to the
upper castes. Among the landlord class households, four of the sample
households, all of them belong to the upper castes. The landlord class in this
region is 100 percent upper caste. The data pertaining to the region shows that
there is cent percent association between caste and class at the upper end of the
class spectrum: i.e., vis-à-vis the landlords. But vis-à-vis the lower end of the
class spectrum one finds a mix of Scheduled as well as backward castes.
Table: 8
Class/Caste composition in the sample (No. of HHs)
Peasant
Class
Scheduled
Caste
Backward
Caste
(classes)
Other Castes
(Forward
Castes) Total
House
holds Househo
lds %
House
holds %
Househo
lds %
Marginal
Peasants
9 23 30 77 0 0 39
Small
Peasants
5 12.
5
34 85 1 2.5 40
Middle
Peasants
0 0 9 81.8
1
2 18.19 11
Rich Peasants 0 0 3 50 3 50 6
Land Lords 0 0 0 0 4 100 4
Total 14 76 10 100
Source: Primary survey.
22 V. Anil Kumar
7. Discussion of primary survey results
Firstly, the trends in the secondary data and data from primary survey
pertaining to semi-irrigated region clearly indicate that the land owned and
controlled by marginal, small and middle peasants has increased while that of the
rich peasants and landlords has declined. The data we generated in the two semi-
irrigated villages clearly coincides with the official data. The trends in primary
data, which show that there is a deconcentration of land ownership in the semi-
irrigated region, are consistent with the official statistics. The marginal, small and
middle peasants who have improved their land ownership also consist of major
chunk of backward and even scheduled castes. The tables on class-caste
composition clearly bring out that the rich peasants and landlords whose land
ownership has declined belong to upper castes. Here class and caste overlap. In
the semi-irrigated region those who have declined in land ownership over the
period 1960-1990 not only belong to rich peasant and landlord classes but also to
upper castes.
Secondly, in the irrigated region the trends brought out are mixed but here
is a case for strengthening of landlords. The data pertaining to the irrigated region
show that there is cent percent association between caste and class at the upper
end of the class spectrum: ie., vis-à-vis the landlords. But vis-à-vis the lower end
of the class spectrum one finds a mix of scheduled as well as backward castes.
Thirdly, a word may be needed about the semi-irrigated region. The semi-
irrigated region is statistically more important for Nalgonda than the other
regions: irrigated and totally unirrigated; because it is geographically large part of
the district. This probably explains that why in the secondary data discussed in the
i.e., in the official statistics the trends of deconcentration are so starkly prominent.
It is possible that the significant presence of the data of the large semi-irrigated
region, which gives the official, land related statistics the trend of deconcentration
in the entire district.
8. Conclusion
In the foregoing we have presented both the official statistics and statistics
generated through primary survey. The official data clearly shows the trends
towards deconcentration and fragmentation of land holdings for the entire district.
Agrarian Change In India: A Case Study 23
This means that during the period 1970 to 1990 the small and marginal holdings
have proliferated in Nalgonda secularly all over the district. This view however is
found to be misleading .The primary survey shows that while there is
strengthening of small and marginal holdings in semi-irrigated region, in the
irrigated region, on the other hand, there is a strengthening of upper caste
landlords. Thus the general picture presented for the whole of the district by
official statistics is debatable. These being the case, the governments and social
scientists using the official data at State and national levels, have to take the data
with caution. But what if the official statistics are not portraying reality, as they
should? The point is that official statistics feed into official policies, which affect
people. Therefore they need to be as closer to the truth as possible. Different data
can lead officials and social scientists to different policy decisions and advice. For
example in the case discussed in this paper the information about land inequality
despite deconcentration and fragmentation of holdings can lead to the
consideration, given ideal circumstances, of measures of land reform. And also it
can lead to the consideration of the fact that irrigation can have the effect of
strengthening pre-existing inequalities and therefore can lead the government to
consider equity measures along with improving irrigation. Or conversely the
proliferation of small holdings in the large semi-irrigated region ought to propel
governments to take policy measures to protect the survival of the marginal, small
and middle peasants particularly in present circumstances when the cases of
farmers’ suicides are frequently reported9.
End Notes
1. Dobb, Maurice(1963) Studies in the Development of Capitalism(New York: International
Publishers)pp 6-7.
2. V.I. Lenin, The Development of Capitalism in Russia, (Moscow: Progress Publishers 1956).
3. Athar Hussain and Keith Tribe, (eds.) Fowkes, Ben (translations), Paths of Development In
Capitalist Agriculture: Readings from German Social Democracy, 1891-99, (London:
Macmillan, 1984).
4. Utsa Patnaik (ed.)., Agrarian Relations and Accumulation: The ‘Mode of Production’ Debate in
India, (Bombay: Sameeksha Trust and Oxford University Press, 1990).
5. T.H.Aston and C.H.E. Philipin (eds.), The Brenner Debate: Agrarian Class Structure and
Economic Development in Pre-Industrial Europe, (Cambridge: Cambridge University Press,
1985).
24 V. Anil Kumar
6. The Statistical Abstracts are prepared mainly from Indian national Census data and other official
sources such as World Agricultural Census and land revenue department of government of
Andhra Pradesh. Our focus in this paper is 1960 to 1990 and therefore largely dependent on
Censuses of that period. We intend to contrast this secondary data with primary data collected
from the field.
7. The peasant size classes are derived in the same manner as in the secondary data so that they are
comparable. The village names adopted are pseudonyms of the villages and not real names.
8. Land ownership has both economic and non-economic aspects associated with it; such as income,
social status and social prestige, political clout to generate patronage and so on. The non-
economic parameters of land ownership are as, if not more, important than economic parameters.
This is particularly so with the case of irrigated areas where both economic and non-economic
parameters are very, very significant.
9. These aspects are important given the huge emphasis that the present government of Andhra
Pradesh is paying towards irrigation; and given the magnitude and complexity of the problem of
farmers’ suicides taking place in several States of India including Andhra Pradesh. The agrarian
policies therefore crucially matter regarding the well being of the farmers. As Prof. Utsa Patnaik
puts it in one of her writings ‘what is cooked in the kitchen [i.e., agricultural sector] is largely
determined [by the policies] outside the kitchen’.
References
Allen, Tim and Alan Thomas. (2000). Poverty and Development into the Twenty First Century.
(Oxford: Oxford University Press,
Aston T.H, and C.H.E. Philipin., (Eds).. 1985). The Brenner Debate: Agrarian Class Structure and
Economic Development in Pre-Industrial Europe. (Cambridge : Cambridge University Press,
Bardhan, Pranab.,(Ed).. (1989). Conversations Between Economists and Anthropologists:
Methodological Issues in Measuring Economic Change in Rural India. (Delhi: Oxford
University Press,
Breman, J. et al., (Eds). (1997).. The village in Asia Revisited. (Delhi: Oxford University Press,
Breman, J. and Sudipto Mundle ., (Eds). (1991).. Rural Transformation in Asia. (Delhi: Oxford
University Press
Bulmer, M. and D.P. Warwick ., (Eds).. (1993).Social Research in Developing Countries: Surveys and
Censuses in the Third World. (London: UCL Press
Byres, T.J. Political Economy, Agrarian Question and Comparative Method (1995). Economic and
Political Weekly, 30 (10),. pp507-513.
Corbridge, Stuart. (1995)Development Studies: A Reader. (London: Arnold,.
Dobb, M. (1963). Studies in the Development of Capitalism. New York: International Publishers.

Agrarian Change In India: A Case Study 25
Frankel, F.R. and M.S.A.Rao., eds.. (1989).Dominance and State Power in Modern India: Decline of a
Social Order. 2 Vol.s. (Delhi: Oxford University Press,
Hart, G. et al.,eds.. (1989). Agrarian Transformations: Local Processes and the State in Southeast Asia.
(Berkeley: University of California Press,
Harvey, Lee, (1990). Critical Social Research. (London: Unwin Hyman,
Hill, P.. (1984)The Poor Quality of Official Socio-Economic Statistics Relating to the Rural Tropical
World: With Special Reference to South Asia. Modern Asian Studies, 18 (3), ,pp 491-514.
Hilton, Rodney.(Ed). (1978).The Transition from Feudalism to Capitalism. ( London: Verso,
Hussain Athar, and Keith Tribe. (Eds.) (Fowkes, Ben. Translations). (1984). Paths of Development In
Capitalist Agriculture: Readings from German Social Democracy, 1891-99, (London:
Macmillan,
Kumar, Dharma.. (1965).Land and Caste in South India. (Cambridge: Cambridge University Press,
Lanjouw, P. and Nicholas Stern.,(Eds). (1998). Economic Development in Palanpur Over Five
Decades. (Delhi: Oxford University Press.
Marx ,Karl,. (1964). Pre-Capitalist Economic Formations. (London: Lawrence and Wishart,
Mendelsohn, O.. (1993)The Transformation of Authority in Rural India. Modern Asian Studies, 27(4),
,pp 805-842.
Patel, S.J.. (1952).Agricultural Labourers in Modern India and Pakistan. (Bombay : Current Book
House,
)Patnaik, Utsa. (1983 On the evolution of the class of agricultural labourers in India. Social Scientist,
11(7), ,pp 3-24.
Patnaik, Utsa, (ed), (1990).. Agrarian Relations and Accumulation: The ‘Mode of Production’ Debate
in India. (Delhi: Oxford University Press,
Patnaik, Utsa.. (1987). Peasant Class Differentiation: A Study in Method With Reference to Haryana.
(Delhi: Oxford University Press,
Patnaik, Utsa.. (1986).The Agrarian Question and the Development of Capitalism in India. (Delhi:
Oxford University Press,
Rudra, Ashok.. (1989). “Field Survey Methods”. In: Pranab Bardhan, (eds) Conversations Between
Economists and Anthropologists: Methodological Issues in Measuring Economic Change in
Rural India. (Delhi: Oxford University Press,
Schendel, W.V.. (1991). Three Deltas: Accumulation and Poverty in Rural Burma, Bengal and South
India. (New Delhi: Sage Publications,
Shanin, T.. (1972).The Awkward Class: Political Sociology of Peasantry in a Developing Society,
Russia-1910-1925. (Oxford: Clarendon Press,

26 V. Anil Kumar
Shanin, T.,(Ed).. (1987).Peasants and Peasant Societies . (Oxford Blackwell Publishers,
Shanin, T. (1990).Defining Peasants: Essays Concerning Rural Societies, Expolary Economics, and
Learning from the Contemporary World. (Oxford: Basil Blackwell,
Srinivas, M.N.. (1992).On Living in a Revolution and Other Essays. (Delhi: Oxford University Press,
Srinivas, M.N.. (1966).Social Change in Modern India. (Berkeley: University of California Press,
Srinivas, M.N.. (1991). The Remembered Village. (Delhi: Oxford University Press
Srinivas, M.N.. (1996). Village, Caste, Gender and Method : Essays in Indian Social Anthropology.
(Delhi: Oxford University Press,
Srinivas, M.N., (Ed). 1996). Caste : Its Twentieth Century Avatar. (New Delhi: Viking, Penguin Books
India.
Srinivas, M.N., et al (Eds).,. (1979).The Field Worker and the Field: Problems and Challenges in
Sociological Investigation. (Oxford University press. Delhi,
Thorner, Alice., (Ed).. (2001). Land, Labour and Rights: 10 Daniel Thorner Memorial Lectures. New
Delhi: Tulika Books,
Thorner, D. and Alice Thorner.. (1962).Land and Labour in India. Bombay: (Asia Publishing House,
Thorner, D. and Alice Thorner.. (1980). The Shaping of Modern India. (Bombay: Sameeksha Trust and
Allied Publishers,
Thorner, D., (1956).. The Agrarian Prospect in India: Five Lectures on Land Reform. (Delhi: Delhi
School of Economics, Delhi University Press,
Varshney, A., ,(1995).. Democracy, Development and Countryside: Urban-Rural Struggles in India.
(New York: Cambridge University Press
Walicki, A. (1969).. The Controversy over Capitalism: Studies in the Social Philosophy of the Russian
Populists. (Oxford: Clarendon Press,
���


![Journal of Agrarian Change, Vol. •• No. ••, •• 2014, pp ... · Journal of Agrarian Change, Vol. •• No. ••, •• 2014, pp ... ... 2006 [1991]),](https://img.pdfslide.us/doc/110x75/5e6ad05555b1ed3f7c6f345d/journal-of-agrarian-change-vol-aa-no-aa-aa-2014-pp-journal.jpg)