Embed Size (px)
Citation preview
1AnnuAl RepoRt 2012 - AGR Petroleum Services Holdings AS
Annual Report 2012
AGR Petroleum Services Holdings AS

2AnnuAl RepoRt 2012 - AGR Petroleum Services Holdings AS
Content
03 Director’sReport
7 ConsolidatedIncomeStatement
9 Consolidatedstatementoffinancialposition
11 ConsolidatedstatementofchangesinEquity
12 Consolidatedstatementofcashflow
14 Notes
54 Incomestatement
55 BalanceSheet
57 StatementofCashflow
58 Notes
71 Auditor’sReport
3AnnuAl RepoRt 2012 - AGR Petroleum Services Holdings AS
Director’s Report 2012AGR Petroleum Services Holdings AS Comp. reg. no: 982 254 477
AGR Petroleum Services Holdings AS is the ultimate parent company of all AGR Petroleum Services companies (the Group) and its main activity is to act as the owner of the shares in the companies.
TheGroupisaleadingsupplierofservicestotheglobaloilandgasindustry.ThemainoperationsarebasedinOslo,withotherofficesaroundtheworld,includingStavanger,Trondheim,Aberdeen,Guilford,Houston,Perth,Moscow,Dubai,AbuDhabiandTelAviv.TheGroupprovidesexpertiseandservicestoseveraloftheworld’smajoroilandgasfields,withacustomerbasecomprisingseveralsmallandmediumsizedoperators,aswellasanumberoflargeinternationaloilcompaniesandNOCs.Attheendof2012,theGrouphad648professionals,whereof285permanentemployees,7projectemployees,336contracted-instaffand20associates.TheannualturnoverwasNOK1255million.
OPERATIONS
TheGroupdeliversabroadserviceofferingwithinreservoirevaluations,wellplanning,welloperationsandintegratedfieldmanagementtotheupstreamoilandgasindustry.Itscorecompetenciesincludegeology,geophysics,petrophysics,reservoirandpetroleumengineering,wellconstruction,drillingmanagement,completiondesignandinstallation,fielddevelopmentplanning,riskandeconomicsevaluation.TheGroupalsodeliversabroadtrainingportfoliowithinthesescopes,aswellasasuiteofsoftwaresolutionsforefficientplanningandexecutionofthewelldeliveryprocess.TheservicesareofferedregionallybyregionalbusinesscentersestablishedinNorway,UnitedKingdom,USA,Russia,UnitedArabicEmiratesandAustralia.
TheGroupalsodeliversabroadtrainingportfoliowithinthesetopics,aswellasasuiteofsoftwaresolutionsforefficientplanningandexecutionofthewelldeliveryprocess.TheservicesareofferedregionallybyregionalbusinesscentersestablishedinNorway,UnitedKingdom,USA,Russia,UnitedArabicEmiratesandAustralia.
During2011theGroupestablishedAGREnergyandgrewitthrough2012.ThiscompanyisOperatorofseverallicenses
inIsrael,holding5%ofeachlicense.ThisnewbusinesslineisbringingtogetherseveralofAGR’sareasofexpertiseandenablingAGRtotakeastakeinthelicenseswherethatisrequired.
In2012theGroupimplementedanumberofsignificantstrategicchangesandsecuredanumberofcontractsensuringthebasisforlong-termsustainablegrowthofthebusiness.Despiteahighactivitylevelthroughout2012,theEBITDAfor2012endedatNOK129millionandisdownfromNOK155millionin2011.ThedeclineoftheEBITDAwasmainlyrelatedtotheactivitymixwherethemajorityofactivityfor2ndhalfoftheyearwasplanningforfuturewelloperationsandan8NOKmilliongroupchargeinQ42012whichwasnotincludedin2011.In2012thebusinessspudded11wellsandhasintotalspudded474wellsthelasttwelveyears.
InQ22012theGroupacquired80%ofthesharesinSteinsvik&CoAS.ThecompanyofferssafetycoachingandotherHSErelatedservicesrelatedtodrillingoperations.ThisstrengthenedtheGroup sHSEandRiskManagementofferingsbyaddingnewservicesandmorecapacitywithadditional23professionalstotheportfolioofservices.HSE&RiskManagementserviceswillbeakeypartofthebusinessportfolioandgrowthinthefuture.
CONTINUEDOPERATION
TheGroupwasat31December2012fundedunderafinancingagreementtogetherwiththeultimateparentcompanyAGRGroupASAandotherAGRcompaniesunderAGRDrillingServices.ThedebtissecuredbypledgeandAGRPetroleumServicescompaniesthataredefinedasobligorsunderAGR’sloanagreementarejointlyandseverallyliableforthedebt.
Towardstheendof2012,theGroupstartedtheprocessofrenewingitsloanfacilityseparatefromitsParentcompanyandotherAGRcompanies.ThisprocesswassuccessfullyconcludedinJanuary2013withasecuredbondissueintheamountofNOK550millionintheNorwegianbondmarketwithmaturityinFebruary2018.Thebondwillbeusedtorefinanceexistingdebtandforgeneralcorporatepurposes.
ThisenablestheGrouptoseekstrategicalternativesseparatefromAGRDrillingServices.UndertheleadershipofÅgeLandro,theGroupisreadytoseekfurthergrowth
4AnnuAl RepoRt 2012 - AGR Petroleum Services Holdings AS
asastand-aloneGroup.Asapartofthiswork,theBoardoftheparentcompanyAGRGroupASAhasapprovedalegaldemergerthatissubjecttofinalapprovaloftheGeneralmeetingattheendofMay2013.
TheGrouphadfinancialcovenantsrelatedtoitspreviousloanagreements.Duetodispositionsrelatedtotherefinancingprocessthathasnowbeenfinalized,someofthefinancialcovenantsunderthepreviousloanagreementeffectiveperQ42012wereintechnicalbreach.
TheBoardofAGRPetroleumServicesHoldingsAShasconsideredthefactorsaboveinrelationtocontinuedoperationsandconcludedthatinaccordancewiththeAccountingAct§3-3a,weconfirmthatthefinancialstatementshavebeenpreparedundertheassumptionofagoingconcern.
WORKINGENVIRONMENTANDPERSONNEL
During2012,theGrouphadzeroincidentsresultinginabsenceandzeromedicaltreatmentincidents.Hence,thefrequencyoflosttimeinjuriesandaccordinglythefrequencyofpersonnelinjuriespermillionworkinghours(H-value/H2-value)waszero.
Averageillnessrelatedabsenceduring2012was1.1%correspondingto1072days.Thisissimilarto2011andconsideredverylow.Therearesomevariationsbetweentheregions,Norway3.7%,UK0.4%,AP0.5%,Moscow2.6%andAmericas0.4%.
GENDEREQUALITY
Asof31December2012theBoardofAGRPetroleumServicesHoldingsAShad3BoardMembersofwhichnonewerewomen.
TheGroupaspirestobeanattractiveemployerforpeoplewithdifferentbackgrounds,regardlessoftheirethnicity,gender,religionorage.Initspolicy,thecompanyhasimplementedconditionstoensureequalopportunitiesinareassuchassalary,promotionandrecruitment.Thecompetenceprincipleisdecisiveinallappointmentprocesses.Inadepartmentwhereonegenderisheavilyunder-represented,thisistakenintoaccountduringtheappointmentprocessifotherqualificationsareotherwiseequal.Inconnectionwiththeyearlysalaryevaluation,attentionisshowntopossibleinequalityregardingaveragelevelofpayformenandwomen.TheGroupprovidesequalpayforequalworkandrewardsgoodresults.
ENVIRONMENTALREPORTING
TheGroup’sactivitiesthateffecttheenvironmentaremanagedbymeansofwellestablishedsystemsandprocessesinordertoidentifyandeliminateorreduceanynegativeimpact,andtoensure,asaminimum,compliancewithlegislationandregulationssetoutbytheauthorities.Theenvironmentalaspectsofouractivitiesareidentifiedandmanaged.TheGroupaimstofacilitatethecontinuousenvironmentalimprovementinouroperationsbyadoptingtheprinciplesofISO14001:2007,internationalstandardforenvironmentalmanagement,andanincreasingpartoftheGroup sbusinessarebeingcertified.Internalcontrolactivitieshavebeenconductedtoverifycompliance.
MARKETOUTLOOK
Themarketoutlookfor2013andbeyondisverystrong.Theindustryisfacinghighdemandfordrillingofwells,whileatthesametimethereisashortageofcapacityinthemarket.Insuchamarket,trackrecordisvital.TheGrouphasdrilled474wellsduringthelast12yearsandiswellpositionedtooffercostefficientwelloperationstotheglobaloil&gasindustry.Ourexperienceisexpectedtobeinhighdemandgoingforward,asdrillingefficiency,costefficiencyandsafetyduringdrillingoperationswillbekeyforoilcompaniestodeliverontheirexplorationplans.
Enteringinto2013,thebusinesshasastrongsecuredorderbacklogofdrillingoperations.Thisisspeciallythecasewithinitsmostimportantregions.Atyearend2012thebusinesswasworkingonwellplanningandpreparationworkfor2013operations-inNorway10wellsarescheduledfor2013.Withalargenumberofnewcontractsandagreementssecuredduringtheyear,thebusinessoutlooksarepositive.
RESULT,CASHFLOW,INVESTMENTS,FINANCINGANDLIQUIDITYRevenueincreasedfromNOK1178millionin2011toNOK1255millionin2012.Operatingprofitin2012endedatNOK109millioncomparedtoNOK131millionin2011.Thedeclineinoperatingprofitwasmainlyrelatedtotheactivitymixwherethemajorityofactivityfor2ndhalfoftheyearwasplanningforfuturewelloperationsandan8NOKmilliongroupchargeinQ42012whichwasnotincludedin2011.Profitaftertaxin2012wasNOK53million,upfromNOK50millionin2011.Formoreinformationaboutthebackgroundfortheresults,pleaserefertotheoperationalsection.TheaccumulatedcashflowfromtheGroup’soperationalactivitieswaspositiveNOK677million,ofwhichNOK368millionrelatestochangeininter-companybalancesrelatingtothecashpoolarrangementwhichincludesAGRGroup
5AnnuAl RepoRt 2012 - AGR Petroleum Services Holdings AS
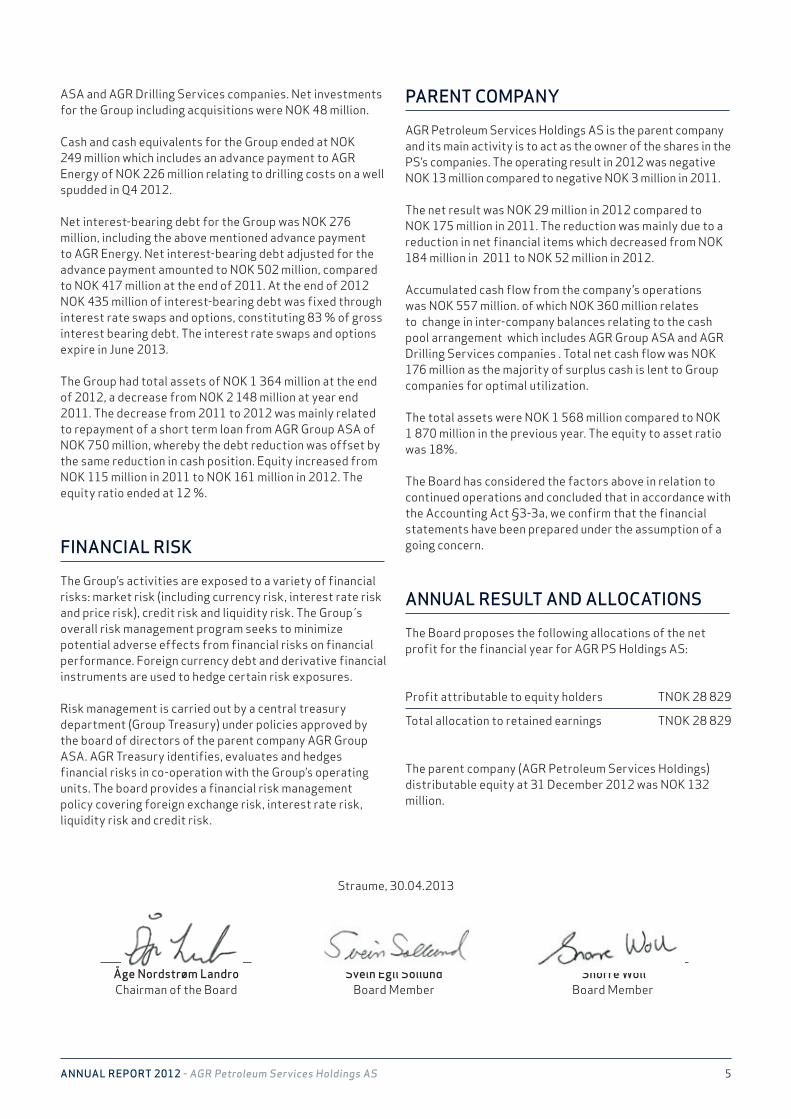
ASAandAGRDrillingServicescompanies.NetinvestmentsfortheGroupincludingacquisitionswereNOK48million.
CashandcashequivalentsfortheGroupendedatNOK249millionwhichincludesanadvancepaymenttoAGREnergyofNOK226millionrelatingtodrillingcostsonawellspuddedinQ42012.Netinterest-bearingdebtfortheGroupwasNOK276million,includingtheabovementionedadvancepaymenttoAGREnergy.Netinterest-bearingdebtadjustedfortheadvancepaymentamountedtoNOK502million,comparedtoNOK417millionattheendof2011.Attheendof2012NOK435millionofinterest-bearingdebtwasfixedthroughinterestrateswapsandoptions,constituting83%ofgrossinterestbearingdebt.TheinterestrateswapsandoptionsexpireinJune2013.TheGrouphadtotalassetsofNOK1364millionattheendof2012,adecreasefromNOK2148millionatyearend2011.Thedecreasefrom2011to2012wasmainlyrelatedtorepaymentofashorttermloanfromAGRGroupASAofNOK750million,wherebythedebtreductionwasoffsetbythesamereductionincashposition.EquityincreasedfromNOK115millionin2011toNOK161millionin2012.Theequityratioendedat12%.
FINANCIALRISK
TheGroup’sactivitiesareexposedtoavarietyoffinancialrisks:marketrisk(includingcurrencyrisk,interestrateriskandpricerisk),creditriskandliquidityrisk.TheGroup soverallriskmanagementprogramseekstominimizepotentialadverseeffectsfromfinancialrisksonfinancialperformance.Foreigncurrencydebtandderivativefinancialinstrumentsareusedtohedgecertainriskexposures.
Riskmanagementiscarriedoutbyacentraltreasurydepartment(GroupTreasury)underpoliciesapprovedbytheboardofdirectorsoftheparentcompanyAGRGroupASA.AGRTreasuryidentifies,evaluatesandhedgesfinancialrisksinco-operationwiththeGroup’soperatingunits.Theboardprovidesafinancialriskmanagementpolicycoveringforeignexchangerisk,interestraterisk,liquidityriskandcreditrisk.
PARENTCOMPANY
AGRPetroleumServicesHoldingsASistheparentcompanyanditsmainactivityistoactastheownerofthesharesinthePS’scompanies.Theoperatingresultin2012wasnegativeNOK13millioncomparedtonegativeNOK3millionin2011.
ThenetresultwasNOK29millionin2012comparedtoNOK175millionin2011.ThereductionwasmainlyduetoareductioninnetfinancialitemswhichdecreasedfromNOK184millionin2011toNOK52millionin2012.
Accumulatedcashflowfromthecompany’soperationswasNOK557million.ofwhichNOK360millionrelatestochangeininter-companybalancesrelatingtothecashpoolarrangementwhichincludesAGRGroupASAandAGRDrillingServicescompanies.TotalnetcashflowwasNOK176millionasthemajorityofsurpluscashislenttoGroupcompaniesforoptimalutilization.
ThetotalassetswereNOK1568millioncomparedtoNOK1870millioninthepreviousyear.Theequitytoassetratiowas18%.
TheBoardhasconsideredthefactorsaboveinrelationtocontinuedoperationsandconcludedthatinaccordancewiththeAccountingAct§3-3a,weconfirmthatthefinancialstatementshavebeenpreparedundertheassumptionofagoingconcern.
ANNUALRESULTANDALLOCATIONS
TheBoardproposesthefollowingallocationsofthenetprofitforthefinancialyearforAGRPSHoldingsAS:
Profitattributabletoequityholders TNOK28829Totalallocationtoretainedearnings TNOK28829
Theparentcompany(AGRPetroleumServicesHoldings)distributableequityat31December2012wasNOK132million.
ÅgeNordstrømLandroChairmanoftheBoard
SveinEgilSollundBoardMember
SnorreWollBoardMember
Straume,30.04.2013
6AnnuAl RepoRt 2012 - AGR Petroleum Services Holdings AS
7AnnuAl RepoRt 2012 - AGR Petroleum Services Holdings AS
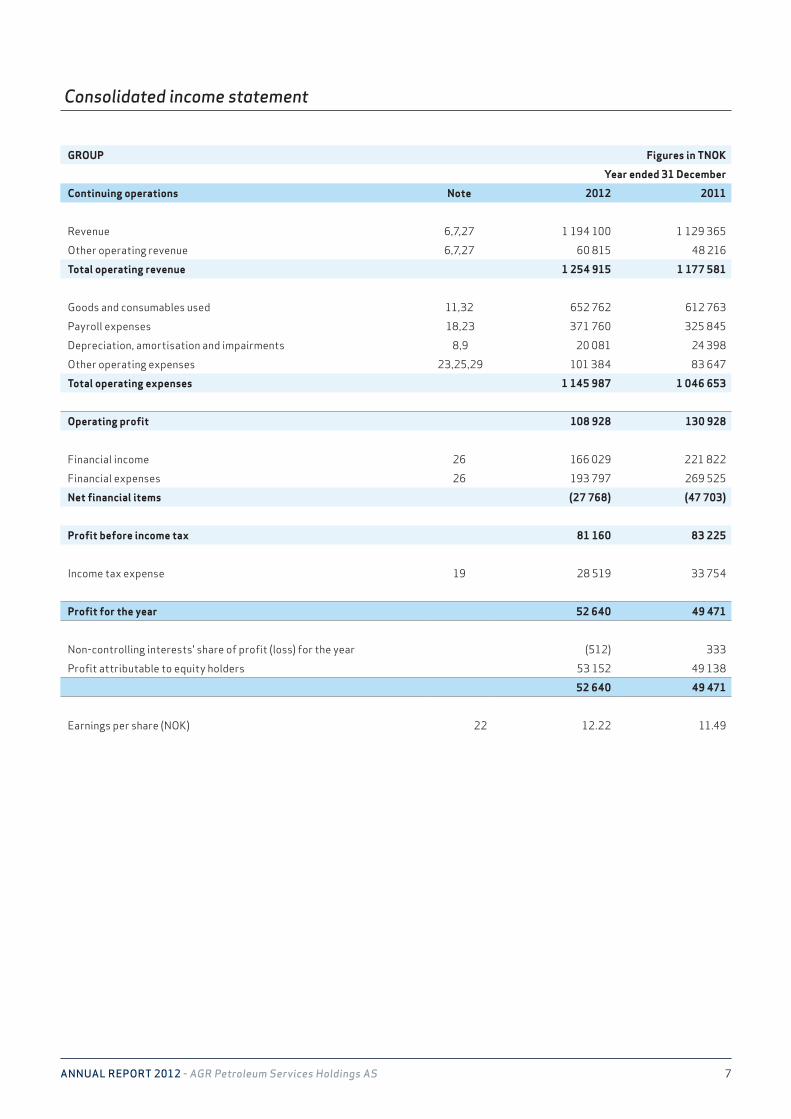
Consolidated income statement
GROUP Figures in TNOK
Year ended 31 December
Continuing operations Note 2012 2011
Revenue 6,7,27 1 194 100 1 129 365
Other operating revenue 6,7,27 60 815 48 216
Total operating revenue 1 254 915 1 177 581
Goods and consumables used 11,32 652 762 612 763
Payroll expenses 18,23 371 760 325 845
Depreciation, amortisation and impairments 8,9 20 081 24 398
Other operating expenses 23,25,29 101 384 83 647
Total operating expenses 1 145 987 1 046 653
Operating profit 108 928 130 928
Financial income 26 166 029 221 822
Financial expenses 26 193 797 269 525
Net financial items (27 768) (47 703)
Profit before income tax 81 160 83 225
Income tax expense 19 28 519 33 754
Profit for the year 52 640 49 471
Non-controlling interests' share of profit (loss) for the year (512) 333
Profit attributable to equity holders 53 152 49 138
52 640 49 471
Earnings per share (NOK) 22 12.22 11.49
8AnnuAl RepoRt 2012 - AGR Petroleum Services Holdings AS
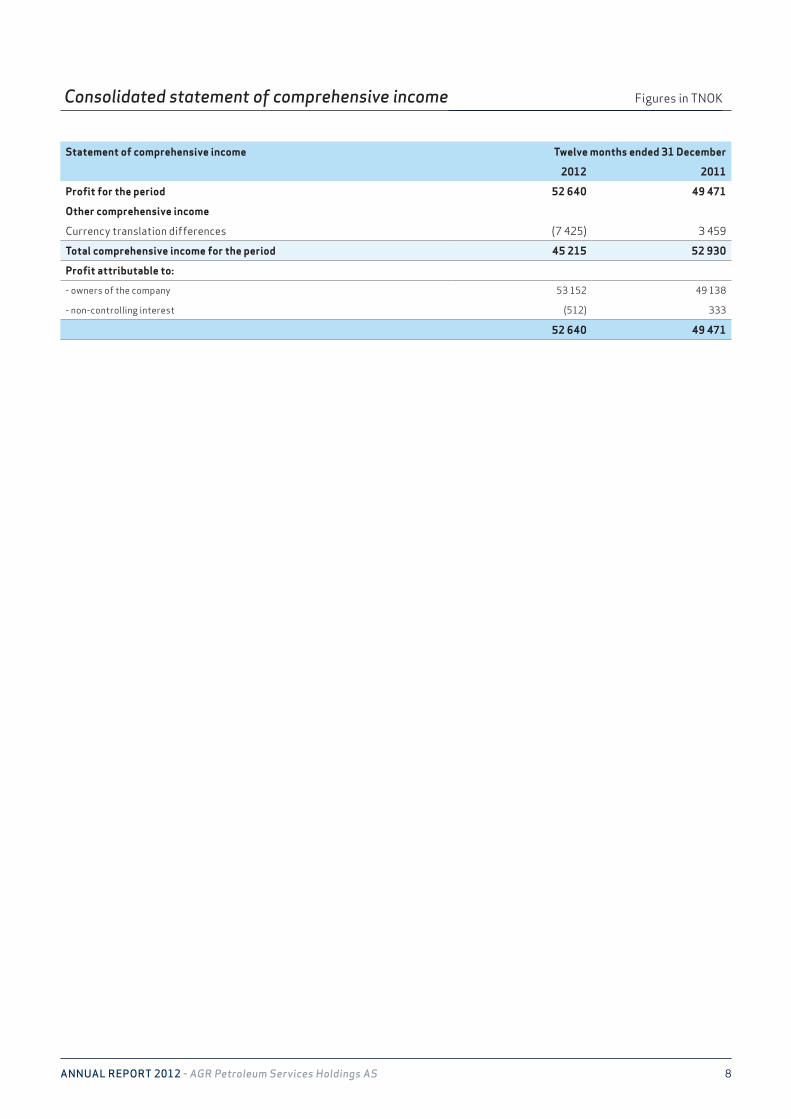
Consolidated statement of comprehensive income Figures in TNOK
Statement of comprehensive income Twelve months ended 31 December
2012 2011
Profit for the period 52 640 49 471
Other comprehensive income
Currency translation differences (7 425) 3 459
Total comprehensive income for the period 45 215 52 930
Profit attributable to:
- owners of the company 53 152 49 138
- non-controlling interest (512) 333
52 640 49 471
9AnnuAl RepoRt 2012 - AGR Petroleum Services Holdings AS
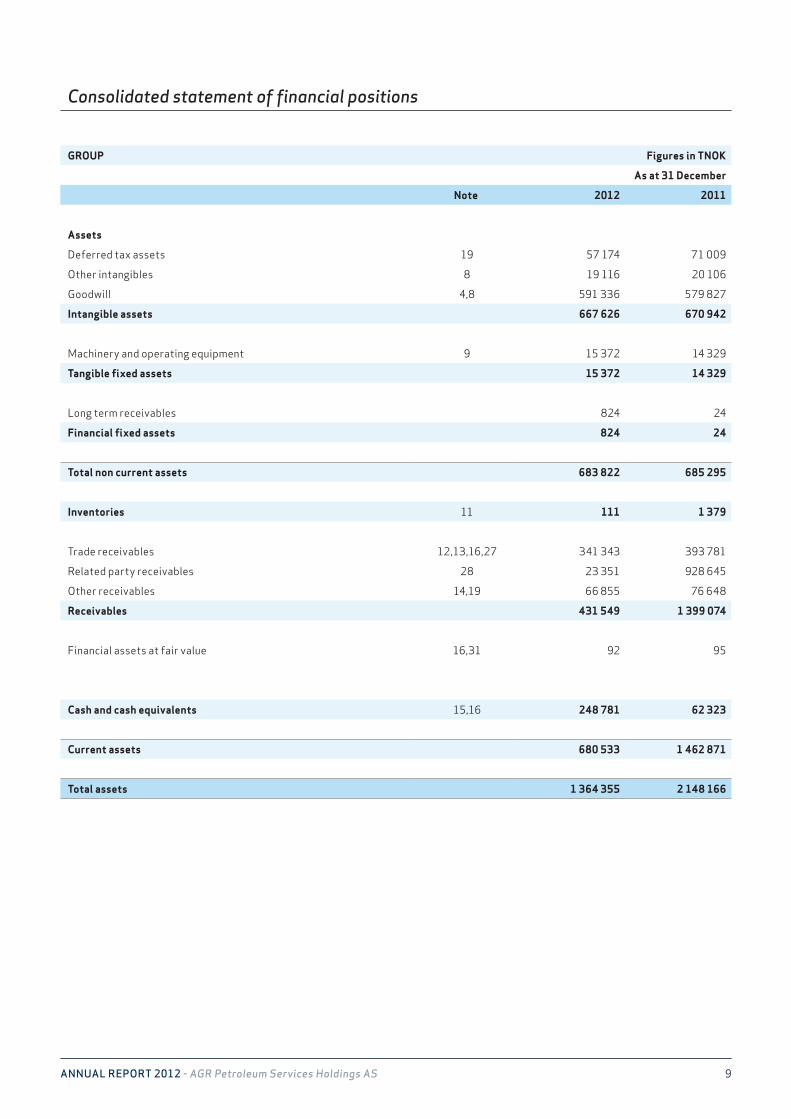
Consolidated statement of financial positions
GROUP Figures in TNOK
As at 31 December
Note 2012 2011
Assets
Deferred tax assets 19 57 174 71 009
Other intangibles 8 19 116 20 106
Goodwill 4,8 591 336 579 827
Intangible assets 667 626 670 942
Machinery and operating equipment 9 15 372 14 329
Tangible fixed assets 15 372 14 329
Long term receivables 824 24
Financial fixed assets 824 24
Total non current assets 683 822 685 295
Inventories 11 111 1 379
Trade receivables 12,13,16,27 341 343 393 781
Related party receivables 28 23 351 928 645
Other receivables 14,19 66 855 76 648
Receivables 431 549 1 399 074
Financial assets at fair value 16,31 92 95
Cash and cash equivalents 15,16 248 781 62 323
Current assets 680 533 1 462 871
Total assets 1 364 355 2 148 166
10AnnuAl RepoRt 2012 - AGR Petroleum Services Holdings AS
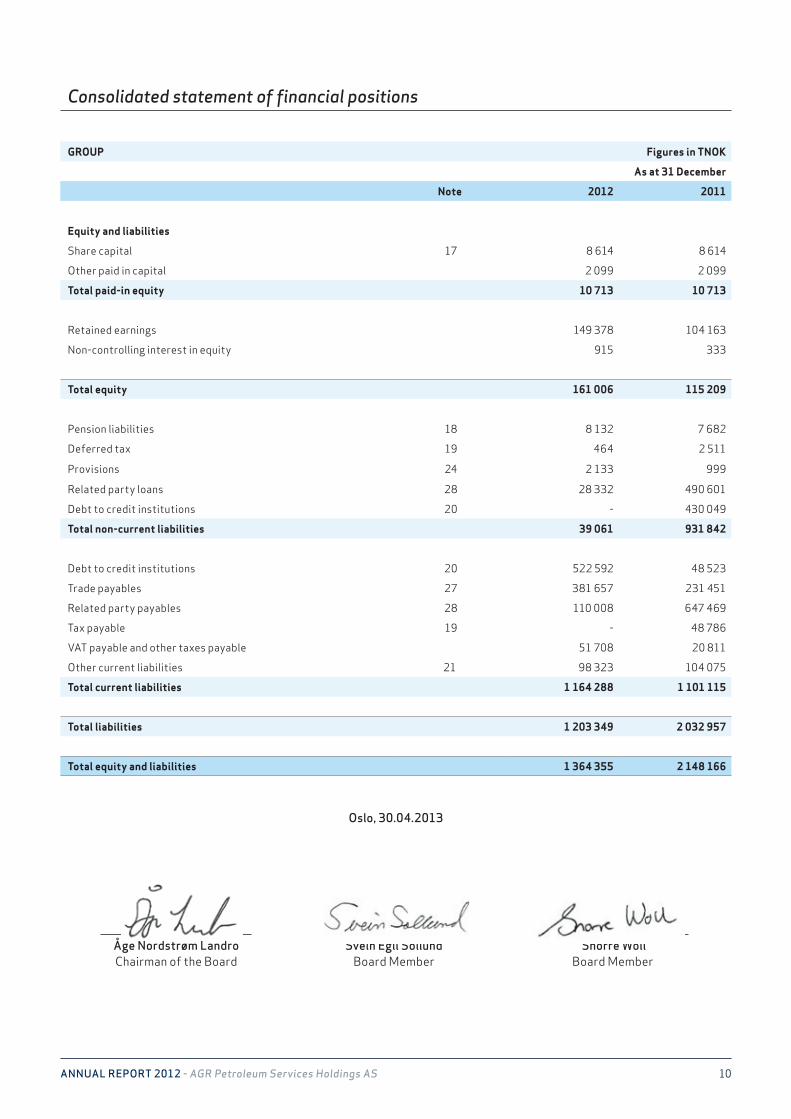
Consolidated statement of financial positions
Oslo, 30.04.2013
GROUP Figures in TNOK
As at 31 December
Note 2012 2011
Equity and liabilities
Share capital 17 8 614 8 614
Other paid in capital 2 099 2 099
Total paid-in equity 10 713 10 713
Retained earnings 149 378 104 163
Non-controlling interest in equity 915 333
Total equity 161 006 115 209
Pension liabilities 18 8 132 7 682
Deferred tax 19 464 2 511
Provisions 24 2 133 999
Related party loans 28 28 332 490 601
Debt to credit institutions 20 - 430 049
Total non-current liabilities 39 061 931 842
Debt to credit institutions 20 522 592 48 523
Trade payables 27 381 657 231 451
Related party payables 28 110 008 647 469
Tax payable 19 - 48 786
VAT payable and other taxes payable 51 708 20 811
Other current liabilities 21 98 323 104 075
Total current liabilities 1 164 288 1 101 115
Total liabilities 1 203 349 2 032 957
Total equity and liabilities 1 364 355 2 148 166
Åge Nordstrøm LandroChairman of the Board
Svein Egil SollundBoard Member
Snorre WollBoard Member
11AnnuAl RepoRt 2012 - AGR Petroleum Services Holdings AS
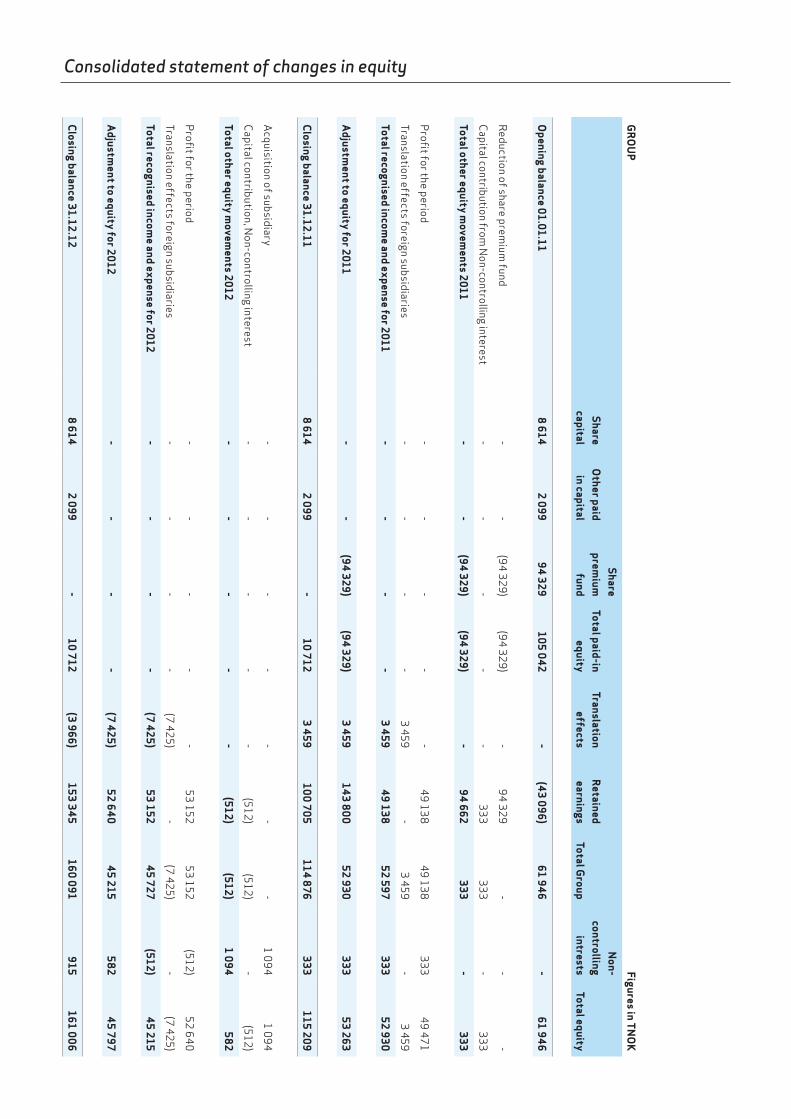
Consolidated statement of changes in equity
GR
OU
P Figures in TN
OK
Share capital
Other paid in capital
Share prem
ium
fund Total paid-in
equity Translation
effects R
etained earnings
Total Group
Non-
controlling intrests
Total equity
Opening balance 01.01.11
8 614 2 099
94 329 105 042
- (43 096)
61 946 -
61 946
Reduction of share prem
ium fund
- -
(94 329)
(94 329)
- 9
4 329 -
- -
Capital contribution from
Non-controlling interest
- -
- -
- 333
333 -
333
Total other equity movem
ents 2011 -
- (94 329)
(94 329) -
94 662 333
- 333
Profi
t for the period -
- -
- -
49 138
49 138
333 49 471
Translation effects foreign subsidiaries -
- -
- 3 459
- 3 459
- 3 459
Total recognised income and expense for 2011
- -
- -
3 459 49 138
52 597 333
52 930
Adjustm
ent to equity for 2011 -
- (94 329)
(94 329) 3 459
143 800 52 930
333 53 263
Closing balance 31.12.11 8 614
2 099 -
10 712 3 459
100 705 114 876
333 115 209
Acquisition of subsidiary
- -
- -
- -
- 1 09
4 1 09
4
Capital contribution, N
on-controlling interest -
- -
- -
(512) (512)
- (512)
Total other equity movem
ents 2012 -
- -
- -
(512) (512)
1 094 582
Profi
t for the period -
- -
- -
53 152 53 152
(512) 52 6
40
Translation effects foreign subsidiaries -
- -
- (7 425)
- (7 425)
- (7 425)
Total recognised income and expense for 2012
- -
- -
(7 425) 53 152
45 727 (512)
45 215
Adjustm
ent to equity for 2012 -
- -
- (7 425)
52 640 45 215
582 45 797
Closing balance 31.12.12 8 614
2 099 -
10 712 (3 966)
153 345 160 091
915 161 006
12AnnuAl RepoRt 2012 - AGR Petroleum Services Holdings AS
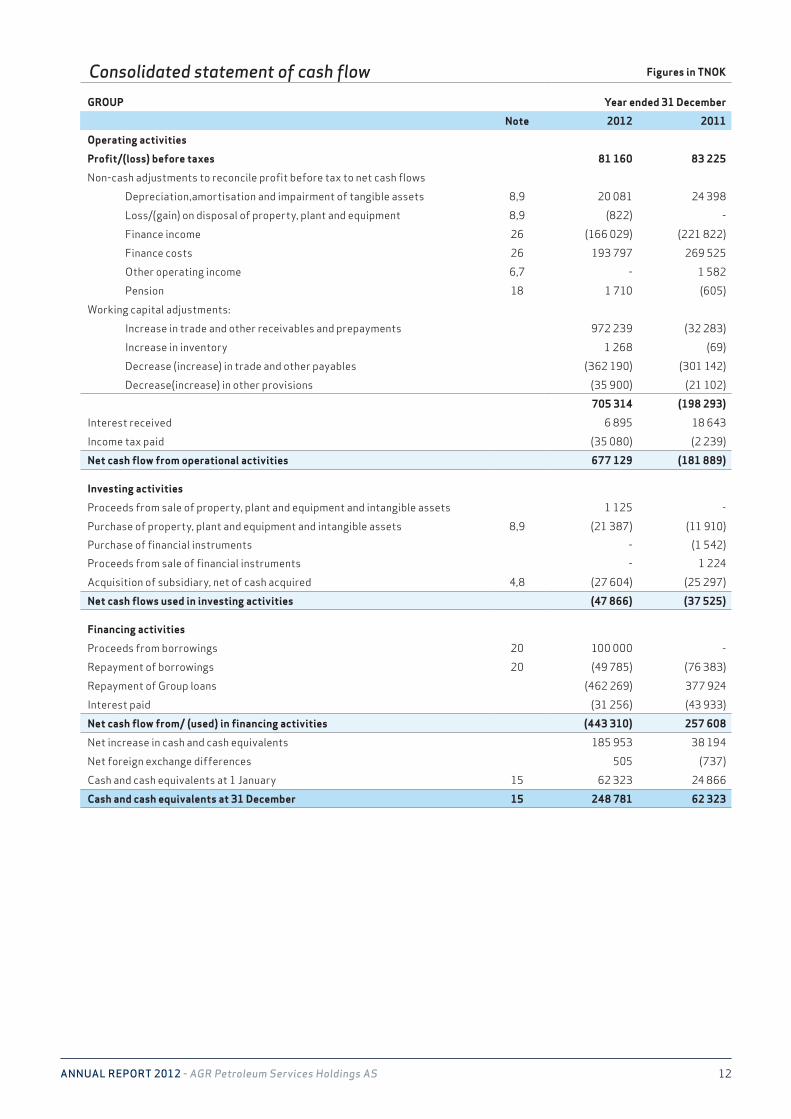
Consolidated statement of cash flow
GROUP Year ended 31 December
Note 2012 2011
Operating activities
Profit/(loss) before taxes 81 160 83 225
Non-cash adjustments to reconcile profit before tax to net cash flows
Depreciation,amortisation and impairment of tangible assets 8,9 20 081 24 398
Loss/(gain) on disposal of property, plant and equipment 8,9 (822) -
Finance income 26 (166 029) (221 822)
Finance costs 26 193 797 269 525
Other operating income 6,7 - 1 582
Pension 18 1 710 (605)
Working capital adjustments:
Increase in trade and other receivables and prepayments 972 239 (32 283)
Increase in inventory 1 268 (69)
Decrease (increase) in trade and other payables (362 190) (301 142)
Decrease(increase) in other provisions (35 900) (21 102)
705 314 (198 293)
Interest received 6 895 18 643
Income tax paid (35 080) (2 239)
Net cash flow from operational activities 677 129 (181 889)
Investing activities
Proceeds from sale of property, plant and equipment and intangible assets 1 125 -
Purchase of property, plant and equipment and intangible assets 8,9 (21 387) (11 910)
Purchase of financial instruments - (1 542)
Proceeds from sale of financial instruments - 1 224
Acquisition of subsidiary, net of cash acquired 4,8 (27 604) (25 297)
Net cash flows used in investing activities (47 866) (37 525)
Financing activities
Proceeds from borrowings 20 100 000 -
Repayment of borrowings 20 (49 785) (76 383)
Repayment of Group loans (462 269) 377 924
Interest paid (31 256) (43 933)
Net cash flow from/ (used) in financing activities (443 310) 257 608
Net increase in cash and cash equivalents 185 953 38 194
Net foreign exchange differences 505 (737)
Cash and cash equivalents at 1 January 15 62 323 24 866
Cash and cash equivalents at 31 December 15 248 781 62 323
Figures in TNOK
13AnnuAl RepoRt 2012 - AGR Petroleum Services Holdings AS

14AnnuAl RepoRt 2012 - AGR Petroleum Services Holdings AS
NOTE 01 Accounting principles
Fundamental PoliciesAGR Petroleum Services Holdings AS (‘the Company’) and its subsidiaries (together ‘the Group’), is a leading supplier of services and technology to the oil and gas offshore industry. The Group’s main operations are based at Oslo, with other offices around the world including Straume (Bergen), Stavanger, Aberdeen, Houston, Perth, Almaty, Dubai and Kuala Lumpur. The company’s parent is AGR Group ASA.
The company has provided goods and services for several of the world’s major oil and gas fields, with a customer base comprising several small and medium sized operators as well as a number of the large international oil companies.
The company is a limited liability company incorporated and domiciled in Norway. The address of its registered office is Smålonane 12-14, 5353 Straume.
The Group consolidated financial statements were author-ised for issue by the board of directors on 30 April 2013.
Summary of significant accounting policiesThe principal accounting policies applied in the preparation of these consolidated financial statements are set out below. These policies have been consistently applied to all the years presented, unless otherwise stated.
The consolidated financial statements of AGR Petroleum Services Holdings AS have been prepared in accordance with International Financial Reporting Standards as adopted by EU (IFRS) and IFRIC Interpretations.
The Group’s financial statements have been prepared under the historical cost convention, with exception of certain items: Financial assets and financial liabilities (including derivative instruments), which are reflected at fair value through profit or loss.
The financial year follows the calendar year. Income statement items are classified by nature.
The preparation of financial statements in conformity with IFRS requires the use of certain critical accounting estimates. It also requires management to exercise its judgment in the process of applying the group’s accounting policies. The areas involving a higher degree of judgment or complexity, or areas where assumptions and estimates are significant to the consolidated financial statements are disclosed in note 3.
Consolidation principlesa) SubsidiariesSubsidiaries are all entities (including special purpose entities) over which the Group has the power to govern the financial and operating policies generally accompanying a shareholding of more than one half of the voting rights.
The existence and effect of potential voting rights that are currently exercisable or convertible are considered when assessing whether the Group controls another entity. Subsidiaries are fully consolidated from the date on which control is transferred to the Group. They are deconsolidated from the date that control ceases.The Group uses the acquisition method of accounting to account for business combinations. The consideration transferred for the acquisition of a subsidiary is the fair values of the assets transferred, the liabilities incurred and the equity interests issued by the Group. The consideration transferred includes the fair value of any asset or liability resulting from a contingent consideration arrangement. Acquisition-related costs are expensed as incurred. Identifiable assets acquired and liabilities and contingent liabilities assumed in a business combination are measured initially at their fair values at the acquisition date. On an acquisition-by-acquisition basis, the Group recognises any non-controlling interest in the acquisition either at fair value or at the non-controlling interest’s proportionate share of the acquired net assets. The excess of the consideration transferred, the amount of any non-controlling interest in the acquisition and the acquisition-date fair value of any previous equity interest in the acquisition over the fair value of the group’s share of the identifiable net assets acquired is recorded as goodwill. If this is less than the fair value of the net assets of the subsidiary acquired in the case of a bargain purchase, the difference is recognised directly in the statement of comprehensive income. Inter-company transactions, balances and unrealised gains on transactions between Group companies are eliminated. Unrealised losses are also eliminated. Accounting policies of subsidiaries have been changed where necessary to ensure consistency with the policies adopted by the Group.
(b) Transactions and non-controlling interestsThe Group treats transactions with non-controlling interests as transactions with equity owners of the Group. For purchases from non-controlling interests, the difference between any consideration paid and the relevant share acquired of the carrying value of net assets of the subsidiary is recorded in equity. Gains or losses on disposals to non-controlling interests are also recorded in equity. When the Group ceases to have control or significant influence, any retained interest in the entity is remeasured to its fair value, with the change in carrying amount recognised in profit or loss. The fair value is the initial carrying amount for the purposes of subsequently accounting for the retained interest as an associate, joint venture or financial asset. In addition, any amounts previously recognised in other comprehensive income in respect of that entity are accounted for as if the Group had directly disposed of the related assets or liabilities. This may mean that amounts previously recognised in other comprehensive income are reclassified to profit or loss.
15AnnuAl RepoRt 2012 - AGR Petroleum Services Holdings AS
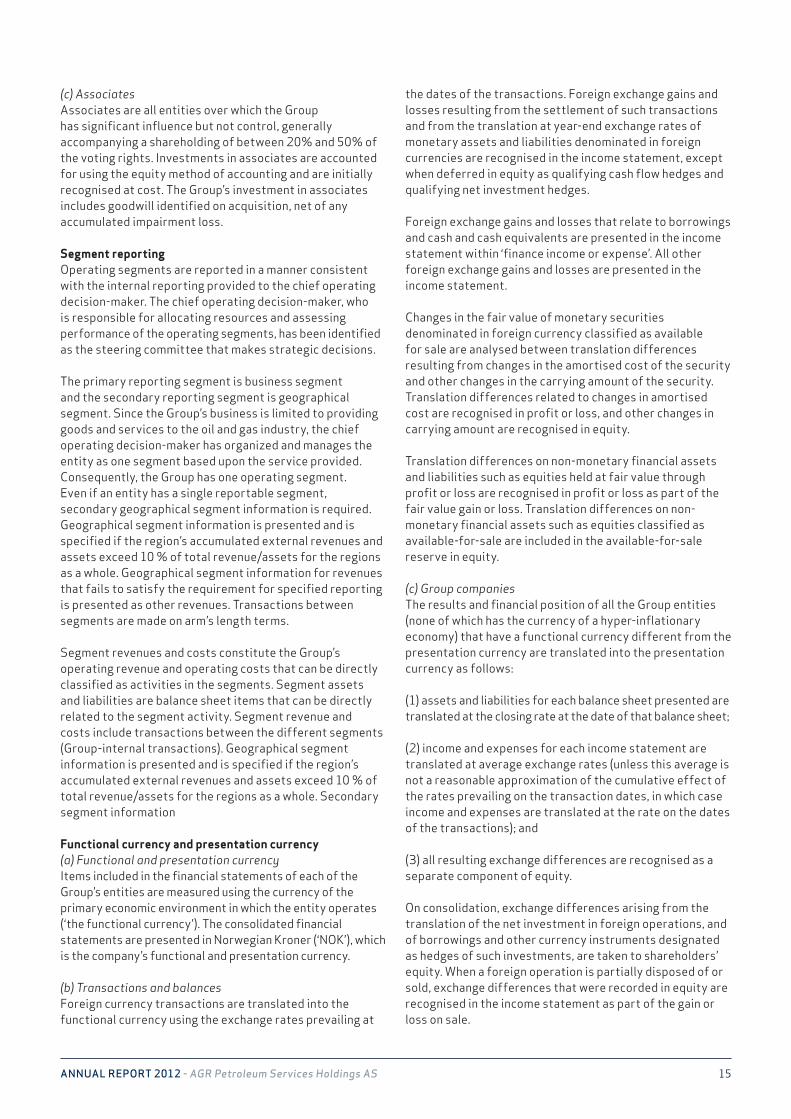
(c) AssociatesAssociates are all entities over which the Group has significant influence but not control, generally accompanying a shareholding of between 20% and 50% of the voting rights. Investments in associates are accounted for using the equity method of accounting and are initially recognised at cost. The Group’s investment in associates includes goodwill identified on acquisition, net of any accumulated impairment loss.
Segment reportingOperating segments are reported in a manner consistent with the internal reporting provided to the chief operating decision-maker. The chief operating decision-maker, who is responsible for allocating resources and assessing performance of the operating segments, has been identified as the steering committee that makes strategic decisions.
The primary reporting segment is business segment and the secondary reporting segment is geographical segment. Since the Group’s business is limited to providing goods and services to the oil and gas industry, the chief operating decision-maker has organized and manages the entity as one segment based upon the service provided. Consequently, the Group has one operating segment. Even if an entity has a single reportable segment, secondary geographical segment information is required. Geographical segment information is presented and is specified if the region’s accumulated external revenues and assets exceed 10 % of total revenue/assets for the regions as a whole. Geographical segment information for revenues that fails to satisfy the requirement for specified reporting is presented as other revenues. Transactions between segments are made on arm’s length terms.
Segment revenues and costs constitute the Group’s operating revenue and operating costs that can be directly classified as activities in the segments. Segment assets and liabilities are balance sheet items that can be directly related to the segment activity. Segment revenue and costs include transactions between the different segments (Group-internal transactions). Geographical segment information is presented and is specified if the region’s accumulated external revenues and assets exceed 10 % of total revenue/assets for the regions as a whole. Secondary segment information
Functional currency and presentation currency(a) Functional and presentation currencyItems included in the financial statements of each of the Group’s entities are measured using the currency of the primary economic environment in which the entity operates (‘the functional currency’). The consolidated financial statements are presented in Norwegian Kroner (‘NOK’), which is the company’s functional and presentation currency.
(b) Transactions and balancesForeign currency transactions are translated into the functional currency using the exchange rates prevailing at
the dates of the transactions. Foreign exchange gains and losses resulting from the settlement of such transactions and from the translation at year-end exchange rates of monetary assets and liabilities denominated in foreign currencies are recognised in the income statement, except when deferred in equity as qualifying cash flow hedges and qualifying net investment hedges.
Foreign exchange gains and losses that relate to borrowings and cash and cash equivalents are presented in the income statement within ‘finance income or expense’. All other foreign exchange gains and losses are presented in the income statement.
Changes in the fair value of monetary securities denominated in foreign currency classified as available for sale are analysed between translation differences resulting from changes in the amortised cost of the security and other changes in the carrying amount of the security. Translation differences related to changes in amortised cost are recognised in profit or loss, and other changes in carrying amount are recognised in equity. Translation differences on non-monetary financial assets and liabilities such as equities held at fair value through profit or loss are recognised in profit or loss as part of the fair value gain or loss. Translation differences on non-monetary financial assets such as equities classified as available-for-sale are included in the available-for-sale reserve in equity.
(c) Group companiesThe results and financial position of all the Group entities (none of which has the currency of a hyper-inflationary economy) that have a functional currency different from the presentation currency are translated into the presentation currency as follows:
(1) assets and liabilities for each balance sheet presented are translated at the closing rate at the date of that balance sheet;
(2) income and expenses for each income statement are translated at average exchange rates (unless this average is not a reasonable approximation of the cumulative effect of the rates prevailing on the transaction dates, in which case income and expenses are translated at the rate on the dates of the transactions); and
(3) all resulting exchange differences are recognised as a separate component of equity.
On consolidation, exchange differences arising from the translation of the net investment in foreign operations, and of borrowings and other currency instruments designated as hedges of such investments, are taken to shareholders’ equity. When a foreign operation is partially disposed of or sold, exchange differences that were recorded in equity are recognised in the income statement as part of the gain or loss on sale.
16AnnuAl RepoRt 2012 - AGR Petroleum Services Holdings AS
Goodwill and fair value adjustments arising on the acqui-sition of a foreign entity are treated as assets and liabilities of the foreign entity and translated at the closing rate.
Classification of assets and liabilitiesAssets are classified as current assets when:
• the asset is a part of the unit’s service cycle and is expected to be realised or used during the course of the unit’s normal production period;
• the asset is held for trading purposes and is expected to be realised within 12 months of balance sheet date;
• the asset is cash or cash equivalent
All other assets are classified as non-current.
Liabilities are classified as current liabilities when:
• the liability is a part of the unit’s service range, and is expected to be settled during the course of normal production period;
• the liability is kept for trading purposes;
• settlement has been agreed within 12 months after balance sheet date;
• the unit does not have an unconditional right to postpone settlement of the liability until at least 12 months after balance sheet date;
All other liabilities are classified as non-current.
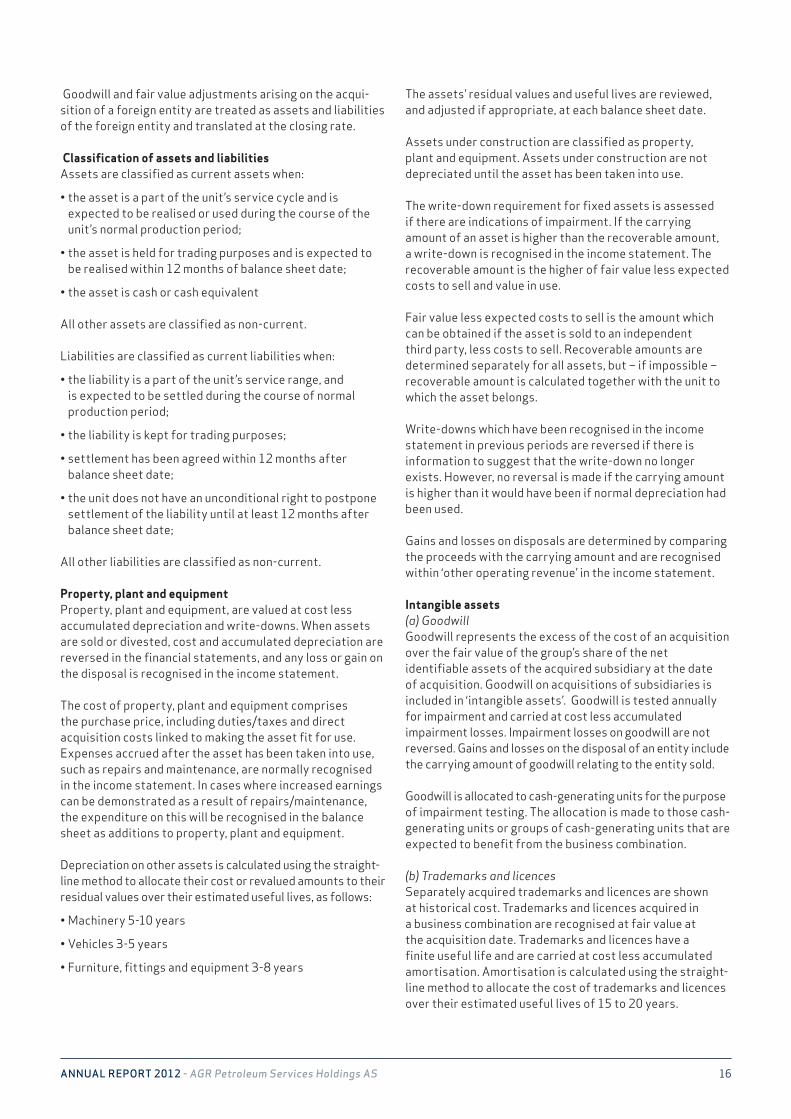
Property, plant and equipmentProperty, plant and equipment, are valued at cost less accumulated depreciation and write-downs. When assets are sold or divested, cost and accumulated depreciation are reversed in the financial statements, and any loss or gain on the disposal is recognised in the income statement. The cost of property, plant and equipment comprises the purchase price, including duties/taxes and direct acquisition costs linked to making the asset fit for use. Expenses accrued after the asset has been taken into use, such as repairs and maintenance, are normally recognised in the income statement. In cases where increased earnings can be demonstrated as a result of repairs/maintenance, the expenditure on this will be recognised in the balance sheet as additions to property, plant and equipment.
Depreciation on other assets is calculated using the straight-line method to allocate their cost or revalued amounts to their residual values over their estimated useful lives, as follows:
• Machinery 5-10 years
• Vehicles 3-5 years
• Furniture, fittings and equipment 3-8 years
The assets’ residual values and useful lives are reviewed, and adjusted if appropriate, at each balance sheet date.
Assets under construction are classified as property, plant and equipment. Assets under construction are not depreciated until the asset has been taken into use.
The write-down requirement for fixed assets is assessed if there are indications of impairment. If the carrying amount of an asset is higher than the recoverable amount, a write-down is recognised in the income statement. The recoverable amount is the higher of fair value less expected costs to sell and value in use.
Fair value less expected costs to sell is the amount which can be obtained if the asset is sold to an independent third party, less costs to sell. Recoverable amounts are determined separately for all assets, but – if impossible – recoverable amount is calculated together with the unit to which the asset belongs.
Write-downs which have been recognised in the income statement in previous periods are reversed if there is information to suggest that the write-down no longer exists. However, no reversal is made if the carrying amount is higher than it would have been if normal depreciation had been used.
Gains and losses on disposals are determined by comparing the proceeds with the carrying amount and are recognised within ‘other operating revenue’ in the income statement.
Intangible assets(a) GoodwillGoodwill represents the excess of the cost of an acquisition over the fair value of the group’s share of the net identifiable assets of the acquired subsidiary at the date of acquisition. Goodwill on acquisitions of subsidiaries is included in ‘intangible assets’. Goodwill is tested annually for impairment and carried at cost less accumulated impairment losses. Impairment losses on goodwill are not reversed. Gains and losses on the disposal of an entity include the carrying amount of goodwill relating to the entity sold. Goodwill is allocated to cash-generating units for the purpose of impairment testing. The allocation is made to those cash-generating units or groups of cash-generating units that are expected to benefit from the business combination. (b) Trademarks and licencesSeparately acquired trademarks and licences are shown at historical cost. Trademarks and licences acquired in a business combination are recognised at fair value at the acquisition date. Trademarks and licences have a finite useful life and are carried at cost less accumulated amortisation. Amortisation is calculated using the straight-line method to allocate the cost of trademarks and licences over their estimated useful lives of 15 to 20 years.
17AnnuAl RepoRt 2012 - AGR Petroleum Services Holdings AS
(c)Contractual customer relationshipsContractual customer relationships acquired in a business combination are recognised at fair value at the acquisition date. The contractual customer relations have a finite useful life and are carried at cost less accumulated amortisation. Amortisation is calculated using the straight-line method over the expected life of the customer relationship (3-8 years)
(d) Computer softwareAcquired computer software licenses are capitalised on the basis of the costs incurred to acquire and bring to use the specific software. These costs are amortised over their estimated useful lives (3-4 years).
Costs associated with maintaining computer software are recognised as an expense as incurred. Costs that are directly associated with the production of identifiable and unique software products controlled by the Group, and that are probable to generate economic benefits exceeding costs beyond one year, are recognised as intangible assets. Direct costs include the software development employee costs and an appropriate portion of relevant overheads.
Computer software development costs recognised as assets are amortised over their estimated useful lives (3-4years).
(e) Research and developmentExpenses relating to research are recognised in the income statement when they are incurred. Expenses relating to development are recognised in the income statement when they are incurred unless the following criteria are met in full:
• ability to measure reliably the expenditure attributable to the intangible asset during its development;
• the technical feasibility of completing the intangible asset so that it will be available for use or sale, has been demonstrated;
• the intention and ability to complete the intangible asset and sell it or use it in the Group’s operations has been demonstrated;
• the intangible asset will generate probable future economic benefits; and
• availability of sufficient technical, financial and other resources for completing the project are present.
When all the above criteria are met, the costs relating to development start to be recognised in the balance sheet. Costs that have been charged as expenses in previous accounting periods are not recognised in the balance sheet.
Recognised development costs are depreciated on a straight-line basis over the estimated useful life of the asset (5-8 years). The recoverable amount of the development costs will be estimated when there is an
indication of impairment or that the need for previous periods’ impairment losses no longer exists and should be reversed to the original cost. (f) Other intangible assetsAcquired technology, licenses and customer relationships are capitalised and carried at cost less accumulated amortisation.Amortisation is calculated using the straight-line method over their estimated useful lives.
Impairment of non-financial assetsAssets that have an indefinite useful life, for example goodwill, are not subject to amortisation and are tested annually for impairment. Assets that are subject to amortisation are reviewed for impairment whenever events or changes in circumstances indicate that the carrying amount may not be recoverable. An impairment loss is recognised for the amount by which the asset’s carrying amount exceeds its recoverable amount.
The recoverable amount is the higher of an asset’s fair value less costs to sell and value in use. For the purposes of assessing impairment, assets are grouped at the lowest levels for which there are separately identifiable cash flows (cash-generating units). Non-financial assets other than goodwill that suffered impairment are reviewed for possible reversal of the impairment at each reporting date.
Non-current assets (or disposal groups) held for saleNon-current assets (or disposal groups) are classified as assets held for sale when their carrying amount is to be recovered principally through a sale transaction and a sale is considered highly probable. They are stated at the lower of carrying amount and fair value less costs to sell if their carrying amount is to be recovered principally through a sale transaction rather than through continuing use.
Financial assetsThe Group classifies its financial assets in the following categories: at fair value through profit or loss, loans and receivables, and available-for-sale. The classification depends on the purpose for which the financial assets were acquired. Management determines the classification of its financial assets at initial recognition. (a) Financial assets at fair value through profit or lossFinancial assets at fair value through profit or loss are financial assets held for trading. A financial asset is classi-fied in this category if acquired principally for the purpose of selling in the short-term. Derivatives are also categorised as held for trading unless they are designated as hedges. Assets in this category are classified as current assets.
(b) Loans and receivablesLoans and receivables are non-derivative financial assets with fixed or determinable payments that are not quoted in an active market. They are included in current assets, except for maturities greater than 12 months after the balance sheet date. These are classified as non-current
18AnnuAl RepoRt 2012 - AGR Petroleum Services Holdings AS
assets. The Group’s loans and receivables comprise ‘trade and other receivables’ and cash and cash equivalents in the balance sheet
(c) Available-for-sale financial assetsAvailable-for-sale financial assets are non-derivatives that are either designated in this category or not classified in any of the other categories. They are included in non-current assets unless management intends to dispose of the investment within 12 months of the balance sheet date.
Regular purchases and sales of financial assets are recognised on the trade-date – the date on which the Group commits to purchase or sell the asset. Investments are initially recognised at fair value plus transaction costs for all financial assets not carried at fair value through profit or loss. Financial assets carried at fair value through profit or loss is initially recognised at fair value and transaction costs are expensed in the income statement. Financial assets are derecognised when the rights to receive cash flows from the investments have expired or have been transferred and the group has transferred substantially all risks and rewards of ownership. Available-for-sale financial assets and financial assets at fair value through profit or loss are subsequently carried at fair value. Loans and receivables are carried at amortised cost using the effective interest method.
Gains or losses arising from changes in the fair value of the ‘financial assets at fair value through profit or loss’ category are presented in the income statement.
Impairment of financial assetsThe Group assesses at the end of each reporting period whether there is objective evidence that a financial asset or group of financial assets is impaired. A financial asset or a group of financial assets is impaired and impairment losses are incurred only if there is objective evidence of impairment as a result of one or more events that occurred after the initial recognition of the asset (a ‘loss event’) and that loss event (or events) has an impact on the estimated future cash flows of the financial asset or group of financial assets that can be reliably estimated. The criteria that the Group uses to determine that there is objective evidence of an impairment loss include:
• significant financial difficulty of the issuer or obligor;
• a breach of contract, such as a default or delinquency in interest or principal payments;
• the Group, for economic or legal reasons relating to the borrower’s financial difficulty, granting to the borrower a concession that the lender would not otherwise consider;
• it becomes probable that the borrower will enter bankruptcy or other financial reorganisation;
• the disappearance of an active market for that financial asset because of financial difficulties; or
• observable data indicating that there is a measurable decrease in the estimated future cash flows from a portfolio of financial assets since the initial recognition of those assets, although the decrease cannot yet be identified with the individual financial assets in the portfolio, including:(i) adverse changes in the payment status of borrowers in the portfolio;(ii) national or local economic conditions that correlate with defaults on the assets in the portfolio.
The Group first assesses whether objective evidence of impairment exists. The amount of the loss is measured as the difference between the asset’s carrying amount and the present value of estimated future cash flows (excluding future credit losses that have not been incurred) discounted at the financial asset’s original effective interest rate. The asset’s carrying amount of the asset is reduced and the amount of the loss is recognised in the consolidated income statement. If a loan or held-to-maturity investment has a variable interest rate, the discount rate for measuring any impairment loss is the current effective interest rate determined under the contract. As a practical expedient, the group may measure impairment on the basis of an instrument’s fair value using an observable market price. If, in a subsequent period, the amount of the impairment loss decreases and the decrease can be related objectively to an event occurring after the impairment was recognised (such as an improvement in the debtor’s credit rating), the reversal of the previously recognised impairment loss is recognised in the consolidated income statement.
Derivative financial instruments and hedging activitiesDerivatives are initially recognised at fair value on the date a derivative contract is entered into and are subsequently remeasured at their fair value. The method of recognising the resulting gain or loss depends on whether the derivative is designated as a hedging instrument, and if so, the nature of the item being hedged. The Group does not use hedge accounting according to IAS 39, and all financial derivatives are thus posted at fair value where changes in values are accounted for in the income statement.
InventoriesInventories are stated at the lower of cost and net realisable value. Cost is determined using the first-in, first-out (FIFO) method. Net realisable value is the estimated selling price in the ordinary course of business, less applicable variable selling expenses. Costs of inventories include the transfer from equity of any gains/losses on qualifying cash flow hedges purchases of raw materials
Obsolete inventories have been fully recognised as impairment losses.

19AnnuAl RepoRt 2012 - AGR Petroleum Services Holdings AS
Trade receivablesTrade receivables are amounts due from customers for merchandise sold or services performed in the ordinary course of business. If collection is expected in one year or less (or in the normal operating cycle of the business if longer), they are classified as current assets. If not, they are presented as noncurrent assets. Trade receivables are recognised initially at fair value and subsequently measured at amortised cost using the effective interest method, less provision for impairment. Discounting occurs only if the receivable are significant.
Cash and cash equivalentsCash and cash equivalents includes cash in hand, deposits held at call with banks, other short-term highly liquid investments with original maturities of three months or less, and bank overdrafts. Bank overdrafts are shown within borrowings in current liabilities on the balance sheet.
The cash and cash equivalent amount in the cash flow statement includes overdraft facilities.
Share capitalOrdinary shares are classified as equity. Incremental costs directly attributable to the issue of new shares or options are shown in equity as a deduction, net of tax, from the proceeds.
Where any Group company purchases the company’s equity share capital (treasury shares), the consideration paid, including any directly attributable incremental costs (net of income taxes) is deducted from equity attributable to the company’s equity holders until the shares are cancelled or reissued. Where such shares are subsequently reissued, any consideration received, net of any directly attributable incremental transaction costs and the related income tax effects, is included in equity attributable to the company’s equity holders.
Trade payablesTrade payables are obligations to pay for goods or services that have been acquired in the ordinary course of business from suppliers. Accounts payable are classified as current liabilities if payment is due within one year or less (or in the normal operating cycle of the business if longer). If not, they are presented as non-current liabilities.
Trade payables are recognised initially at fair value and subsequently measured at amortised cost using the effective interest method. Discounting occurs only if the payable are significant
BorrowingsBorrowings are recognised initially at fair value, net of transaction costs incurred. Borrowings are subsequently stated at amortised cost; any difference between the proceeds (net of transaction costs) and the redemption value is recognised in the income statement over the period of the borrowings using the effective interest method.
Fees paid on the establishment of loan facilities are recognised as transaction costs of the loan to the extent that it is probable that some or all of the facility will be drawn down. In this case, the fee is deferred until the draw-down occurs. To the extent there is no evidence that it is probable that some or all of the facility will be drawn down, the fee is capitalised as a pre-payment for liquidity services and amortised over the period of the facility to which it relates.
Borrowings are classified as current liabilities unless the Group has an unconditional right to defer settlement of the liability for at least 12 months after the balance sheet date.
Current and deferred income taxThe tax expense for the period comprises current and deferred tax. Tax is recognised in the income statement, except to the extent that it relates to items recognised directly in equity. In this case, the tax is also recognised in equity, respectively
The current income tax charge is calculated on the basis of the tax laws enacted or substantively enacted at the balance sheet date in the countries where the company’s subsidiaries and associates operate and generate taxable income. Management periodically evaluates positions taken in tax returns with respect to situations in which applicable tax regulation is subject to interpretation. It establishes provisions where appropriate on the basis of amounts expected to be paid to the tax authorities. Deferred income tax is recognised, using the liability method, on temporary differences arising between the tax bases of assets and liabilities and their carrying amounts in the consolidated financial statements. However, the deferred income tax is not accounted for if it arises from initial recognition of an asset or liability in a transaction other than a business combination that at the time of the transaction affects neither accounting nor taxable profit nor loss. Deferred income tax is determined using tax rates (and laws) that have been enacted or substantially enacted by the balance sheet date and are expected to apply when the related deferred income tax asset is realised or the deferred income tax liability is settled. Deferred income tax assets are recognised only to the extent that it is probable that future taxable profit will be available against which the temporary differences can be utilised. Deferred income tax is provided on temporary differences arising on investments in subsidiaries and associates, except where the timing of the reversal of the temporary difference is controlled by the group and it is probable that the temporary difference will not reverse in the foreseeable future.
20AnnuAl RepoRt 2012 - AGR Petroleum Services Holdings AS
Deferred income tax assets and liabilities are offset when there is a legally enforceable right to offset current tax assets against current tax liabilities and when the deferred income taxes assets and liabilities relate to income taxes levied by the same taxation authority on either the taxable entity or different taxable entities where there is an intention to settle the balances on a net basis.
Employee benefits(a) Pension obligationsGroup companies operate various pension schemes. The schemes are generally funded through payments to insurance companies, determined by periodic actuarial calculations. The Group has both defined benefit and defined contribution plans. A defined contribution plan is a pension plan under which the Group pays fixed contributions into a separate entity. The Group has no legal or constructive obligations to pay further contributions if the fund does not hold sufficient assets to pay all employees the benefits relating to employee service in the current and prior periods. A defined benefit plan is a pension plan that is not a defined contribution plan. Typically, defined benefit plans define an amount of pension benefit that an employee will receive on retirement, usually dependent on one or more factors such as age, years of service and compensation.
The liability recognised in the balance sheet in respect of defined benefit pension plans is the present value of the defined benefit obligation at the balance sheet date less the fair value of plan assets, together with adjustments for unrecognised actuarial gains or losses and past service costs. The defined benefit obligation is calculated annually by independent actuaries using the projected unit credit method. The present value of the defined benefit obligation is determined by discounting the estimated future cash outflows using interest rates of high-quality corporate bonds that are denominated in the currency in which the benefits will be paid and that have terms to maturity approximating to the terms of the related pension liability.
Actuarial gains and losses arising from experience adjustments and changes in actuarial assumptions in excess of the greater of 10% of the value of plan assets or present value of the defined benefit obligation at the end of the previous reporting period, are charged or credited to income over the employees’ expected average remaining working lives.
Past-service costs are recognised immediately in income, unless the changes to the pension plan are conditional on the employees remaining in service for a specified period of time (the vesting period). In this case, the past-service costs are amortised on a straight-line basis over the vesting period.
For defined contribution plans, the Group pays contributions to publicly or privately administered pension insurance plans on a mandatory, contractual or voluntary basis. The Group has no further payment obligations once
the contributions have been paid. The contributions are recognised as employee benefit expense when they are due. Prepaid contributions are recognised as an asset to the extent that a cash refund or a reduction in the future payments is available.
(b) Termination benefitsTermination benefits are payable when employment is terminated by the Group before the normal retirement date, or whenever an employee accepts voluntary redundancy in exchange for these benefits. The Group recognises termination benefits when it is demonstrably committed to either: terminating the employment of current employees according to a detailed formal plan without possibility of withdrawal; or providing termination benefits as a result of an offer made to encourage voluntary redundancy. Benefits falling due more than 12 months after the balance sheet date are discounted to their present value.
(c) Bonus plansThe Group recognises a provision where contractually obliged or where there is a past practice that has created a constructive obligation.
ProvisionsProvisions are recognised when, and only when, the company has a present liability (legal or constructive) as a result of events that have taken place, it is probable that a financial outflow will take place as a result of this liability, and that the size of the amount can be estimated reliably. Provisions are reviewed on each balance sheet date and their level reflects the best estimate of the liability. When the effect of time is insignificant, the provisions will be equal to the size of the expense necessary to be free of the liability. When the effect of time is significant, the provisions will be the present value of future payments to cover the liability. Any increase in the provisions due to time is presented as interest costs. Contingent liabilitiesContingent liabilities are defined as:(i) possible obligations resulting from past events whose existence depends on future events;(ii) obligations that are not recognised because it is not probable that they will lead to an outflow of resources; and(iii) obligations that cannot be measured with sufficient reliability.
Contingent liabilities are not recognised in the annual financial statements, apart from contingent liabilities which are acquired through the acquisition of an entity. Significant contingent liabilities are disclosed, with the exception of contingent liabilities where the probability of the liability occurring is remote.
Contingent liabilities acquired upon the purchase of operations are recognised at fair value even if the liability is not probable. The assessment of probability and fair value
21AnnuAl RepoRt 2012 - AGR Petroleum Services Holdings AS
is subject to constant review. Changes in the fair value are recognised in the income statement.
A contingent asset is not recognised in the annual financial statement unless deemed virtually certain to give rise to an inflow, but are disclosed where it is deemed probable that a benefit will accrue to the Group.
Revenue recognitionRevenue comprises the fair value of the consideration received or receivable for the sale of goods and services in the ordinary course of the Group’s activities. Revenue is shown net of value-added tax, returns, rebates and discounts and after eliminating sales within the Group.
Revenue includes only the gross inflows of economic benefits received and receivable by the entity on its own account. Amounts collected on behalf of third parties such as sales taxes, goods and services taxes and value added taxes are not economic benefits which flow to the entity and do not result in increases in equity. Therefore, they are excluded from revenue. Similarly, when an agency relationship, the gross inflows of economic benefits include amounts collected on behalf of the principal and which do not result in increases in equity for the entity. The amounts collected on behalf of the principal are not revenue. Instead, revenue is the amount of commission.
The Group recognises revenue when the amount of revenue can be reliably measured, it is probable that future economic benefits will flow to the entity and when specific criteria have been met for each of the Group’s activities as described below. The amount of revenue is not considered to be reliably measurable until all contingencies relating to the sale have been resolved. The Group bases its estimates on historical results, taking into consideration the type of customer, the type of transaction and the specifics of each arrangement.
The Group’s operations mainly consist of services related to personnel and equipment hire. Consequently, the revenue recognition is based on daily/monthly rates and actual registered hours. Revenue is recognised when it is probable that transactions will generate future economic benefits that will flow to the company and the revenue amount can be reliably estimated. Revenues from the sale of goods are recognised in the income statement once delivery has taken place, the risk has been transferred and the company has established a receivable due by customer.
Interest income is recognised on a time-proportion basis using the effective interest method. When a receivable is impaired, the Group reduces the carrying amount to its recoverable amount, being the estimated future cash flow discounted at the original effective interest rate of the instrument, and continues unwinding the discount as interest income. Interest income on impaired loans is recognised using the original effective interest rate.
LeasesLeases in which a significant portion of the risks and rewards of ownership are retained by the lessor are classified as operating leases. Payments made under operating leases (net of any incentives received from the lessor) are charged to the income statement on a straight-line basis over the period of the lease.
Earnings per shareEarnings per share are calculated by the majority’s share of the result for the period being divided by a time-weighted average of ordinary shares for the period.
Events after date of balance sheet New information on the Group’s positions at the balance sheet date is taken into account in the annual financial statements. Events after the balance sheet date that do not affect the Group’s position at the balance sheet date but which will affect the Group’s position in the future are disclosed if significant.
Cash Flow StatementThe cash flow statement presents the accumulated cash flow for operational, investment and financial activities. The statement outlines the effect each activity has on liquid assets. The cash flow statement has been prepared in line with the indirect model.
Discontinued operations.If a significant part of the Group’s operations is divested or a decision has been made to divest it, this business is presented as “Discontinued operations” on a separate line of the income statement and the balance sheet. As a result, all the other figures presented are exclusive of the discontinued operations. The comparative figures in the income statement are restated and presented on a single line with the discontinued operations. Comparative figures in the balance sheet are not correspondingly restated.
Changes in accounting policy and disclosuresIFRSs implementedIFRS 7 Financial Instruments – Disclosures (amendment)The amendment relates to disclosure requirements for financial assets that are derecognised in their entirety, but where the entity has a continuing involvement. The amendmentswill assist users in understanding the implications of transfers of financial assets and the potential risks that may remain with the transferor. The amended IFRS 7 was effective for annual periods beginning on or after 1 July 2011. The Group implemented the amended IFRS 7 as of 1 January 2012. The amendment had no impact on disclosures, or the Group’s financial position or performance.
IFRSs and IFRICs issued but not yet effective
IFRS 7 Financial Instruments – Disclosures (amendment)The IASB has introduced new disclosure requirements in IFRS 7. These disclosures, which are similar to the new US GAAP requirements, would provide users with information
22AnnuAl RepoRt 2012 - AGR Petroleum Services Holdings AS
that is useful in (a) evaluating the effect of potential effect of netting arrangements on an entity’s financial position and (b) analysing and comparing financial statements prepared in accordance with IFRSs and US GAAP. The amended IFRS 7 is effective for annual periods beginning on or after 1 January 2013 The Group expects to implement the amended IFRS 7 as of 1 January 2013. The amendment affects disclosure only and has no impact on the Group’s financial position or performance. IFRS 9 Financial InstrumentsIFRS 9 as issued reflects the first phase of the IASBs work on replacement of IAS 39 and applies to classification and measurement of financial assets and financial liabilities as defined in IAS 39. According to IFRS 9 financial assets with basic loan features shall be measured at amortised cost, unless one opts to measure these assets at fair value. All other financial assets shall be measured at fair value. The classification and measurement of financial liabilities under IFRS 9 is a continuation from IAS 39, with the exception of financial liabilities designated at fair value through profit or loss (fair value option), where change in fair value relating to own credit risk shall be separated and shall be presented in other comprehensive income. In subsequent phases, the IASB will address hedge accounting and impairment of financial assets. IFRS 9 is effective for annual periods beginning on or after 1 January 2015, but the standard is not yet approved by the EU. The Group expects to apply IFRS 9 as of 1 January 2015. IFRS 10 Consolidated Financial StatementsIFRS 10 replaces the portion of IAS 27 Consolidated and Separate Financial Statements that addresses the accounting for consolidated financial statements. It also includes the issues raised in SIC-12 Consolidation —Special Purpose Entities. IFRS 10 establishes a single control model that applies to all entities including special purpose entities. The changes introduced by IFRS 10 will require management to exercise significant judgement to determine which entities are controlled, and therefore, are required to be consolidated by a parent, compared with the requirements that were in IAS 27. The Group is currently assessing the impact that this standard will have on the financial position and performance. This standard becomes effective for annual periods beginning on or after 1 January 2014. The Group expects to apply IFRS 10 as of 1 January 2014. IFRS 11 Joint ArrangementsIFRS 11 replaces IAS 31 Interests in Joint Ventures and SIC-13 Jointly-controlled Entities —Non-monetary Contributions by Venturers. IFRS 11 removes the option to account for jointly controlled entities (JCEs) using proportionate consolidation. Instead, JCEs that meet the definition of a joint venture must be accounted for using the equity method. The Group is does not expect that the impact that this standard will have any effect on the financial position and performance. This standard becomes effective for annual periods beginning on or after 1 January 2014. The Group expects to apply IFRS 11 as of 1 January 2014.
IFRS 12 Disclosure of Involvement with Other EntitiesIFRS 12 includes all of the disclosures that were previously in IAS 27 related to consolidated financial statements, as well as all of the disclosures that were previously included in IAS 31 and IAS 28. These disclosures relate to an entity’s interests in subsidiaries, joint arrangements, associates and structured entities. A number of new disclosures are also required. This standard becomes effective for annual periods beginning on or after 1 January 2014. The Group expects to apply IFRS 12 as of 1 January 2014.
NOTE 02 Financial risk management
Financial risk factorsThe Group’s activities are exposed to a variety of financial risks. Market risks including currency risk, interest rate risk, credit risk and liquidity risk. The Group’s overall risk management program focuses on the unpredictability of financial markets and seeks to minimize potential adverse effects on the Group’s financial performance. The Group uses debt and derivative financial instruments to hedge certain risk exposures. Risk management is carried out by a central treasury department (Group treasury) under policies approved by the board of directors. Group treasury identifies, evaluates and hedges financial risks in co-operation with the Group’s operating units. The board provides risk management policies covering specific areas, such as foreign exchange risk, interest rate risk, liquidity risk and credit risk. (a) Market risk(i) Foreign exchange riskThe Group operates internationally and is exposed to foreign exchange risk arising from various currency exposures, primarily with respect to the US Dollar and GBP. Foreign exchange risk arises from future commercial transactions, recognised assets and liabilities and net investments in foreign operations.
The Group s financial risk policy is that 12 month forecasted net currency exposure shall be maximum 60 million in NOK equivalents. Positions are reviewed quarterly. Hedging is conducted by applying combination of long term foreign currency term loans and currency derivatives. If the NOK currency in 2012 had weakened/strengthened by 10% against the US Dollar with all other variables held constant, EBITDA for the year would have been approximately NOK 6 million higher/lower, mainly as a result of foreign exchange gains/losses on translation of net US Dollar revenues. If the NOK currency had weakened/strengthened 10% against the GBP with all other variables held constant, EBITDA for the year would have been approximately NOK 5 million lower/higher, mainly as a result of foreign exchange gains/losses on translation of net GBP costs.
23AnnuAl RepoRt 2012 - AGR Petroleum Services Holdings AS
(ii) Price riskThe Group is indirectly exposed to changes in the oil price, however current group policy is to not hedge oil price changes.
(iii) Cash flow and fair value interest rate riskAs the Group has no significant interest-bearing assets, the Group’s income and operating cash flows are substantially independent of changes in market interest rates. The Group’s interest rate risk arises from long-term borrowings. Borrowings issued at variable rates expose the group to cash flow interest rate risk. Group policy is that long-term borrowings shall be based on floating interest rates, however interest rate derivatives shall be applied in order to avoid significant losses due to interest rate changes. The Group manages its interest rate risk by applying derivatives such as interest rate collar swaps, in order to establish a cap on interest rates in case of significant increase in market interest rates. In addition, the Group has applied floating-to-fixed interest rate swaps. Such interest rate swaps have the economic effect of converting borrowings from floating rates to fixed rates.
Based on the risk analysis where a 1% interest rate increase/decrease is applied, the impact of net interest expenses would be negative NOK 1 million and positive NOK 1 million respectively (negative on decreased interest rates due to interest floor on the interest rate collar swap)
At 31 December 2012 the Group held 3 interest rate swap contracts with a total amount of NOK 267 million and 1 interest rate collar swap amounting to NOK168 million, which in aggregate constitutes approximately 83% of the Group’s long-term interest bearing debt.
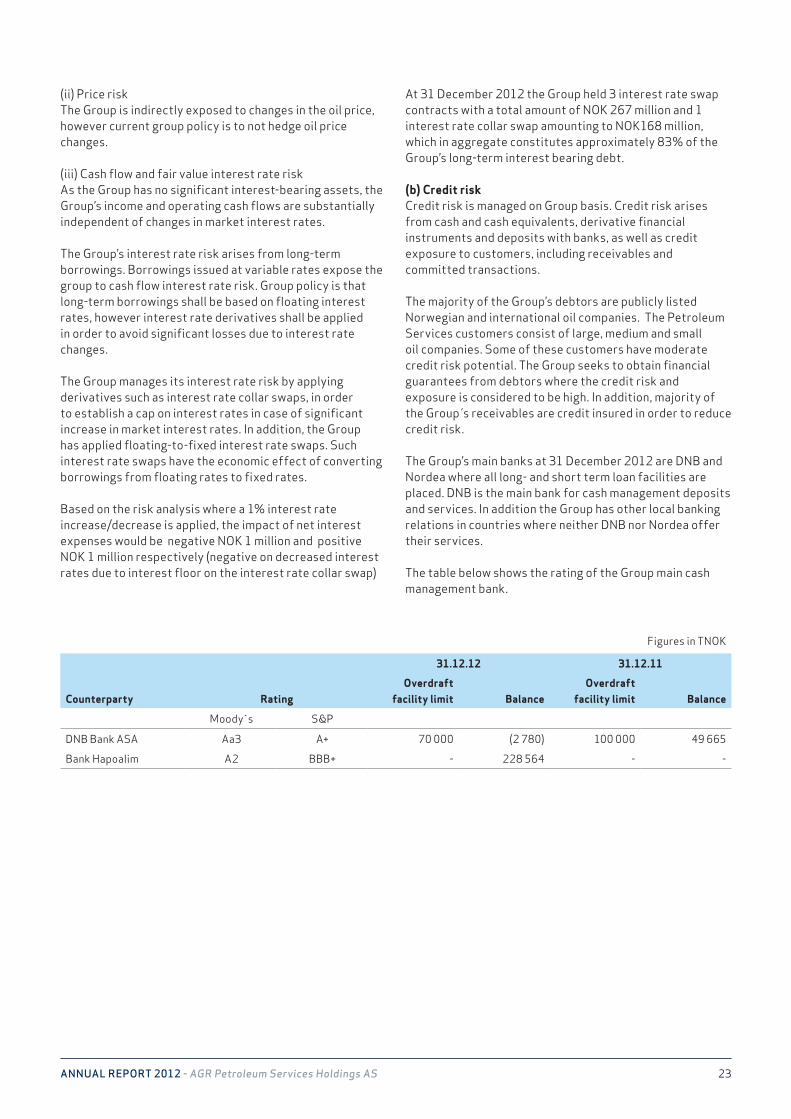
(b) Credit riskCredit risk is managed on Group basis. Credit risk arises from cash and cash equivalents, derivative financial instruments and deposits with banks, as well as credit exposure to customers, including receivables and committed transactions.
The majority of the Group’s debtors are publicly listed Norwegian and international oil companies. The Petroleum Services customers consist of large, medium and small oil companies. Some of these customers have moderate credit risk potential. The Group seeks to obtain financial guarantees from debtors where the credit risk and exposure is considered to be high. In addition, majority of the Group s receivables are credit insured in order to reduce credit risk.
The Group’s main banks at 31 December 2012 are DNB and Nordea where all long- and short term loan facilities are placed. DNB is the main bank for cash management deposits and services. In addition the Group has other local banking relations in countries where neither DNB nor Nordea offer their services.
The table below shows the rating of the Group main cash management bank.
31.12.12 31.12.11
Counterparty RatingOverdraft
facility limit BalanceOverdraft
facility limit Balance
Moody s S&P
DNB Bank ASA Aa3 A+ 70 000 (2 780) 100 000 49 665
Bank Hapoalim A2 BBB+ - 228 564 - -
Figures in TNOK
24AnnuAl RepoRt 2012 - AGR Petroleum Services Holdings AS
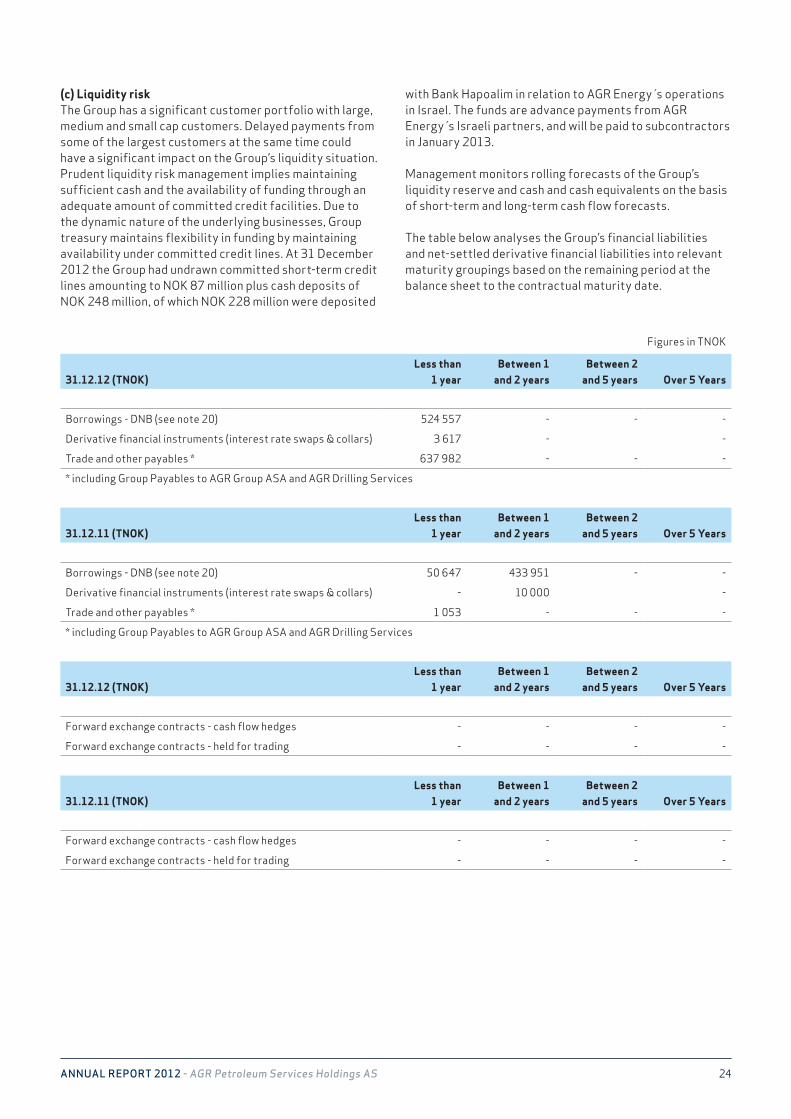
(c) Liquidity riskThe Group has a significant customer portfolio with large, medium and small cap customers. Delayed payments from some of the largest customers at the same time could have a significant impact on the Group’s liquidity situation. Prudent liquidity risk management implies maintaining sufficient cash and the availability of funding through an adequate amount of committed credit facilities. Due to the dynamic nature of the underlying businesses, Group treasury maintains flexibility in funding by maintaining availability under committed credit lines. At 31 December 2012 the Group had undrawn committed short-term credit lines amounting to NOK 87 million plus cash deposits of NOK 248 million, of which NOK 228 million were deposited
with Bank Hapoalim in relation to AGR Energy s operations in Israel. The funds are advance payments from AGR Energy s Israeli partners, and will be paid to subcontractors in January 2013. Management monitors rolling forecasts of the Group’s liquidity reserve and cash and cash equivalents on the basis of short-term and long-term cash flow forecasts.
The table below analyses the Group’s financial liabilities and net-settled derivative financial liabilities into relevant maturity groupings based on the remaining period at the balance sheet to the contractual maturity date.
31.12.12 (TNOK)Less than
1 yearBetween 1
and 2 yearsBetween 2
and 5 years Over 5 Years
Borrowings - DNB (see note 20) 524 557 - - -
Derivative financial instruments (interest rate swaps & collars) 3 617 - -
Trade and other payables * 637 982 - - -
* including Group Payables to AGR Group ASA and AGR Drilling Services
31.12.11 (TNOK)Less than
1 yearBetween 1
and 2 yearsBetween 2
and 5 years Over 5 Years
Borrowings - DNB (see note 20) 50 647 433 951 - -
Derivative financial instruments (interest rate swaps & collars) - 10 000 -
Trade and other payables * 1 053 - - -
* including Group Payables to AGR Group ASA and AGR Drilling Services
31.12.12 (TNOK)Less than
1 yearBetween 1
and 2 yearsBetween 2
and 5 years Over 5 Years
Forward exchange contracts - cash flow hedges - - - -
Forward exchange contracts - held for trading - - - -
31.12.11 (TNOK)Less than
1 yearBetween 1
and 2 yearsBetween 2
and 5 years Over 5 Years
Forward exchange contracts - cash flow hedges - - - -
Forward exchange contracts - held for trading - - - -
Figures in TNOK
25AnnuAl RepoRt 2012 - AGR Petroleum Services Holdings AS
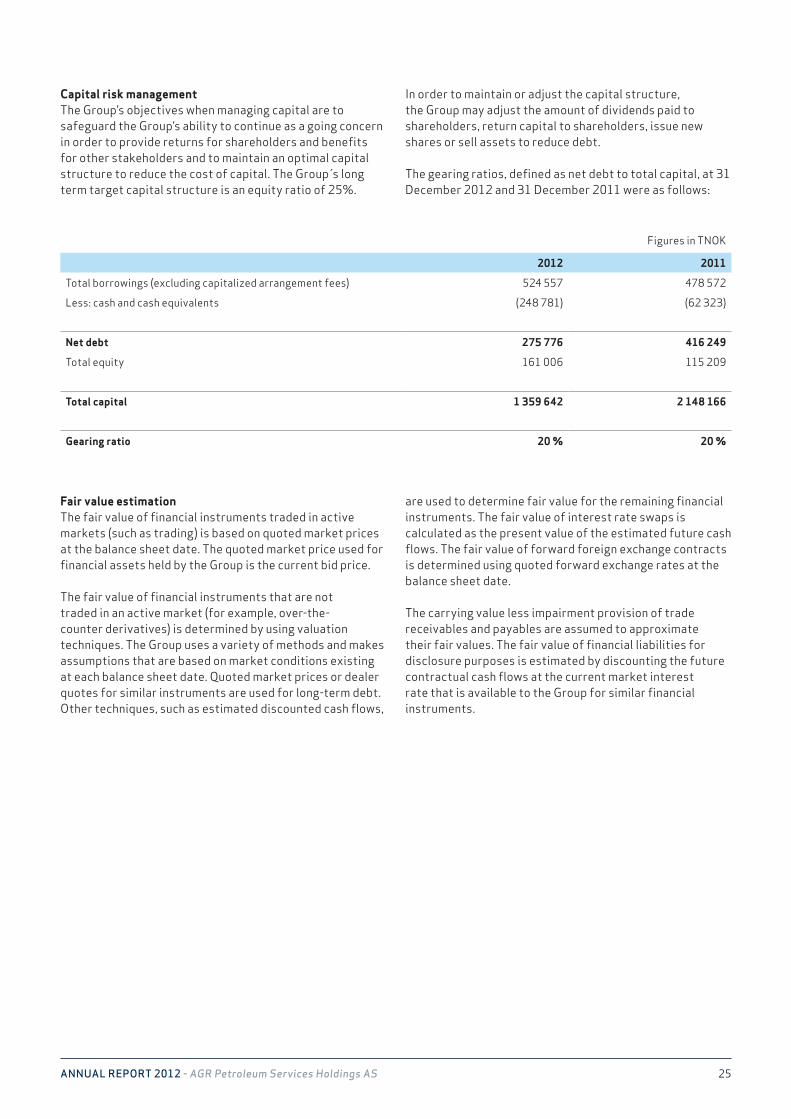
Capital risk managementThe Group’s objectives when managing capital are to safeguard the Group’s ability to continue as a going concern in order to provide returns for shareholders and benefits for other stakeholders and to maintain an optimal capital structure to reduce the cost of capital. The Group s long term target capital structure is an equity ratio of 25%.
In order to maintain or adjust the capital structure, the Group may adjust the amount of dividends paid to shareholders, return capital to shareholders, issue new shares or sell assets to reduce debt. The gearing ratios, defined as net debt to total capital, at 31 December 2012 and 31 December 2011 were as follows:
Fair value estimationThe fair value of financial instruments traded in active markets (such as trading) is based on quoted market prices at the balance sheet date. The quoted market price used for financial assets held by the Group is the current bid price. The fair value of financial instruments that are not traded in an active market (for example, over-the-counter derivatives) is determined by using valuation techniques. The Group uses a variety of methods and makes assumptions that are based on market conditions existing at each balance sheet date. Quoted market prices or dealer quotes for similar instruments are used for long-term debt. Other techniques, such as estimated discounted cash flows,
are used to determine fair value for the remaining financial instruments. The fair value of interest rate swaps is calculated as the present value of the estimated future cash flows. The fair value of forward foreign exchange contracts is determined using quoted forward exchange rates at the balance sheet date. The carrying value less impairment provision of trade receivables and payables are assumed to approximate their fair values. The fair value of financial liabilities for disclosure purposes is estimated by discounting the future contractual cash flows at the current market interest rate that is available to the Group for similar financial instruments.
2012 2011
Total borrowings (excluding capitalized arrangement fees) 524 557 478 572
Less: cash and cash equivalents (248 781) (62 323)
Net debt 275 776 416 249
Total equity 161 006 115 209
Total capital 1 359 642 2 148 166
Gearing ratio 20 % 20 %
Figures in TNOK
26AnnuAl RepoRt 2012 - AGR Petroleum Services Holdings AS
NOTE 03 Critical accounting estimates and judgements
The preparation of consolidated financial statements in accordance with IFRSs and applying the chosen accounting policies requires management to make judgements, estimates and assumptions that affect the reported amounts of revenues, expenses, assets, liabilities, and the disclosure of contingent liabilities. However, uncertainty about these assumptions and estimates could result in outcomes that require material adjustment to the carrying amount of the asset or liability affected in future periods. The estimates and associated assumptions are based on historical experience and various other factors that are believed to be reasonable under the circumstances. Actual results may differ from these estimates. The estimates and the underlying assumptions are reviewed on an ongoing basis. Revision to accounting estimates are recognised in the period in which the estimate is revised if the revision affects only that period, or in the period of the revision and future periods if the revision affects both current and future periods. The accounting policies applied by the Group in which judgements, estimates and assumptions may significantly differ from actual results are addressed below. Impairment of non-current assetsThe Group’s accounts for the impairment of non-current assets in accordance with IAS 36 Impairment of Assets. Under IAS 36 The Group are required to assess the conditions that could cause an asset to become impairment at least annually, and to perform a recoverability test for potentially impaired assets held by the entity. Impairment exists when the carrying value of an assets or cash gene-rating unit exceeds its recoverable amount, which is the higher of its fair value less cost to sell and its value to use. Directly observable market prices rarely exist for the Group ’s assets, however, fair value may be estimated based on recent observed transactions on comparable assets, bids or other discussions of potential transaction involving the asset, or internal models used by the Group for transactions involving the same type of assets. The value in use calculation is based on a discounted cash flow model. The cash flow are derived from budget for the next five years and do not include restructuring activities that the Group is not yet committed to or significant future investments that will enhance the asset’s performance of the cash generating unit being tested. Such estimate are subjects to a number of assumptions including the useful lives of assets, replacement costs and the timing and amounts of certain future cash flows, which may be dependent on future prices, future activity, currency rates, and a suitable discount rate in order to calculate present value. While the Group believe that the assumptions are appropriate, such amounts estimated could differ materially from what will actually occur in the future. Refer to note 9 for disclosure of fixed assets.
Impairment of goodwillIn accounting for the acquisition of business, the Group is required to determine the fair value of assets, liabilities, intangible assets and contingent liabilities at the time of acquisition. In case of business combination achieved in stages, the Group must also estimate the fair value of the existing ownership interest when it gains control. Any excess purchase price is included in goodwill. In the business the Group operates, fair values of individual assets and liabilities are normally not readily observable in active markets, which require the Group to estimate the fair value of acquired assets and liabilities through valuation techniques. Determining whether goodwill is impaired requires an estimation of the value in use of the cash-generating units to which goodwill has been allocated. The value in use calculation requires the management to estimate the future cash flows expected to arise from cash-generating units. See discussion above regarding impairment of non-current assets. According to impairment test performed for 2012 and 2011 the recoverable amounts exceed the carrying amount for the Group. The impairment test of goodwill is not sensitive to an increase of 1 % in the discount rate in 2012 or 2011, or a 2% decrease in margins in 2012 or 2011 compared to management’s estimates.
Fair value measurement of contingent considerationContingent consideration, resulting from business combinations, is valued at fair value at the acquisition date as part of the business combination. When the contingent consideration meets the definitions of a derivate and, thus a financial liability, it is subsequently remeasured to fair value at each reporting date. The determination of the fair value is based on discounted cash flows. The key assumptions take into consideration the probability of meeting each performance target and the discount factor. Refer to note 24 for provisions for business combinations. Capitalised development costsCertain development costs are capitalised when it is probable that a development project will generate future economic benefits and certain criteria, including commercial and technological feasibility, have been met. These costs are then amortised on a systematic basis over their expected useful lives. During the development stage, management must estimate the commercial and technological feasibility of these projects as well as their expected useful lives. Whenever there is an indicator that development costs capitalised for a specific project may be impaired, the recoverable amount of the asset is estimated. See discussion above regarding impairment of non-current assets. Refer to note 8 for disclosure of capitalised development cost.
27AnnuAl RepoRt 2012 - AGR Petroleum Services Holdings AS
Trade receivablesCalculation of provision for impairment of trade receivables is based on a number of estimates. Areas including significant financial difficulties of the debtor, probability that the debtor will enter bankruptcy or financial reorganization, and default or delinquency in payments (more than 30 days overdue) are all considered indicators that the trade receivable is impaired. However, assessing the fair value of the amounts recoverable is highly judgmental and incomplete or incorrect information could lead to significant changes in the recoverable amounts. Refer to note 13 for aging and provision for impairment of trade receivables.
Pension liabilitiesThe fair value of pension liabilities is calculated based on several actuarial and economic assumptions. An actuarial valuation involves making various assumptions that may differ from actual developments in the future. These include the determination of the discount rate, future salary increases, mortality rates and future pension increases. Due to the complexity of the valuation, the underlying assumptions and its long-term nature, a defined benefit obligation is highly sensitive to changes in these assumptions. The discount rate and other assumptions are normally reviewed annually when the actuarial calculation is carried out, unless there are significant changes during the year. Refer to note 18 for disclosure of actuarial assumptions for the Group.
Income taxThe Group calculates income tax expense based on reported income in the different legal entities. Deferred income tax expense is calculated based on the differences between the assets’ carrying value for financial reporting purposes and their respective tax basis that are considered temporary in nature. The total amount of income tax expense and allocation between current and deferred income tax requires management’s interpretation of complex tax laws and regulations in the many tax jurisdictions where the Group operates. Valuation of deferred tax assets is dependent on management’s assessment of future recoverability of the deferred benefit. Expected recoverability may result from expected taxable income in the near future, planned transactions or planned tax optimizing measures. Economic conditions may change and lead to a different conclusion regarding recoverability, and such change may affect the result for each reporting period. Tax authorities in different jurisdictions may challenge the Group’s calculation of tax payable from prior periods. Such process may lead to changes to prior periods’ taxable income, resulting in changes to income tax expense in the period of change. During the period when tax authorities may challenge the taxable income, management is required to make estimates of the probability and size of possible tax adjustments. Such estimates may change as additional information becomes known. Refer to note 19 disclosure of tax.
On 9 May 2012 , the Group has acquired an 80 % shareholding in Steinsvik & Co AS. Headquartered in Stavanger, Steinsvik & Co supplies safety professionals, including safety coaches and internal control officers (ICO), to drilling rigs in the Norwegian market. The firm also provides HSE training for oil companies and performs safety inspections on rigs operating both on the Norwegian sector and internationally.
The purchase price allocation is preliminary as of 31 December 2012, and is subject to changes before 30 June 2013. The guarantee amount of NOK 1.5 million is placed on escrow for 18 months and has been booked as a liability in
the balance sheet as it is likely that it will be paid out to the former shareholders after 18 months . The goodwill arising from the acquisition is mainly connected to the value of the employees. The goodwill is not deductible for tax purposes.
From the date of acquisition, Steinsvik & Co AS has contributed TNOK 29 764 of revenue and TNOK 3 964 of the net profit before tax of the Group.
If the combinations had taken place at the beginning of the year, revenue would have been TNOK 1 274 967 and the profit from continuing operations for the Group would have been TNOK 55 086.
NOTE 04 Business combinations
NOTE 03 Critical accounting estimates and judgements
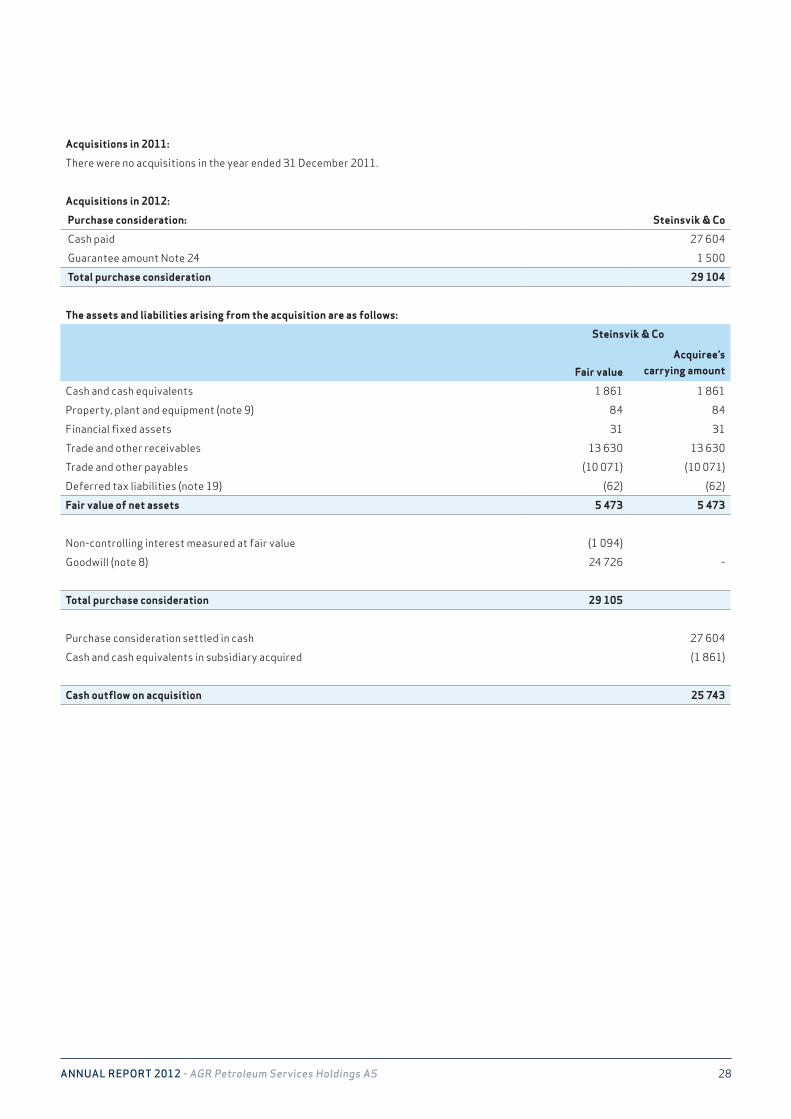
28AnnuAl RepoRt 2012 - AGR Petroleum Services Holdings AS
Acquisitions in 2011:
There were no acquisitions in the year ended 31 December 2011.
Acquisitions in 2012:
Purchase consideration: Steinsvik & Co
Cash paid 27 604
Guarantee amount Note 24 1 500
Total purchase consideration 29 104
The assets and liabilities arising from the acquisition are as follows:
Steinsvik & Co
Acquiree’s carrying amountFair value
Cash and cash equivalents 1 861 1 861
Property, plant and equipment (note 9) 84 84
Financial fixed assets 31 31
Trade and other receivables 13 630 13 630
Trade and other payables (10 071) (10 071)
Deferred tax liabilities (note 19) (62) (62)
Fair value of net assets 5 473 5 473
Non-controlling interest measured at fair value (1 094)
Goodwill (note 8) 24 726 -
Total purchase consideration 29 105
Purchase consideration settled in cash 27 604
Cash and cash equivalents in subsidiary acquired (1 861)
Cash outflow on acquisition 25 743
NOTE 04 Business combinations
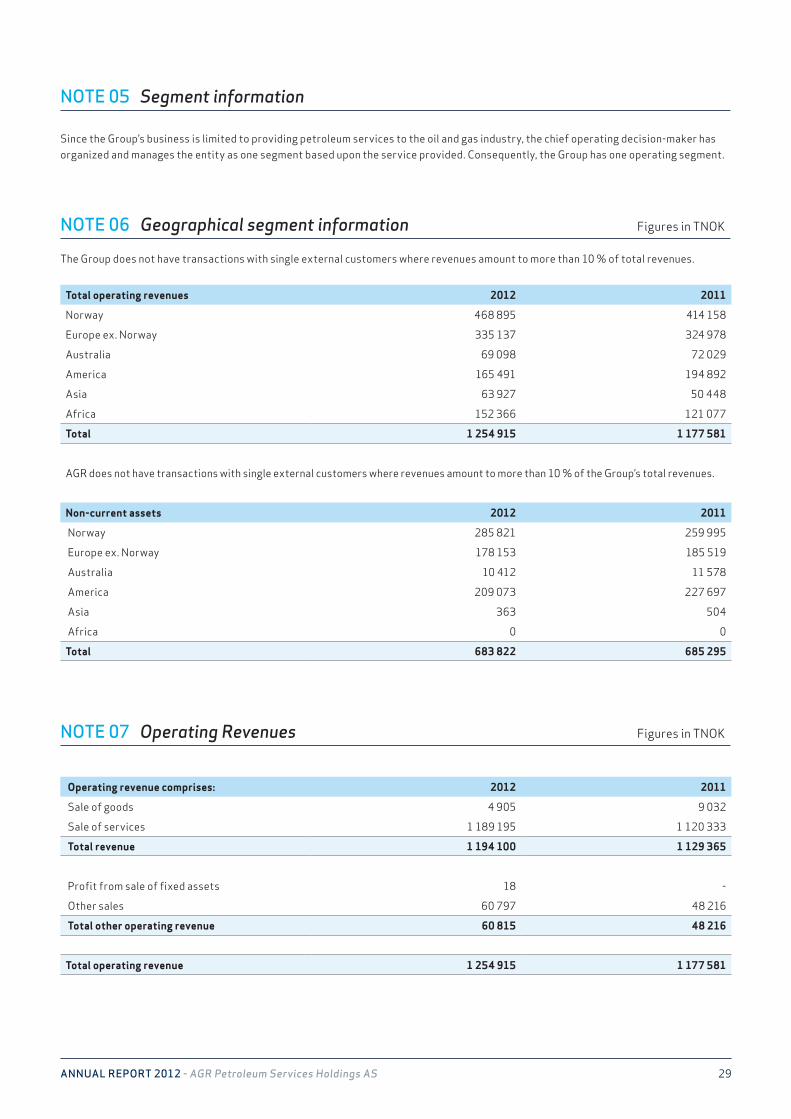
29AnnuAl RepoRt 2012 - AGR Petroleum Services Holdings AS
Since the Group’s business is limited to providing petroleum services to the oil and gas industry, the chief operating decision-maker has organized and manages the entity as one segment based upon the service provided. Consequently, the Group has one operating segment.
NOTE 05 Segment information
NOTE 06 Geographical segment information Figures in TNOK
The Group does not have transactions with single external customers where revenues amount to more than 10 % of total revenues.
NOTE 07 Operating Revenues Figures in TNOK
Total operating revenues 2012 2011
Norway 468 895 414 158
Europe ex. Norway 335 137 324 978
Australia 69 098 72 029
America 165 491 194 892
Asia 63 927 50 448
Africa 152 366 121 077
Total 1 254 915 1 177 581
AGR does not have transactions with single external customers where revenues amount to more than 10 % of the Group’s total revenues.
Non-current assets 2012 2011
Norway 285 821 259 995
Europe ex. Norway 178 153 185 519
Australia 10 412 11 578
America 209 073 227 697
Asia 363 504
Africa 0 0
Total 683 822 685 295
Operating revenue comprises: 2012 2011
Sale of goods 4 905 9 032
Sale of services 1 189 195 1 120 333
Total revenue 1 194 100 1 129 365
Profit from sale of fixed assets 18 -
Other sales 60 797 48 216
Total other operating revenue 60 815 48 216
Total operating revenue 1 254 915 1 177 581
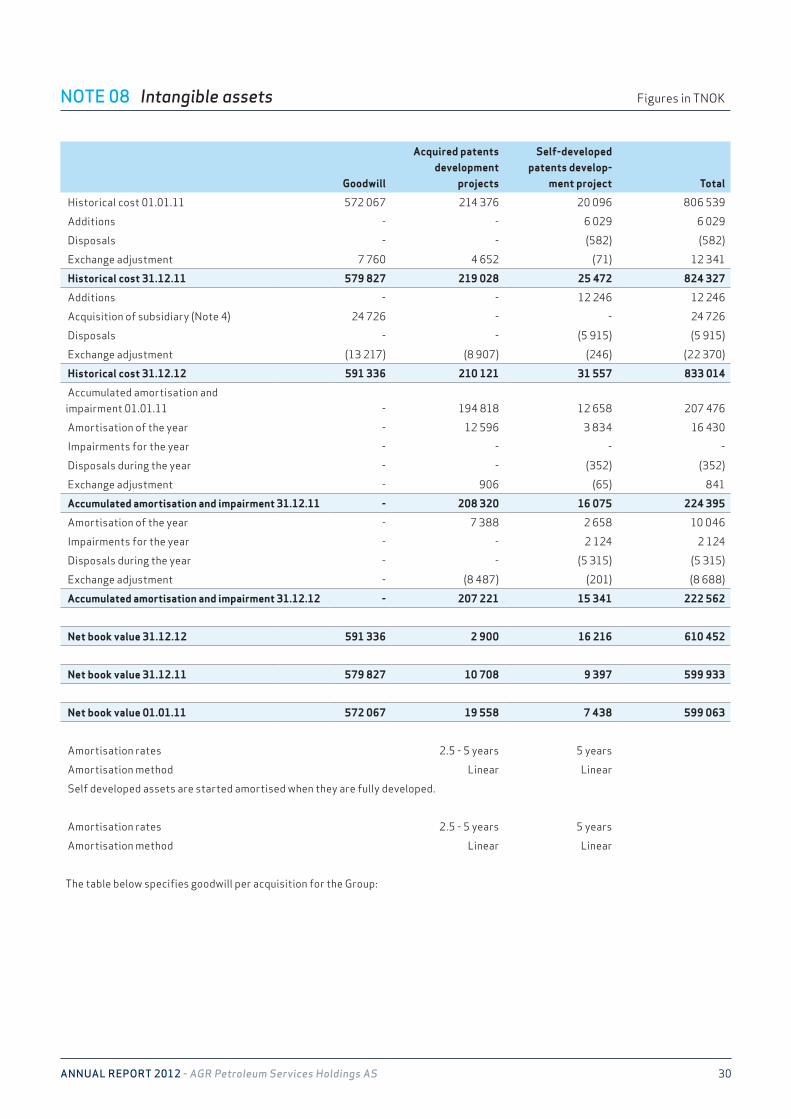
30AnnuAl RepoRt 2012 - AGR Petroleum Services Holdings AS
NOTE 08 Intangible assets Figures in TNOK
Goodwill
Acquired patents development
projects
Self-developed patents develop-
ment project Total
Historical cost 01.01.11 572 067 214 376 20 096 806 539
Additions - - 6 029 6 029
Disposals - - (582) (582)
Exchange adjustment 7 760 4 652 (71) 12 341
Historical cost 31.12.11 579 827 219 028 25 472 824 327
Additions - - 12 246 12 246
Acquisition of subsidiary (Note 4) 24 726 - - 24 726
Disposals - - (5 915) (5 915)
Exchange adjustment (13 217) (8 907) (246) (22 370)
Historical cost 31.12.12 591 336 210 121 31 557 833 014
Accumulated amortisation and impairment 01.01.11 - 194 818 12 658 207 476
Amortisation of the year - 12 596 3 834 16 430
Impairments for the year - - - -
Disposals during the year - - (352) (352)
Exchange adjustment - 906 (65) 841
Accumulated amortisation and impairment 31.12.11 - 208 320 16 075 224 395
Amortisation of the year - 7 388 2 658 10 046
Impairments for the year - - 2 124 2 124
Disposals during the year - - (5 315) (5 315)
Exchange adjustment - (8 487) (201) (8 688)
Accumulated amortisation and impairment 31.12.12 - 207 221 15 341 222 562
Net book value 31.12.12 591 336 2 900 16 216 610 452
Net book value 31.12.11 579 827 10 708 9 397 599 933
Net book value 01.01.11 572 067 19 558 7 438 599 063
Amortisation rates 2.5 - 5 years 5 years
Amortisation method Linear Linear
Self developed assets are started amortised when they are fully developed.
Amortisation rates 2.5 - 5 years 5 years
Amortisation method Linear Linear
The table below specifies goodwill per acquisition for the Group:
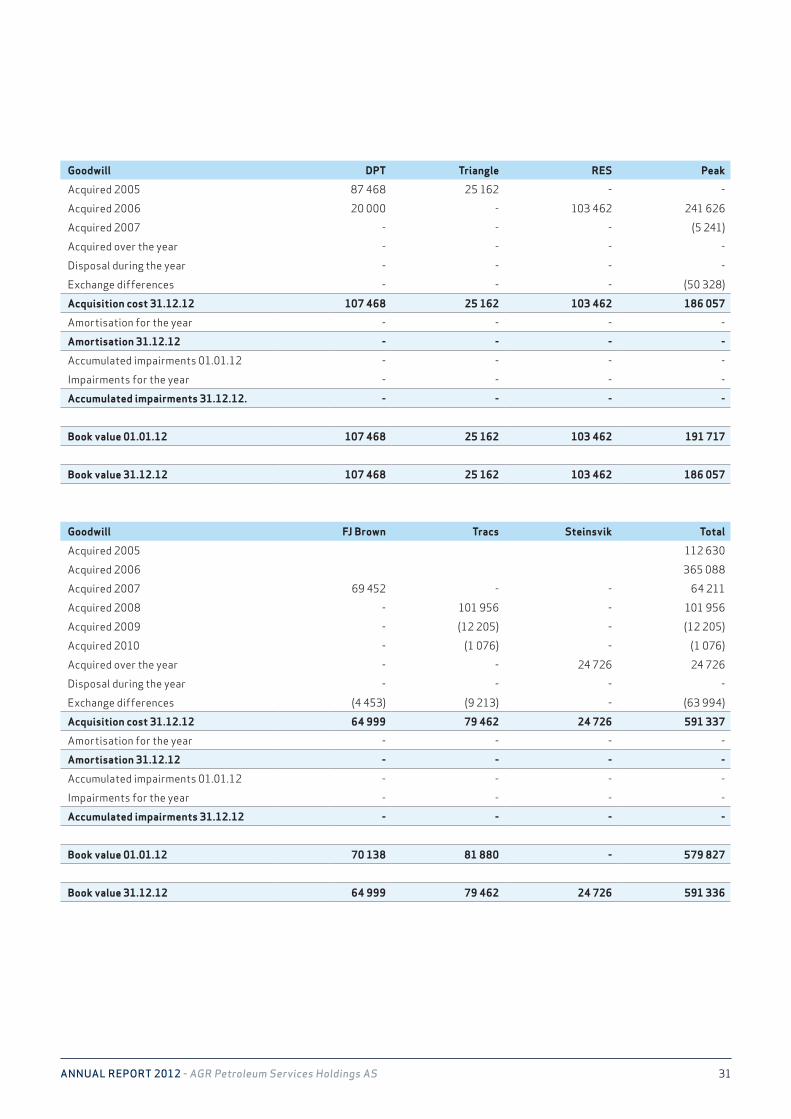
31AnnuAl RepoRt 2012 - AGR Petroleum Services Holdings AS
Goodwill DPT Triangle RES Peak
Acquired 2005 87 468 25 162 - -
Acquired 2006 20 000 - 103 462 241 626
Acquired 2007 - - - (5 241)
Acquired over the year - - - -
Disposal during the year - - - -
Exchange differences - - - (50 328)
Acquisition cost 31.12.12 107 468 25 162 103 462 186 057
Amortisation for the year - - - -
Amortisation 31.12.12 - - - -
Accumulated impairments 01.01.12 - - - -
Impairments for the year - - - -
Accumulated impairments 31.12.12. - - - -
Book value 01.01.12 107 468 25 162 103 462 191 717
Book value 31.12.12 107 468 25 162 103 462 186 057
Goodwill FJ Brown Tracs Steinsvik Total
Acquired 2005 112 630
Acquired 2006 365 088
Acquired 2007 69 452 - - 64 211
Acquired 2008 - 101 956 - 101 956
Acquired 2009 - (12 205) - (12 205)
Acquired 2010 - (1 076) - (1 076)
Acquired over the year - - 24 726 24 726
Disposal during the year - - - -
Exchange differences (4 453) (9 213) - (63 994)
Acquisition cost 31.12.12 64 999 79 462 24 726 591 337
Amortisation for the year - - - -
Amortisation 31.12.12 - - - -
Accumulated impairments 01.01.12 - - - -
Impairments for the year - - - -
Accumulated impairments 31.12.12 - - - -
Book value 01.01.12 70 138 81 880 - 579 827
Book value 31.12.12 64 999 79 462 24 726 591 336
NOTE 08 Intangible assets Figures in TNOK
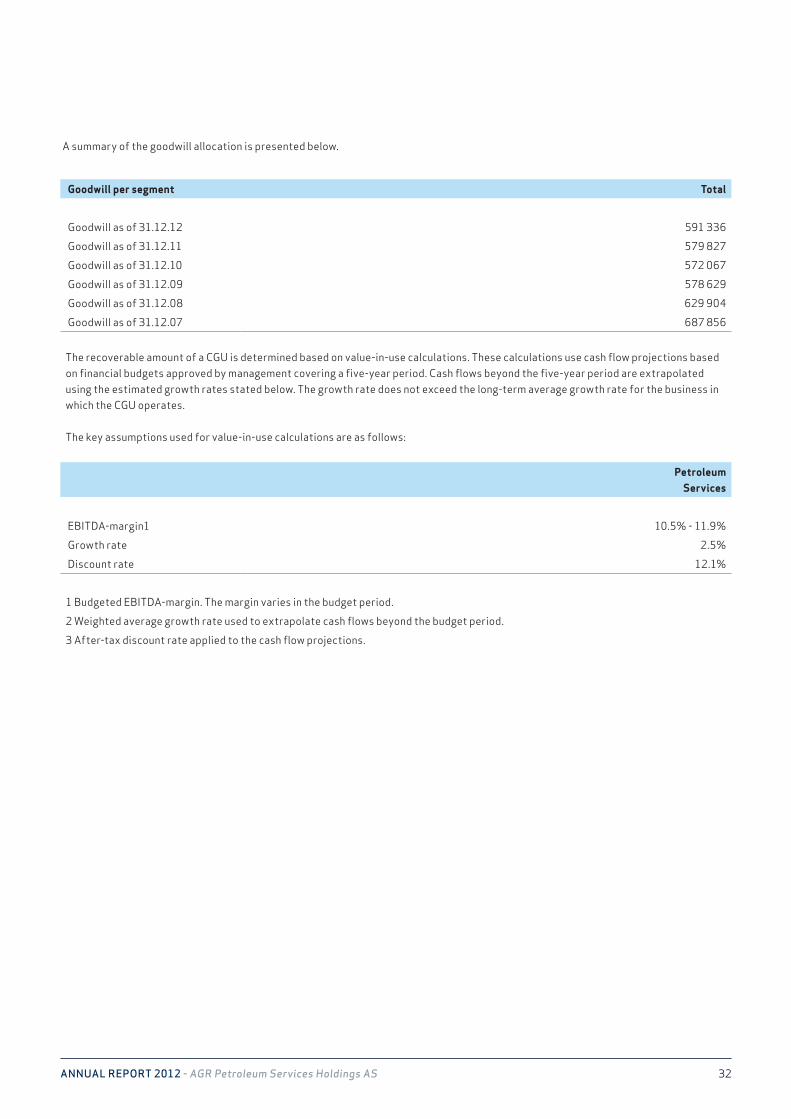
32AnnuAl RepoRt 2012 - AGR Petroleum Services Holdings AS
NOTE 08 Intangible assets Figures in TNOK
A summary of the goodwill allocation is presented below.
Goodwill per segment Total
Goodwill as of 31.12.12 591 336
Goodwill as of 31.12.11 579 827
Goodwill as of 31.12.10 572 067
Goodwill as of 31.12.09 578 629
Goodwill as of 31.12.08 629 904
Goodwill as of 31.12.07 687 856
The recoverable amount of a CGU is determined based on value-in-use calculations. These calculations use cash flow projections based on financial budgets approved by management covering a five-year period. Cash flows beyond the five-year period are extrapolated using the estimated growth rates stated below. The growth rate does not exceed the long-term average growth rate for the business in which the CGU operates.
The key assumptions used for value-in-use calculations are as follows:
Petroleum Services
EBITDA-margin1 10.5% - 11.9%
Growth rate 2.5%
Discount rate 12.1%
1 Budgeted EBITDA-margin. The margin varies in the budget period.
2 Weighted average growth rate used to extrapolate cash flows beyond the budget period.
3 After-tax discount rate applied to the cash flow projections.
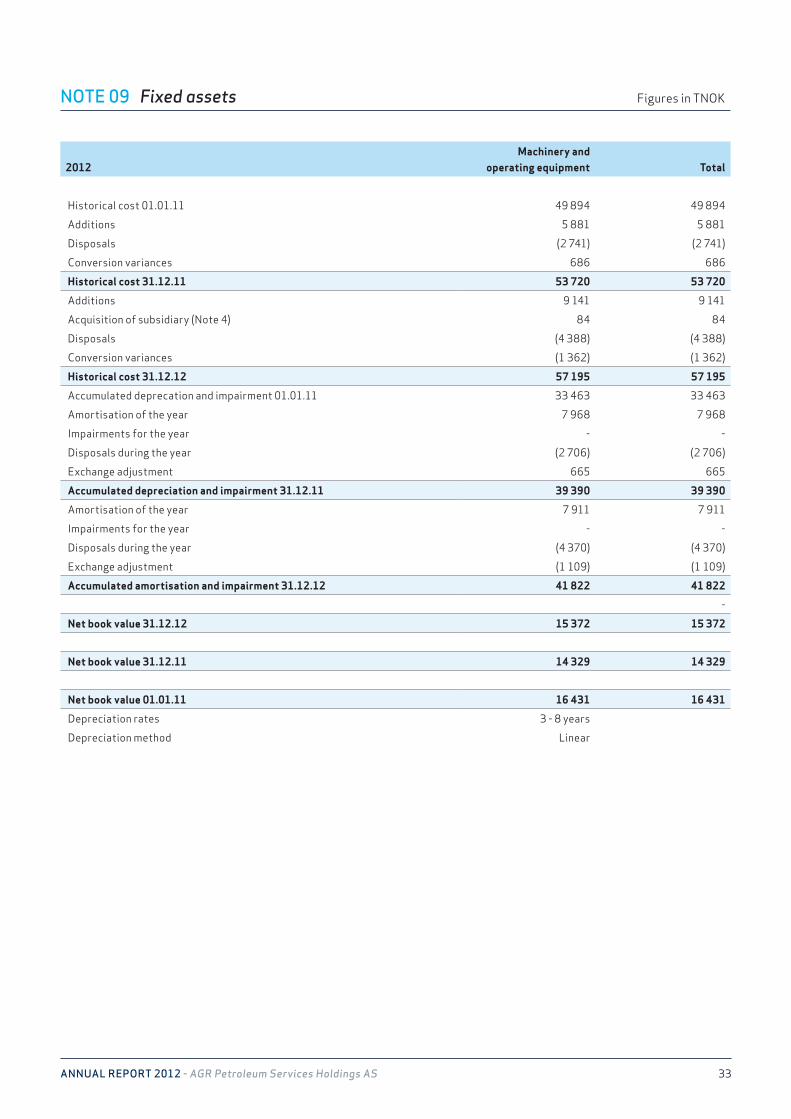
33AnnuAl RepoRt 2012 - AGR Petroleum Services Holdings AS
NOTE 09 Fixed assets Figures in TNOK
2012 Machinery and
operating equipment Total
Historical cost 01.01.11 49 894 49 894
Additions 5 881 5 881
Disposals (2 741) (2 741)
Conversion variances 686 686
Historical cost 31.12.11 53 720 53 720
Additions 9 141 9 141
Acquisition of subsidiary (Note 4) 84 84
Disposals (4 388) (4 388)
Conversion variances (1 362) (1 362)
Historical cost 31.12.12 57 195 57 195
Accumulated deprecation and impairment 01.01.11 33 463 33 463
Amortisation of the year 7 968 7 968
Impairments for the year - -
Disposals during the year (2 706) (2 706)
Exchange adjustment 665 665
Accumulated depreciation and impairment 31.12.11 39 390 39 390
Amortisation of the year 7 911 7 911
Impairments for the year - -
Disposals during the year (4 370) (4 370)
Exchange adjustment (1 109) (1 109)
Accumulated amortisation and impairment 31.12.12 41 822 41 822
-
Net book value 31.12.12 15 372 15 372
Net book value 31.12.11 14 329 14 329
Net book value 01.01.11 16 431 16 431
Depreciation rates 3 - 8 years
Depreciation method Linear
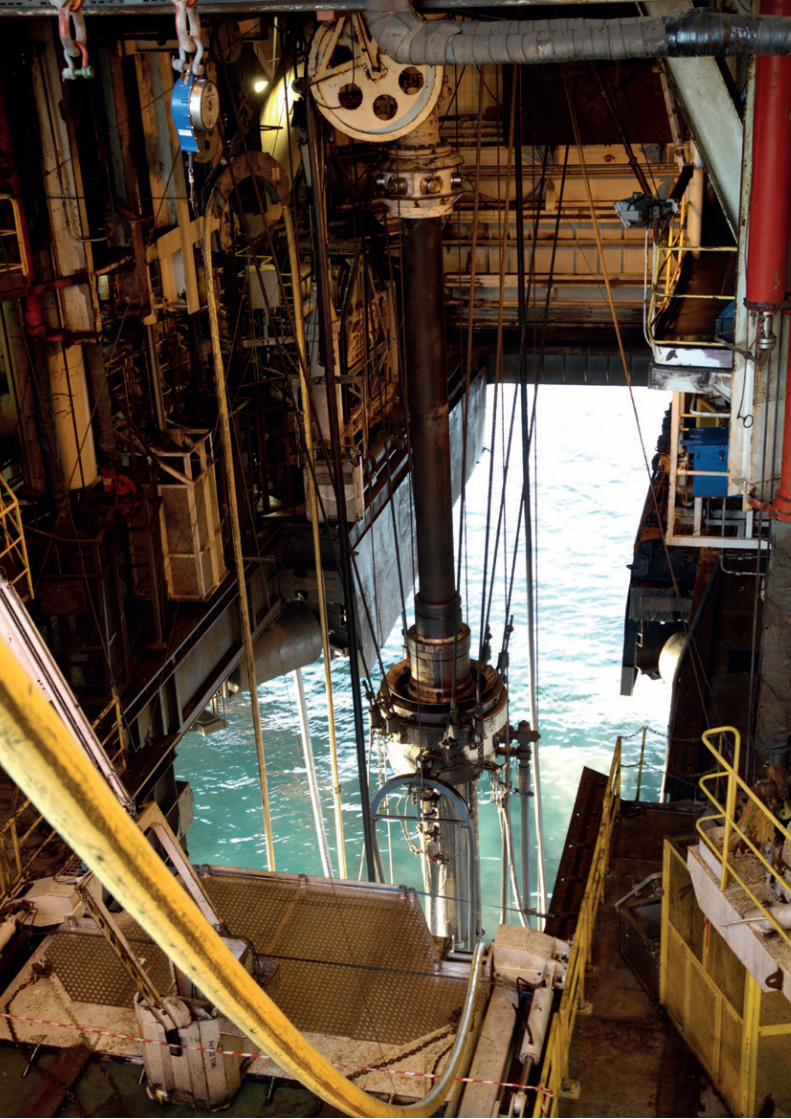
34AnnuAl RepoRt 2012 - AGR Petroleum Services Holdings AS
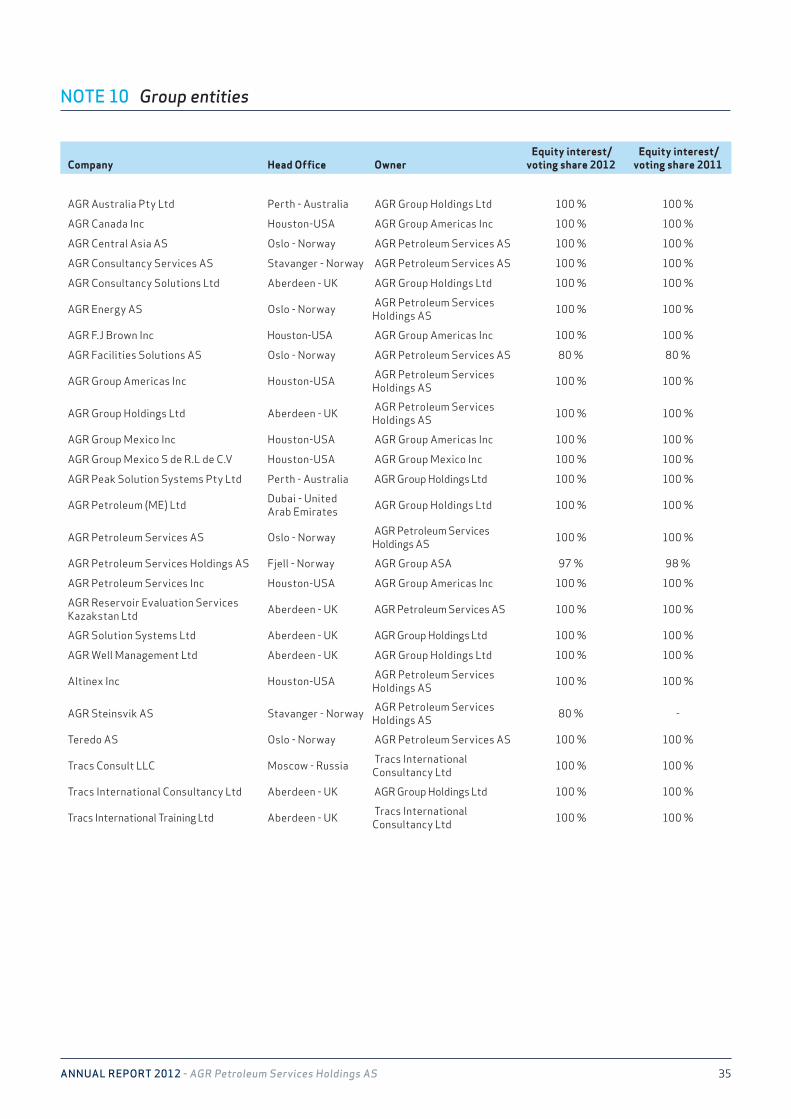
35AnnuAl RepoRt 2012 - AGR Petroleum Services Holdings AS
NOTE 10 Group entities
Company Head Office Owner Equity interest/
voting share 2012 Equity interest/
voting share 2011
AGR Australia Pty Ltd Perth - Australia AGR Group Holdings Ltd 100 % 100 %
AGR Canada Inc Houston-USA AGR Group Americas Inc 100 % 100 %
AGR Central Asia AS Oslo - Norway AGR Petroleum Services AS 100 % 100 %
AGR Consultancy Services AS Stavanger - Norway AGR Petroleum Services AS 100 % 100 %
AGR Consultancy Solutions Ltd Aberdeen - UK AGR Group Holdings Ltd 100 % 100 %
AGR Energy AS Oslo - Norway AGR Petroleum Services Holdings AS 100 % 100 %
AGR F.J Brown Inc Houston-USA AGR Group Americas Inc 100 % 100 %
AGR Facilities Solutions AS Oslo - Norway AGR Petroleum Services AS 80 % 80 %
AGR Group Americas Inc Houston-USA AGR Petroleum Services Holdings AS 100 % 100 %
AGR Group Holdings Ltd Aberdeen - UK AGR Petroleum Services Holdings AS 100 % 100 %
AGR Group Mexico Inc Houston-USA AGR Group Americas Inc 100 % 100 %
AGR Group Mexico S de R.L de C.V Houston-USA AGR Group Mexico Inc 100 % 100 %
AGR Peak Solution Systems Pty Ltd Perth - Australia AGR Group Holdings Ltd 100 % 100 %
AGR Petroleum (ME) Ltd Dubai - United Arab Emirates AGR Group Holdings Ltd 100 % 100 %
AGR Petroleum Services AS Oslo - Norway AGR Petroleum Services Holdings AS 100 % 100 %
AGR Petroleum Services Holdings AS Fjell - Norway AGR Group ASA 97 % 98 %
AGR Petroleum Services Inc Houston-USA AGR Group Americas Inc 100 % 100 %
AGR Reservoir Evaluation Services Kazakstan Ltd Aberdeen - UK AGR Petroleum Services AS 100 % 100 %
AGR Solution Systems Ltd Aberdeen - UK AGR Group Holdings Ltd 100 % 100 %
AGR Well Management Ltd Aberdeen - UK AGR Group Holdings Ltd 100 % 100 %
Altinex Inc Houston-USA AGR Petroleum Services Holdings AS 100 % 100 %
AGR Steinsvik AS Stavanger - Norway AGR Petroleum Services Holdings AS 80 % -
Teredo AS Oslo - Norway AGR Petroleum Services AS 100 % 100 %
Tracs Consult LLC Moscow - Russia Tracs International Consultancy Ltd 100 % 100 %
Tracs International Consultancy Ltd Aberdeen - UK AGR Group Holdings Ltd 100 % 100 %
Tracs International Training Ltd Aberdeen - UK Tracs International Consultancy Ltd 100 % 100 %
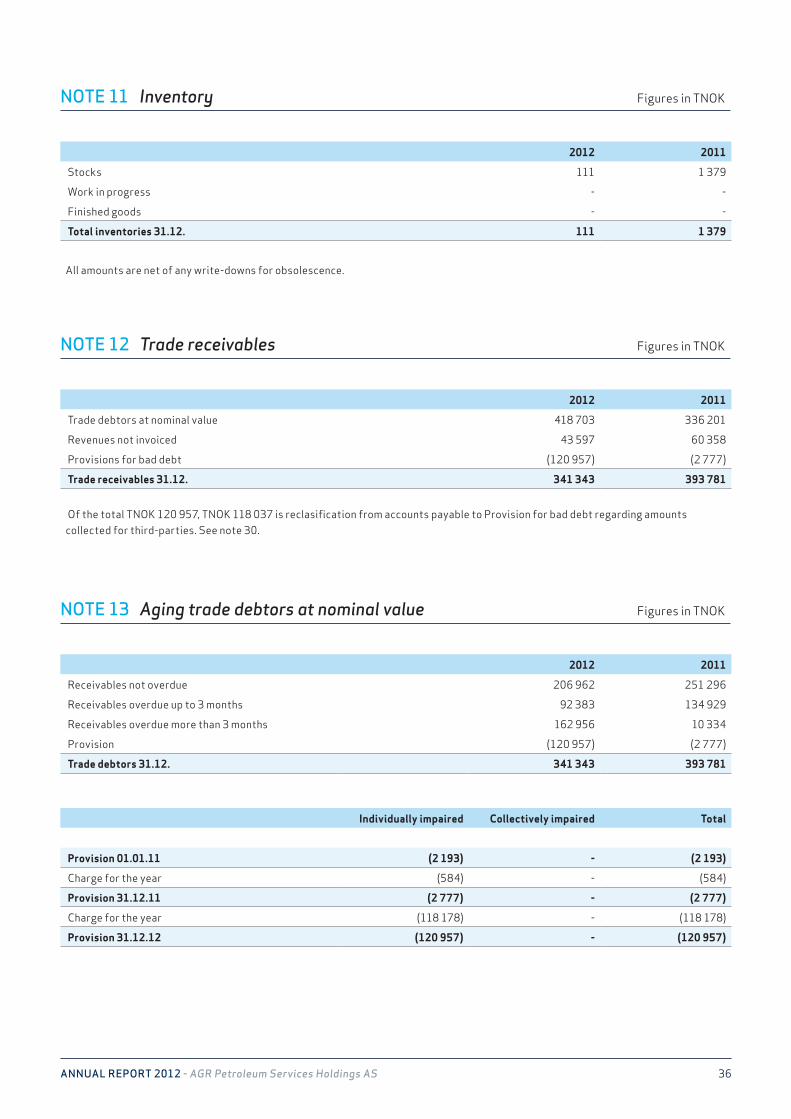
36AnnuAl RepoRt 2012 - AGR Petroleum Services Holdings AS
2012 2011
Stocks 111 1 379
Work in progress - -
Finished goods - -
Total inventories 31.12. 111 1 379
All amounts are net of any write-downs for obsolescence.
2012 2011
Trade debtors at nominal value 418 703 336 201
Revenues not invoiced 43 597 60 358
Provisions for bad debt (120 957) (2 777)
Trade receivables 31.12. 341 343 393 781
Of the total TNOK 120 957, TNOK 118 037 is reclasification from accounts payable to Provision for bad debt regarding amounts collected for third-parties. See note 30.
2012 2011
Receivables not overdue 206 962 251 296
Receivables overdue up to 3 months 92 383 134 929
Receivables overdue more than 3 months 162 956 10 334
Provision (120 957) (2 777)
Trade debtors 31.12. 341 343 393 781
Individually impaired Collectively impaired Total
Provision 01.01.11 (2 193) - (2 193)
Charge for the year (584) - (584)
Provision 31.12.11 (2 777) - (2 777)
Charge for the year (118 178) - (118 178)
Provision 31.12.12 (120 957) - (120 957)
NOTE 11 Inventory Figures in TNOK
NOTE 12 Trade receivables Figures in TNOK
NOTE 13 Aging trade debtors at nominal value Figures in TNOK
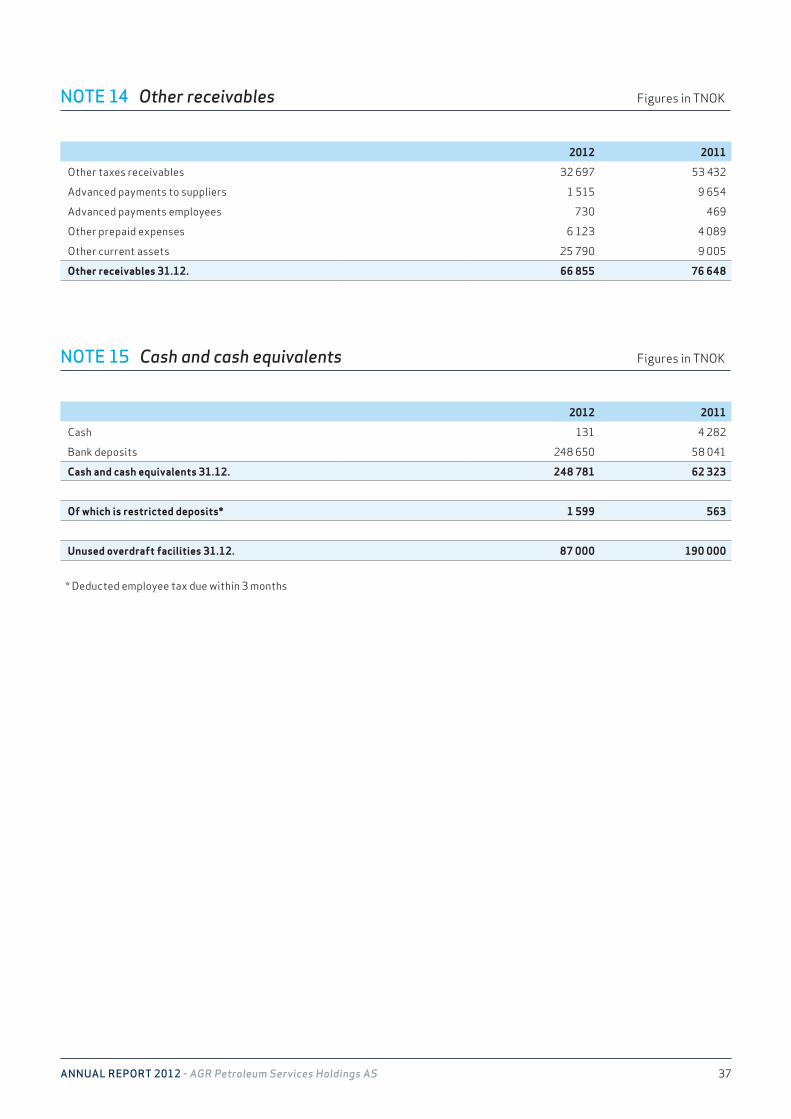
37AnnuAl RepoRt 2012 - AGR Petroleum Services Holdings AS
2012 2011
Other taxes receivables 32 697 53 432
Advanced payments to suppliers 1 515 9 654
Advanced payments employees 730 469
Other prepaid expenses 6 123 4 089
Other current assets 25 790 9 005
Other receivables 31.12. 66 855 76 648
2012 2011
Cash 131 4 282
Bank deposits 248 650 58 041
Cash and cash equivalents 31.12. 248 781 62 323
Of which is restricted deposits* 1 599 563
Unused overdraft facilities 31.12. 87 000 190 000
* Deducted employee tax due within 3 months
NOTE 14 Other receivables Figures in TNOK
NOTE 15 Cash and cash equivalents Figures in TNOK
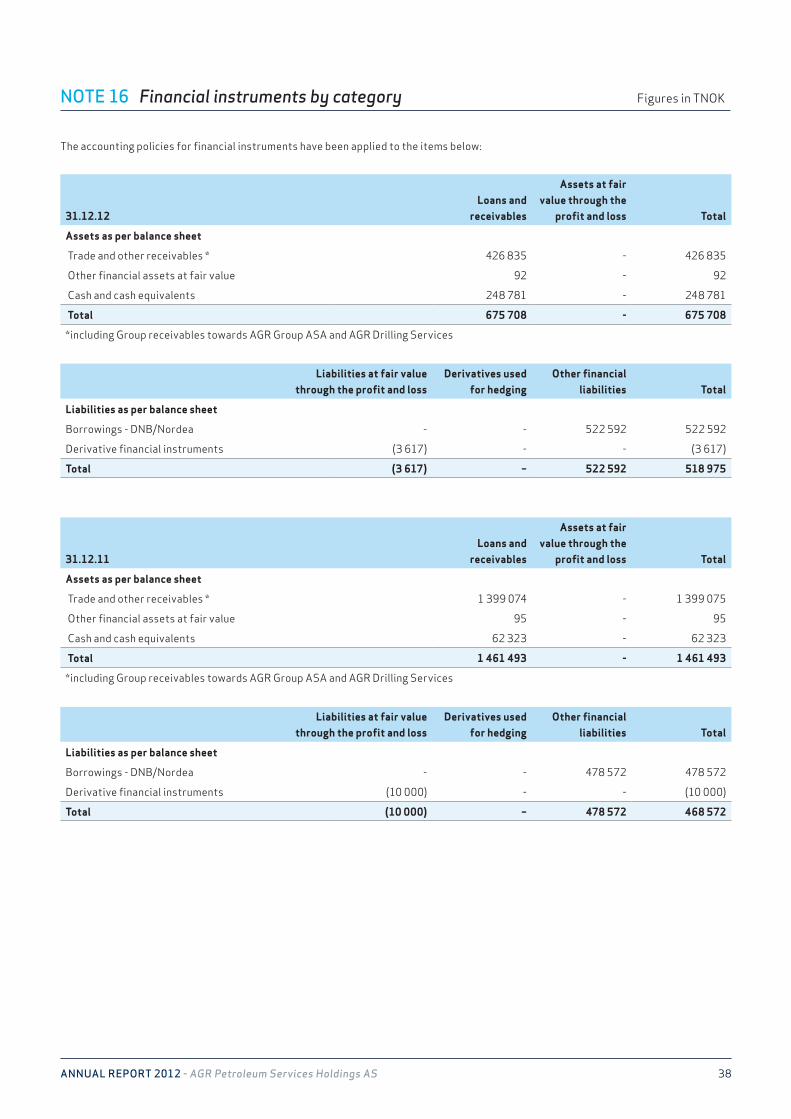
38AnnuAl RepoRt 2012 - AGR Petroleum Services Holdings AS
31.12.12Loans and
receivables
Assets at fair value through the
profit and loss Total
Assets as per balance sheet
Trade and other receivables * 426 835 - 426 835
Other financial assets at fair value 92 - 92
Cash and cash equivalents 248 781 - 248 781
Total 675 708 - 675 708
*including Group receivables towards AGR Group ASA and AGR Drilling Services
Liabilities at fair value through the profit and loss
Derivatives used for hedging
Other financial liabilities Total
Liabilities as per balance sheet
Borrowings - DNB/Nordea - - 522 592 522 592
Derivative financial instruments (3 617) - - (3 617)
Total (3 617) − 522 592 518 975
31.12.11Loans and
receivables
Assets at fair value through the
profit and loss Total
Assets as per balance sheet
Trade and other receivables * 1 399 074 - 1 399 075
Other financial assets at fair value 95 - 95
Cash and cash equivalents 62 323 - 62 323
Total 1 461 493 - 1 461 493
*including Group receivables towards AGR Group ASA and AGR Drilling Services
Liabilities at fair value through the profit and loss
Derivatives used for hedging
Other financial liabilities Total
Liabilities as per balance sheet
Borrowings - DNB/Nordea - - 478 572 478 572
Derivative financial instruments (10 000) - - (10 000)
Total (10 000) − 478 572 468 572
The accounting policies for financial instruments have been applied to the items below:
NOTE 16 Financial instruments by category Figures in TNOK
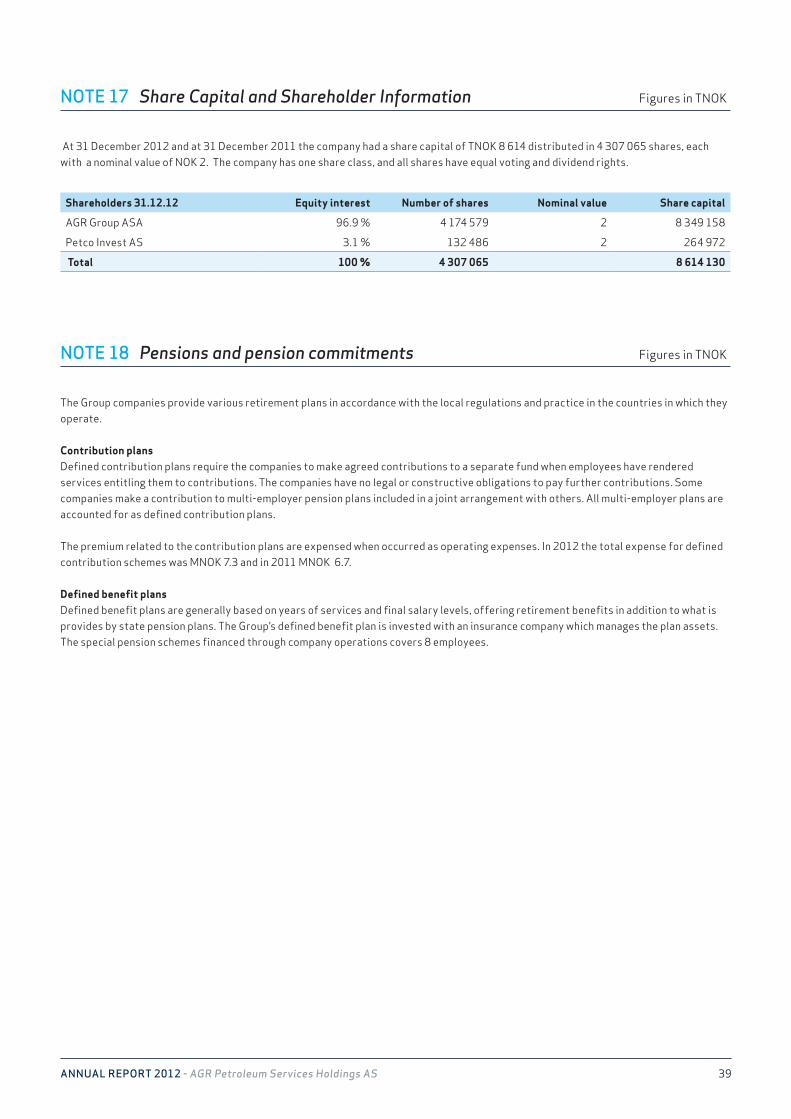
39AnnuAl RepoRt 2012 - AGR Petroleum Services Holdings AS
NOTE 17 Share Capital and Shareholder Information Figures in TNOK
Shareholders 31.12.12 Equity interest Number of shares Nominal value Share capital
AGR Group ASA 96.9 % 4 174 579 2 8 349 158
Petco Invest AS 3.1 % 132 486 2 264 972
Total 100 % 4 307 065 8 614 130
At 31 December 2012 and at 31 December 2011 the company had a share capital of TNOK 8 614 distributed in 4 307 065 shares, each with a nominal value of NOK 2. The company has one share class, and all shares have equal voting and dividend rights.
NOTE 18 Pensions and pension commitments Figures in TNOK
The Group companies provide various retirement plans in accordance with the local regulations and practice in the countries in which they operate. Contribution plansDefined contribution plans require the companies to make agreed contributions to a separate fund when employees have rendered services entitling them to contributions. The companies have no legal or constructive obligations to pay further contributions. Some companies make a contribution to multi-employer pension plans included in a joint arrangement with others. All multi-employer plans are accounted for as defined contribution plans. The premium related to the contribution plans are expensed when occurred as operating expenses. In 2012 the total expense for defined contribution schemes was MNOK 7.3 and in 2011 MNOK 6.7. Defined benefit plansDefined benefit plans are generally based on years of services and final salary levels, offering retirement benefits in addition to what is provides by state pension plans. The Group’s defined benefit plan is invested with an insurance company which manages the plan assets. The special pension schemes financed through company operations covers 8 employees.
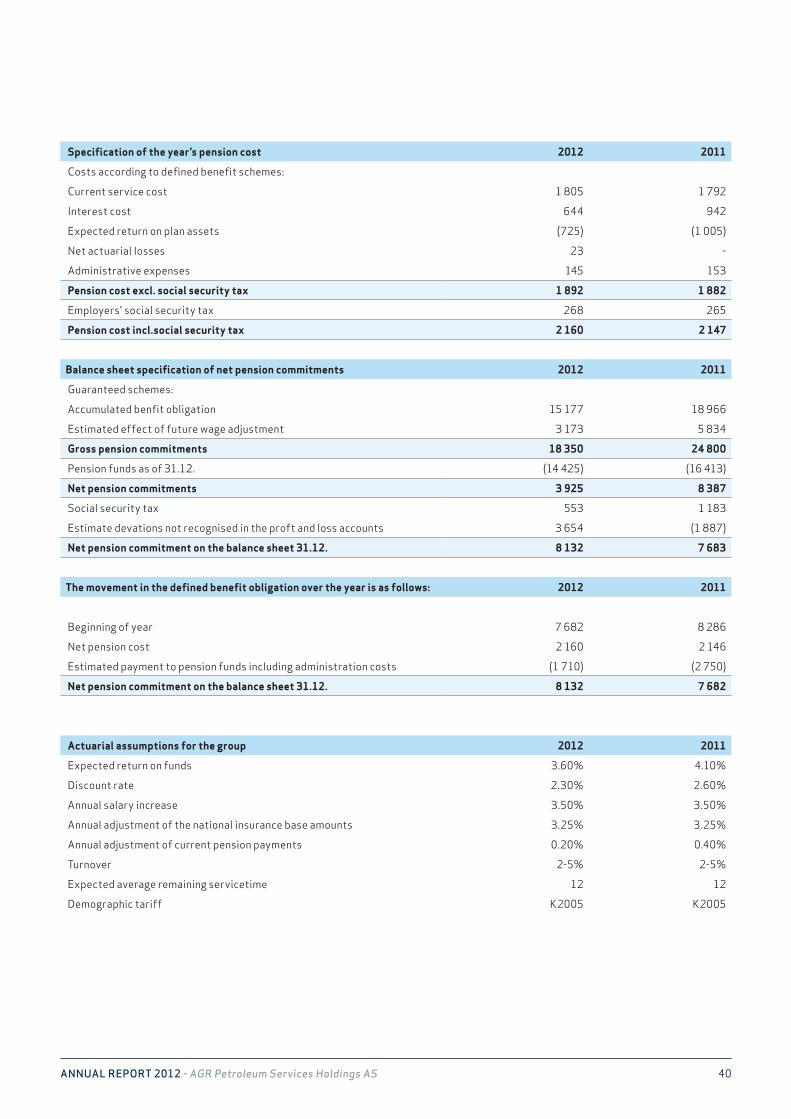
40AnnuAl RepoRt 2012 - AGR Petroleum Services Holdings AS
NOTE 18 Pensions and pension commitments Figures in TNOK
Specification of the year’s pension cost 2012 2011
Costs according to defined benefit schemes:
Current service cost 1 805 1 792
Interest cost 644 942
Expected return on plan assets (725) (1 005)
Net actuarial losses 23 -
Administrative expenses 145 153
Pension cost excl. social security tax 1 892 1 882
Employers' social security tax 268 265
Pension cost incl.social security tax 2 160 2 147
Balance sheet specification of net pension commitments 2012 2011
Guaranteed schemes:
Accumulated benfit obligation 15 177 18 966
Estimated effect of future wage adjustment 3 173 5 834
Gross pension commitments 18 350 24 800
Pension funds as of 31.12. (14 425) (16 413)
Net pension commitments 3 925 8 387
Social security tax 553 1 183
Estimate devations not recognised in the proft and loss accounts 3 654 (1 887)
Net pension commitment on the balance sheet 31.12. 8 132 7 683
The movement in the defined benefit obligation over the year is as follows: 2012 2011
Beginning of year 7 682 8 286
Net pension cost 2 160 2 146
Estimated payment to pension funds including administration costs (1 710) (2 750)
Net pension commitment on the balance sheet 31.12. 8 132 7 682
Actuarial assumptions for the group 2012 2011
Expected return on funds 3.60% 4.10%
Discount rate 2.30% 2.60%
Annual salary increase 3.50% 3.50%
Annual adjustment of the national insurance base amounts 3.25% 3.25%
Annual adjustment of current pension payments 0.20% 0.40%
Turnover 2-5% 2-5%
Expected average remaining servicetime 12 12
Demographic tariff K2005 K2005
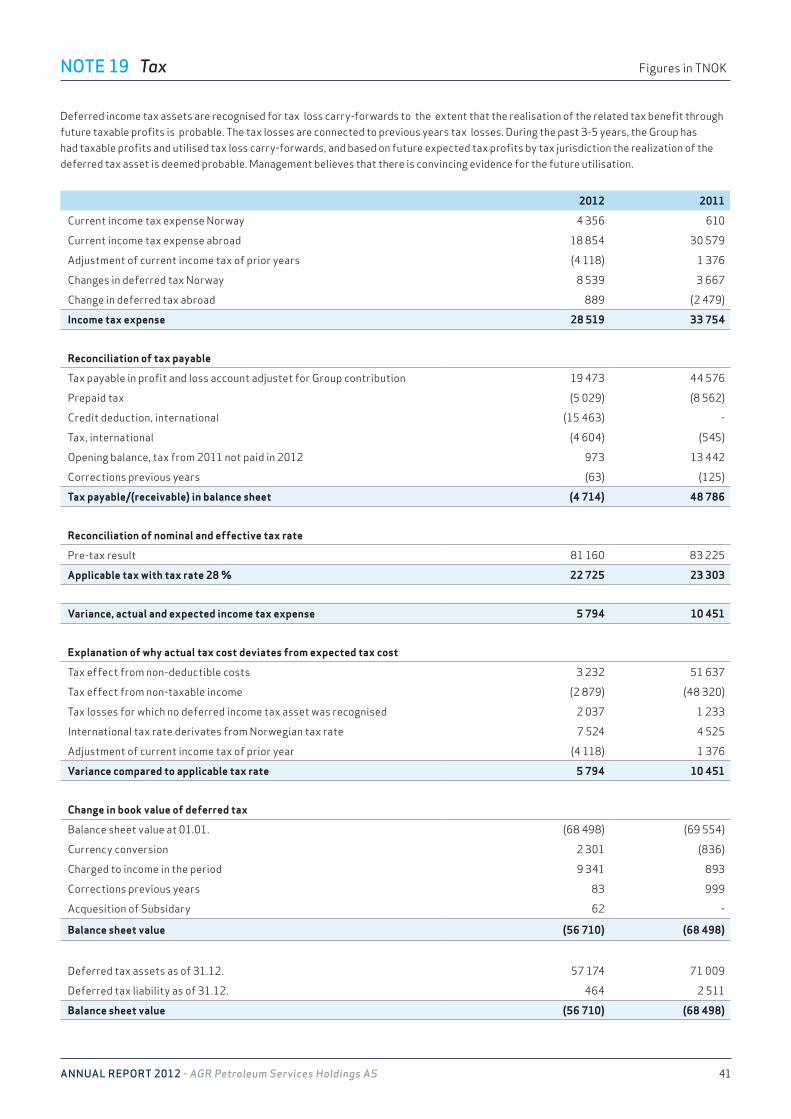
41AnnuAl RepoRt 2012 - AGR Petroleum Services Holdings AS
NOTE 19 Tax Figures in TNOK
2012 2011
Current income tax expense Norway 4 356 610
Current income tax expense abroad 18 854 30 579
Adjustment of current income tax of prior years (4 118) 1 376
Changes in deferred tax Norway 8 539 3 667
Change in deferred tax abroad 889 (2 479)
Income tax expense 28 519 33 754
Reconciliation of tax payable
Tax payable in profit and loss account adjustet for Group contribution 19 473 44 576
Prepaid tax (5 029) (8 562)
Credit deduction, international (15 463) -
Tax, international (4 604) (545)
Opening balance, tax from 2011 not paid in 2012 973 13 442
Corrections previous years (63) (125)
Tax payable/(receivable) in balance sheet (4 714) 48 786
Reconciliation of nominal and effective tax rate
Pre-tax result 81 160 83 225
Applicable tax with tax rate 28 % 22 725 23 303
Variance, actual and expected income tax expense 5 794 10 451
Explanation of why actual tax cost deviates from expected tax cost
Tax effect from non-deductible costs 3 232 51 637
Tax effect from non-taxable income (2 879) (48 320)
Tax losses for which no deferred income tax asset was recognised 2 037 1 233
International tax rate derivates from Norwegian tax rate 7 524 4 525
Adjustment of current income tax of prior year (4 118) 1 376
Variance compared to applicable tax rate 5 794 10 451
Change in book value of deferred tax
Balance sheet value at 01.01. (68 498) (69 554)
Currency conversion 2 301 (836)
Charged to income in the period 9 341 893
Corrections previous years 83 999
Acquesition of Subsidary 62 -
Balance sheet value (56 710) (68 498)
Deferred tax assets as of 31.12. 57 174 71 009
Deferred tax liability as of 31.12. 464 2 511
Balance sheet value (56 710) (68 498)
Deferred income tax assets are recognised for tax loss carry-forwards to the extent that the realisation of the related tax benefit through future taxable profits is probable. The tax losses are connected to previous years tax losses. During the past 3-5 years, the Group has had taxable profits and utilised tax loss carry-forwards, and based on future expected tax profits by tax jurisdiction the realization of the deferred tax asset is deemed probable. Management believes that there is convincing evidence for the future utilisation.
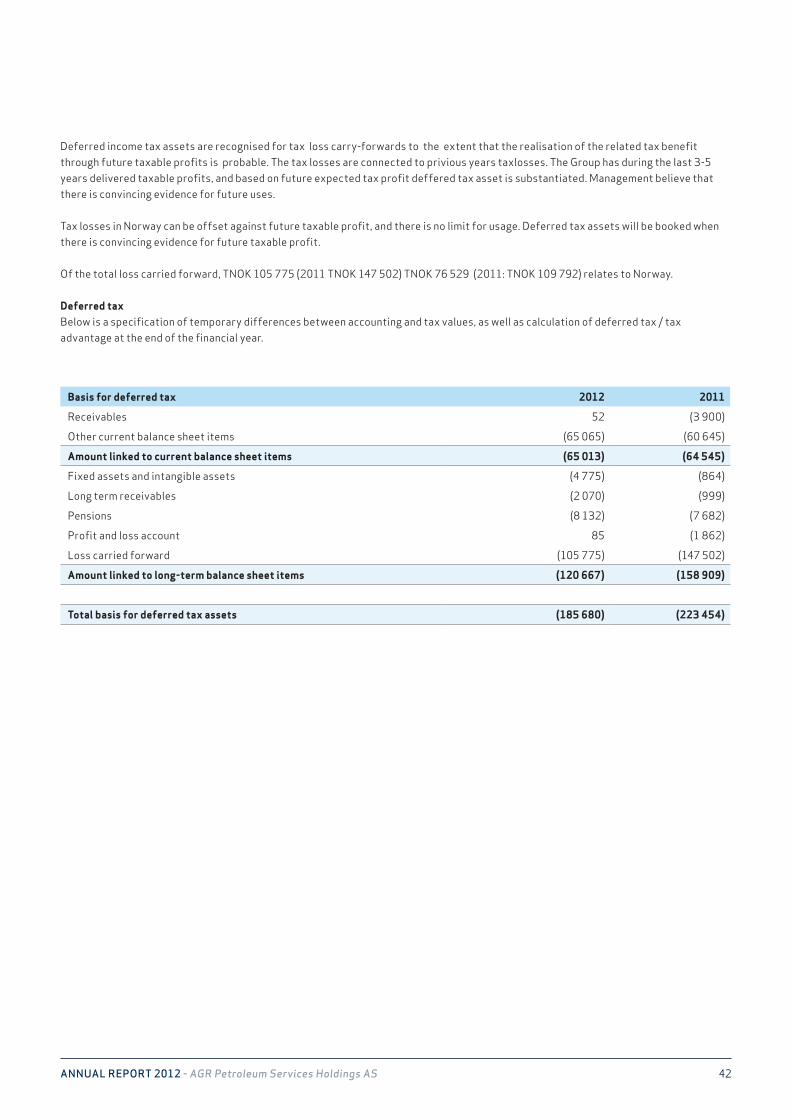
42AnnuAl RepoRt 2012 - AGR Petroleum Services Holdings AS
NOTE 19 Tax Figures in TNOK
Basis for deferred tax 2012 2011
Receivables 52 (3 900)
Other current balance sheet items (65 065) (60 645)
Amount linked to current balance sheet items (65 013) (64 545)
Fixed assets and intangible assets (4 775) (864)
Long term receivables (2 070) (999)
Pensions (8 132) (7 682)
Profit and loss account 85 (1 862)
Loss carried forward (105 775) (147 502)
Amount linked to long-term balance sheet items (120 667) (158 909)
Total basis for deferred tax assets (185 680) (223 454)
Deferred income tax assets are recognised for tax loss carry-forwards to the extent that the realisation of the related tax benefit through future taxable profits is probable. The tax losses are connected to privious years taxlosses. The Group has during the last 3-5 years delivered taxable profits, and based on future expected tax profit deffered tax asset is substantiated. Management believe that there is convincing evidence for future uses.
Tax losses in Norway can be offset against future taxable profit, and there is no limit for usage. Deferred tax assets will be booked when there is convincing evidence for future taxable profit.
Of the total loss carried forward, TNOK 105 775 (2011 TNOK 147 502) TNOK 76 529 (2011: TNOK 109 792) relates to Norway.
Deferred taxBelow is a specification of temporary differences between accounting and tax values, as well as calculation of deferred tax / tax advantage at the end of the financial year.
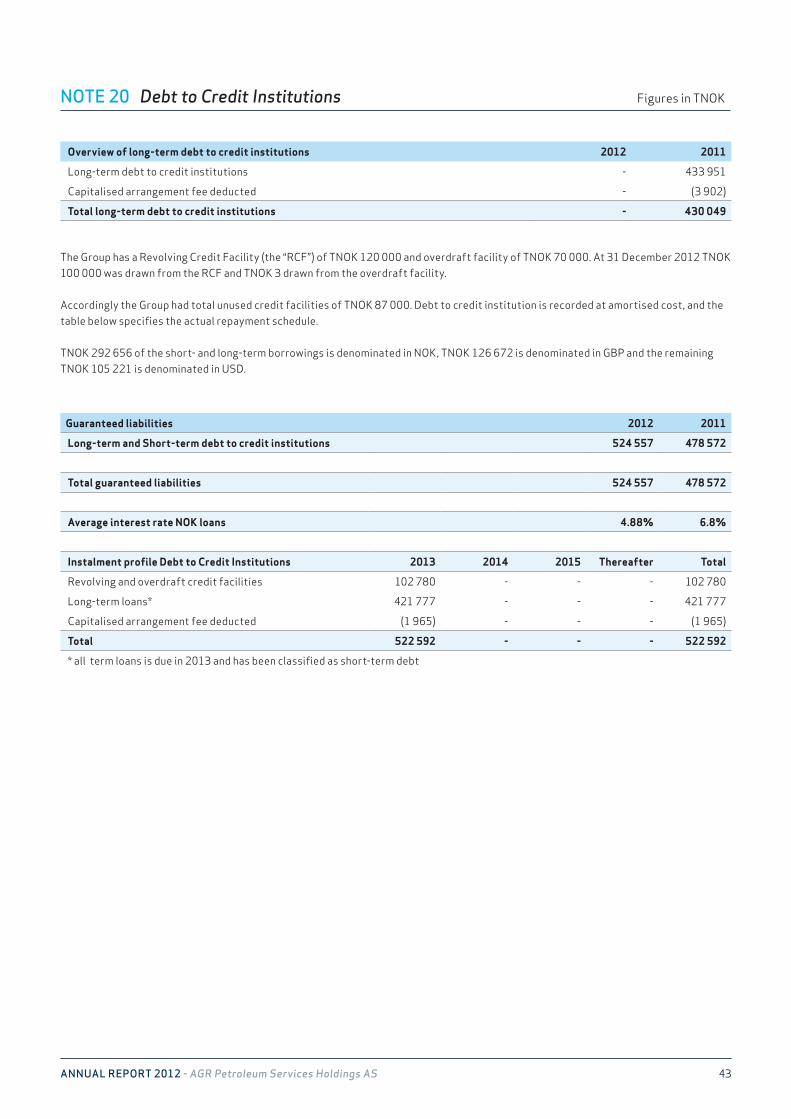
43AnnuAl RepoRt 2012 - AGR Petroleum Services Holdings AS
NOTE 20 Debt to Credit Institutions Figures in TNOK
Guaranteed liabilities 2012 2011
Long-term and Short-term debt to credit institutions 524 557 478 572
Total guaranteed liabilities 524 557 478 572
Average interest rate NOK loans 4.88% 6.8%
Instalment profile Debt to Credit Institutions 2013 2014 2015 Thereafter Total
Revolving and overdraft credit facilities 102 780 - - - 102 780
Long-term loans* 421 777 - - - 421 777
Capitalised arrangement fee deducted (1 965) - - - (1 965)
Total 522 592 - - - 522 592
* all term loans is due in 2013 and has been classified as short-term debt
The Group has a Revolving Credit Facility (the “RCF”) of TNOK 120 000 and overdraft facility of TNOK 70 000. At 31 December 2012 TNOK 100 000 was drawn from the RCF and TNOK 3 drawn from the overdraft facility.
Accordingly the Group had total unused credit facilities of TNOK 87 000. Debt to credit institution is recorded at amortised cost, and the table below specifies the actual repayment schedule.
TNOK 292 656 of the short- and long-term borrowings is denominated in NOK, TNOK 126 672 is denominated in GBP and the remaining TNOK 105 221 is denominated in USD.
Overview of long-term debt to credit institutions 2012 2011
Long-term debt to credit institutions - 433 951
Capitalised arrangement fee deducted - (3 902)
Total long-term debt to credit institutions - 430 049
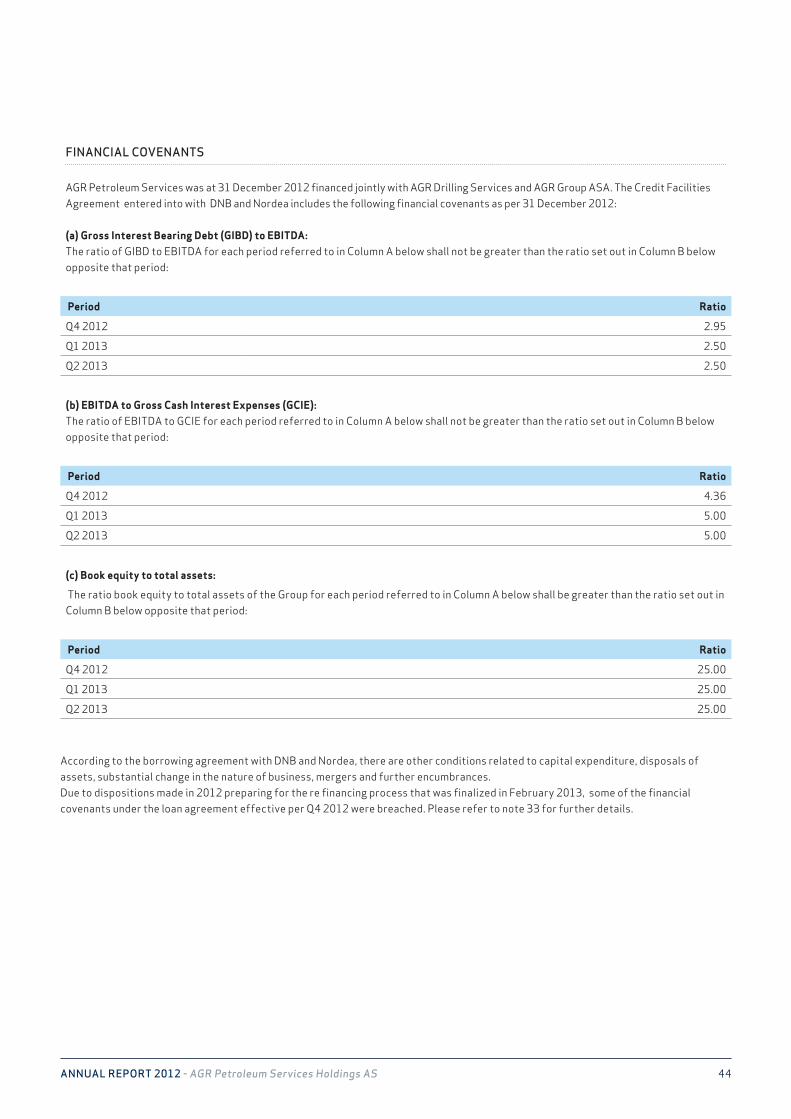
44AnnuAl RepoRt 2012 - AGR Petroleum Services Holdings AS
NOTE 20 Debt to Credit Institutions Figures in TNOK
FiNaNciaL cOvENaNTS
AGR Petroleum Services was at 31 December 2012 financed jointly with AGR Drilling Services and AGR Group ASA. The Credit Facilities Agreement entered into with DNB and Nordea includes the following financial covenants as per 31 December 2012:
(a) Gross Interest Bearing Debt (GIBD) to EBITDA: The ratio of GIBD to EBITDA for each period referred to in Column A below shall not be greater than the ratio set out in Column B below opposite that period:
Period Ratio
Q4 2012 2.95
Q1 2013 2.50
Q2 2013 2.50
(b) EBITDA to Gross Cash Interest Expenses (GCIE): The ratio of EBITDA to GCIE for each period referred to in Column A below shall not be greater than the ratio set out in Column B below opposite that period:
Period Ratio
Q4 2012 4.36
Q1 2013 5.00
Q2 2013 5.00
(c) Book equity to total assets:
The ratio book equity to total assets of the Group for each period referred to in Column A below shall be greater than the ratio set out in Column B below opposite that period:
Period Ratio
Q4 2012 25.00
Q1 2013 25.00
Q2 2013 25.00
According to the borrowing agreement with DNB and Nordea, there are other conditions related to capital expenditure, disposals of assets, substantial change in the nature of business, mergers and further encumbrances. Due to dispositions made in 2012 preparing for the re financing process that was finalized in February 2013, some of the financial covenants under the loan agreement effective per Q4 2012 were breached. Please refer to note 33 for further details.
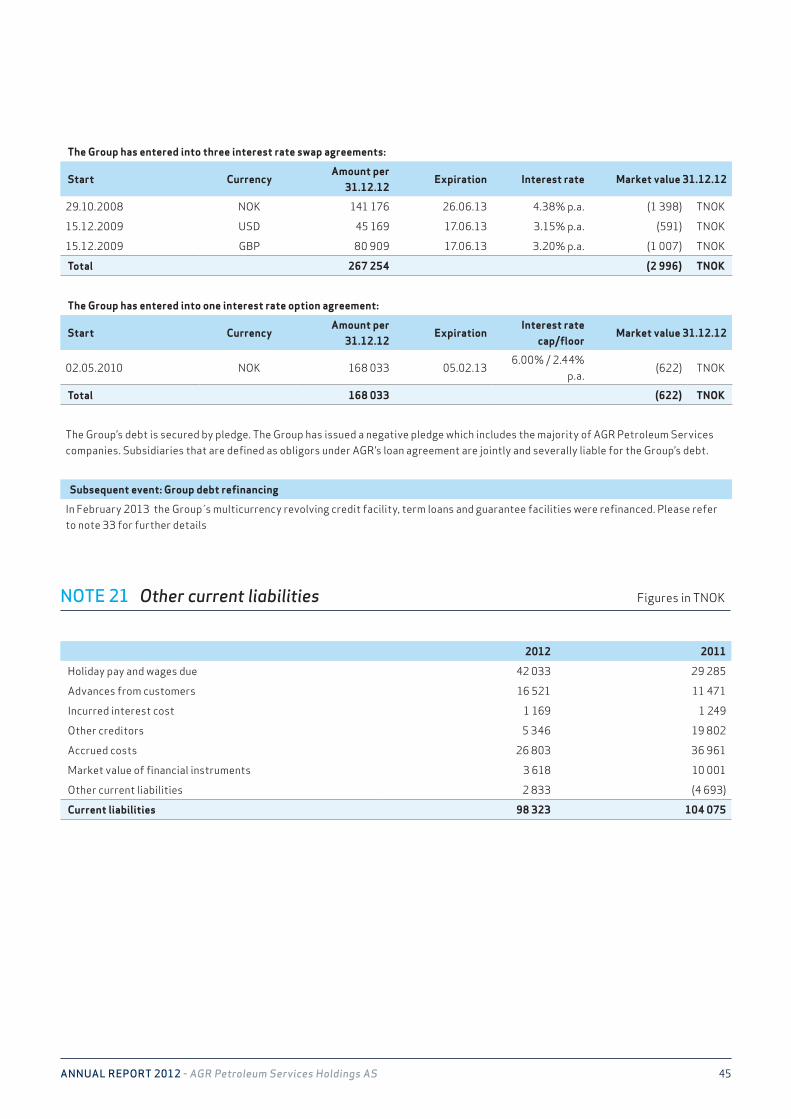
45AnnuAl RepoRt 2012 - AGR Petroleum Services Holdings AS
The Group has entered into three interest rate swap agreements:
Start Currency Amount per
31.12.12 Expiration Interest rate Market value 31.12.12
29.10.2008 NOK 141 176 26.06.13 4.38% p.a. (1 398) TNOK
15.12.2009 USD 45 169 17.06.13 3.15% p.a. (591) TNOK
15.12.2009 GBP 80 909 17.06.13 3.20% p.a. (1 007) TNOK
Total 267 254 (2 996) TNOK
The Group has entered into one interest rate option agreement:
Start Currency Amount per
31.12.12 Expiration
Interest rate cap/floor
Market value 31.12.12
02.05.2010 NOK 168 033 05.02.13 6.00% / 2.44%
p.a. (622) TNOK
Total 168 033 (622) TNOK
The Group’s debt is secured by pledge. The Group has issued a negative pledge which includes the majority of AGR Petroleum Services companies. Subsidiaries that are defined as obligors under AGR’s loan agreement are jointly and severally liable for the Group’s debt.
Subsequent event: Group debt refinancing
In February 2013 the Group s multicurrency revolving credit facility, term loans and guarantee facilities were refinanced. Please refer to note 33 for further details
NOTE 21 Other current liabilities Figures in TNOK
2012 2011
Holiday pay and wages due 42 033 29 285
Advances from customers 16 521 11 471
Incurred interest cost 1 169 1 249
Other creditors 5 346 19 802
Accrued costs 26 803 36 961
Market value of financial instruments 3 618 10 001
Other current liabilities 2 833 (4 693)
Current liabilities 98 323 104 075
NOTE 20 Debt to Credit Institutions Figures in TNOK
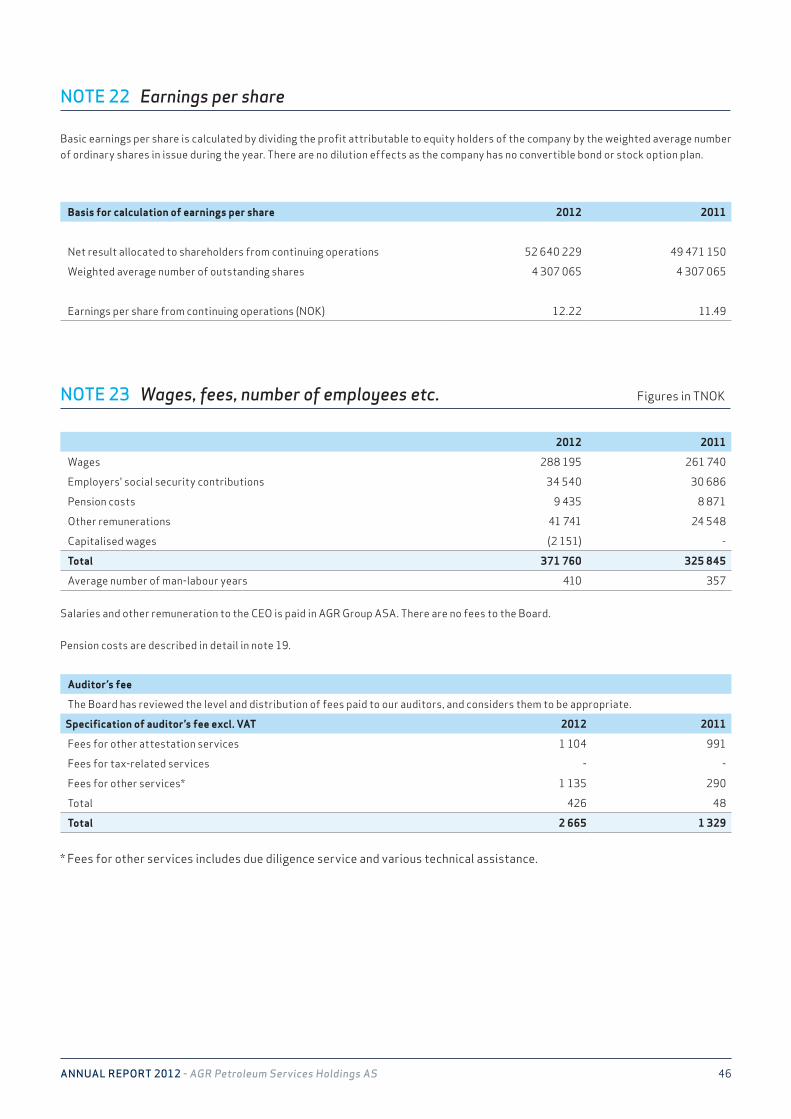
46AnnuAl RepoRt 2012 - AGR Petroleum Services Holdings AS
NOTE 22 Earnings per share
Basis for calculation of earnings per share 2012 2011
Net result allocated to shareholders from continuing operations 52 640 229 49 471 150
Weighted average number of outstanding shares 4 307 065 4 307 065
Earnings per share from continuing operations (NOK) 12.22 11.49
Basic earnings per share is calculated by dividing the profit attributable to equity holders of the company by the weighted average number of ordinary shares in issue during the year. There are no dilution effects as the company has no convertible bond or stock option plan.
NOTE 23 Wages, fees, number of employees etc. Figures in TNOK
2012 2011
Wages 288 195 261 740
Employers' social security contributions 34 540 30 686
Pension costs 9 435 8 871
Other remunerations 41 741 24 548
Capitalised wages (2 151) -
Total 371 760 325 845
Average number of man-labour years 410 357
Salaries and other remuneration to the CEO is paid in AGR Group ASA. There are no fees to the Board.
Pension costs are described in detail in note 19.
Auditor’s fee
The Board has reviewed the level and distribution of fees paid to our auditors, and considers them to be appropriate.
Specification of auditor’s fee excl. VAT 2012 2011
Fees for other attestation services 1 104 991
Fees for tax-related services - -
Fees for other services* 1 135 290
Total 426 48
Total 2 665 1 329
* Fees for other services includes due diligence service and various technical assistance.
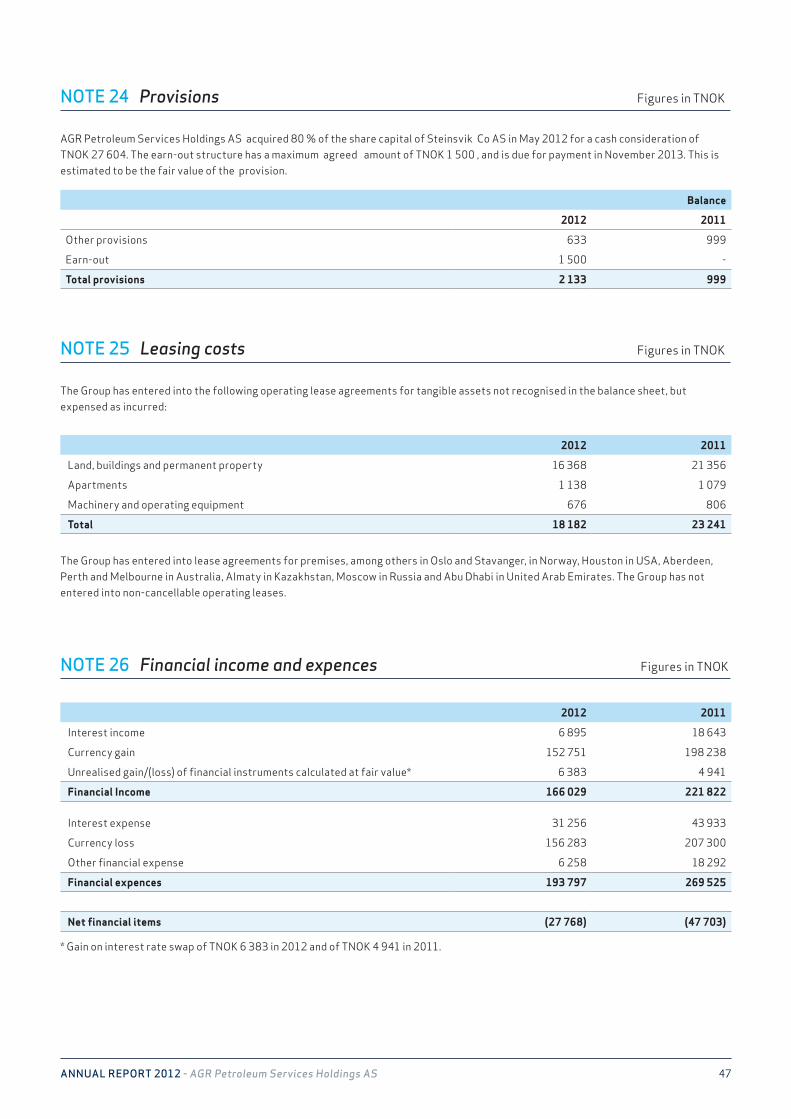
47AnnuAl RepoRt 2012 - AGR Petroleum Services Holdings AS
NOTE 24 Provisions Figures in TNOK
NOTE 25 Leasing costs Figures in TNOK
Balance
2012 2011
Other provisions 633 999
Earn-out 1 500 -
Total provisions 2 133 999
AGR Petroleum Services Holdings AS acquired 80 % of the share capital of Steinsvik Co AS in May 2012 for a cash consideration of TNOK 27 604. The earn-out structure has a maximum agreed amount of TNOK 1 500 , and is due for payment in November 2013. This is estimated to be the fair value of the provision.
2012 2011
Land, buildings and permanent property 16 368 21 356
Apartments 1 138 1 079
Machinery and operating equipment 676 806
Total 18 182 23 241
The Group has entered into lease agreements for premises, among others in Oslo and Stavanger, in Norway, Houston in USA, Aberdeen, Perth and Melbourne in Australia, Almaty in Kazakhstan, Moscow in Russia and Abu Dhabi in United Arab Emirates. The Group has not entered into non-cancellable operating leases.
The Group has entered into the following operating lease agreements for tangible assets not recognised in the balance sheet, but expensed as incurred:
NOTE 26 Financial income and expences Figures in TNOK
2012 2011
Interest income 6 895 18 643
Currency gain 152 751 198 238
Unrealised gain/(loss) of financial instruments calculated at fair value* 6 383 4 941
Financial Income 166 029 221 822
Interest expense 31 256 43 933
Currency loss 156 283 207 300
Other financial expense 6 258 18 292
Financial expences 193 797 269 525
Net financial items (27 768) (47 703)
* Gain on interest rate swap of TNOK 6 383 in 2012 and of TNOK 4 941 in 2011.
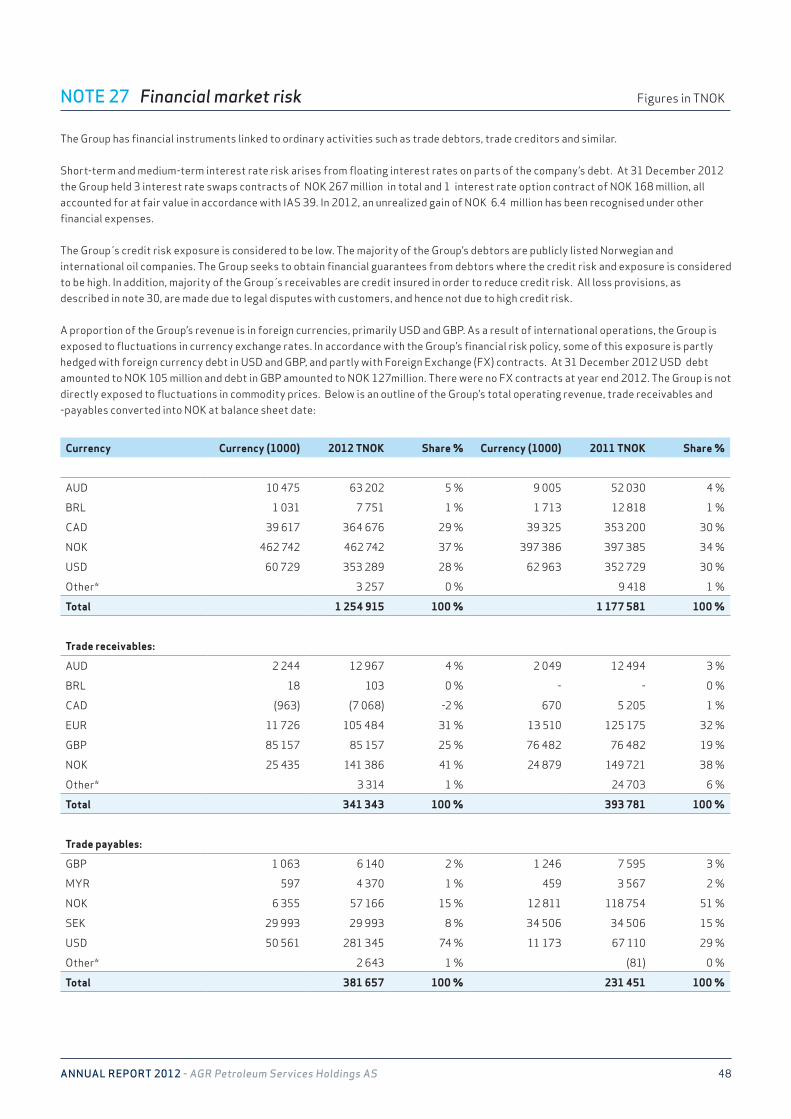
48AnnuAl RepoRt 2012 - AGR Petroleum Services Holdings AS
NOTE 27 Financial market risk Figures in TNOK
The Group has financial instruments linked to ordinary activities such as trade debtors, trade creditors and similar. Short-term and medium-term interest rate risk arises from floating interest rates on parts of the company’s debt. At 31 December 2012 the Group held 3 interest rate swaps contracts of NOK 267 million in total and 1 interest rate option contract of NOK 168 million, all accounted for at fair value in accordance with IAS 39. In 2012, an unrealized gain of NOK 6.4 million has been recognised under other financial expenses. The Group s credit risk exposure is considered to be low. The majority of the Group’s debtors are publicly listed Norwegian and international oil companies. The Group seeks to obtain financial guarantees from debtors where the credit risk and exposure is considered to be high. In addition, majority of the Group s receivables are credit insured in order to reduce credit risk. All loss provisions, as described in note 30, are made due to legal disputes with customers, and hence not due to high credit risk. A proportion of the Group’s revenue is in foreign currencies, primarily USD and GBP. As a result of international operations, the Group is exposed to fluctuations in currency exchange rates. In accordance with the Group’s financial risk policy, some of this exposure is partly hedged with foreign currency debt in USD and GBP, and partly with Foreign Exchange (FX) contracts. At 31 December 2012 USD debt amounted to NOK 105 million and debt in GBP amounted to NOK 127million. There were no FX contracts at year end 2012. The Group is not directly exposed to fluctuations in commodity prices. Below is an outline of the Group’s total operating revenue, trade receivables and -payables converted into NOK at balance sheet date:
Currency Currency (1000) 2012 TNOK Share % Currency (1000) 2011 TNOK Share %
AUD 10 475 63 202 5 % 9 005 52 030 4 %
BRL 1 031 7 751 1 % 1 713 12 818 1 %
CAD 39 617 364 676 29 % 39 325 353 200 30 %
NOK 462 742 462 742 37 % 397 386 397 385 34 %
USD 60 729 353 289 28 % 62 963 352 729 30 %
Other* 3 257 0 % 9 418 1 %
Total 1 254 915 100 % 1 177 581 100 %
Trade receivables:
AUD 2 244 12 967 4 % 2 049 12 494 3 %
BRL 18 103 0 % - - 0 %
CAD (963) (7 068) -2 % 670 5 205 1 %
EUR 11 726 105 484 31 % 13 510 125 175 32 %
GBP 85 157 85 157 25 % 76 482 76 482 19 %
NOK 25 435 141 386 41 % 24 879 149 721 38 %
Other* 3 314 1 % 24 703 6 %
Total 341 343 100 % 393 781 100 %
Trade payables:
GBP 1 063 6 140 2 % 1 246 7 595 3 %
MYR 597 4 370 1 % 459 3 567 2 %
NOK 6 355 57 166 15 % 12 811 118 754 51 %
SEK 29 993 29 993 8 % 34 506 34 506 15 %
USD 50 561 281 345 74 % 11 173 67 110 29 %
Other* 2 643 1 % (81) 0 %
Total 381 657 100 % 231 451 100 %
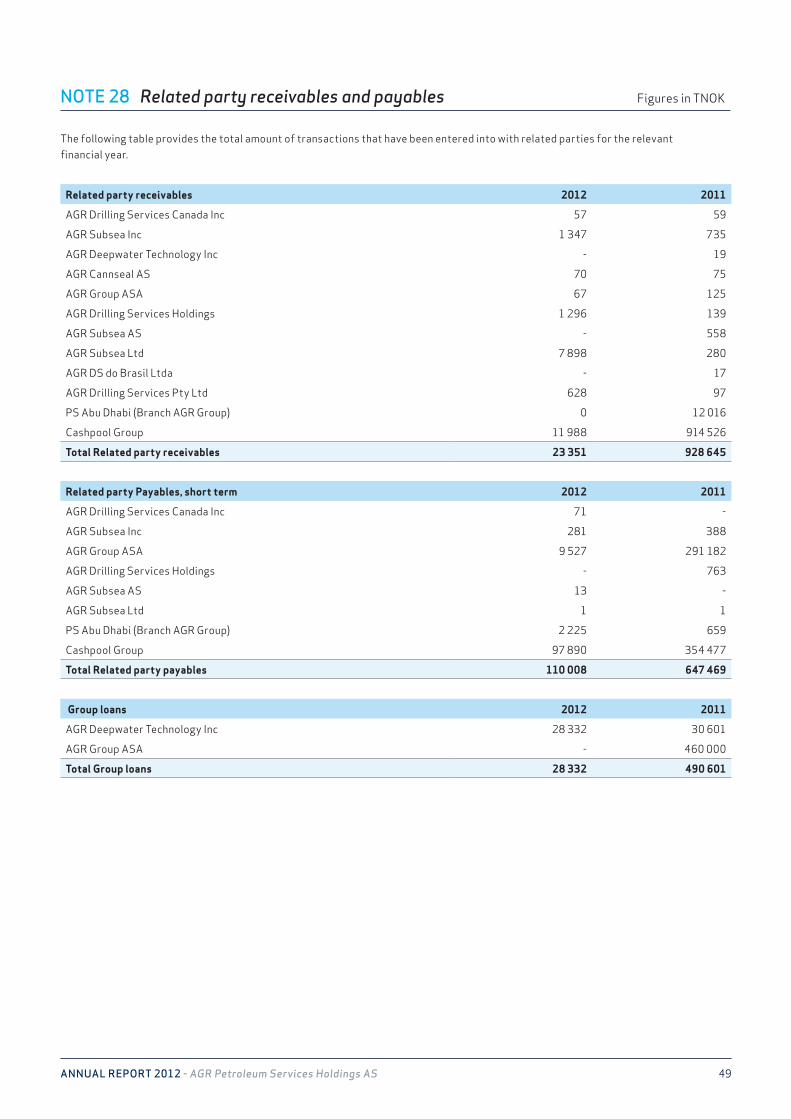
49AnnuAl RepoRt 2012 - AGR Petroleum Services Holdings AS
NOTE 28 Related party receivables and payables Figures in TNOK
Related party receivables 2012 2011
AGR Drilling Services Canada Inc 57 59
AGR Subsea Inc 1 347 735
AGR Deepwater Technology Inc - 19
AGR Cannseal AS 70 75
AGR Group ASA 67 125
AGR Drilling Services Holdings 1 296 139
AGR Subsea AS - 558
AGR Subsea Ltd 7 898 280
AGR DS do Brasil Ltda - 17
AGR Drilling Services Pty Ltd 628 97
PS Abu Dhabi (Branch AGR Group) 0 12 016
Cashpool Group 11 988 914 526
Total Related party receivables 23 351 928 645
Related party Payables, short term 2012 2011
AGR Drilling Services Canada Inc 71 -
AGR Subsea Inc 281 388
AGR Group ASA 9 527 291 182
AGR Drilling Services Holdings - 763
AGR Subsea AS 13 -
AGR Subsea Ltd 1 1
PS Abu Dhabi (Branch AGR Group) 2 225 659
Cashpool Group 97 890 354 477
Total Related party payables 110 008 647 469
Group loans 2012 2011
AGR Deepwater Technology Inc 28 332 30 601
AGR Group ASA - 460 000
Total Group loans 28 332 490 601
The following table provides the total amount of transactions that have been entered into with related parties for the relevant financial year.
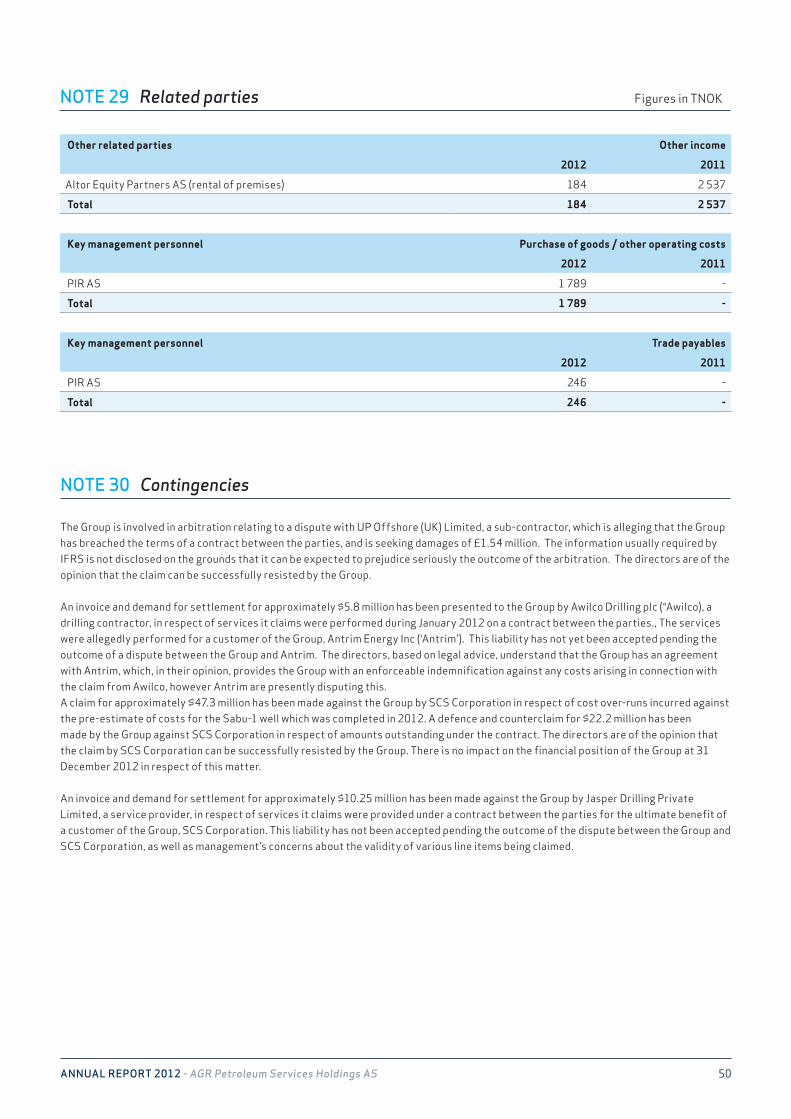
50AnnuAl RepoRt 2012 - AGR Petroleum Services Holdings AS
NOTE 29 Related parties Figures in TNOK
Other related parties Other income
2012 2011
Altor Equity Partners AS (rental of premises) 184 2 537
Total 184 2 537
Key management personnel Purchase of goods / other operating costs
2012 2011
PIR AS 1 789 -
Total 1 789 -
Key management personnel Trade payables
2012 2011
PIR AS 246 -
Total 246 -
NOTE 30 Contingencies
The Group is involved in arbitration relating to a dispute with UP Offshore (UK) Limited, a sub-contractor, which is alleging that the Group has breached the terms of a contract between the parties, and is seeking damages of £1.54 million. The information usually required by IFRS is not disclosed on the grounds that it can be expected to prejudice seriously the outcome of the arbitration. The directors are of the opinion that the claim can be successfully resisted by the Group.
An invoice and demand for settlement for approximately $5.8 million has been presented to the Group by Awilco Drilling plc (“Awilco), a drilling contractor, in respect of services it claims were performed during January 2012 on a contract between the parties., The services were allegedly performed for a customer of the Group, Antrim Energy Inc (‘Antrim’). This liability has not yet been accepted pending the outcome of a dispute between the Group and Antrim. The directors, based on legal advice, understand that the Group has an agreement with Antrim, which, in their opinion, provides the Group with an enforceable indemnification against any costs arising in connection with the claim from Awilco, however Antrim are presently disputing this. A claim for approximately $47.3 million has been made against the Group by SCS Corporation in respect of cost over-runs incurred against the pre-estimate of costs for the Sabu-1 well which was completed in 2012. A defence and counterclaim for $22.2 million has been made by the Group against SCS Corporation in respect of amounts outstanding under the contract. The directors are of the opinion that the claim by SCS Corporation can be successfully resisted by the Group. There is no impact on the financial position of the Group at 31 December 2012 in respect of this matter.
An invoice and demand for settlement for approximately $10.25 million has been made against the Group by Jasper Drilling Private Limited, a service provider, in respect of services it claims were provided under a contract between the parties for the ultimate benefit of a customer of the Group, SCS Corporation. This liability has not been accepted pending the outcome of the dispute between the Group and SCS Corporation, as well as management’s concerns about the validity of various line items being claimed.
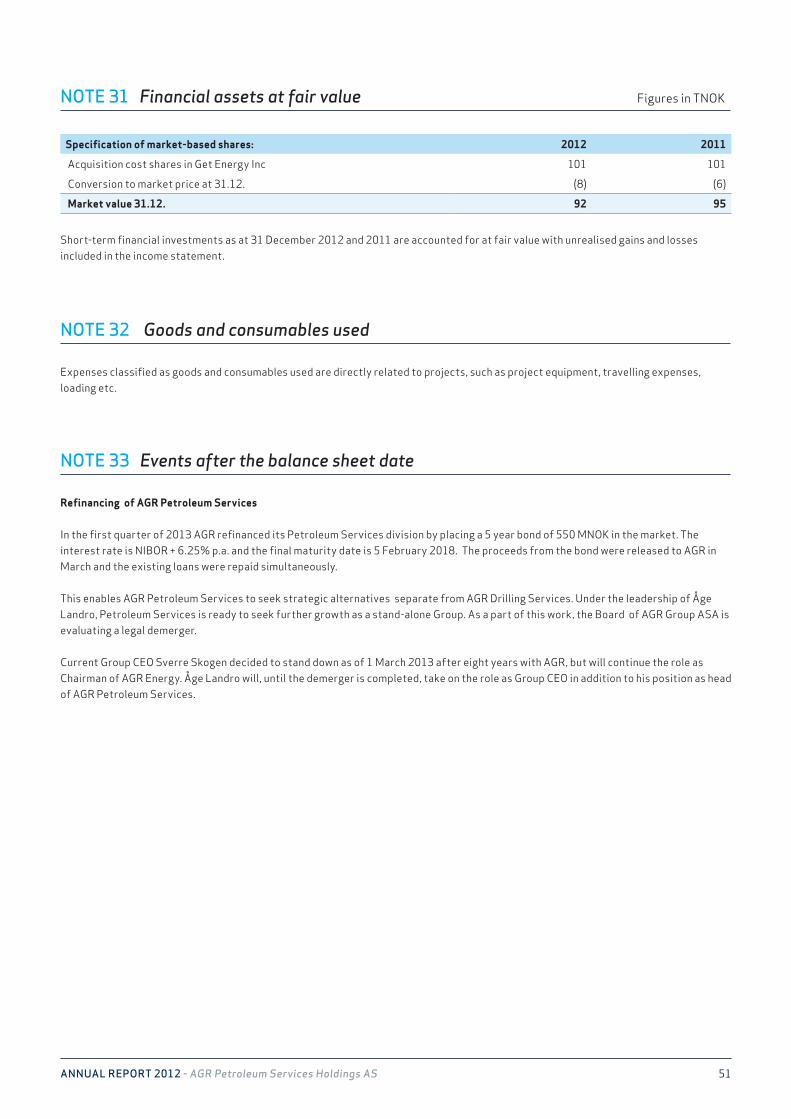
51AnnuAl RepoRt 2012 - AGR Petroleum Services Holdings AS
NOTE 31 Financial assets at fair value Figures in TNOK
Specification of market-based shares: 2012 2011
Acquisition cost shares in Get Energy Inc 101 101
Conversion to market price at 31.12. (8) (6)
Market value 31.12. 92 95
Short-term financial investments as at 31 December 2012 and 2011 are accounted for at fair value with unrealised gains and losses included in the income statement.
NOTE 33 Events after the balance sheet date
Refinancing of AGR Petroleum Services In the first quarter of 2013 AGR refinanced its Petroleum Services division by placing a 5 year bond of 550 MNOK in the market. The interest rate is NIBOR + 6.25% p.a. and the final maturity date is 5 February 2018. The proceeds from the bond were released to AGR in March and the existing loans were repaid simultaneously.
This enables AGR Petroleum Services to seek strategic alternatives separate from AGR Drilling Services. Under the leadership of Åge Landro, Petroleum Services is ready to seek further growth as a stand-alone Group. As a part of this work, the Board of AGR Group ASA is evaluating a legal demerger.
Current Group CEO Sverre Skogen decided to stand down as of 1 March 2013 after eight years with AGR, but will continue the role as Chairman of AGR Energy. Åge Landro will, until the demerger is completed, take on the role as Group CEO in addition to his position as head of AGR Petroleum Services.
NOTE 32 Goods and consumables used
Expenses classified as goods and consumables used are directly related to projects, such as project equipment, travelling expenses, loading etc.
52AnnuAl RepoRt 2012 - AGR Petroleum Services Holdings AS
NOTE 34 Share investment program
Share investment programIn 2011 AGR introduced co-investment program in AGR Petroleum Services. In May 2011 AGR Group ASA sold 42 939 A-shares in its subsidiary PetCo Invest AS to key employees and board members in AGR Group ASA and AGR Petroleum Services Holdings for NOK 102 per share. PetCo Invest AS owns 90 954 shares in AGR Petroleum Services Holdings AS, corresponding to 2.1%. AGR Group ASA is the owner of the remaining 97.9%. In April 2012 Petco Invest AS increased its ownership in AGR Petroleum Services Holdings with 41 532 shares and owns 132 480 shares, corresponding to 3.1% per December 2012. AGR Group ASA is the owner of the remaining 96.9 %. AGR Group ASA’s shareholding in PetCo Invest AS following the transaction was one controlling B-share respectively. PetCo Invest AS have been incorporated for the purpose of investing in AGR Petroleum Services Holdings AS respectively.
The price per share in PetCo Invest AS was determined based on the estimated fair value of AGR Petroleum Services Holdings AS, using over-the-cycle EV/EBITDA trading multiples in accordance with EVCA guidelines. Accordingly, the transactions have not affected the profit and loss accounts of AGR. In order to increase the investments made by PetCo Invest AS, AGR Group ASA has provided loans in the form of seller’s credits with an annual interest rate of 8%. AGR Group ASA has an option to increase its shareholding in and PetCo Invest AS by cash payment or set-off against any outstanding amount under the loan agreements.
The co-investment programs within AGR Petroleum Services are governed by the provisions in three separate shareholders agreements. The shareholders agreements are entered into by and between the holding companies, the investment companies and the participants in the program. Among other things the shareholder agreement will provide for drag-along and tag-along provisions for the event that AGR Group ASA should sell its shares in the holding companies. The participants cannot sell or transfer the shares in PetCo Invest AS without the consent of AGR. If a participant in the program gives or is given notice of termination of employment before the second anniversary of the program, AGR has an option to buy the shares at fair value.
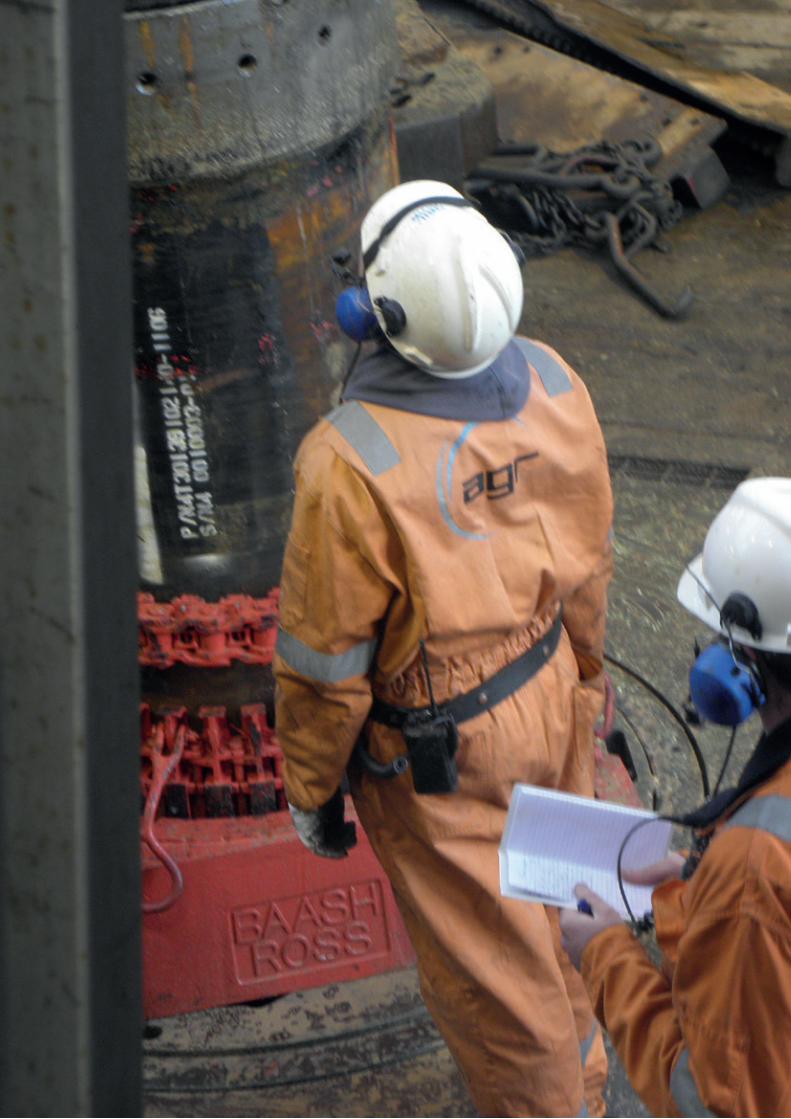
53AnnuAl RepoRt 2012 - AGR Petroleum Services Holdings AS
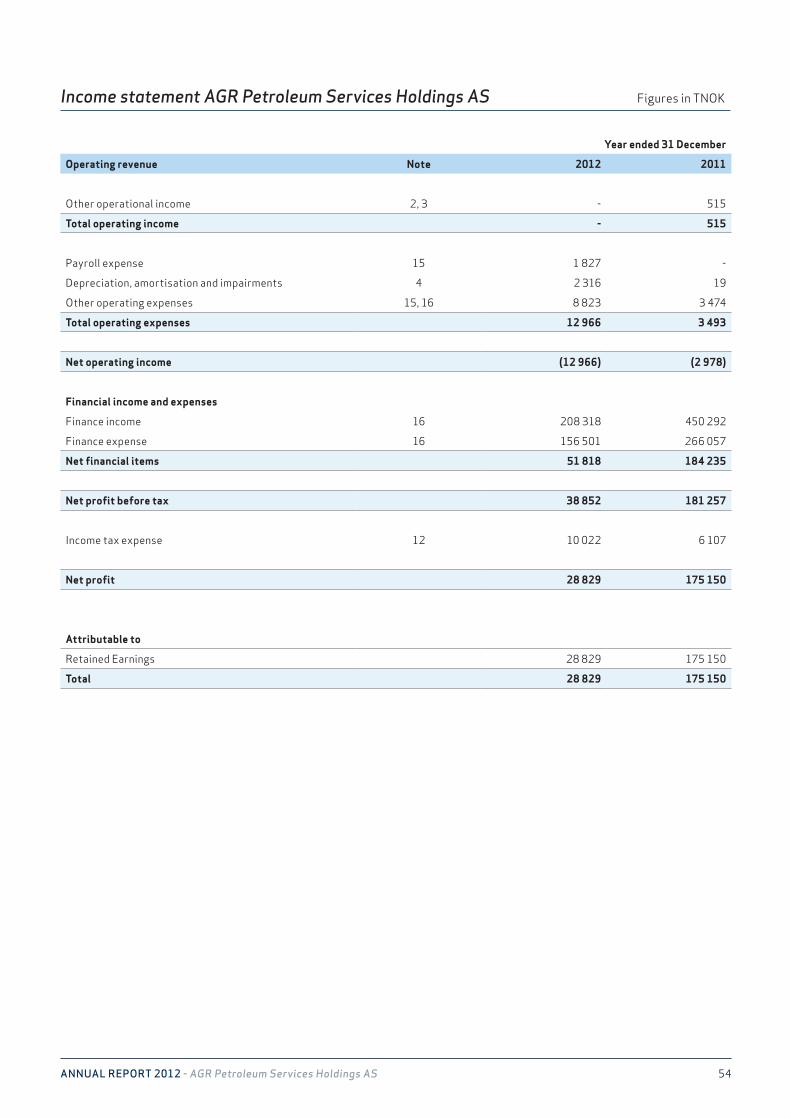
AnnuAl RepoRt 2012 - AGR Petroleum Services Holdings AS 54
Year ended 31 December
Operating revenue Note 2012 2011
Other operational income 2, 3 - 515
Total operating income - 515
Payroll expense 15 1 827 -
Depreciation, amortisation and impairments 4 2 316 19
Other operating expenses 15, 16 8 823 3 474
Total operating expenses 12 966 3 493
Net operating income (12 966) (2 978)
Financial income and expenses
Finance income 16 208 318 450 292
Finance expense 16 156 501 266 057
Net financial items 51 818 184 235
Net profit before tax 38 852 181 257
Income tax expense 12 10 022 6 107
Net profit 28 829 175 150
Attributable to
Retained Earnings 28 829 175 150
Total 28 829 175 150
Income statement AGR Petroleum Services Holdings AS Figures in TNOK
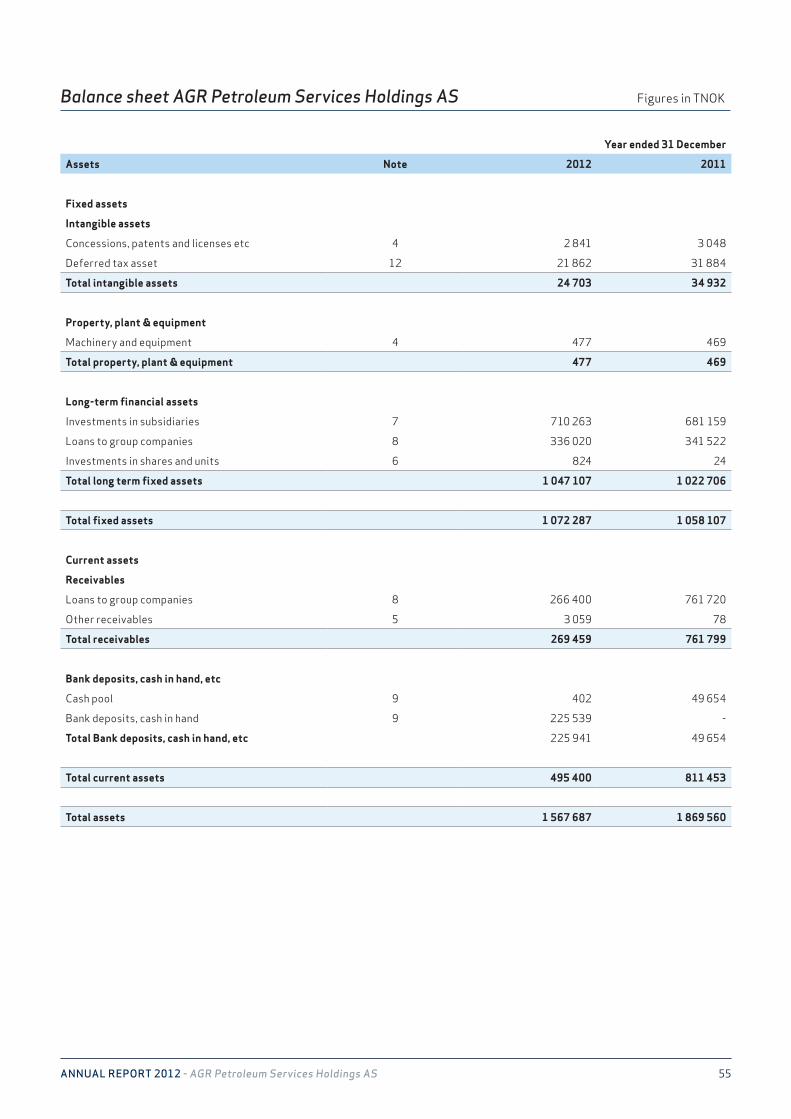
AnnuAl RepoRt 2012 - AGR Petroleum Services Holdings AS 55
Balance sheet AGR Petroleum Services Holdings AS Figures in TNOK
Year ended 31 December
Assets Note 2012 2011
Fixed assets
Intangible assets
Concessions, patents and licenses etc 4 2 841 3 048
Deferred tax asset 12 21 862 31 884
Total intangible assets 24 703 34 932
Property, plant & equipment
Machinery and equipment 4 477 469
Total property, plant & equipment 477 469
Long-term financial assets
Investments in subsidiaries 7 710 263 681 159
Loans to group companies 8 336 020 341 522
Investments in shares and units 6 824 24
Total long term fixed assets 1 047 107 1 022 706
Total fixed assets 1 072 287 1 058 107
Current assets
Receivables
Loans to group companies 8 266 400 761 720
Other receivables 5 3 059 78
Total receivables 269 459 761 799
Bank deposits, cash in hand, etc
Cash pool 9 402 49 654
Bank deposits, cash in hand 9 225 539 -
Total Bank deposits, cash in hand, etc 225 941 49 654
Total current assets 495 400 811 453
Total assets 1 567 687 1 869 560
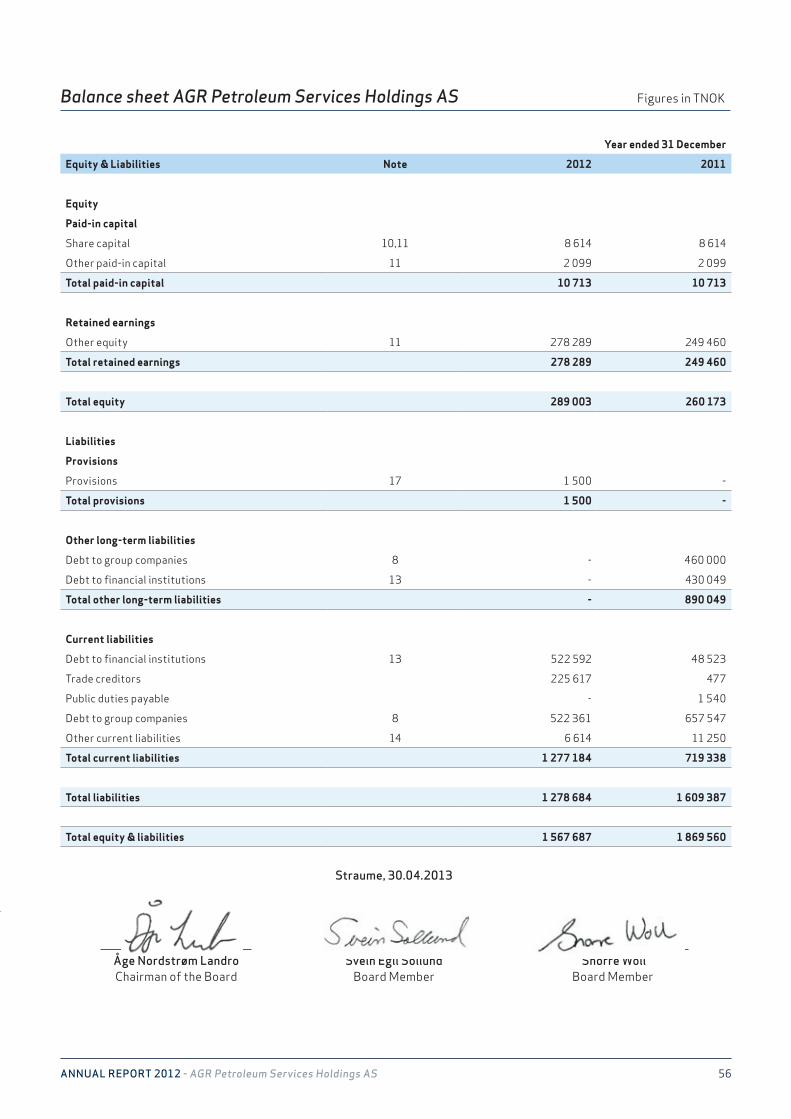
AnnuAl RepoRt 2012 - AGR Petroleum Services Holdings AS 56
Balance sheet AGR Petroleum Services Holdings AS Figures in TNOK
Year ended 31 December
Equity & Liabilities Note 2012 2011
Equity
Paid-in capital
Share capital 10,11 8 614 8 614
Other paid-in capital 11 2 099 2 099
Total paid-in capital 10 713 10 713
Retained earnings
Other equity 11 278 289 249 460
Total retained earnings 278 289 249 460
Total equity 289 003 260 173
Liabilities
Provisions
Provisions 17 1 500 -
Total provisions 1 500 -
Other long-term liabilities
Debt to group companies 8 - 460 000
Debt to financial institutions 13 - 430 049
Total other long-term liabilities - 890 049
Current liabilities
Debt to financial institutions 13 522 592 48 523
Trade creditors 225 617 477
Public duties payable - 1 540
Debt to group companies 8 522 361 657 547
Other current liabilities 14 6 614 11 250
Total current liabilities 1 277 184 719 338
Total liabilities 1 278 684 1 609 387
Total equity & liabilities 1 567 687 1 869 560
Åge Nordstrøm LandroChairman of the Board
Svein Egil SollundBoard Member
Straume, 30.04.2013
Snorre WollBoard Member
Åge LandroCEO
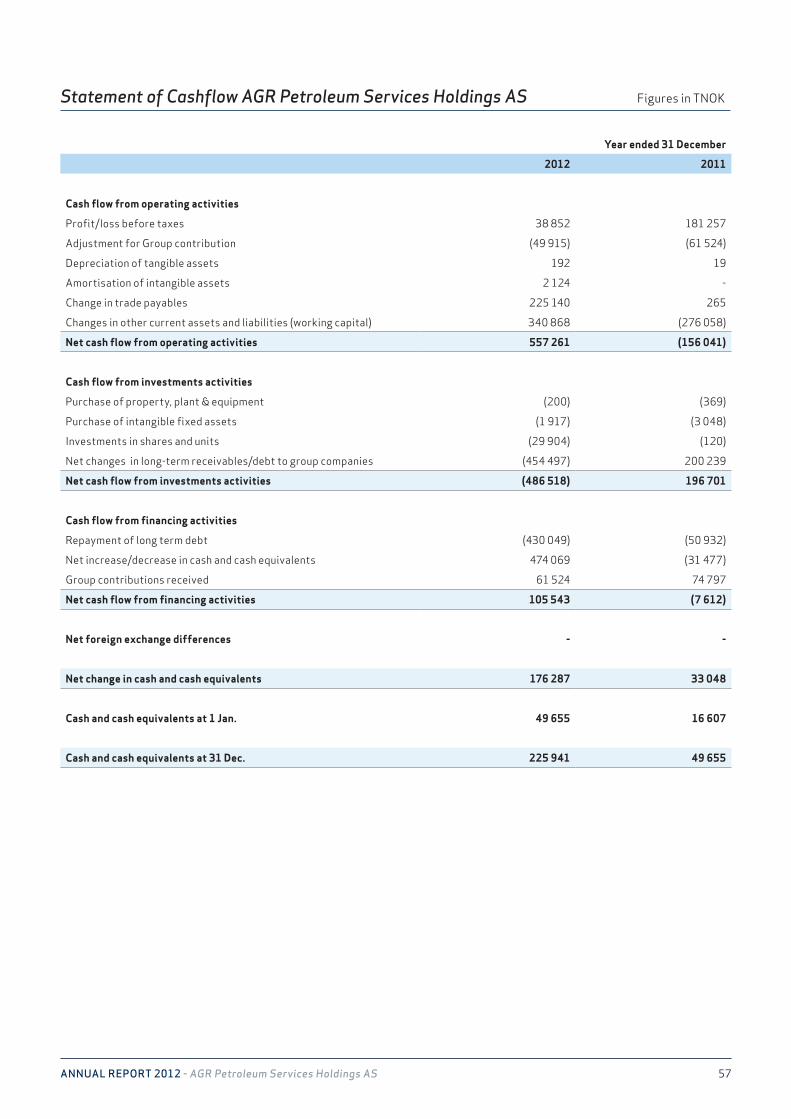
AnnuAl RepoRt 2012 - AGR Petroleum Services Holdings AS 57
Statement of Cashflow AGR Petroleum Services Holdings AS Figures in TNOK
Year ended 31 December
2012 2011
Cash flow from operating activities
Profit/loss before taxes 38 852 181 257
Adjustment for Group contribution (49 915) (61 524)
Depreciation of tangible assets 192 19
Amortisation of intangible assets 2 124 -
Change in trade payables 225 140 265
Changes in other current assets and liabilities (working capital) 340 868 (276 058)
Net cash flow from operating activities 557 261 (156 041)
Cash flow from investments activities
Purchase of property, plant & equipment (200) (369)
Purchase of intangible fixed assets (1 917) (3 048)
Investments in shares and units (29 904) (120)
Net changes in long-term receivables/debt to group companies (454 497) 200 239
Net cash flow from investments activities (486 518) 196 701
Cash flow from financing activities
Repayment of long term debt (430 049) (50 932)
Net increase/decrease in cash and cash equivalents 474 069 (31 477)
Group contributions received 61 524 74 797
Net cash flow from financing activities 105 543 (7 612)
Net foreign exchange differences - -
Net change in cash and cash equivalents 176 287 33 048
Cash and cash equivalents at 1 Jan. 49 655 16 607
Cash and cash equivalents at 31 Dec. 225 941 49 655
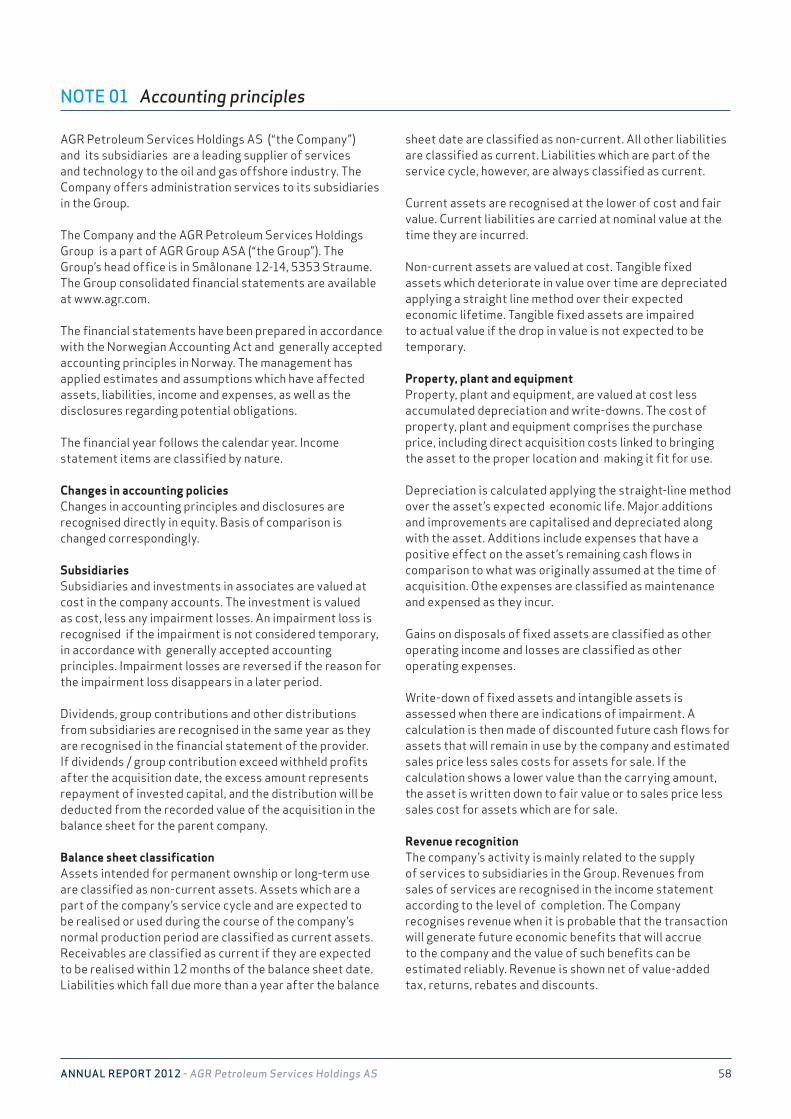
AnnuAl RepoRt 2012 - AGR Petroleum Services Holdings AS 58
NOTE 01 Accounting principles
AGR Petroleum Services Holdings AS (“the Company”) and its subsidiaries are a leading supplier of services and technology to the oil and gas offshore industry. The Company offers administration services to its subsidiaries in the Group.
The Company and the AGR Petroleum Services Holdings Group is a part of AGR Group ASA (“the Group”). The Group’s head office is in Smålonane 12-14, 5353 Straume. The Group consolidated financial statements are available at www.agr.com.
The financial statements have been prepared in accordance with the Norwegian Accounting Act and generally accepted accounting principles in Norway. The management has applied estimates and assumptions which have affected assets, liabilities, income and expenses, as well as the disclosures regarding potential obligations.
The financial year follows the calendar year. Income statement items are classified by nature.
Changes in accounting policiesChanges in accounting principles and disclosures are recognised directly in equity. Basis of comparison is changed correspondingly.
SubsidiariesSubsidiaries and investments in associates are valued at cost in the company accounts. The investment is valued as cost, less any impairment losses. An impairment loss is recognised if the impairment is not considered temporary, in accordance with generally accepted accounting principles. Impairment losses are reversed if the reason for the impairment loss disappears in a later period.
Dividends, group contributions and other distributions from subsidiaries are recognised in the same year as they are recognised in the financial statement of the provider. If dividends / group contribution exceed withheld profits after the acquisition date, the excess amount represents repayment of invested capital, and the distribution will be deducted from the recorded value of the acquisition in the balance sheet for the parent company.
Balance sheet classificationAssets intended for permanent ownship or long-term use are classified as non-current assets. Assets which are a part of the company’s service cycle and are expected to be realised or used during the course of the company’s normal production period are classified as current assets. Receivables are classified as current if they are expected to be realised within 12 months of the balance sheet date. Liabilities which fall due more than a year after the balance
sheet date are classified as non-current. All other liabilities are classified as current. Liabilities which are part of the service cycle, however, are always classified as current.
Current assets are recognised at the lower of cost and fair value. Current liabilities are carried at nominal value at the time they are incurred.
Non-current assets are valued at cost. Tangible fixed assets which deteriorate in value over time are depreciated applying a straight line method over their expected economic lifetime. Tangible fixed assets are impaired to actual value if the drop in value is not expected to be temporary.
Property, plant and equipmentProperty, plant and equipment, are valued at cost less accumulated depreciation and write-downs. The cost of property, plant and equipment comprises the purchase price, including direct acquisition costs linked to bringing the asset to the proper location and making it fit for use.
Depreciation is calculated applying the straight-line method over the asset’s expected economic life. Major additions and improvements are capitalised and depreciated along with the asset. Additions include expenses that have a positive effect on the asset’s remaining cash flows in comparison to what was originally assumed at the time of acquisition. Othe expenses are classified as maintenance and expensed as they incur.
Gains on disposals of fixed assets are classified as other operating income and losses are classified as other operating expenses.
Write-down of fixed assets and intangible assets is assessed when there are indications of impairment. A calculation is then made of discounted future cash flows for assets that will remain in use by the company and estimated sales price less sales costs for assets for sale. If the calculation shows a lower value than the carrying amount, the asset is written down to fair value or to sales price less sales cost for assets which are for sale.
Revenue recognitionThe company’s activity is mainly related to the supply of services to subsidiaries in the Group. Revenues from sales of services are recognised in the income statement according to the level of completion. The Company recognises revenue when it is probable that the transaction will generate future economic benefits that will accrue to the company and the value of such benefits can be estimated reliably. Revenue is shown net of value-added tax, returns, rebates and discounts.
AnnuAl RepoRt 2012 - AGR Petroleum Services Holdings AS 59
Matcing principleRevenues are matched with expenses in accordance with the matching principle. Unrealised losses which are considered both likely to incur and quantifiable, as well as unconditional obligations and orders, are expensed in accordance with generally accepted accounting principles.
Foreign exchangeMonetary items in foreign currency are translated to NOK using the exchange rates at the balance sheet date. Foreign exchange gains/losses are presented as finance income/expenses in the income statement.
Provisions, contingent liabilities an conditional assetsContingent liabilities are recognised in the financial statements if there is more than a 50% probability that the liability will be settled. Best estimate is applied when calculating the settlement value. Provisions for contingent liabilities arising from the movement of goods or which are expected to be settled within a year from the balanse sheet date are classified as short-term liabilities. Other provisions are classified as provision for liabilities under long-term debt.
PensionsThe Company’s pension obligations to its employees consist of making a specified contribution to each employee’s pension fund (defined contribution plan). The pension cost consists of the period’s contribution including employers’ social security tax. The Company has no further payment commitment after the contributions have been paid.
Extraordinary income and expensesIncome is classified as extraordinary if it is unusual, irregular and material considered in relation to the company’s business.
Accounts receivables and other receivablesAccounts receivable and other current receivables are recorded in the balance sheet at nominal value less confirmed losses and provisions for doubtful accounts. Provisions for doubtful accounts are based on specific assessments of individual accounts, as well as an assessment of the group of accounts as a whole.
Cash and cash equivalentsCash and cash equivalents consist of cash and bank deposits.
The Company is a participant in the Group s cash pool system, and all of the bank accounts which are part of the system are presented as intercompany receivables/debt in the balance sheet.
Use of estimatesWhen there is uncertainty regarding the measurement of an item in the accounts, the best estimate is applied. Changes in estimates are accounted for in the period that the change is made. Estimates are subject to uncertainty and may deviate from the final outcome.
Cash flow statementThe cash flow statement presents the accumulated cash flow for operational, investment and financial activities. The statement outlines each activity’s effect on cash and cash equivalents. The cash flow statement has been prepared using the indirect method.
Income TaxThe tax expense in the financial statements consists of tax payable and changes in deferred tax. Deferred tax/tax asset is calculated using the relevant tax rate on all temporary differences that exist between the tax bases of assets and liabilities and their carrying amounts in the financial statements, as well as any tax losses carried forward at year-end.
Tax increasing and tax reducing temporary differences that are reversed, or can be reversed in the same period are recorded net. Deferred tax assets are recorded in the balance sheet when it is more likely than not that the tax assets will be utilized.
BorrowingsBorrowings are recognised initally at fair value, net of transaction costs incurred. Borrowing are subsequently stated at amortised cost, any difference between the proceeds (net of transaction costs) and the redemption value is recognised in the income statement over the period og the borrowings using the effective interest method.
Fee paid on the establishment of loan facilities are recognised as transaction costs of the loan to the extent that it is probable that some or all of the facility will be drawn down. In this care, the fee is deferred until the drawn down occurs. To the extent there is no evidence that it is probable that some or all of the facility will be drawn down, the fee is capitalised as a pre-payment for liquidity services and amortised over the period of the facility to which it relates.
Borrowings are classified as current liabilities unless the Company has an unconditional right to defer settlement of the liability for at least 12 months after the balance sheet date.
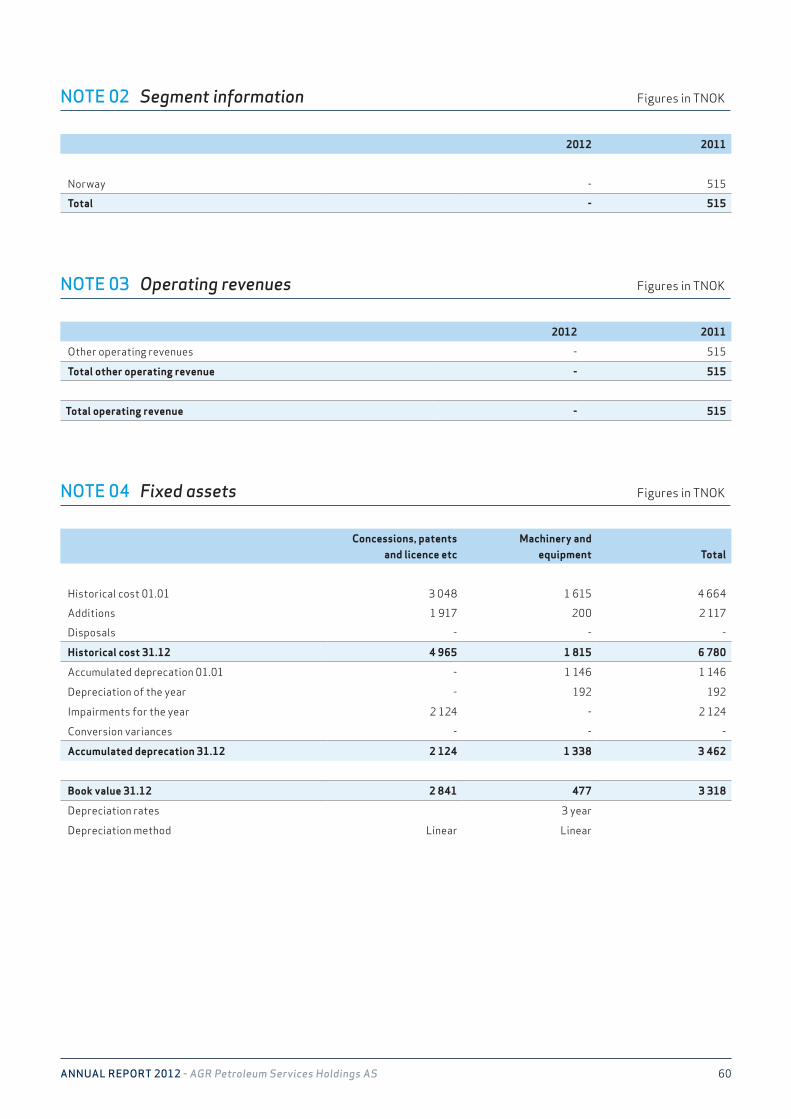
AnnuAl RepoRt 2012 - AGR Petroleum Services Holdings AS 60
2012 2011
Norway - 515
Total - 515
Concessions, patents and licence etc
Machinery and equipment Total
Historical cost 01.01 3 048 1 615 4 664
Additions 1 917 200 2 117
Disposals - - -
Historical cost 31.12 4 965 1 815 6 780
Accumulated deprecation 01.01 - 1 146 1 146
Depreciation of the year - 192 192
Impairments for the year 2 124 - 2 124
Conversion variances - - -
Accumulated deprecation 31.12 2 124 1 338 3 462
Book value 31.12 2 841 477 3 318
Depreciation rates 3 year
Depreciation method Linear Linear
NOTE 02 Segment information Figures in TNOK
NOTE 03 Operating revenues Figures in TNOK
2012 2011
Other operating revenues - 515
Total other operating revenue - 515
Total operating revenue - 515
NOTE 04 Fixed assets Figures in TNOK
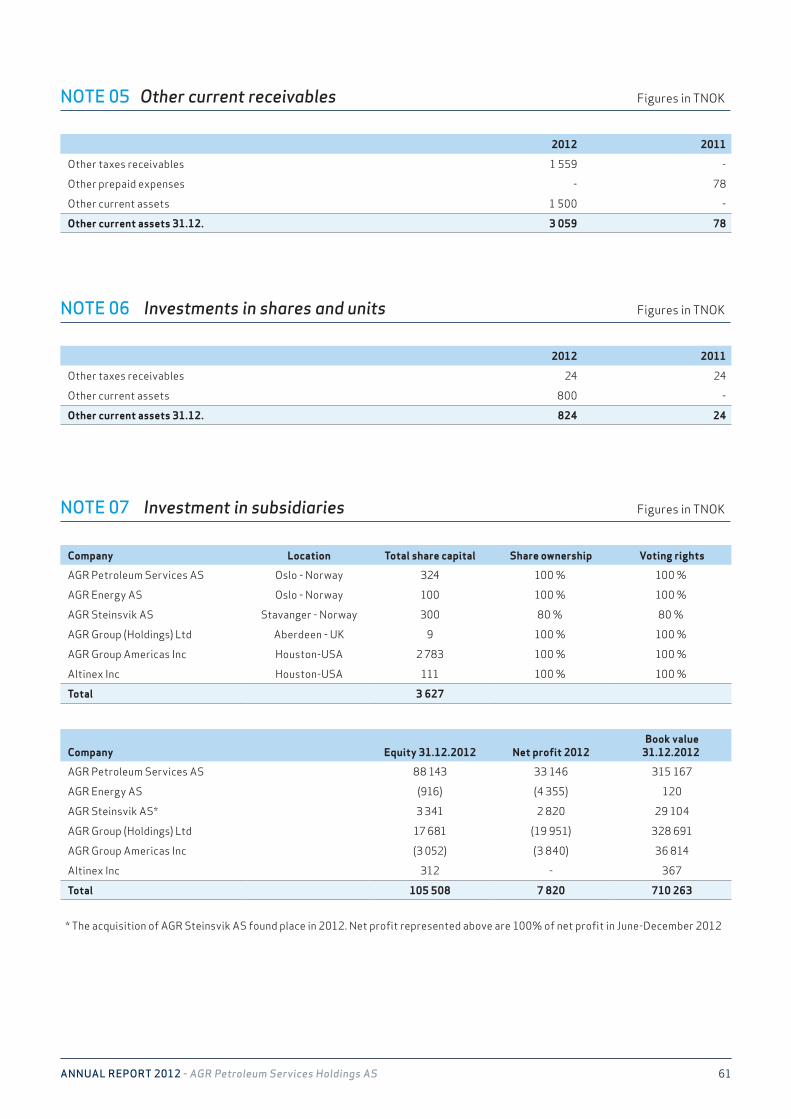
AnnuAl RepoRt 2012 - AGR Petroleum Services Holdings AS 61
NOTE 07 Investment in subsidiaries Figures in TNOK
NOTE 05 Other current receivables Figures in TNOK
NOTE 06 Investments in shares and units Figures in TNOK
2012 2011
Other taxes receivables 1 559 -
Other prepaid expenses - 78
Other current assets 1 500 -
Other current assets 31.12. 3 059 78
2012 2011
Other taxes receivables 24 24
Other current assets 800 -
Other current assets 31.12. 824 24
Company Location Total share capital Share ownership Voting rights
AGR Petroleum Services AS Oslo - Norway 324 100 % 100 %
AGR Energy AS Oslo - Norway 100 100 % 100 %
AGR Steinsvik AS Stavanger - Norway 300 80 % 80 %
AGR Group (Holdings) Ltd Aberdeen - UK 9 100 % 100 %
AGR Group Americas Inc Houston-USA 2 783 100 % 100 %
Altinex Inc Houston-USA 111 100 % 100 %
Total 3 627
Company Equity 31.12.2012 Net profit 2012 Book value 31.12.2012
AGR Petroleum Services AS 88 143 33 146 315 167
AGR Energy AS (916) (4 355) 120
AGR Steinsvik AS* 3 341 2 820 29 104
AGR Group (Holdings) Ltd 17 681 (19 951) 328 691
AGR Group Americas Inc (3 052) (3 840) 36 814
Altinex Inc 312 - 367
Total 105 508 7 820 710 263
* The acquisition of AGR Steinsvik AS found place in 2012. Net profit represented above are 100% of net profit in June-December 2012
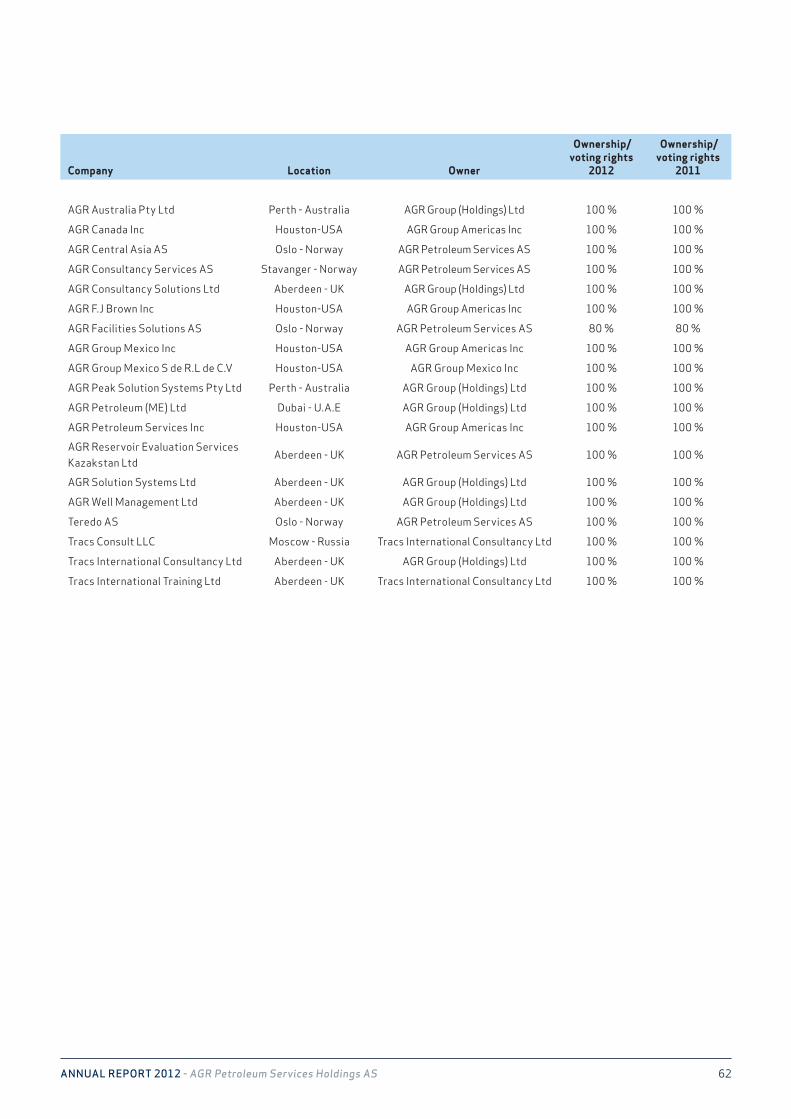
AnnuAl RepoRt 2012 - AGR Petroleum Services Holdings AS 62
NOTE 07 Investment in subsidiaries Figures in TNOK
Company Location Owner
Ownership/ voting rights
2012
Ownership/ voting rights
2011
AGR Australia Pty Ltd Perth - Australia AGR Group (Holdings) Ltd 100 % 100 %
AGR Canada Inc Houston-USA AGR Group Americas Inc 100 % 100 %
AGR Central Asia AS Oslo - Norway AGR Petroleum Services AS 100 % 100 %
AGR Consultancy Services AS Stavanger - Norway AGR Petroleum Services AS 100 % 100 %
AGR Consultancy Solutions Ltd Aberdeen - UK AGR Group (Holdings) Ltd 100 % 100 %
AGR F.J Brown Inc Houston-USA AGR Group Americas Inc 100 % 100 %
AGR Facilities Solutions AS Oslo - Norway AGR Petroleum Services AS 80 % 80 %
AGR Group Mexico Inc Houston-USA AGR Group Americas Inc 100 % 100 %
AGR Group Mexico S de R.L de C.V Houston-USA AGR Group Mexico Inc 100 % 100 %
AGR Peak Solution Systems Pty Ltd Perth - Australia AGR Group (Holdings) Ltd 100 % 100 %
AGR Petroleum (ME) Ltd Dubai - U.A.E AGR Group (Holdings) Ltd 100 % 100 %
AGR Petroleum Services Inc Houston-USA AGR Group Americas Inc 100 % 100 %
AGR Reservoir Evaluation Services Kazakstan Ltd
Aberdeen - UK AGR Petroleum Services AS 100 % 100 %
AGR Solution Systems Ltd Aberdeen - UK AGR Group (Holdings) Ltd 100 % 100 %
AGR Well Management Ltd Aberdeen - UK AGR Group (Holdings) Ltd 100 % 100 %
Teredo AS Oslo - Norway AGR Petroleum Services AS 100 % 100 %
Tracs Consult LLC Moscow - Russia Tracs International Consultancy Ltd 100 % 100 %
Tracs International Consultancy Ltd Aberdeen - UK AGR Group (Holdings) Ltd 100 % 100 %
Tracs International Training Ltd Aberdeen - UK Tracs International Consultancy Ltd 100 % 100 %
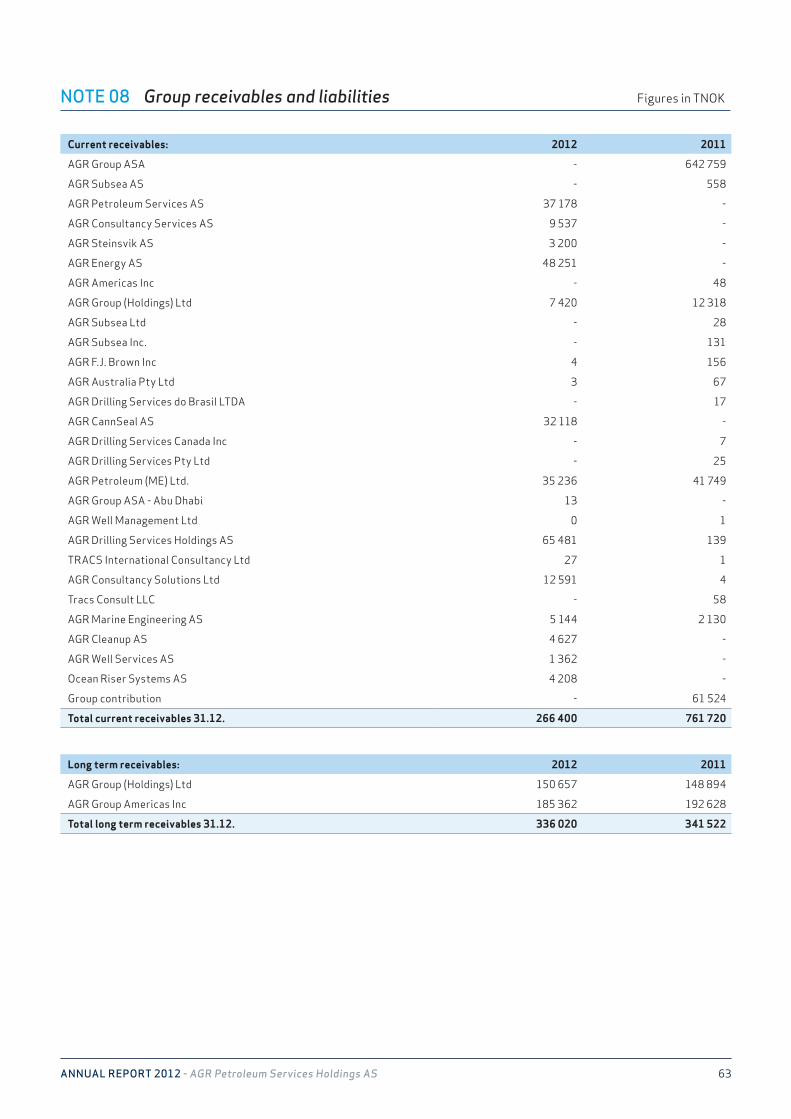
AnnuAl RepoRt 2012 - AGR Petroleum Services Holdings AS 63
Long term receivables: 2012 2011
AGR Group (Holdings) Ltd 150 657 148 894
AGR Group Americas Inc 185 362 192 628
Total long term receivables 31.12. 336 020 341 522
NOTE 08 Group receivables and liabilities Figures in TNOK
Current receivables: 2012 2011
AGR Group ASA - 642 759
AGR Subsea AS - 558
AGR Petroleum Services AS 37 178 -
AGR Consultancy Services AS 9 537 -
AGR Steinsvik AS 3 200 -
AGR Energy AS 48 251 -
AGR Americas Inc - 48
AGR Group (Holdings) Ltd 7 420 12 318
AGR Subsea Ltd - 28
AGR Subsea Inc. - 131
AGR F.J. Brown Inc 4 156
AGR Australia Pty Ltd 3 67
AGR Drilling Services do Brasil LTDA - 17
AGR CannSeal AS 32 118 -
AGR Drilling Services Canada Inc - 7
AGR Drilling Services Pty Ltd - 25
AGR Petroleum (ME) Ltd. 35 236 41 749
AGR Group ASA - Abu Dhabi 13 -
AGR Well Management Ltd 0 1
AGR Drilling Services Holdings AS 65 481 139
TRACS International Consultancy Ltd 27 1
AGR Consultancy Solutions Ltd 12 591 4
Tracs Consult LLC - 58
AGR Marine Engineering AS 5 144 2 130
AGR Cleanup AS 4 627 -
AGR Well Services AS 1 362 -
Ocean Riser Systems AS 4 208 -
Group contribution - 61 524
Total current receivables 31.12. 266 400 761 720
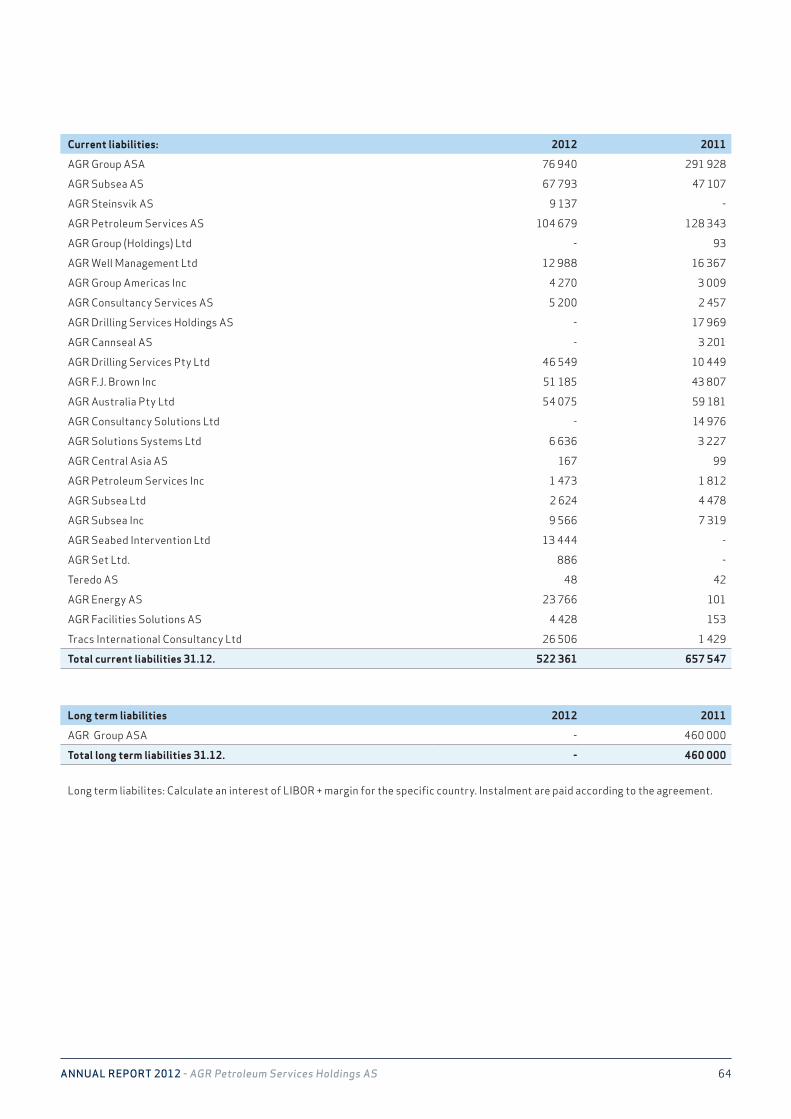
AnnuAl RepoRt 2012 - AGR Petroleum Services Holdings AS 64
Long term liabilities 2012 2011
AGR Group ASA - 460 000
Total long term liabilities 31.12. - 460 000
Long term liabilites: Calculate an interest of LIBOR + margin for the specific country. Instalment are paid according to the agreement.
NOTE 08 Group receivables and liabilities Figures in TNOK
Current liabilities: 2012 2011
AGR Group ASA 76 940 291 928
AGR Subsea AS 67 793 47 107
AGR Steinsvik AS 9 137 -
AGR Petroleum Services AS 104 679 128 343
AGR Group (Holdings) Ltd - 93
AGR Well Management Ltd 12 988 16 367
AGR Group Americas Inc 4 270 3 009
AGR Consultancy Services AS 5 200 2 457
AGR Drilling Services Holdings AS - 17 969
AGR Cannseal AS - 3 201
AGR Drilling Services Pty Ltd 46 549 10 449
AGR F.J. Brown Inc 51 185 43 807
AGR Australia Pty Ltd 54 075 59 181
AGR Consultancy Solutions Ltd - 14 976
AGR Solutions Systems Ltd 6 636 3 227
AGR Central Asia AS 167 99
AGR Petroleum Services Inc 1 473 1 812
AGR Subsea Ltd 2 624 4 478
AGR Subsea Inc 9 566 7 319
AGR Seabed Intervention Ltd 13 444 -
AGR Set Ltd. 886 -
Teredo AS 48 42
AGR Energy AS 23 766 101
AGR Facilities Solutions AS 4 428 153
Tracs International Consultancy Ltd 26 506 1 429
Total current liabilities 31.12. 522 361 657 547
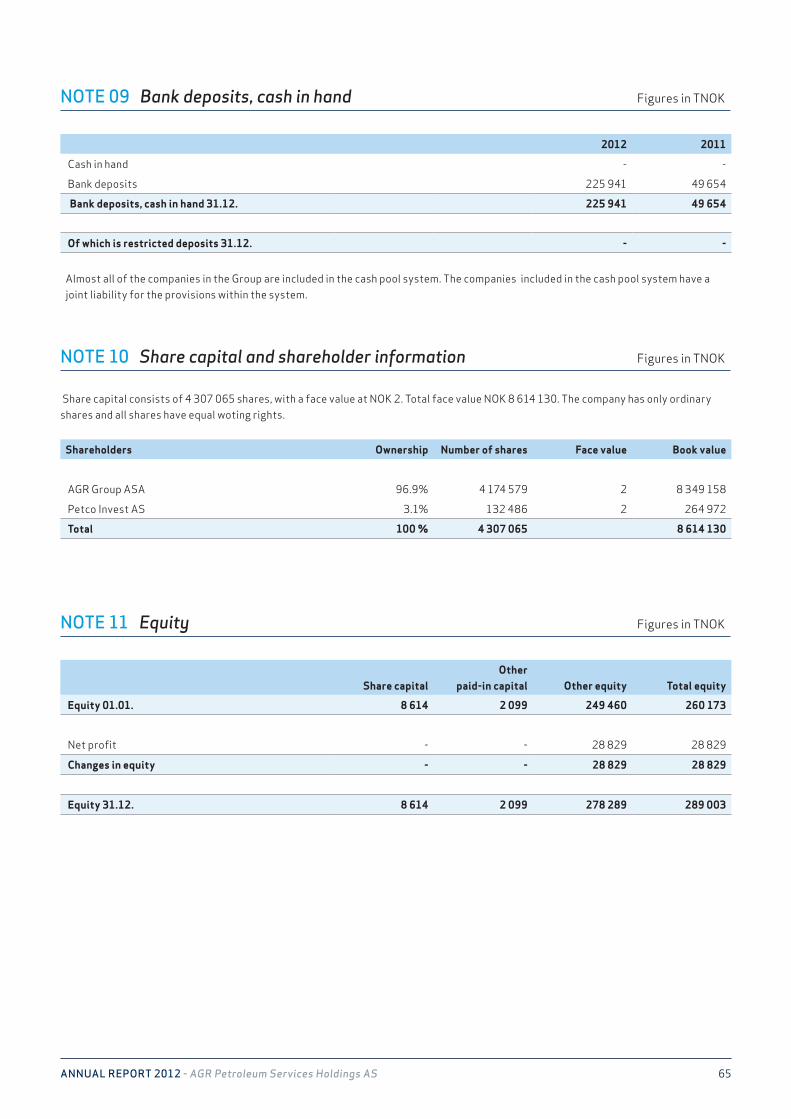
AnnuAl RepoRt 2012 - AGR Petroleum Services Holdings AS 65
NOTE 09 Bank deposits, cash in hand Figures in TNOK
NOTE 10 Share capital and shareholder information Figures in TNOK
NOTE 11 Equity Figures in TNOK
Share capital consists of 4 307 065 shares, with a face value at NOK 2. Total face value NOK 8 614 130. The company has only ordinary shares and all shares have equal woting rights.
2012 2011
Cash in hand - -
Bank deposits 225 941 49 654
Bank deposits, cash in hand 31.12. 225 941 49 654
Of which is restricted deposits 31.12. - -
Almost all of the companies in the Group are included in the cash pool system. The companies included in the cash pool system have a joint liability for the provisions within the system.
Shareholders Ownership Number of shares Face value Book value
AGR Group ASA 96.9% 4 174 579 2 8 349 158
Petco Invest AS 3.1% 132 486 2 264 972
Total 100 % 4 307 065 8 614 130
Share capital Other
paid-in capital Other equity Total equity
Equity 01.01. 8 614 2 099 249 460 260 173
Net profit - - 28 829 28 829
Changes in equity - - 28 829 28 829
Equity 31.12. 8 614 2 099 278 289 289 003
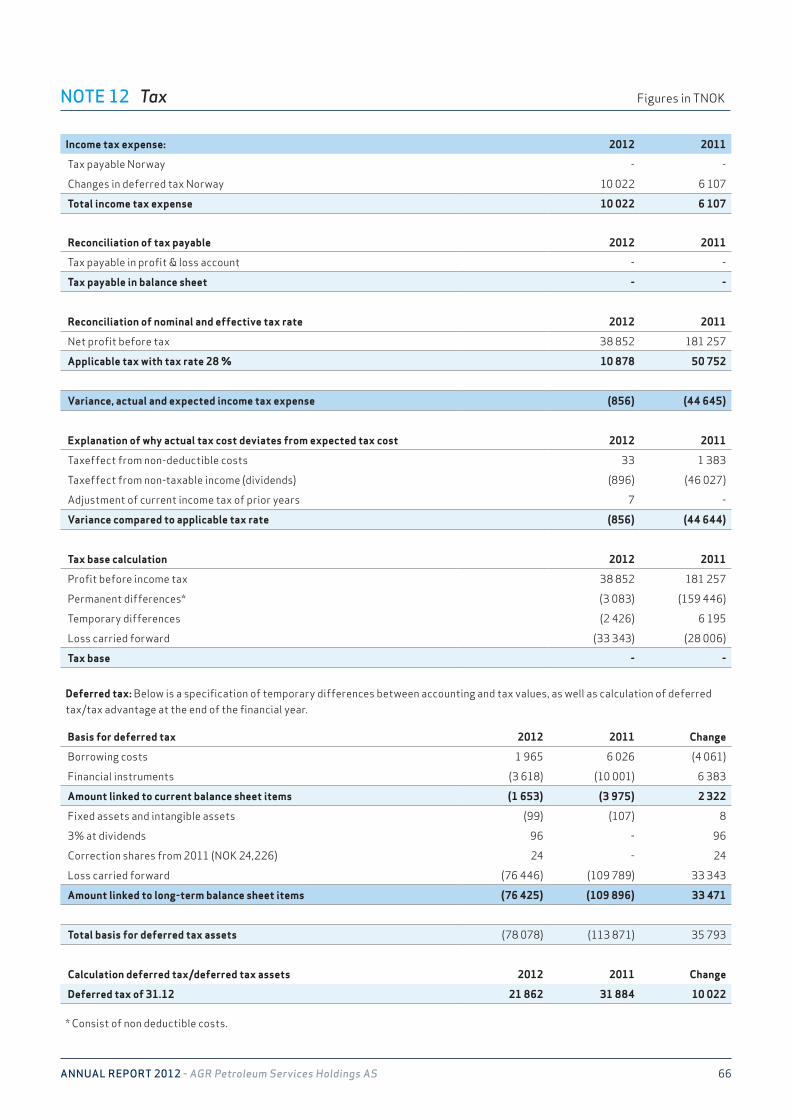
AnnuAl RepoRt 2012 - AGR Petroleum Services Holdings AS 66
NOTE 12 Tax Figures in TNOK
Income tax expense: 2012 2011
Tax payable Norway - -
Changes in deferred tax Norway 10 022 6 107
Total income tax expense 10 022 6 107
Reconciliation of tax payable 2012 2011
Tax payable in profit & loss account - -
Tax payable in balance sheet - -
Reconciliation of nominal and effective tax rate 2012 2011
Net profit before tax 38 852 181 257
Applicable tax with tax rate 28 % 10 878 50 752
Variance, actual and expected income tax expense (856) (44 645)
Explanation of why actual tax cost deviates from expected tax cost 2012 2011
Taxeffect from non-deductible costs 33 1 383
Taxeffect from non-taxable income (dividends) (896) (46 027)
Adjustment of current income tax of prior years 7 -
Variance compared to applicable tax rate (856) (44 644)
Tax base calculation 2012 2011
Profit before income tax 38 852 181 257
Permanent differences* (3 083) (159 446)
Temporary differences (2 426) 6 195
Loss carried forward (33 343) (28 006)
Tax base - -
Deferred tax: Below is a specification of temporary differences between accounting and tax values, as well as calculation of deferred tax/tax advantage at the end of the financial year.
Basis for deferred tax 2012 2011 Change
Borrowing costs 1 965 6 026 (4 061)
Financial instruments (3 618) (10 001) 6 383
Amount linked to current balance sheet items (1 653) (3 975) 2 322
Fixed assets and intangible assets (99) (107) 8
3% at dividends 96 - 96
Correction shares from 2011 (NOK 24,226) 24 - 24
Loss carried forward (76 446) (109 789) 33 343
Amount linked to long-term balance sheet items (76 425) (109 896) 33 471
Total basis for deferred tax assets (78 078) (113 871) 35 793
Calculation deferred tax/deferred tax assets 2012 2011 Change
Deferred tax of 31.12 21 862 31 884 10 022
* Consist of non deductible costs.
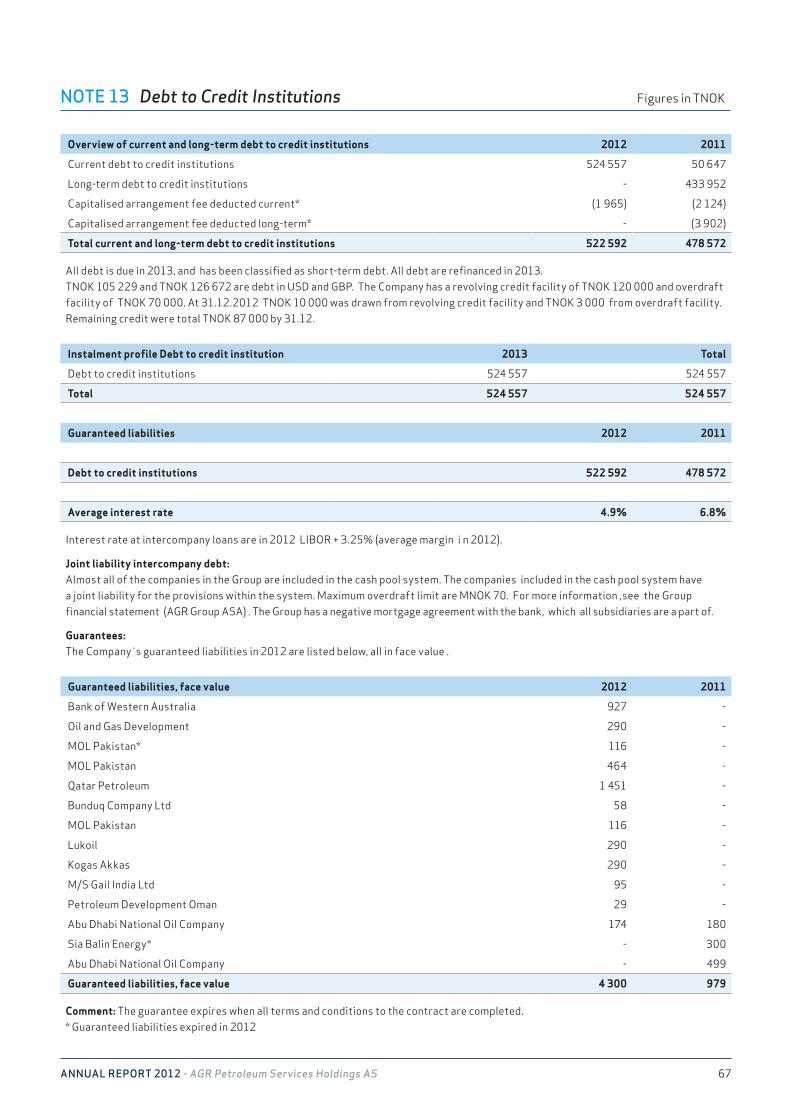
AnnuAl RepoRt 2012 - AGR Petroleum Services Holdings AS 67
NOTE 13 Debt to Credit Institutions Figures in TNOK
Overview of current and long-term debt to credit institutions 2012 2011
Current debt to credit institutions 524 557 50 647
Long-term debt to credit institutions - 433 952
Capitalised arrangement fee deducted current* (1 965) (2 124)
Capitalised arrangement fee deducted long-term* - (3 902)
Total current and long-term debt to credit institutions 522 592 478 572
All debt is due in 2013, and has been classified as short-term debt. All debt are refinanced in 2013.TNOK 105 229 and TNOK 126 672 are debt in USD and GBP. The Company has a revolving credit facility of TNOK 120 000 and overdraft facility of TNOK 70 000. At 31.12.2012 TNOK 10 000 was drawn from revolving credit facility and TNOK 3 000 from overdraft facility. Remaining credit were total TNOK 87 000 by 31.12.
Instalment profile Debt to credit institution 2013 Total
Debt to credit institutions 524 557 524 557
Total 524 557 524 557
Guaranteed liabilities 2012 2011
Debt to credit institutions 522 592 478 572
Average interest rate 4.9% 6.8%
Interest rate at intercompany loans are in 2012 LIBOR + 3.25% (average margin i n 2012).
Joint liability intercompany debt:Almost all of the companies in the Group are included in the cash pool system. The companies included in the cash pool system have a joint liability for the provisions within the system. Maximum overdraft limit are MNOK 70. For more information ,see the Group financial statement (AGR Group ASA) . The Group has a negative mortgage agreement with the bank, which all subsidiaries are a part of.
Guarantees:The Company s guaranteed liabilities in 2012 are listed below, all in face value .
Guaranteed liabilities, face value 2012 2011
Bank of Western Australia 927 -
Oil and Gas Development 290 -
MOL Pakistan* 116 -
MOL Pakistan 464 -
Qatar Petroleum 1 451 -
Bunduq Company Ltd 58 -
MOL Pakistan 116 -
Lukoil 290 -
Kogas Akkas 290 -
M/S Gail India Ltd 95 -
Petroleum Development Oman 29 -
Abu Dhabi National Oil Company 174 180
Sia Balin Energy* - 300
Abu Dhabi National Oil Company - 499
Guaranteed liabilities, face value 4 300 979
Comment: The guarantee expires when all terms and conditions to the contract are completed.* Guaranteed liabilities expired in 2012
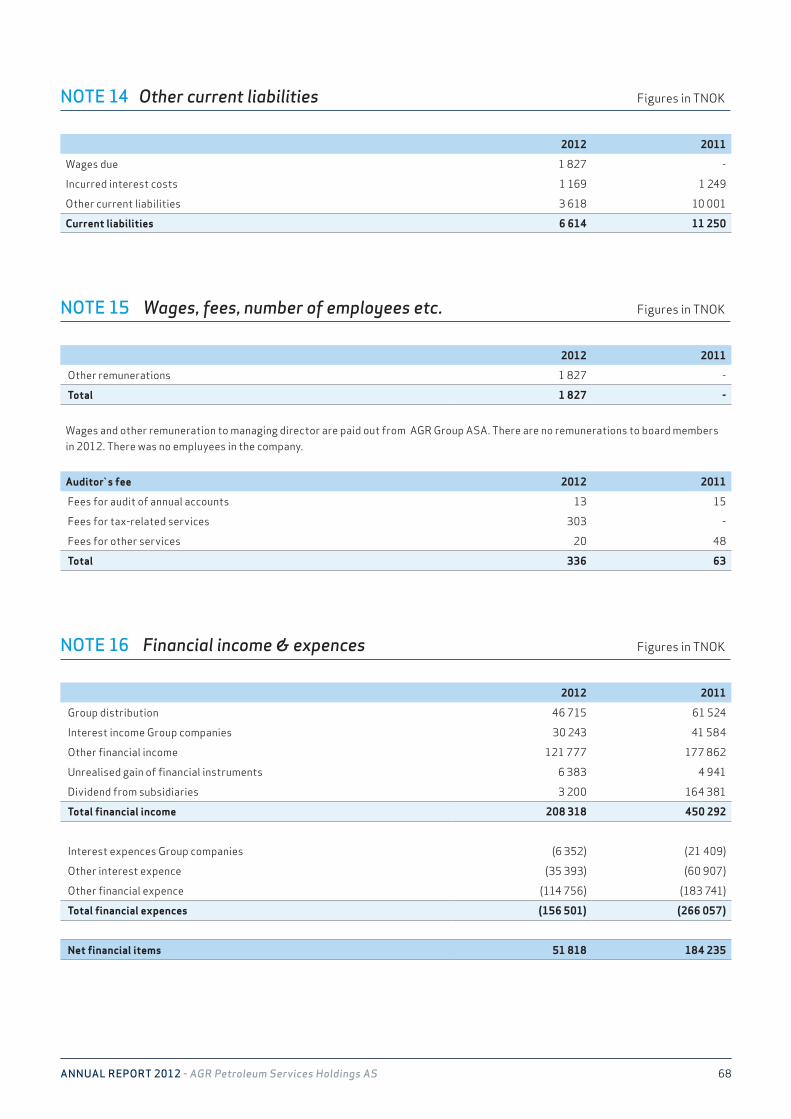
AnnuAl RepoRt 2012 - AGR Petroleum Services Holdings AS 68
NOTE 14 Other current liabilities Figures in TNOK
NOTE 15 Wages, fees, number of employees etc. Figures in TNOK
NOTE 16 Financial income & expences Figures in TNOK
2012 2011
Wages due 1 827 -
Incurred interest costs 1 169 1 249
Other current liabilities 3 618 10 001
Current liabilities 6 614 11 250
2012 2011
Other remunerations 1 827 -
Total 1 827 -
Wages and other remuneration to managing director are paid out from AGR Group ASA. There are no remunerations to board members in 2012. There was no empluyees in the company.
2012 2011
Group distribution 46 715 61 524
Interest income Group companies 30 243 41 584
Other financial income 121 777 177 862
Unrealised gain of financial instruments 6 383 4 941
Dividend from subsidiaries 3 200 164 381
Total financial income 208 318 450 292
Interest expences Group companies (6 352) (21 409)
Other interest expence (35 393) (60 907)
Other financial expence (114 756) (183 741)
Total financial expences (156 501) (266 057)
Net financial items 51 818 184 235
Auditor s fee 2012 2011
Fees for audit of annual accounts 13 15
Fees for tax-related services 303 -
Fees for other services 20 48
Total 336 63
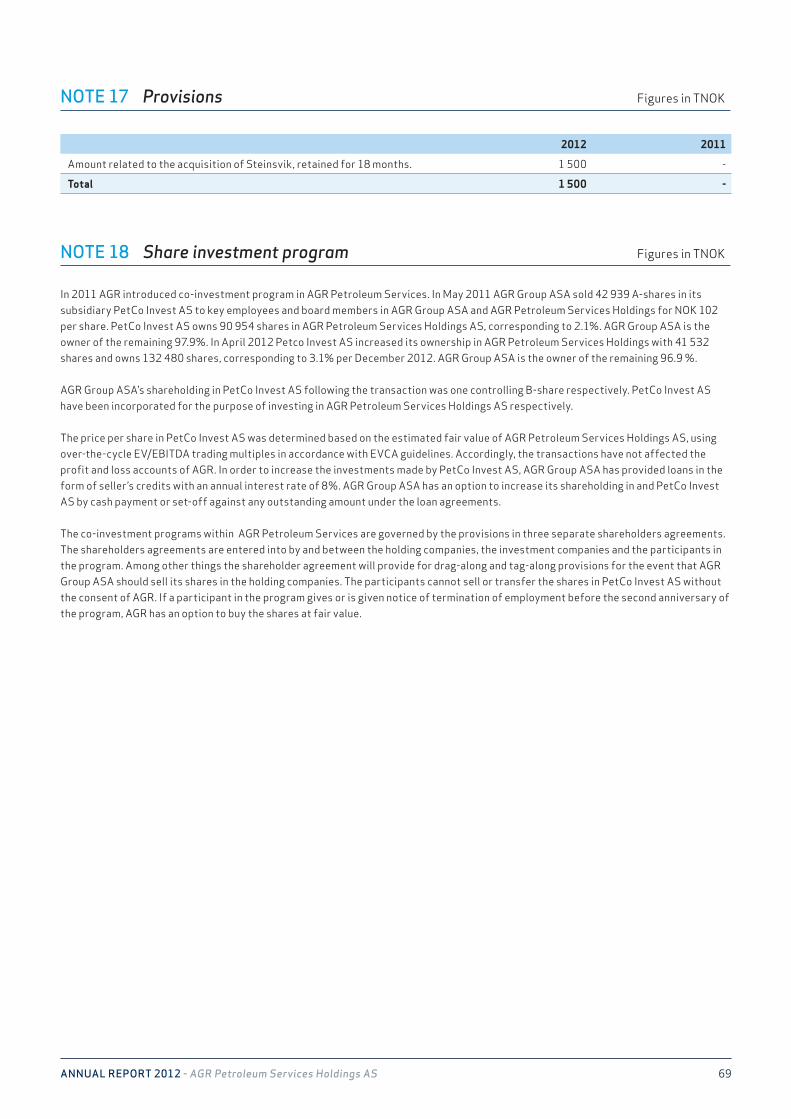
AnnuAl RepoRt 2012 - AGR Petroleum Services Holdings AS 69
NOTE 18 Share investment program Figures in TNOK
In 2011 AGR introduced co-investment program in AGR Petroleum Services. In May 2011 AGR Group ASA sold 42 939 A-shares in its subsidiary PetCo Invest AS to key employees and board members in AGR Group ASA and AGR Petroleum Services Holdings for NOK 102 per share. PetCo Invest AS owns 90 954 shares in AGR Petroleum Services Holdings AS, corresponding to 2.1%. AGR Group ASA is the owner of the remaining 97.9%. In April 2012 Petco Invest AS increased its ownership in AGR Petroleum Services Holdings with 41 532 shares and owns 132 480 shares, corresponding to 3.1% per December 2012. AGR Group ASA is the owner of the remaining 96.9 %. AGR Group ASA’s shareholding in PetCo Invest AS following the transaction was one controlling B-share respectively. PetCo Invest AS have been incorporated for the purpose of investing in AGR Petroleum Services Holdings AS respectively.
The price per share in PetCo Invest AS was determined based on the estimated fair value of AGR Petroleum Services Holdings AS, using over-the-cycle EV/EBITDA trading multiples in accordance with EVCA guidelines. Accordingly, the transactions have not affected the profit and loss accounts of AGR. In order to increase the investments made by PetCo Invest AS, AGR Group ASA has provided loans in the form of seller’s credits with an annual interest rate of 8%. AGR Group ASA has an option to increase its shareholding in and PetCo Invest AS by cash payment or set-off against any outstanding amount under the loan agreements.
The co-investment programs within AGR Petroleum Services are governed by the provisions in three separate shareholders agreements. The shareholders agreements are entered into by and between the holding companies, the investment companies and the participants in the program. Among other things the shareholder agreement will provide for drag-along and tag-along provisions for the event that AGR Group ASA should sell its shares in the holding companies. The participants cannot sell or transfer the shares in PetCo Invest AS without the consent of AGR. If a participant in the program gives or is given notice of termination of employment before the second anniversary of the program, AGR has an option to buy the shares at fair value.
NOTE 17 Provisions Figures in TNOK
2012 2011
Amount related to the acquisition of Steinsvik, retained for 18 months. 1 500 -
Total 1 500 -

AnnuAl RepoRt 2012 - AGR Petroleum Services Holdings AS 70
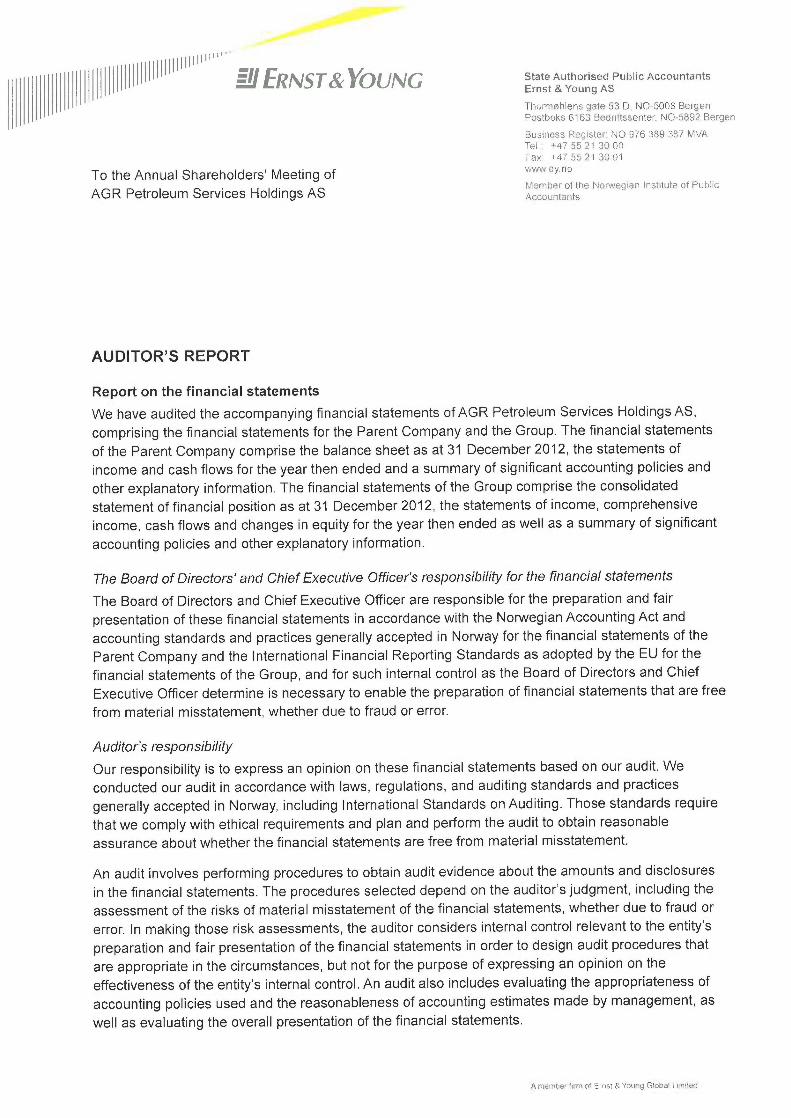
~ IIIIII~~~~'~~~~ _/ ERNST&YOUNG
To the Annual Shareholders' Meeting of
AGR Petroleum Services Holdings AS
AUDITOR'S REPORT
State Authorised Pubiic AccountantsErnst &Young AS
ThormØhiens gate 53 D: NO-5Q08 BergenPostbaks 6163 Bedriftssenter, NO-5892 Bergen
E3usiness Register': NO 976 389 387 MVATel.. +47 55 21 30 UOFBx: +47 55 21 30 U1www e y. no
Member of the Norwegian institute of Public,
Accountants
Report on the financial statements
We have audited the accompanying financial statements ofAGR Petroleum Services Holdings AS,
comprising the financial statements for the Parent Company and the Group. The financial statements
of the Parent Company comprise the balance sheet as at 31 December 2012, the statements of
income and cash flows for the year then ended and a summary of significant accounting policies and
other explanatory information. The financial statements of the Group comprise the consolidated
statement of financial position as at 31 December 2012, the statements of income, comprehensive
income, cash flows and changes in equity for the year then ended as well as a summary of significant
accounting policies and other explanatory information.
The Board of Directors' and Chief Executive Officer's responsibility for the financial statements
The Board of Directors and Chief Executive Officer are responsible for the preparation and fair
presentation of these financial statements in accordance with the Norwegian Accounting Act and
accounting standards and practices generally accepted in Norway for the financial statements of the
Parent Company and the International Financial Reporting Standards as adopted by the EU for the
financial statements of the Group, and for such internal control as the Board of Directors and Chief
Executive Officer determine is necessary to enable the preparation of financial statements that are free
from material misstatement, whether due to fraud or error.
Auditor's responsibility
Our responsibility is to express an opinion on these financial statements based on our audit. We
conducted our audit in accordance with laws, regulations, and auditing standards and practices
generally accepted in Norway, including International Standards on Auditing. Those standards require
that we comply with ethical requirements and plan and perform the audit to obtain reasonable
assurance about whether the financial statements are free from material misstatement.
An audit involves performing procedures to obtain audit evidence about the amounts and disclosures
in the financial statements. The procedures selected depend on the auditor's judgment, including the
assessment of the risks of material misstatement of the financial statements, whether due to fraud or
error. In making those risk assessments, the auditor considers internal control relevant to the entity's
preparation and fair presentation of the financial statements in order to design audit procedures that
are appropriate in the circumstances, but not for the purpose of expressing an opinion on the
effectiveness of the entity's internal control. An audit also includes evaluating the appropriateness of
accounting policies used and the reasonableness of accounting estimates made by management, as
well as evaluating the overall presentation of the financial statements.
A n~i~ir~ber P~rrn cif Ernst & Y~uny Globy t,irn~t~d
=~ ERNST &YOUNG ~~
We believe that the audit evidence we have obtained is sufficient and appropriate to provide a basis for
our audit opinion on the financial statements for the Parent Company and the Group.
Opinion on fhe financial statements of the Parent Company
In our opinion, the financial statements ofAGR Petroleum Services Holdings AS have been prepared
in accordance with laws and regulations and present fairly, in all material respects, the financial
position of the Company as at 31 December 2012 and its financial performance and cash flows for the
year then ended in accordance with the Norwegian Accounting Act and accounting standards and
practices generally accepted in Norway.
Opinion on the financial statements of the Group
In our opinion, the financial statements of the Group have been prepared in accordance with laws and
regulations and present fairly, in all material respects, the financial position of the Group as at 31
December 2012 and its financial performance and cash flows for the year then ended in accordance
with the International Financial Reporting Standards as adopted by the EU.
Report on other legal and regulatory requirements
Opinion on the Board of Directors' report
Based on our audit of the financial statements as described above, it is our opinion that the information
presented in the Directors' report concerning the financial statements, the going concern assumption
and the proposal for the allocation of the result is consistent with the financial statements and complies
with the law and regulations.
Opinion on registration and documentation
Based on our audit of the financial statements as described above, and control procedures we have
considered necessary in accordance with the International Standard on Assurance Engagements
(ISAE) 3000, «Assurance Engagements Other than Audits or Reviews of Historical Financial
Information», it is our opinion that the Board of Directors and Chief Executive Officer have fulfilled their
duty to ensure that the Company's accounting information is properly recorded and documented as
required by law and generally accepted bookkeeping practice in Norway.
Bergen,
ERN~r c
eState Authorised Public Accountant (Norway)

AnnuAl RepoRt 2012 - AGR Petroleum Services Holdings AS 73
www.agr.com