Embed Size (px)
Citation preview

CARBON CONSTRAINED
FUTUREAGL’s approach to climate
change mitigation: a scenario analysis

AGL ENERGY LIMITED ABN 74 115 061 375
Contents
1. Introduction 2
2. AGL's approach to climate change 3
3. Emission reduction scenarios 7
4. Modelling approach and results 9
5. Conclusion 13
About this Report
This report outlines how AGL is positioning its business for a carbon constrained future, and provides the results of economic modelling of the impacts of various carbon constraints on the National Electricity Market and the AGL generation portfolio. The results do not represent an expected or preferred view of the future; rather the model optimises the replacement of existing power station output with low emission generation to minimise the overall costs of meeting demand given a range of specific assumptions. As such, caution should be exercised when interpreting the results.

CARBON CONSTRAINED FUTUREAGL’s approach to climate change mitigation: a scenario analysis
1
Climate change will drive a fundamental change in the way Australians produce and consume energy. With a proud history of evolving to meet the challenges of change, AGL is positioning itself to generate value throughout this transition and beyond.

2 CARBON CONSTRAINED FUTURE
INTRODUCTION
On 12 December 2015, 195 nations adopted a new global agreement aimed at mitigating dangerous climate change. Through the Intended Nationally Determined Contributions (INDC) process, it is estimated that countries have collectively agreed to reduce emissions in a manner consistent with limiting anthropogenic climate change to 2.7 degrees Celsius above pre-industrial levels. The ambition within the ‘Paris Agreement’ is stronger, involving a goal of limiting global warming to less than 2 degrees, and concerted effort to constrain warming to less than 1.5 degrees above pre-industrial levels.
The energy sector, and in particular electricity generation, has an important role in this transition. Generation of electricity produces around one-third of Australia’s greenhouse gas emissions and approximately three-quarters of the existing steam-based generation fleet is beyond its original design life. In this context, AGL is committed to playing a leading role in developing a pathway to a modern, decarbonised generation sector. This transition presents both risks and opportunities. Longer-term, it is likely to provide an opportunity for growth and value creation.
The electricity generation industry cannot effect a low-carbon transition in isolation of government and public policy settings. AGL has consistently advocated for long-term and consistent policy that provides the requisite stability and certainty to invest in new low-emissions generation capacity with a view to creating value for shareholders, customers, employees and communities. In coming years, policy makers will need to better integrate electricity and climate change policy to ensure that the transition to a decarbonised energy system is least cost and efficient.
AGL is Australia’s largest corporate emitter of greenhouse gas emissions. AGL’s operational footprint is around 44 million tonnes with the vast majority of emissions produced at just four power stations: Bayswater; Liddell; Loy Yang A; and Torrens Island. These four generation assets produce enough electricity for millions of Australian homes and businesses. At the same time, AGL has Australia’s largest privately-owned and operated portfolio of large-scale renewable energy assets, including the Hallett wind farms in South Australia; the Macarthur and Oaklands Hill wind farms in Victoria; hydro power stations in Victoria; and the Nyngan and Broken Hill solar plants in New South Wales.
This report has been developed with the purpose of framing the risks and opportunities associated with decarbonisation of AGL’s large scale generation fleet. While other aspects of AGL’s business could possibly be impacted by climate change mitigation and adaptation policy, the 44 million tonne scope 1 footprint represents the most material aspect of AGL’s response to climate change. Utilising PLEXOS1 modelling software, three scenarios of the National Electricity Market are presented: no carbon constraint; a carbon constraint that provides a linear pathway from emissions in 2016 to a 26-28% reduction in 2030; and an emissions constraint that represents a carbon budget consistent with limiting climate change to 2 degrees above pre-industrial levels. The purpose of this analysis is to demonstrate the sustainability of AGL’s generation fleet in a carbon constrained future across a range of scenarios. Although a 1.5 degree infers a tighter carbon budget, the marginal impact on emission reduction for electricity systems is muted2. As such our analysis includes reference to 2 degree carbon budget assessments.
The analysis demonstrates that AGL's generation fleet plays a critical role in the transition to a decarbonised generation sector, providing valuable low cost and efficient generation over the coming decades while the power sector transitions to more renewables and distributed energy resources. Importantly, the modelling is based upon least-cost dispatch within the National Electricity Market and ignores real-world constraints such as game theory; portfolio optimisation and non short run marginal cost (SRMC) bidding. Given all of the emission reduction scenarios involve significant penetration of renewables, caution should be exercised in analysing the results. The wholesale energy market design may require alteration in such an environment3, and this is discussed in detail in section four (policy implications). Such reform would affect the economic results presented in this report. Nevertheless, the results show the importance of AGL’s strategic direction, providing near and medium term value through existing technologies while positioning the organisation for growth in a carbon constrained future.
This report is structured as follows: Section 2 provides details on AGL’s approach to climate change and information on how AGL integrates consideration of climate change across the business; Section 3 shows how the emission reduction scenarios modelled were derived; Section 4 outlines the approach taken to modelling these scenarios and presents the results with concluding remarks provided in Section 5.
INTRODUCTION
2 INTRODUCTION
1 See http://energyexemplar.com/software/plexos-desktop-edition/ for further information on the PLEXOS modelling software. 2 See Rogelj, J. et al. Energy system transformations for limiting end-of-century warming to below 1.5 °C. Nature Clim. Change 5, 519–527 (2015).3 For further information, see Nelson, T. and Orton, F. (2016), ‘Climate and electricity policy integration: Is the South Australian electricity market the canary in the coalmine?’,
The Electricity Journal, Vol. 29, No. 4, pp. 1-7.
1.

3
AGL accepts the Intergovernmental Panel on Climate Change (IPCC) conclusion that: warming of the climate is unequivocal; anthropogenic greenhouse gas emissions are extremely likely to be the cause; and that the risks associated with climate change are reduced substantially if warming is limited to less than 2 degrees Celsius above pre-industrial levels. Achieving this outcome would require complete decarbonisation of the world economy by 2100 and emission reductions of up to 70% by 2050.
Australia currently has two main climate change public policy mechanisms. The first is a ‘Direct Action’ policy which involves the Commonwealth Government operating a reverse auction process to allocate $2.5 billion to fund emission reduction projects. The policy also incorporates ‘baselines’ for individual emitting facilities operating within Australia with the potential for penalties should those baselines be exceeded. The second policy is the 20% Renewable Energy Target (RET)4 which requires electricity retailers to fund small-scale solar PV systems and increase the proportion of large-scale renewables in the overall electricity mix.
Over 80% of electricity produced in Australia is sourced from the combustion of fossil fuels. Achieving the ‘2 degree’ outcome referenced by the IPCC will require transition to a decarbonised generation sector. This is likely to take several decades given the sheer scale of replacing the existing generation fleet with low-emissions substitute technology. Furthermore, it will require an evolution of public policy as the existing framework described above is insufficient to deliver significant cuts in emissions by mid-century.
AGL’s approach to climate change is built around the importance of stakeholder engagement. AGL is committed to engaging with all of its stakeholders in relation to the issues of climate change and reducing greenhouse gas emissions. It is important that investors, customers, employees, the communities in which we operate, the broader community, and governments are all aware of the strategic steps AGL is taking to reduce emissions.
AGL GREENHOUSE GAS POLICYAGL’s approach to greenhouse gas emissions and climate change is documented within the AGL Greenhouse Gas Policy. The policy, which was revised in April 2015, states that AGL acknowledges that Australia is moving to a carbon-constrained future and provides a framework within which AGL will structure its carbon reduction activities. It also presents a pathway for the gradual decarbonisation of the AGL generation portfolio by 2050.
The revised Greenhouse Gas Policy states that AGL will:• Continue to provide the market with safe, reliable,
affordable and sustainable energy options;
• Not build, finance or acquire new conventional coal-fired power stations in Australia (i.e. without carbon capture and storage);
• Not extend the operating life of any of its existing coal-fired power stations;
• Close, by 2050, all existing coal-fired power stations in its portfolio;
• Improve the GHG efficiency of its operations, and those over which it has influence;
• Continue to invest in new renewable and near-zero emission technologies;
• Make available innovative and cost-effective solutions for its customers, such as distributed renewable generation, battery storage, and demand management solutions;
• Incorporate a forecast of future carbon pricing into all generation capital expenditure decisions; and
• Continue to be an advocate for effective long-term government policy to reduce Australia’s emissions in a manner that is consistent with the long-term interests of consumers and investors.
The AGL Greenhouse Gas Policy provides an internal framework to align and coordinate various streams of work related to climate change and emissions reduction. At its core, AGL’s approach to emission reductions involves several key work streams: measurement; improving the efficiency of existing power stations; preparing for the decommissioning of existing power stations at the end of their operating lives; investing in new, large-scale, low-emission technologies such as wind farms and solar plants; investing in new business models to allow AGL customers to have more control of their energy usage; and engaging in the public policy debate in a constructive manner.
AGL’S APPROACH TO CLIMATE CHANGE
AGL’S APPROACH TO CLIMATE CHANGE
3
4 The official target is set as 33,000 GWh of electricity from renewable resources, which will represent approximately 20% of electricity generation.
2.

4 CARBON CONSTRAINED FUTURE
AGL’S APPROACH TO CLIMATE CHANGE
MEASUREMENT OF GREENHOUSE GAS EMISSIONSAGL uses three approaches to measure and communicate our greenhouse gas emissions. These greenhouse footprints are available in AGL’s Sustainability Report data centre, and provide a complete account of the annual greenhouse impacts from AGL’s business:
• The operational greenhouse gas footprint covers the emissions from activities and assets that AGL operates.
• The equity greenhouse gas footprint sets out AGL’s share (by percentage of investment level) of the emissions from fully or partly owned assets, regardless of who operates the asset. The equity footprint indicates to AGL shareholders the greenhouse gas impacts associated with their investment.
• The energy supply greenhouse gas footprint estimates the supply chain emissions associated with the energy which AGL sells to our customers, covering emissions resulting from the production, transportation, distribution and consumption of electricity and gas.
Much of the focus on AGL’s emissions is concentrated on the operational greenhouse gas footprint. However, assessing the risks and opportunities associated with AGL’s operations beyond power generation (i.e. retailing) requires a more comprehensive assessment of the equity and energy supply footprints5. AGL will continue to publish these footprints, in addition to reporting under the mandatory National Greenhouse and Energy Reporting Act (NGERs).
IMPROVING THE EFFICIENCY OF EXISTING POWER STATIONSAs part of the adoption of the revised AGL Greenhouse Gas Policy in April 2015, AGL recommitted to incorporating a future carbon price into all generation capital expenditure decisions.
Over the past year, AGL has also created a new role within the Group Operations team focused on identifying and implementing energy efficiency improvements at AGL’s existing large-scale thermal power stations: Bayswater; Liddell; Loy Yang and Torrens Island. These activities will become increasingly important as greenhouse gas emission externalities are priced either explicitly or implicitly in the future.
PREPARING FOR THE DECOMMISSIONING OF AGL’S EXISTING GENERATION FLEET One of the critical components of the AGL Greenhouse Gas Policy involves a commitment not to extend the operating lives of its existing power stations. In practice, this means that the Liddell power station will cease operations in 2022 with Bayswater and Loy Yang to cease operation in the 2030s and 2040s. While these dates are well into the future, they are a function of the very low-cost, relatively high efficiency nature of the plants (when compared to other assets within the market). Figure 1 shows the major power stations in New South Wales and Victoria by emissions intensity and age. The size of the ‘bubble’ represents the size of the plant (by capacity).
The carbon intensity and relative age of AGL’s generation fleet, compared to relevant peers means that AGL’s generation fleet is likely to be required to ensure system security while decarbonisation occurs.
5 For further information on the importance of accurate reporting, see: Nelson, T. Wood, E. Hunt, J. and Thurbon, C. (2011), ‘Improving Australian greenhouse gas reporting and financial analysis of carbon risk associated with investments’, Sustainability Accounting, Management and Policy Journal, Vol. 2 Issue 1, pp.147 – 157.
AGL NSW plants AGL VIC plants NSW plants VIC plants
2015
1.6
1.5
1.4
1.3
1.2
1.1
1.0
0.9
0.8
0.7
0.62020 2025 2030 2035 2040 2045 2050
Emiss
ions
Inte
nsity
(t/M
Wh)
Year in which plant turns 50
LiddellBayswater
Loy Yang A
Figure 1: Major power stations in New South Wales and Victoria
Source: Derived from data obtained from the Clean Energy Regulator
5
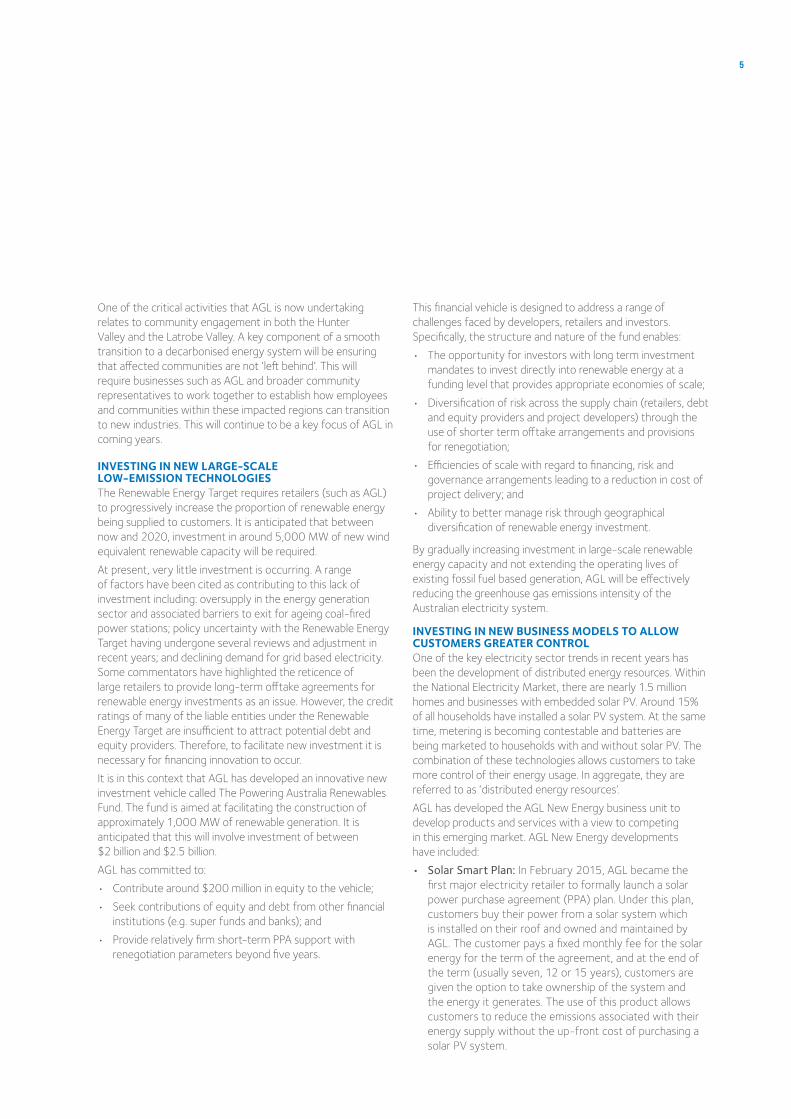
One of the critical activities that AGL is now undertaking relates to community engagement in both the Hunter Valley and the Latrobe Valley. A key component of a smooth transition to a decarbonised energy system will be ensuring that affected communities are not ‘left behind’. This will require businesses such as AGL and broader community representatives to work together to establish how employees and communities within these impacted regions can transition to new industries. This will continue to be a key focus of AGL in coming years.
INVESTING IN NEW LARGE-SCALE LOW-EMISSION TECHNOLOGIESThe Renewable Energy Target requires retailers (such as AGL) to progressively increase the proportion of renewable energy being supplied to customers. It is anticipated that between now and 2020, investment in around 5,000 MW of new wind equivalent renewable capacity will be required.
At present, very little investment is occurring. A range of factors have been cited as contributing to this lack of investment including: oversupply in the energy generation sector and associated barriers to exit for ageing coal-fired power stations; policy uncertainty with the Renewable Energy Target having undergone several reviews and adjustment in recent years; and declining demand for grid based electricity. Some commentators have highlighted the reticence of large retailers to provide long-term offtake agreements for renewable energy investments as an issue. However, the credit ratings of many of the liable entities under the Renewable Energy Target are insufficient to attract potential debt and equity providers. Therefore, to facilitate new investment it is necessary for financing innovation to occur.
It is in this context that AGL has developed an innovative new investment vehicle called The Powering Australia Renewables Fund. The fund is aimed at facilitating the construction of approximately 1,000 MW of renewable generation. It is anticipated that this will involve investment of between $2 billion and $2.5 billion.
AGL has committed to:
• Contribute around $200 million in equity to the vehicle;
• Seek contributions of equity and debt from other financial institutions (e.g. super funds and banks); and
• Provide relatively firm short-term PPA support with renegotiation parameters beyond five years.
This financial vehicle is designed to address a range of challenges faced by developers, retailers and investors. Specifically, the structure and nature of the fund enables:
• The opportunity for investors with long term investment mandates to invest directly into renewable energy at a funding level that provides appropriate economies of scale;
• Diversification of risk across the supply chain (retailers, debt and equity providers and project developers) through the use of shorter term offtake arrangements and provisions for renegotiation;
• Efficiencies of scale with regard to financing, risk and governance arrangements leading to a reduction in cost of project delivery; and
• Ability to better manage risk through geographical diversification of renewable energy investment.
By gradually increasing investment in large-scale renewable energy capacity and not extending the operating lives of existing fossil fuel based generation, AGL will be effectively reducing the greenhouse gas emissions intensity of the Australian electricity system.
INVESTING IN NEW BUSINESS MODELS TO ALLOW CUSTOMERS GREATER CONTROL One of the key electricity sector trends in recent years has been the development of distributed energy resources. Within the National Electricity Market, there are nearly 1.5 million homes and businesses with embedded solar PV. Around 15% of all households have installed a solar PV system. At the same time, metering is becoming contestable and batteries are being marketed to households with and without solar PV. The combination of these technologies allows customers to take more control of their energy usage. In aggregate, they are referred to as ‘distributed energy resources’.
AGL has developed the AGL New Energy business unit to develop products and services with a view to competing in this emerging market. AGL New Energy developments have included:
• Solar Smart Plan: In February 2015, AGL became the first major electricity retailer to formally launch a solar power purchase agreement (PPA) plan. Under this plan, customers buy their power from a solar system which is installed on their roof and owned and maintained by AGL. The customer pays a fixed monthly fee for the solar energy for the term of the agreement, and at the end of the term (usually seven, 12 or 15 years), customers are given the option to take ownership of the system and the energy it generates. The use of this product allows customers to reduce the emissions associated with their energy supply without the up-front cost of purchasing a solar PV system.

6 CARBON CONSTRAINED FUTURE
• Sunverge: In February 2016, AGL invested $20 million in Sunverge which is a US-based energy storage and management company. The investment will enhance AGL’s energy storage management capabilities and help accelerate the adoption of energy storage in the Australian market. As part of the strategic agreement, AGL is the exclusive channel partner for the sales of Sunverge’s intelligent energy storage systems in Australia.
The ‘distributed energy resources’ future is based on an integrated offering of decentralised products and services including digital metering, solar PV systems, as well as new technologies such as batteries, electric vehicles and other ‘beyond the meter’ energy solutions. The significant transformation of the energy sector is being driven in part by evolving policy, emerging technology and changing customer demands and needs. Reducing emissions is an important objective for the deployment of distributed energy resources. When combined with AGL’s plans for investment in new large-scale renewable energy and eventual cessation of the operation of existing coal-fired power plants, there is a clear direction towards a decarbonised energy system.
Advanced metering is likely to be a key technology underpinning this change as it allows customers to shift consumption from higher demand periods to lower demand periods and reduce emerging exposure to time-based or capacity based electricity pricing. Given this, AGL has developed Active Stream, a wholly-owned subsidiary of AGL Energy Limited. In June 2015 Active Stream announced it was entering the contestable digital metering market. Active Stream offers a range of digital metering products and services to retailers, distributors and other businesses including the installation and maintenance of digital metering devices (on the retailer’s behalf) and provision of metering data to the customer’s retailer, the relevant network operator and AEMO for billing and settlement.
ENGAGING IN CONSTRUCTIVE PUBLIC POLICY DEBATE The AGL Greenhouse Gas Policy states that governments should set both binding and aspirational medium and long-term emission reduction targets. AGL supports the use of both regulatory and market-based policy mechanisms to deliver the required emission reductions. Importantly, a range of policies are likely to be needed.
Governments should consider targeted policies for key industries such as electricity generation, specifically:
• Emissions standards for all new power stations;
• Regulation which drives the progressive closure of older, emissions-intensive power stations or retrofitting with CCS technology; and
• Continued incentives for renewable energy with increased scope to include all zero and near-zero emission energy sources.
Such policies would facilitate a gradual but meaningful reduction in electricity sector emissions, which comprise around one-third of the Australian total. Over time, and with meaningful electricity market reform, such policies would facilitate transition to a decarbonised energy system.
AGL is committed to engaging with all stakeholders in relation to the development of public policy options for addressing climate change. AGL submissions made to public policy processes can be sourced from the AGL blog (www.aglblog.com.au). Further information in relation to how AGL engages with stakeholders on broader issues of public policy is published in AGL’s Sustainability Report (Public Policy Engagement and Stakeholder Engagement sections). This disclosure explains where AGL funds external bodies that advocate on issues related to climate change policy and examines the consistency of their policies with AGL's positions.
AGL economists have continued to publish research in recent years related to the impacts of climate change policy on the electricity sector. Highlights from the past three years include: ‘Climate and electricity policy integration: Is the South Australian electricity market the canary in the coalmine?’; ‘Australian climate change policy: where to from here?’; and ‘Energy-only markets and renewable energy targets: Complementary policy or policy collision?’. AGL has also participated in an Australian Research Council (ARC) project related to computable general equilibrium (CGE) modelling of climate change with the University of New England (UNE). The purpose of this activity is to transparently provide information and insights to policy makers.
In 2015, AGL was a signatory to a public statement supporting the efforts of the Commonwealth Government to secure an international agreement ahead of the Conference of the Parties meeting in Paris. The statement was facilitated by The Climate Institute and also signed by leading Australian and international organisations including BHP Billiton, Westpac, GE, Mirvac, Santos, Unilever and Wesfarmers.
AGL’S APPROACH TO CLIMATE CHANGE
7
In 1850, annual anthropogenic global carbon dioxide emissions were around 2 gigatonnes (Gt). Since that time, there has been a steady growth in emissions associated with global industrialisation. In 2013, global carbon dioxide emissions were approximately 37Gt. From all sources, global anthropogenic emissions are around 50 Gt each year. This increase in emissions has resulted in a significant rise in the concentration of greenhouse gases in the atmosphere from approximately 280 parts per million (ppm) in 1850 to around 400 ppm today – the highest level in at least 800,000 years. The IPCC has stated that this is, ‘..extremely likely to have been the dominant cause of the observed warming since the mid-20th century’. Between the late 1800s and today, average combined land and ocean surface temperatures increased by 0.85 degrees Celsius. To summarise simply, ‘human influence on the climate system is clear’.
The IPCC estimates that in the absence of greenhouse mitigation policies, global mean surface temperatures are likely to be between 2.5°C and 7.8°C greater than pre-industrial levels by 2100. To limit temperature increases to less than 2°C, it is likely that concentrations of greenhouse gases in the atmosphere need to be limited to 450 ppm or lower. Such a limit would require reductions in global anthropogenic emissions of between 40% and 70% by 2050 and complete decarbonisation of the world economy by 2100.
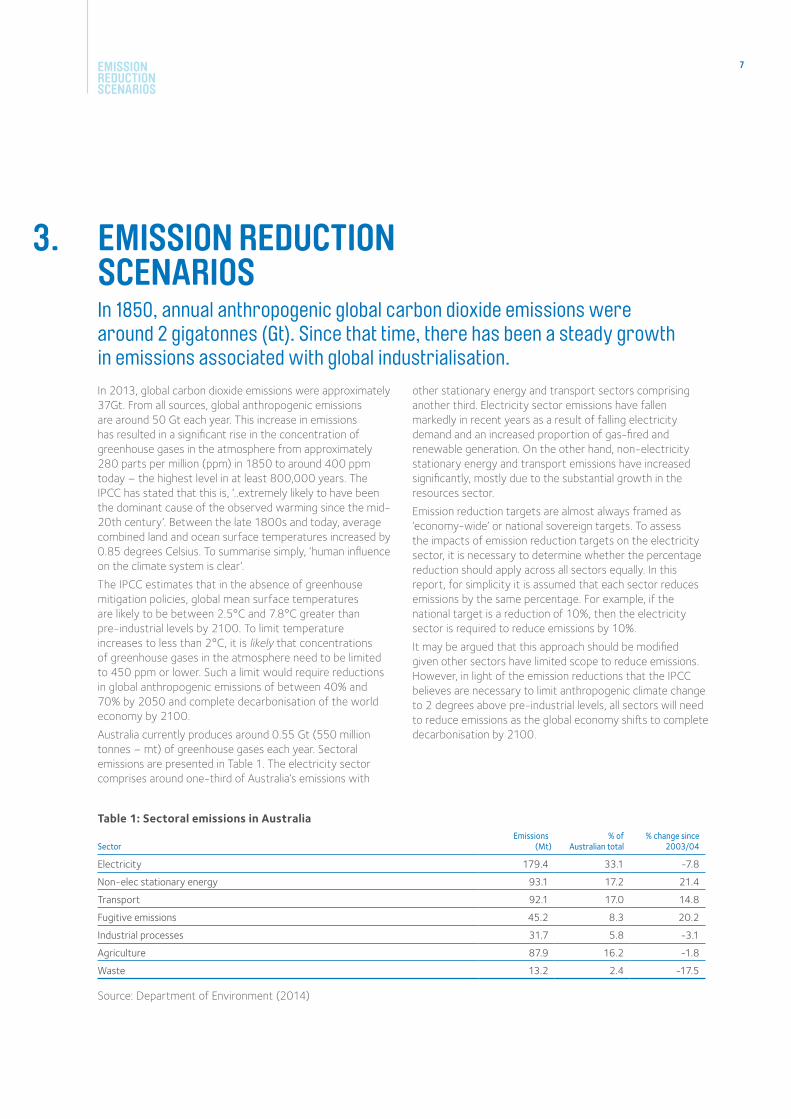
Australia currently produces around 0.55 Gt (550 million tonnes – mt) of greenhouse gases each year. Sectoral emissions are presented in Table 1. The electricity sector comprises around one-third of Australia’s emissions with
other stationary energy and transport sectors comprising another third. Electricity sector emissions have fallen markedly in recent years as a result of falling electricity demand and an increased proportion of gas-fired and renewable generation. On the other hand, non-electricity stationary energy and transport emissions have increased significantly, mostly due to the substantial growth in the resources sector.
Emission reduction targets are almost always framed as ‘economy-wide’ or national sovereign targets. To assess the impacts of emission reduction targets on the electricity sector, it is necessary to determine whether the percentage reduction should apply across all sectors equally. In this report, for simplicity it is assumed that each sector reduces emissions by the same percentage. For example, if the national target is a reduction of 10%, then the electricity sector is required to reduce emissions by 10%.
It may be argued that this approach should be modified given other sectors have limited scope to reduce emissions. However, in light of the emission reductions that the IPCC believes are necessary to limit anthropogenic climate change to 2 degrees above pre-industrial levels, all sectors will need to reduce emissions as the global economy shifts to complete decarbonisation by 2100.
EMISSION REDUCTION SCENARIOS
EMISSION REDUCTION SCENARIOS
Table 1: Sectoral emissions in Australia
SectorEmissions
(Mt)% of
Australian total% change since
2003/04
Electricity 179.4 33.1 -7.8
Non-elec stationary energy 93.1 17.2 21.4
Transport 92.1 17.0 14.8
Fugitive emissions 45.2 8.3 20.2
Industrial processes 31.7 5.8 -3.1
Agriculture 87.9 16.2 -1.8
Waste 13.2 2.4 -17.5
Source: Department of Environment (2014)
3.

8
SCENARIO 1 – CURRENT GOVERNMENT POLICYScenario 1 has been developed to reflect the existing Commonwealth Government commitment made through the Intended Nationally Determined Contributions (INDC) process during 2015. This commitment is to reduce emissions by 26-28% of 2005 levels by 2030. In many ways this is seen as the ‘minimum’ emission reduction that is likely to apply in Australia given the agreement reached in Paris in December 2015 at the 21st Conference of the Parties (COP21) entrenches a ‘ratchet mechanism’. This mechanism imposes an expectation that emission reduction targets will strengthen over time.
Table 2: Scenario 1 – current government policy
ParameterEmissions
(Mt)
2005 Australian electricity sector emissions 195
2005 National Electricity Market emissions6 175
Target in 2030 (27% less than 2005) 128
Table 2 outlines the key parameters for establishing a National Electricity Market target for 2030. As AGL only operates in the National Electricity Market, it is necessary to pro-rata emission reductions between this and other markets (e.g. the South-West Interconnected System in Western Australia). Using this pro-rata methodology yields an emission reduction target of 128 mt in 2030. To give effect to this target, the scenario utilises annual linear reductions in emissions that give effect to a 26-28% reduction by 2030, relative to 2005 levels. Emission reduction targets are not applied until 2020 to reflect the current policy environment.
SCENARIO 2 – ‘2 DEGREE’ CARBON BUDGETBased upon evidence published by the IPCC, the total global ‘carbon budget’7 that could be emitted between 2000 and 2050 with a view to maintaining a 67 percent chance of limiting global warming to 2 degrees Celsius is estimated at approximately 1,700 Gt of greenhouse gases. In other words, by limiting emissions to this level, there is a reasonable chance that global temperature
increases can be limited to less than 2 degrees Celsius. It is extremely difficult to envisage how a global limitation on emissions would be distributed among individual sovereign nations. Methodologies have been established that would allocate the global budget to individual nations based upon population, economic strength and historical emissions. Ultimately, deriving a carbon budget for Australia is ‘subjective’ and is likely to be disputed by individuals as either too high or too low.
Accordingly, this report utilises expert advice from the Climate Change Authority. In 2013, the Climate Change Authority stated8:
‘The Authority proposes a ‘modified contraction and convergence’ approach to calculating Australia’s fair share of the global emissions budget. The approach is equitable and feasible. It involves a gradual convergence to equal-per-person emissions rights in the future. As a share of the global emissions budget, this implies a national budget of 10.1 Gt CO2-e for the period 2013 to 2050. This is about 17 years of emissions at current levels and can be met through a mix of domestic and international emissions reductions.’
Adopting a 10.1 Gt or 10,100 Mt overarching carbon budget for Australia for the period 2013 to 2050, it is possible to derive an emissions reduction trajectory for Australia and then subsequently the electricity sector and the National Electricity Market. This is outlined in Table 3.
Table 3: Scenario 2 – ‘2 degree’ carbon budget
ParameterEmissions
(Mt)
Australian carbon budget (2013-2050) 10,100
Electricity sector share of budget9 3,363
National Electricity Market budget10 3,026
The annual reduction in emissions has been derived linearly from 2020 to reflect the current policy environment. Between 2020 and 2050, emissions are reduced by approximately 7 percent per annum which results in the sector being effectively decarbonised by 2050.
6 The National Electricity Market’s emissions are approximately 90% of total Australian electricity sector emissions.7 A ‘carbon budget’ is essentially a quantity of greenhouse gas emissions that can be emitted.8 See http://www.climatechangeauthority.gov.au/reviews/targets-and-progress-review/part-c for further information.9 As the electricity sector comprises around one-third of emissions, one-third of the national budget has been allocated to the electricity sector.10 The National Electricity Market’s emissions are approximately 90% of total Australian electricity sector emissions.
CARBON CONSTRAINED FUTURE
EMISSION REDUCTION SCENARIOS

9
The emission reduction scenarios outlined in Section 3 have been modelled within the National Electricity Market using PLEXOS11 modelling software. The model effectively replicates decision making within the market. Existing generation facilities are ‘dispatched’ to meet given levels of demand. Over time, new generation capacity can be ‘built’ within the model. Importantly, the capital costs of new generation facilities are included but existing generators incur only short-run fuel and operating costs. The objective of the model is to minimise costs while meeting imposed constraints such as greenhouse gas emission profiles. The model effectively optimises the replacement of higher-cost, more emissions intensive power stations with low emissions generation capacity.
Key assumptions made in the model include:
• Supply must equal demand at all demand points. This ensures ‘blackouts’ do not occur;
• The minimum reserve requirement must be met in each region;
• New generation cannot be installed instantaneously. As generation takes several years to build, the model requires a commitment to build the generator some years before it can ‘generate’;
• The current Renewable Energy Target is met through required build of renewable assets (predominantly wind) for all scenarios;
• Emission reduction targets do not apply until 2020 and beyond. This has been adopted to reflect the existing policy landscape;
• Generation capacity is added in realistic increments. For example, individual 1 MW wind turbines are not built to meet incremental emission reduction requirements. This results in ‘lumpy’ capital investment, which is a key characteristic of energy markets;
• Electricity demand forecasts are derived from the Australian Energy Market Operator (AEMO) official forecasts;
• New entrant cost assumptions are derived from publicly available data sources such as the Australian Energy Technology Assessment and the Australian Power Generation Technology Report; and
• The model produces results for the period to 2030. While it is possible to run scenario modelling beyond this timeframe, there are limitations to the validity of the results given the inherent uncertainties of periods so far into the future.
Three scenarios have been modelled. The first is a ‘no carbon reductions’ scenario to allow a contrast to be drawn between the two emission reductions scenarios developed in Section 3. The two emission reduction scenarios are shown in Figure 2. Note that the 26-28% scenario involves a ‘steeper’ reduction beyond 2030 with a view to making the scenario consistent with a ‘2 degree’ budget beyond 2030.
Figure 2: Emission reduction scenarios
Scenario 1 – 26–28% Scenario 2 – '2 degree'
2015 2016 2017 2018 2019 2020 2021 2022 2023 2024 2025 2026 2027 2028 2029 2030
NEM
Em
issio
ns (
kt)
20,000
40,000
60,000
80,000
100,000
120,000
140,000
160,000
180,000
MODELLING APPROACH AND RESULTS
MODELLING APPROACH AND RESULTS
11 For further information on PLEXOS modelling, see: http://energyexemplar.com/software/plexos-desktop-edition/
4.
1 0
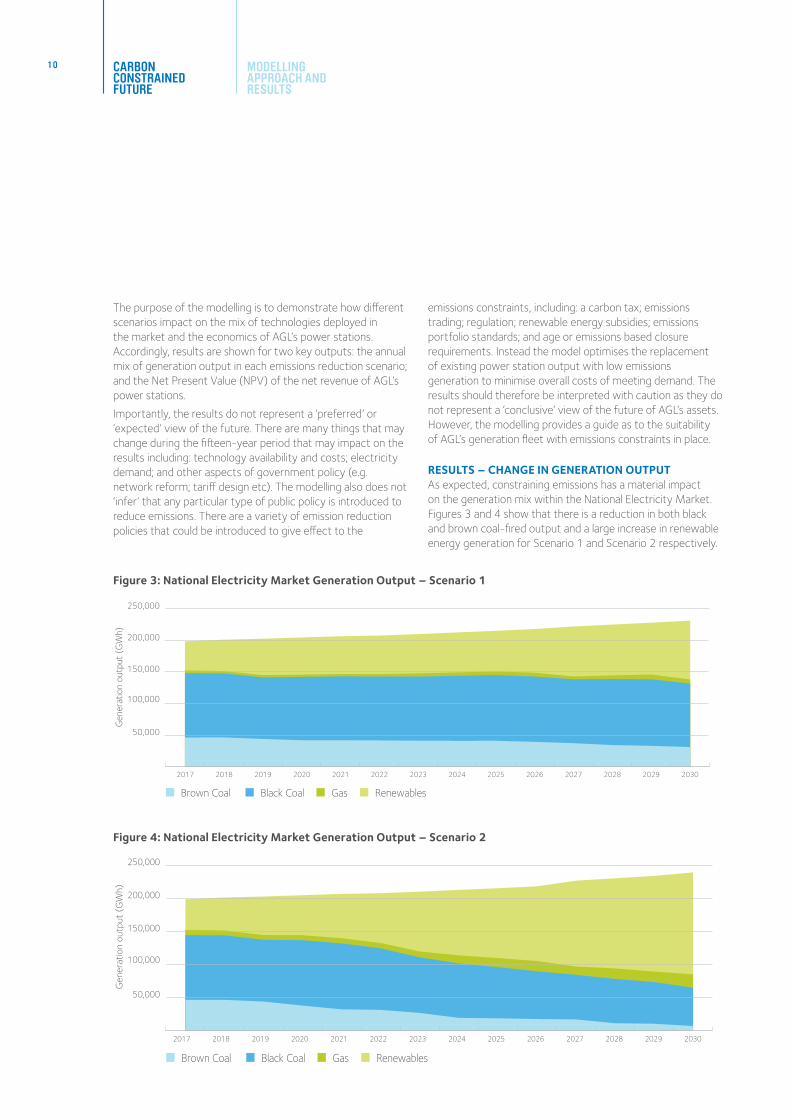
The purpose of the modelling is to demonstrate how different scenarios impact on the mix of technologies deployed in the market and the economics of AGL’s power stations. Accordingly, results are shown for two key outputs: the annual mix of generation output in each emissions reduction scenario; and the Net Present Value (NPV) of the net revenue of AGL’s power stations.
Importantly, the results do not represent a ‘preferred’ or ‘expected’ view of the future. There are many things that may change during the fifteen-year period that may impact on the results including: technology availability and costs; electricity demand; and other aspects of government policy (e.g. network reform; tariff design etc). The modelling also does not ‘infer’ that any particular type of public policy is introduced to reduce emissions. There are a variety of emission reduction policies that could be introduced to give effect to the
emissions constraints, including: a carbon tax; emissions trading; regulation; renewable energy subsidies; emissions portfolio standards; and age or emissions based closure requirements. Instead the model optimises the replacement of existing power station output with low emissions generation to minimise overall costs of meeting demand. The results should therefore be interpreted with caution as they do not represent a ‘conclusive’ view of the future of AGL’s assets. However, the modelling provides a guide as to the suitability of AGL’s generation fleet with emissions constraints in place.
RESULTS – CHANGE IN GENERATION OUTPUTAs expected, constraining emissions has a material impact on the generation mix within the National Electricity Market. Figures 3 and 4 show that there is a reduction in both black and brown coal-fired output and a large increase in renewable energy generation for Scenario 1 and Scenario 2 respectively.
Figure 3: National Electricity Market Generation Output – Scenario 1
2017 2018 2019 2020 2021 2022 2023 2024 2025 2026 2027 2028 2029 2030
Gen
erat
ion
outp
ut (
GW
h)
Brown Coal Black Coal Gas Renewables
50,000
100,000
150,000
200,000
250,000
Figure 4: National Electricity Market Generation Output – Scenario 2
2017 2018 2019 2020 2021 2022 2023 2024 2025 2026 2027 2028 2029 2030
Gen
erat
ion
outp
ut (
GW
h)
Brown Coal Black Coal Gas Renewables
50,000
100,000
150,000
200,000
250,000
CARBON CONSTRAINED FUTURE
MODELLING APPROACH AND RESULTS

1 1
In both Scenarios 1 and 2, there is limited uptake of gas-fired generation. This reflects both the cost of gas and the amortised capital costs of combined-cycle units relative to the emission profile of such plant, compared to the more significant reductions required by 2030. However, with such significant uptake of renewable energy, there are limitations to the ‘ramping’ capabilities of existing coal-fired generators. To overcome these limitations, grid-based energy storage is used to complement intermittent renewables, particularly in Scenario 2. This has particular implications for the design of the wholesale electricity market which are discussed in the Policy Implications sub-section below.
The results show that different regions will be impacted in different ways if emissions are reduced in a ‘least cost’ manner. There is a much greater impact on brown coal-fired generation than black coal-fired generation in Scenario 2. In reality, it may be that policy makers adopt a different approach and reduce emissions proportionally in each jurisdiction to ensure that no one region is disproportionately impacted due to a focus on ‘least cost’ emission reductions.
RESULTS – NPV ANALYSIS OF ECONOMICS OF AGL POWER STATIONS12
The aggregate Net Present Value (NPV) of AGL’s power stations is calculated utilising the net present value of annual economic revenues minus annual economic costs. The term ‘economic’ is used purposefully in the sense that the revenues do not necessarily reflect real-world ‘prices’ that generators receive for their output. Revenues are instead based upon marginal cost bidding behaviour within the model and do not reflect game theoretical behaviour and energy portfolio management optimisation, among other things. As such, caution should be exercised in comparing these results to financial analyses of AGL’s power station operations. That said, the difference in NPV between the scenarios is instructive for assessing the impacts of emission reduction policies on AGL's generation activities.
Figure 5 shows the results of the NPV calculations across the three scenarios modelled. The ‘Base NPV’ represents the minimum value that would accrue to AGL power stations, based upon the least cost modelling results. In effect, the marginal cost of emissions (an output of the model) has been ascribed to each power station based upon its own emissions. This additional cost has been subtracted from the total NPV to derive an estimate of the minimum value accruing to AGL power stations in a policy environment where all carbon costs are internalised and based only upon the marginal cost of abatement in the National Electricity Market. In Scenario 1, the Base NPV value is approximately 5% lower than the
‘No Carbon Constraint’ scenario. The Base NPV value in Scenario 2 is approximately 25% lower than the ‘No Carbon Constraint’ scenario.
Figure 5: NPV Analysis of Emission Reduction Scenarios
No carbon constraint
Scenario 1$0
$1
$2
$3
$4
$5
NPV
(bn
)
Scenario 2
Potential additional value (depending upon policy)
Base NPV
The ‘Potential Additional Value’ represents the potential further value to AGL power stations in an environment where the marginal cost of emissions is either lower or not fully internalised. This may occur in a policy environment where the marginal cost of emissions is set by other parts of the economy or through internationally linked carbon pricing; or carbon pricing is not explicitly utilised and a combination of other measures is used instead, such as regulation, minimum performance standards and renewable energy targets. In such an environment, there is very little difference to the NPV accruing to AGL’s power station portfolio across all three scenarios.
POLICY IMPLICATIONSThe NPV results show that the way in which public policy is implemented to achieve a given emissions reduction constraint has an impact on the value to AGL’s generation portfolio. There are arguments for and against the use of different instruments to reduce emissions.
However, it is worth noting that for carbon pricing to be utilised effectively to drive emissions reductions within the electricity sector, it would result in materially higher wholesale electricity prices given the interaction between existing wholesale market design and a carbon price.
12 AGL’s thermal power stations are: Bayswater; Liddell; Loy Yang A; Torrens Island; Somerton. The analysis also includes AGL’s renewable assets such as wind farms; hydro assets; and solar projects. Further information on AGL’s power station fleet can be found in the Sustainability Report data centre.

1 2 CARBON CONSTRAINED FUTURE
Figure 6 shows that the carbon price required to displace a new coal-fired power station with a new wind farm is likely to be around $40/tonne. However, given the sunk-cost nature of existing coal-fired generators, the carbon price required to displace an existing coal-fired power station with a new wind farm is likely to be higher than $100/tonne. Given recent political history, it is unlikely to be acceptable to rely upon a carbon price at such a level to drive capital substitution within the electricity industry. A lower, potentially internationally linked carbon price may be more acceptable but would not be high enough to drive emission reductions within the electricity sector.Therefore, it is possible that policy makers will gravitate towards other policy levers to drive the potential change highlighted by the modelling results in this report. This could include: regulation; emissions performance standards; renewable energy portfolio standards; and emissions or aged-based closure requirements for existing coal-fired generation facilities. Such policies may be better placed to reduce emissions in an oversupplied generation market – with orderly, rather than disorderly, entry and exit by individual generators another priority to ensure security of supply is maintained13. Ultimately it is difficult to predict which policy levers will be used and therefore the information presented in this report should be assessed with such uncertainty in mind.
Policy makers will also need to consider whether an energy-only market is suitable for facilitating the types of emission reductions modelled in this report. At present, the National Electricity Market operates as an ‘energy-only’ market where only energy is valued and capacity is not. In theory, where available capacity exceeds demand, prices are generally reflective of the SRMC of the marginal generator required to meet demand. However, where demand is met with
the highest-cost final marginal unit, prices exceed SRMC outcomes, thereby allowing generators to recover their heavy fixed costs. This also facilitates new investment by providing pricing signals for additional capacity requirements. Where over-investment occurs, prices do not allow for the recovery of fixed costs preventing further over-investment occurring.
In other words, price volatility is the way in which ‘energy-only’ markets provide sufficient revenues for an ‘optimal’ generation mix given a level of electricity demand. In the emission reduction scenarios modelled in this report, real-world volatility would need to become extreme to ensure capital costs of complementary thermal generation (e.g. open-cycle gas turbines) or battery storage technologies can be recovered with such high levels of renewable generation. A recent study found that the National Electricity Market would require a market price cap of between $60,000 and $80,000 per MWh for revenue adequacy if the system was supplied by 100% renewable energy. This is between four and six times greater than the current market price cap.14
It is questionable whether such high levels of volatility are consistent with real-world community expectations. The use of an ‘energy-only’ market, while pursuing high proportions of renewable energy to reduce emissions, is likely to be unacceptable to generation financiers and retailers; customers; and governments. Given the high known fixed-cost nature of renewable energy and complementary energy storage, pricing based upon short-run costs seems impractical over the long-term. Under these conditions it is uncertain how new renewable capacity could be successfully financed because intermittent generators are generally unable to sell forward contracts (which provide some revenue certainty) and high market pricing events may coincide with low rather than high output from intermittent renewables.
13 See: Jotzo, F. and Mazouz, S. (2015), ‘Brown coal exit: A market mechanism for regulated closure of highly emissions intensive power stations’, Economic Analysis and Policy, Vol. 48, pp. 71-81; and Nelson, T. Reid, C. and McNeill, J. (2015), ‘Energy-only markets and renewable energy targets: Complementary policy or policy collision?’, Economic Analysis and Policy, Vol. 46, pp. 25-42.
14 See Riesz, J. Gilmore, J. and MacGill, I. (2016), ‘Assessing the viability of energy-only markets with 100% renewables: an Australian National Electricity Market case study’, Economics of Energy and Environmental Policy, Vol. 5, No. 1, pp. 105-130.
MODELLING APPROACH AND RESULTS
Black coal Wind Existing coal
0 5 10 15 20 25 30 35 40 45 50 55 60 65 70 75 80 85 90 95 100 105 110 115 120 125 130 135
LRM
C/S
RMC
($/M
Wh)
Carbon price ($/tonne)
20
40
60
80
100
120
140
160
180
Carbon price required to displace new coal with new wind
Carbon price required to displace old coal with new wind
Figure 6: Economics of carbon pricing

5.
1 3
In 2015, Australia established a 26-28% emissions reduction target for 2030 relative to 2005 levels as part of the INDC component of the historic agreement reached at COP21. Given the agreement also involved a ‘ratcheting mechanism’ and references to limiting anthropogenic climate change to 2 degrees Celsius above pre-industrial levels, it is reasonable to conclude that the Australian electricity sector is likely to face significant emission reduction targets over the coming decades.As one of Australia’s largest electricity retailers, the biggest electricity generator in the National Electricity Market and the largest privately owned operator of large-scale renewable energy, AGL faces both risks and opportunities associated with emission reduction activities. AGL has provided a comprehensive framework for its consideration of climate change related issues through the AGL Greenhouse Gas Policy. The policy has resulted in AGL ruling out further investments in conventional coal-fired power stations in Australia and provided a pathway for decommissioning existing assets at the end of their operational lives.
AGL is positioning its business to capture value from a decarbonised future. The development of the Powering Australian Renewables Fund will allow AGL to further develop its pipeline of large-scale renewable assets and contribute much needed financing innovation to the broader renewable energy sector. By establishing an AGL New Energy business, AGL is positioning itself for a distributed energy resources future where digital metering; embedded solar generation and storage; and in-home energy management facilitates greater consumer control and associated reduced greenhouse gas emissions.
This report has provided results for detailed economic modelling of emission reduction scenarios within the National Electricity Market. Achieving significant cuts in emissions will require substantial new investment in renewable energy capacity and the gradual cessation of operations by existing thermal generators. This will take decades but AGL is committed to working with both its people and broader impacted communities with a view to developing new industries and opportunities.
The modelling shows that AGL’s power stations are likely to maintain much of their value in the shift to a carbon constrained world due to their relative low-cost and high efficiency. While the modelling is subject to significant uncertainty given the decadal timeframes involved, it is instructive for demonstrating the robustness of AGL’s assets across a range of potential outcomes. Ultimately, the type of policy utilised to give effect to the emission reductions modelled will have a material impact on AGL. A shift away from ‘energy-only’ electricity markets and the use of non-carbon pricing emissions reduction policies seems possible given the modelling results.
Climate change presents both risks and opportunities for AGL and its customers, shareholders, employees and communities. AGL will continue to provide regular information on its emissions and business activities related to climate change mitigation, and will continue to make transparent contributions to the public policy debate. Engagement with stakeholders is a critical component of AGL’s approach to climate change and this report represents an important part of this broader engagement.
CONCLUSION