Embed Size (px)
Citation preview

AG
IR W
ork
sh
op
March 10 2005Brussels
Can we afford to live longer in better health?
Alternative scenarios for health, life expectancy and social expenditure
Ed WesterhoutCPB, the Netherlands

AG
IR W
ork
sh
op
March 10 2005Brussels
Ageing and AGIR
Ageing:► low fertility, increasing life expectancy, retiring of
baby-boom generations► demographic shift in the coming decades► public institutions, in particular in the field of health
care and pensions, financed on a PAYG basis► problem of fiscal sustainability
AGIR:► what gains to expect in lifetime expectancy?► will the health status of people further improve?► issues important for future of pensions, health care,
labour markets, market for informal care

AG
IR W
ork
sh
op
March 10 2005Brussels
WP4 AGIR-project
CPB’s WP4:► analysis of ageing on
– expenditure on acute health care– expenditure on long-term care– expenditure on (first-pillar) pensions– tax revenues– sustainability of public finances
Special emphasis on four items:► death-related costs► living longer (increasing life expectancy)► in better health (improvements in health)► role of these factors relative to other factors

AG
IR W
ork
sh
op
March 10 2005Brussels
Death-related costs
High medical spending in last year(s) of life:► Roos et al. (1987), Lubitz and Riley (1993), Zweifel
et al. (1999), Cutler and Meara (1999), McGrail et al. (2000), Hogan et al. (2001), Batljan and Lagergren (2004)
Share of death-related costs in medical costs stable over time:► Lubitz and Riley (1993), Hogan et al. (2001)
Death-related costs decline with age…► Roos et al. (1987), Spillman and Lubitz (2000)
…or rise with age:► Levinsky et al. (2001), Serup Hansen et al. (2002)

AG
IR W
ork
sh
op
March 10 2005Brussels
Life expectancy, medical conditions
No biological limit to life expectancy?:► White (2002) shows steady increase in life
expectancy, WP1 AGIR► Vaupel (1998) shows huge life expectancy
improvements for the elderly and (to a somewhat lesser extent) for females
Medical conditions have improved in the past:► Jacobzone et al. (2000), Cutler (2001, 2003)► Due to obesity, the future does not necessarily
extrapolate the past: Sturm (2002), Sturm et al. (2004), Thorpe et al. (2004)

AG
IR W
ork
sh
op
March 10 2005Brussels
Four scenarios
LivingLonger (LL)
Living LongerIn Better Health (LLIBH)
Improvementin health
Base Casescenario (BC)
Idem, without death-related costs (BCW)
Living InBetter Health(LIBH)
No healthimprovement
Strong increase in life expectancy
Moderate increase in life expectancy

AG
IR W
ork
sh
op
March 10 2005Brussels
Structure of the model
demographic block health care expenditure profile split relation between health status and labour market
participation/expenditure on social security relation between health status and health
expenditure sustainability of public finances

AG
IR W
ork
sh
op
March 10 2005Brussels
Health care expenditure (age) profiles
0
10000
20000
30000
0 10 20 30 40 50 60 70 80 90Age
H
L
U
T
D

AG
IR W
ork
sh
op
March 10 2005Brussels
Health status of the population
Impact upon medical expenditure:► Lubitz et al. (2003), WP2 AGIR
Impact upon labour market participation (through retirement decision):► Kerkhofs et al. (1999), Börsch-Supan (2000),
McGarry (2004), WP3 AGIR
Closure of the model:► Expenditure on social security, revenues from (direct
and indirect) taxation, sustainability gap
Calculations for 15 EU-countries and their (BBP-weighted) average

AG
IR W
ork
sh
op
March 10 2005Brussels
Base Case scenario: expenditure as % of GDP (EU-average)
0%
2%
4%
6%
8%
10%
12%
14%
16%
2001 2008 2015 2022 2029 2036 2043 2050
LTC_BC
AHC_BC
P_BC
HC_BC

AG
IR W
ork
sh
op
March 10 2005Brussels
Impact of death-related costs(EU-average)
Acute Health Care
Expenditure
Long-Term Care
Expenditure
Sustainability Gap
Base Case scenario (BC)
1,8 0,9 3,3
Base Case scenario with flat age profile of death-related costs
1,9 1,0 3,4
Base Case scenario without death-related costs (BCW)
2,1 1,0 3,5

AG
IR W
ork
sh
op
March 10 2005Brussels
Living Longer scenario: expenditure as % of GDP (EU-average)
4%
6%
8%
10%
12%
14%
16%
2001 2008 2015 2022 2029 2036 2043 2050
HC_LL
HC_BC
P_BC
P_LL

AG
IR W
ork
sh
op
March 10 2005Brussels
Living In Better Health scenario:expenditure as % of GDP (EU-average)
4%
6%
8%
10%
12%
14%
16%
2001 2008 2015 2022 2029 2036 2043 2050
P_LIBH
P_BC
HC_LIBH
HC_BC
AG
IR W
ork
sh
op
March 10 2005Brussels
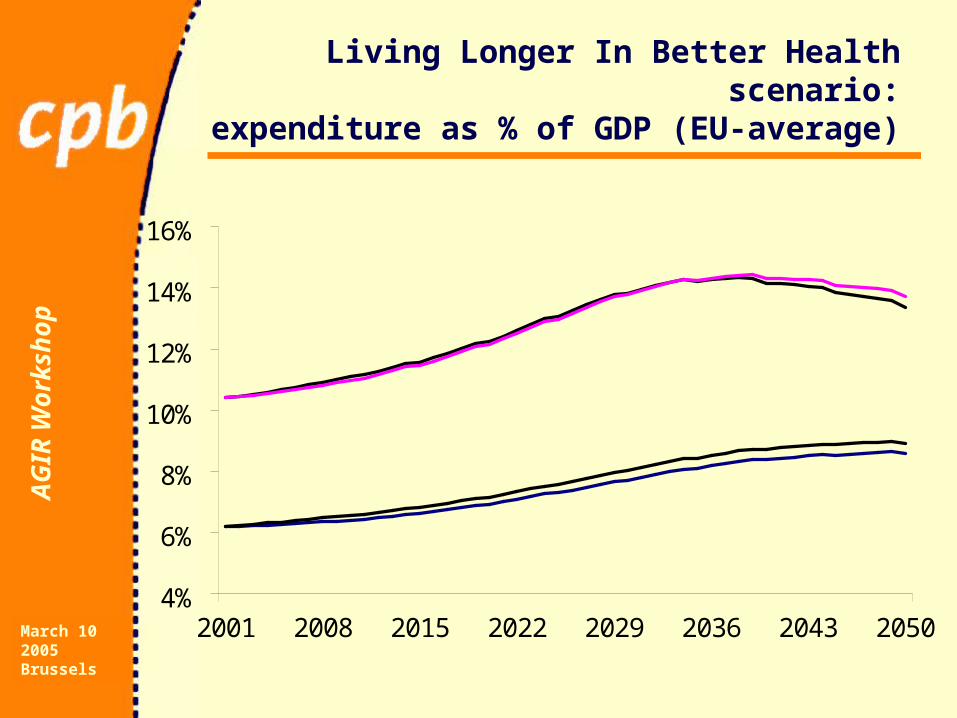
Living Longer In Better Health scenario:expenditure as % of GDP (EU-average)
4%
6%
8%
10%
12%
14%
16%
2001 2008 2015 2022 2029 2036 2043 2050
HC_LLIBH
P_BC
P_LLIBH
HC_LLIBHHC_LLIBH
HC_BC

AG
IR W
ork
sh
op
March 10 2005Brussels
Four scenarios: Overview
BC BCW LL LIBH LLIBH
Health care expenditure 2,7 3,1 3,4 1,8 2,4
- Acute health care expenditure 1,8 2,1 2,2 1,1 1,4
- Long-term care expenditure 0,9 1,0 1,2 0,7 1,0
Pension expenditure 3,1 3,1 4,4 2,2 3,5
Total primary expenditure 5,8 6,2 7,8 4,0 5,9
Sustainability gap 3,3 3,5 4,3 2,5 3,4

AG
IR W
ork
sh
op
March 10 2005Brussels
Fiscal sustainability:public debt as % of GDP (EU- average)
0%
50%
100%
150%
200%
250%
300%
350%
2004 2011 2018 2025 2032 2039 2046
LIBH
LLIBHBC
LL

AG
IR W
ork
sh
op
March 10 2005Brussels
Sensitivity tests
Effect of ageing on the interest rate and the rate of productivity growth
Effect of a higher income elasticity of health care expenditure
Effect of higher labour market participation

AG
IR W
ork
sh
op
March 10 2005Brussels
Assumptions in the base case scenario
Annual rate of labour productivity growth 1.75%
Real interest rate 3.75%
Income elasticity equal to one

AG
IR W
ork
sh
op
March 10 2005Brussels
Effect of ageing on the interest rate and the rate
of productivity growth
INGENUE study ► Interest rate -0.5%► Rate of productivity growth -0.7%
CPB Four Futures study (Regional communities scenario)
► Interest rate -1%► Rate of productivity growth -0.75%

AG
IR W
ork
sh
op
March 10 2005Brussels
Health care expenditure,labour market participation
A lot of uncertainties surround prediction of health care expenditure growth► Income elasticity may exceed one (Newhouse
(1977), Gerdtham and Jönsson (2000))► Medical-technological progress (Acemoglu and Linn
(2003), Westerhout (2004))
Alternative scenario on health care expenditure► 0.15% higher income elasticity of health care
expenditure
Alternative scenario on labour market participation ► 5% increase in the rate of labour market participation
AG
IR W
ork
sh
op
March 10 2005Brussels
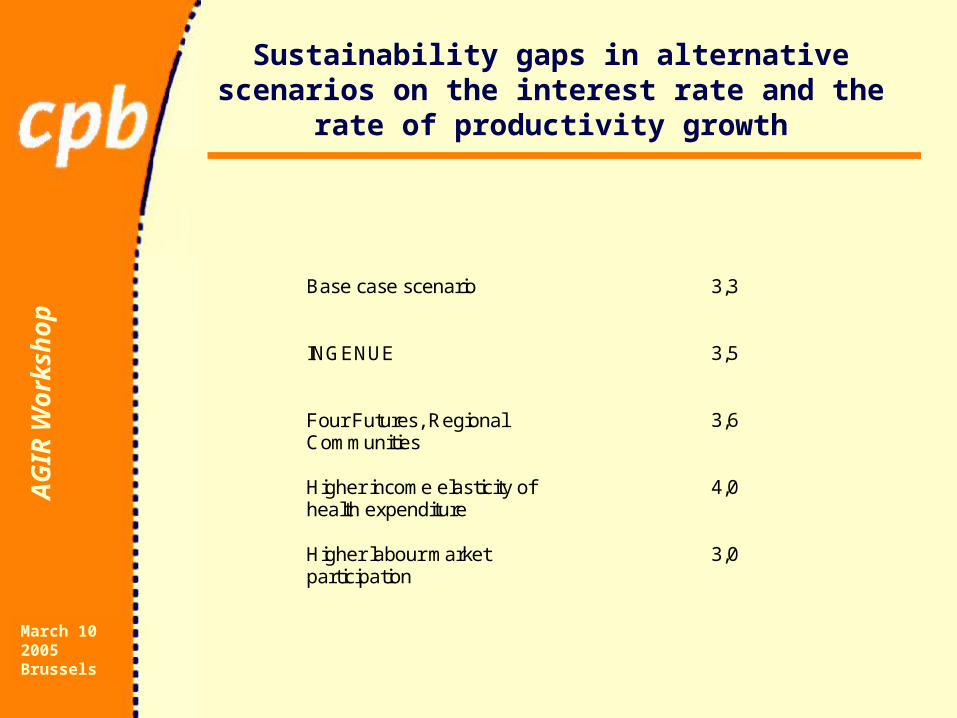
Sustainability gaps in alternative scenarios on the interest rate and the rate of productivity growth
Base case scenario
3,3
INGENUE
3,5
Four Futures, Regional Communities
3,6
Higher income elasticity of health expenditure
4,0
Higher labour market participation
3,0

AG
IR W
ork
sh
op
March 10 2005Brussels
Conclusions
Living longer in better health will not alleviate the fiscal problems in the EU area. But:► it changes the composition of public expenditure:
– pension expenditure will increase faster than health care expenditure
► the uncertainties are large:– if substantial improvements in health status fail to
come, further increases in life expectancy become a threat
The effect of life expectancy and health status on fiscal sustainability:► outweighs the effects of interest rate and productivity
growth