Embed Size (px)
Citation preview
Journal of Personality and Social Psychology Copyright 1989 by the American Psychological Association, Inc. 1989, Vol. 57, No. 3, 416--425 0022-3514/89/$00.75
Aging and Susceptibility to Attitude Change
Jon A. Krosnick Duane E Alwin Ohio State University University of Michigan
Two hypotheses about the relation between age and susceptibility to attitude change were tested. The impressionable years hypothesis proposes that individuals are highly susceptible to attitude change during late adolescence and early adulthood and that susceptibility drops precipitously immediately thereafter and remains low throughout the rest of the life cycle. The increasing persistence hypothesis proposes that people become gradually more resistant to change throughout their lives. Structural equation models were applied to data from the 1956-1960, 1972-1976, and 1980 National Election Panel Studies in order to estimate the stability of political attitudes and unreliability in measures of them. The results support the impressionable years hypothesis and disconfirm the increasing persistence hypothesis. A decrease in the over-time consistency of attitude reports among 66- to 83- year-olds was found to be due to increased random measurement error in their reports, not to in- creased attitude change.
A great deal of research has explored individual difference variables that determine the susceptibility of attitudes to change. For example, recent meta-analyses have shown that women are more easily influenced than men under certain cir- cumstances (Cooper, 1979; Eagly & Carli, 1981). Other re- search has found relations between personality and resistance to attitude change (Hovland & Janis, 1959; Newcomb, 1943). And still other research indicates that attitudes that are more central or important to individuals are more resistant to change than are noncentral or unimportant attitudes (Krosnick, 1988).
In this article, we explore another possible determinant: age. It is widely believed that susceptibility to attitude change varies as people progress through the life cycle. Two principal hypoth- eses have been proposed, both of which assert that susceptibility to attitude change is greatest during adolescence and early adulthood and decreases thereafter. In this article, we evaluate these hypotheses in two studies of political attitudes. We begin by describing the two hypotheses and highlighting the short- comings of the limited existing evidence testing them. We then report new evidence, using improved data and analytic methods.
This research was supported by Grant 2-R01-AG04743-03 from the National Institute on Aging. Portions of this article were presented at the 1988 annual meeting of the American Association for Public Opin- ion Research in Toronto, Canada.
We acknowledge the Inter-University Consortium for Political and Social Research for providing access to the National Election Study data analyzed in this article, and we thank Frank Mierzwa and Lynn Diel- man for conducting the data analysis. We also thank David Sears, Philip Converse, and Richard Petty for very helpful comments and sugges- tions.
Correspondence concerning this article should be addressed to Jon A. Krosniek, Department of Psychology, Ohio State University, Colum- bus, Ohio 43210, or to Duane E Alwin, Institute for Social Research, University of Michigan, 426 Thompson Street, Ann Arbor, Michigan 48106.
Two Perspect ives on Age a n d At t i t ude Change
There are two major perspectives on the relation between age and attitude flexibility (see Alwin, Cohen, & Newcomb, in press). According to the impressionable years hypothesis, the socializing influences individuals experience when they are young have a profound impact on their thinking throughout their lives (Cutler, 1974; Dennis, 1973; Easton & Dennis, 1969; Greenstein, 1965; Hess & Torney, 1967; Sears, 1975, 1981, 1983). The historical environment in which a young person be- comes an active participant in the adult world shapes the basic values, attitudes, and world views formed during those years. Once the period of early socialization has passed, this hypothe- sis argues, its residuals are fixed within individuals, and these core orientations are unlikely to change.I
As a result of this process, members of each birth cohort are presumably likely to resemble one another closely in terms of their basic attitudes (Mannheim, 1952). Furthermore, differ- ences between birth cohorts in terms of the economic, social, and political conditions and the formal socialization practices they experience produce differences between cohorts in terms of attitudes (Cutler, 1974, p. 441). For example, increases in the rate of formal education in the United States have provided new birth cohorts with different socializing experiences from those of preceding generations. Cohort replacement may be responsi- ble for recent changes in a variety of the American public's so- cial and political attitudes. Cohorts who have had one sort of early socialization experience die off as cohorts with different socialization experiences enter adulthood (Mannheim, 1952).
A second view of the relation between age and susceptibility to attitude change is called the increasing persistence hypothe-
There is no universal agreement on precisely which are the impres- sionable years. Some authors see political socialization as largely com- pleted by age 18; others see it as continuing up to approximately age 25. Consistent with this latter view, Newcomb and colleagues (Newcomb, 1943; Newcomb, Koenig, Hacks, & Warwick, 1967) found evidence of significant political socialization between ages 18 and 25.
416

AGING AND SUSCEPTIBILITY TO ATTITUDE CHANGE 417
sis. According to this perspective, individuals are eminently flexible and responsive to social circumstances when they are young, but as they age, their flexibility decreases gradually (Glenn, 1974, 1980; Jennings & Niemi, 1981; Markus, 1979; Sears, 1981, 1983). There are a number of justifications for the argument that attitude flexibility decreases steadily through the life span (see, e.g., Glenn, 1980). First, because of a decline in energy and loss of brain tissue, capacities for information pro- cessing and memory decline as life progresses, making incorpo- ration of new information difficult. Second, the experiences one has as one ages leave a gradually growing body of attitude-rele- vant knowledge within the individual that serves as a source of psychological stability (Wood, 1982). Third, aging entails social disengagement and a decrease in interest in events distant from one's immediate life (Gergen & Back, 1966; Glenn, 1969), which reduces the likelihood that attitude-challenging informa- tion will be carefully considered by an individual (Petty & Caci- oppo, 1979). Finally, a corresponding increase in social support for one's attitudes takes place as one accumulates friends who share similar social background experiences and world views as a result of friend selection and social influence processes (New- comb, Koenig, Hacks, & Warwick, 1967). This, too, may in- crease resistance to attitude change. As a result of these pro- cesses, people's attitudes presumably become less responsive to developments in their environments and thereby become less likely to change. According to this view, gradual changes in ag- gregated society-level attitudes reflect changes among the youn- gest members of society in response to major national events and personal experiences.
A third view of the relation between age and susceptibility to attitude change is the life-long openness hypothesis (Sears, 1981, 1983). According to this view, individuals are highly flexible throughout their lives and constantly alter their attitudes in re- sponse to changing life circumstances (see, e.g., Brim & Kagan, 1980, p. 1). This view is not necessarily incompatible with the impressionable years and increasing persistence hypotheses be- cause susceptibility to attitude change could decrease across the life cycle, as described by either of these hypotheses, although it may never reach a very low level. On the other hand, suscepti- bility to attitude change could, in theory, be near zero through- out the life cycle, a hypothesis that we view as the relevant null hypothesis for these others.
Previous Tests o f These Hypotheses
Two principal research approaches have been taken to test these hypotheses. The first involves tracking birth cohorts' aver- age attitudes over time. Perhaps the best known of these studies was Newcomb's classic Bennington study (Newcomb, 1943; Newcomb et al., 1967). Newcomb measured the social and po- litical attitudes of a cohort of female students before, during, and after their years at Bennington College. These women had been raised in conservative, socioeconomically advantaged households and were confronted with a very liberal environ- ment at Bennington. During their college years, the students' mean political orientation moved from the conservative end of the political spectrum toward the liberal end. The longer stu- dents stayed at Bennington, the more liberal they became on average.
Newcomb et al. (1967) reinterviewed many of these students 25 years after they graduated from Bennington and found that they had remained quite liberal on average in terms of political orientations. And when they were interviewed again in 1984, the Bennington women continued to evidence highly liberal po- litical orientations on average (Alwin et al., in press). This evi- dence is limited because of the unrepresentativeness of the sam- ple, but studies of aggregate-level attitude change in representa- tive national samples have also found large shifts in young cohorts and negligible shifts in middle-aged and older cohorts (Converse, 1976; Crewe, Sarlvik, & Air, 1977; Glenn, 1980; Markus, 1979; Mueller, 1973; Nunn, Crockett, & Williams, 1978). Thus, this body of evidence is consistent with the im- pressionable years hypothesis and challenges the increasing per- sistence hypothesis.
Assessing attitude change by tracking changes in a group's average attitude is almost certain to underestimate the amount of attitude change that actually occurred. High levels of aggre- gate stability can coexist with high levels of individual attitude change that cancel out at the aggregate level. Therefore, more definitive tests of the impressionable years and increasing per- sistence hypotheses require analyses of individual-level attitude stability. This is the second principal research method that has been used in this literature.
To assess the Bennington women's iudividual-level stability, Newcomb et al. (1967) computed test-retest correlations be- tween attitude measures. Because correlations between atti- tudes in 1938 and attitudes in 1960 were slightly larger (about .50 on average) than were correlations between attitudes in 1935 and attitudes in 1938 (about.42), Newcomb concluded that the Bennington women's attitudes became more stable as they got older. Jennings and his colleagues reported similar evidence on the consistency over time of attitude reports made by represen- tative national samples of adults (Jennings, 1988; Jennings & Markus, 1984; Jennings & Niemi, 1978; Markus, 1979). Al- though Newcomb et al. did not assess attitude change after age 40, Jennings and Markus (1984) did; they found no consistent evidence of an increase in the over-time consistency of attitude reports between the ages of 25 and 63. Therefore, this evidence is most supportive of the impressionable years hypothesis.
The only investigation that examined political attitude stabil- ity across the entire life span reached a different conclusion. Sears (1981) found that test-retest correlations between mea- sures of racial prejudice gradually increased across 21-28-year- olds, 29-44-year-olds, and 45-60-year-olds, a result consistent with the increasing persistence hypothesis. Sears also found un- expectedly low levels of over-time consistency among individu- als older than age 60, a result he viewed as evidence that an increase in susceptibility to change occurs in later years.
Confounding Attitude Change With Attitude Measurement Unreliability
As a group, these studies are problematic partly because of the inconsistencies among their findings. However, they are also problematic because of a common flaw in their analytic ap- proaches. It is well known that test-retest correlations, such as those computed by Newcomb et al. (1967), Jennings and Mar- kus (1984), and Sears (198 l), are not pure measures of attitude
418 JON A. KROSNICK AND DUANE E ALWIN
stability (see, e.g., Wheaton, Muthen, Alwin, & Summers, 1977). These correlations reflect both the amount of attitude change that takes place during a given t ime period and the amount of random measurement error in reports of attitudes. Differences between age groups in terms of over-time corre- lations may reflect differences in the extent of either or both processes, because both attenuate such correlations.
Jennings and Markus (1984) recognized this confounding (see pp. 1004-1005, footnote 3). In their analysis of party iden- tifieation, they used structural equation modeling to separate attitude change from attitude measurement unreliability. Jen- nings and Markus found that taking measurement error into account in this fashion did not alter their evidence of increased stability in early adulthood. However, Jennings and colleagues did not perform similar analyses for the other attitudes they measured, and it is impossible to be certain that doing so would not have altered their general conclusion.
Sears ( 1981) dealt with measurement error in a different fash- ion. He assessed the relation between age and random measure- ment error by computing Cronbach's alpha coefficients for his 10-item index of racial attitudes. Because the alpha coefficients for all of the age groups were "in the same ballpark," Sears con- cluded that the variation in test-retest correlations that he ob- served reflected only differences in attitude change.
Treating Cronbach's alpha as a measure of reliability as Sears (1981) did entails making the assumption that the 10 items composing his index are all univocal measures of a single, uni- dimensional orientation toward racial integration. However, re- cent evidence suggests that the items Sears analyzed actually measure more than one latent attitude dimension (Bobo, 1983). I f this is so, Sears's alphas confound random measurement er- ror with the strength of the relations among the dimensions. Variation in the latter across age groups could have masked variation in measurement reliability across age groups.
Furthermore, although Sears (1981) viewed his Cronbach's alpha analysis as revealing no relation between age and attitude measurement reliability, a number of previous investigations have found that the amount of random measurement error in attitude reports is greater among older respondents (Andrews, 1984; Andrews & Herzog, 1986; Stember, 1951-1952). Indeed, a close inspection of Sears's (1981) reliability coefficients re- veals that the oldest respondents' alpha was lower than those of younger respondents, enough so to explain the decrease in over- time correlations. 2 Therefore, the decline Sears discovered in over-time correlations among the oldest age group may reflect an increase in random measurement error instead of an in- crease in the rate of attitude change.
foreign policy issues, attitudes toward social groups, political party identification, and liberal-conservative ideological orien- tations. Third, we implemented an analytic approach that per- mitted us to estimate attitude change and random measurement error separately in a way that did not require that assumptions be made about the unidimensionality of sets of attitude items.
Study 1 was based on data collected from two panels of re- spondents, who were each interviewed on three occasions, 2 years apart. Each panel's interviews spanned two presidential elections and one congressional election. Respondents in each panel were asked certain attitude questions during each inter- view, which allowed us to generate separate estimates of attitude stability and attitude measure reliability, using structural equa- tion modeling. Study 2 used the same analytic method but was based on data collected over only 8 months, during a single pres- idential election campaign. Taken together, these data sets per- mitted us to examine political attitude change both within and between presidential election campaigns.
S tudy 1
Method
Samples. The data analyzed in this study came from two panel sur- veys in the National Election Study series. For the first survey the Uni- versity of Michigan's Center for Political Studies interviewed a repre- sentative, national cross-section of 1,132 adults living in private house- holds in the United States at the time of the 1956 presidential election. They were interviewed again at the time of the 1958 midterm election and again at the time of the 1960 presidential election. In the second panel survey that we examined, a nationally representative sample of 1,320 adults was interviewed at the time of the 1972 U.S. presidential election. They were interviewed again at the time of the 1974 midterm election and again at the time of the 1976 presidential election.
In order to permit testing of hypotheses regarding aging, we divided the respondents in each panel into the following age groups on the basis of their age at the first wave of the survey: 18-25, 26-33, 34-41, 42-49, 50-57, 58-65, and 66-83. The groups were based on 8-year age spans in order to generate as many approximately equal-sized age groups as possible that were each large enough to yield reliable parameter esti- mates. The resulting age-group sizes for the 1950s panel were 94, 228, 241, 187, 138, 101, and 99, respectively. For the 1970s panel, the age group sizes were 208, 227, 190, 204, 167, 147, and 161, respectively)
Measures. Our analyses required that attitudes be measured on three occasions. In the 1956-1960 study, respondents were asked identical questions in each year that measured attitudes toward school integra- tion, federally guaranteed employment for all Americans, U.S. involve- ment in the affairs of other nations, U.S. international financial aid pro- grams, maintenance of U.S. troops abroad, and federal financial aid to schools. Also, during all three waves, respondents were asked which ma-
T h e Presen t Inves t iga t ion
In sum, past investigations of the relation between age and attitude stability have had significant methodological limita- tions. In this article, we will report two studies of the relation between age and attitude change that overcome these problems in three principal ways. First, the data we analyzed were col- lected from nationally representative samples of adults in the United States who ranged in age from 18 to 83 years. Second, we examined a range of social and political attitudes, including trust in government, political efficacy, attitudes on domestic and
2 When Sears (1981) controlled for educational differences between age groups, the average drop from the 45-60-ycar-olds to the 61 +-year- olds in over-time consistency was. 16, whereas the average drop in reli- ability was .08. Because unreliability in a measure reduces a test-retest correlation twice, at both Wave 1 and Wave 2 (Alwin, 1973), this differ- ence in reliability would fully account for the difference in over-time consistency.
3 These ns do not add up to the total Ns for the panels because of missing data on the age variable. In the 1950s panel, the ages of 44 respondents were not ascertained, and in the 1970s panel, the ages of 16 respondents were not ascertained.
AGING AND SUSCEPTIBILITY TO ATTITUDE CHANGE 419
jor political party they identified with and how strongly they did so. In the 1972-1976 panel, respondents were asked identical questions in each year measuring seven categories of attitudes: (a) political party identification, (b) liberal-conservative ideological orientation, (c) atti- tudes toward social groups, such as labor unions, the military, and the police, (d) attitudes on racial policy issues, such as school bussing pro- grams, (e) attitudes on nonracial domestic policy issues, such as feder- ally guaranteed employment and protecting the rights of people accused of committing crimes, (f) political efficacy and alienation, and (g) atti- tudes toward prominent politicians. In total, 50 items were analyzed from these two panel surveys. 4
Some of the attitude measures allowed respondents to indicate (a) that they did not know what their attitude was on an issue or (b) that they had not thought enough about an issue to form an attitude. Re- spondents who gave either of these answers to a given question at any wave were eliminated from the analyzed sample for that question. 5
Analysis. We wished to estimate the reliability of these measures and the stability of the underlying attitudes for each of the seven age groups. A number of analytic approaches have been proposed for doing so using structural equation modeling all of which require data on a panel of respondents collected on at least two occasions (see Alwin, 1988). When only two waves of data are available, these approaches require that the assumption be made that a set of questions are congeneric measures of a single attitude. Because we had measures of the same attitudes on three occasions, we were able to estimate the parameters of a model that does not entail this assumption.
The model we estimated is composed of two structural equations:
Xt = ¢, + ~t, (1)
and
¢, =/3,,,-1~,-1 + ~',. (2)
Equation 1 specifies the measurement model, which describes the rela- tion between the latent attitude being measured and verbal reports of it. It decomposes variance in reports Oft, where t = 1, 2, 3) into two components, one due to the latent attitude (rt) and the other due to random measurement error (~t). Equation 2 specifies the structural model, which describes the relations among the latent attitudes./~t.t-~ is the stability of the latent attitude during the period from t - 1 to t • ~'t represents sources of change over time in the latent attitude. This model has been discussed extensively by Heise (1969), Wheaton et al., (1977), and Wiley and Wiley (1970).
As it appears in Equations 1 and 2, the model is underidentified. There are six independent pieces of information available (o12, 0,32, 0,31, ~l 2, 0,22, and 0,32) with which to estimate eight parameters (/~21,/~32, ¢~12, ¢~e, 0,~32, #~12, ¢r22, and 0,~32). In order to identify the model, the attitude measure's reliability is assumed to remain constant across waves (#1 e - O'M2)/0,12 = (O"22- 0,E22)/0,22 = (0,32- 0,e32)/0"32; Heise, 1969). 6 Given this constraint, the model is just-identified, so the parameter estimates will always fit the observed data perfectly.
For each attitude measure, the parameters of the model were esti- mated separately for each of the seven age groups using LISREL VI (Jores- kng & Sorbom, 1978). We then analyzed the resulting parameter esti- mates in two ways. First, we were interested in the stability of the latent attitude, so we examined the estimates of/32~ and/~32. Second, we exam- ined the single reliability estimate generated for each attitude measure. And finally, we were interested in comparing the conclusions reached by our analysis with those that would have been reached had we ignored the distinction between attitude instability and attitude measure unreli- ability. We therefore examined Pearson product-moment test-retest correlations between the attitude measures at adjacent waves: rl2 and r2a. For the sake of simplicity, all of the following statistical tests involv- ing stability are based on a single combined analysis of all the stability coefficients (/~2~ and/~32), and all tests involving over-time consistency
are based on a single combined analysis of all the test-retest correlations (r12 and r23 ).
Results
Zero-order correlations. The top panel o f Table I displays the average test-retest correlations for each age group. As expected, a one-way analysis o f variance (ANOVA) of the figures in the third co lumn indicated that there were statistically significant differences among the age groups, F(6, 693) = 2.86, p = .01. Tests o f a priori contrasts revealed that, consistent with the two aging hypotheses, the youngest age group 's average correlation was significantly smaller than the average o f the 26-65 age groups, t(693) = 2.18, p < .03. Consistent with the claim that atti tude measurement reliability decreases in old age, the oldest age group 's average correlation was significantly smaller than the average o f the 26-65 age groups, t(693) = 2.97, p < .01. Taken together, these results precisely replicate Sears's (1981) findings. 7
Attitude stability. The middle panel o f Table 1 displays esti- mates o f attitude stability. The impressionable years hypothesis proposes that these stability coefficients should be relatively small in the youngest age group and should be large and approx- imately equal in the remaining age groups. The increasing-per- sistence hypothesis proposes instead that we should observe a consistent, gradual increase in the stability coefficients across the age groups.
4 For two other items in the 1950s data set and six other items in the 1970s data set, either LISREL was unable to estimate the structural equation model parameters for one age group, or one age group's pa- rameter estimates were far out of range. These problems probably oc- curred because of random fluctuation in the zero-order correlations be- tween the attitude measures that resulted from small sample sizes and sampling error. In order to maintain comparability of items across age groups, we did not include these items in any of the following analyses. However, when we repeated the analyses deleting only those single data points that were not estimable, the results were equivalent to those re- ported here (and in fact supported our conclusions even more strongly). The first-wave National Election Study item numbers for the attitude measures included in these analyses are 32, 35, 41, 53, 56, 74, and 88 in the 1950s and 112, 140, 202, 232, 259, 253, 255,258, 264, 269-274, 570-574, 576, 578, 621,652, 707, 709, 714, 717-722, 724, 737, 744, 745,749, 752, 753, 755,756, and 1067 in the 1970s.
5 All of the following analyses were also run recoding "don't know" and "haven't thought much about this issue" responses to the midpoint of the attitude scales. The results of these analyses are essentially identi- cal to those reported here. Levels of"don't know" and "haven't thought much about this issue" responses increase consistently across the life cycle, from a low of about 12% for 18-25-year-olds to about 23% for 66-83-year-olds, with most of the increase occurring after age 49.
6 An alternative approach to identifying the model described in Equations 1 and 2 was proposed by Wiley and Wiley (1970). All of the following analyses were recomputed using their identifying assumption. The results of these analyses were comparable to those reported in the text.
7 Here and throughout the remainder of the results, we found no sta- tistically significant differences between attitude--object categories in the relation between age and attitude stability and attitude-report reli- ability. For more detailed results in this regard, see Alwin and Krosnick (1988, 1989) and Krosnick and Alwin (1989).
420 JON A. KROSNICK AND DUANE E ALWIN
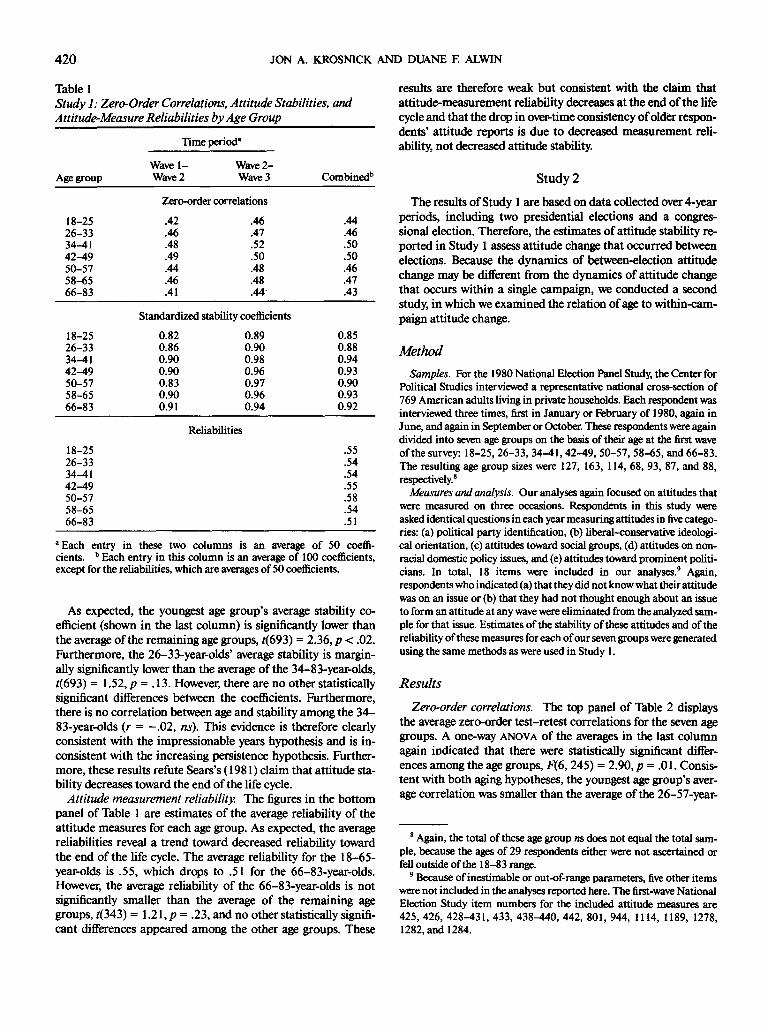
Table 1 Study 1: Zero-Order Correlations, Attitude Stabilities, and Attitude-Measure Reliabilities by Age Group
Time period"
Wave 1- Wave 2- Age group Wave 2 Wave 3 Combined b
Zero-ordercorrelations
18-25 .42 .46 .44 26-33 .46 .47 .46 34-41 .48 .52 .50 42-49 .49 .50 .50 50-57 .44 .48 .46 58-65 .46 .48 .47 66-83 .41 .44 .43
Standardized stability coefficients
18-25 0.82 0.89 0.85 26-33 0.86 0.90 0.88 34-41 0.90 0.98 0.94 42-49 0.90 0.96 0.93 50-57 0.83 0.97 0.90 58-65 0.90 0.96 0.93 66-83 0.91 0.94 0.92
Reliabilities
18-25 .55 26-33 .54 34-41 .54 42-49 .55 50-57 .58 58-65 .54 66-83 .51
a Each entry in these two columns is an average of 50 coeffi- cients, b Each entry in this column is an average of 100 coefficients, except for the reliabilities, which are averages of 50 coefficients.
As expected, the youngest age group's average stability co- efficient (shown in the last column) is significantly lower than the average of the remaining age groups, t(693) = 2.36, p < .02. Furthermore, the 26-33-year-olds' average stability is margin- ally significantly lower than the average of the 34-83-year-olds, t(693) = 1.52, p = . 13. However, there are no other statistically significant differences between the coefficients. Furthermore, there is no correlation between age and stability among the 34- 83-year-olds (r = - .02, ns). This evidence is therefore dearly consistent with the impressionable years hypothesis and is in- consistent with the increasing persistence hypothesis. Further- more, these results refute Sears's ( 1981 ) claim that attitude sta- bility decreases toward the end of the life cycle.
Attitude measurement reliability The figures in the bottom panel of Table 1 are estimates of the average reliability of the attitude measures for each age group. As expected, the average reliabilities reveal a trend toward decreased reliability toward the end of the life cycle. The average reliability for the 18-65- year-olds is .55, which drops to .51 for the 66-83-year-olds. However, the average reliability of the 66-83-year-olds is not significantly smaller than the average of the remaining age groups, t(343) = 1.21, p = .23, and no other statistically signifi- cant differences appeared among the other age groups. These
results are therefore weak but consistent with the claim that attitude-measurement reliability decreases at the end of the life cycle and that the drop in over-time consistency of older respon- dents' attitude reports is due to decreased measurement reli- ability, not decreased attitude stability.
Study 2
The results of Study 1 are based on data collected over 4-ycar periods, including two presidential elections and a congres- sional election. Therefore, the estimates of attitude stability re- ported in Study 1 assess attitude change that occurred between elections. Because the dynamics o f between-election attitude change may be different from the dynamics of attitude change that occurs within a single campaign, we conducted a second study, in which we examined the relation of age to within-cam- paign attitude change.
Method
Samples. For the 1980 National Election Panel Study, the Center for Political Studies interviewed a representative national cross-section of 769 American adults living in private households. Each respondent was interviewed three times, first in January or February of 1980, again in June, and again in September or October. These respondents were again divided into seven age groups on the basis of their a~ at the first wave of the survey: 18-25, 26-33, 34--41, 42-49, 50-57, 58-65, and 66-83. The resulting age group sizes were 127, 163, 114, 68, 93, 87, and 88, respectively, s
Measures and analysis. Our analyses again focused on attitudes that were measured on three occasions. Respondents in this study were asked identical questions in each year measuring attitudes in five catego- ries: (a) political party identification, (b) liberal-conservative ideologi- cal orientation, (c) attitudes toward social groups, (d) attitudes on non- racial domestic policy issues, and (e) attitudes toward prominent politi- cians. In total, 18 items were included in our anaiyses. 9 Again, respondents who indicated (a) that they did not know what their attitude was on an issue or (b) that they had not thought enough about an issue to form an attitude at any wave were eliminated from the analyzed sam- ple for that issue. Estimates of the stability of these attitudes and of the reliability of these measures for each of our seven groups were generated using the same methods as were used in Study 1.
Results
Zero-order correlations. The top panel of Table 2 displays the average zero-order test-retest correlations for the seven age groups. A one-way ANOVA of the averages in the last column again indicated that there were statistically significant differ- ences among the age groups, F(6, 245) = 2.90, p = .01. Consis- tent with both aging hypotheses, the youngest age group's aver- age correlation was smaller than the average of the 26-57-year-
s Again, the total of these age group ns does not equal the total sam- ple, because the ages of 29 respondents either were not ascertained or fell outside of the 18-83 range.
9 Because of inestimable or out-of-range parameters, five other items were not included in the analyses reported here. The first-wave National Election Study item numbers for the included attitude measures are 425, 426, 428--431,433, 438-440, 442, 801,944, 1114, 1189, 1278, 1282, and 1284.
AGING AND SUSCEPTIBILITY TO ATrITUDE CHANGE 421
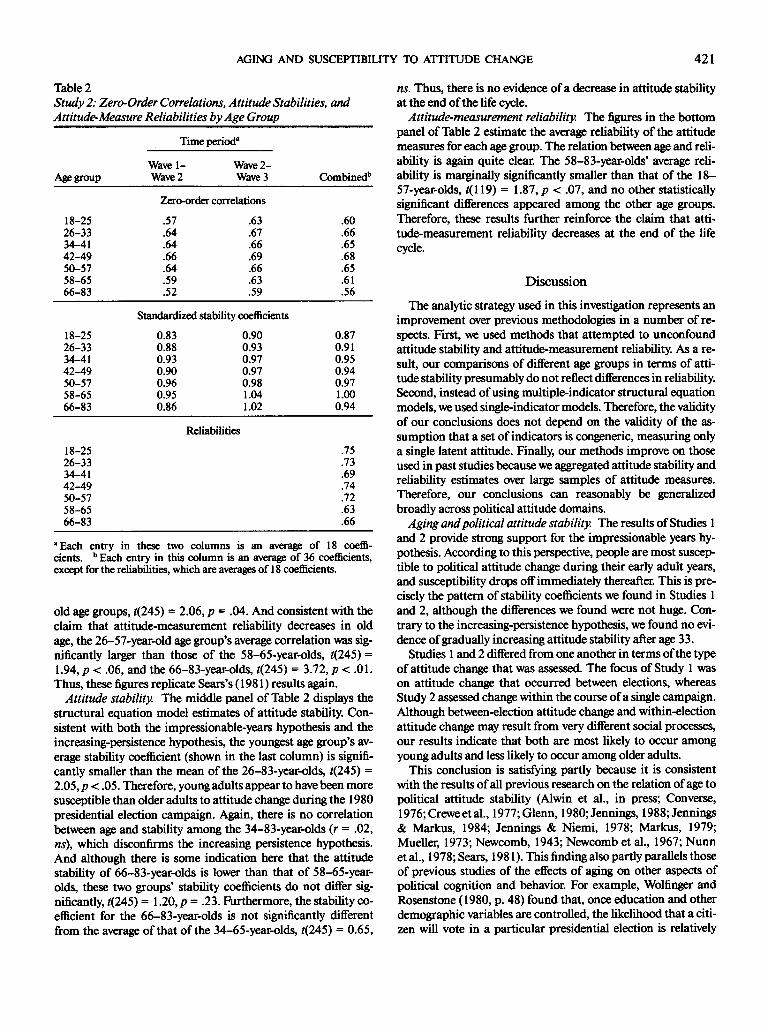
Table 2 Study 2: Zero-Order Correlations, Attitude Stabilities, and Attitude-Measure Reliabilities by Age Group
Time period"
Wave 1- Wave 2- Age group Wave 2 Wave 3 Combined b
Zero-ordercorrelations
18-25 .57 .63 .60 26-33 .64 .67 .66 34-41 .64 .66 .65 42-49 .66 .69 .68 50-57 .64 .66 .65 58-65 .59 .63 .61 66-83 .52 .59 .56
Standardized stability coefficients
18-25 0.83 0.90 0.87 26-33 0.88 0.93 0.91 34-41 0.93 0.97 0.95 42-49 0.90 0.97 0.94 50-57 0.96 0.98 0.97 58-65 0.95 1.04 1.00 66-83 0.86 1.02 0.94
Rcliabilities
18-25 .75 26-33 .73 34-41 .69 42-49 .74 50-57 .72 58-65 .63 66-83 .66
a Each entry in these two columns is an average of 18 coeffi- cients, b Each entry in this column is an average of 36 coefficients, except for the reliabilities, which are averages of 18 coefficients.
old age groups, t(245) = 2.06, p = .04. And consistent with the claim that attitude-measurement reliability decreases in old age, the 26-57-year-old age group's average correlation was sig- nificantly larger than those of the 58-65-year-olds, t(245)= 1.94, p < .06, and the 66-83-year-olds, t(245) = 3.72, p < .01. Thus, these figures replicate Sears's ( 1981) results again.
Attitude stability. The middle panel of Table 2 displays the structural equation model estimates of attitude stability. Con- sistent with both the impressionable-years hypothesis and the increasing-persistence hypothesis, the youngest age group's av- erage stability coefficient (shown in the last column) is signifi- cantly smaller than the mean of the 26-83-year-olds, t(245) = 2.05, p < .05. Therefore, young adults appear to have been more susceptible than older adults to attitude change during the 1980 presidential election campaign. Again, there is no correlation between age and stability among the 34-83-year-olds (r = .02, ns), which disconfirms the increasing persistence hypothesis. And although there is some indication here that the attitude stability of 66-83-year-olds is lower than that of 58-65-year- olds, these two groups' stability coefficients do not differ sig- nificantly, t(245) = 1.20, p = .23. Furthermore, the stability co- efficient for the 66-83-year-olds is not significantly different from the average of that of the 34-65-year-olds, t(245) = 0.65,
ns. Thus, there is no evidence of a decrease in attitude stability at the end of the life cycle.
Attitude-measurement reliability. The figures in the bottom panel of Table 2 estimate the average reliability of the attitude measures for each age group. The relation between age and reli- ability is again quite clear. The 58-83-year-olds' average reli- ability is marginally significantly smaller than that of the 18- 57-year-olds, t(119) = 1.87, p < .07, and no other statistically significant differences appeared among the other age groups. Therefore, these results further reinforce the claim that atti- tude-measurement reliability decreases at the end of the life cycle.
Discussion
The analytic strategy used in this investigation represents an improvement over previous methodologies in a number of re- spects. First, we used methods that attempted to unconfound attitude stability and attitude-measurement reliability. As a re- sult, our comparisons of different age groups in terms of atti- tude stability presumably do not reflect differences in reliability. Second, instead of using multiple-indicator structural equation models, we used single-indicator models. Therefore, the validity of our conclusions does not depend on the validity of the as- sumption that a set of indicators is congeneric, measuring only a single latent attitude. Finally, our methods improve on those used in past studies because we aggregated attitude stability and reliability estimates over large samples of attitude measures. Therefore, our conclusions can reasonably be generalized broadly across political attitude domains.
Aging and political attitude stability. The results of Studies l and 2 provide strong support for the impressionable years hy- pothesis. According to this perspective, people are most suscep- tible to political attitude change during their early adult years, and susceptibility drops off immediately thereafter. This is pre- cisely the pattern of stability coefficients we found in Studies l and 2, although the differences we found were not huge. Con- trary to the increasing-persistence hypothesis, we found no evi- dence of gradually increasing attitude stability after age 33.
Studies 1 and 2 differed from one another in terms of the type of attitude change that was assessed. The focus of Study 1 was on attitude change that occurred between elections, whereas Study 2 assessed change within the course of a single campaign. Although between-election attitude change and within-election attitude change may result from very different social processes, our results indicate that both are most likely to occur among young adults and less likely to occur among older adults.
This conclusion is satisfying partly because it is consistent with the results of all previous research on the relation of age to political attitude stability (Alwin et al., in press; Converse, 1976; Crewe et al., 1977; Glenn, 1980; Jennings, 1988; Jennings & Markus, 1984; Jennings & Niemi, 1978; Markus, 1979; Mueller, 1973; Newcomb, 1943; Newcomb et al., 1967; Nunn et al., 1978; Sears, 198 l). This finding also partly parallels those of previous studies of the effects of aging on other aspects of political cognition and behavior. For example, Wolfinger and Rosenstone (1980, p. 48) found that, once education and other demographic variables are controlled, the likelihood that a citi- zen will vote in a particular presidential election is relatively
422 JON A. KROSNICK AND DUANE E ALWlN
low at age 18, increases dramatically up to age 30, and continues to increase therealter, although more slowly. Converse (1976) found that the strength of political-party identification follows the same pattern across the life span. These findings are consis- tent with our evidence of increases in political-attitude stability between the ages of 18 and 30, so they may be produced by similar mechanisms. However, our failure to find evidence of increased stability thereafter conflicts with Wolfinger and Ro- senstone's (1980) and Converse's (1976) results and raises the possibility that different mechanisms may be operating.
Wolfinger and Rosenstone's (1980) research suggests an inter- esting possible relation that may underlie our results. They found that the increase in voter turnout with age was powerfully related to educational attainment. Aging led to dramatically in- creased turnout among people who had not graduated from high school, but aging had almost no effect on turnout among people with at least some graduate school training (p. 59). Thus, advanced education apparently instigates a high level of turnout during early adulthood that remains crystallized throughout later adulthood. Advanced education may also solidify young people's political attitudes, so that the relation we found be- tween age and attitude stability may disappear among well-edu- cated respondents. Unfortunately, our samples were too small to permit simultaneous analysis of age and education. Future studies that do this simultaneous analysis may make an impor- tant contribution to our understanding of the mechanisms through which aging affects political cognition and behavior and of the limiting conditions of those effects.
It is interesting to note that the magnitude of the effect of aging on influenceability found here is comparable with the ap- parent effect on influenceability of another frequently studied individual difference variable: gender. Eagly and Carli's (198 l) mean effect size for gender, calculated in terms of d, was .26. In terms of d, the effects of age identified here are .21 in Study l and .20 in Study 2. The methods used in the present study are very different from those used in the studies examined by Eagiy and Carli, so direct comparison of these ds is probably not war- ranted. Nonetheless, they suggest that age and gender may have comparable effects on persuasibility, although the effects of both variables are not especially strong.
Aging and attitude measurement unreliability. Contrary to Sears's ( 1981 ) conclusion, Studies 1 and 2 revealed no evidence ofa drop-offin attitude stability at the end of the life cycle. Our results suggest that his finding in this regard reflected a slight increase in the amount of random measurement error in atti- tude reports provided by the oldest respondents in surveys. Consistent with previous work on survey-measurement reli- ability (e.g., Andrews, 1984; Andrews & Herzog, 1986), Studies I and 2 produced evidence of this relation between age and atti- tude-measurement reliability. We suspect that this relation oc- curs because, as people age, they become less able or less willing, or both, to make precise reports of internal states by means of closed-ended survey questions.
These results demonstrate how equating attitude stability with zero-order test-retest correlations between attitude mea- sures can lead to incorrect conclusions. Unreliability in attitude reports is partly the result of respondent characteristics (Alwin & Krosnick, 1988), so between-group differences in over-time consistency confound differences in attitude stability with
differences in unreliability. Given the clear conceptual distinc- tion between these two processes, researchers making compari- sons of any psychological parameters across groups defined by age or by any other individual difference variable should take into account the possibility of measurement-error differences between groups.
Aging effects versus birth cohort differences. It is well known that comparisons of age groups using cross-sectional data may reflect the effects of aging~ but they may also represent other processes instead (see Riley, 1973); most important, they may represent cohort-specific differences. In our case, we have as- sumed that the lower stability we observed in young adults' atti- tudes increases as they age. However, the unique socialization experiences of these individuals may have made them unusually susceptible to attitude change, and this unusual susceptibility may be maintained throughout their lives. We cannot fully test and rule out this possibility. However, the fact that similar re- lations of age to attitude stability were found in the 1950s, 1970s, and 1980s panel data when they were analyzed sepa- rately suggests strongly that this result does not reflect the unique socializing experiences of one young birth cohort.
In principle, our finding that the oldest adults evidenced greater unreliability in their attitude reports may also reflect birth cohort differences instead of aging differences. In fact, Sears (1981) suggested that this relation may appear because older birth cohorts acquired less formal education on average than did younger birth cohorts, and education is positively re- lated to attitude-report precision. Although education is indeed negatively related to random measurement error in attitude re- ports (Alwin & Krosnick, 1988; Andrews, 1984; Andrews & Herzog, 1986), studies that controlled for educational differ- ences between age groups found that older respondents still evi- denced heightened random-measurement error (Andrews, 1984; Andrews & Herzog, 1986). Sears's (1981) own analysis revealed that controlling for education reduced but did not eliminate the drop in over-time consistency or reliability of atti- tude reports among respondents ages 61 years and older. And a recent cohort analysis found that the reliability of attitude re- ports decreased as each of a series of birth cohorts aged, thus demonstrating aging effects with education held constant (see Alwin & Krosnick, 1989).
The survey samples we analyzed were too small to permit a simultaneous analysis of age and education, because this would require dividing already small age groups into even smaller edu- cation subgroups. However, given previous research, we suspect that controlling for education would eliminate some but not all of the relation we observed here between age and the reliability of attitude reports. And again, because the relation of age to reliability appeared in the 1950s, 1970s, and 1980s data when they were analyzed separately, it does not seem to be due to a particular birth cohort's unique experiences.
Sample attrition. Another possible explanation for our find- ings of decreased attitude report reliability late in life is differ- ential sample attrition. As a birth cohort ages, some members die off. It is conceivable that the most reliable members of our oldest birth cohorts were the most likely to have died. There- fore, what appears to be an effect of aging on attitude-measure- ment reliability may in fact be the result of differential attrition. Again, we cannot test or rule this out using the present data.
AGING AND SUSCEPTIBILITY TO ATTITUDE CHANGE 423
This can only be accomplished using longitudinal data, col- lected over very long time periods, which permit assessment of the relation between reliability and mortality. However, if reli- ability and mortality are related, we can imagine that they could be so in exactly the opposite direction: The most unreliable members of a birth cohort may be the first to die. If this is so, we have underestimated the relation of age to unreliability.
A more important potential problem involves the sampling practices used for the National Election Studies. It is conven- tional for the National Election Studies to omit from their sam- ples individuals who live in dormitories and prisons and those serving in the military (Converse, 1976, pp. 49-50). It seems likely that greater proportions of young adults ages 18-25 fall into these categories (particularly the dormitory category) com- pared with older people. If individuals who fall into these cate- gories have unusually high attitude stability, this could account for the apparently lower level of attitude stability of 18-25-year- olds. This is a plausible and more troubling alternative explana- tion for our results that we cannot rule out.
Determinants of attitude change levels. Throughout this arti- cle, we have treated differences between age groups in terms of attitude stability levels as indicating differences in susceptibility to attitude change. However, it is important to acknowledge that these levels are in fact joint products of susceptibility to change and the frequency with which individuals encounter attitude- change-inducing stimuli (see, e.g., Converse, 1962; Zaller, 1987). Therefore, young people may evidence higher levels of attitude change not because of greater susceptibility but rather because of greater exposure to change-inducing events. Indeed, this is quite plausible: People probably experience more major life shifts between ages 18 and 25 than at any other point in the life cycle. These changes may include graduating from high school, going to college, graduating from college, starting a first job, getting married, becoming a parent, moving from one place of residence to another, and so on. Without measuring and con- trolling for the frequency of such attitude-change-inducing events, it is impossible to be certain that the higher levels of attitude change among 18-25-year-olds observed here can be attributed to greater susceptibility to attitude change.
The validity of our estimation method. Separating test-retest correlations into components due to stability and unreliability is an inherently tricky business; therefore, it seems appropriate to be cautious about the validity of our conclusions in this re- gard. Although our approach to this problem is an improve- ment over previous efforts, the structural-equation model we used does make certain assumptions that may be invalid. For example, the model assumes that attitude change occurs ac- cording to a simplex process (see Alwin, 1988), and some skep- ticism has been expressed about this assumption (Ragosa, 1988). However, a careful review of our test-retest correlations revealed that nearly all of them had a simplex structure; there- fore, we are not particularly troubled by this assumption. The model also assumes that measurement reliability remains con- stant across repeated interviews, which may not be the case. For example, a Socratic effect may produce a decrease in random measurement error across waves of panel surveys (Jagodzinski, Kuhnel, & Schmidt, 1987; but see Saris & Putte, 1988). How- ever, the reliabilities generated by our estimation method are essentially averages computed across the three interviews,
which can be reasonably compared across age groups even if the assumption of constant reliability is violated.
Although these assumptions, therefore, do not seem prob- lematic, the model does make other assumptions that may be untenable and that may complicate a clean separation of stabil- ity from unreliability. For example, the model assumes that there is no correlated measurement error across interviews, and violation of this assumption would lead to inappropriately low estimates of unreliability (although not inappropriate estimates of random measurement error; see Alwin, 1974). We therefore await the development of more effective analytic techniques or the collection of multiwave panel data sets that will eliminate the necessity of making these assumptions. In the meantime, howevc~ the method we have used here seems to us to be the best one available for accomplishing our goals.
Laboratory studies of attitude change. Assuming that we have identified age-based differences in susceptibility to attitude change, our findings have important implications for social psy- chologists' traditional approach to studying the determinants of attitude change: laboratory experiments involving college undergraduate subjects. Our results make it clear that these sub- jects, most of whom fall in the 18-25 age range, are likely to evidence higher levels of attitude change than are older adults. Therefore, the levels of attitude change typically found in labo- ratory studies are likely to be higher than would be produced by more representative samples of adults (see Hovland, 1959; Sears, 1986).
Do our results suggest that social psychologists should no longer conduct studies of college sophomores? We believe not. Social psychologists are generally interested in documenting the processes by which attitude change occurs, not in assessing gen- eral levels of flexibility. Whether the processes by which attitude change occurs are any different among young people than they are among older people remains a matter for empirical evalua- tion (although Sears, 1986, has suggested that such differences are likely). Unless process differences are uncovered, our evi- dence suggests that social psychologists' traditional approach is probably a highly sensible one. Studies of any process can most efficiently be conducted using subjects who are most likely to manifest that process; thus, studies of attitude change may be most efficiently conducted using subjects who are most likely to be susceptible to it: those between ages 18 and 25 years. Clearly though, assessing the generalizability of attitude change pro- cesses across the life span is a worthy focus for future research.
Impressionable years or lifelong openness? A cursory exami- nation of our results reveals that we have reported very high stability coefficients, ranging from 0.82 to 1.04. One might be tempted to conclude from this that the political attitudes we examined are nearly perfectly stable after early adulthood and that political attitude change is likely to be an extremely rare event after age 25 (see, e.g., Achen, 1975). This conclusion is supported by the only study that tracked attitude stability across nearly the entire life span, the Bennington study (Alwin et al., in press). It found remarkably high levels of attitude sta- bility (betas of approximately 0.86) across approximately 23- year periods (Alwin et al., in press; Newcomb et al., 1967). When this finding is considered in light of Study l 's average stability coefficient for 2-year periods (0.91) and Study 2's aver- age stability coefficient for 4-month periods (0.94), it appears
424 JON A. KROSNICK AND DUANE E ALWIN
that stability is asymptotic at a relatively high level. I° Thus, this evidence would offer strong support for the impressionable- years hypothesis and would suggest rejection of the lifelong- openness hypothesis (Brim & Kagan, 1980; Glenn, 1980; Sears, 1981, 1983).
However, it is possible to use these data to argue for a different conclusion. The women who were the subjects of the Benning- ton study are unconventional in numerous ways and may there- fore evidence unusually high levels of attitude stability (see AI- win et al., in press). Furthermore, the overall average stability coefficients reported here are not exactly 1.0, and they summa- rize only the amount of change that took place during 2-year periods in Study 1 and 3-4 month periods in Study 2. When multiplied out to produce an estimate of stability over a 10-year period, a 2-year stability coefficient of 0.90 becomes about 0.60. Given that the average stability coefficients from Study 2 are not much larger than those from Study 1 (which involved longer time intervals between waves), such a simple-minded multi- plication exercise may not accurately represent the processes involved. Nonetheless, one could use this evidence to argue that political attitude change may not be a rare exception, but rather may be a common event over the long haul.
This is precisely the conclusion reached by Searin~ Wright, and Rabinowitz (1976) on the basis of an analysis of aggregate attitude change in the U.S. public over a 16-year period. And it is a conclusion consistent with Jennings and colleagues' (Jen- nings & Markus, 1984; Jennings & Niemi, 1981) evidence of only low-to-moderate levels of over-time consistency in attitude reports over 8- to 9-year periods. II These figures underestimate stability because they confound attitude change with measure- ment unreliability, but it seems unlikely that correcting for un- reliability would yield stability coefficients very close to 1.0. Thus, this evidence is consistent with the notion of lifelong openness to change in beliefs, attitudes, and behavior.
If this is true, it has at least two important implications for the study of political attitudes. First, it would call into question the widely shared belief that the most potent political attitudes, such as politieal-party identifications and racial attitudes, are formed during childhood or early adulthood and persist unal- tered throughout the remainder of the life cycle (e.g., Campbell, Converse, Miller, & Stokes, 1960; Easton & Dennis, 1969; Sears, 1983). And second, it would suggest that political-atti- tude change occurs frequently enough in the normal course of daily life to justify extensive study of its dynamics. Some re- search is beginning to identify the forces that produce naturally occurring political-attitude change (e.g., Franklin, 1984), and we look forward to more such work. We look forward as well to long-term studies of attitude stability across the entire life cycle in representative samples that will allow a more definitive test of the lifelong-openness hypothesis. Until such studies are con- ducted, the validity of the lifelong-openness hypothesis remains uncertain.
~o We thank David Sears for pointing this out. ~m Jennings and Niemi's (1981) test-retest correlations vary substan-
tially in magnitude. These correlations appear to depend partly on the particular attitude object, perhaps because of different formal proper- ties of the attitude measures (see, e.g., Kxosnick & Alwin, 1989).
References
Achen, C. H. (1975). Mass political attitudes and the survey response. American Political Science Review, 69, 1218-1231.
Alwin, D. E (1973). Making inferences from attitude-behavior corre- lations. Sociomet~ 36, 253-278.
Alwin, D. E (1974). Approaches to the interpretation of relationships in the multitrait-multimethod matrix. In H. L. Costner (Ed.), Socio- logical methodology 1973-74 (pp. 79-105). San Francisco: Jossey- Bass.
Alwin, D. E (1988). Structural equation models in research on human development and aging. In K. W. Schaie, R. T. Campbell, W. M. Mer- edith, & S. C. Rawlings (Eds.), Methodological issues in aging re- search (pp. 71-170). New York: Springer Publishing.
Alwin, D. E, Cohen, R. L., & Newcomb, T. M. (in press). The mgmen of Bennington: A study of political orientations over the life span. Mad- ison: University of Wisconsin Press.
Alwin, D. E, & Kxosnick, J. A. (1988, June). The reliability ofattitudi- nod survey data. Paper presented at the International Conference on Social Science Methodology, Dubrovnik, Yugoslavia.
Alwin, D. E, & Krosnick, J. A. (1989). Aging, cohort stability, and change in sociopolitical attitudes: Exploring the generational-persis- tence model. Unpublished manuscript, Institute for Social Research, Ann Arbor, Michigan.
Andrews, E M. (1984). Construct validity and error components of sur- vey measures: A structural modeling approach. Public Opinion Quarterly, 48, 409-442.
Andrews, E M., & Herzog A. R. (1986). The quality of survey data as related to age of respondent. Journal of the American Statistical Association, 81, 403-4 10.
Bobo, L. (1983). Whites' opposition to busing: Symbolic racism or real- istic group conflict? Journal of Personality and Social Psychology, 45, 1196-1210.
Brim, O. G., & Kagan, J. (1980). Constancy andchange in human devel- opment. Cambridge, MA: Harvard University Press.
Campbell, A., Converse, P. E., Miller, W. E., & Stokes, D. E. (1960). The American voter. Chicago: University of Chicago Press.
Converse, P. E. (1962). Information flow and the stability of partisan attitudes. Public Opinion Quarterly, 26, 578-599.
Converse, P. E. (1976). The dynamics of party support: Cohort-analyz- ing party identification. Beverly Hills, CA: Sage.
Cooper, H. M. (1979). Statistically combining independent studies: A meta-analysis of sex differences in conformity research. Journal of Personality and Social Psychology, 37, 131-146.
Crewe, I., Sarlvik, C., & Alt, J. (1977). Partisan dealignment in Britain 1964-1974. British Journal of Political Science, 7, 129-190.
Cutler, N. E. (1974). Aging and generations in politics: The conflict of explanations and inference. In A. R. Wilcox (Ed.), Public opinion and political attitudes (pp. 440-462). New York: Wiley. •
Dennis, J. (1973). Socialization to politics: A reader. New York: Wiley. Eagly, A. H., & Carli, L. L. (1981). Sex of researchers and sex-typed
communications as determinants of sex differences in influence.abil- ity: A meta-analysis of social influence studies. Psychological Bulle- tin, 90, 1-20.
Easton, D., & Dennis, J. (1969). Children in the political system: Ori- gins of political legitimacy, New York: McGraw-Hill.
Franklin, C. H. (1984). Issue preferences, socialization, and the evolu- tion of party identification. American Journal of Political Science, 28, 459-478.
Gergen, K. J., & Back, K. W. (1966). Communication in the interview and the disengaged respondent. Public Opinion Quarterly, 30, 385- 398.
Glenn, N. D. (1969). Aging, disengagement, and opinionation. Public Opinion Quarterly, 33, 17-33.
AGING AND SUSCEPTIBILITY TO ATTITUDE CHANGE 425
Glenn, N. D. (1974). Aging and conservatism. Annals of the Academy of Political and Social Science, 415, 176-186.
Glenn, N. D. (1980). Values, attitudes, and beliefs. In O. G. Brim & J. Kagan (Eds.), Constancy and change in human development (pp. 596-640). Cambridge, MA: Harvard University Press.
Greenstein, E I. (1965). Children and politics. New Haven, C'12. Yale University Press.
Heise, D. R. (1969). Separating reliability and instability in test-retest correlations. American Sociological Review, 34, 93-101.
Hess, R. D., & Torney, J. V. (1967). The development of political atti- tudes in children. Chicago: Aldine.
Hovland, C. I. (1959). Reconciling conflicting results derived from ex- perimental and survey studies of attitude change. American Psycholo- gist, 14, 8-17.
Hovland, C. I., & Janis, I. L. (1959). Personality andpersuasibility. New Haven, CT: Yale University Press.
Jagodzinski, W., Kuhnel, S. M., & Sehmidt, P. (1987). Is there a "So- cratic effect" in nonexperimental panel studies? Sociological Meth- ods and Research, 15, 259-302.
Jennings, M. K. (1988, April). Educational stratification and political development in the Vietnam generation. Paper presented at the annual meeting of the Midwest Political Science Association, Chicago.
Jennings, M. K., & Markus, G. B. (1984). Partisan orientations over the long haul: Results from the three-wave political socialization panel study. American Political Science Review, 78, 1000-1018.
Jennings, M. K., & Niemi, R. G. (1978). The persistence of political orientations: An overtime analysis of two generations. British Journal of Political Science, 8, 333- 363.
Jennings, M. K., & Niemi, R. G. (1981). Generations and politics. Princeton, NJ: Princeton University Press.
Joreskog, IC G., & Sorbom, D. (1978). LISREL: Analysis of linear struc- tural relationships by the method of maximum likelihood. Chicago: National Educational Resources.
Krosniek, J. A. (1988). Attitude importance and attitude change. Jour- nal of Experimental Social Psychology,, 24, 240-255.
Krosnick, J. A., & Alwin, D. E (1989). Symbolic versus non-symbolic political attitudes: Is there a distinction? Unpublished manuscript, Ohio State University, Columbus.
Mannheim, K. (1952). The problem of generations. In P. Kecskemeti (Ed.), Essays on the sociology of knowledge (pp. 276-322). London: Routiedge & Kegan Paul.
Markus, G. B. (1979). The political environment and the dynamics of public attitudes: A panel study. American Journal of Political Science, 23, 338-359.
Mueller, J. E. (1973). Wars, presidents, and public opinion. New York: Wiley.
Newcomb, T M. (1943). Personality and social change: Attitude forma- tion in a student community. New York: Holt.
Newcomb, T. M., Koenig, K. E., Hacks, R., & Warwick, D. P. (1967).
Persistence and change: Bennington College and its students after 25 years. New York: Wiley.
Nunn, C. Z., Crockett, H. J., & Williams, J. A. (1978). Tolerance for nonconformity. San Francisco: Jossey-Bass.
Petty, R. E., & Cacioppo, J. T. (1979). Issue involvement can increase or decrease persuasion by enhancing message-relevant cognitive re- sponses. Journal of Personality and Social Psycholog?z, 37, 1915- 1926.
Ragosa, D. (1988). Myths about longitudinal research. In K. W. Schaie, R. T Campbell, W. M. Meredith, & S. C. Rawlings (Eds.), Method- ological issues in aging research (pp. 171-209). New York: Springer.
Riley, M. W. (1973). Aging and cohort succession: Interpretations and misinterpretations. Public Opinion Quarterly, 37, 35-49.
Saris, W. E., & Putte, B. V. D. (1988). True score or factor models. Sociological Methods and Research, 17, 123-157.
Searing, D., Wright, G., & Rabinowitz, G. (1976). The primacy princi- ple: Attitude change and political socialization. British Journal of Po- litical Science, 6, 83-113.
Sears, D. O. (1975). Political socialization. In E I. Greenstein & N. W. Polsby (Ede.), Handbook of political science (pp. 96-136). Reading, MA: Addison-Wesley.
Sears, D. O. (1981). Life stage effects on attitude change, especially among the elderly. In S. B. Kiesler, J. N. Morgan, & V. K. Oppenhei- mer (Eds. ), Aging: Social change (pp. 183-204). New York: Academic Press.
Sears, D. O. (1983). The persistence of early political predispositions: The roles of attitude object and life stage. In L. Wheeler (Ed.), Review of personality and social psychology (Vol. 4, pp. 79-116). Beverly Hills, CA: Sage.
Sears, D. O. (1986). College sophomores in the laboratory: Influences of a narrow data base on social psyehology's view of human nature. Journal of Personality and Social Psychology,, 51, 515-530.
Stember, H. (1951-1952). Which respondents are reliable? Interna- tional Journal of Opinion and Attitude Research, 5, 474--479.
Wheaton, B., Muthen, B., Alwin, D. E, & Summers, G. E (1977). As- sessing reliability and stability in panel models. In D. R. Heise (Ed.), Sociological methodology 1977 (pp. 85-136). San Francisco: Jossey- Bass.
Wiley, D. E., & Wiley, J. A. (1970). The estimation of measurement error in panel data. American Sociological Review,, 35, 112-117.
Wolfinger, R. E., & Rosenstone, S. J. (1980). Who votes? New Haven, C12. Yale University Press.
Wood, W. (1982). Retrieval of attitude-relevant information from mem- ory: Effects on susceptibility to persuasion and on intrinsic motiva- tion. Journal of Personality and Social Psychology, 42, 798-810.
Zaller, J. R. (1987). Diffusion of political attitudes. Journal of Personal- ity and Social Psychology 53, 821-833.
Received November 14, 1988 Revision received March 27, 1989
Accepted March 27, 1989 •