Embed Size (px)
Citation preview
Aging with and into Physical Disabilities
Ivan R. Molton, Ph.D.University of Washington Medical Center
These slides are the intellectual property of the presenter and the University of Washington and may not be used without permission.
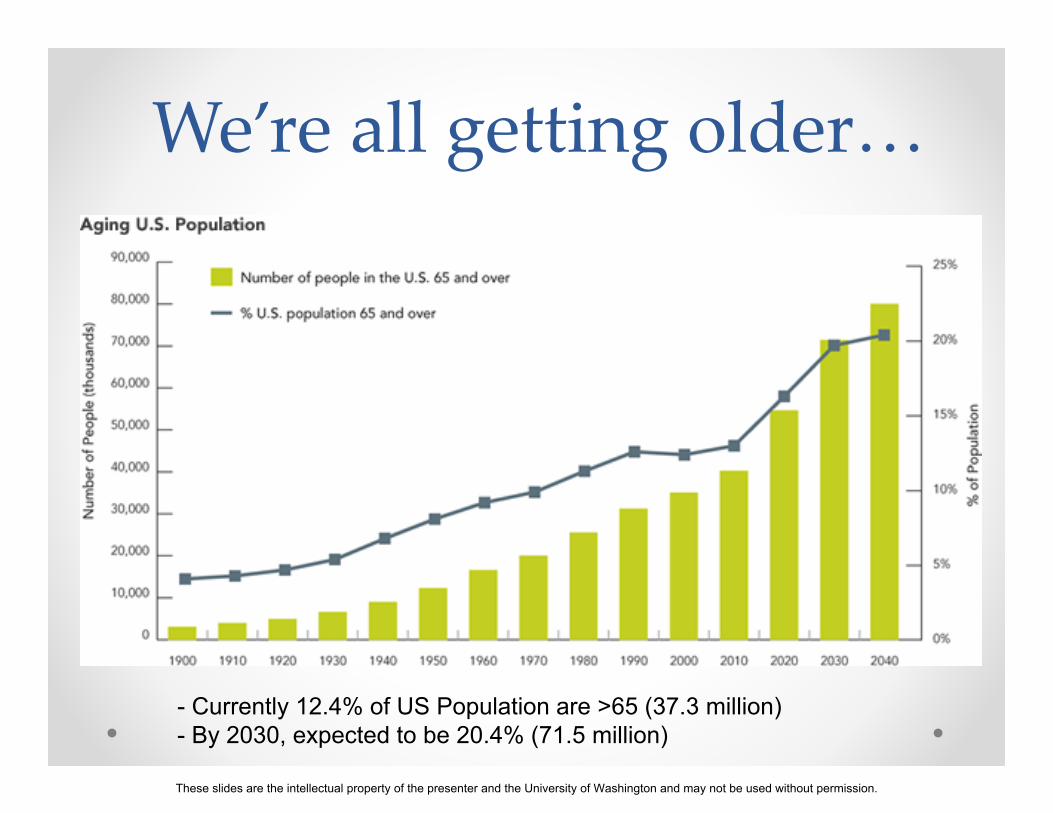
We’re all getting older…
- Currently 12.4% of US Population are >65 (37.3 million)- By 2030, expected to be 20.4% (71.5 million)
These slides are the intellectual property of the presenter and the University of Washington and may not be used without permission.
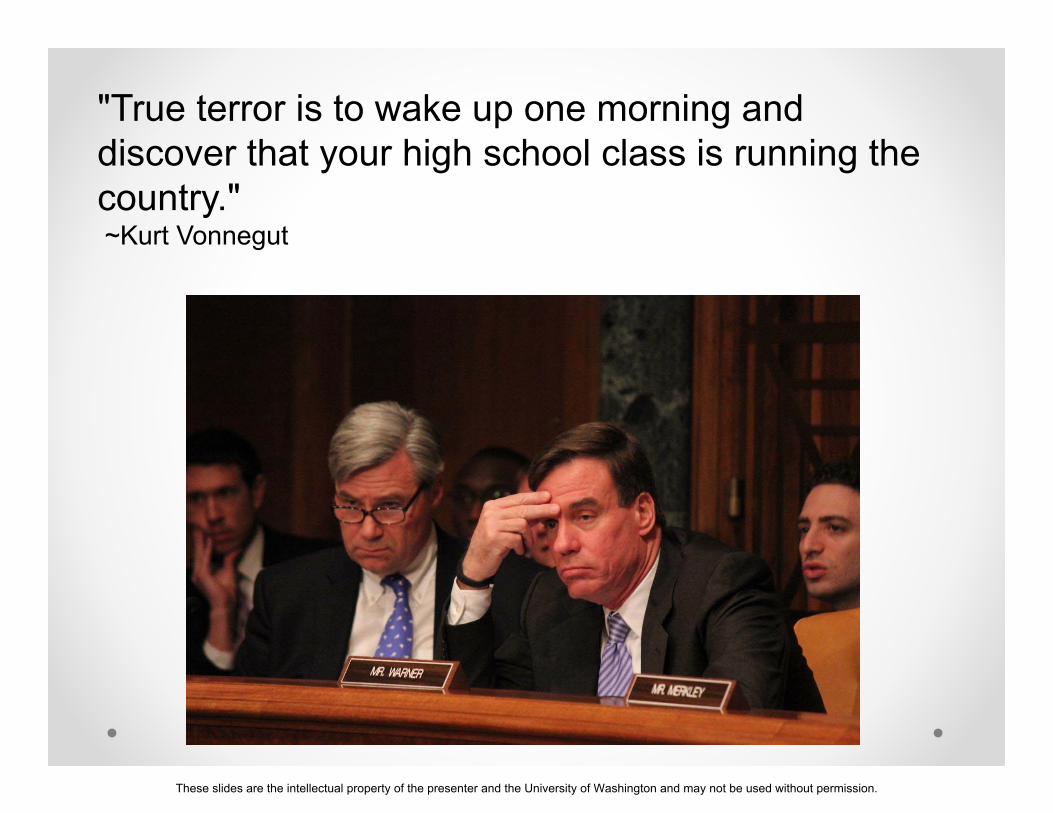
"True terror is to wake up one morning and discover that your high school class is running the country."~Kurt Vonnegut
These slides are the intellectual property of the presenter and the University of Washington and may not be used without permission.
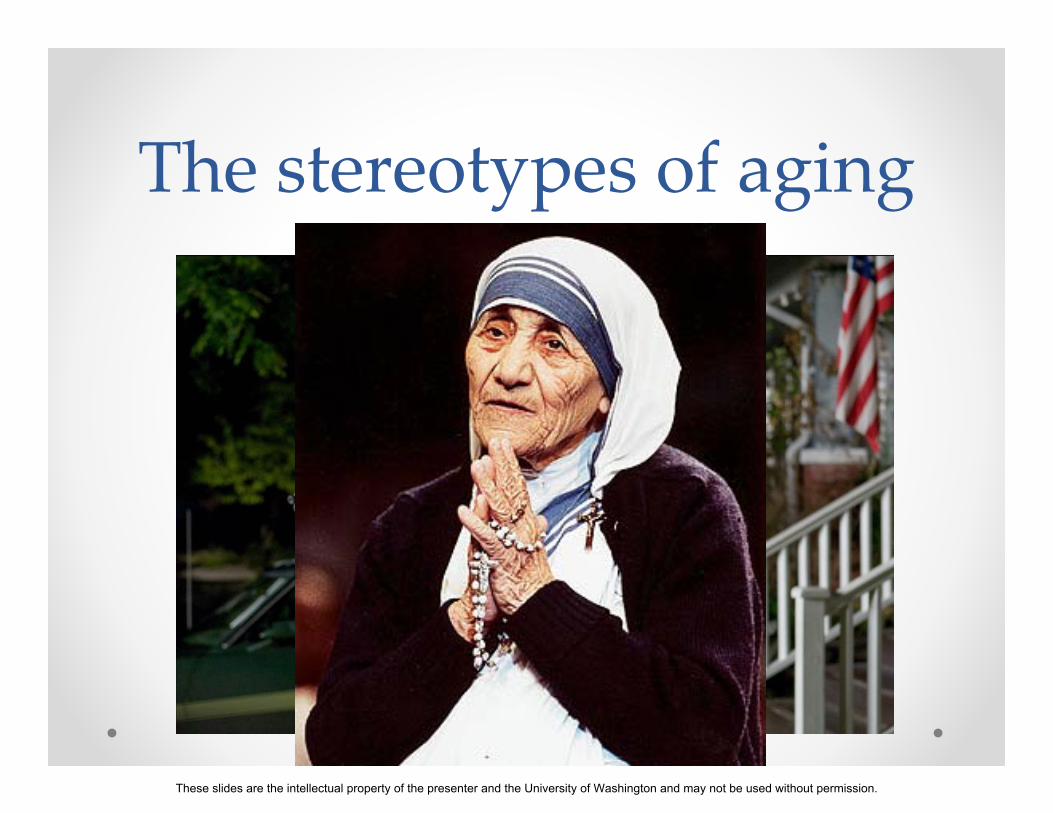
The stereotypes of aging
These slides are the intellectual property of the presenter and the University of Washington and may not be used without permission.
Older adults are only the “same” in that they’re so
“different”• Older adults show more
intergroup variability than do younger adults in almost all areaso physical functioning and capabilityo cognitive abilities
• Crystallized intelligence• Complex reasoning and problem-solving
o emotional functioning• Depression, anxiety, happiness
These slides are the intellectual property of the presenter and the University of Washington and may not be used without permission.
Employment is one area of variability
• In 1995, 30% of those over 55 had some gainful employment
• In 2016, the number was closer to 40%• Most of this increase has been in the last 10 years• Unemployment rate for people over 55 is 3.8% (in
2/16), lower than national rate (4.9%)
These slides are the intellectual property of the presenter and the University of Washington and may not be used without permission.
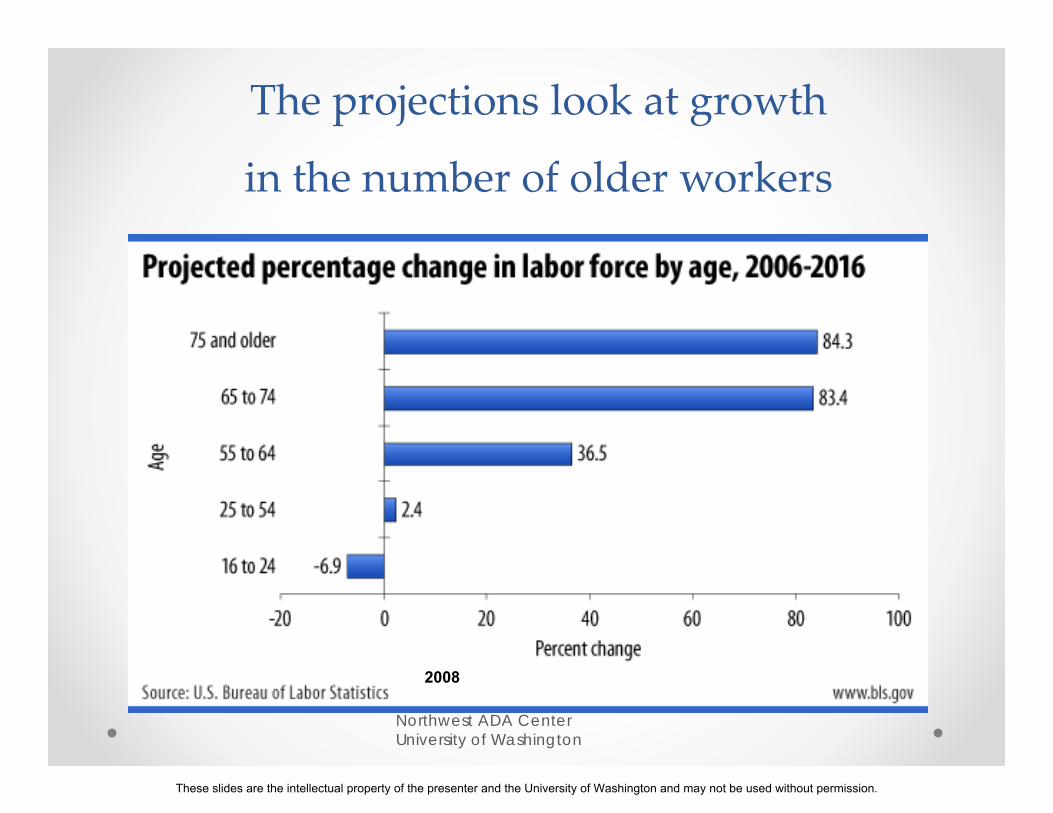
The projections look at growth
in the number of older workers
Northwest ADA Center University of Washington
2008
These slides are the intellectual property of the presenter and the University of Washington and may not be used without permission.
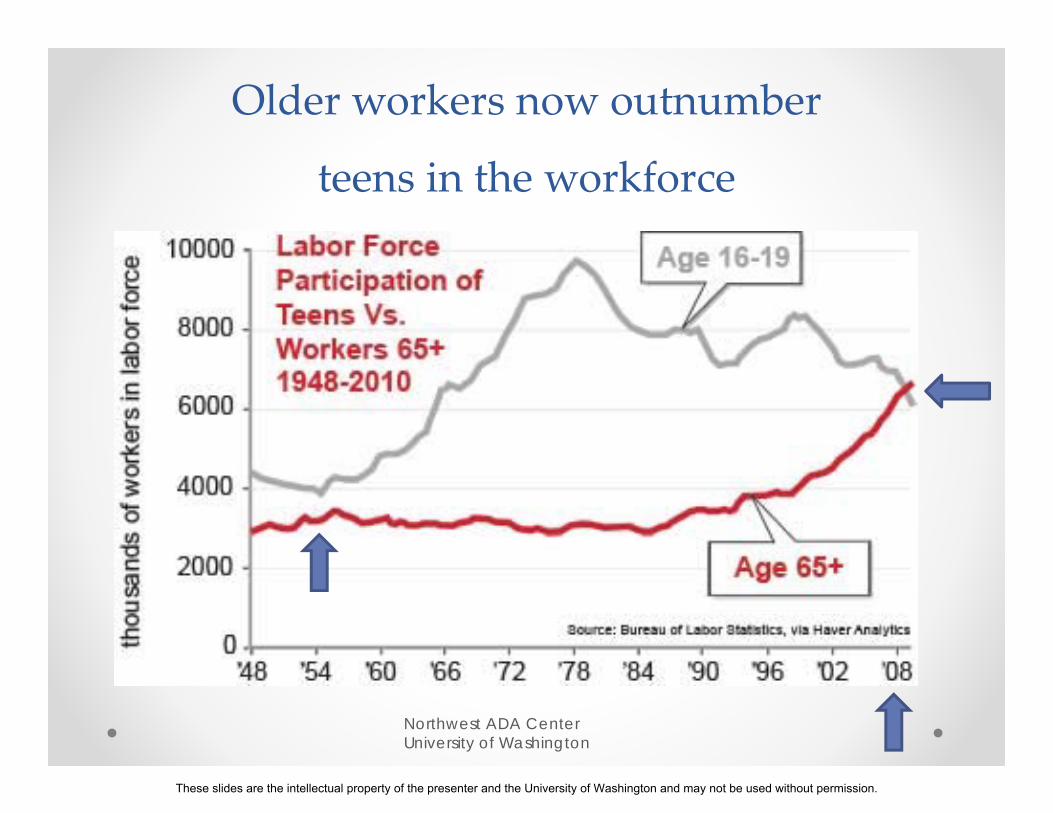
Older workers now outnumber
teens in the workforce
Northwest ADA Center University of Washington
These slides are the intellectual property of the presenter and the University of Washington and may not be used without permission.
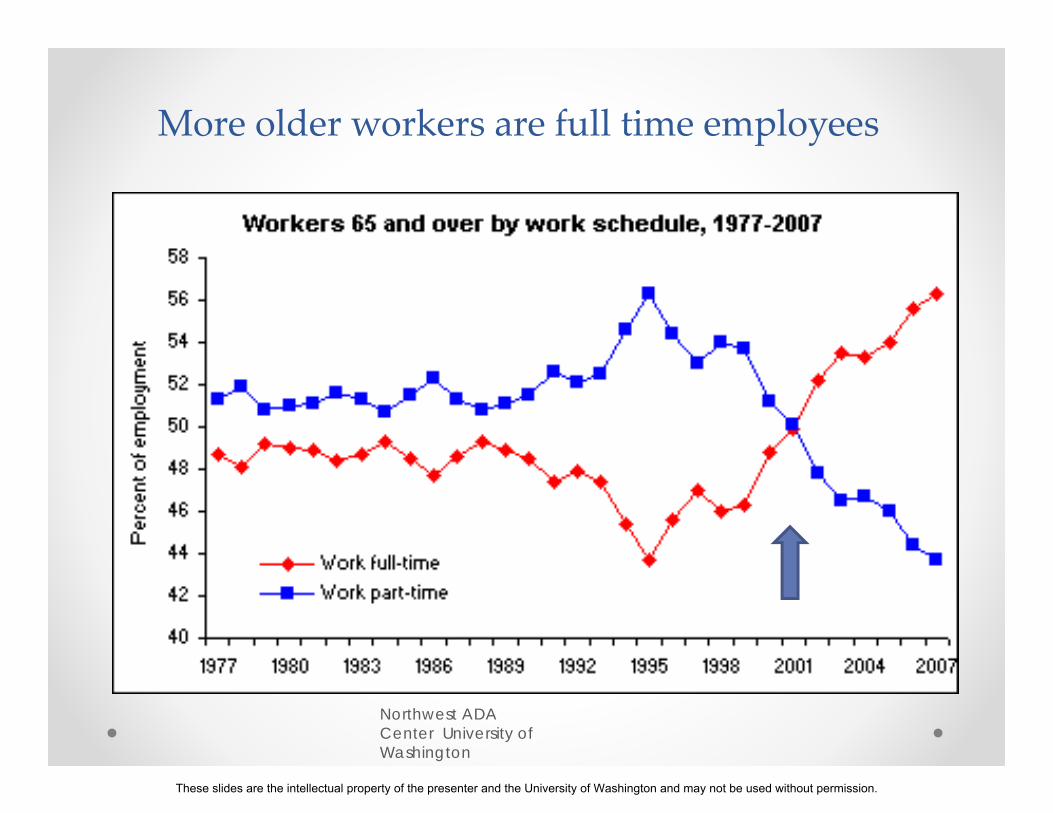
More older workers are full time employees
Bureau of Labor Statistics 2008
Northwest ADA Center University of Washington
These slides are the intellectual property of the presenter and the University of Washington and may not be used without permission.
Ageism is alive and well in the workplace
• In the US, age discrimination claims have gone from 15,785 in 1997 to 21,396 in 2013
• Those age 55 and up spend 10 to 11 months looking for new work after leaving a job, compared with about four to seven months for workers age 16 to 34.
• Increasing age is associated witho More frequent firingo Lack of hiringo Perceived lack of support of supervisors
• Identified stereotypes among employers:o Older workers are “incompetent”, “behind” and “disengaged”
• Fears among older workers:o Tech is too advanced
• Perceived ageism in the workplace is associated witho Poorer job satisfaction, commitment and engagement
These slides are the intellectual property of the presenter and the University of Washington and may not be used without permission.

Some “helpful” tips
These slides are the intellectual property of the presenter and the University of Washington and may not be used without permission.
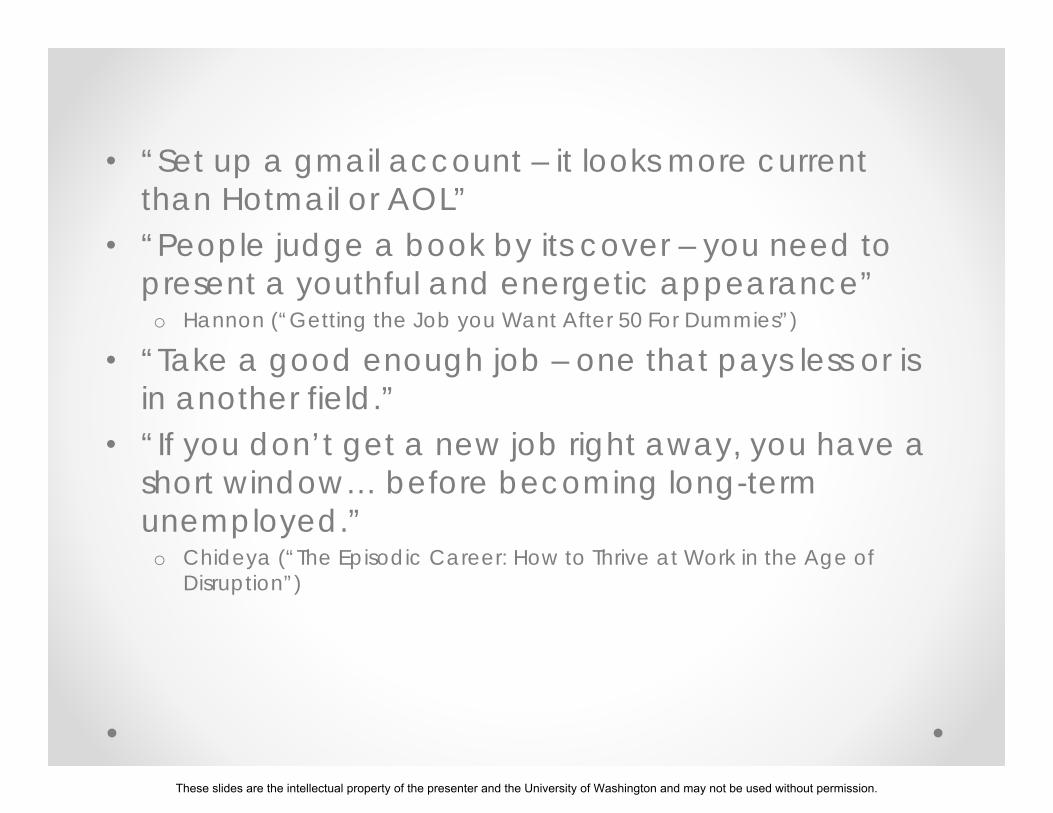
• “Set up a gmail account – it looks more current than Hotmail or AOL”
• “People judge a book by its cover – you need to present a youthful and energetic appearance”
o Hannon (“Getting the Job you Want After 50 For Dummies”)
• “Take a good enough job – one that pays less or is in another field.”
• “If you don’t get a new job right away, you have a short window… before becoming long-term unemployed.”
o Chideya (“The Episodic Career: How to Thrive at Work in the Age of Disruption”)
These slides are the intellectual property of the presenter and the University of Washington and may not be used without permission.
Aging “into” and aging “with” physical disabilities
These slides are the intellectual property of the presenter and the University of Washington and may not be used without permission.
Aging “into” disability• All these new older adults mean a
greater incidence of new-onset disabling conditionso Osteoarthritis, MI, stroke, falls, amputation
• Over age 65, 2/3rds suffer from multiple chronic conditions contributing to disability
• These individuals utilize 65% of the US healthcare budget
These slides are the intellectual property of the presenter and the University of Washington and may not be used without permission.
These slides are the intellectual property of the presenter and the University of Washington and may not be used without permission.
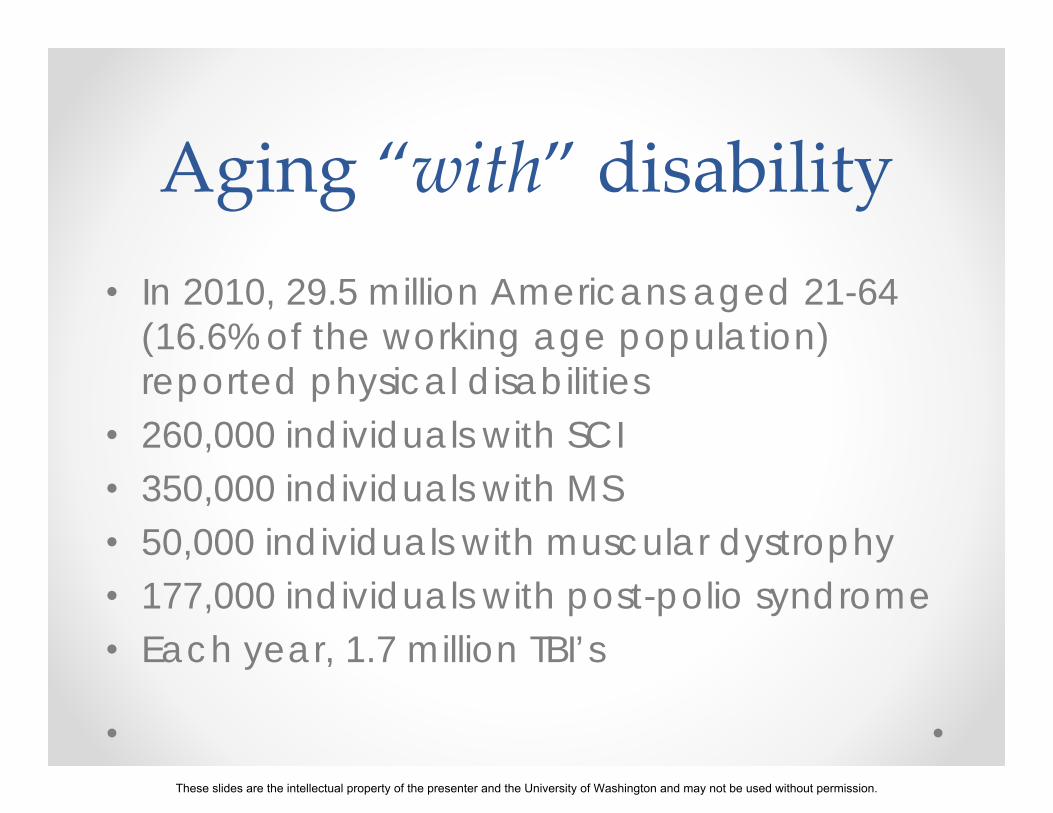
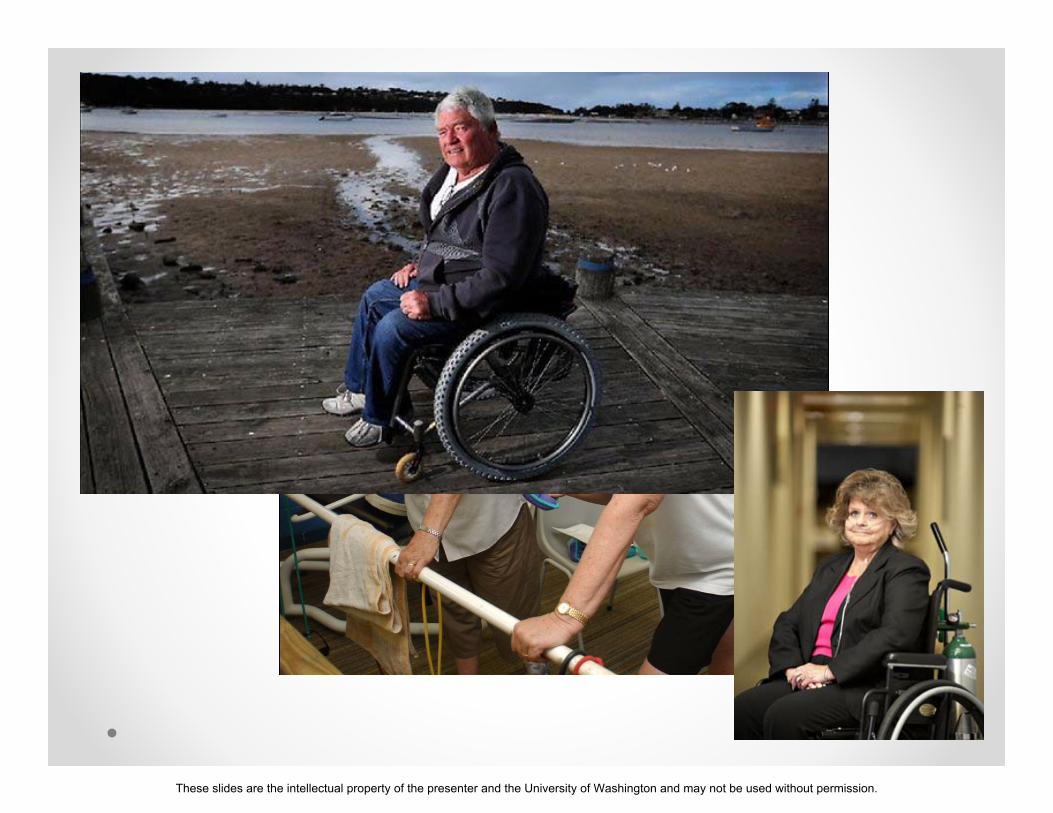
Aging “with” disability• In 2010, 29.5 million Americans aged 21-64
(16.6% of the working age population) reported physical disabilities
• 260,000 individuals with SCI• 350,000 individuals with MS• 50,000 individuals with muscular dystrophy• 177,000 individuals with post-polio syndrome• Each year, 1.7 million TBI’s
These slides are the intellectual property of the presenter and the University of Washington and may not be used without permission.
Aging with disability.
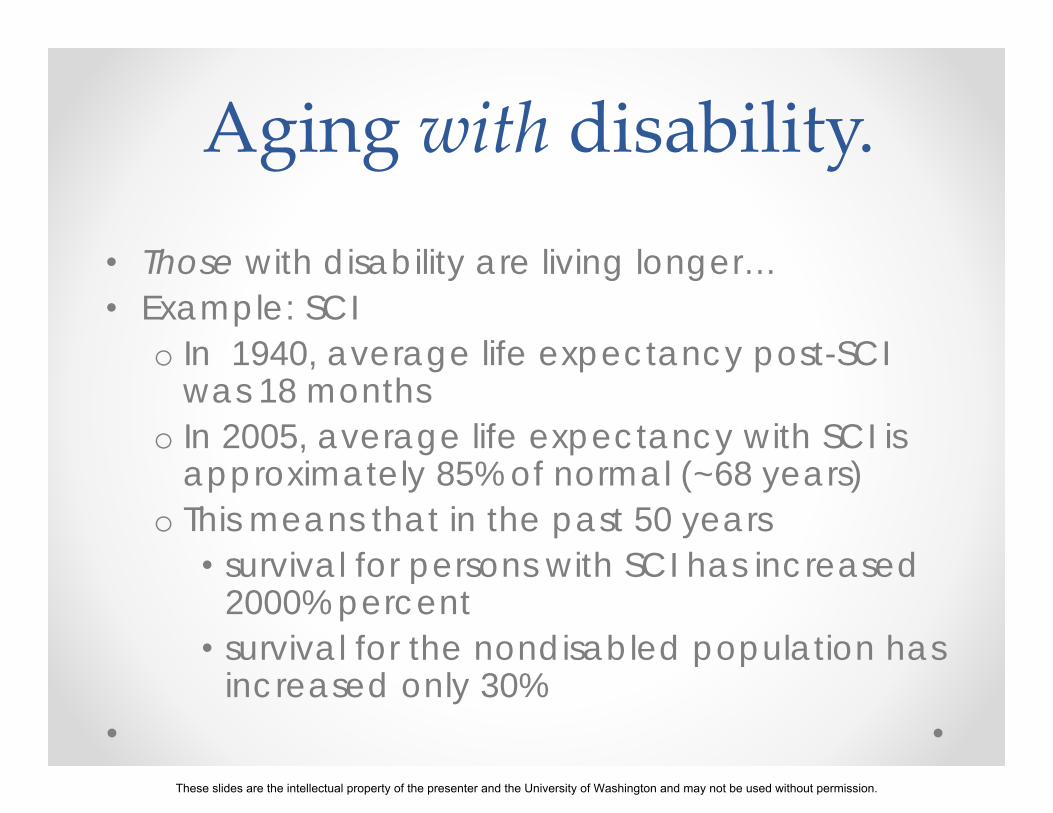
• Those with disability are living longer…• Example: SCI
o In 1940, average life expectancy post-SCI was 18 months
o In 2005, average life expectancy with SCI is approximately 85% of normal (~68 years)
o This means that in the past 50 years• survival for persons with SCI has increased
2000% percent • survival for the nondisabled population has
increased only 30%
These slides are the intellectual property of the presenter and the University of Washington and may not be used without permission.
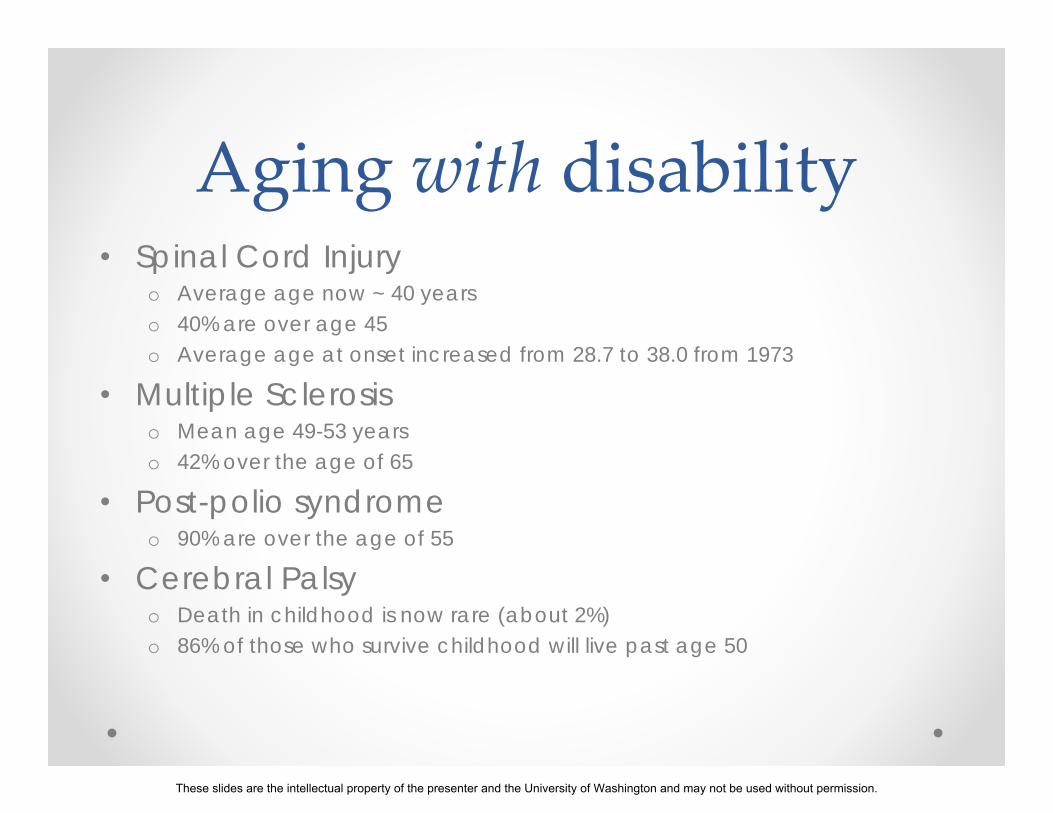
• Spinal Cord Injuryo Average age now ~ 40 yearso 40% are over age 45o Average age at onset increased from 28.7 to 38.0 from 1973
• Multiple Sclerosiso Mean age 49-53 yearso 42% over the age of 65
• Post-polio syndromeo 90% are over the age of 55
• Cerebral Palsyo Death in childhood is now rare (about 2%)o 86% of those who survive childhood will live past age 50
Aging with disability
These slides are the intellectual property of the presenter and the University of Washington and may not be used without permission.
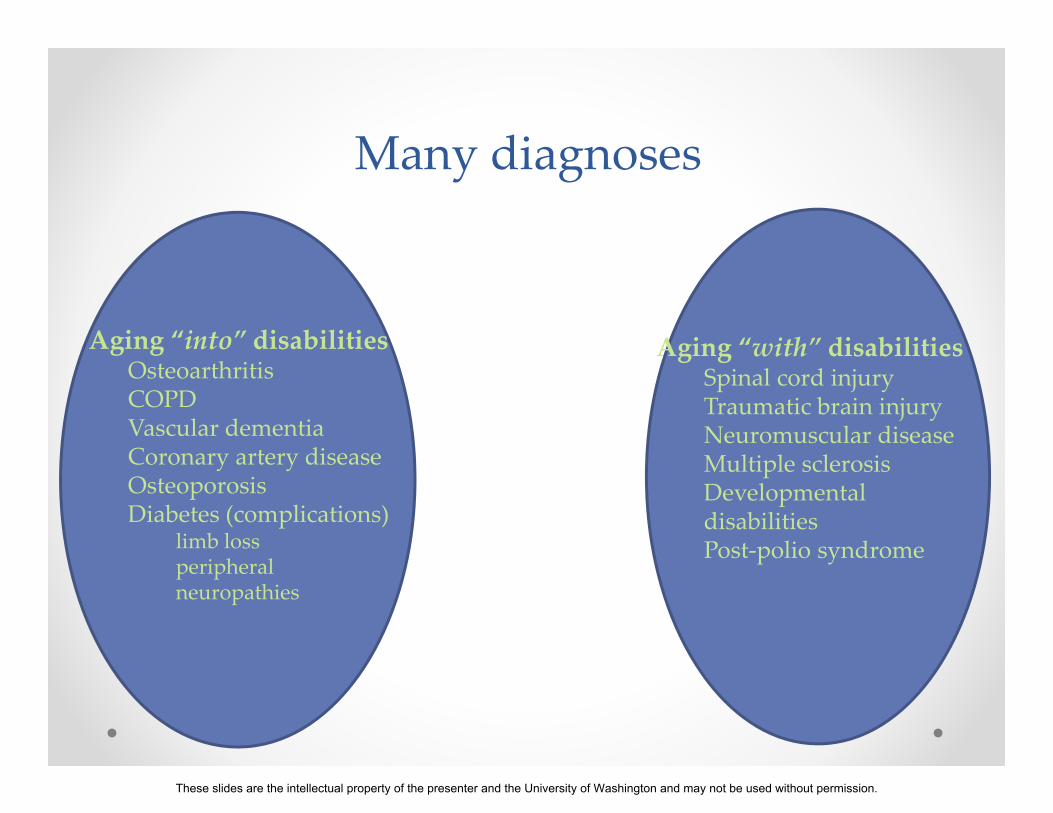
Many diagnoses
Aging “into” disabilitiesOsteoarthritisCOPDVascular dementiaCoronary artery diseaseOsteoporosisDiabetes (complications)
limb lossperipheral neuropathies
Aging “with” disabilitiesSpinal cord injuryTraumatic brain injuryNeuromuscular diseaseMultiple sclerosisDevelopmental disabilitiesPost‐polio syndrome
These slides are the intellectual property of the presenter and the University of Washington and may not be used without permission.
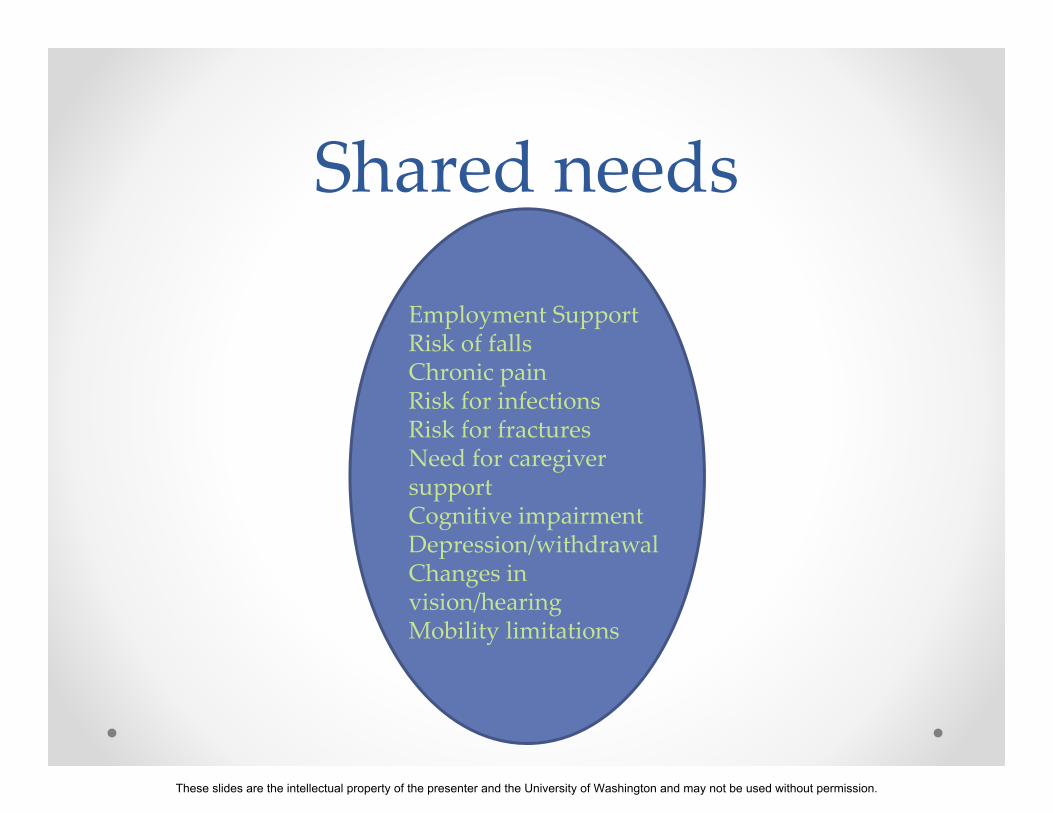
Shared needs
Employment SupportRisk of fallsChronic painRisk for infectionsRisk for fracturesNeed for caregiver supportCognitive impairmentDepression/withdrawalChanges in vision/hearingMobility limitations
These slides are the intellectual property of the presenter and the University of Washington and may not be used without permission.
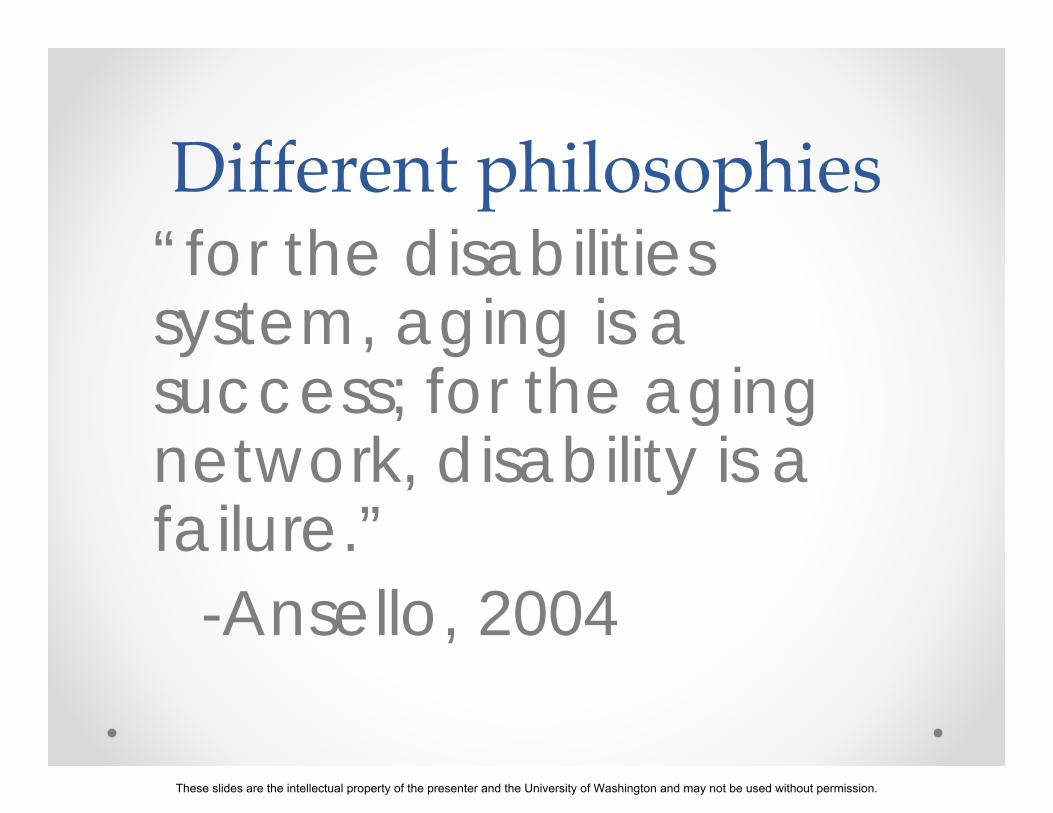
Different philosophies“for the disabilities system, aging is a success; for the aging network, disability is a failure.”
-Ansello, 2004
These slides are the intellectual property of the presenter and the University of Washington and may not be used without permission.
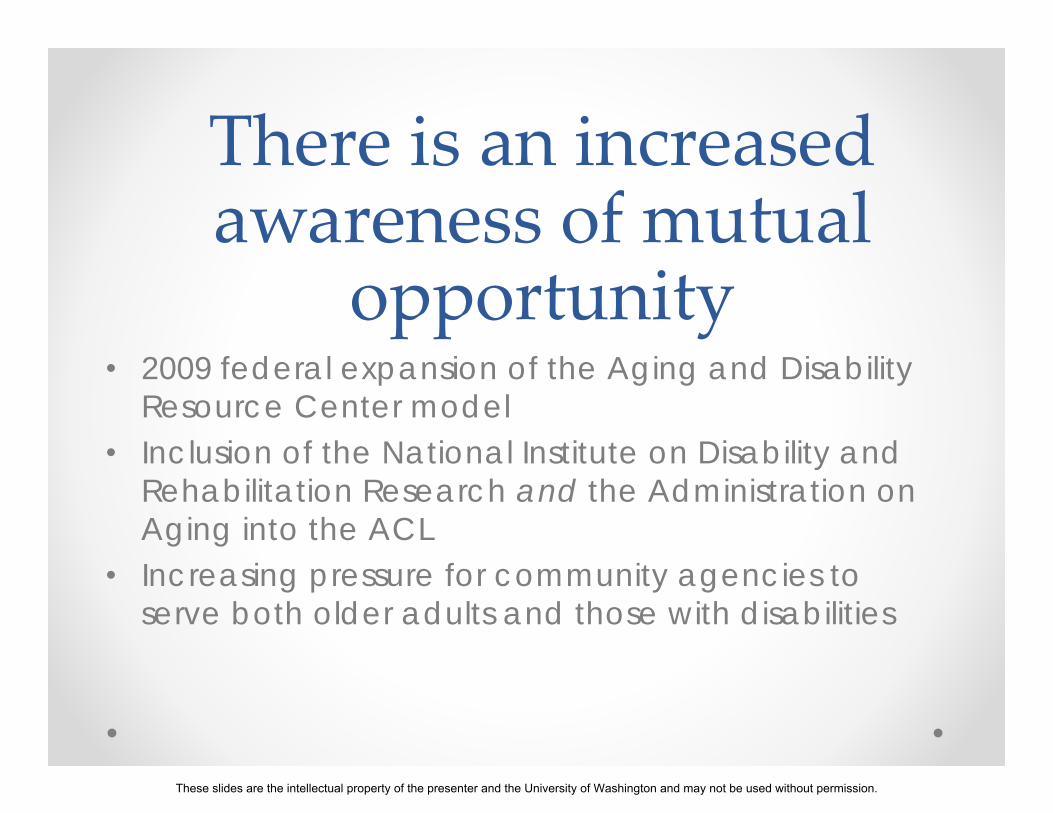
There is an increased awareness of mutual
opportunity• 2009 federal expansion of the Aging and Disability
Resource Center model• Inclusion of the National Institute on Disability and
Rehabilitation Research and the Administration on Aging into the ACL
• Increasing pressure for community agencies to serve both older adults and those with disabilities
These slides are the intellectual property of the presenter and the University of Washington and may not be used without permission.
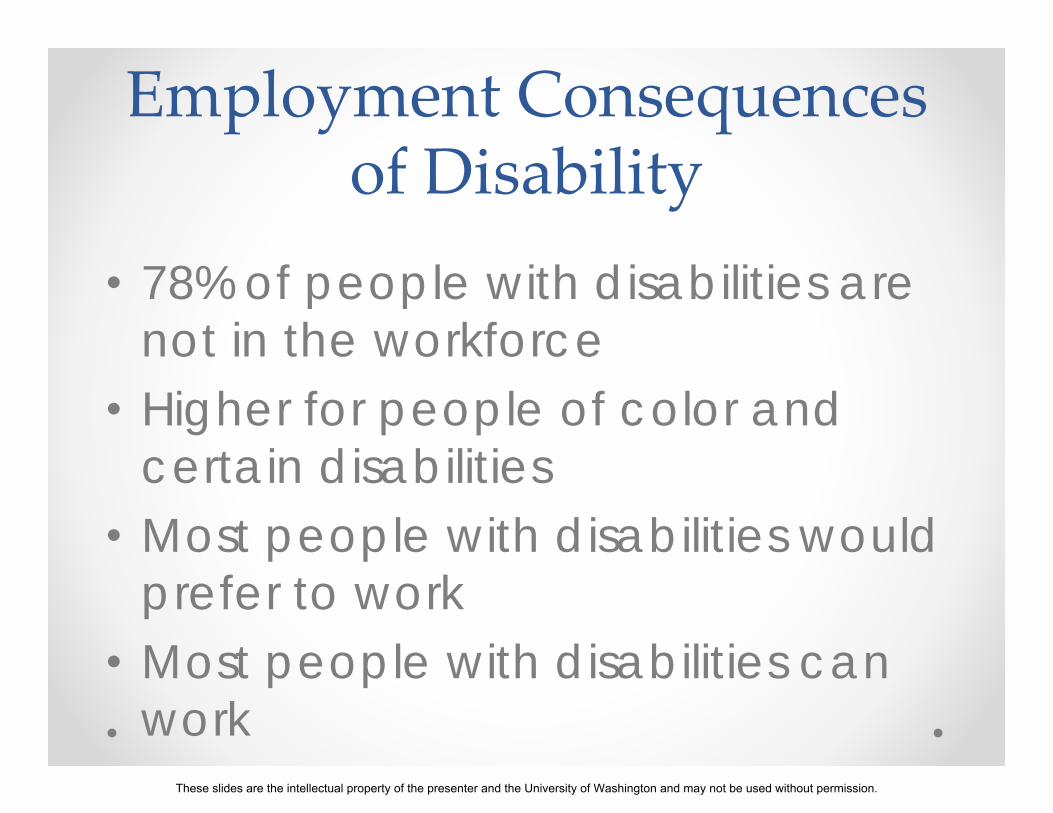
Employment Consequences of Disability
• 78% of people with disabilities are not in the workforce
• Higher for people of color and certain disabilities
• Most people with disabilities would prefer to work
• Most people with disabilities can work
These slides are the intellectual property of the presenter and the University of Washington and may not be used without permission.
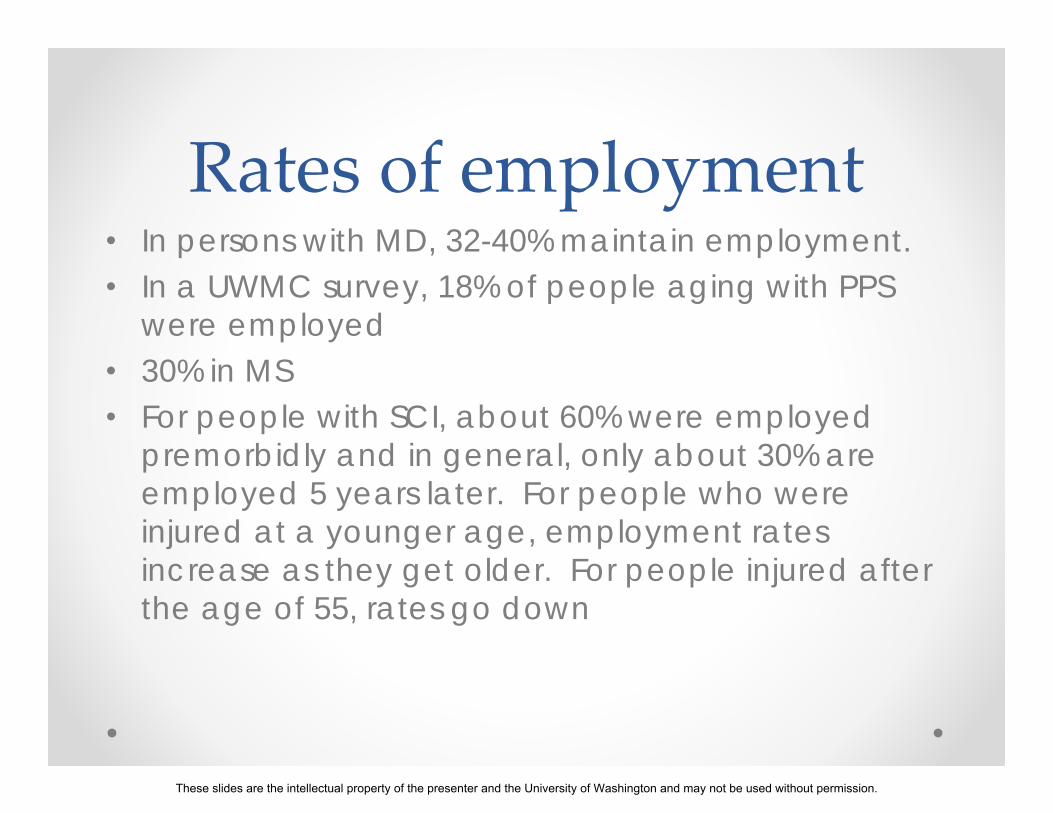
Rates of employment• In persons with MD, 32-40% maintain employment.• In a UWMC survey, 18% of people aging with PPS
were employed • 30% in MS• For people with SCI, about 60% were employed
premorbidly and in general, only about 30% are employed 5 years later. For people who were injured at a younger age, employment rates increase as they get older. For people injured after the age of 55, rates go down
These slides are the intellectual property of the presenter and the University of Washington and may not be used without permission.
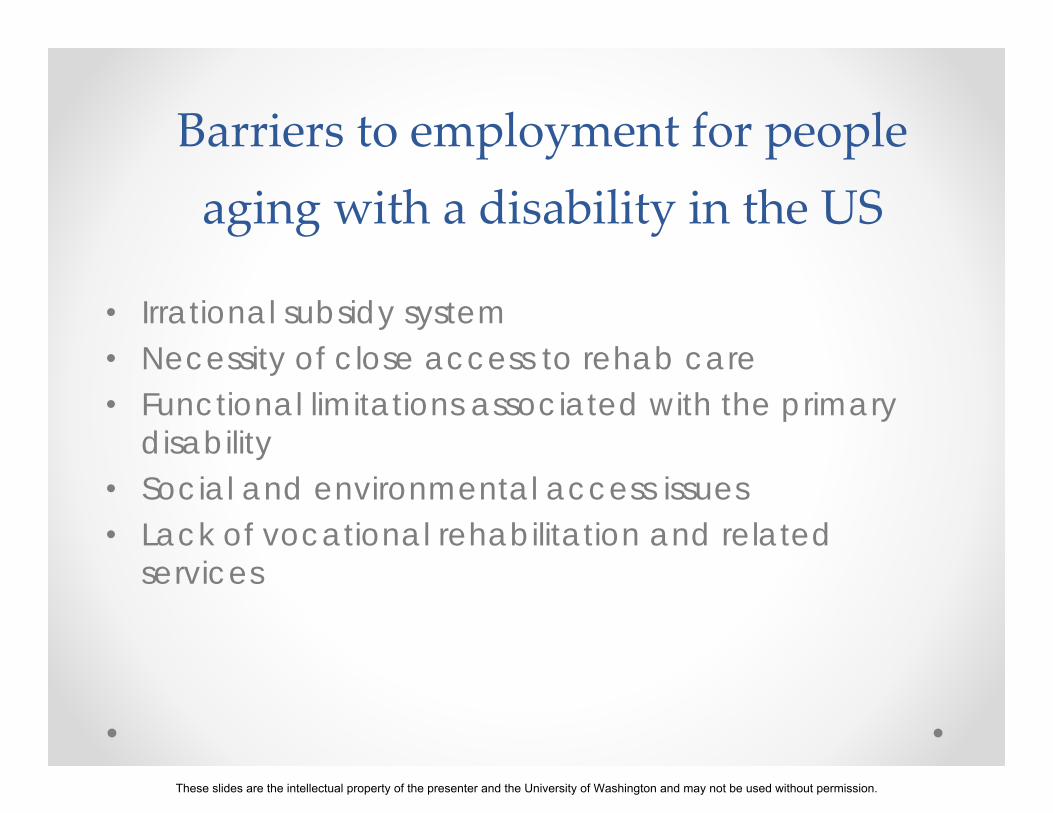
Barriers to employment for people aging with a disability in the US
• Irrational subsidy system• Necessity of close access to rehab care• Functional limitations associated with the primary
disability• Social and environmental access issues• Lack of vocational rehabilitation and related
services
These slides are the intellectual property of the presenter and the University of Washington and may not be used without permission.
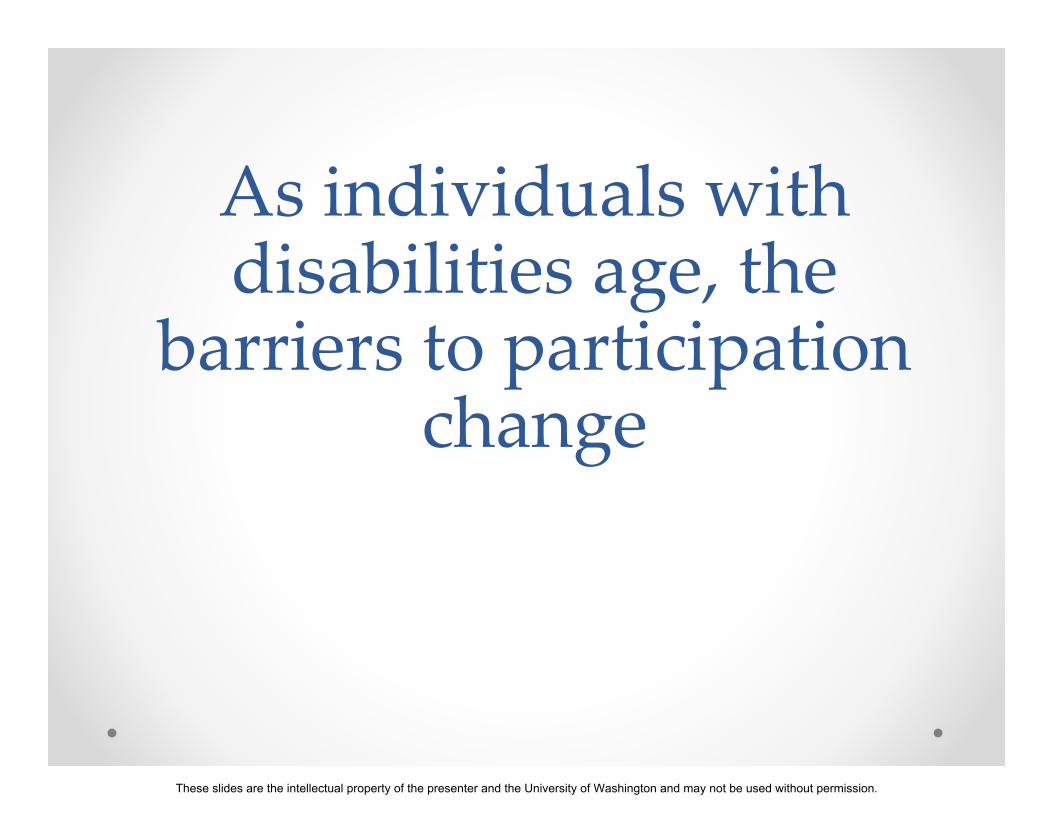
As individuals with disabilities age, the
barriers to participation change
These slides are the intellectual property of the presenter and the University of Washington and may not be used without permission.
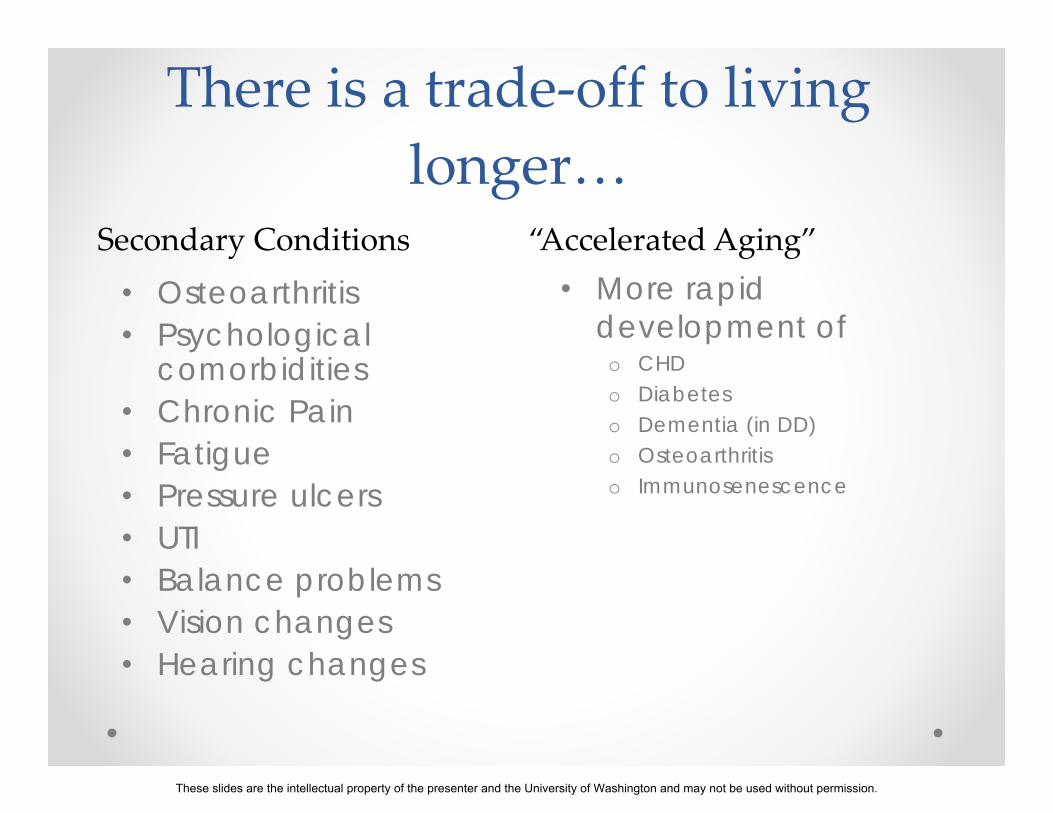
There is a trade‐off to living longer…
• Osteoarthritis• Psychological
comorbidities• Chronic Pain• Fatigue• Pressure ulcers• UTI• Balance problems• Vision changes• Hearing changes
• More rapid development of
o CHDo Diabeteso Dementia (in DD)o Osteoarthritiso Immunosenescence
Secondary Conditions “Accelerated Aging”
These slides are the intellectual property of the presenter and the University of Washington and may not be used without permission.
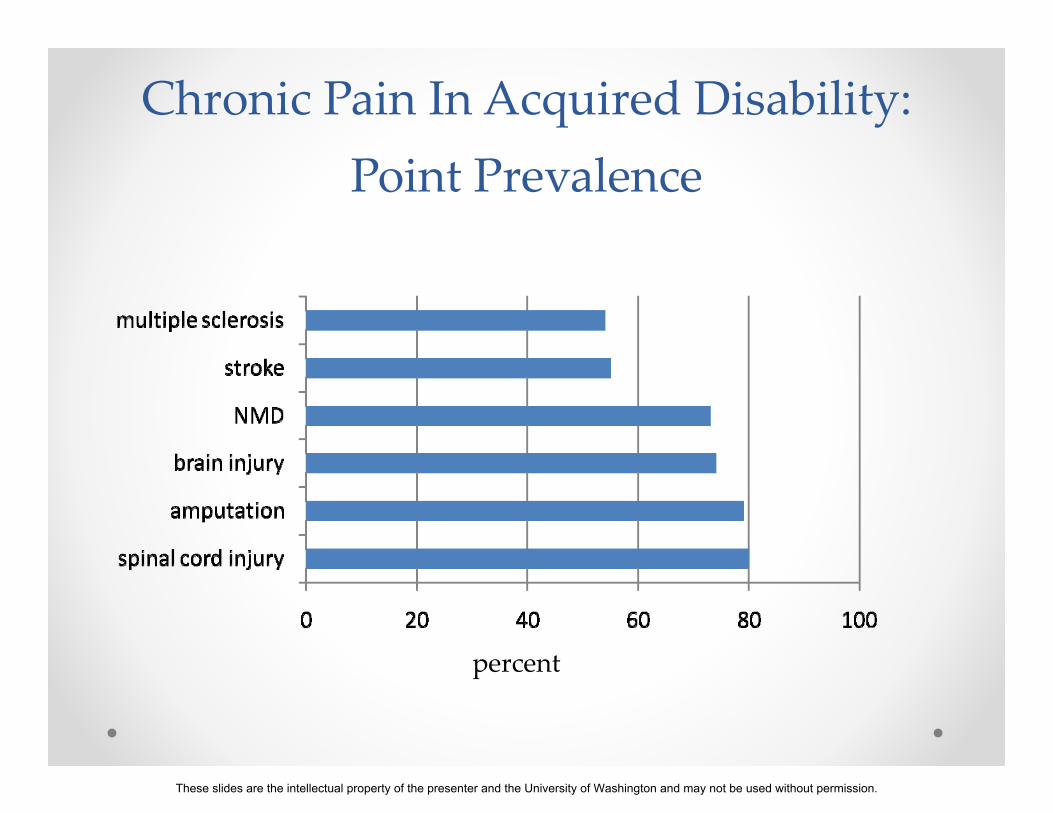
Chronic Pain In Acquired Disability:Point Prevalence
percent
These slides are the intellectual property of the presenter and the University of Washington and may not be used without permission.
These slides are the intellectual property of the presenter and the University of Washington and may not be used without permission.
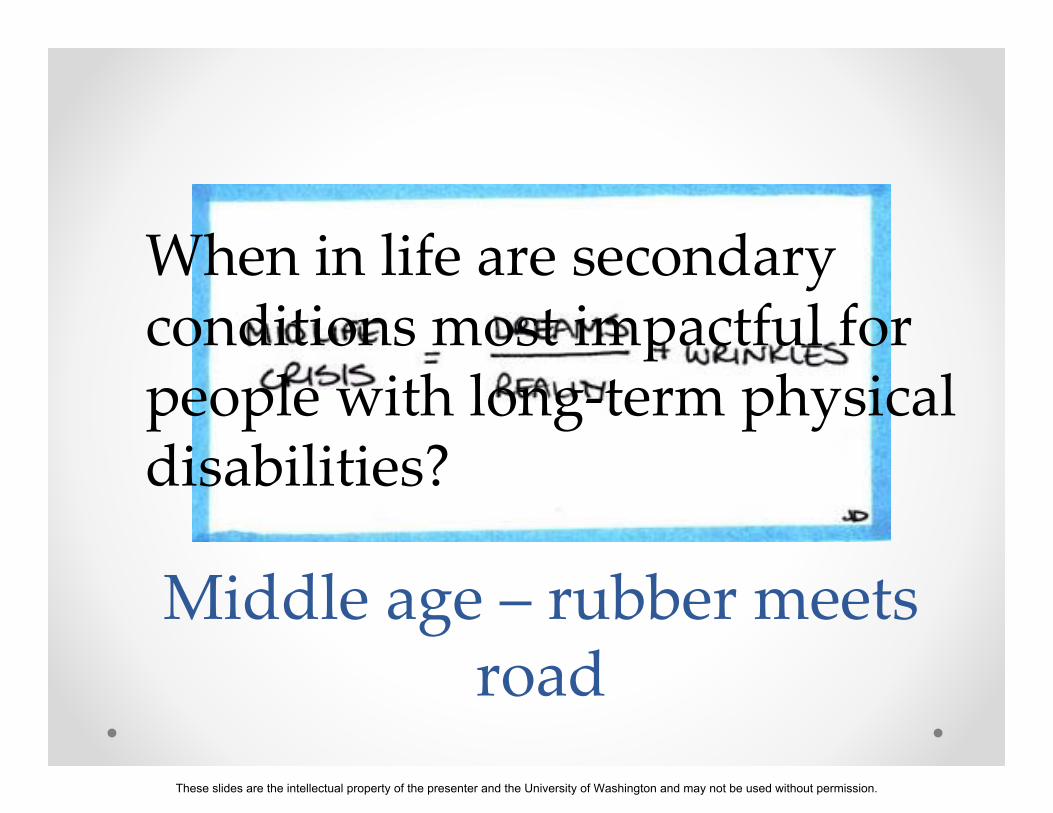
Middle age – rubber meets road
When in life are secondary conditions most impactful for people with long‐term physical disabilities?
These slides are the intellectual property of the presenter and the University of Washington and may not be used without permission.
• In nondisabled people, 45-64 is a stressful time o Peak financial burden, parenting
demands, pre-retirement planning, more “daily hassles”
• In people with disability, there is all of this plus worsening 2ndry health conditions, declining health, earlier involuntary retirement
These slides are the intellectual property of the presenter and the University of Washington and may not be used without permission.
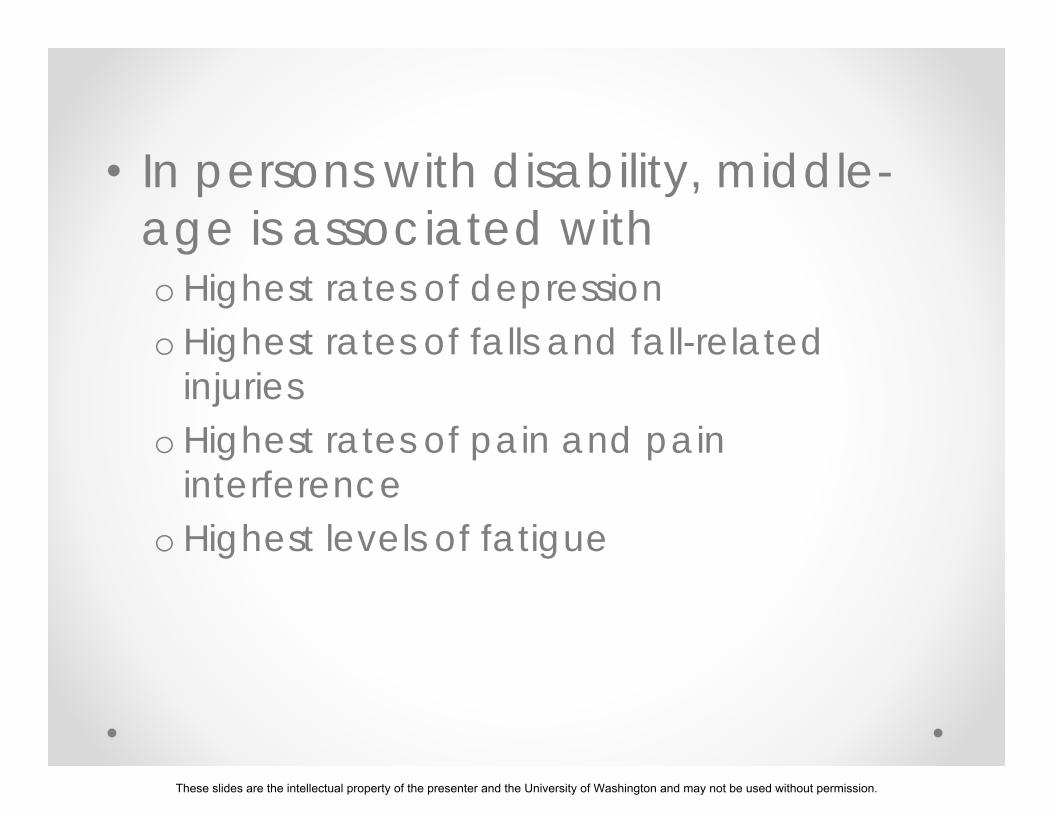
• In persons with disability, middle-age is associated witho Highest rates of depressiono Highest rates of falls and fall-related
injurieso Highest rates of pain and pain
interferenceo Highest levels of fatigue
These slides are the intellectual property of the presenter and the University of Washington and may not be used without permission.
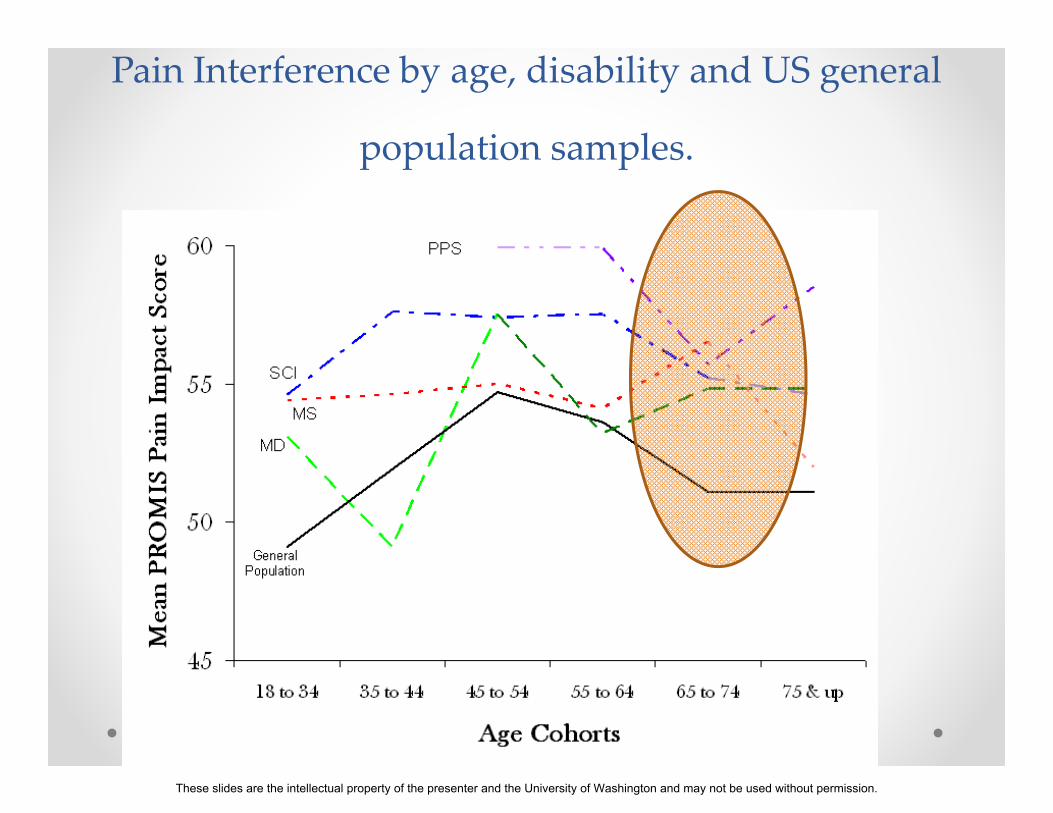
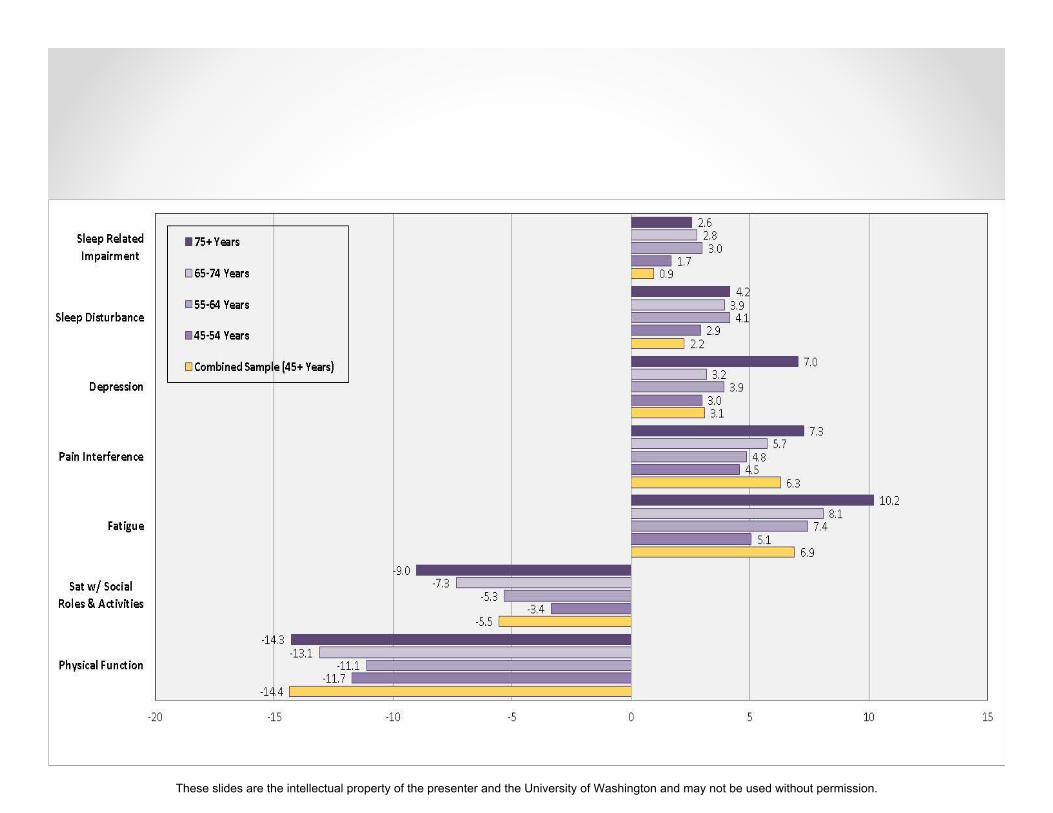
Pain Interference by age, disability and US general
population samples.
These slides are the intellectual property of the presenter and the University of Washington and may not be used without permission.
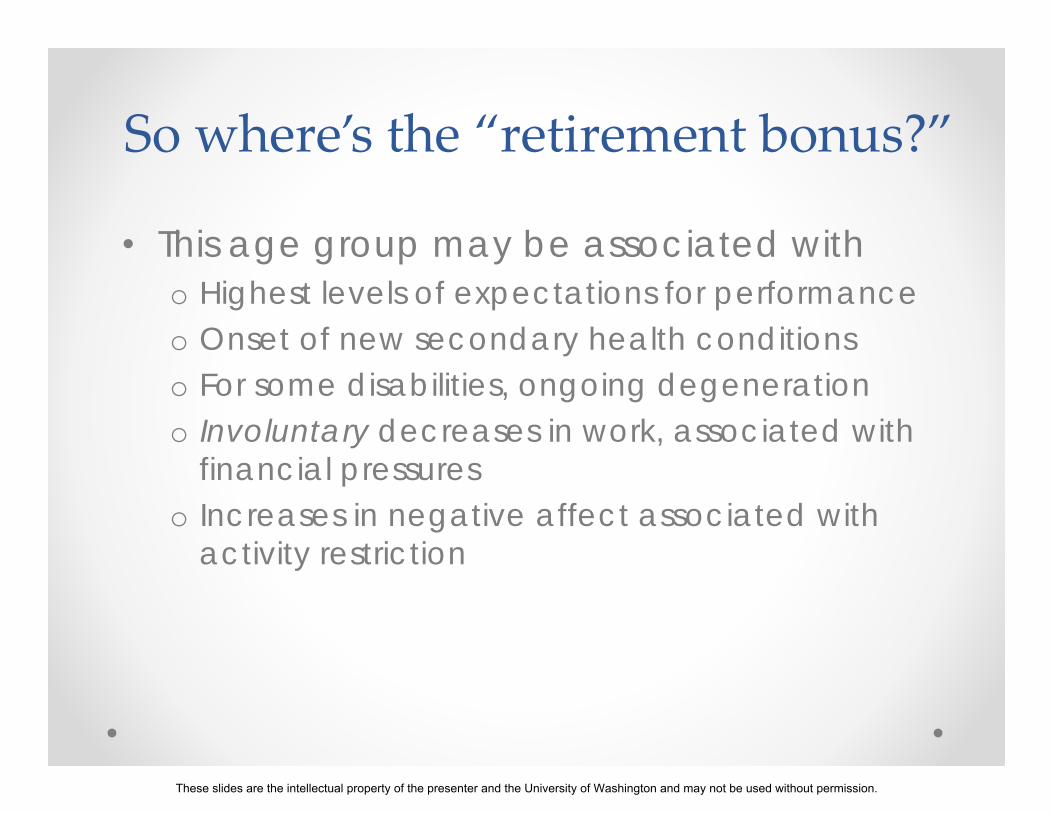
So where’s the “retirement bonus?”
• This age group may be associated witho Highest levels of expectations for performanceo Onset of new secondary health conditionso For some disabilities, ongoing degenerationo Involuntary decreases in work, associated with
financial pressureso Increases in negative affect associated with
activity restriction
These slides are the intellectual property of the presenter and the University of Washington and may not be used without permission.
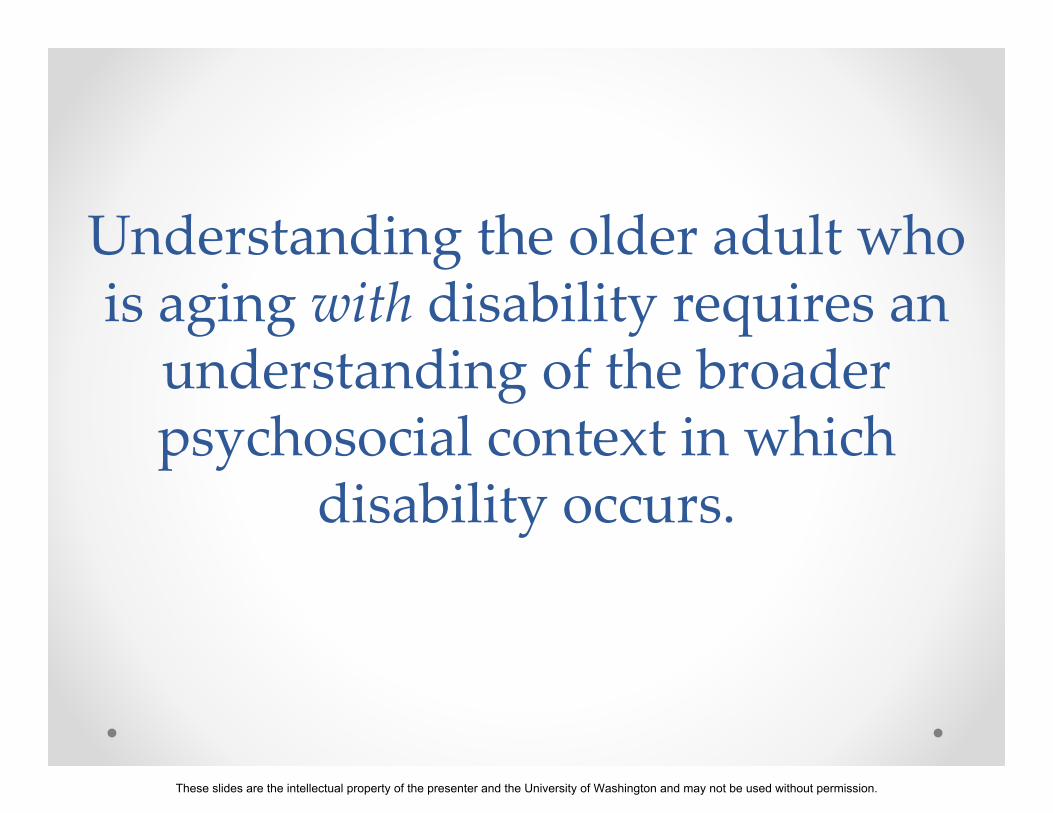
Understanding the older adult who is aging with disability requires an understanding of the broader psychosocial context in which
disability occurs.
These slides are the intellectual property of the presenter and the University of Washington and may not be used without permission.
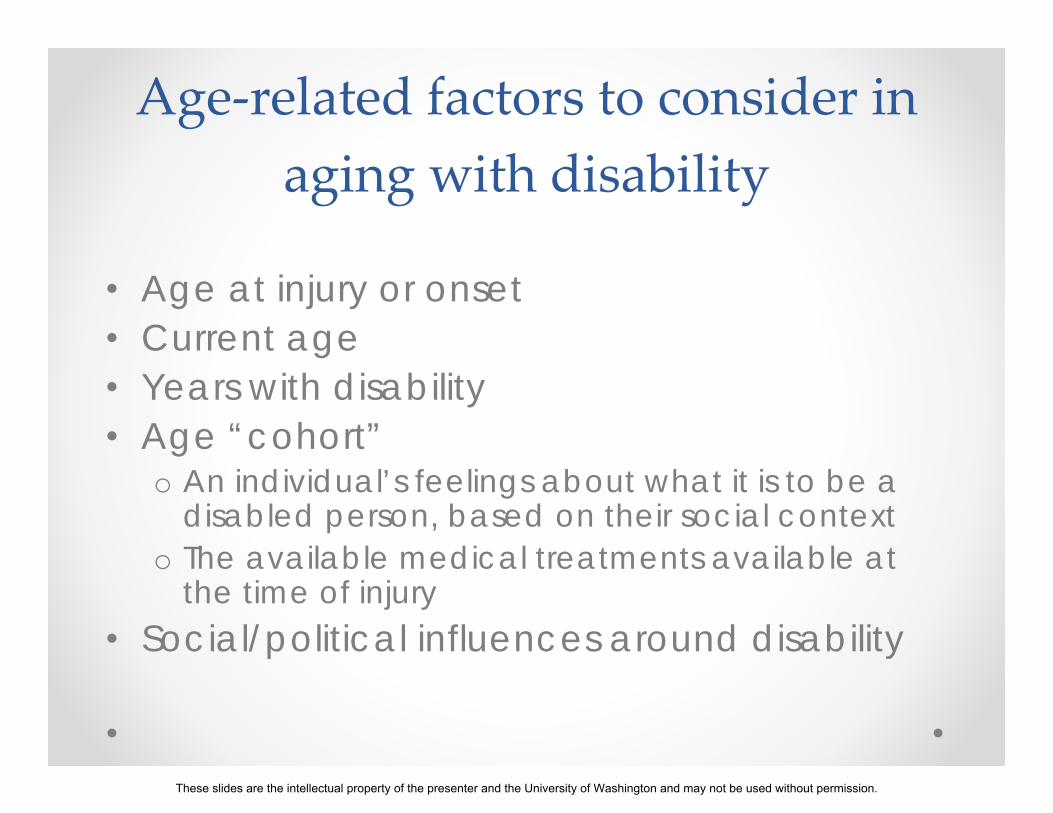
Age‐related factors to consider in aging with disability
• Age at injury or onset• Current age• Years with disability• Age “cohort”
o An individual’s feelings about what it is to be a disabled person, based on their social context
o The available medical treatments available at the time of injury
• Social/political influences around disability
These slides are the intellectual property of the presenter and the University of Washington and may not be used without permission.
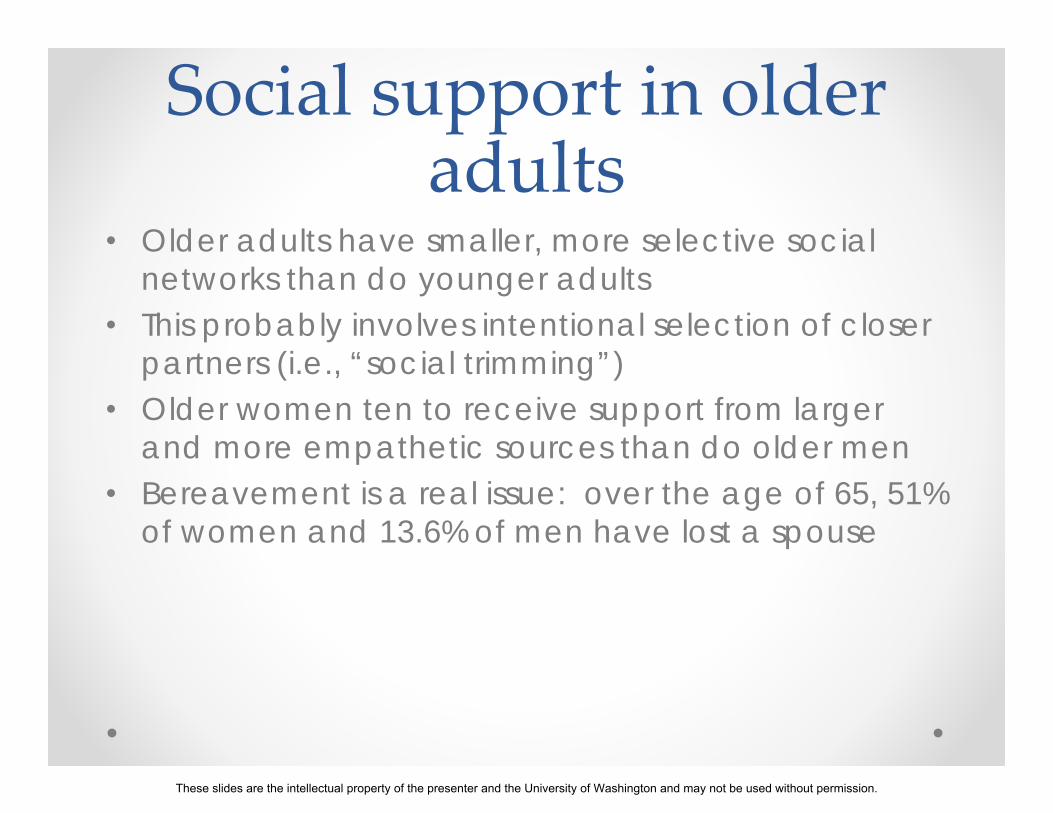
Social support in older adults
• Older adults have smaller, more selective social networks than do younger adults
• This probably involves intentional selection of closer partners (i.e., “social trimming”)
• Older women ten to receive support from larger and more empathetic sources than do older men
• Bereavement is a real issue: over the age of 65, 51% of women and 13.6% of men have lost a spouse
These slides are the intellectual property of the presenter and the University of Washington and may not be used without permission.
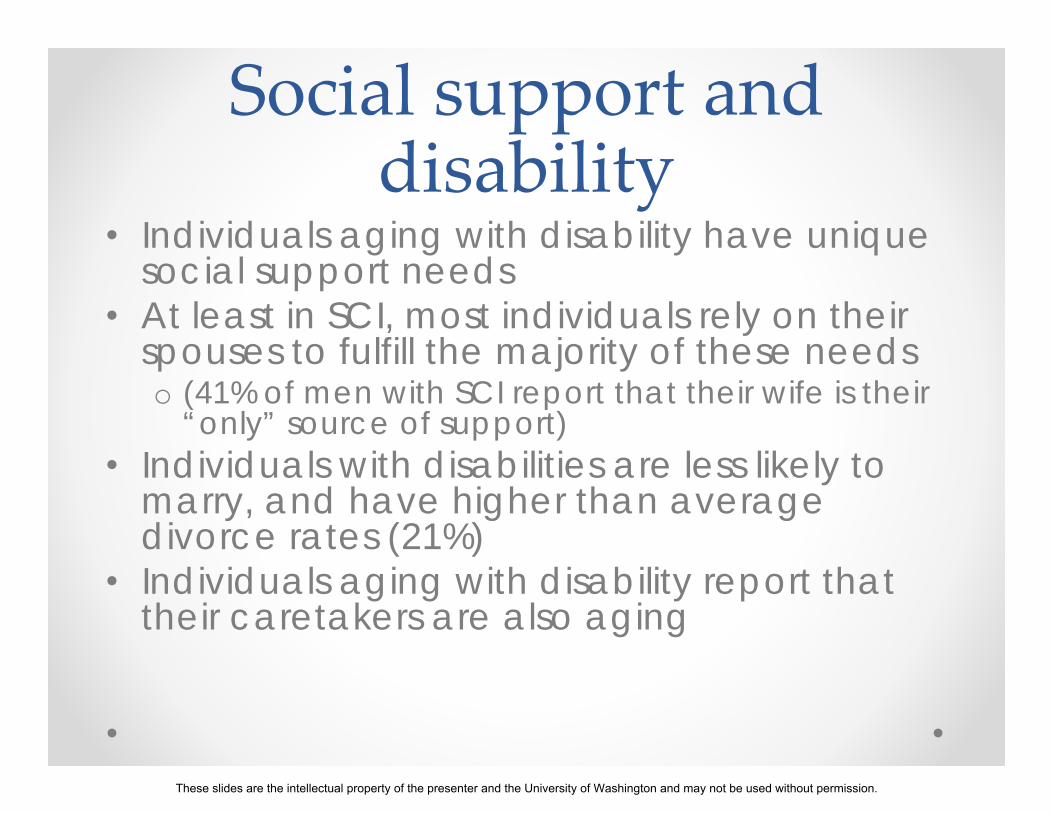
Social support and disability
• Individuals aging with disability have unique social support needs
• At least in SCI, most individuals rely on their spouses to fulfill the majority of these needs o (41% of men with SCI report that their wife is their
“only” source of support)• Individuals with disabilities are less likely to
marry, and have higher than average divorce rates (21%)
• Individuals aging with disability report that their caretakers are also aging
These slides are the intellectual property of the presenter and the University of Washington and may not be used without permission.
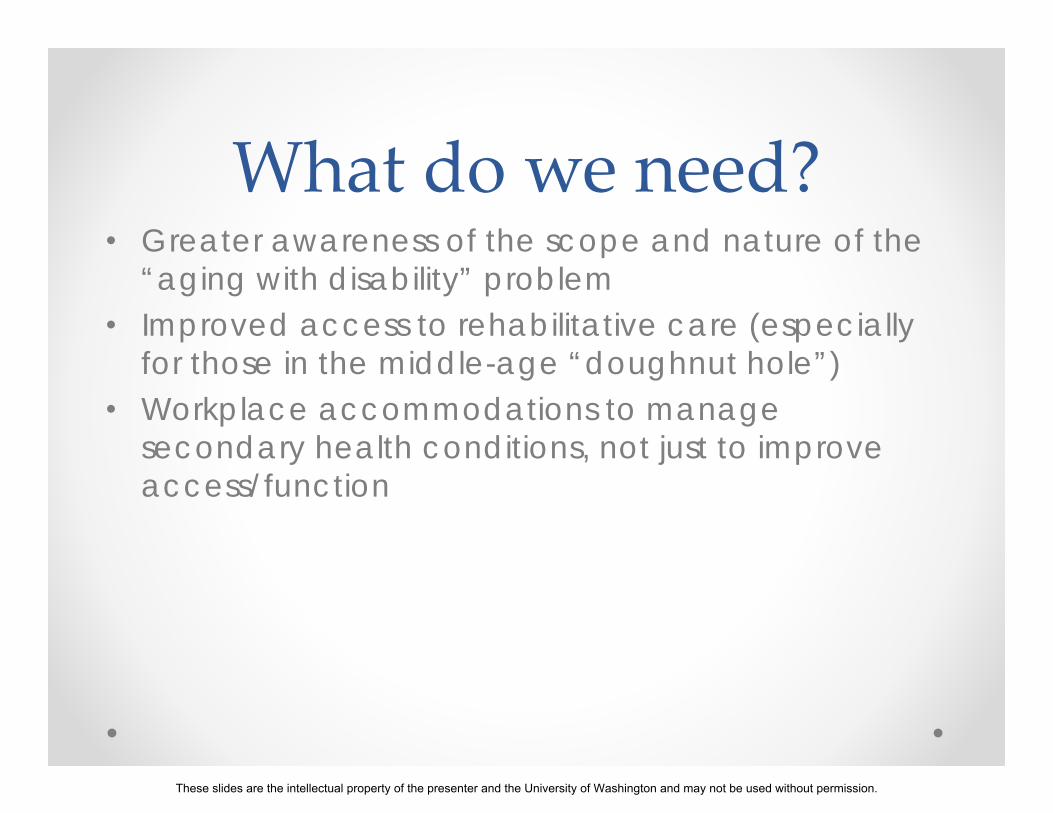
What do we need?• Greater awareness of the scope and nature of the
“aging with disability” problem• Improved access to rehabilitative care (especially
for those in the middle-age “doughnut hole”)• Workplace accommodations to manage
secondary health conditions, not just to improve access/function
These slides are the intellectual property of the presenter and the University of Washington and may not be used without permission.
Questions and Discussion?
These slides are the intellectual property of the presenter and the University of Washington and may not be used without permission.