Embed Size (px)
Citation preview
2011AnnuAl RepoRt to StockholdeRSAnnuAl RepoRt conSolidAted FinAnciAl StAtementS
Agilent technologieS, inc.
225211_Agilednt_CVR & Tabs_R3.indd 1 1/30/12 3:35 PM

225211_Agilednt_CVR & Tabs_R3.indd 2 1/30/12 3:35 PM
Annu
al Re
port
2011AnnuAl RepoRt to StockholdeRSAnnuAl RepoRt conSolidAted FinAnciAl StAtementS
Agilent technologieS, inc.
225211_Agilednt_CVR & Tabs_R3.indd 3 1/30/12 3:35 PM

225211_Agilednt_CVR & Tabs_R3.indd 2 1/30/12 3:35 PM
Annu
al Re
port
2011AnnuAl RepoRt to StockholdeRSAnnuAl RepoRt conSolidAted FinAnciAl StAtementS
Agilent technologieS, inc.2011AnnuAl RepoRt to StockholdeRS
ted FinAnciAl StAted FinAnciAl StAted FinAnciAl St tementSAtementSA
225211_Agilednt_CVR & Tabs_R3.indd 3 1/30/12 3:35 PM

This page is intentionally left blank.

Annu
al R
epor
t
1
To our shareholders,
Fiscal 2011 was an excellent year for Agilent. Annual revenues of $6.6 billion were up 22 percent over fiscal 2010. This was the second year in a row that annual revenues grew by more than 20 percent. Operating profit and earnings per share also increased substantially. We ended the fiscal year with the best operational performance in the company’s eleven-year history.
In addition to our strong fiscal 2011 financial results, we made strong progress in several strategic areas. We continued the integration of Varian, the largest acquisition in our history, strengthening product portfolios and customer satisfaction levels while achieving targeted cost savings. We increased our manufacturing capacity to manage increased demand for our solutions. We grew our footprint in rapidly growing emerging economies, including China, India and Brazil. And we continued our penetration into the life sciences market, which remains Agilent’s largest measurement growth opportunity.
As a reflection of Agilent’s financial strength and continuing growth opportunities, in January 2012 we announced the initiation of quarterly cash dividends to Agilent shareholders. This underscores our commitment to enhance shareholder value and return.
Electronic Measurement Group
Agilent’s Electronic Measurement Group (EMG) provides solutions in communications, industrial, aerospace and defense, semiconductor and computer measurement markets. Core technology platforms include oscilloscopes, signal analyzers, spectrum analyzers and network analyzers.
Communications markets saw strong demand in wireless manufacturing test, driven by smartphones, 3G and LTE (long-term evolution) network rollouts. General purpose markets saw strong demand in digital test, driven by new high-speed digital interfaces. And while aerospace and defense was unfavorably impacted by budget concerns in the United States, the market outside of the U.S. continued to see solid growth.
EMG underwent a major restructuring during the 2009 economic recession to improve profitability, increase flexibility and reduce cyclicality. We have seen a positive return on these efforts as the broader electronic measurement markets recovered. In fiscal 2011, EMG generated industry-leading organic growth and operating margins.
EMG continued to invest heavily in research and development, and these efforts paid off as well. In fiscal 2011 we held our largest-ever product announcement in oscilloscopes, introducing a new family of value scopes with world-leading price/performance. We have also enhanced our product portfolio with 55 modular instrument offerings, enabling Agilent to provide the broadest and most flexible range of electronic measurement products in the industry.
Chemical Analysis Group
Agilent’s Chemical Analysis Group (CAG) provides solutions in the chemical and energy, food testing, environmental and forensics markets. Core technology platforms include gas chromatography, GC-mass spectrometry, atomic and molecular spectroscopy and related chemistries.
Global applied chemical markets saw strong growth in fiscal 2011. Emerging countries increased their footprint in the global economy, creating a growing need for new material and energy sources. At the same time, these developing economies sought to improve the quality of their

2
environments and the health of their citizens. The world’s food supply is becoming increasingly globalized. Additionally, the energy sector invested in equipment recapitalization. Each of these trends created significant opportunities in the global applied chemical market.
Agilent capitalized on these market trends and outgrew the market through increased R&D investments and by leveraging our expanded portfolio from acquisitions.
Our R&D investments yielded several innovative new products for applied chemical markets. The 4100 MP-AES (microwave plasma atomic emission spectrometer) is the first spectroscopy solution to run entirely on air instead of expensive and dangerous argon gas. The Cary 630 is the world’s smallest bench FTIR (Fourier Transform Infrared) instrument. Agilent CrossLab is the company’s first portfolio of supplies designed to work with all major brands of analytical instruments.
CAG also saw strong market response from its expanded portfolio of high-end GC-mass spec products, including an industry-first GC/Q-TOF (time of flight) solution that combines the power of Agilent’s market-leading GC solution with our high-performance TOF analyzer.
The integration of Varian enabled our new spectroscopy business to benefit from a greater reach into new regions and markets, while customers benefitted from a widely expanded portfolio of supplies, chemistries and instruments. CAG also acquired A2 Technologies, a specialist in FTIR technologies with a portfolio of handheld instruments that enable customers to bring the lab to the test site.
Life Sciences Group
Agilent’s Life Sciences Group (LSG) provides solutions in pharmaceutical research and development, pharmaceutical manufacturing, and government and academic research. Core technology platforms include liquid chromatography, LC-mass spectrometry, microarrays, nuclear magnetic resonance and magnetic resonance imaging solutions.
While fiscal 2011 saw continued market uncertainly in the U.S. and European pharmaceutical industry, LSG had good momentum driven by the replacement cycle for lab instrumentation. Our strong presence in emerging countries also positioned us well, as big pharma continued to increase operations in these geographies.
LSG continued to penetrate academic and government markets by identifying opportunities and deploying an expert field team where Agilent solutions were true differentiators. The Agilent Thought Leadership program partnered with leading researchers in strategic areas including integrated biology, structural biology, biological food safety, synthetic biology and in vitro toxicology. This global program creates direct business opportunities and visibility for Agilent in leading-edge life science areas.
Among new product introductions, we expanded our SureSelect genome partitioning product portfolio. We leveraged our ultra-sensitive ion funnel technology with the launch of our 6550 Q-TOF LC/MS solution. And we revolutionized liquid chromatography operation with our ISET pump emulation software, which enables our 1290 systems to emulate other LC pumps across the market.
Agilent took several strategic actions in anticipation of further growth in life sciences. LSG added technology to its portfolio via the acquisitions of BIOCIUS and Lab901. BIOCIUS Life Sciences developed the RapidFire drug-screening platform for the pharmaceutical and bio-pharmaceutical markets. Lab901 developed the ScreenTape platform for nucleic acid quantization
Annu
al R
epor
t
3
and detection. LSG’s manufacturing site in Cedar Creek, Texas, was registered with the U.S. Food and Drug Administration as a medical device establishment in preparation for the manufacture of diagnostic products.
The year ahead in 2012
Agilent is in a strong financial position as we look ahead to fiscal 2012. We expect to maintain our solid operating model, which ensures fiscal discipline through both the highs and lows of the economic cycle.
Moving forward, we will pursue a four-point strategy to differentiate and excel through (1) market reach and customer trust, (2) technology leadership, (3) scale and scope, and (4) team.
(1) Agilent operates in more than 110 countries throughout the world. We hold a leading customer loyalty position in every major product category as measured by independent sources.
(2) Agilent offers advanced technologies in all core platforms throughout electronic measurement, chemical analysis and life sciences. We will continue to invest aggressively in research and development to maintain this technology leadership.
(3) Our world-class manufacturing organization provides us with global purchasing power and infrastructure leverage throughout the company. This leverage should enable us to continue improving Agilent’s cost of sales, particularly in our chemical analysis and life sciences businesses.
(4) Agilent’s continued success is a credit to our leadership and employee teams. Our 18,700 employees around the world are dedicated to providing the industry’s best customer service, with uncompromising speed, quality and integrity.
Agilent also strives to be a leader in sustainability strategies and philanthropic efforts. Our annual Corporate Citizenship Report, which reflects our ongoing efforts to bring positive change to the world, can be accessed from our company website at www.agilent.com/environment/esr/home.html.
Agilent’s singular focus on measurement helps scientists and engineers address their toughest challenges with precision and confidence. With the help of Agilent’s products and services, they are better positioned to deliver breakthroughs that can make a measurable difference in the world.
Bill Sullivan President and Chief Executive Officer
February 8, 2012
4
Agilent at a GlanceAgilent is the world’s premier measurement company providing core bio-analytical and
electronic measurement solutions to the communications, electronics, life sciences and chemical analysis industries.
For the fiscal year ended October 31, 2011, we have three business segments comprised of the electronic measurement business, the chemical analysis business and the life sciences business. Our electronic measurement business addresses the communications, electronics and other industries. Our chemical analysis business focuses on the petrochemical, environmental, forensics and food safety industries. Our life sciences business focuses on the pharmaceutical, biotech, academic and government, bio-agriculture and food safety industries.
In addition to our three businesses, we conduct centralized research through Agilent Technologies Research Laboratories. Each of our businesses, including Agilent Labs, is supported by our global infrastructure organization, which provides shared services in the areas of finance, legal, workplace services, human resources and information technology.
We sell our products primarily through direct sales, but we also utilize distributors, resellers, manufacturer’s representatives, telesales and electronic commerce. Of our total net revenue of $6.6 billion for the fiscal year ended October 31, 2011, we generated 30 percent in the U.S. and 70 percent outside the U.S. As of October 31, 2011, we employed approximately 18,700 people worldwide. Our primary research and development and manufacturing sites are in California, Colorado and Delaware in the U.S. and in Australia, China, Germany, India, Italy, Japan, Malaysia, Singapore and the United Kingdom.
Business Group 2011 Net Revenue Description
Electronic Measurement
$3.3 billionSummary: Our electronic measurement business provides electronic measurement instruments and systems, software design tools and related services that are used in the design, development, manufacture, installation, deployment and operation of electronics equipment, and microscopy products. Related services include start-up assistance, instrument productivity and application services and instrument calibration and repair. We also offer customization, consulting and optimization services throughout the customer’s product lifecycle. Our electronic measurement business employed approximately 8,100 people as of October 31, 2011.
Markets: The markets for our electronic measurement business include communications test and general purpose test. We market our electronic measurement products and services to network equipment manufacturers, handset manufacturers, and communications service providers, including component manufacturers within the supply chain for these customers. We market our general purpose test products and services to the electronics industry and other industries with significant electronic content such as the aerospace and defense, computer and semiconductor industries.

Annu
al R
epor
t
5
Business Group 2011 Net Revenue Description
Product areas: We divide our electronic measurement products into communications test products and general purpose test products. We sell products and services applicable to a wide range of communications networks and systems including wireless communications and microwave networks, voice, broadband, data, and fiber optic networks. Test products include electronic design automation software, vector and signal analyzers, signal generators, vector network analyzers, one box testers, oscilloscopes, logic and protocol analyzers, and bit-error ratio testers. Also, we sell the following types of products into the general purpose test market: general purpose instruments, modular instruments and test software, digital test products, semiconductor and board test solutions, electronics manufacturing test equipment, atomic force microscopes and radio frequency and network surveillance solutions.
Chemical Analysis
$1.5 billionSummary: Our chemical analysis business provides application-focused solutions that include instruments, software, consumables and services that enable customers to identify, quantify and analyze the physical and biological properties of substances and products. We employed approximately 3,500 people as of October 31, 2011 in our chemical analysis business.
Markets: The markets for our chemical analysis group include chemical and energy testing, environmental testing, forensics and drug testing, and food safety markets. The natural gas and petroleum refining markets use our products to measure and control the quality of their finished products and to verify the environmental safety of their operations. Our instruments, software and workflow solutions are used by the environmental market for applications such as laboratory and field analysis of chemical pollutants in air, water, soil and solid waste. Drug testing and forensics laboratories use our instruments, software and workflow solutions for applications such as analyzing evidence associated with crime, screening athletes for performance enhancing drugs, analyzing samples for recreational drugs, or detecting and identifying biological and chemical warfare agents. Our instruments, software, and workflow solutions are used throughout the food production chain, including incoming inspection, new product development, quality control and assurance, and packaging.
Product areas: The key product categories for the chemical analysis business include: gas chromatography, mass spectrometry, spectroscopy, vacuum technology, and related consumables and services.

6
Business Group 2011 Net Revenue Description
Life Sciences $1.8 billionSummary: Our life sciences business provides application-focused solutions that include instruments, software, consumables and services that enable customers to identify, quantify and analyze the physical and biological properties of substances and products. We employed approximately 4,600 people as of October 31, 2011 in our life sciences business.
Markets: The markets for our life sciences group include the pharmaceutical, biotechnology, contract research and contract manufacturing organization market and the academic and government market The former market consists of “for-profit” companies who participate across the pharmaceutical value chain in the areas of therapeutic research, discovery & development, clinical trials, manufacturing and quality assurance and quality control. The academic and government market consists primarily of “not-for-profit” organizations and includes academic institutions, large government institutes and privately funded organizations, and plays an influential role in technology adoption and therapeutic developments for Pharma and molecular diagnostics companies.
Product areas: The key product categories for the life sciences business include: liquid chromatography, mass spectrometry, microarrays, polymerase chain reaction (PCR) instrumentation, bioreagents, lab automation and robotics, electrophoresis, software and informatics, nuclear magnetic resonance (NMR) and magnetic resonance imaging (MRI) systems, and related consumables and services.
Agilent Research Laboratories
Agilent Technologies Research Laboratories is our research organization based in Santa Clara, California, with offices in China and Belgium. The Agilent Labs create competitive advantage through high-impact technology, driving market leadership and growth in Agilent’s core businesses and expanding Agilent’s measurement footprint into adjacent markets. At the cross-roads of the organization, the Agilent Labs are able to identify and enable synergies across Agilent’s businesses to create competitive differentiation and compelling customer value. The technical staff have advanced degrees that cover a wide range of scientific and engineering fields, including biology, chemistry, computer science, distributed measurement, electrical engineering, image processing, materials science, mathematics, nano/microfabrication, microfluidics, software, informatics, optics, physics, physiology and signal processing.
Global Infrastructure Organization
We provide support to our businesses through our global infrastructure organization. This support includes services in the areas of finance, legal, workplace services, human resources and information technology. Generally these organizations are centrally operated from Santa Clara, California, with services provided worldwide. As of the end of October 2011, our global infrastructure organization employed approximately 2,500 people.
Annu
al R
epor
t
7
Senior Executives
William P. Sullivan* President and Chief Executive Officer
Richard A. Burdsall Senior Vice President Chief Infrastructure Officer
Gooi Soon Chai Senior Vice President Order Fulfillment and Supply Chain
Jean M. Halloran* Senior Vice President Human Resources
Didier Hirsch* Senior Vice President Chief Financial Officer
Marie Oh Huber* Senior Vice President, General Counsel and Secretary
Michael R. McMullen* Senior Vice President, Agilent and President, Chemical Analysis Group
Ronald S. Nersesian* Executive Vice President Chief Operating Officer
Shiela B. Robertson Senior Vice President Corporate Development and Strategy
Nicolas H. Roelofs* Senior Vice President, Agilent and President, Life Sciences Group
Guy Séné* Senior Vice President, Agilent and President, Electronic Measurement Group
Darlene J.S. Solomon, Ph.D. Senior Vice President Chief Technology Officer
Officers
Neil P. Dougherty Vice President, Treasurer
Lonnie G. Justice Vice President and General Manager, Sales, Service and Support Chemical Analysis Group
Saleem N. Odeh Vice President and General Manager, Sales, Service, Support and Quality Electronic Measurement Group
John Pouk Vice President and General Manager, Worldwide Sales Life Sciences Group
Stephen D. Williams Vice President, Assistant General Counsel and Assistant Secretary
Directors
James G. Cullen Chairman of the Board of Directors of Agilent, Retired President and Chief Operating Officer of Bell Atlantic Corporation (now known as Verizon)
Paul N. Clark Former Chief Executive Officer and President of ICOS Corporation
Heidi Fields Executive Vice President and Chief Financial Officer of Blue Shield of California
Robert J. Herbold Retired Executive Vice President of Microsoft Corporation
Koh Boon Hwee Non-Executive Chairman of Sunningdale Tech Ltd. and Non-Executive Chairman of Yeo Hiap Seng Ltd. and Yeo Hiap Seng (Malaysia) Bhd.
David M. Lawrence, M.D. Retired Chairman Emeritus of Kaiser Foundation Health Plan, Inc. and Kaiser Foundation Hospitals
A. Barry Rand Chief Executive Officer of AARP
William P. Sullivan, President and Chief Executive Officer of Agilent Technologies, Inc.
Takadata Yamada, M.D. Chief Medical and Scientific Officer of Takeda Pharmaceuticals International, Inc.
Board Committees
Audit & Finance Committee Heidi Fields, Chairperson Paul N. Clark Robert J. Herbold
Compensation Committee David M. Lawrence, M.D., Chairperson Koh Boon Hwee A. Barry Rand Tadataka Yamada, M.D.
Nominating/Corporate Governance Committee James G. Cullen Chairperson Paul N. Clark Heidi Fields Robert J. Herbold Koh Boon Hwee David M. Lawrence, M.D. A. Barry Rand Takadata Yamada
Executive Committee James G. Cullen, Chairperson William P. Sullivan
* These individuals are executive officers of Agilent under Section 16 of the Securities Exchange Act of 1934.

8
Agilent’s annual meeting of stockholders will take place on Wednesday, March 21, 2012 at 8:00 a.m. at Agilent’s headquarters located at 5301 Stevens Creek Boulevard, Building No. 5, Santa Clara, California.
Investor Information
Please see the full and audited financial statements and footnotes contained in this booklet. To receive paper copies of the annual report, proxy statement, Form 10-K, earnings announcements and other financial information, people in the United States and Canada should call our toll-free number: (877) 942-4200. In addition, you can access this financial information at Agilent’s Investor Relations Web site. The address is http://www.investor.agilent.com. This information is also available by writing to the address provided under the Investor Contact heading below.
Corporate Governance, Business Conduct and Ethics
Agilent’s Amended and Restated Corporate Governance Standards, the charters of our Audit and Finance Committee, our Compensation Committee, our Executive Committee and our Nominating/Corporate Governance Committee, as well as our Standards of Business Conduct (including code of ethics provisions that apply to our principal executive officer, principal financial officer, principal accounting officer and senior financial officers) are available on our website at www.investor.agilent.com under “Corporate Governance”. These items are also available in print to any stockholder in the United States and Canada who requests them by calling (877) 942-4200. This information is also available by writing to the company at the headquarters’ address provided below.
Transfer Agent and Registrar
Please contact our transfer agent, at the phone number or address listed below, with any questions about stock certificates, transfer of ownership or other matters pertaining to your stock account.
Computershare Investor Services 250 Royall Street Canton, MA 02021 United States
If calling from anywhere within the United States and Canada: (877) 309-9856.
If calling from outside the United States: (312) 588-4672.
The e-mail address for general shareholder inquiries for Computershare is: www.computershare.com/contactus.
Investor Contact
Agilent Technologies, Inc. Investor Relations Department 5301 Stevens Creek Boulevard Santa Clara, CA 95051

Annu
al R
epor
t
9
You can also contact the Investor Relations Department via e-mail at the Agilent Investor Relations Web site at http://www.investor.agilent.com. Click “Information Request” under the “Investor Information” tab to send a message.
Agilent Headquarters
Agilent Technologies, Inc. 5301 Stevens Creek Boulevard Santa Clara, CA 95051 Phone: (408) 553-2424
Common Stock
Agilent is listed on the New York Stock Exchange and our ticker symbol is “A.” There were approximately 39,669 registered stockholders as of December 1, 2011.
The following tables summarize the high and low stock prices by period for Agilent’s common stock.
Fiscal 2010 High Low
First Quarter (ended January 31, 2010) $31.77 $24.69Second Quarter (ended April 30, 2010) $37.43 $28.13Third Quarter (ended July 31, 2010) $36.89 $26.74Fourth Quarter (ended October 31, 2010) $35.33 $26.68
Fiscal 2011 High Low
First Quarter (ended January 31, 2011) $44.45 $34.38Second Quarter (ended April 30, 2011) $50.68 $39.94Third Quarter (ended July 31, 2011) $55.33 $41.29Fourth Quarter (ended October 31, 2011) $42.78 $28.67
Our management and Board of Directors evaluate our capitalization strategy on an on-going basis. On January 17, 2012, our Board of Directors approved the initiation of quarterly cash dividends to our shareholders and declared the company’s first cash dividend. A dividend of 10 cents per share of common stock will be paid on April 25, 2012 to all shareholders of record as of the close of business on April 3, 2012. The timing and amounts of any future dividends are subject to determination and approval by the Board of Directors.
10
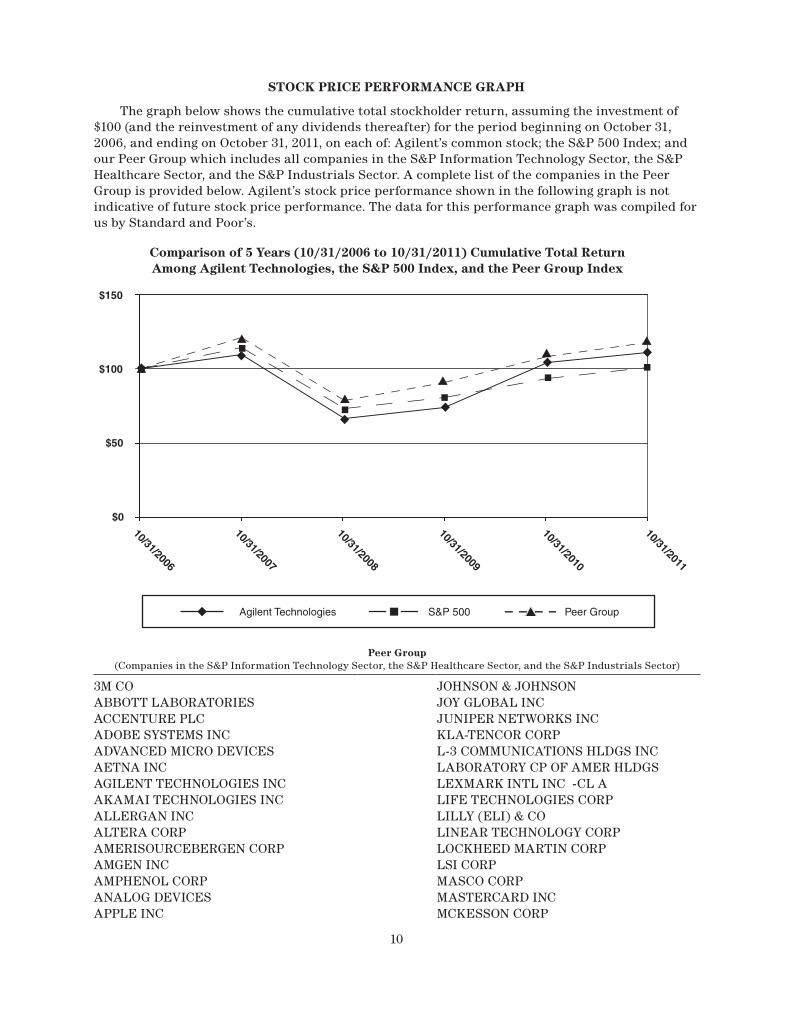
STOCK PRICE PERFORMANCE GRAPH
The graph below shows the cumulative total stockholder return, assuming the investment of $100 (and the reinvestment of any dividends thereafter) for the period beginning on October 31, 2006, and ending on October 31, 2011, on each of: Agilent’s common stock; the S&P 500 Index; and our Peer Group which includes all companies in the S&P Information Technology Sector, the S&P Healthcare Sector, and the S&P Industrials Sector. A complete list of the companies in the Peer Group is provided below. Agilent’s stock price performance shown in the following graph is not indicative of future stock price performance. The data for this performance graph was compiled for us by Standard and Poor’s.
Comparison of 5 Years (10/31/2006 to 10/31/2011) Cumulative Total ReturnAmong Agilent Technologies, the S&P 500 Index, and the Peer Group Index
10/31/2006
10/31/2007
Agilent Technologies S&P 500 Peer Group
10/31/2008
10/31/2009
10/31/2010
10/31/2011
$150
$100
$50
$0
Peer Group (Companies in the S&P Information Technology Sector, the S&P Healthcare Sector, and the S&P Industrials Sector)
3M CO JOHNSON & JOHNSONABBOTT LABORATORIES JOY GLOBAL INCACCENTURE PLC JUNIPER NETWORKS INCADOBE SYSTEMS INC KLA-TENCOR CORPADVANCED MICRO DEVICES L-3 COMMUNICATIONS HLDGS INCAETNA INC LABORATORY CP OF AMER HLDGSAGILENT TECHNOLOGIES INC LEXMARK INTL INC -CL AAKAMAI TECHNOLOGIES INC LIFE TECHNOLOGIES CORPALLERGAN INC LILLY (ELI) & COALTERA CORP LINEAR TECHNOLOGY CORPAMERISOURCEBERGEN CORP LOCKHEED MARTIN CORPAMGEN INC LSI CORPAMPHENOL CORP MASCO CORPANALOG DEVICES MASTERCARD INCAPPLE INC MCKESSON CORP

Annu
al R
epor
t
11
Peer Group (Companies in the S&P Information Technology Sector, the S&P Healthcare Sector, and the S&P Industrials Sector)
APPLIED MATERIALS INC MEDCO HEALTH SOLUTIONS INCAUTODESK INC MEDTRONIC INCAUTOMATIC DATA PROCESSING MEMC ELECTRONIC MATERIALS INCAVERY DENNISON CORP MERCK & COBARD (C.R.) INC MICROCHIP TECHNOLOGY INCBAXTER INTERNATIONAL INC MICRON TECHNOLOGY INCBECTON DICKINSON & CO MICROSOFT CORPBIOGEN IDEC INC MOLEX INCBMC SOFTWARE INC MONSTER WORLDWIDE INCBOEING CO MOTOROLA MOBILITY HLDGS INCBOSTON SCIENTIFIC CORP MOTOROLA SOLUTIONS INCBRISTOL-MYERS SQUIBB CO MYLAN INCBROADCOM CORP -CL A NETAPP INCC H ROBINSON WORLDWIDE INC NORFOLK SOUTHERN CORPCA INC NORTHROP GRUMMAN CORPCARDINAL HEALTH INC NOVELLUS SYSTEMS INCCAREFUSION CORP NVIDIA CORPCATERPILLAR INC ORACLE CORPCELGENE CORP PACCAR INCCERNER CORP PALL CORPCIGNA CORP PARKER-HANNIFIN CORPCINTAS CORP PATTERSON COMPANIES INCCISCO SYSTEMS INC PAYCHEX INCCITRIX SYSTEMS INC PERKINELMER INCCOGNIZANT TECH SOLUTIONS PFIZER INCCOMPUTER SCIENCES CORP PITNEY BOWES INCCOMPUWARE CORP PRECISION CASTPARTS CORPCORNING INC QUALCOMM INCCOVENTRY HEALTH CARE INC QUANTA SERVICES INCCOVIDIEN PLC QUEST DIAGNOSTICS INCCSX CORP RAYTHEON COCUMMINS INC RED HAT INCDANAHER CORP REPUBLIC SERVICES INCDAVITA INC ROBERT HALF INTL INCDEERE & CO ROCKWELL AUTOMATIONDELL INC ROCKWELL COLLINS INCDENTSPLY INTERNATL INC ROPER INDUSTRIES INC/DEDONNELLEY (R R) & SONS CO RYDER SYSTEM INCDOVER CORP SAIC INCDUN & BRADSTREET CORP SALESFORCE.COM INCEATON CORP SANDISK CORPEBAY INC SNAP-ON INCEDWARDS LIFESCIENCES CORP SOUTHWEST AIRLINESELECTRONIC ARTS INC ST JUDE MEDICAL INCEMC CORP/MA STANLEY BLACK & DECKER INCEMERSON ELECTRIC CO STERICYCLE INCEQUIFAX INC STRYKER CORPEXPEDITORS INTL WASH INC SYMANTEC CORPEXPRESS SCRIPTS INC TE CONNECTIVITY LTD

12
Peer Group (Companies in the S&P Information Technology Sector, the S&P Healthcare Sector, and the S&P Industrials Sector)
F5 NETWORKS INC TELLABS INCFASTENAL CO TENET HEALTHCARE CORPFEDEX CORP TERADATA CORPFIDELITY NATIONAL INFO SVCS TERADYNE INCFIRST SOLAR INC TEXAS INSTRUMENTS INCFISERV INC TEXTRON INCFLIR SYSTEMS INC THERMO FISHER SCIENTIFIC INCFLOWSERVE CORP TOTAL SYSTEM SERVICES INCFLUOR CORP TYCO INTERNATIONAL LTDFOREST LABORATORIES -CL A UNION PACIFIC CORPGENERAL DYNAMICS CORP UNITED PARCEL SERVICE INCGENERAL ELECTRIC CO UNITED TECHNOLOGIES CORPGILEAD SCIENCES INC UNITEDHEALTH GROUP INCGOODRICH CORP VARIAN MEDICAL SYSTEMS INCGOOGLE INC VERISIGN INCGRAINGER (W W) INC VISA INCHARRIS CORP WASTE MANAGEMENT INCHEWLETT-PACKARD CO WATERS CORPHONEYWELL INTERNATIONAL INC WATSON PHARMACEUTICALS INCHOSPIRA INC WELLPOINT INCHUMANA INC WESTERN DIGITAL CORPILLINOIS TOOL WORKS WESTERN UNION COINGERSOLL-RAND PLC XEROX CORPINTEL CORP XILINX INCINTL BUSINESS MACHINES CORP YAHOO INCINTUIT INC ZIMMER HOLDINGS INCINTUITIVE SURGICAL INCIRON MOUNTAIN INCITT CORPJABIL CIRCUIT INCJACOBS ENGINEERING GROUP INCJDS UNIPHASE CORP
Additional Information
This annual report, including the letter titled “To our stockholders,” contains forward-looking statements including, without limitation, statements regarding trends, seasonality, cyclicality and growth in, and drivers of, the markets we sell into, our strategic direction, our future effective tax rate and tax valuation allowance, earnings from our foreign subsidiaries, remediation activities, new product and service introductions, the ability of our products to meet market needs, changes to our manufacturing processes, the use of contract manufacturers, the impact of local government regulations on our ability to pay vendors or conduct operations, our liquidity position, our ability to generate cash from operations, growth in our businesses, our investments, the potential impact of adopting new accounting pronouncements, our financial results, our purchase commitments, our contributions to our pension plans, the selection of discount rates and recognition of any gains or losses for our benefit plans, our cost-control activities, savings and headcount reduction recognized from our restructuring programs, uncertainties relating to Food and Drug Administration (“FDA”) and other regulatory approvals, the integration of our Varian acquisition and other transactions, our stock repurchase program, our transition to lower-cost regions, and the existence of economic instability, that involve risks and uncertainties. Our actual results could differ materially from the

Annu
al R
epor
t
13
results contemplated by these forward-looking statements due to various factors, including those detailed in Agilent’s filings with the Securities and Exchange Commission, including our Annual Report on Form 10-K for the year ended October 31, 2011.
The materials contained in this annual report are as of December 16, 2011, unless otherwise noted. The content of this annual report contains time-sensitive information that is accurate only as of this date. If any portion of this annual report is redistributed at a later date, Agilent will not be reviewing or updating the material in this report. The information on page 7 regarding our senior executives, officers and directors is current as of February 8, 2012.
This annual report contains Agilent’s 2011 audited financial statements and notes thereto in the following section of this booklet with the tab “Annual Report Financials.” Within the Annual Report Financials, please refer to “Management’s Discussion and Analysis of Financial Condition and Results of Operations” and “Risks, Uncertainties and Other Factors That May Affect Future Results” for more complete information on each of our businesses and Agilent as a whole.

2011AnnuAl RepoRt to StockholdeRSAnnuAl RepoRt conSolidAted FinAnciAl StAtementS
Agilent technologieS, inc. Annu
al Re
port
Finan
cials
225211_Agilednt_CVR & Tabs_R3.indd 4 1/30/12 3:35 PM
This page is intentionally left blank.

2011AnnuAl RepoRt to StockholdeRSAnnuAl RepoRt conSolidAted FinAnciAl StAtementS
Agilent technologieS, inc.2011AnnuAl RepoRt to StockholdeRS
ted FinAnciAl StAted FinAnciAl StAted FinAnciAl St tementSAtementSA
Annu
al Re
port
Finan
cials
225211_Agilednt_CVR & Tabs_R3.indd 4 1/30/12 3:35 PM

This page is intentionally left blank.
Annu
al R
epor
t Fin
anci
als
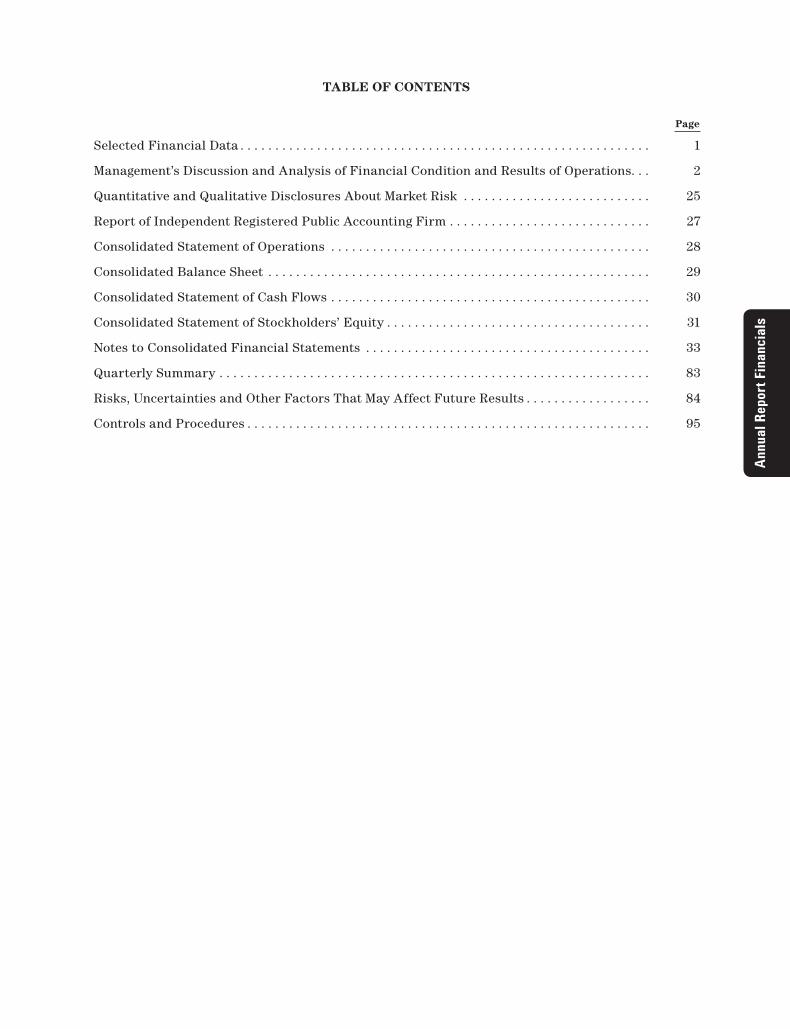
TABLE OF CONTENTS
Page
Selected Financial Data . . . . . . . . . . . . . . . . . . . . . . . . . . . . . . . . . . . . . . . . . . . . . . . . . . . . . . . . . . . 1
Management’s Discussion and Analysis of Financial Condition and Results of Operations. . . 2
Quantitative and Qualitative Disclosures About Market Risk . . . . . . . . . . . . . . . . . . . . . . . . . . . 25
Report of Independent Registered Public Accounting Firm . . . . . . . . . . . . . . . . . . . . . . . . . . . . . 27
Consolidated Statement of Operations . . . . . . . . . . . . . . . . . . . . . . . . . . . . . . . . . . . . . . . . . . . . . . 28
Consolidated Balance Sheet . . . . . . . . . . . . . . . . . . . . . . . . . . . . . . . . . . . . . . . . . . . . . . . . . . . . . . . 29
Consolidated Statement of Cash Flows . . . . . . . . . . . . . . . . . . . . . . . . . . . . . . . . . . . . . . . . . . . . . . 30
Consolidated Statement of Stockholders’ Equity . . . . . . . . . . . . . . . . . . . . . . . . . . . . . . . . . . . . . . 31
Notes to Consolidated Financial Statements . . . . . . . . . . . . . . . . . . . . . . . . . . . . . . . . . . . . . . . . . 33
Quarterly Summary . . . . . . . . . . . . . . . . . . . . . . . . . . . . . . . . . . . . . . . . . . . . . . . . . . . . . . . . . . . . . . 83
Risks, Uncertainties and Other Factors That May Affect Future Results . . . . . . . . . . . . . . . . . . 84
Controls and Procedures . . . . . . . . . . . . . . . . . . . . . . . . . . . . . . . . . . . . . . . . . . . . . . . . . . . . . . . . . . 95

This page is intentionally left blank.

Annu
al R
epor
t Fin
anci
als
1
SELECTED FINANCIAL DATA (Unaudited)
Years Ended October 31,
2011 2010 2009 2008 2007
(in millions, except per share data)
Consolidated Statement of Operations Data:Net revenue . . . . . . . . . . . . . . . . . . . . . . . . . . . . . . . . . . . . . . $6,615 $5,444 $ 4,481 $5,774 $5,420Income before taxes . . . . . . . . . . . . . . . . . . . . . . . . . . . . . . . $1,032 $ 692 $ 7 $ 815 $ 670Net income (loss) . . . . . . . . . . . . . . . . . . . . . . . . . . . . . . . . . . $1,012 $ 684 $ (31) $ 693 $ 638Net income (loss) per share — Basic: . . . . . . . . . . . . . . . . . $ 2.92 $ 1.97 $ (0.09) $ 1.91 $ 1.62Net income (loss) per share — Diluted: . . . . . . . . . . . . . . . . $ 2.85 $ 1.94 $ (0.09) $ 1.87 $ 1.57Weighted average shares used in computing basic net
income (loss) per share . . . . . . . . . . . . . . . . . . . . . . . . . . . 347 347 346 363 394Weighted average shares used in computing diluted net
income (loss) per share . . . . . . . . . . . . . . . . . . . . . . . . . . . 355 353 346 371 406
October 31,
2011 2010 2009 2008 2007
(in millions)
Consolidated Balance Sheet Data:Cash and cash equivalents and
short-term investments . . . . . . . . . . . . . . . . . . . . . . . . . . $ 3,527 $2,649 $2,493 $ 1,429 $ 1,826Working capital . . . . . . . . . . . . . . . . . . . . . . . . . . . . . . . . . . . $ 3,732 $3,086 $2,838 $ 1,852 $2,008Long-term restricted cash and cash equivalents . . . . . . . $ — $ — $ 1,566 $ 1,582 $ 1,615Total assets . . . . . . . . . . . . . . . . . . . . . . . . . . . . . . . . . . . . . . $ 9,057 $ 9,696 $ 7,612 $ 7,007 $ 7,554Long-term debt . . . . . . . . . . . . . . . . . . . . . . . . . . . . . . . . . . . $ 1,932 $ 2,190 $2,904 $ 2,125 $ 2,087Stockholders’ equity . . . . . . . . . . . . . . . . . . . . . . . . . . . . . . . $4,308 $3,228 $2,506 $2,559 $3,234

2
MANAGEMENT’S DISCUSSION AND ANALYSIS OF FINANCIAL CONDITION AND RESULTS OF OPERATIONS
The following discussion should be read in conjunction with the consolidated financial statements and notes thereto included elsewhere in this annual report. This report contains forward-looking statements including, without limitation, statements regarding trends, seasonality, cyclicality and growth in, and drivers of, the markets we sell into, our strategic direction, our future effective tax rate and tax valuation allowance, earnings from our foreign subsidiaries, remediation activities, new product and service introductions, the ability of our products to meet market needs, changes to our manufacturing processes, the use of contract manufacturers, the impact of local government regulations on our ability to pay vendors or conduct operations, our liquidity position, our ability to generate cash from operations, growth in our businesses, our investments, the potential impact of adopting new accounting pronouncements, our financial results, our purchase commitments, our contributions to our pension plans, the selection of discount rates and recognition of any gains or losses for our benefit plans, our cost-control activities, savings and headcount reduction recognized from our restructuring programs, uncertainties relating to Food and Drug Administration (“FDA”) and other regulatory approvals, the integration of our Varian acquisition and other transactions, our stock repurchase program, our transition to lower-cost regions, and the existence of economic instability, that involve risks and uncertainties. Our actual results could differ materially from the results contemplated by these forward-looking statements due to various factors, including those discussed in this annual report.
Overview and Executive Summary
Agilent is the world’s premier measurement company, providing core electronic and bio-analytical measurement solutions to the communications, electronics, life sciences and chemical analysis industries. Our fiscal year end is October 31. Unless otherwise stated, all years and dates refer to our fiscal year.
For the year ended October 31, 2011 we acquired three separate businesses: A2 Technologies, Lab901 and Biocius Life Sciences Inc., for a total cost of $96 million, net of cash acquired.
Agilent’s total orders in 2011 were $6,769 million, an increase of 18 percent when compared to 2010. The increase in orders associated with the Varian acquisition less the orders attributable to divested businesses (the network solutions and Hycor businesses) accounted for 5 percentage points of order growth for the year ended October 31, 2011 when compared to 2010. Due to the close date of the Varian acquisition, which occurred on May 14, 2010, we have excluded orders related to Varian for the period November 1, 2010 to May 14, 2011 when we compare periods without the Varian acquisition. The increase in orders in the year ended October 31, 2011 compared with last year was attributable to improvement in many of our instrument platforms, consumables and services. Agilent’s total orders in 2010 increased 28 percent when compared to 2009. The increase in orders associated with the Varian acquisition less the orders attributable to our divested businesses (the network solutions and Hycor businesses) accounted for 3 percentage points of order growth for the year ended October 31, 2010 when compared to 2009. The increase in orders in the year ended October 31, 2010 compared with the prior year was due to a strong performance in new products and service and support businesses.
Agilent’s net revenue of $6,615 million increased 22 percent when compared to 2010. The revenue increase associated with the Varian acquisition less the revenue attributable to our divested businesses (the network solutions and Hycor businesses) accounted for approximately 5 percentage points of the revenue increase for the year ended October 31, 2011 when compared to 2010. Due to the close date of the Varian acquisition, which occurred on May 14, 2010, we have excluded revenue related to Varian for the period November 1, 2010 to May 14, 2011 when we compare periods without the Varian acquisition. Excluding the Varian acquisition and Hycor
Annu
al R
epor
t Fin
anci
als
3
divestiture, growth in demand for life sciences products increased in all markets led by sales into the pharmaceutical and biotechnology end-market for the year ended October 31, 2011, when compared to the prior year. Excluding the Varian acquisition, sales to all end-markets grew across the chemical analysis business, in particular the petrochemical market, for the year ended October 31, 2011 when compared to 2010. Within electronic measurement, general purpose end-markets improved in 2011 when compared to the prior year as a result of the recovery in the electronics and semiconductor businesses. Also within electronic measurement, the communications test businesses improved strongly in the year ended October 31, 2011 when compared to the prior year with wireless manufacturing reporting good revenue growth in the year. Agilent’s total net revenue in 2010 increased 21 percent when compared to 2009. The revenue increase associated with the Varian acquisition less the revenue attributable to our divested businesses (the network solutions and Hycor businesses) accounted for 3 percentage points of revenue increase for the year ended October 31, 2010 when compared to 2009.
Net income was $1,012 million in 2011 compared to net income of $684 million in 2010 and a net loss of $31 million in 2009. In 2011, 2010 and 2009 we generated operating cash flows of $1,260 million, $718 million and $408 million, respectively. As of October 31, 2011 and 2010 we had cash and cash equivalents balances of $3,527 million and $2,649 million, respectively.
On May 14, 2010, we completed our acquisition of Varian by means of a merger of one of our wholly-owned subsidiaries with and into Varian such that Varian became a wholly-owned subsidiary of Agilent. We financed the purchase price of Varian using the proceeds from our September 2009 offering of senior notes and other existing cash. The Varian merger has been accounted for in accordance with the authoritative accounting guidance and the results of Varian are included in Agilent’s consolidated financial statements from the date of merger. For additional details related to the acquisition of Varian, see Note 3, “Acquisition of Varian”.
Looking forward, we believe there are continued marketing opportunities in emerging markets and improvements to be achieved in operating performance by leveraging our design, supply chain and manufacturing capabilities. In addition, we will continue integrating Varian’s order fulfillment systems and processes into Agilent and our priority is to focus on revenue and cost synergies, as well as increase technology sharing between our businesses. As a result of the integration of Varian into Agilent, we are expecting to achieve $100 million in net cost savings. Approximately 1/3 of the net cost savings have been generated within general and administrative expenses at the end of fiscal 2011 and the remaining savings within the costs of products and services are expected to be realized by the end of fiscal 2013.
Critical Accounting Policies and Estimates
The preparation of financial statements in accordance with accounting principles generally accepted in the U.S. requires management to make estimates and assumptions that affect the amounts reported in our consolidated financial statements and accompanying notes. Management bases its estimates on historical experience and various other assumptions believed to be reasonable. Although these estimates are based on management’s best knowledge of current events and actions that may impact the company in the future, actual results may be different from the estimates. Our critical accounting policies are those that affect our financial statements materially and involve difficult, subjective or complex judgments by management. Those policies are revenue recognition, inventory valuation, share-based compensation, retirement and post-retirement plan assumptions, goodwill and purchased intangible assets, restructuring and asset impairment charges and accounting for income taxes.
Revenue recognition. We enter into agreements to sell products (hardware or software), services, and other arrangements (multiple element arrangements) that include combinations of products and services. Revenue from product sales, net of trade discounts and allowances, is

4
recognized provided that persuasive evidence of an arrangement exists, delivery has occurred, the price is fixed or determinable, and collectability is reasonably assured. Delivery is considered to have occurred when title and risk of loss have transferred to the customer. Revenue is reduced for estimated product returns, when appropriate. For sales that include customer-specified acceptance criteria, revenue is recognized after the acceptance criteria have been met. For products that include installation, if the installation meets the criteria to be considered a separate element, product revenue is recognized upon delivery, and recognition of installation revenue occurs when the installation is complete. Otherwise, neither the product nor the installation revenue is recognized until the installation is complete. Revenue from services is deferred and recognized over the contractual period or as services are rendered and accepted by the customer. We allocate revenue to each element in our multiple-element arrangements based upon their relative selling prices. We determine the selling price for each deliverable based on a selling price hierarchy. The selling price for a deliverable is based on our vendor specific objective evidence (VSOE) if available, third-party evidence (TPE) if VSOE is not available, or estimated selling price (ESP) if neither VSOE nor TPE is available. Revenue from the sale of software products that are not required to deliver the tangible product’s essential functionality are accounted for under software revenue recognition rules. Revenue allocated to each element is then recognized when the basic revenue recognition criteria for that element have been met. The amount of product revenue recognized is affected by our judgments as to whether an arrangement includes multiple elements.
We use VSOE of selling price in the selling price allocation in all instances where it exists. VSOE of selling price for products and services is determined when a substantial majority of the selling prices fall within a reasonable range when sold separately. TPE of selling price can be established by evaluating largely interchangeable competitor products or services in standalone sales to similarly situated customers. As our products contain a significant element of proprietary technology and the solution offered differs substantially from that of competitors, it is difficult to obtain the reliable standalone competitive pricing necessary to establish TPE. ESP represents the best estimate of the price at which we would transact a sale if the product or service were sold on a standalone basis. We determine ESP for a product or service by using historical selling prices which reflect multiple factors including, but not limited to customer type, geography, market conditions, competitive landscape, gross margin objectives and pricing practices. The determination of ESP is made through consultation with and approval by management. We may modify or develop new pricing practices and strategies in the future. As these pricing strategies evolve, we may modify our pricing practices in the future, which may result in changes in ESP. The aforementioned factors may result in a different allocation of revenue to the deliverables in multiple element arrangements from the current fiscal quarter, which may change the pattern and timing of revenue recognition for these elements but will not change the total revenue recognized for the arrangement.
Inventory valuation. We assess the valuation of our inventory on a periodic basis and make adjustments to the value for estimated excess and obsolete inventory based upon estimates about future demand and actual usage. Such estimates are difficult to make under most economic conditions. The excess balance determined by this analysis becomes the basis for our excess inventory charge. Our excess inventory review process includes analysis of sales forecasts, managing product rollovers and working with manufacturing to maximize recovery of excess inventory. If actual market conditions are less favorable than those projected by management, additional write-downs may be required. If actual market conditions are more favorable than anticipated, inventory previously written down may be sold to customers, resulting in lower cost of sales and higher income from operations than expected in that period.
Share‑based compensation. We account for share-based awards in accordance with the authoritative guidance. Under the authoritative guidance, share-based compensation expense is primarily based on estimated grant date fair value and is recognized on a straight line basis. The fair value of share-based awards for employee stock option awards was estimated using the

Annu
al R
epor
t Fin
anci
als
5
Black-Scholes option pricing model. Shares granted under the LTPP were valued using the Monte Carlo simulation model. The estimated fair value of restricted stock unit awards is determined based on the market price of Agilent’s common stock on the date of grant. The ESPP allows eligible employees to purchase shares of our common stock at 85 percent of the purchase price and uses the purchase date to establish the fair market value.
Both the Black-Scholes and Monte Carlo simulation fair value models require the use of highly subjective and complex assumptions, including the option’s expected life and the price volatility of the underlying stock. The expected stock price volatility assumption was determined using the historical volatility of Agilent’s stock option over the most recent historical period equivalent to the expected life. A 10 percent increase in our estimated volatility from 35 percent to 45 percent for our most recent employee stock option grant would generally increase the value of an award and the associated compensation cost by approximately 23 percent if no other factors were changed.
In 2009 and 2010 the expected life of our employee stock options was 4.4 years. In the first quarter of 2011, we revised our estimate of the expected life of our employee stock options from 4.4 to 5.8 years. For the grants awarded under the 2009 stock plan after November 1, 2010, we increased the period available to retirement eligible employees to exercise their options from three years at retirement date to the full contractual term of ten years. In developing our estimated life of our employee stock options of 5.8 years, we considered the historical option exercise behavior of our executive employees who were granted the majority of the options in the annual grants made during the three months ended January 31, 2011, which we believe is representative of future behavior. See Note 4, “Share-based Compensation,” to the consolidated financial statements for more information.
The assumptions used in calculating the fair value of share-based awards represent our best estimates, but these estimates involve inherent uncertainties and the application of management judgment. Although we believe the assumptions and estimates we have made are reasonable and appropriate, changes in assumptions could materially impact our reported financial results.
Retirement and post‑retirement benefit plan assumptions. Retirement and post-retirement benefit plan costs are a significant cost of doing business. They represent obligations that will ultimately be settled sometime in the future and therefore are subject to estimation. Pension accounting is intended to reflect the recognition of future benefit costs over the employees’ average expected future service to Agilent based on the terms of the plans and investment and funding decisions. To estimate the impact of these future payments and our decisions concerning funding of these obligations, we are required to make assumptions using actuarial concepts within the framework of accounting principles generally accepted in the U.S. Two critical assumptions are the discount rate and the expected long-term return on plan assets. Other important assumptions include, expected future salary increases, expected future increases to benefit payments, expected retirement dates, employee turnover, retiree mortality rates, and portfolio composition. We evaluate these assumptions at least annually.
The discount rate is used to determine the present value of future benefit payments at the measurement date — October 31 for both U.S. and non-U.S. plans. For 2011 and 2010, the U.S. discount rates were based on the results of matching expected plan benefit payments with cash flows from a hypothetically constructed bond portfolio and decreased in 2011 from the previous year. In 2011, the discount rate for non-U.S. plans was generally based on published rates for high quality corporate bonds and either remained unchanged or decreased. Lower discount rates increase present values and subsequent year pension expense; higher discount rates decrease present values and subsequent year pension expense.

6
The company uses alternate methods of amortization as allowed by the authoritative guidance which amortizes the actuarial gains and losses on a consistent basis for the years presented. For U.S. Plans, gains and losses are amortized over the average future working lifetime. For most Non-U.S. Plans and U.S. Post-Retirement Benefit Plans, gains and losses are amortized using a separate layer for each year’s gains and losses. The expected long-term return on plan assets is estimated using current and expected asset allocations as well as historical and expected returns. Plan assets are valued at fair value. If we changed our estimated return on assets by 1 percent, the impact would be $6 million on U.S. pension expense and $17 million on non-U.S. pension expense. The net periodic pension and post-retirement benefit costs recorded in operations excluding curtailments and settlements were $58 million in 2011, $82 million in 2010, and $103 million in 2009.
Goodwill and purchased intangible assets. Agilent reviews goodwill for impairment annually during our fourth fiscal quarter and whenever events or changes in circumstances indicate the carrying value may not be recoverable. As defined in the authoritative guidance, a reporting unit is an operating segment, or one level below an operating segment. We have aggregated components of an operating segment that have similar economic characteristics into our reporting units. We have three reporting units for goodwill impairment testing purposes: life sciences, chemical analysis and electronic measurement. At the time of an acquisition, we assign goodwill to the reporting unit that is expected to benefit from the synergies of the combination.
In September 2011, the FASB approved changes to the goodwill impairment guidance which are intended to reduce the cost and complexity of the annual impairment test. The changes provide entities an option to perform a qualitative assessment to determine whether further impairment testing is necessary. The revised standard gives an entity the option to first assess qualitative factors to determine whether performing the current two-step test is necessary. If an entity believes, as a result of its qualitative assessment, that it is more-likely-than-not (i.e. > 50% chance) that the fair value of a reporting unit is less than its carrying amount, the quantitative impairment test will be required. Otherwise, no further testing will be required.
The revised guidance includes examples of events and circumstances that might indicate that a reporting unit’s fair value is less than its carrying amount. These include macro-economic conditions such as deterioration in the entity’s operating environment or industry or market considerations; entity-specific events such as increasing costs, declining financial performance, or loss of key personnel; or other events such as an expectation that a reporting unit will be sold or a sustained decrease in the stock price on either an absolute basis or relative to peers.
The new qualitative indicators replace those currently used to determine whether an interim goodwill impairment test is required. The changes will be effective for annual and interim goodwill impairment tests performed for fiscal years beginning after December 15, 2011. However, earlier adoption is permitted. Agilent has opted to early adopt this guidance for the year ended October 31, 2011.
If it is determined, as a result of the qualitative assessment, that it is more-likely-than-not that the fair value of a reporting unit is less than its carrying amount, the provisions of authoritative guidance require that we perform a two-step impairment test on goodwill. In the first step, we compare the fair value of each reporting unit to its carrying value. The second step (if necessary) measures the amount of impairment by applying fair-value-based tests to the individual assets and liabilities within each reporting unit.
Based on our results of our qualitative test for goodwill impairment, as of September 30, 2011, we believe that it is more-likely-than-not that the fair value of each of our three reporting units, life sciences, chemical analysis and electronic measurement, is greater than their respective carrying

Annu
al R
epor
t Fin
anci
als
7
values. There was no impairment of goodwill during the years ended October 31, 2011, 2010 and 2009. Each quarter we review the events and circumstances to determine if goodwill impairment is indicated.
Purchased intangible assets consist primarily of acquired developed technologies, proprietary know-how, trademarks, and customer relationships and are amortized using the straight-line method over estimated useful lives ranging from 6 months to 15 years. In process research and development (IPR&D) is initially capitalized at fair value as an intangible asset with an indefinite life and assessed for impairment thereafter. When the IPR&D project is complete, it is reclassified as an amortizable purchased intangible asset and is amortized over its estimated useful life. If an IPR&D project is abandoned, Agilent will record a charge for the value of the related intangible asset to Agilent’s consolidated statement of operations in the period it is abandoned.
We continually monitor events and changes in circumstances that could indicate carrying amounts of long-lived assets, including purchased intangible assets, may not be recoverable. When such events or changes in circumstances occur, we assess the recoverability of long-lived assets by determining whether the carrying value of such assets will be recovered through undiscounted expected future cash flows. If the total of the undiscounted future cash flows is less than the carrying amount of those assets, we recognize an impairment loss based on the excess of the carrying amount over the fair value of the assets. We performed impairment analyses of purchased intangible assets in 2011 and recorded $3 million of impairment charges primarily related to a business where we ceased operations. We performed impairment analyses of purchased intangible assets in 2010 and recorded $13 million of impairment charges primarily related to a divested business.
Restructuring and asset impairment charges. The four main components of our restructuring plans are related to workforce reductions, the consolidation of excess facilities, asset impairments and special charges related to inventory. Workforce reduction charges are accrued when it is determined that a liability has been incurred, which is generally after individuals have been notified of their termination dates and expected severance payments. Plans to consolidate excess facilities result in charges for lease termination fees and future commitments to pay lease charges, net of estimated future sublease income. We recognize charges for consolidation of excess facilities generally when we have vacated the premises. These estimates were derived using the authoritative accounting guidance. We have also assessed the recoverability of our long-lived assets, by determining whether the carrying value of such assets will be recovered through undiscounted future cash flows. Asset impairments primarily consist of property, plant and equipment and are based on an estimate of the amounts and timing of future cash flows related to the expected future remaining use and ultimate sale or disposal of buildings and equipment net of costs to sell. The charges related to inventory include estimated future inventory disposal payments that we are contractually obliged to make to our suppliers and reserves taken against inventory on hand. If the amounts and timing of cash flows from restructuring activities are significantly different from what we have estimated, the actual amount of restructuring and asset impairment charges could be materially different, either higher or lower, than those we have recorded.
Accounting for income taxes. We must make certain estimates and judgments in determining income tax expense for financial statement purposes. These estimates and judgments occur in the calculation of tax credits, benefits and deductions, and in the calculation of certain tax assets and liabilities which arise from differences in the timing of recognition of revenue and expense for tax and financial statement purposes, as well as interest and penalties related to uncertain tax positions. Significant changes to these estimates may result in an increase or decrease to our tax provision in a subsequent period.

8
Significant management judgment is also required in determining whether deferred tax assets will be realized in full or in part. When it is more likely than not that all or some portion of specific deferred tax assets such as net operating losses or foreign tax credit carryforwards will not be realized, a valuation allowance must be established for the amount of the deferred tax assets that cannot be realized. We consider all available positive and negative evidence on a jurisdiction-by-jurisdiction basis when assessing whether it is more likely than not that deferred tax assets are recoverable. We consider evidence such as our past operating results, the existence of cumulative losses in recent years and our forecast of future taxable income. At October 31, 2011, we provided a valuation allowance for our net U.S. deferred tax assets and on certain foreign deferred tax assets. We intend to maintain a valuation allowance in these jurisdictions until sufficient positive evidence exists to support its reversal.
Due to improvements in the U.S. operating results over the past three years, management believes a reasonable possibility exists that, within the next year, sufficient positive evidence may become available to reach a conclusion that the U.S. valuation allowance will no longer be needed.
We have not provided for all U.S. federal income and foreign withholding taxes on the undistributed earnings of some of our foreign subsidiaries because we intend to reinvest such earnings indefinitely. Should we decide to remit this income to the U.S. in a future period, our provision for income taxes will increase materially in that period.
The calculation of our tax liabilities involves dealing with uncertainties in the application of complex tax law and regulations in a multitude of jurisdictions. Although the guidance on the accounting for uncertainty in income taxes prescribes the use of a recognition and measurement model, the determination of whether an uncertain tax position has met those thresholds will continue to require significant judgment by management. If the ultimate resolution of tax uncertainties is different from what is currently estimated, a material impact on income tax expense could result.
Adoption of New Pronouncements
See Note 2, “New Accounting Pronouncements,” to the consolidated financial statements for a description of new accounting pronouncements.
Restructuring Costs, Asset Impairments and Other Charges
Our 2009 restructuring program, the (“FY 2009 Plan”), announced in the first half of 2009, was conceived in response to deteriorating economic conditions and was designed to deliver sufficient savings to enable our businesses to reach their profitability targets throughout the cycle. Workforce reduction payments, primarily severance, were largely complete in fiscal year 2010. Lease payments should primarily be complete by the end of fiscal 2014.
Foreign Currency
Our revenues, costs and expenses, and monetary assets and liabilities are exposed to changes in foreign currency exchange rates as a result of our global operating and financing activities. We hedge revenues, expenses and balance sheet exposures that are not denominated in the functional currencies of our subsidiaries on a short term and anticipated basis. We do experience some fluctuations within individual lines of the consolidated statement of operations and balance sheet because our hedging program is not designed to offset the currency movements in each category of revenues, expenses, monetary assets and liabilities. Our hedging program is designed to hedge currency movements on a relatively short-term basis (rolling twelve month period). Therefore, we are exposed to currency fluctuations over the longer term.

Annu
al R
epor
t Fin
anci
als
9
Results from Operations
Orders and Net Revenue
Years Ended October 31, 2011 over 2010% Change
2010 over 2009% Change2011 2010 2009
(in millions)
Orders . . . . . . . . . . . . . . . . . . . . . . . . . . . . . . . . $6,769 $ 5,744 $4,486 18% 28%
Net revenue:Products . . . . . . . . . . . . . . . . . . . . . . . . . . . . $5,482 $4,464 $3,566 23% 25%Services and other . . . . . . . . . . . . . . . . . . . . $1,133 $ 980 $ 915 16% 7%
Total net revenue . . . . . . . . . . . . . . . . . . . . . . . $6,615 $5,444 $4,481 22% 21%
Years Ended October 31, 2011 over 2010 Ppts Change
2010 over 2009 Ppts Change2011 2010 2009
% of total net revenue:Products . . . . . . . . . . . . . . . . . . . . . . . . . . . . 83% 82% 80% 1 2Services and other . . . . . . . . . . . . . . . . . . . . 17% 18% 20% (1) (2)
Total. . . . . . . . . . . . . . . . . . . . . . . . . . . . . . . . 100% 100% 100%
Agilent’s total orders in 2011 were $6,769 million, an increase of 18 percent when compared to 2010. The increase in orders associated with the Varian acquisition less the orders attributable to divested businesses (the network solutions and Hycor businesses) accounted for 5 percentage points of order growth for the year ended October 31, 2011 when compared to 2010. Due to the close date of the Varian acquisition, which occurred on May 14, 2010, we have excluded orders related to Varian for the period November 1, 2010 to May 14, 2011 when we compare periods without the Varian acquisition. The increase in orders in the year ended October 31, 2011 compared with last year was attributable to improvement in many of our instrument platforms, consumables and services. Agilent’s total orders in 2010 increased 28 percent when compared to 2009. The increase in orders associated with the Varian acquisition less the orders attributable to our divested businesses (the network solutions and Hycor businesses) accounted for 3 percentage points of order growth for the year ended October 31, 2010 when compared to 2009. The increase in orders in the year ended October 31, 2010 compared with the prior year was due to a strong performance in new products and service and support businesses.
Agilent’s net revenue of $6,615 million increased 22 percent when compared to 2010. The revenue increase associated with the Varian acquisition less the revenue attributable to our divested businesses (the network solutions and Hycor businesses) accounted for approximately 5 percentage points of the revenue increase for the year ended October 31, 2011 when compared to 2010. Due to the close date of the Varian acquisition, which occurred on May 14, 2010, we have excluded revenue related to Varian for the period November 1, 2010 to May 14, 2011 when we compare periods without the Varian acquisition. Excluding the Varian acquisition and Hycor divestiture, growth in demand for life sciences products increased in all markets led by sales into the pharmaceutical and biotechnology end-market for the year ended October 31, 2011, when compared to the prior year. Excluding the Varian acquisition, sales to all end-markets grew across the chemical analysis business, in particular the petrochemical market, for the year ended October 31, 2011 when compared to 2010. Within electronic measurement, general purpose end-markets improved in 2011 when compared to the prior year as a result of the recovery in the electronics and semiconductor businesses. Also within electronic measurement, the communications test businesses improved in the year ended October 31, 2011 when compared to

10
the prior year with wireless manufacturing reporting good revenue growth in the year. Agilent’s total net revenue in 2010 increased 21 percent when compared to 2009. The revenue increase associated with the Varian acquisition less the revenue attributable to our divested businesses (the network solutions and Hycor businesses) accounted for 3 percentage points of revenue increase for the year ended October 31, 2010 when compared to 2009. Note 21, “Segment Information” shows a reconciliation between segment revenue and net revenue.
Services and other revenue include revenue generated from servicing our installed base of products, warranty extensions and consulting. Services and other revenue increased 16 percent in 2011 as compared to 2010. The increase in services and other revenue associated with the Varian acquisition less the revenue attributable to the network solutions divestiture accounted for 2 percentage point of revenue increase in 2011. Services and other revenue increased 7 percent in 2010 as compared to 2009. The increase in services and other revenue associated with the Varian acquisition less the revenue attributable to the network solutions divestiture accounted for 1 percentage point of revenue increase in 2010. The service and other revenue growth is lower than product revenue growth due to only a proportion of product sales attracting service contracts, the recognition of warranty revenue over an extended period and a portion of the revenue being driven more by the previously installed base than current period product sales.
Backlog
On October 31, 2011, our unfilled orders for the life sciences business were approximately $430 million, as compared to approximately $350 million at October 31, 2010. On October 31, 2011, our unfilled orders for the chemical analysis business were approximately $320 million, as compared to approximately $250 million at October 31, 2010. On October 31, 2011, our unfilled orders for the electronic measurement business were approximately $810 million, as compared to $830 million at October 31, 2010. We expect that a large majority of the unfilled orders for all three businesses will be delivered to customers within six months. On average, our unfilled orders represent approximately three months’ worth of revenues. In light of this experience, backlog on any particular date, while indicative of short-term revenue performance, is not necessarily a reliable indicator of medium or long-term revenue performance.
Costs and Expenses
Years Ended October 31, 2011 over 2010 Change
2010 over 2009 Change2011 2010 2009
Gross margin on products . . . . . . . . . . . 54.9% 55.7% 52.6% (1) ppt 3 pptsGross margin on services and other . . . 45.9% 45.1% 45.7% 1 ppt (1) pptTotal gross margin . . . . . . . . . . . . . . . . . 53.3% 53.8% 51.1% (1) ppt 3 pptsOperating margin . . . . . . . . . . . . . . . . . . 16.2% 10.3% 1.0% 6 ppts 9 ppts
(in millions)
Research and development . . . . . . . . . . $ 649 $ 612 $ 642 6% (5)%Selling, general and administrative . . . $1,809 $1,752 $ 1,603 3% 9%
In 2011, total gross margin decreased 1 percentage point in comparison to 2010. The unfavorable impact of the Varian acquisition (including fair value adjustments) and higher variable and incentive pay were largely offset by the benefits of favorable volume impacts, decreased business and infrastructure programs and lower restructuring costs. Operating margins in 2011 increased 6 percentage points as compared to 2010 due to higher volume partly offset by increased variable and incentive pay. In 2010, total gross margin increased 3 percentage points in comparison to 2009 and operating margins in 2010 increased 9 percentage points as compared to 2009.

Annu
al R
epor
t Fin
anci
als
11
The benefits of business and infrastructure programs, lower restructuring costs, together with favorable volume impacts offset the unfavorable impact of the Varian acquisition (including fair value adjustments), wage restoration and higher variable and incentive pay.
Research and development expenditures increased 6 percent in 2011 compared to 2010. Increased expenditure was due to our continued investment in new product development, the Varian acquisition and higher variable and incentive pay. These increases were partly offset by the impact of the divested businesses (the network solutions and Hycor businesses) and decreased restructuring expenses. Research and development expenditures decreased 5 percent in 2010 compared to 2009. Increases in expenses due to the Varian acquisition, wage restoration, higher variable and incentive pay were more than offset by the impact of the divested businesses (the network solutions and Hycor businesses) and decreased restructuring expenses.
Selling, general and administrative expenses increased 3 percent in 2011 compared to 2010. Increased expenditure was due to the Varian acquisition and higher variable and incentive pay offset by the impact of decreased restructuring expenses and the costs associated with the divested businesses (the network solutions and Hycor businesses). Selling, general and administrative expenses increased 9 percent in 2010 compared to 2009. Increased expenditure was due to the Varian acquisition, higher variable and incentive pay and wage restoration offset by the impact of decreased restructuring expenses and the divested businesses (the network solutions and Hycor businesses).
Gross inventory charges were $30 million in 2011 and 2010 and $54 million in 2009. Sales of previously written down inventory were $5 million in 2011 and 2010 and $8 million in 2009.
Our research and development efforts focus on potential new products and product improvements covering a wide variety of technologies, none of which is individually significant to our operations. We conduct five types of research and development: basic research, foundation technologies, communications, life sciences and measurement. Our research seeks to improve on various technical competencies in electronics, software, systems and solutions, life sciences and photonics. In each of these research fields, we conduct research that is focused on specific product development for release in the short-term as well as other research that is intended to be the foundation for future products over a longer time-horizon. Some of our product development research is designed to improve on the more than 20,000 products already in production, focus on major new product releases, and develop new product segments for the future. Due to the breadth of research and development projects across all of our businesses, there are a number of drivers of this expense. We remain committed to invest about 10 percent of revenues in research and development and have focused our development efforts on key strategic opportunities to align our business with available markets and position ourselves to capture market share.
For the year ended October 31, 2010 we recorded a $132 million gain on the sale of our network solutions business and $54 million of income in respect of a tax sharing settlement with Hewlett Packard Company.
At October 31, 2011, our headcount was approximately 18,700 compared to 18,500 in 2010 and 16,800 in 2009. The increase in our headcount in 2010, compared to 2009, was due to the Varian acquisition.
Provision for Income Taxes
Years Ended October 31,
2011 2010 2009
(in millions)
Provision for income taxes . . . . . . . . . . . . . . . . . . . . . . . . . . $20 $8 $38
12
Agilent enjoys tax holidays in several different jurisdictions, most significantly in Singapore, and Malaysia. The tax holidays provide lower rates of taxation on certain classes of income and require various thresholds of investments and employment or specific types of income in those jurisdictions. The tax holidays are due for renewal between 2015 and 2023. As a result of the incentives, the impact of the tax holidays decreased income taxes by $127 million, $62 million and $14 million in 2011, 2010 and 2009, respectively. The benefit of the tax holidays on net income (loss) per share (diluted) was approximately $0.36, $0.18 and $0.04 in 2011, 2010 and 2009, respectively.
For 2011, the effective tax rate was 2 percent. The 2 percent effective tax rate reflects tax on earnings in jurisdictions that have low effective tax rates and includes a $97 million net tax benefit primarily associated with a refund in Canada and the recognition of previously unrecognized tax benefits and the reversal of the related interest accruals due to the reassessment of certain uncertain tax positions. The income tax provision also includes a $26 million out of period adjustment to reduce the carrying value of certain U.K. deferred tax assets for which the majority was recorded in the quarter ended April 30, 2011. The overstatement of these deferred tax assets resulted in an overstatement of the U.K. valuation allowance release in the fourth quarter of 2010. For the full year, this out of period adjustment was substantially offset by other out of period adjustments. The net impact of all out of period adjustments on the effective tax rate was immaterial. Without considering interest and penalties, the effective rate reflects taxes in all jurisdictions except the U.S. and certain foreign jurisdictions in which income tax expense or benefit continues to be offset by adjustments to valuation allowances. We intend to maintain valuation allowances in these jurisdictions until sufficient positive evidence exists to support its reversal.
For 2010, the effective tax rate was 1 percent. The 1 percent effective tax rate includes a $101 million beneficial release of the U.K. valuation allowance, a $32 million current year increase in prior year tax reserves, and tax on earnings in jurisdictions that have low effective tax rates. Also included is a $17 million tax benefit related to a $54 million non-taxable settlement payment received in connection with a tax sharing agreement between Agilent and Hewlett Packard Company. Without considering interest and penalties, the effective rate reflects taxes in all jurisdictions except the U.S. and certain foreign jurisdictions in which income tax expense or benefit continues to be offset by adjustments to valuation allowances. We intend to maintain a valuation allowance in these jurisdictions until sufficient positive evidence exists to support its reversal.
For 2009, the effective tax rate was 543 percent. The 543 percent effective tax rate reflects that our structure has a fixed component that results in unusual tax results on reduced levels of profitability. The tax rate also includes tax on earnings in jurisdictions that have low effective tax rates. In addition, net tax benefits totaling $71 million relating primarily to the lapses of statutes of limitations and tax settlements in foreign jurisdictions are incorporated in the rate. Without considering interest and penalties, the rate reflects taxes in all jurisdictions except the U.S. and foreign jurisdictions where we have recorded valuation allowances.
During 2003, we established a valuation allowance for the deferred tax assets of the U.S. and certain entities in foreign jurisdictions. The valuation allowance requires an assessment of both positive and negative evidence when determining whether it is more likely than not that deferred tax assets are recoverable. Such assessment is required on a jurisdiction by jurisdiction basis. During 2009, 2010, and 2011, we continued to maintain valuation allowance for U.S. federal and state deferred tax assets until sufficient positive evidence exists to support its reversal. We currently have a valuation allowance of $369 million of which $308 million relates to U.S. jurisdictions. The reduction to the valuation allowance in 2011 is primarily due to the reduction in the deferred taxes relating to pension and post retirement medical benefits and the utilization of tax credits associated with the repatriation of foreign earnings. Due to improvements in the U.S. operating results over the past three years, management believes a reasonable possibility exists
Annu
al R
epor
t Fin
anci
als
13
that, within the next year, sufficient positive evidence may become available to reach a conclusion that the U.S. valuation allowance will no longer be needed. In 2010 after consideration of all the available positive and negative evidence, we concluded that it is more likely than not that all of the U.K. deferred tax assets will be realized and reversed the entire U.K. valuation allowance.
In accordance with the guidance on the accounting for uncertainty in income taxes, for all U.S. and other tax jurisdictions, we recognize potential liabilities for anticipated tax audit issues based on our estimate of whether, and the extent to which, additional taxes and interest will be due. If our estimate of income tax liabilities proves to be less than the ultimate assessment, a further charge to expense would be required. If events occur and the payment of these amounts ultimately proves to be unnecessary, the reversal of the liabilities would result in tax benefits being recognized in the period when we determine the liabilities are no longer necessary. We include interest and penalties related to unrecognized tax benefits within the provision for income taxes on the consolidated statements of operations.
On August 31, 2010 we reached an agreement with the Internal Revenue Service (“IRS”) for tax years 2000 through 2002. The adjustments were offset by applying available net operating losses and had no material impact on our statement of operations. In December 2010, we reached an agreement with the IRS for tax years 2003-2005. In addition, Agilent and the IRS reached an agreement on transfer pricing issues covering years 2003-2007. Tax adjustments resulting from these agreements will be offset with net operating losses and tax credit carryforwards. Agilent’s U.S. federal income tax returns for 2006 through 2007 are currently under audit by the IRS. Primarily as a result of these agreements with the IRS and agreements with other tax jurisdictions, unrecognized tax benefits were reduced from $656 million at October 31, 2010 to $469 million at October 31, 2011.
Segment Overview
Agilent is a measurement company providing core bio-analytical and electronic measurement solutions to the life sciences, chemical analysis, communications and electronics industries. Agilent has three primary businesses focused on the life sciences market, the chemical analysis market and the electronic measurement market.
Life Sciences
Our life sciences business provides application-focused solutions that include instruments, software, consumables, and services that enable customers to identify, quantify and analyze the physical and biological properties of substances and products. Key product categories in life sciences include: DNA and RNA microarrays and associated scanner, software, and reagents; microfluidics-based sample analysis systems; liquid chromatography (LC) systems, columns and components; liquid chromatography mass spectrometry (LCMS) systems; capillary electrophoresis systems; laboratory software and informatics systems; bio-reagents and related products; laboratory automation and robotic systems, dissolution testing; Nuclear Magnetic Resonance (NMR) and Magnetic Resonance Imaging (MRI) systems along with X-Ray crystallography, and services and support for the aforementioned products.

14
Orders and Net Revenue
Years Ended October 31, 2011 over 2010 Change
2010 over 2009 Change2011 2010 2009
(in millions)
Orders . . . . . . . . . . . . . . . . . . . . . . . . . . . . . $1,875 $1,526 $1,234 23% 24%
Net revenue from products . . . . . . . . . . . . $1,424 $1,179 $ 964 21% 22%Net revenue from services and other. . . . 368 300 255 23% 18%
Total net revenue . . . . . . . . . . . . . . . . . . . . $1,792 $1,479 $1,219 21% 21%
Life sciences orders in 2011 increased 23 percent compared to 2010. Excluding the impact of the Varian acquisition, the Hycor divestiture and our recent acquisitions of Biocius and Lab901, orders grew 13 percent year over year. Due to the close date of the Varian acquisition which occurred on May 14, 2010, we have excluded the period from November 1, 2010 to May 14, 2011 when we compare periods without the Varian acquisition. Order results were led by strength in the LC-MS, automation, informatics, genomics, consumables, and services portfolios. We saw solid performance in key products, such as the 1200 Infinity LC Series, LC/Triple Quadrupole (QQQ) system, SureSelect Complete, and OpenLAB software suite. Geographically, excluding the impact of acquisitions and the Hycor divestiture, orders grew 7 percent in the Americas, 15 percent in Europe, 4 percent in Japan, and 21 percent in other Asia Pacific during 2011 when compared to 2010. Outstanding performance of LC-MS instrument systems in China contributed to Asia Pacific regional growth. Life sciences orders in 2010 increased 24 percent compared to 2009. Excluding acquisitions and the Hycor divestiture, life sciences orders in 2010 increased 15 percent compared to 2009, driven by strength in the LC, microarray, and automation portfolios, along with consumables and services.
Life sciences net revenue in 2011 increased 21 percent compared to 2010. Excluding the impact of the Varian acquisition, the Hycor divestiture and other recent acquisitions, revenue grew 13 percent year over year. In addition, foreign currency movements for 2011 had a favorable impact of 3 percentage points compared to 2010. Revenue growth was led by the LC, LC-MS, automation, genomics, and services portfolios, along with Research Products including NMR and MRI. The automation business continues to scale globally through increased market penetration and new product introductions, while SureSelect Complete remains a key performer for the genomics business. Geographically, excluding the impact of acquisitions and the Hycor divestiture, revenues grew 11 percent in the Americas, 7 percent in Europe, 16 percent in Japan, and 23 percent in other Asia Pacific during 2011 when compared to 2010. Growth in the Americas was helped by an expanded sales channel selling a broader portfolio of products to our customers, while China growth remains strong. Life sciences revenues in 2010 increased 21 percent compared to 2009. Excluding acquisitions and the Hycor divestiture, life sciences revenues in 2010 increased 14 percent compared to 2009, with growth in all regional markets, especially the Americas, Japan, and other Asia Pacific regions.
During this fiscal year, solid revenue growth was present in the pharmaceutical and biotech, academic and government markets, as well as in other applied markets such as petrochemical. However, we saw a slowdown in growth from the pharmaceutical market toward the end of the fiscal year. Despite budget restrictions in most large pharmaceutical companies, technology refresh programs continue to drive traditional replacement business to move to the latest technologies. In the academic market, next generation sequencing continues to be very active. The petrochemical and food safety applied markets remain strong.
Looking forward, we expect reasonable momentum in our markets to drive further demand in our instruments and application solutions. The life sciences business also remains focused on expanding our application portfolio. The Lab901 acquisition will allow us to address the demand
Annu
al R
epor
t Fin
anci
als
15
for higher automation and throughput for DNA and protein analysis. With the acquisition of Biocius Life Sciences and its RapidFire high-throughput mass spectrometry drug-screening technology platform, we are well positioned to expand our reach within the pharmaceutical market. The life sciences channel is specifically adding capabilities to address life science applications expertise, an area of critical need. We will also focus on investments related to emerging countries and emerging markets.
In addition, our strategic focus is to complete the successful integration of the Varian expanded life sciences product portfolio, including complementary products in liquid chromatography, mass spectrometry, consumables, new offerings in dissolution testing, and magnetic resonance (NMR, MRI). We are focusing on improving the Research Product Division growth and profitability. Progress has been made in filling service and sales positions, as well as redefining teams internally. Additionally, supply chain and manufacturing support have been added and factories are being modified to meet future growth and cost goals.
Gross Margin and Operating Margin
The following table shows the life sciences business’ margins, expenses and income from operations for 2011 versus 2010, and 2010 versus 2009.
Years Ended October 31, 2011 over 2010 Change
2010 over 2009 Change2011 2010 2009
Total gross margin . . . . . . . . . . . . . . . . . 52.0% 53.5% 54.2% (2) ppts (1) pptOperating margin . . . . . . . . . . . . . . . . . . 13.2% 15.0% 14.3% (2) ppts 1 ppt
(in millions)
Research and development . . . . . . . . . . $ 174 $142 $131 22% 9%Selling, general and administrative . . . $522 $427 $356 22% 20%Income from operations . . . . . . . . . . . . . $237 $221 $ 174 7% 27%
Gross margins declined by 2 percentage points in 2011 compared to 2010. Changes in 2011 were due to the impact of the Varian portfolio, higher logistics costs, and higher consumables costs partially offset by favorable volume impact. Gross margins declined by 1 percentage point in 2010 compared to 2009 mainly due to the addition of the Varian portfolio.
Research and development expenses increased 22 percent in 2011 compared to 2010. Increase was due to our acquisitions (Varian, Lab901, and Biocius) and continued investments in new product development. Research and development expenses increased 9 percent in 2010 compared to 2009, mostly driven by the Varian acquisition and selective investments in new product introductions partially offset by the Hycor divestiture.
Selling, general and administrative expenses increased 22 percent in 2011 compared to 2010. Increase was due to acquisitions (Varian, Lab901, and Biocius), higher commissions, and investments in sales channel coverage partially offset by lower discretionary spending. As we grew our installed base, investments in emerging markets and sales support capabilities also had an impact on these expenses. Selling, general and administrative expenses increased 20 percent in 2010 compared to 2009. The increase was mostly driven by the Varian acquisition and establishment and staffing of the dedicated life sciences sales channel partially offset by the Hycor divestiture.

16
Operating margins declined by 2 percentage points in 2011 compared to 2010. Operating margins improved by 1 percentage point in 2010 compared to 2009. Factors which led to operating margin variances for these periods are collectively highlighted in the above discussions on gross margins, research and development expenses, and selling, general and administrative expenses.
Income from Operations
Income from operations in 2011 increased by $16 million or 7 percent on a revenue increase of $313 million, a 5 percent year-over-year operating margin incremental. Income from operations in 2010 increased by $47 million or 27 percent compared to 2009 on a revenue increase of $260 million, an 18 percent year-over-year operating margin incremental.
Chemical Analysis
Our chemical analysis business provides application-focused solutions that include instruments, software, consumables, and services that enable customers to identify, quantify and analyze the physical and biological properties of substances and products. Key product categories in chemical analysis include: gas chromatography (GC) systems, columns and components; gas chromatography mass spectrometry (GC-MS) systems; inductively coupled plasma mass spectrometry (ICP-MS) instruments; atomic absorption (AA) instruments; inductively coupled plasma optical emission spectrometry (ICP-OES) instruments; software and data systems; vacuum pumps and measurement technologies; services and support for our products.
Orders and Net Revenue
Years Ended October 31, 2011 over 2010 Change
2010 over 2009 Change2011 2010 2009
(in millions)
Orders . . . . . . . . . . . . . . . . . . . . . . . . . . . . . . . $1,589 $1,224 $853 30% 43%
Net revenue from products . . . . . . . . . . . . . $ 1,194 $ 954 $653 25% 46%Net revenue from services and other . . . . . 324 246 191 32% 29%
Total net revenue . . . . . . . . . . . . . . . . . . . . . $ 1,518 $1,200 $844 27% 42%
Chemical analysis orders in 2011 increased 30 percent compared to 2010. Excluding the impact of the Varian and A2 Technologies acquisitions, orders grew 11 percent year over year. Due to the close date of the Varian acquisition which occurred on May 14, 2010, we have excluded the period from November 1, 2010 to the May 14, 2011 when we compare periods without the Varian acquisition. Order results were led by solid performance in the GC, GC-MS, and ICP-MS instruments, along with consumables and services. Growth in the services and support business was driven by strength in compliance and preventive maintenance services. Replacement cycle purchasing remains strong, driving solid order performance in instruments such as the 7890A GC, autosampler and 5975 series GC-MS. Geographically, excluding the impact of the Varian and A2 Technologies acquisitions, orders grew 3 percent in the Americas, 10 percent in Europe, 3 percent in Japan, and 24 percent in other Asia Pacific during 2011 when compared to 2010. China continues to be a major growth driver as government investments to upgrade lab capabilities and capacities remain strong. Chemical analysis orders in 2010 increased 43 percent compared to 2009. Excluding acquisitions, chemical analysis orders in 2010 increased 17 percent compared to 2009, driven by strength in the GC, GC-MS, ICPMS, and vacuum pump portfolios, along with consumables and services.

Annu
al R
epor
t Fin
anci
als
17
Chemical analysis net revenue in 2011 increased 27 percent compared to 2010. Excluding the impact of the Varian and A2 Technologies acquisitions, revenues grew 8 percent year over year. In addition, foreign currency movements for 2011 had a favorable impact of 3 percentage points compared to 2010. Revenue growth was led by the GC, GC-MS, and ICP-MS instruments, along with services. Geographically, excluding the impact of the Varian and A2 Technologies acquisitions, revenues grew 1 percent in the Americas, 2 percent in Europe, 4 percent in Japan, and 26 percent in other Asia Pacific during 2011 when compared to 2010. Unexpectedly strong results in the United States last year due to the Gulf of Mexico oil spill remediation efforts and weakness in government spending in the current year negatively impacted year over year comparisons for the Americas. Chemical analysis revenues in 2010 increased 42 percent compared to 2009. Excluding acquisitions, chemical analysis revenues in 2010 increased 15 percent compared to 2009, with growth in all regional markets, especially the Americas, Japan, and other Asia Pacific regions.
Growth in core end markets continues. The energy, chemical, and food markets remain strong overall, while the environmental and food markets are particularly strong in China. In the petrochemical market, the replacement of aging equipment remains robust worldwide and new investment to expand refining capacity continues in Asia. In the food market, the demand to export safe and high quality food in emerging markets, especially China, remains robust. Globalization of the food supply generates business risk for food producers, and our instruments help mitigate that risk. New food safety laws in the United States, India, and China are increasing demand for chemical measurement. The demand continues to drive increased testing capacity and instrument purchases in all product categories, consumables, and services. In the environmental market, discovery of emerging contaminates continues to be important research to protect the public health in mature geographies while demand for safe drinking water is strong in emerging economies. Both factors drive increased instrument purchases, especially high end mass spectrometry instruments.
Looking forward, we seek to capitalize on sales opportunities arising from a wide range of new product introductions during the last quarter of this fiscal year. We will also look to complete the successful integration of Varian. With Varian, our chemical analysis product portfolio has new offerings in spectroscopy and vacuum technologies, complementary mass spectrometry products, and an expanded consumables portfolio which are being leveraged globally with an integrated sales team. We are focusing on improvements in profitability of the Varian portfolio by refreshing products and leveraging our Asia supply chain. In addition to driving value from our acquisitions, we continue to focus on expanding our core offerings, especially opportunities in consumables and services. We will also focus on expanding our leadership position in developing countries and emerging markets.

18
Gross Margin and Operating Margin
The following table shows the chemical analysis business’s margins, expenses and income from operations for 2011 versus 2010, and 2010 versus 2009.
Years Ended October 31, 2011 over 2010 Change
2010 over 2009 Change2011 2010 2009
Total gross margin . . . . . . . . . . . . . . . . . . 51.1% 53.5% 54.4% (2) ppts (1) pptOperating margin . . . . . . . . . . . . . . . . . . . 20.6% 23.3% 25.6% (3) ppts (2) ppts
(in millions)
Research and development . . . . . . . . . . . $ 92 $ 68 $ 50 35% 36%Selling, general and administrative . . . . $ 371 $ 294 $ 193 26% 52%Income from operations . . . . . . . . . . . . . . $ 313 $ 279 $ 216 12% 29%
Gross margins declined by 2 percentage points in 2011 compared to 2010. Changes in 2011 were due to the impact of the Varian portfolio and higher logistics costs. Gross margins declined by 1 percentage point in 2010 compared to 2009 mainly due to the addition of the Varian portfolio.
Research and development expenses increased 35 percent in 2011 compared to 2010. Increase was due to the Varian acquisition and investments in product R&D to support ongoing portfolio enhancement and expansion. Research and development expenses increased 36 percent in 2010 compared to 2009, primarily driven by the Varian acquisition.
Selling, general and administrative expenses increased 26 percent in 2011 compared to 2010. Increase was due primarily to the Varian and A2 Technologies acquisitions, higher commissions, and investments in sales channel coverage partially offset by lower discretionary spending. Selling, general and administrative expenses increased 52 percent in 2010 compared to 2009, primarily driven by the Varian acquisition.
Operating margins declined by 3 percentage points in 2011 compared to 2010. Operating margins declined by 2 percentage points in 2010 compared to 2009. Factors which led to operating margin variances for these periods are collectively highlighted in the above discussions on gross margins, research and development expenses, and selling, general and administrative expenses.
Income from Operations
Income from operations in 2011 increased by $34 million or 12 percent on a revenue increase of $318 million, an 11 percent year-over-year operating margin incremental. Income from operations in 2010 increased by $63 million or 29 percent compared to 2009 on a revenue increase of $356 million, an 18 percent year-over-year operating margin incremental.
Electronic Measurement
Our electronic measurement business provides electronic measurement instruments and systems, software design tools and related services that are used in the design, development, manufacture, installation, deployment and operation of electronics equipment, and microscopy products. Related services include start-up assistance, instrument productivity and application services and instrument calibration and repair. We also offer customization, consulting and optimization services throughout the customer’s product lifecycle.

Annu
al R
epor
t Fin
anci
als
19
Orders and Net Revenue
Years Ended October 31, 2011 over 2010 Change
2010 over 2009 Change2011 2010 2009
(in millions)
Orders . . . . . . . . . . . . . . . . . . . . . . . . . . . . . . . . $3,305 $2,994 $2,399 10% 25%
Net revenue from products . . . . . . . . . . . . . . $ 2,875 $2,345 $1,949 23% 20%Net revenue from services and other . . . . . . 441 439 469 0% (6)%
Total net revenue . . . . . . . . . . . . . . . . . . . . . . $ 3,316 $ 2,784 $ 2,418 19% 15%
Electronic measurement orders increased 10 percent in 2011 compared to 2010. Foreign currency movements had a slightly favorable impact on the year-over-year growth rate. Key contributors to the year-over-year growth included strength in wireless manufacturing and digital test that was partially offset by a decline in network monitoring orders associated with the divestiture of the network solutions business. Order growth associated with component manufacturers, semiconductor companies, and service and support was solid year-over-year. On a geographic basis, 2011 orders increased 3 percent in the Americas, 3 percent in Europe, 20 percent in Japan, and 21 percent in Asia Pacific excluding Japan. Electronic measurement orders increased 25 percent in 2010 compared to 2009, reflecting broad-based economic recovery with strength in industrial and wireless R&D and manufacturing demand partially offset by a decline in network monitoring orders relating to the divestiture of the network solutions business.
Electronic measurement revenues increased 19 percent in 2011 compared to 2010 due to strength in both general purpose and communications test markets. Revenue growth exceeded order growth year-over-year due to backlog build in 2010 with orders higher than revenue and a slight decrease in backlog in 2011. Foreign currency movements were slightly favorable, contributing to year-over-year growth. Regionally, revenues from the Americas increased 17 percent, Europe grew 15 percent, Japan improved 30 percent reflecting strong wireless test business, and Asia Pacific excluding Japan increased 20 percent compared to 2010 due to strong semiconductor business earlier in the fiscal year and ongoing wireless test demand. Revenue from products increased 23 percent year-over-year while service related revenue was flat due to the divestiture of the network solutions business. Electronic measurement revenues increased 15 percent in 2010 compared to 2009 due to strong growth across all key markets, particularly industrial and wireless manufacturing demand, partially offset by a decrease in network monitoring associated with the divestiture of the network solutions business.
General purpose test revenues, representing approximately 63 percent of electronic measurement revenues, reflected strong demand from industrial, computers, and semiconductor customers and moderating growth in aerospace and defense. Overall improvement in economic conditions supported greater demand from customers with industrial or general purpose applications. Growth in the computers and semiconductor business reflected strong demand for digital test driven in part by the proliferation of high speed data transmission and strength in semiconductor test due to growth in end user markets, including smartphones. Aerospace and defense business was solid, reflecting strong demand for information management and surveillance applications moderated by the general funding uncertainty in the United States for the Department of Defense. In 2010, general purpose test represented 64 percent of electronic measurement revenues, reflecting strong computers and semiconductor business and solid industrial and aerospace and defense related demand.
Communications test revenues, representing approximately 37 percent of electronic measurement, experienced growth in wireless R&D and manufacturing and other communications test, partly offset by a decline in network monitoring revenues due to the divestiture of the network solutions business. Solid growth in wireless R&D reflected more favorable market conditions

20
and targeted investments in high data rate applications, including long-term evolution (“LTE”), an emerging wireless, standard that is in the early stages of adoption. Strength in wireless manufacturing was driven by growth in smartphones and continued 3G expansion. Strong growth in other communications test reflected the expansion of broadband technologies driven by the evolution to data-driven services. In 2010, communications test represented 36 percent of electronic measurement revenues, reflecting a broad recovery in communications markets with growth in all sub-markets except for the decline in network monitoring revenues due to the divestiture of the network solutions business.
Looking forward, we expect moderating growth rates as a result of comparisons to strong 2011 results. We anticipate the communications test business to remain solid, driven by growth in smartphones, continuing 3G expansion, and further adoption of the new wireless standard, LTE. We expect moderating demand in our general purpose segment in the near term, reflecting a cautious spending environment given the global economic uncertainty and relatively flat aerospace and defense business in the U.S.
Gross Margin and Operating Margin
The following table shows the electronic measurement business’s margins, expenses and income from operations for 2011 versus 2010 and 2010 versus 2009.
Years Ended October 31, 2011 over 2010 Change
2010 over 2009 Change2011 2010 2009
Total gross margin . . . . . . . . . . . . . . . . . . . . . . . 58.4% 58.4% 53.5% — 5 pptsOperating margin . . . . . . . . . . . . . . . . . . . . . . . . 22.9% 15.7% —% 7 ppts 16 ppts
(in millions)
Research and development . . . . . . . . . . . . . . . . $ 379 $ 391 $ 425 (3)% (8)%Selling, general and administrative . . . . . . . . . $ 798 $ 798 $ 869 — (8)%Income from operations . . . . . . . . . . . . . . . . . . . $ 760 $ 438 $ 1 74% 100%
Gross margins for products and services were flat in 2011 compared to 2010 on an absolute basis and slightly lower on a volume-adjusted basis. Changes in gross margins reflected the favorable impact of higher volume offset by the unfavorable impact of currency movements, unfavorable mix with a higher proportion of lower gross margin wireless manufacturing business, increased variable and incentive pay, and higher infrastructure costs. In 2010, gross margins improved 5 percentage points compared to 2009 primarily due to higher volume and a lower cost structure.
Research and development expenses declined 3 percent in 2011 compared to 2010. The decline was driven primarily by lower infrastructure costs and spending reductions of which a portion related to the network solutions business divestiture that were partially offset by higher variable and incentive pay and the unfavorable impact of currency movements. Research and development expenses declined 8 percent in 2010 compared to 2009, reflecting savings from restructuring programs, lower infrastructure costs, and spending reductions partially offset by wage restoration, higher variable and incentive pay, and the unfavorable impact of currency movements.
Selling, general and administrative expenses were flat in 2011 compared to 2010. Similar to R&D, year-over-year changes included lower infrastructure costs and spending reductions partly related to the network solutions divestiture offset by the unfavorable impact of currency movements and higher variable and incentive pay. Selling, general and administrative expenses declined 8 percent in 2010 compared to 2009, reflecting savings from restructuring programs, lower infrastructure costs, and reduced spending partly offset by wage restoration, higher variable pay and commissions, and unfavorable impact of currency movements.
Annu
al R
epor
t Fin
anci
als
21
Operating margins improved by 7 percentage points in 2011 compared to 2010 due to the combination of higher revenue volume and lower infrastructure costs partly offset by increased variable and incentive pay and the unfavorable impact of currency movements. Operating margins increased 16 percentage points in 2010 compared to 2009, reflecting higher revenue volume and structural and operational expense reductions.
Income from Operations
Income from operations in 2011 increased by $322 million or 74 percent compared to 2010 on a revenue increase of $532 million, a 61 percent year-over-year operating margin incremental that reflected the benefits of higher revenue volume and limited expense growth. Going forward, the year-over-year operating margin incremental is expected to moderate as compares are made against relatively stronger 2011 results. Income from operations in 2010 increased by $437 million or 100 percent compared to 2009 on a revenue increase of $366 million, a 119 percent year-over-year operating margin incremental that included the benefit of structural and operational expense reductions.
Financial Condition
Liquidity and Capital Resources
As of October 31, 2011, approximately $3.4 billion of our cash and cash equivalents is held outside of the U.S. in our foreign subsidiaries. Most of the amounts held outside of the U.S. could be repatriated to the U.S. but, under current law, would be subject to U.S. federal and state income taxes, less applicable foreign tax credits. Agilent has accrued for U.S. federal and state tax liabilities on the earnings of its foreign subsidiaries except when the earnings are considered indefinitely reinvested outside of the U.S. Repatriation could result in additional material U.S. federal and state income tax payments in future years. We utilize a variety of funding strategies in an effort to ensure that our worldwide cash is available in the locations in which it is needed.
Our financial position as of October 31, 2011 consisted of cash and cash equivalents of $3,527 million as compared to $2,649 million as of October 31, 2010.
Net Cash Provided by Operating Activities
Net cash provided by operating activities was $1,260 million in 2011 as compared to $718 million provided in 2010 mainly due to improved operating results. We also received $65 million in interest rate swap proceeds and $61 million in respect of a tax sharing settlement with Hewlett Packard Company during the year ended October 31, 2011. We paid approximately net $22 million in taxes in 2011 as compared to net $48 million in the same period in 2010. In 2009, we generated $408 million in net cash provided by operating activities.
In 2011, accounts receivable provided cash of $11 million as compared to cash used of $166 million in 2010. Days’ sales outstanding were 45 days in 2011 as compared to 50 days in 2010. Accounts payable used cash of $35 million in 2011 as compared to cash provided of $113 million in 2010. Cash used in inventory was $208 million in 2011 compared to cash used of $51 million in 2010. Inventory day’s on-hand increased to 100 days in 2011 compared to 87 days in 2010.
We contributed $33 million and $30 million to our U.S. defined benefit plans in 2011 and 2010, respectively. We contributed $59 million and $47 million to our non-U.S. defined benefit plans in 2011 and 2010, respectively. We contributed zero and $1 million to our U.S. post-retirement benefit plans in 2011 and 2010, respectively. Our non-U.S. defined benefit plans are generally funded ratably throughout the year. Total contributions in 2011 were $14 million or 18% percent more

22
than 2010. Our annual contributions are highly dependent on the relative performance of our assets versus our projected liabilities, among other factors. We expect to contribute approximately $82 million to our U.S. and non-U.S. defined benefit plans during 2012.
Net Cash Provided by/Used in Investing Activities
Net cash provided in investing activities in 2011 was $1,294 million compared to $1,174 million used in 2010. In 2009, we used $14 million of net cash in the investing activities of operations.
Investments in property, plant and equipment were $188 million in 2011 and $121 million in 2010. Proceeds from sale of property, plant and equipment were $18 million in 2011 as compared to $7 million in 2010. In 2011, we invested $98 million in acquisitions of businesses and intangible assets compared to $1,313 million in 2010 which was primarily related to our acquisition of Varian. Restricted cash decreased $1,545 million mostly due to the reclassification of restricted cash to cash and cash equivalents following the December 10, 2010 settlement of the World Trade repurchase obligation. In 2009, we invested $2 million in acquisitions of businesses and purchase of intangible assets. Proceeds from the sale of investment securities in 2011 were $16 million as compared to $38 million in 2010. Proceeds from divestitures were $1 million in 2011, compared to $205 million in 2010.
Net Cash Provided by/Used in Financing Activities
Net cash used in financing activities in 2011 was $1,693 million compared to $601 million and $657 million net cash provided in 2010 and 2009, respectively. We satisfied the $1,500 million financing obligation of World Trade in its entirety on December 10, 2010.
Treasury stock repurchases
On November 19, 2009 our Board of Directors approved a share-repurchase program to reduce or eliminate dilution of basic outstanding shares in connection with issuances of stock under the company’s equity incentive plans. The share-repurchase program does not require the company to acquire a specific number of shares and may be suspended or discontinued at any time. There is no fixed termination date for the new share-repurchase program. For the year ended October 31, 2011 we repurchased approximately 12 million shares for $497 million. For the year ended October 31, 2010 we repurchased 13 million shares for $411 million.
Credit Facility
On October 20, 2011, we entered into a five-year credit agreement, which provides for a $400 million unsecured credit facility that will expire on October 20, 2016. The company may use amounts borrowed under the facility for general corporate purposes. As of October 31, 2011 the company has no borrowings outstanding under the facility. The Credit Agreement replaced the Company’s prior Five-Year Credit Agreement dated as of May 11, 2007, which was terminated upon the execution of the Credit Agreement. We were in compliance with the covenants for the credit facilities during the year ended October 31, 2011.
Short‑term debt
On September 9, 2009, the company issued an aggregate principal amount of $250 million in senior notes maturing in 2012 (“2012 notes”). The 2012 notes were issued at 99.91% of their principal amount, bear interest at a fixed rate of 4.45% per annum, and mature on September 14, 2012. Interest is payable semi-annually on March 14th and September 14th of each year, and payments commenced on March 14, 2010.

Annu
al R
epor
t Fin
anci
als
23
Upon the closing of the offering of the 2012 senior notes, we entered into interest rate swaps with an aggregate notional amount of $250 million. Under the interest rate swaps, we will receive fixed-rate interest payments and will make payments based on the U.S. dollar LIBOR plus 258 basis points with respect to the 2012 senior notes. The economic effect of these swaps will be to convert the fixed-rate interest expense on the senior notes to a variable LIBOR-based interest rate. The hedging relationship qualifies for the shortcut method of assessing hedge effectiveness, and consequently we do not expect any ineffectiveness during the life of the swap and any movement in the value of the swap would be reflected in the movement in fair value of the senior notes. At October 31, 2011, the fair value of the swaps on 2012 senior notes was an asset of $3 million, with a corresponding increase in the carrying value of 2012 senior notes.
We satisfied the financing obligation of World Trade in its entirety on December 10, 2010 using the proceeds of our senior notes issued in July 2010 and existing cash on our balance sheet.
Long‑term debt
On October 24, 2007, the company issued an aggregate principal amount of $600 million in senior notes maturing in 2017 (“2017 notes”). The 2017 senior notes were issued at 99.60% of their principal amount, bear interest at a fixed rate of 6.50% per annum, and mature on November 1, 2017. Interest is payable semi-annually on May 1st and November 1st of each year and payments commenced on May 1, 2008.
On November 25, 2008, we terminated two interest rate swap contracts associated with our 2017 senior notes that represented the notional amount of $400 million. The asset value, including interest receivable, upon termination was approximately $43 million and the amount to be amortized at October 31, 2011 was $31 million. The gain is being deferred and amortized to interest expense over the remaining life of the 2017 senior notes.
On September 9, 2009, the company issued an aggregate principal amount of $500 million in senior notes maturing in 2015 (“2015 notes”). The 2015 notes were issued at 99.69% of their principal amount, bear interest at a fixed rate of 5.50% per annum, and mature on September 14, 2015. Interest is payable semi-annually on March 14th and September 14th of each year, and payments commenced on March 14, 2010.
On June 6, 2011, we terminated our interest rate swap contracts related to our 2015 senior notes that represented the notional amount of $500 million. The asset value, including interest receivable, upon termination for these contracts was approximately $31 million and the amount to be amortized at October 31, 2011 was $24 million. The gain is being deferred and amortized to interest expense over the remaining life of the 2015 senior notes.
On July 13, 2010, Agilent issued two tranches of senior notes with an aggregate principal amount of $750 million, a $250 million tranche maturing in 2013 (“2013 notes”) and a $500 million tranche maturing in 2020 (“2020 notes”). The 2013 notes were issued at 99.82% of their principal amount, bear interest at a fixed rate of 2.50% per annum and mature on July 15, 2013. The 2020 notes were issued at 99.54% of their principal amount, bear interest at a fixed rate of 5.00% per annum, and mature on July 15, 2020. Interest on both tranches is payable semi-annually on January 15th and July 15th of each year, payments commenced on January 15, 2011.
On August 9, 2011, we terminated our interest rate swap contracts related to our 2020 senior notes that represented the notional amount of $500 million. The asset value, including interest receivable, upon termination for these contracts was approximately $34 million and the amount to be amortized at October 31, 2011 was $32 million. The gain is being deferred and amortized to interest expense over the remaining life of the 2020 senior notes.

24
Off Balance Sheet Arrangements and Other
We have contractual commitments for non-cancelable operating leases. See Note 17 “Commitments and Contingencies”, to our consolidated financial statements for further information on our non-cancelable operating leases.
Our liquidity is affected by many factors, some of which are based on normal ongoing operations of our business and some of which arise from fluctuations related to global economics and markets. Our cash balances are generated and held in many locations throughout the world. Local government regulations may restrict our ability to move cash balances to meet cash needs under certain circumstances. We do not currently expect such regulations and restrictions to impact our ability to pay vendors and conduct operations throughout our global organization.
Contractual Commitments
Our cash flows from operations are dependent on a number of factors, including fluctuations in our operating results, accounts receivable collections, inventory management, and the timing of tax and other payments. As a result, the impact of contractual obligations on our liquidity and capital resources in future periods should be analyzed in conjunction with such factors.
The following table summarizes our total contractual obligations at October 31, 2011 for operations and excludes amounts recorded in our consolidated balance sheet (in millions):
Less than one year One to three years Three to five years More than five years
Operating leases. . . . . . . . . $ 51 $71 $31 $12Commitments to contract
manufacturers and suppliers . . . . . . . . . . . . . 799 3 — —
Other purchase commitments . . . . . . . . . 62 — — —
Retirement plans . . . . . . . . 82 — — —
Total. . . . . . . . . . . . . . . . . $994 $74 $31 $12
Operating leases. Commitments under operating leases relate primarily to leasehold property, see Note 17, “Commitments and Contingencies”.
Commitments to contract manufacturers and suppliers. We purchase components from a variety of suppliers and use several contract manufacturers to provide manufacturing services for our products. During the normal course of business, we issue purchase orders with estimates of our requirements several months ahead of the delivery dates. However, our agreements with these suppliers usually provide us the option to cancel, reschedule, and adjust our requirements based on our business needs prior to firm orders being placed. Typically purchase orders outstanding with delivery dates within 30 days are non-cancelable. Therefore, only approximately 48 percent of our reported purchase commitments arising from these agreements are firm, non-cancelable, and unconditional commitments. We expect to fulfill almost all purchase commitments for inventory within one year.
In addition to the above mentioned commitments to contract manufacturers and suppliers, we record a liability for firm, non-cancelable, and unconditional purchase commitments for quantities in excess of our future demand forecasts consistent with our policy relating to excess inventory. As of October 31, 2011, the liability for our firm, non-cancelable and unconditional purchase commitments was $5 million, compared to $4 million as of October 31, 2010. These amounts are included in other accrued liabilities in our consolidated balance sheet.

Annu
al R
epor
t Fin
anci
als
25
Other purchase commitments. We have categorized “other purchase commitments” as contracts with professional services suppliers. Typically we can cancel these contracts within 90 days without penalties. For those contracts that are not cancelable within 90 days without penalties, we are disclosing the amounts we are obligated to pay to a supplier under each contract in that period before such contract can be cancelled. Our contractual obligations with these suppliers under “other purchase commitments” were approximately $62 million for the next year.
Retirement Plans. Commitments under the retirement plans relate to expected contributions to be made to our U.S. and non U.S. defined benefit plans and to our post-retirement medical plans.
We had no material off-balance sheet arrangements as of October 31, 2011 or October 31, 2010.
On Balance Sheet Arrangements
The following table summarizes our total contractual obligations recorded in our consolidated balance sheet pertaining to our short-term and long-term debt as of October 31, 2011(in millions):
Less than one year One to three years Three to five years More than five years
Senior notes . . . . . . . . . . . . $250 $250 $500 $1,100
We have contractual obligations for interest payments on the above debts. Interest rates and payment dates are detailed in “Net Cash Provided by/Used in Financing Activities”.
Other long-term liabilities include $356 million and $430 million of liabilities for uncertain tax positions as of October 31, 2011 and October 31, 2010, respectively. We are unable to accurately predict when these amounts will be realized or released.
QUANTITATIvE AND QUALITATIvE DISCLOSURES ABOUT MARKET RISK
We are exposed to foreign currency exchange rate risks inherent in our sales commitments, anticipated sales, and assets and liabilities denominated in currencies other than the functional currency of our subsidiaries. We hedge future cash flows denominated in currencies other than the functional currency using sales forecasts up to twelve months in advance. Our exposure to exchange rate risks is managed on an enterprise-wide basis. This strategy utilizes derivative financial instruments, including option and forward contracts, to hedge certain foreign currency exposures with the intent of offsetting gains and losses that occur on the underlying exposures with gains and losses on the derivative contracts hedging them. We do not currently and do not intend to utilize derivative financial instruments for speculative trading purposes.
Our operations generate non-functional currency cash flows such as revenues, third party vendor payments and inter-company payments. In anticipation of these foreign currency cash flows and in view of volatility of the currency market, we enter into such foreign exchange contracts as are described above to manage our currency risk. Approximately 64 percent of our revenues in 2011, 63 percent of our revenues in 2010 and 62 percent of our revenues in 2009 were generated in U.S. dollars.
We performed a sensitivity analysis assuming a hypothetical 10 percent adverse movement in foreign exchange rates to the hedging contracts and the underlying exposures described above. As of October 31, 2011 and 2010, the analysis indicated that these hypothetical market movements would not have a material effect on our consolidated financial position, results of operations or cash flows.

26
We are also exposed to interest rate risk due to the mismatch between the interest expense we pay on our loans at fixed rates and the variable rates of interest we receive from cash, cash equivalents and other short-term investments. We have issued long-term debt in U.S. dollars or foreign currencies at fixed interest rates based on the market conditions at the time of financing. We believe that the fair value of our fixed rate debt changes when the underlying market rates of interest change, and we may use interest rate swaps to modify such market risk. The interest rate swaps effectively change our fixed interest rate payments to U.S. dollar LIBOR-based variable interest expense to match the floating interest income from our cash, cash equivalents and other short term investments. By entering into these interest rate swaps we are also hedging the movements in the fair value of the fixed-rate debt on our balance sheet. However, not all of our fixed rate debt’s fair value is hedged in this manner, and in the future we may choose to terminate previously executed swaps. As of October 31, 2011 we held interest rate swaps with an aggregate notional amount of $250 million associated with our 2012 senior notes.
We performed a sensitivity analysis assuming a hypothetical 10 percent adverse movement in interest rates relating to the underlying fair value of our fixed rate debt. As of October 31, 2011, the sensitivity analyses indicated that a hypothetical 10 percent adverse movement in interest rates would result in an immaterial impact to the fair value of our fixed interest rate debt.

Annu
al R
epor
t Fin
anci
als
27
REPORT OF INDEPENDENT REGISTERED PUBLIC ACCOUNTING FIRM
To the Stockholders and Board of Directors of Agilent Technologies, Inc.:
In our opinion, the accompanying consolidated balance sheets and the related consolidated statements of operations, cash flows, and equity present fairly, in all material respects, the financial position of Agilent Technologies, Inc. and its subsidiaries at October 31, 2011 and October 31, 2010, and the results of their operations and their cash flows for each of the three years in the period ended October 31, 2011 in conformity with accounting principles generally accepted in the United States of America. Also in our opinion, the Company maintained, in all material respects, effective internal control over financial reporting as of October 31, 2011, based on criteria established in Internal Control ‑ Integrated Framework issued by the Committee of Sponsoring Organizations of the Treadway Commission (COSO). The Company’s management is responsible for these financial statements, for maintaining effective internal control over financial reporting and for its assessment of the effectiveness of internal control over financial reporting, included in the accompanying Management’s Report on Internal Control over Financial Reporting. Our responsibility is to express opinions on these financial statements and on the Company’s internal control over financial reporting based on our integrated audits. We conducted our audits in accordance with the standards of the Public Company Accounting Oversight Board (United States). Those standards require that we plan and perform the audits to obtain reasonable assurance about whether the financial statements are free of material misstatement and whether effective internal control over financial reporting was maintained in all material respects. Our audits of the financial statements included examining, on a test basis, evidence supporting the amounts and disclosures in the financial statements, assessing the accounting principles used and significant estimates made by management, and evaluating the overall financial statement presentation. Our audit of internal control over financial reporting included obtaining an understanding of internal control over financial reporting, assessing the risk that a material weakness exists, and testing and evaluating the design and operating effectiveness of internal control based on the assessed risk. Our audits also included performing such other procedures as we considered necessary in the circumstances. We believe that our audits provide a reasonable basis for our opinions.
A company’s internal control over financial reporting is a process designed to provide reasonable assurance regarding the reliability of financial reporting and the preparation of financial statements for external purposes in accordance with generally accepted accounting principles. A company’s internal control over financial reporting includes those policies and procedures that (i) pertain to the maintenance of records that, in reasonable detail, accurately and fairly reflect the transactions and dispositions of the assets of the company; (ii) provide reasonable assurance that transactions are recorded as necessary to permit preparation of financial statements in accordance with generally accepted accounting principles, and that receipts and expenditures of the company are being made only in accordance with authorizations of management and directors of the company; and (iii) provide reasonable assurance regarding prevention or timely detection of unauthorized acquisition, use, or disposition of the company’s assets that could have a material effect on the financial statements.
Because of its inherent limitations, internal control over financial reporting may not prevent or detect misstatements. Also, projections of any evaluation of effectiveness to future periods are subject to the risk that controls may become inadequate because of changes in conditions, or that the degree of compliance with the policies or procedures may deteriorate.
/s/ PricewaterhousecooPers LLP
San Jose, California December 16, 2011
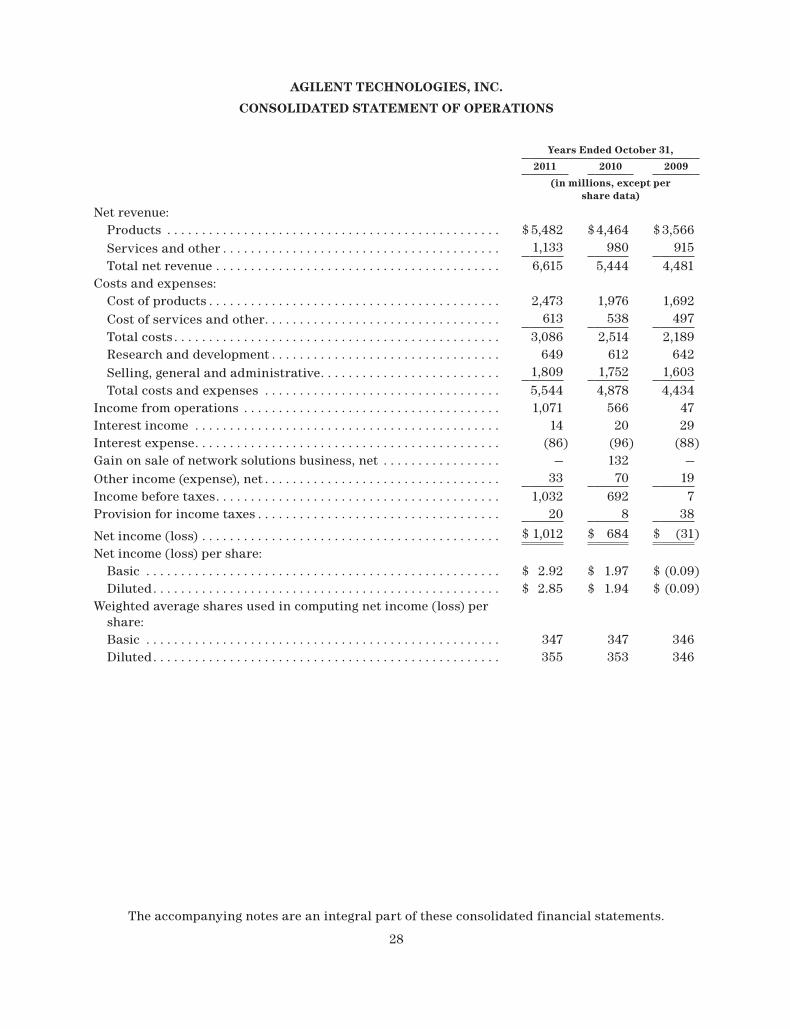
28
AGILENT TECHNOLOGIES, INC.
CONSOLIDATED STATEMENT OF OPERATIONS
The accompanying notes are an integral part of these consolidated financial statements.
Years Ended October 31,
2011 2010 2009
(in millions, except per share data)
Net revenue:Products . . . . . . . . . . . . . . . . . . . . . . . . . . . . . . . . . . . . . . . . . . . . . . . . $ 5,482 $4,464 $3,566Services and other . . . . . . . . . . . . . . . . . . . . . . . . . . . . . . . . . . . . . . . . 1,133 980 915Total net revenue . . . . . . . . . . . . . . . . . . . . . . . . . . . . . . . . . . . . . . . . . 6,615 5,444 4,481
Costs and expenses:Cost of products . . . . . . . . . . . . . . . . . . . . . . . . . . . . . . . . . . . . . . . . . . 2,473 1,976 1,692Cost of services and other. . . . . . . . . . . . . . . . . . . . . . . . . . . . . . . . . . 613 538 497Total costs . . . . . . . . . . . . . . . . . . . . . . . . . . . . . . . . . . . . . . . . . . . . . . . 3,086 2,514 2,189Research and development . . . . . . . . . . . . . . . . . . . . . . . . . . . . . . . . . 649 612 642Selling, general and administrative. . . . . . . . . . . . . . . . . . . . . . . . . . 1,809 1,752 1,603Total costs and expenses . . . . . . . . . . . . . . . . . . . . . . . . . . . . . . . . . . 5,544 4,878 4,434
Income from operations . . . . . . . . . . . . . . . . . . . . . . . . . . . . . . . . . . . . . 1,071 566 47Interest income . . . . . . . . . . . . . . . . . . . . . . . . . . . . . . . . . . . . . . . . . . . . 14 20 29Interest expense. . . . . . . . . . . . . . . . . . . . . . . . . . . . . . . . . . . . . . . . . . . . (86) (96) (88)Gain on sale of network solutions business, net . . . . . . . . . . . . . . . . . — 132 —Other income (expense), net . . . . . . . . . . . . . . . . . . . . . . . . . . . . . . . . . . 33 70 19Income before taxes. . . . . . . . . . . . . . . . . . . . . . . . . . . . . . . . . . . . . . . . . 1,032 692 7Provision for income taxes . . . . . . . . . . . . . . . . . . . . . . . . . . . . . . . . . . . 20 8 38
Net income (loss) . . . . . . . . . . . . . . . . . . . . . . . . . . . . . . . . . . . . . . . . . . . $ 1,012 $ 684 $ (31)
Net income (loss) per share:Basic . . . . . . . . . . . . . . . . . . . . . . . . . . . . . . . . . . . . . . . . . . . . . . . . . . . $ 2.92 $ 1.97 $ (0.09)Diluted. . . . . . . . . . . . . . . . . . . . . . . . . . . . . . . . . . . . . . . . . . . . . . . . . . $ 2.85 $ 1.94 $ (0.09)
Weighted average shares used in computing net income (loss) per share:Basic . . . . . . . . . . . . . . . . . . . . . . . . . . . . . . . . . . . . . . . . . . . . . . . . . . . 347 347 346Diluted. . . . . . . . . . . . . . . . . . . . . . . . . . . . . . . . . . . . . . . . . . . . . . . . . . 355 353 346
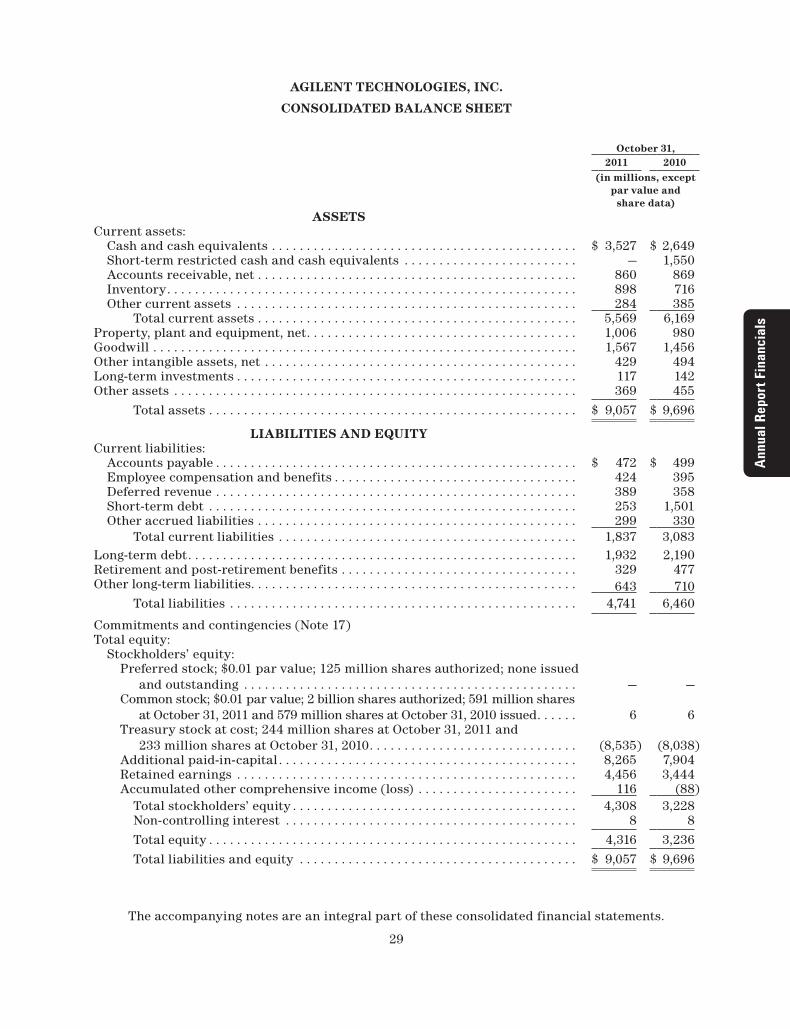
Annu
al R
epor
t Fin
anci
als
29
AGILENT TECHNOLOGIES, INC.
CONSOLIDATED BALANCE SHEET
The accompanying notes are an integral part of these consolidated financial statements.
October 31,2011 2010
(in millions, except par value and
share data)ASSETS
Current assets:Cash and cash equivalents . . . . . . . . . . . . . . . . . . . . . . . . . . . . . . . . . . . . . . . . . . . . $ 3,527 $ 2,649Short-term restricted cash and cash equivalents . . . . . . . . . . . . . . . . . . . . . . . . . — 1,550Accounts receivable, net . . . . . . . . . . . . . . . . . . . . . . . . . . . . . . . . . . . . . . . . . . . . . . 860 869Inventory. . . . . . . . . . . . . . . . . . . . . . . . . . . . . . . . . . . . . . . . . . . . . . . . . . . . . . . . . . . 898 716Other current assets . . . . . . . . . . . . . . . . . . . . . . . . . . . . . . . . . . . . . . . . . . . . . . . . . 284 385
Total current assets . . . . . . . . . . . . . . . . . . . . . . . . . . . . . . . . . . . . . . . . . . . . . . 5,569 6,169Property, plant and equipment, net. . . . . . . . . . . . . . . . . . . . . . . . . . . . . . . . . . . . . . . 1,006 980Goodwill . . . . . . . . . . . . . . . . . . . . . . . . . . . . . . . . . . . . . . . . . . . . . . . . . . . . . . . . . . . . . 1,567 1,456Other intangible assets, net . . . . . . . . . . . . . . . . . . . . . . . . . . . . . . . . . . . . . . . . . . . . . 429 494Long-term investments . . . . . . . . . . . . . . . . . . . . . . . . . . . . . . . . . . . . . . . . . . . . . . . . . 117 142Other assets . . . . . . . . . . . . . . . . . . . . . . . . . . . . . . . . . . . . . . . . . . . . . . . . . . . . . . . . . . 369 455
Total assets . . . . . . . . . . . . . . . . . . . . . . . . . . . . . . . . . . . . . . . . . . . . . . . . . . . . . $ 9,057 $ 9,696
LIABILITIES AND EQUITYCurrent liabilities:
Accounts payable . . . . . . . . . . . . . . . . . . . . . . . . . . . . . . . . . . . . . . . . . . . . . . . . . . . . $ 472 $ 499Employee compensation and benefits . . . . . . . . . . . . . . . . . . . . . . . . . . . . . . . . . . . 424 395Deferred revenue . . . . . . . . . . . . . . . . . . . . . . . . . . . . . . . . . . . . . . . . . . . . . . . . . . . . 389 358Short-term debt . . . . . . . . . . . . . . . . . . . . . . . . . . . . . . . . . . . . . . . . . . . . . . . . . . . . . 253 1,501Other accrued liabilities . . . . . . . . . . . . . . . . . . . . . . . . . . . . . . . . . . . . . . . . . . . . . . 299 330
Total current liabilities . . . . . . . . . . . . . . . . . . . . . . . . . . . . . . . . . . . . . . . . . . . 1,837 3,083Long-term debt. . . . . . . . . . . . . . . . . . . . . . . . . . . . . . . . . . . . . . . . . . . . . . . . . . . . . . . . 1,932 2,190Retirement and post-retirement benefits . . . . . . . . . . . . . . . . . . . . . . . . . . . . . . . . . . 329 477Other long-term liabilities. . . . . . . . . . . . . . . . . . . . . . . . . . . . . . . . . . . . . . . . . . . . . . . 643 710
Total liabilities . . . . . . . . . . . . . . . . . . . . . . . . . . . . . . . . . . . . . . . . . . . . . . . . . . 4,741 6,460
Commitments and contingencies (Note 17)Total equity:
Stockholders’ equity:Preferred stock; $0.01 par value; 125 million shares authorized; none issued
and outstanding . . . . . . . . . . . . . . . . . . . . . . . . . . . . . . . . . . . . . . . . . . . . . . . . — —Common stock; $0.01 par value; 2 billion shares authorized; 591 million shares
at October 31, 2011 and 579 million shares at October 31, 2010 issued. . . . . . 6 6Treasury stock at cost; 244 million shares at October 31, 2011 and
233 million shares at October 31, 2010. . . . . . . . . . . . . . . . . . . . . . . . . . . . . . (8,535) (8,038)Additional paid-in-capital . . . . . . . . . . . . . . . . . . . . . . . . . . . . . . . . . . . . . . . . . . . 8,265 7,904Retained earnings . . . . . . . . . . . . . . . . . . . . . . . . . . . . . . . . . . . . . . . . . . . . . . . . . 4,456 3,444Accumulated other comprehensive income (loss) . . . . . . . . . . . . . . . . . . . . . . . 116 (88) Total stockholders’ equity . . . . . . . . . . . . . . . . . . . . . . . . . . . . . . . . . . . . . . . . . 4,308 3,228 Non-controlling interest . . . . . . . . . . . . . . . . . . . . . . . . . . . . . . . . . . . . . . . . . . 8 8
Total equity . . . . . . . . . . . . . . . . . . . . . . . . . . . . . . . . . . . . . . . . . . . . . . . . . . . . . 4,316 3,236
Total liabilities and equity . . . . . . . . . . . . . . . . . . . . . . . . . . . . . . . . . . . . . . . . $ 9,057 $ 9,696
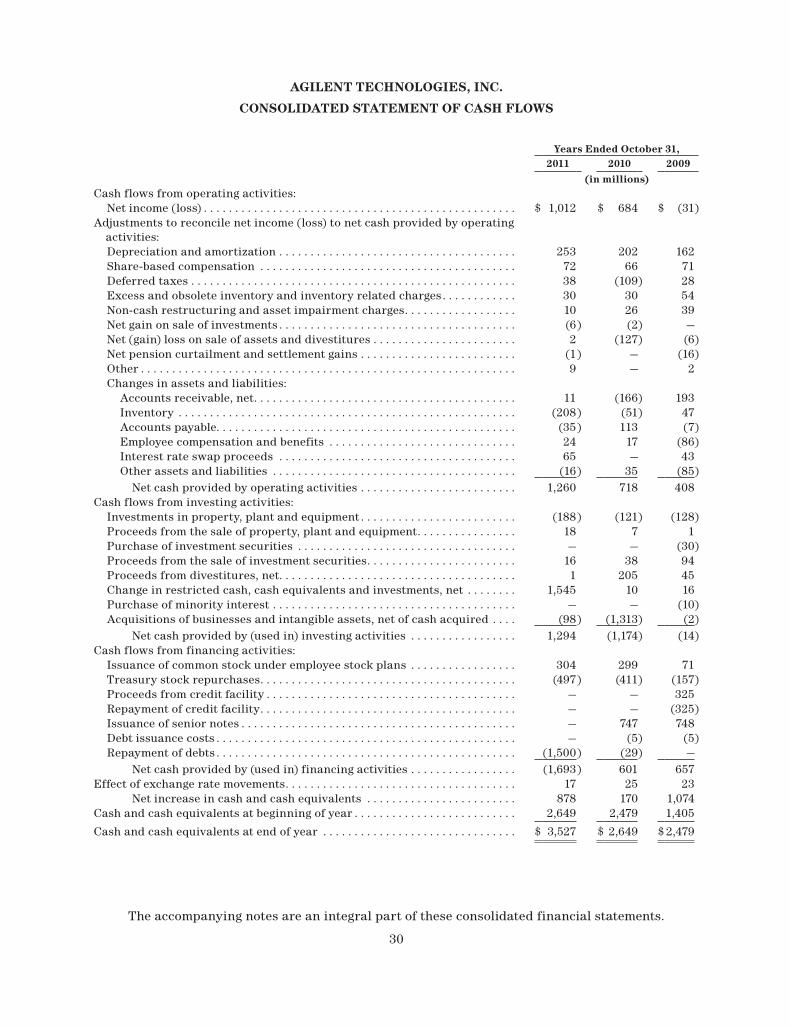
30
AGILENT TECHNOLOGIES, INC.
CONSOLIDATED STATEMENT OF CASH FLOWS
The accompanying notes are an integral part of these consolidated financial statements.
Years Ended October 31,2011 2010 2009
(in millions)Cash flows from operating activities:
Net income (loss) . . . . . . . . . . . . . . . . . . . . . . . . . . . . . . . . . . . . . . . . . . . . . . . . . . $ 1,012 $ 684 $ (31)Adjustments to reconcile net income (loss) to net cash provided by operating
activities:Depreciation and amortization . . . . . . . . . . . . . . . . . . . . . . . . . . . . . . . . . . . . . . 253 202 162Share-based compensation . . . . . . . . . . . . . . . . . . . . . . . . . . . . . . . . . . . . . . . . . 72 66 71Deferred taxes . . . . . . . . . . . . . . . . . . . . . . . . . . . . . . . . . . . . . . . . . . . . . . . . . . . . 38 (109) 28Excess and obsolete inventory and inventory related charges. . . . . . . . . . . . 30 30 54Non-cash restructuring and asset impairment charges. . . . . . . . . . . . . . . . . . 10 26 39Net gain on sale of investments . . . . . . . . . . . . . . . . . . . . . . . . . . . . . . . . . . . . . . (6) (2) —Net (gain) loss on sale of assets and divestitures . . . . . . . . . . . . . . . . . . . . . . . 2 (127) (6)Net pension curtailment and settlement gains . . . . . . . . . . . . . . . . . . . . . . . . . (1) — (16)Other . . . . . . . . . . . . . . . . . . . . . . . . . . . . . . . . . . . . . . . . . . . . . . . . . . . . . . . . . . . . 9 — 2Changes in assets and liabilities:
Accounts receivable, net. . . . . . . . . . . . . . . . . . . . . . . . . . . . . . . . . . . . . . . . . . 11 (166) 193Inventory . . . . . . . . . . . . . . . . . . . . . . . . . . . . . . . . . . . . . . . . . . . . . . . . . . . . . . (208) (51) 47Accounts payable. . . . . . . . . . . . . . . . . . . . . . . . . . . . . . . . . . . . . . . . . . . . . . . . (35) 113 (7)Employee compensation and benefits . . . . . . . . . . . . . . . . . . . . . . . . . . . . . . 24 17 (86)Interest rate swap proceeds . . . . . . . . . . . . . . . . . . . . . . . . . . . . . . . . . . . . . . 65 — 43Other assets and liabilities . . . . . . . . . . . . . . . . . . . . . . . . . . . . . . . . . . . . . . . (16) 35 (85) Net cash provided by operating activities . . . . . . . . . . . . . . . . . . . . . . . . . 1,260 718 408
Cash flows from investing activities:Investments in property, plant and equipment . . . . . . . . . . . . . . . . . . . . . . . . . (188) (121) (128)Proceeds from the sale of property, plant and equipment. . . . . . . . . . . . . . . . 18 7 1Purchase of investment securities . . . . . . . . . . . . . . . . . . . . . . . . . . . . . . . . . . . — — (30)Proceeds from the sale of investment securities. . . . . . . . . . . . . . . . . . . . . . . . 16 38 94Proceeds from divestitures, net. . . . . . . . . . . . . . . . . . . . . . . . . . . . . . . . . . . . . . 1 205 45Change in restricted cash, cash equivalents and investments, net . . . . . . . . 1,545 10 16Purchase of minority interest . . . . . . . . . . . . . . . . . . . . . . . . . . . . . . . . . . . . . . . — — (10)Acquisitions of businesses and intangible assets, net of cash acquired . . . . (98) (1,313) (2)
Net cash provided by (used in) investing activities . . . . . . . . . . . . . . . . . 1,294 (1,174) (14)Cash flows from financing activities:
Issuance of common stock under employee stock plans . . . . . . . . . . . . . . . . . 304 299 71Treasury stock repurchases. . . . . . . . . . . . . . . . . . . . . . . . . . . . . . . . . . . . . . . . . (497) (411) (157)Proceeds from credit facility . . . . . . . . . . . . . . . . . . . . . . . . . . . . . . . . . . . . . . . . — — 325Repayment of credit facility. . . . . . . . . . . . . . . . . . . . . . . . . . . . . . . . . . . . . . . . . — — (325)Issuance of senior notes . . . . . . . . . . . . . . . . . . . . . . . . . . . . . . . . . . . . . . . . . . . . — 747 748Debt issuance costs . . . . . . . . . . . . . . . . . . . . . . . . . . . . . . . . . . . . . . . . . . . . . . . . — (5) (5)Repayment of debts . . . . . . . . . . . . . . . . . . . . . . . . . . . . . . . . . . . . . . . . . . . . . . . . (1,500) (29) —
Net cash provided by (used in) financing activities . . . . . . . . . . . . . . . . . (1,693) 601 657Effect of exchange rate movements. . . . . . . . . . . . . . . . . . . . . . . . . . . . . . . . . . . . . 17 25 23
Net increase in cash and cash equivalents . . . . . . . . . . . . . . . . . . . . . . . . 878 170 1,074Cash and cash equivalents at beginning of year . . . . . . . . . . . . . . . . . . . . . . . . . . 2,649 2,479 1,405
Cash and cash equivalents at end of year . . . . . . . . . . . . . . . . . . . . . . . . . . . . . . . $ 3,527 $ 2,649 $2,479

Annu
al R
epor
t Fin
anci
als
31
AGILENT TECHNOLOGIES, INC.
CONSOLIDATED STATEMENT OF EQUITY
Common Stock Treasury Stock AccumulatedOther
Comprehensive Income/(Loss)
Number of
SharesPar
value
Additional Paid-in Capital
Number of
Shares
Treasury Stock at
CostRetained Earnings
Total Stockholders
Equity
Non- Controlling
InterestsTotal
Equity
(in millions, except number of shares in thousands)
Balance as of October 31, 2008 . . . . . . . . . . . 560,667 $6 $ 7,410 (210,822) $(7,470) $ 2,791 $(178) $2,559 $ 14 $2,573
Components of comprehensive income:
Net loss . . . . . . . . . . . . . . . . . . . . . . . . . . . . — — — — — (31) — (31) — (31)
Change in unrealized loss on investments, net of tax of $2 . . . . . . . — — — — — — 8 8 — 8
Change in unrealized loss on derivative instruments . . . . . . . . . . . — — — — — — 1 1 — 1
Losses reclassified into earnings related to derivative instruments, net of tax of $(8) . . . . . . . . . . . . . . . . . — — — — — — 15 15 — 15
Change in foreign currency translation . . . — — — — — — 157 157 — 157
Change in net defined benefit pension and post retirement plan costs:
Net loss, net of tax of $18 . . . . . . . . . . . . . — — — — — — (287) (287) — (287)
Net prior service credit. . . . . . . . . . . . . . . — — — — — — 99 99 — 99
Total comprehensive loss . . . . . . . . . . . . . (38) — (38)
Net income attributable to non-controlling interests . . . . . . . . . — — — — — — — — 7 7
Distributions to non-controlling interests . . . . . . . . . . . . . . . . . . . . . . . — — — — — — — — (3) (3)
Purchase of non-controlling interests. . . — — — — — — — — (10) (10)
Share-based awards issued . . . . . . . . . . . . . . 5,400 — 71 — — — — 71 — 71
Repurchase of common stock . . . . . . . . . . . . — — — (9,097) (157) — — (157) — (157)
Share-based compensation . . . . . . . . . . . . . . — — 71 — — — — 71 — 71
Balance as of October 31, 2009 . . . . . . . . . . . 566,067 6 7,552 (219,919) (7,627) 2,760 (185) 2,506 8 2,514
Components of comprehensive income:
Net income . . . . . . . . . . . . . . . . . . . . . . . . . — — — — — 684 — 684 — 684
Change in unrealized gain on investments . . . . . . . . . . . . . . . . . . . . — — — — — — 1 1 — 1
Change in unrealized loss on derivative instruments . . . . . . . . . . . . . . . . . . . . — — — — — — 4 4 — 4
Losses reclassified into earnings related to derivative instruments, net of tax of $1 . . . . . . . . . . . . . . . . . . — — — — — — (6) (6) — (6)
Change in foreign currency translation . . . — — — — — — 70 70 — 70
Change in net defined benefit pension and post retirement plan costs:
Net gain, net of tax of $9. . . . . . . . . . . . . . — — — — — — 53 53 — 53
Net prior service cost . . . . . . . . . . . . . . . . — — — — — — (25) (25) — (25)
Total comprehensive income . . . . . . . . . . 781 — 781
Share-based awards issued. . . . . . . . . . . . . . 12,760 — 288 — — — — 288 — 288
Repurchase of common stock . . . . . . . . . . . . — — — (12,764) (411) — — (411) — (411)
Share-based compensation . . . . . . . . . . . . . . — — 64 — — — — 64 — 64
Balance as of October 31, 2010 . . . . . . . . . . . 578,827 $6 $ 7,904 (232,683) $(8,038) $3,444 $ (88) $3,228 $ 8 $3,236

32
AGILENT TECHNOLOGIES, INC.
CONSOLIDATED STATEMENT OF EQUITY — (Continued)
The accompanying notes are an integral part of these consolidated financial statements.
Common Stock Treasury Stock AccumulatedOther
Comprehensive Income/(Loss)
Number of
SharesPar
value
Additional Paid-in Capital
Number of
Shares
Treasury Stock at
CostRetained Earnings
Total Stockholders
Equity
Non- Controlling
InterestsTotal
Equity
(in millions, except number of shares in thousands)
Balance as of October 31, 2010 . . . . . . . . . . . . 578,827 $ 6 $ 7,904 (232,683) $(8,038) $3,444 $ (88) $3,228 $ 8 $3,236
Components of comprehensive income:
Net income . . . . . . . . . . . . . . . . . . . . . . . . . — — — — — 1,012 — 1,012 — 1,012
Change in unrealized gain on investments . . . . . . . . . . . . . . . . . . . . — — — — — — (4) (4) — (4)
Change in unrealized loss on derivative instruments . . . . . . . . . . . . . . . . . . . . — — — — — — — — — —
Losses reclassified into earnings related to derivative instruments, net of tax of $(2). . . . . . . . . . . . . . . . . — — — — — — 3 3 — 3
Change in foreign currency translation . — — — — — — 94 94 — 94
Change in net defined benefit pension and post retirement plan costs:
Net loss, net of tax of $(3). . . . . . . . . . . . . — — — — — — (38) (38) — (38)
Net prior service gain . . . . . . . . . . . . . . . . — — — — — — 149 149 — 149
Total comprehensive income . . . . . . . . . . 1,216 — 1,216
Share-based awards issued . . . . . . . . . . . . . . 11,841 — 289 — — — — 289 — 289
Repurchase of common stock . . . . . . . . . . . . . — — — (11,603) (497) — — (497) — (497)
Share-based compensation . . . . . . . . . . . . . . . — — 72 — — — — 72 — 72
Balance as of October 31, 2011 . . . . . . . . . . . . 590,668 $ 6 $8,265 (244,286) $(8,535) $4,456 $116 $4,308 $ 8 $ 4,316
Annu
al R
epor
t Fin
anci
als
33
1. Overview and Summary of Significant Accounting Policies
Overview. Agilent Technologies, Inc. (“we”, “Agilent” or the “company”), incorporated in Delaware in May 1999, is a measurement company, providing core bio-analytical and electronic measurement solutions to the communications, electronics, life sciences and chemical analysis industries.
Acquisition of Varian, Inc. On May 14, 2010, we completed our acquisition of Varian, Inc. (“Varian”), a leading supplier of scientific instrumentation and associated consumables for life science and chemical analysis market applications, by means of a merger of one of our wholly-owned subsidiaries with and into Varian such that Varian became a wholly-owned subsidiary of Agilent. The $1.5 billion total purchase price of Varian included $52 cash per share of Varian’s outstanding common stock including vested and non-vested in-the-money stock options at $52 cash per share less their exercise price. Varian’s non-vested restricted stock awards, non-vested performance shares, at 100 percent of target, and non-vested director’s stock units were also paid at $52 per share. As part of the European Commission’s merger approval and the Federal Trade Commission consent order, Agilent committed to sell Varian’s laboratory gas chromatography (“GC”) business; Varian’s triple quadrupole gas chromatography-mass spectrometry (“GC-MS”) business; Varian’s inductively-coupled plasma-mass spectrometry (“ICP-MS”) business; and Agilent’s micro GC business. On May 19, 2010 we completed the sale of the Varian laboratory GC business, the triple quadrupole GC-MS business, the ICP-MS business and the Agilent micro GC business for approximately $33 million. We financed the purchase price of Varian using the proceeds from our September 2009 offering of senior notes and other existing cash. The Varian merger has been accounted for in accordance with the authoritative accounting guidance and the results of Varian are included in Agilent’s consolidated financial statements from the date of merger. We expect to realize operational and cost synergies, leverage the existing sales channels and product development resources, and utilize the assembled workforce. The company expects the combined entity to achieve significant savings in corporate and divisional overhead costs. The company also anticipates opportunities for growth through expanded geographic and customer segment diversity and the ability to leverage additional products and capabilities. For additional details related to the acquisition of Varian, see Note 3, “Acquisition of Varian”.
Sale of Network Solutions Division. On May 1, 2010, we completed the sale of the Network Solutions Division (“NSD”) of our electronic measurement business to JDS Uniphase Corporation (“JDSU”), a leading communications test and measurement company. JDSU paid Agilent $160 million and we recorded a net gain on the sale of NSD of $132 million in fiscal 2010. NSD includes Agilent’s network assurance solutions, network protocol test and drive test products. The results of operations of NSD were not significant to the income from operations of Agilent for the year ended October 31, 2010.
Sale of Hycor Biomedical, Inc. On February 2, 2010, the company sold Hycor Biomedical Inc., a wholly-owned subsidiary, to Linden LLC, a Chicago-based healthcare private equity firm. Hycor is a global manufacturer and marketer of in vitro diagnostics products.
Basis of presentation. The accompanying financial data has been prepared by us pursuant to the rules and regulations of the U.S. Securities and Exchange Commission (“SEC”) and is in conformity with U.S. generally accepted accounting principles (“GAAP”). Our fiscal year end is October 31. Unless otherwise stated, all years and dates refer to our fiscal year.
Reclassifications. Certain prior year financial statement and disclosure amounts have been reclassified to conform to the current year presentation with no impact on previously reported net income.
34
Management is responsible for the fair presentation of the accompanying consolidated financial statements, prepared in accordance with U.S. GAAP, and has full responsibility for their integrity and accuracy. In the opinion of management, the accompanying consolidated financial statements contain all adjustments necessary to present fairly our consolidated balance sheet, statement of operations, statement of cash flows and statement of stockholders’ equity for all periods presented.
Principles of consolidation. The consolidated financial statements include the accounts of the company and our wholly- and majority-owned subsidiaries. All significant intercompany accounts and transactions have been eliminated. Partially owned, non-controlled equity affiliates are accounted for under the equity method.
Use of estimates. The preparation of financial statements in accordance with accounting principles generally accepted in the U.S. requires management to make estimates and assumptions that affect the amounts reported in our consolidated financial statements and accompanying notes. Management bases its estimates on historical experience and various other assumptions believed to be reasonable. Although these estimates are based on management’s best knowledge of current events and actions that may impact the company in the future, actual results may be different from the estimates. Our critical accounting policies are those that affect our financial statements materially and involve difficult, subjective or complex judgments by management. Those policies are revenue recognition, inventory valuation, share-based compensation, retirement and post-retirement plan assumptions, goodwill and purchased intangible assets and accounting for income taxes.
Revenue recognition. We enter into agreements to sell products (hardware and/or software), services and other arrangements (multiple element arrangements) that include combinations of products and services.
We recognize revenue, net of trade discounts and allowances, provided that (1) persuasive evidence of an arrangement exists, (2) delivery has occurred, (3) the price is fixed or determinable and (4) collectibility is reasonably assured. Delivery is considered to have occurred when title and risk of loss have transferred to the customer, for products, or when the service has been provided. We consider the price to be fixed or determinable when the price is not subject to refund or adjustments. We consider arrangements with extended payment terms not to be fixed or determinable, and accordingly we defer revenue until amounts become due. At the time of the transaction, we evaluate the creditworthiness of our customers to determine the appropriate timing of revenue recognition.
Product revenue. Our product revenue is generated predominantly from the sales of various types of test equipment. Product revenue, including sales to resellers and distributors, is reduced for estimated returns, when appropriate. For sales or arrangements that include customer-specified acceptance criteria, including those where acceptance is required upon achievement of performance milestones, revenue is recognized after the acceptance criteria have been met. For products that include installation, if the installation meets the criteria to be considered a separate element, product revenue is recognized upon delivery, and recognition of installation revenue is delayed until the installation is complete. Otherwise, neither the product nor the installation revenue is recognized until the installation is complete.
Where software is licensed separately, revenue is recognized when the software is delivered and title and risk of loss have been transferred to the customer or, in the case of electronic delivery of software, when the customer is given access to the licensed software programs. We also evaluate

Annu
al R
epor
t Fin
anci
als
35
whether collection of the receivable is probable, the fee is fixed or determinable and whether any other undelivered elements of the arrangement exist on which a portion of the total fee would be allocated based on vendor-specific objective evidence.
Service revenue. Revenue from services includes extended warranty, customer support, consulting, training and education. Service revenue is deferred and recognized over the contractual period or as services are rendered and accepted by the customer. For example, customer support contracts are recognized ratably over the contractual period, while training revenue is recognized as the training is provided to the customer. In addition the four revenue recognition criteria described above must be met before service revenue is recognized.
Revenue Recognition for Arrangements with Multiple Deliverables. On November 1, 2010, we adopted an accounting update regarding revenue recognition for multiple deliverable arrangements and an accounting update for certain revenue arrangements that include software elements.
We adopted the above accounting updates on a prospective basis for applicable transactions originating or materially modified after November 1, 2010. The amended update for multiple deliverable arrangements did not change the units of accounting for our revenue transactions, and most products and services qualify as separate units of accounting. Under the previous guidance for multiple deliverable arrangements with software elements, we typically applied the residual method to allocate revenue if we were unable to determine vendor specific objective evidence of fair value or verifiable objective evidence of fair value for the delivered element but were able to obtain fair value for any undelivered elements.
The adoption of the amended revenue recognition rules did not significantly change the timing of revenue recognition and did not have a material impact on our consolidated financial statements for the year ended October 31, 2011. We cannot reasonably estimate the effect of adopting these standards on future financial periods as the impact will vary depending on the nature and volume of new or materially modified sales arrangements in any given period.
Our multiple-element arrangements are generally comprised of a combination of measurement instruments, installation or other start-up services and/or software and/or support or services. Hardware and software elements are typically delivered at the same time and revenue is recognized upon delivery once title and risk of loss pass to the customer. Delivery of installation, start-up services and other services varies based on the complexity of the equipment, staffing levels in a geographic location and customer preferences, and can range from a few days to a few months. Service revenue is deferred and recognized over the contractual period or as services are rendered and accepted by the customer. Revenue from the sale of software products that are not required to deliver the tangible product’s essential functionality are accounted for under software revenue recognition rules which require vendor specific objective evidence (“VSOE”) of fair value to allocate revenue in a multiple element arrangement. Our arrangements generally do not include any provisions for cancellation, termination, or refunds that would significantly impact recognized revenue.
We have evaluated the deliverables in our multiple-element arrangements and concluded that they are separate units of accounting if the delivered item or items have value to the customer on a standalone basis and for an arrangement that includes a general right of return relative to the delivered item(s), delivery or performance of the undelivered item(s) is considered probable and substantially in our control. We allocate revenue to each element in our multiple-element arrangements based upon their relative selling prices. We determine the selling price for each deliverable based on a selling price hierarchy. The selling price for a deliverable is based on VSOE if

36
available, third-party evidence (“TPE”) if VSOE is not available, or estimated selling price (“ESP”) if neither VSOE nor TPE is available. Revenue allocated to each element is then recognized when the basic revenue recognition criteria for that element have been met.
We use VSOE of selling price in the selling price allocation in all instances where it exists. VSOE of selling price for products and services is determined when a substantial majority of the selling prices fall within a reasonable range when sold separately. TPE of selling price can be established by evaluating largely interchangeable competitor products or services in standalone sales to similarly situated customers. As our products contain a significant element of proprietary technology and the solution offered differs substantially from that of competitors, it is difficult to obtain the reliable standalone competitive pricing necessary to establish TPE. ESP represents the best estimate of the price at which we would transact a sale if the product or service were sold on a standalone basis. We determine ESP for a product or service by using historical selling prices which reflect multiple factors including, but not limited to customer type, geography, market conditions, competitive landscape, gross margin objectives and pricing practices. The determination of ESP is made through consultation with and approval by management. We may modify or develop new pricing practices and strategies in the future. As these pricing strategies evolve, we may modify our pricing practices in the future, which may result in changes in ESP. The aforementioned factors may result in a different allocation of revenue to the deliverables in multiple element arrangements from the current fiscal quarter, which may change the pattern and timing of revenue recognition for these elements but will not change the total revenue recognized for the arrangement.
Deferred revenue. Deferred revenue represents the amount that is allocated to undelivered elements in multiple element arrangements. We limit the revenue recognized to the amount that is not contingent on the future delivery of products or services or meeting other specified performance conditions.
Accounts receivable, net. Trade accounts receivable are recorded at the invoiced amount and do not bear interest. Such accounts receivable has been reduced by an allowance for doubtful accounts, which is our best estimate of the amount of probable credit losses in our existing accounts receivable. We determine the allowance based on customer specific experience and the aging of such receivables, among other factors. We do not have any off-balance-sheet credit exposure related to our customers. Accounts receivable are also recorded net of product returns.
Share‑based compensation. For the years ended 2011, 2010 and 2009, we accounted for share-based awards made to our employees and directors including employee stock option awards, restricted stock units, employee stock purchases made under our Employee Stock Purchase Plan (“ESPP”) and performance share awards under Agilent Technologies, Inc. Long-Term Performance Program (“LTPP”) using the estimated grant date fair value method of accounting. Under the fair value method, we recorded compensation expense for all share-based awards of $73 million in 2011, $66 million in 2010 and $71 million in 2009.
Inventory. Inventory is valued at standard cost, which approximates actual cost computed on a first-in, first-out basis, not in excess of market value. We assess the valuation of our inventory on a periodic basis and make adjustments to the value for estimated excess and obsolete inventory based on estimates about future demand. The excess balance determined by this analysis becomes the basis for our excess inventory charge. Our excess inventory review process includes analysis of sales forecasts, managing product rollovers and working with manufacturing to maximize recovery of excess inventory.
Annu
al R
epor
t Fin
anci
als
37
Warranty. Our standard warranty terms typically extend for one year from the date of delivery. We accrue for standard warranty costs based on historical trends in warranty charges as a percentage of net product revenue . The accrual is reviewed regularly and periodically adjusted to reflect changes in warranty cost estimates. Estimated warranty charges are recorded within cost of products at the time products are sold. See Note 16, “Guarantees”.
Taxes on income. Income tax expense or benefit is based on income or loss before taxes. Deferred tax assets and liabilities are recognized principally for the expected tax consequences of temporary differences between the tax bases of assets and liabilities and their reported amounts.
Shipping and handling costs. Our shipping and handling costs charged to customers are included in net revenue, and the associated expense is recorded in cost of products for all periods presented.
Goodwill and Purchased Intangible Assets. In September 2011, the FASB approved changes to the goodwill impairment guidance which are intended to reduce the cost and complexity of the annual impairment test. The changes provide entities an option to perform a qualitative assessment to determine whether further impairment testing is necessary. The revised standard gives an entity the option to first assess qualitative factors to determine whether performing the current two-step test is necessary. If an entity believes, as a result of its qualitative assessment, that it is more-likely-than-not (i.e. > 50% chance) that the fair value of a reporting unit is less than its carrying amount, the quantitative impairment test will be required. Otherwise, no further testing will be required.
The revised guidance includes examples of events and circumstances that might indicate that a reporting unit’s fair value is less than its carrying amount. These include macro-economic conditions such as deterioration in the entity’s operating environment or industry or market considerations; entity-specific events such as increasing costs, declining financial performance, or loss of key personnel; or other events such as an expectation that a reporting unit will be sold or a sustained decrease in the stock price on either an absolute basis or relative to peers.
The changes will be effective for annual and interim goodwill impairment tests performed for fiscal years beginning after December 15, 2011. However, earlier adoption is permitted. Agilent has opted to early adopt this guidance for the year ended October 31, 2011.
If it is determined, as a result of the qualitative assessment, that it is more-likely-than-not that the fair value of a reporting unit is less than its carrying amount, the provisions of authoritative guidance require that we perform a two-step impairment test on goodwill. In the first step, we compare the fair value of each reporting unit to its carrying value. The second step (if necessary) measures the amount of impairment by applying fair-value-based tests to the individual assets and liabilities within each reporting unit. As defined in the authoritative guidance, a reporting unit is an operating segment, or one level below an operating segment. We have aggregated components of an operating segment that have similar economic characteristics into our reporting units. Accordingly, Agilent has three reporting units, which are the same as our operating segments: life sciences, chemical analysis and electronic measurement. At the time of an acquisition, we assign goodwill to the reporting unit that is expected to benefit from the synergies of the combination. Based on our results of our qualitative test for goodwill impairment, as of September 30, 2011, we believe that it is more-likely-than-not that the fair value of each of our three reporting units, life sciences, chemical analysis and electronic measurement is greater than their respective carrying values. There was no impairment of goodwill during the years ended October 31, 2011, 2010 and 2009.

38
Purchased intangible assets consist primarily of acquired developed technologies, proprietary know-how, trademarks, and customer relationships and are amortized using the straight-line method over estimated useful lives ranging from 6 months to 15 years. In process research and development (“IPR&D”) is initially capitalized at fair value as an intangible asset with an indefinite life and assessed for impairment thereafter. When the IPR&D project is complete, it is reclassified as an amortizable purchased intangible asset and is amortized over its estimated useful life. If an IPR&D project is abandoned, Agilent will record a charge for the value of the related intangible asset to Agilent’s consolidated statement of operations in the period it is abandoned.
Advertising. Advertising costs are expensed as incurred and amounted to $55 million in 2011, $45 million in 2010 and $36 million in 2009 for Agilent operations.
Research and development. Costs related to research, design and development of our products are charged to research and development expense as they are incurred.
Sales Taxes. Sales taxes collected from customers and remitted to governmental authorities are not included in our revenue.
Net income (loss) per share. Basic net income (loss) per share is computed by dividing net income (loss) — the numerator — by the weighted average number of common shares outstanding — the denominator — during the period excluding the dilutive effect of stock options and other employee stock plans. Diluted net income per share gives effect to all potentially dilutive common stock equivalents outstanding during the period. In computing diluted net income per share under the treasury stock method, the average stock price for the period is used in determining the number of shares assumed to be purchased from the proceeds of stock option exercises. The number of shares assumed to be purchased also considers the amount of unrecognized compensation cost for future service. As a result of the company’s net loss in 2009, the computation of diluted net loss per share for 2009 excludes the diluted impact of all common stock equivalents outstanding. See Note 6, “Net Income (Loss) per Per Share”.
Cash, cash equivalents and short term investments. We classify investments as cash equivalents if their original or remaining maturity is three months or less at the date of purchase. Cash equivalents are stated at cost, which approximates fair value.
As of October 31, 2011, approximately $3.4 billion of our cash and cash equivalents is held outside of the U.S. in our foreign subsidiaries. Under current tax laws, most of the cash could be repatriated to the U.S. but it would be subject to U.S. federal and state income taxes, less applicable foreign tax credits. Our cash and cash equivalents mainly consist of short term deposits held at major global financial institutions, institutional money market funds, and similar short duration instruments with original maturities of 90 days or less. We continuously monitor the creditworthiness of the financial institutions and institutional money market funds in which we invest our funds.
We classify investments as short-term investments if their original or remaining maturities are greater than three months and their remaining maturities are one year or less.
Restricted cash and cash equivalents was nil in 2011 and $1.6 billion in 2010 mostly held in commercial paper.
Fair Value of Financial Instruments. The carrying values of certain of our financial instruments including cash and cash equivalents, restricted cash and cash equivalents, accounts receivable, accounts payable, accrued compensation and other accrued liabilities approximate fair value because of their short maturities. The fair value of long-term equity investments is determined using quoted market prices for those securities when available. For those long-term

Annu
al R
epor
t Fin
anci
als
39
equity investments accounted for under the cost method, their carrying value approximates their estimated fair value. The fair value of our short-term and long-term debt exceeds the carrying value by approximately $140 million as of October 31, 2011. The fair value of foreign currency contracts used for hedging purposes is estimated internally by using inputs tied to active markets. The carrying value of our investment in direct-financing leases approximates their estimated fair value. See also Note 12, “Fair Value Measurements” for additional information on the fair value of financial instruments.
Concentration of credit risk. Financial instruments that potentially subject Agilent to significant concentration of credit risk include money market fund investments, time deposits, commercial paper and demand deposit balances. These investments are categorized as cash and cash equivalents, restricted cash and cash equivalents and long-term investments. In addition, Agilent has credit risk from derivative financial instruments used in hedging activities, accounts receivable and investments in direct-financing leases. We invest in a variety of financial instruments and limit the amount of credit exposure with any one financial institution. Credit risk with respect to our accounts receivable is diversified due to the large number of entities comprising our customer base and their dispersion across many different industries and geographies. Credit risk associated with our investment in direct-financing leases has been mitigated by a contract with a third party to provide credit protection. We have a comprehensive credit policy in place and exposure to credit risk is monitored on an ongoing basis. Credit evaluations are performed on all customers requiring credit over a certain amount and we sell the majority of our products through our direct sales force. Credit risk is mitigated through collateral such as letter of credit, bank guarantees or payment terms like cash in advance. Credit evaluation is performed by an independent team to ensure proper segregation of duties. No single customer accounted for more than 10 percent of combined accounts receivable as of October 31, 2011 and 2010.
Derivative instruments. Agilent is exposed to global market exchange rate and interest rate risks in the normal course of business. We enter into foreign exchange contracts, primarily forward contracts and purchased options and interest rate swaps to manage financial exposures resulting from changes in foreign currency exchange rates and interest rates. In the vast majority of cases, these contracts are designated at inception as hedges of the related foreign currency or interest exposures. Foreign currency exposures include committed and anticipated revenue and expense transactions and assets and liabilities that are denominated in currencies other than the functional currency of the subsidiary. Interest rate exposures are associated with the company’s fixed-rate debt. For option contracts, we exclude time value from the measurement of effectiveness. To achieve hedge accounting, contracts must reduce the foreign currency exchange rate and interest rate risk otherwise inherent in the amount and duration of the hedged exposures and comply with established risk management policies; foreign exchange hedging contracts generally mature within twelve months and interest rate swaps mature at the same time as the maturity of the debt. In order to manage foreign currency exposures in a few limited jurisdictions, such as China, we may enter into foreign exchange contracts that do not qualify for hedge accounting. In such circumstances, the local foreign currency exposure is offset by contracts owned by the parent company. We do not use derivative financial instruments for speculative trading purposes.
All derivatives are recognized on the balance sheet at their fair values. For derivative instruments that are designated and qualify as a fair value hedge, changes in value of the derivative are recognized in the consolidated statement of operations in the current period, along with the offsetting gain or loss on the hedged item attributable to the hedged risk. For derivative instruments that are designated and qualify as a cash flow, changes in the value of the effective portion of the derivative instrument is recognized in accumulated comprehensive income, a component of stockholders’ equity. Amounts associated with cash flow hedges are reclassified and recognized in income when either the forecasted transaction occurs or it becomes probable the forecasted transaction will not occur. Derivatives not designated as hedging instruments are

40
recorded on the balance sheet at their fair value and changes in the fair values are recorded in the income statement in the current period. Derivative instruments are subject to master netting arrangements and qualify for net presentation in the balance sheet. Changes in the fair value of the ineffective portion of derivative instruments are recognized in earnings in the current period. Ineffectiveness in 2011, 2010 and 2009 was not significant.
Property, plant and equipment. Property, plant and equipment are stated at cost less accumulated depreciation. Additions, improvements and major renewals are capitalized; maintenance, repairs and minor renewals are expensed as incurred. When assets are retired or disposed of, the assets and related accumulated depreciation and amortization are removed from our general ledger, and the resulting gain or loss is reflected in the consolidated statement of operations. Buildings and improvements are depreciated over the lesser of their useful lives or the remaining term of the lease and machinery and equipment over three to ten years. We currently use the straight-line method to depreciate assets.
Leases. We lease buildings, machinery and equipment under operating leases for original terms ranging generally from one to twenty years. Certain leases contain renewal options for periods up to six years.
Capitalized software. We capitalize certain internal and external costs incurred to acquire or create internal use software. Capitalized software is included in property, plant and equipment and is depreciated over three to five years once development is complete.
Impairment of long‑lived assets. We continually monitor events and changes in circumstances that could indicate carrying amounts of long-lived assets, including intangible assets, may not be recoverable. When such events or changes in circumstances occur, we assess the recoverability of long-lived assets by determining whether the carrying value of such assets will be recovered through undiscounted expected future cash flows. If the total of the undiscounted future cash flows is less than the carrying amount of those assets, we recognize an impairment loss based on the excess of the carrying amount over the fair value of the assets.
Employee compensation and benefits. Amounts owed to employees, such as accrued salary, bonuses and vacation benefits are accounted for within employee compensation and benefits. The total amount of accrued vacation benefit was $144 million and $142 million as of October 31, 2011 and 2010, respectively.
Foreign currency translation. We translate and remeasure balance sheet and income statement items into U.S. dollars. For those subsidiaries that operate in a local currency functional environment, all assets and liabilities are translated into U.S. dollars using current exchange rates; revenue and expenses are translated using monthly exchange rates which approximate to average exchange rates in effect during each period. Resulting translation adjustments are reported as a separate component of accumulated comprehensive loss in stockholders’ equity.
For those subsidiaries that operate in a U.S. dollar functional environment, foreign currency assets and liabilities are remeasured into U.S. dollars at current exchange rates except for nonmonetary assets and capital accounts which are remeasured at historical exchange rates. Revenue and expenses are generally remeasured at monthly exchange rates which approximate average exchange rates in effect during each period. Gains or losses from foreign currency remeasurement are included in consolidated net income (loss). Net gains or losses resulting from foreign currency transactions, including hedging gains and losses, are reported in other income (expense), net and was $1 million loss for fiscal year 2011, 2010 and 2009.

Annu
al R
epor
t Fin
anci
als
41
2. New Accounting Pronouncements
In October 2009, the Financial Accounting Standards Board (“FASB”) amended revenue recognition guidance for arrangements with multiple deliverables. The guidance eliminates the residual method of revenue recognition and requires the use of management’s best estimate of selling price for individual elements of an arrangement when VSOE, or TPE is unavailable. The FASB also amended the scope of existing software revenue recognition accounting. Tangible products containing software components and non-software components that function together to deliver the product’s essential functionality would be scoped out of the accounting guidance on software and accounted for based on other appropriate revenue recognition guidance. We adopted all of the above guidance effective November 1, 2010 on a prospective basis. The adoption of the amended revenue recognition rules did not have a material impact on our consolidated financial statements. See Note 1, “Overview, Basis of Presentation and Summary of Significant Accounting Policies” for additional information.
In January 2010, the FASB issued guidance that requires new disclosures for fair value measurements and provides clarification for existing disclosure requirements. The guidance is effective for interim and annual periods beginning after December 15, 2009, except for gross presentation of activity in level 3 which is effective for annual periods beginning after December 15, 2010, and for interim periods in those years. We adopted the guidance for new disclosures for fair value measurements and clarification for existing disclosure requirements as of February 1, 2010 and there was no material impact on our consolidated financial statements. Additionally, we will adopt the guidance regarding level 3 activity on November 1, 2011 and we do not expect there to be a material impact to our consolidated financial statements. See Note 12, “Fair Value Measurements” for additional information on the fair value of financial instruments.
In April 2010, the FASB issued guidance on defining a milestone and determining when it may be appropriate to apply the milestone method of revenue recognition for research or development transactions. The guidance is effective on a prospective basis for milestones achieved in fiscal years, and interim periods within those years, beginning on or after June 15, 2010, with early adoption permitted. We adopted the guidance in the first quarter of 2011 and there was no material impact on our consolidated financial statements.
In May 2011, the FASB amended fair value measurement and disclosure guidance to achieve convergence with International Financial Reporting Standards (“IFRS”). The amended guidance modifies the measurement of fair value, clarifies verbiage, and changes disclosure or other requirements in US GAAP and IFRS. The guidance is effective during interim and annual periods beginning after December 15, 2011. We do not expect a material impact on our consolidated financial statements due to the adoption of this guidance.
In June 2011, the FASB issued guidance related to the presentation of comprehensive income. The guidance aims to improve the comparability, consistency, and transparency of financial reporting and to increase the prominence of items reported in other comprehensive income. The guidance is effective for fiscal years, and interim periods within those years, beginning after December 15, 2011. We expect to make presentational changes to our consolidated financial statements upon adoption of this guidance, but as this guidance impacts financial statement presentation requirements only, its adoption will not have a material impact on our consolidated financial statements.
In September 2011, the FASB amended guidance relating to the goodwill impairment test. The changes are intended to reduce the cost and complexity of the annual test by providing entities an option to perform a qualitative assessment to determine whether further impairment testing

42
is necessary. The revised guidance includes examples of events and circumstances that might indicate that a reporting unit’s fair value is less than its carrying amount. The changes will be effective for annual and interim goodwill impairment tests performed for fiscal years beginning after December 15, 2011. However, earlier adoption is permitted. Agilent has opted to early adopt this guidance for the year ended October 31, 2011, See Note 1, “Overview, Basis of Presentation and Summary of Significant Accounting Policies” for additional information.
3. Acquisition of varian
On May 14, 2010, we completed the acquisition of Varian through the merger of Varian and Cobalt Acquisition Corp., a direct wholly-owned subsidiary of Agilent under the Merger Agreement, dated July 26, 2009. As a result of the merger, Varian became a wholly-owned subsidiary of Agilent. Accordingly, the results of Varian are included in Agilent’s consolidated financial statements from the date of the merger. For the period from May 15, 2010 to October 31, 2010, Varian’s net revenue was $320 million.
The consideration paid was approximately $1,507 million, comprising $52 cash per share of Varian’s outstanding common stock. We also paid $17 million to acquire Varian’s vested in-the money stock options at $52 cash per share less their exercise price. In addition we paid $12 million for Varian’s non-vested in-the-money stock options at $52 cash per share less their exercise price, and Varian’s non-vested restricted stock awards and non-vested performance shares, each at 100 percent of target and at $52 cash per share. In accordance with the authoritative accounting guidance, settlement of the non-vested awards is considered to be for the performance of post combination services and is therefore stock-based compensation expensed immediately after acquisition. Agilent funded the acquisition using the proceeds from our September 2009 offering of senior notes and other existing cash.
The Varian merger was accounted for in accordance with the authoritative accounting guidance. The acquired assets and assumed liabilities were recorded by Agilent at their estimated fair values. Agilent determined the estimated fair values with the assistance of appraisals or valuations performed by independent third party specialists, discounted cash flow analyses, quoted market prices where available, and estimates made by management. We expect to realize operational and cost synergies, leverage the existing sales channels and product development resources, and utilize the assembled workforce. The company expects the combined entity to achieve significant savings in corporate and divisional overhead costs. The company also anticipates opportunities for growth through expanded geographic and customer segment diversity and the ability to leverage additional products and capabilities. These factors, among others, contributed to a purchase price in excess of the estimated fair value of Varian’s net identifiable assets acquired, and, as a result, we have recorded goodwill in connection with this transaction.
Goodwill acquired was allocated to our operating segments and reporting units as a part of the purchase price allocation. We do not expect the goodwill recognized to be deductible for income tax purposes. Any impairment charges made in the future associated with goodwill will not be tax deductible.
A portion of the overall purchase price was allocated to acquired intangible assets. Amortization expense associated with acquired intangible assets is not deductible for tax purposes. Therefore, approximately $138 million was established as a deferred tax liability for the future amortization of these intangibles.
Annu
al R
epor
t Fin
anci
als
43
The following table summarizes the allocation of the purchase price to the estimated fair values of the assets acquired and liabilities assumed on the closing date of May 14, 2010 (in millions):
Cash and cash equivalents . . . . . . . . . . . . . . . . . . . . . . . . . . . . . . . $ 226Accounts receivable. . . . . . . . . . . . . . . . . . . . . . . . . . . . . . . . . . . . . 138Inventories . . . . . . . . . . . . . . . . . . . . . . . . . . . . . . . . . . . . . . . . . . . . 170Other current assets . . . . . . . . . . . . . . . . . . . . . . . . . . . . . . . . . . . . 47Property, plant and equipment . . . . . . . . . . . . . . . . . . . . . . . . . . . 126Intangible assets . . . . . . . . . . . . . . . . . . . . . . . . . . . . . . . . . . . . . . . 417Other assets . . . . . . . . . . . . . . . . . . . . . . . . . . . . . . . . . . . . . . . . . . . 13Goodwill . . . . . . . . . . . . . . . . . . . . . . . . . . . . . . . . . . . . . . . . . . . . . . 787Total assets acquired. . . . . . . . . . . . . . . . . . . . . . . . . . . . . . . . . . . . 1,924Accounts payable . . . . . . . . . . . . . . . . . . . . . . . . . . . . . . . . . . . . . . . (65)Employee compensation and benefits . . . . . . . . . . . . . . . . . . . . . . (43)Deferred revenue . . . . . . . . . . . . . . . . . . . . . . . . . . . . . . . . . . . . . . . (30)Other accrued liabilities . . . . . . . . . . . . . . . . . . . . . . . . . . . . . . . . . (72)Long-term debt. . . . . . . . . . . . . . . . . . . . . . . . . . . . . . . . . . . . . . . . . (15)Retirement and post-retirement benefits . . . . . . . . . . . . . . . . . . . (18)Other long-term liabilities. . . . . . . . . . . . . . . . . . . . . . . . . . . . . . . . (157)
Net assets acquired . . . . . . . . . . . . . . . . . . . . . . . . . . . . . . . . . . . . . $1,524
The fair value of cash and cash equivalents, accounts receivable, other current assets, accounts payable and other accrued liabilities were generally determined using historical carrying values given the short-term nature of these assets and liabilities.
The fair values for acquired inventory, property, plant and equipment, intangible assets, retirement and post-retirement benefits, and deferred revenue were determined with the assistance of valuations performed by independent valuation specialists.
The fair values of certain other assets, long-term debt, and certain other long-term liabilities were determined internally using discounted cash flow analyses and estimates made by management.
The company has completed its business combination accounting as of May 14, 2010.
Valuations of intangible assets acquired
The components of intangible assets acquired in connection with the Varian acquisition were as follows (in millions):
Fair valueEstimated Useful Life
Developed product technology . . . . . . . . . . . . . . . . . . . . . . . . . . . . $221 1-7 yrsCustomer relationships . . . . . . . . . . . . . . . . . . . . . . . . . . . . . . . . . . 157 2-10 yrsTradenames and trademarks . . . . . . . . . . . . . . . . . . . . . . . . . . . . . 10 1.5 yrsOrder backlog . . . . . . . . . . . . . . . . . . . . . . . . . . . . . . . . . . . . . . . . . . 9 0.5-1 yrTotal intangible assets subject to amortization . . . . . . . . . . . . . . 397In-process research and development. . . . . . . . . . . . . . . . . . . . . . 20
Total intangible assets . . . . . . . . . . . . . . . . . . . . . . . . . . . . . . . . . . $417
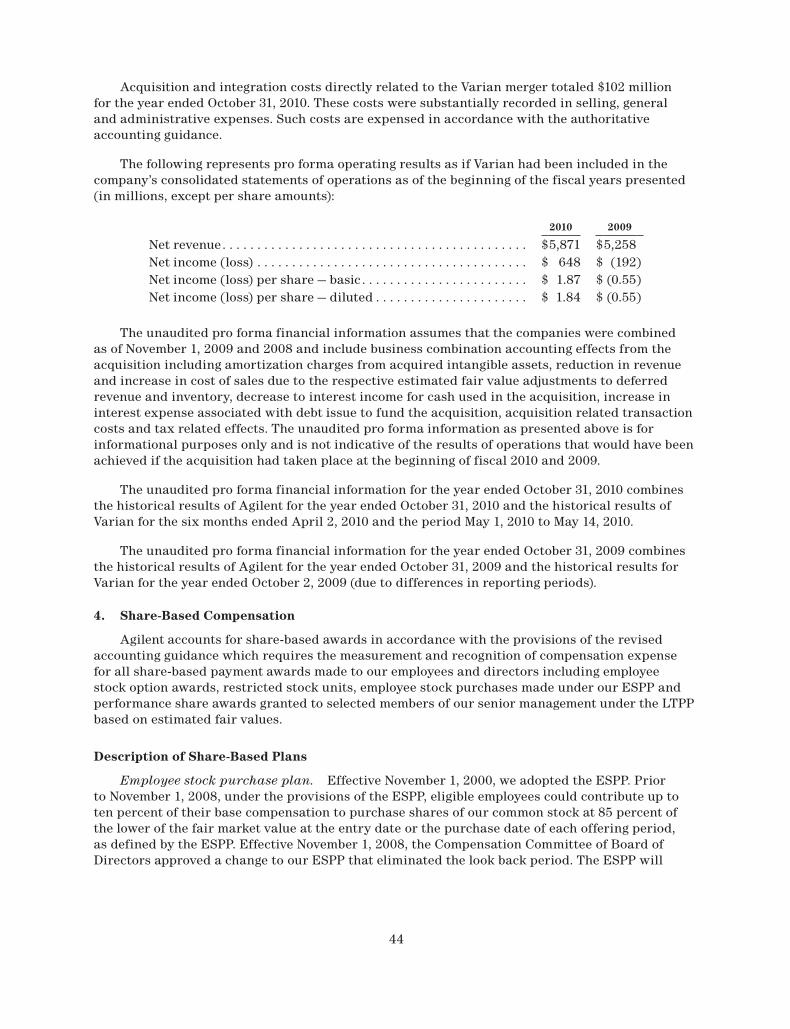
44
Acquisition and integration costs directly related to the Varian merger totaled $102 million for the year ended October 31, 2010. These costs were substantially recorded in selling, general and administrative expenses. Such costs are expensed in accordance with the authoritative accounting guidance.
The following represents pro forma operating results as if Varian had been included in the company’s consolidated statements of operations as of the beginning of the fiscal years presented (in millions, except per share amounts):
2010 2009
Net revenue. . . . . . . . . . . . . . . . . . . . . . . . . . . . . . . . . . . . . . . . . . . . $5,871 $5,258Net income (loss) . . . . . . . . . . . . . . . . . . . . . . . . . . . . . . . . . . . . . . . $ 648 $ (192)Net income (loss) per share — basic . . . . . . . . . . . . . . . . . . . . . . . . $ 1.87 $ (0.55)Net income (loss) per share — diluted . . . . . . . . . . . . . . . . . . . . . . $ 1.84 $ (0.55)
The unaudited pro forma financial information assumes that the companies were combined as of November 1, 2009 and 2008 and include business combination accounting effects from the acquisition including amortization charges from acquired intangible assets, reduction in revenue and increase in cost of sales due to the respective estimated fair value adjustments to deferred revenue and inventory, decrease to interest income for cash used in the acquisition, increase in interest expense associated with debt issue to fund the acquisition, acquisition related transaction costs and tax related effects. The unaudited pro forma information as presented above is for informational purposes only and is not indicative of the results of operations that would have been achieved if the acquisition had taken place at the beginning of fiscal 2010 and 2009.
The unaudited pro forma financial information for the year ended October 31, 2010 combines the historical results of Agilent for the year ended October 31, 2010 and the historical results of Varian for the six months ended April 2, 2010 and the period May 1, 2010 to May 14, 2010.
The unaudited pro forma financial information for the year ended October 31, 2009 combines the historical results of Agilent for the year ended October 31, 2009 and the historical results for Varian for the year ended October 2, 2009 (due to differences in reporting periods).
4. Share-Based Compensation
Agilent accounts for share-based awards in accordance with the provisions of the revised accounting guidance which requires the measurement and recognition of compensation expense for all share-based payment awards made to our employees and directors including employee stock option awards, restricted stock units, employee stock purchases made under our ESPP and performance share awards granted to selected members of our senior management under the LTPP based on estimated fair values.
Description of Share-Based Plans
Employee stock purchase plan. Effective November 1, 2000, we adopted the ESPP. Prior to November 1, 2008, under the provisions of the ESPP, eligible employees could contribute up to ten percent of their base compensation to purchase shares of our common stock at 85 percent of the lower of the fair market value at the entry date or the purchase date of each offering period, as defined by the ESPP. Effective November 1, 2008, the Compensation Committee of Board of Directors approved a change to our ESPP that eliminated the look back period. The ESPP will

Annu
al R
epor
t Fin
anci
als
45
continue to allow eligible employees to purchase shares of our common stock at 85 percent of the purchase price, but only uses the purchase date to establish the fair market value. Shares authorized for issuance in connection with the ESPP are subject to an automatic annual increase of the lesser of one percent of the outstanding shares of common stock of Agilent on November 1, or an amount determined by the Compensation Committee of our Board of Directors. Under the terms of the ESPP, in no event shall the number of shares issued under the ESPP exceed 75 million shares.
Under our ESPP, employees purchased 1,205,431 shares for $43 million in 2011, 1,577,388 shares for $40 million in 2010 and 3,007,747 shares for $52 million in 2009. As of October 31, 2011, the number of shares of common stock authorized and available for issuance under our ESPP was 33,577,991. This excludes the number of shares of common stock to be issued to participants in consideration of the aggregate participant contributions totaling $24 million as of October 31, 2011.
Incentive compensation plans. On November 19, 2008 and March 11, 2009, the Compensation Committee of Board of Directors and the stockholders, respectively, approved the Agilent Technologies, Inc. 2009 Stock Plan (the “2009 Stock Plan”) to replace the Company’s 1999 Stock Plan and 1999 Stock Non-Employee Director Stock Plan and subsequently reserved 25 million shares of Company common stock that may be issued under the 2009 Plan, plus any shares forfeited or cancelled under the 1999 Stock Plan. The 2009 Stock Plan provides for the grant of awards in the form of stock options, stock appreciation rights (“SARs”), restricted stock, restricted stock units (“RSUs”), performance shares and performance units with performance-based conditions on vesting or exercisability, and cash awards. The 2009 Plan has a term of ten years. As of October 31, 2011, 20,699,753 shares were available for future awards under the 2009 Stock Plan.
Stock options granted under the 2009 Stock Plans may be either “incentive stock options”, as defined in Section 422 of the Internal Revenue Code, or non-statutory. Options generally vest at a rate of 25 percent per year over a period of four years from the date of grant and generally have a maximum contractual term of ten years. The exercise price for stock options is generally not less than 100 percent of the fair market value of our common stock on the date the stock award is granted.
Effective November 1, 2003, the Compensation Committee of the Board of Directors approved the LTPP, which is a performance stock award program administered under the 1999 and 2009 Stock Plans, for the company’s executive officers and other key employees. Participants in this program are entitled to receive unrestricted shares of the company’s stock after the end of a three-year period, if specified performance targets are met. LTPP awards are generally designed to meet the criteria of a performance award with the performance metrics and peer group comparison set at the beginning of the performance period. Based on the performance metrics the final award may vary from zero to 200 percent of the target award. The maximum contractual term for awards under the LTPP program is three years. We consider the dilutive impact of this program in our diluted net income (loss) per share calculation only to the extent that the performance conditions are met.
In March 2007, we began to issue restricted stock units under our share-based plans. The estimated fair value of the restricted stock unit awards granted under the Stock Plans is determined based on the market price of Agilent’s common stock on the date of grant. Restricted stock units generally vest, with some exceptions, at a rate of 25 percent per year over a period of four years from the date of grant.
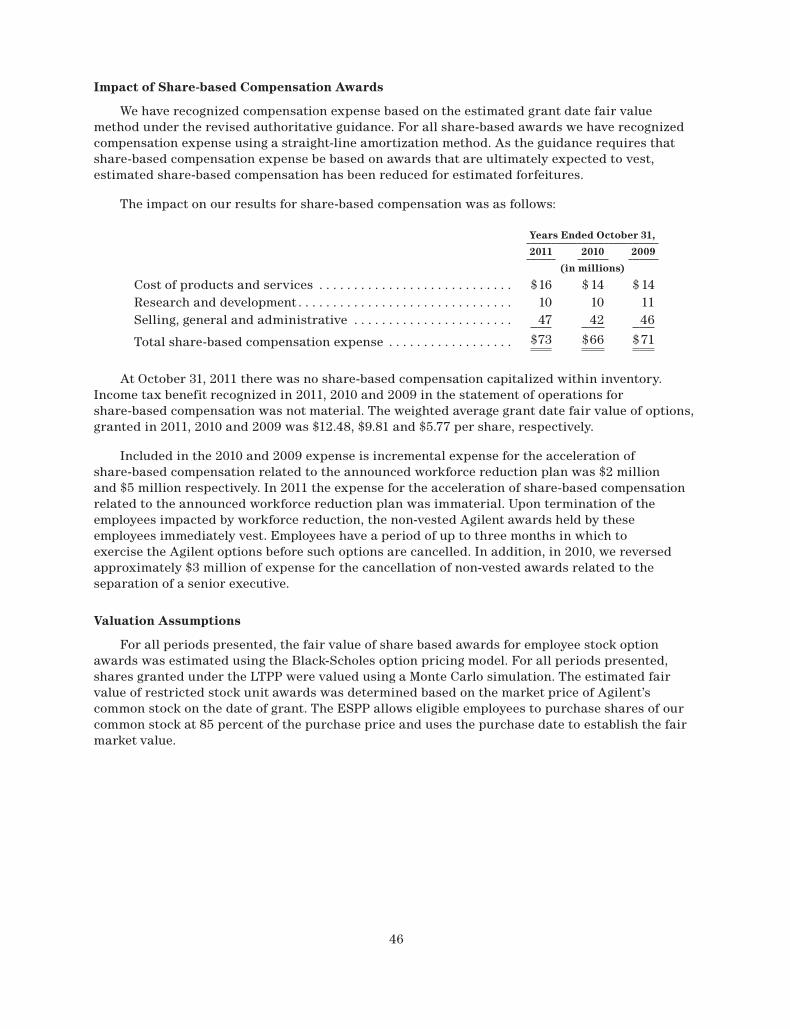
46
Impact of Share-based Compensation Awards
We have recognized compensation expense based on the estimated grant date fair value method under the revised authoritative guidance. For all share-based awards we have recognized compensation expense using a straight-line amortization method. As the guidance requires that share-based compensation expense be based on awards that are ultimately expected to vest, estimated share-based compensation has been reduced for estimated forfeitures.
The impact on our results for share-based compensation was as follows:
Years Ended October 31,
2011 2010 2009
(in millions)
Cost of products and services . . . . . . . . . . . . . . . . . . . . . . . . . . . . $16 $14 $14Research and development . . . . . . . . . . . . . . . . . . . . . . . . . . . . . . . 10 10 11Selling, general and administrative . . . . . . . . . . . . . . . . . . . . . . . 47 42 46
Total share-based compensation expense . . . . . . . . . . . . . . . . . . $73 $66 $71
At October 31, 2011 there was no share-based compensation capitalized within inventory. Income tax benefit recognized in 2011, 2010 and 2009 in the statement of operations for share-based compensation was not material. The weighted average grant date fair value of options, granted in 2011, 2010 and 2009 was $12.48, $9.81 and $5.77 per share, respectively.
Included in the 2010 and 2009 expense is incremental expense for the acceleration of share-based compensation related to the announced workforce reduction plan was $2 million and $5 million respectively. In 2011 the expense for the acceleration of share-based compensation related to the announced workforce reduction plan was immaterial. Upon termination of the employees impacted by workforce reduction, the non-vested Agilent awards held by these employees immediately vest. Employees have a period of up to three months in which to exercise the Agilent options before such options are cancelled. In addition, in 2010, we reversed approximately $3 million of expense for the cancellation of non-vested awards related to the separation of a senior executive.
valuation Assumptions
For all periods presented, the fair value of share based awards for employee stock option awards was estimated using the Black-Scholes option pricing model. For all periods presented, shares granted under the LTPP were valued using a Monte Carlo simulation. The estimated fair value of restricted stock unit awards was determined based on the market price of Agilent’s common stock on the date of grant. The ESPP allows eligible employees to purchase shares of our common stock at 85 percent of the purchase price and uses the purchase date to establish the fair market value.

Annu
al R
epor
t Fin
anci
als
47
The following assumptions were used to estimate the fair value of employee stock options and LTPP grants.
Years Ended October 31,
2011 2010 2009
Stock Option Plans:Weighted average risk-free interest rate . . . . . . . . . . 1.49% 2.19% 2.31%Dividend yield. . . . . . . . . . . . . . . . . . . . . . . . . . . . . . . . 0% 0% 0%Weighted average volatility. . . . . . . . . . . . . . . . . . . . . 35% 37% 32%Expected life. . . . . . . . . . . . . . . . . . . . . . . . . . . . . . . . . 5.80 yrs 4.40 yrs 4.40 yrs
LTPP:Volatility of Agilent shares . . . . . . . . . . . . . . . . . . . . . 40% 39% 33%Volatility of selected peer-company shares . . . . . . . 20%-76% 20%-80% 17%-62%Price-wise correlation with selected peers. . . . . . . . 55% 53% 35%
Both the Black-Scholes and Monte Carlo simulation fair value models require the use of highly subjective and complex assumptions, including the option’s expected life and the price volatility of the underlying stock. For all the years presented, the expected stock price volatility assumption was determined using the historical volatility of Agilent’s stock options over the most recent historical period equivalent to the expected life.
In 2009 and 2010 the expected life of our employee stock options was 4.4 years. In the first quarter of 2011, we revised our estimate of the expected life of our employee stock options from 4.4 to 5.8 years. For the grants awarded under the 2009 stock plan after November 1, 2010, we increased the period available to retirement eligible employees to exercise their options from three years at retirement date to the full contractual term of ten years. In developing our estimated life of our employee stock options of 5.8 years, we considered the historical option exercise behavior of our executive employees who were granted the majority of the options in the annual grants made during the three months ended January 31, 2011, which we believe is representative of future behavior.
Share-based Payment Award Activity
Employee Stock Options
The following table summarizes employee stock option award activity made to our employees and directors for 2011:
Options Outstanding
Weighted Average
Exercise Price
(in thousands)
Outstanding at October 31, 2010 . . . . . . . . . . . . . . . . . . 22,644 $28Granted . . . . . . . . . . . . . . . . . . . . . . . . . . . . . . . . . . . . . . . 1,342 $35Exercised . . . . . . . . . . . . . . . . . . . . . . . . . . . . . . . . . . . . . (9,738) $27Cancelled/Forfeited/Expired . . . . . . . . . . . . . . . . . . . . . (1,177) $42
Outstanding at October 31, 2011 . . . . . . . . . . . . . . . . . . 13,071 $28
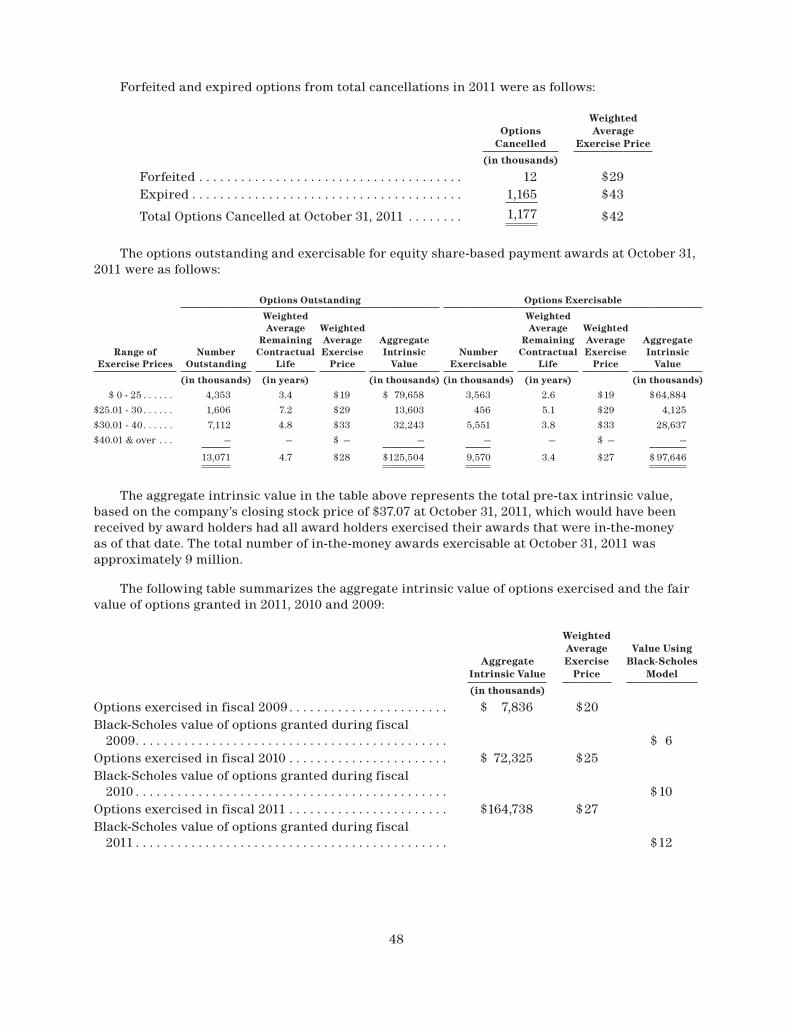
48
Forfeited and expired options from total cancellations in 2011 were as follows:
Options Cancelled
Weighted Average
Exercise Price
(in thousands)
Forfeited . . . . . . . . . . . . . . . . . . . . . . . . . . . . . . . . . . . . . . 12 $29Expired . . . . . . . . . . . . . . . . . . . . . . . . . . . . . . . . . . . . . . . 1,165 $43
Total Options Cancelled at October 31, 2011 . . . . . . . . 1,177 $42
The options outstanding and exercisable for equity share-based payment awards at October 31, 2011 were as follows:
Options Outstanding Options Exercisable
Range of Exercise Prices
Number Outstanding
Weighted Average
Remaining Contractual
Life
Weighted Average Exercise
Price
Aggregate Intrinsic
valueNumber
Exercisable
Weighted Average
Remaining Contractual
Life
Weighted Average Exercise
Price
Aggregate Intrinsic
value
(in thousands) (in years) (in thousands) (in thousands) (in years) (in thousands)
$ 0 - 25 . . . . . . 4,353 3.4 $19 $ 79,658 3,563 2.6 $19 $64,884
$25.01 - 30 . . . . . . 1,606 7.2 $29 13,603 456 5.1 $29 4,125
$30.01 - 40 . . . . . . 7,112 4.8 $33 32,243 5,551 3.8 $33 28,637
$40.01 & over . . . — — $ — — — — $ — —
13,071 4.7 $28 $125,504 9,570 3.4 $27 $ 97,646
The aggregate intrinsic value in the table above represents the total pre-tax intrinsic value, based on the company’s closing stock price of $37.07 at October 31, 2011, which would have been received by award holders had all award holders exercised their awards that were in-the-money as of that date. The total number of in-the-money awards exercisable at October 31, 2011 was approximately 9 million.
The following table summarizes the aggregate intrinsic value of options exercised and the fair value of options granted in 2011, 2010 and 2009:
Aggregate Intrinsic value
Weighted Average Exercise
Price
value Using Black-Scholes
Model
(in thousands)
Options exercised in fiscal 2009 . . . . . . . . . . . . . . . . . . . . . . . $ 7,836 $20Black-Scholes value of options granted during fiscal
2009 . . . . . . . . . . . . . . . . . . . . . . . . . . . . . . . . . . . . . . . . . . . . . $ 6Options exercised in fiscal 2010 . . . . . . . . . . . . . . . . . . . . . . . $ 72,325 $25Black-Scholes value of options granted during fiscal
2010 . . . . . . . . . . . . . . . . . . . . . . . . . . . . . . . . . . . . . . . . . . . . . $10Options exercised in fiscal 2011 . . . . . . . . . . . . . . . . . . . . . . . $164,738 $27Black-Scholes value of options granted during fiscal
2011 . . . . . . . . . . . . . . . . . . . . . . . . . . . . . . . . . . . . . . . . . . . . . $12
Options Outstanding Options Exercisable
Range of Exercise
PricesNumber
Outstanding
Weighted Average
Remaining Contractual
Life
Weighted Average Exercise
Price
Aggregate Intrinsic
valueNumber
Exercisable
Weighted Average
Remaining Contractual
Life
Weighted Average Exercise
Price
Aggregate Intrinsic
value
(in thousands) (in years) (in thousands) (in thousands) (in years) (in thousands)
$ 0 - 25 . . . . . 4,353 3.4 $19 $ 79,658 3,563 2.6 $19 $64,884
$25.01 - 30 . . . . . 1,606 7.2 $29 13,603 456 5.1 $29 4,125
$30.01 - 40 . . . . . 7,112 4.8 $33 32,243 5,551 3.8 $33 28,637
$40.01 & over. . . — — $ — — — — $ — —
13,071 4.7 $28 $125,504 9,570 3.4 $27 $ 97,646

Annu
al R
epor
t Fin
anci
als
49
As of October 31, 2011, the unrecognized share-based compensation costs for outstanding stock option awards, net of expected forfeitures, was approximately $12 million which is expected to be amortized over a weighted average period of 2.4 years. The amount of cash received from the exercise of share-based awards granted was $304 million in 2011, $299 million in 2010 and $71 million in 2009. See Note 5, “Provision for Income Taxes” for the tax impact on share-based award exercises.
Non‑vested Awards
The following table summarizes non-vested award activity in 2011 primarily for our LTPP and restricted stock unit awards:
Shares
Weighted Average
Grant Price
(in thousands)
Non-vested at October 31, 2010 . . . . . . . . . . . . . . . . . . . 3,284 $29Granted . . . . . . . . . . . . . . . . . . . . . . . . . . . . . . . . . . . . . . 1,594 $37Vested . . . . . . . . . . . . . . . . . . . . . . . . . . . . . . . . . . . . . . . . (1,322) $33Forfeited . . . . . . . . . . . . . . . . . . . . . . . . . . . . . . . . . . . . . . (78) $33FY2008 LTPP Incremental Issuance . . . . . . . . . . . . . . . 126 $35
Non-vested at October 31, 2011 . . . . . . . . . . . . . . . . . . . 3,604 $31
As of October 31, 2011, the unrecognized share-based compensation costs for non-vested restricted stock awards, net of expected forfeitures, was approximately $50 million which is expected to be amortized over a weighted average period of 2.5 years. The total fair value of restricted stock awards vested was $43 million for 2011, $35 million for 2010 and $25 million for 2009.
5. Provision for Income Taxes
The domestic and foreign components of income (loss) before taxes are:
Years Ended October 31,
2011 2010 2009
(in millions)
U.S. operations . . . . . . . . . . . . . . . . . . . . . . . . . . . . . . $ 88 $163 $(226)Non-U.S. operations . . . . . . . . . . . . . . . . . . . . . . . . . . 944 529 233
Total provision . . . . . . . . . . . . . . . . . . . . . . . . . . . . . . $1,032 $692 $ 7

50
The provision for income taxes is comprised of:
Years Ended October 31,
2011 2010 2009
(in millions)
U.S. federal taxes:Current . . . . . . . . . . . . . . . . . . . . . . . . . . . . . . . . . . $ (1) $ (40) $ (20)Deferred . . . . . . . . . . . . . . . . . . . . . . . . . . . . . . . . . — 37 26
Non-U.S. taxes:Current . . . . . . . . . . . . . . . . . . . . . . . . . . . . . . . . . . (6) 145 20Deferred . . . . . . . . . . . . . . . . . . . . . . . . . . . . . . . . . 28 (141) 6
State taxes, net of federal benefit:Current . . . . . . . . . . . . . . . . . . . . . . . . . . . . . . . . . . (11) 12 10Deferred . . . . . . . . . . . . . . . . . . . . . . . . . . . . . . . . . 10 (5) (4)
Total provision . . . . . . . . . . . . . . . . . . . . . . . . . . . . . . $ 20 $ 8 $ 38
The income tax provision does not reflect potential future tax savings resulting from excess deductions associated with our various share-based award plans.
The significant components of deferred tax assets and deferred tax liabilities included on the consolidated balance sheet are:
Years Ended October 31,
2011 2010
Deferred Tax Assets
Deferred Tax Liabilities
Deferred Tax Assets
Deferred Tax Liabilities
(in millions)
Inventory. . . . . . . . . . . . . . . . . . . . . . . . . . . . . . . . $ 30 $ — $ 36 $ —Intangibles . . . . . . . . . . . . . . . . . . . . . . . . . . . . . . — 82 — 132Property, plant and equipment . . . . . . . . . . . . . — 32 4 16Warranty reserves . . . . . . . . . . . . . . . . . . . . . . . . 16 — 14 1Retiree medical benefits . . . . . . . . . . . . . . . . . . . 14 — 43 2Pension benefits . . . . . . . . . . . . . . . . . . . . . . . . . . 110 — 199 49Employee benefits, other than retirement . . . . 84 — 96 —Net operating loss, capital loss,
and credit carryforwards . . . . . . . . . . . . . . . . 272 — 393 —Unrealized gains/losses on investments . . . . . . 47 — 47 —Unremitted earnings of foreign subsidiaries . . — — — 88Share-based compensation. . . . . . . . . . . . . . . . . 48 — 51 —Deferred revenue . . . . . . . . . . . . . . . . . . . . . . . . . 18 — 93 2Other . . . . . . . . . . . . . . . . . . . . . . . . . . . . . . . . . . . 56 36 52 3
Subtotal . . . . . . . . . . . . . . . . . . . . . . . . . . . . . . . 695 150 1,028 293Tax valuation allowance . . . . . . . . . . . . . . . . . . . (369) — (527) —Total deferred tax assets or deferred tax
liabilities . . . . . . . . . . . . . . . . . . . . . . . . . . . . . . $ 326 $150 $ 501 $293

Annu
al R
epor
t Fin
anci
als
51
The breakdown between current and long-term deferred tax assets and deferred tax liabilities was as follows for the years 2011 and 2010:
Years Ended October 31,
2011 2010
(in millions)
Current deferred tax assets (included within other current assets) . . . . . . . . . . . . . . . . . . . . . . . . . . . . . . . . . . $ 54 $ 99
Long-term deferred tax assets (included within other assets) . . . . . . . . . . . . . . . . . . . . . . . . . . . . . . . . . . . . . . . . . 168 190
Current deferred tax liabilities (included within other accrued liabilities) . . . . . . . . . . . . . . . . . . . . . . . . . . . . . . (4) (10)
Long-term deferred tax liabilities (included within other long-term liabilities) . . . . . . . . . . . . . . . . . . . . . . . . . . . . . (42) (71)
Total . . . . . . . . . . . . . . . . . . . . . . . . . . . . . . . . . . . . . . . . . . . . . . . . . $ 176 $208
During 2003, we established valuation allowances for the deferred tax assets of the U.S. and certain entities in foreign jurisdictions. The valuation allowances require an assessment of both positive and negative evidence when determining whether it is more likely than not that deferred tax assets are recoverable. Such assessment is required on a jurisdiction by jurisdiction basis. During 2011, 2010 and 2009, we continued to maintain a valuation allowance for U.S. federal and state deferred tax assets until sufficient positive evidence exists to support reversal. We currently have a valuation allowance of $369 million of which $308 million relates to U.S. jurisdictions. The reduction to the valuation allowance in 2011 is primarily due to the reduction in the deferred taxes relating to pension and post retirement medical benefits and the utilization of tax credits associated with the repatriation of foreign earnings. Due to improvements in the U.S. operating results over the past three years, management believes a reasonable possibility exists that, within the next year, sufficient positive evidence may become available to reach a conclusion that the U.S. valuation allowance will no longer be needed. In 2010, after consideration of all the available positive and negative evidence, we concluded that it is more likely than not that all of the U.K. deferred tax assets will be realized and reversed the entire U.K. valuation allowance. We intend to maintain a valuation allowance in these jurisdictions until sufficient positive evidence exists to support its reversal.
At October 31, 2011, we had federal net operating loss carryforwards of approximately $24 million and tax credit carryforwards of approximately $121 million. The federal net operating losses expire in years beginning 2021 through 2026, and the federal tax credits begin to expire in 2018, if not utilized. At October 31, 2011, we had state net operating loss carryforwards of approximately $219 million which expire in years beginning 2014 through 2031, if not utilized. In addition, we had state tax credit carryforwards of $6 million that do not expire. All of the federal and some of the state net operating loss carryforwards are subject to change of ownership limitations provided by the Internal Revenue Code and similar state provisions. These annual loss limitations may result in the expiration or reduced utilization of the net operating losses. At October 31, 2011, we also had foreign net operating loss carryforwards of approximately $517 million. Of this foreign loss, $271 million will expire in years beginning 2012 through 2021, if not utilized. The remaining $246 million has an indefinite life. Some of the foreign losses are subject to annual loss limitation rules.

52
The authoritative guidance prohibits recognition of a deferred tax asset for excess tax benefits related to stock and stock option plans that have not yet been realized through reduction in income taxes payable. Such unrecognized deferred tax benefits totaled $194 million as of October 31, 2011 and will be accounted for as a credit to shareholders’ equity, if and when realized through a reduction in income taxes payable.
The differences between the U.S. federal statutory income tax rate and our effective tax rate are:
Years Ended October 31,
2011 2010 2009
(in millions)
Profit before tax times statutory rate . . . . . . . . . . . . . . . . . . . . . . $ 361 $ 242 $ 2State income taxes, net of federal benefit . . . . . . . . . . . . . . . . . . . (1) 4 6Non-U.S. income taxed at different rates . . . . . . . . . . . . . . . . . . . . (153) (98) 47Change in unrecognized non-U.S. tax benefits . . . . . . . . . . . . . . . (97) 32 (71)Research credits . . . . . . . . . . . . . . . . . . . . . . . . . . . . . . . . . . . . . . . . (5) (1) (7)Hewlett Packard tax sharing agreement adjustment . . . . . . . . . . (3) (17) —Nondeductible goodwill . . . . . . . . . . . . . . . . . . . . . . . . . . . . . . . . . . — — 2Nondeductible employee stock purchase plan expense . . . . . . . . 1 1 2Other, net . . . . . . . . . . . . . . . . . . . . . . . . . . . . . . . . . . . . . . . . . . . . . . 1 7 11
Valuation allowances . . . . . . . . . . . . . . . . . . . . . . . . . . . . . . . . . . . . (84) (162) 46
Provision for income taxes . . . . . . . . . . . . . . . . . . . . . . . . . . . . . . . $ 20 $ 8 $ 38
Effective tax rate . . . . . . . . . . . . . . . . . . . . . . . . . . . . . . . . . . . . . . . 2% 1% 543%
Agilent enjoys tax holidays in several different jurisdictions, most significantly in Singapore, and Malaysia. The tax holidays provide lower rates of taxation on certain classes of income and require various thresholds of investments and employment or specific types of income in those jurisdictions. The tax holidays are due for renewal between 2015 and 2023. As a result of the incentives, the impact of the tax holidays decreased income taxes by $127 million, $62 million and $14 million in 2011, 2010 and 2009, respectively. The benefit of the tax holidays on net income (loss) per share (diluted) was approximately $0.36, $0.18 and $0.04 in 2011, 2010 and 2009, respectively.
For 2011, the effective tax rate was 2 percent. The 2 percent effective tax rate reflects tax on earnings in jurisdictions that have low effective tax rates and includes a $97 million net tax benefit primarily associated with a refund in Canada and the recognition of previously unrecognized tax benefits and the reversal of the related interest accruals due to the reassessment of certain uncertain tax positions. The income tax provision also includes a $26 million out of period adjustment to reduce the carrying value of certain U.K. deferred tax assets for which the majority was recorded in the quarter ended April 30, 2011. The overstatement of these deferred tax assets resulted in an overstatement of the U.K. valuation allowance release in the fourth quarter of 2010. For the full year, this out of period adjustment was substantially offset by other out of period adjustments. The net impact of all out of period adjustments on the effective tax rate was immaterial. Without considering interest and penalties, the effective rate reflects taxes in all jurisdictions except the U.S. and certain foreign jurisdictions in which income tax expense or benefit continues to be offset by adjustments to valuation allowances. We intend to maintain valuation allowances in these jurisdictions until sufficient positive evidence exists to support its reversal.
For 2010, the effective tax rate was 1 percent. The 1 percent effective tax rate includes a $101 million beneficial release of the U.K. valuation allowance, a $32 million current year increase in prior year tax reserves, and tax on earnings in jurisdictions that have low effective tax rates.

Annu
al R
epor
t Fin
anci
als
53
Also included is a $17 million tax benefit related to a $54 million non-taxable settlement payment received in connection with a tax sharing agreement between Agilent and Hewlett Packard Company. Without considering interest and penalties, the effective rate reflects taxes in all jurisdictions except the U.S. and certain foreign jurisdictions in which income tax expense or benefit continues to be offset by adjustments to valuation allowances. We intend to maintain a valuation allowance in these jurisdictions until sufficient positive evidence exists to support its reversal.
For 2009, the effective tax rate was 543 percent. The 543 percent effective tax rate reflects that our structure has a fixed component that results in unusual tax results on reduced levels of profitability. The tax rate also includes tax on earnings in jurisdictions that have low effective tax rates. In addition, net tax benefits totaling $71 million relating primarily to the lapses of statutes of limitations and tax settlements in foreign jurisdictions are incorporated in the rate. Without considering interest and penalties, the rate reflects taxes in all jurisdictions except the U.S. and foreign jurisdictions where we have recorded valuation allowances.
Agilent records U.S. income taxes on the undistributed earnings of foreign subsidiaries unless the subsidiaries’ earnings are considered indefinitely reinvested outside the U.S. As of October 31, 2011, the cumulative amount of undistributed earnings considered indefinitely reinvested is $4,213 million. Because of the availability of U.S. foreign tax credits, the determination of the unrecognized deferred tax liability on these earnings is not practicable.
We are subject to ongoing tax examinations of our tax returns by the Internal Revenue Service and other tax authorities in various jurisdictions. In accordance with the guidance on the accounting for uncertainty in income taxes, we regularly assess the likelihood of adverse outcomes resulting from these examinations to determine the adequacy of our provision for income taxes. These assessments can require considerable estimates and judgments. If our estimate of income tax liabilities proves to be less than the ultimate assessment, then a further charge to expense would be required. If events occur and the payment of these amounts ultimately proves to be unnecessary, the reversal of the liabilities would result in tax benefits being recognized in the period when we determine the liabilities are no longer necessary.
We include interest and penalties related to unrecognized tax benefits within the provision for income taxes on the consolidated statements of operations. As of October 31, 2011, we accrued and reported $38.0 million of interest and penalties relating to unrecognized tax benefits. We recognized $13.6 million of tax benefits in 2011. As of October 31, 2010, we accrued and reported $53.8 million of interest and penalties relating to unrecognized tax benefits of which $5.4 million was recognized in 2010.
A 2011 and 2010 rollforward of our uncertain tax benefits including all federal, state and foreign tax jurisdictions is as follows:
2011 2010
(in millions)
Balance, beginning of year . . . . . . . . . . . . . . . . . . . . . . . . . . . . . . . . . . . . . . . . . . . . . . . . $656 $930Additions for acquisitions . . . . . . . . . . . . . . . . . . . . . . . . . . . . . . . . . . . . . . . . . . . . . . . — 15Additions for tax positions related to the current year . . . . . . . . . . . . . . . . . . . . . . . 41 46Additions for tax positions from prior years . . . . . . . . . . . . . . . . . . . . . . . . . . . . . . . . 18 75Reductions for tax positions from prior years . . . . . . . . . . . . . . . . . . . . . . . . . . . . . . (170) (284)Settlements with taxing authorities . . . . . . . . . . . . . . . . . . . . . . . . . . . . . . . . . . . . . . . (67) (119)Statute of limitations expirations . . . . . . . . . . . . . . . . . . . . . . . . . . . . . . . . . . . . . . . . . (9) (7)
Balance, end of year . . . . . . . . . . . . . . . . . . . . . . . . . . . . . . . . . . . . . . . . . . . . . . . . . . . . . . $469 $656

54
In the U.S., tax years remain open back to the year 2006 for federal income tax purposes. Tax years remain open back to the year 2000 for significant states. In other major jurisdictions where we conduct business, the tax years generally remain open back to the year 2003. With these jurisdictions and the U.S., it is possible that there could be significant changes to our unrecognized tax benefits in the next twelve months due to either the expiration of a statute of limitation or a tax audit settlement. Because of the uncertainty as to the timing of a potential settlement or the completion of tax audits, an estimate cannot be made of the range of tax increases or decreases that could occur in the next twelve months.
On August 31, 2010 we reached an agreement with the Internal Revenue Service (“IRS”) for tax years 2000 through 2002. The adjustments were offset by applying available net operating losses and had no material impact on our statement of operations. In December 2010, we reached an agreement with the IRS for tax years 2003-2005. In addition, Agilent and the IRS reached an agreement on transfer pricing issues covering years 2003-2007. Tax adjustments resulting from these agreements will be offset with net operating losses and tax credit carryforwards. Agilent’s U.S. federal income tax returns for 2006 through 2007 are currently under audit by the IRS. Primarily as a result of these agreements with the IRS and agreements with other tax jurisdictions, unrecognized tax benefits were reduced from $656 million at October 31, 2010 to $469 million at October 31, 2011.
6. Net Income (Loss) Per Share
The following is a reconciliation of the numerators and denominators of the basic and diluted net income (loss) per share computations for the periods presented below. As a result of the company’s net loss in 2009, the computation of diluted net loss per share for 2009 excludes the diluted impact of all common stock equivalents outstanding.
Years Ended October 31,
2011 2010 2009
(in millions)
Numerator:Net income (loss) . . . . . . . . . . . . . . . . . . . . . . . . . . . . . . . . . . . . . . . . . $1,012 $684 $(31)
Denominators:Basic weighted average shares . . . . . . . . . . . . . . . . . . . . . . . . . . . . . 347 347 346Potentially dilutive common stock equivalents — stock options
and other employee stock plans . . . . . . . . . . . . . . . . . . . . . . . . . . 8 6 —
Diluted weighted average shares . . . . . . . . . . . . . . . . . . . . . . . . . . . 355 353 346
The dilutive effect of share-based awards is reflected in diluted net income (loss) per share by application of the treasury stock method, which includes consideration of unamortized share-based compensation expense and the dilutive effect of in-the-money options and non-vested restricted stock units. Under the treasury stock method, the amount the employee must pay for exercising stock options and unamortized share-based compensation expense are assumed proceeds to be used to repurchase hypothetical shares. An increase in the fair market value of the company’s common stock can result in a greater dilutive effect from potentially dilutive awards. The total number of share-based awards issued in 2011, 2010 and 2009 were 12 million, 13 million and 5 million, respectively.

Annu
al R
epor
t Fin
anci
als
55
The following table presents options to purchase shares of common stock, which were not included in the computation of diluted net income (loss) per share because they were anti-dilutive.
Years Ended October 31,
2011 2010 2009
Options to purchase shares of common stock (in millions) . . . . . . . . . . . . . . . . . . . . . . . . . . . 1 11 29
7. Supplemental Cash Flow Information
Net cash paid for income taxes was $22 million in 2011, $48 million in 2010, and $113 million in 2009. Cash paid for interest was $95 million in 2011, $89 million in 2010 and $88 million in 2009.
8. Inventory
October 31,
2011 2010
(in millions)
Finished goods . . . . . . . . . . . . . . . . . . . . . . . . . . . . . . . . . . . . . $452 $338Purchased parts and fabricated assemblies. . . . . . . . . . . . . 446 378
Inventory. . . . . . . . . . . . . . . . . . . . . . . . . . . . . . . . . . . . . . . . . . $898 $ 716
Inventory-related excess and obsolescence charges of $30 million, $30 million and $54 million were recorded in total cost of products in 2011, 2010 and 2009, respectively. We record excess and obsolete inventory charges for both inventory on our site as well as inventory at our contract manufacturers and suppliers where we have non-cancelable purchase commitments.
9. Property, Plant and Equipment, Net
October 31,
2011 2010
(in millions)
Land. . . . . . . . . . . . . . . . . . . . . . . . . . . . . . . . . . . . . . . . . . . . . . . . $ 138 $ 137Buildings and leasehold improvements. . . . . . . . . . . . . . . . . . . 1,271 1,268Machinery and equipment . . . . . . . . . . . . . . . . . . . . . . . . . . . . . 833 793Software . . . . . . . . . . . . . . . . . . . . . . . . . . . . . . . . . . . . . . . . . . . . 370 377
Total property, plant and equipment. . . . . . . . . . . . . . . . . . . . . . . 2,612 2,575Accumulated depreciation and amortization. . . . . . . . . . . . . . . . (1,606) (1,595)
Property, plant and equipment, net. . . . . . . . . . . . . . . . . . . . . . . . $ 1,006 $ 980
Asset impairments other than restructuring were $7 million in 2011 and 2010 and zero in 2009. Depreciation expenses were $142 million in 2011, $124 million in 2010 and $112 million in 2009.

56
10. Goodwill and Other Intangible Assets
The goodwill balances at October 31, 2011, 2010 and 2009 and the movements in 2011 and 2010 for each of our reportable segments are shown in the table below:
Life Sciences
Chemical Analysis
Electronic Measurement Total
(in millions)
Goodwill as of October 31, 2009 . . . . . . . . $123 $151 $381 $ 655Foreign currency translation impact . . . . . 5 17 23 45Divestitures . . . . . . . . . . . . . . . . . . . . . . . . . . (1) (24) (13) (38)Goodwill arising from acquisitions . . . . . . . 184 603 7 794Goodwill as of October 31, 2010 . . . . . . . . $311 $ 747 $398 $ 1,456Foreign currency translation impact
and other adjustments . . . . . . . . . . . . . . . 3 7 37 47Goodwill arising from acquisitions . . . . . . . 53 11 — 64
Goodwill as of October 31, 2011 . . . . . . . . $367 $765 $435 $ 1,567
The component parts of other intangible assets at October 31, 2011 and 2010 are shown in the table below:
Other Intangible Assets
Gross Carrying Amount
Accumulated Amortization
and Impairments
Net Book value
(in millions)
As of October 31, 2010:Purchased technology . . . . . . . . . . . . . . . . . . . . . . . . $466 $176 $290Backlog . . . . . . . . . . . . . . . . . . . . . . . . . . . . . . . . . . . . 12 12 —Trademark/Tradename . . . . . . . . . . . . . . . . . . . . . . 39 13 26Customer relationships . . . . . . . . . . . . . . . . . . . . . . 236 77 159
Total amortizable intangible assets . . . . . . . . . . $753 $278 $475In-Process R&D . . . . . . . . . . . . . . . . . . . . . . . . . . . . . 19 — 19
Total . . . . . . . . . . . . . . . . . . . . . . . . . . . . . . . . . . . . $772 $278 $494
As of October 31, 2011:Purchased technology . . . . . . . . . . . . . . . . . . . . . . . . $510 $246 $264Backlog . . . . . . . . . . . . . . . . . . . . . . . . . . . . . . . . . . . . 12 12 —Trademark/Tradename . . . . . . . . . . . . . . . . . . . . . . 40 20 20Customer relationships . . . . . . . . . . . . . . . . . . . . . . 249 114 135
Total amortizable intangible assets . . . . . . . . . . $811 $392 $419In-Process R&D . . . . . . . . . . . . . . . . . . . . . . . . . . . . . 10 — 10
Total . . . . . . . . . . . . . . . . . . . . . . . . . . . . . . . . . . . . $821 $392 $429
In 2011, we recorded additions to goodwill of $64 million relating to the purchase of three businesses. We also recorded a $27 million addition to goodwill during the year in the electronic measurement segment relating to deferred taxes from a prior acquisition. In 2011, we recorded additions to other intangibles of $42 million related to the purchase of three businesses. We also
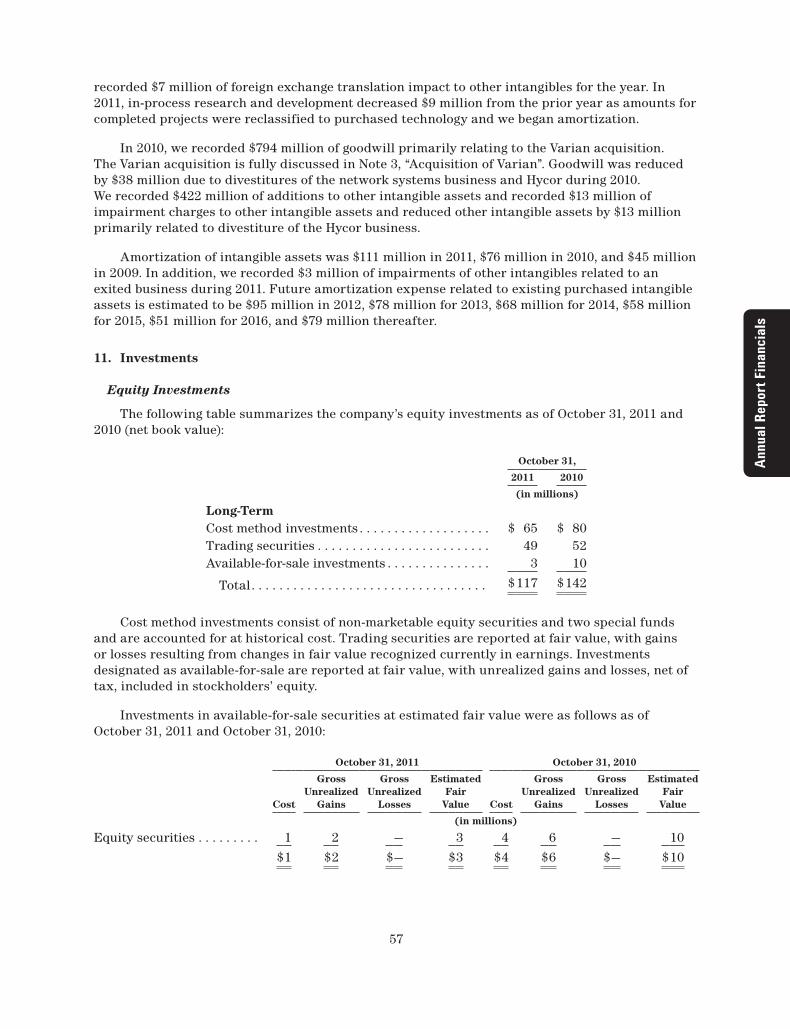
Annu
al R
epor
t Fin
anci
als
57
recorded $7 million of foreign exchange translation impact to other intangibles for the year. In 2011, in-process research and development decreased $9 million from the prior year as amounts for completed projects were reclassified to purchased technology and we began amortization.
In 2010, we recorded $794 million of goodwill primarily relating to the Varian acquisition. The Varian acquisition is fully discussed in Note 3, “Acquisition of Varian”. Goodwill was reduced by $38 million due to divestitures of the network systems business and Hycor during 2010. We recorded $422 million of additions to other intangible assets and recorded $13 million of impairment charges to other intangible assets and reduced other intangible assets by $13 million primarily related to divestiture of the Hycor business.
Amortization of intangible assets was $111 million in 2011, $76 million in 2010, and $45 million in 2009. In addition, we recorded $3 million of impairments of other intangibles related to an exited business during 2011. Future amortization expense related to existing purchased intangible assets is estimated to be $95 million in 2012, $78 million for 2013, $68 million for 2014, $58 million for 2015, $51 million for 2016, and $79 million thereafter.
11. Investments
Equity Investments
The following table summarizes the company’s equity investments as of October 31, 2011 and 2010 (net book value):
October 31,
2011 2010
(in millions)
Long-TermCost method investments . . . . . . . . . . . . . . . . . . . $ 65 $ 80Trading securities . . . . . . . . . . . . . . . . . . . . . . . . . 49 52Available-for-sale investments . . . . . . . . . . . . . . . 3 10
Total. . . . . . . . . . . . . . . . . . . . . . . . . . . . . . . . . . $117 $142
Cost method investments consist of non-marketable equity securities and two special funds and are accounted for at historical cost. Trading securities are reported at fair value, with gains or losses resulting from changes in fair value recognized currently in earnings. Investments designated as available-for-sale are reported at fair value, with unrealized gains and losses, net of tax, included in stockholders’ equity.
Investments in available-for-sale securities at estimated fair value were as follows as of October 31, 2011 and October 31, 2010:
October 31, 2011 October 31, 2010
Cost
Gross Unrealized
Gains
Gross Unrealized
Losses
Estimated Fair
value Cost
Gross Unrealized
Gains
Gross Unrealized
Losses
Estimated Fair
value
(in millions)
Equity securities . . . . . . . . . 1 2 — 3 4 6 — 10
$1 $2 $— $3 $4 $6 $— $10
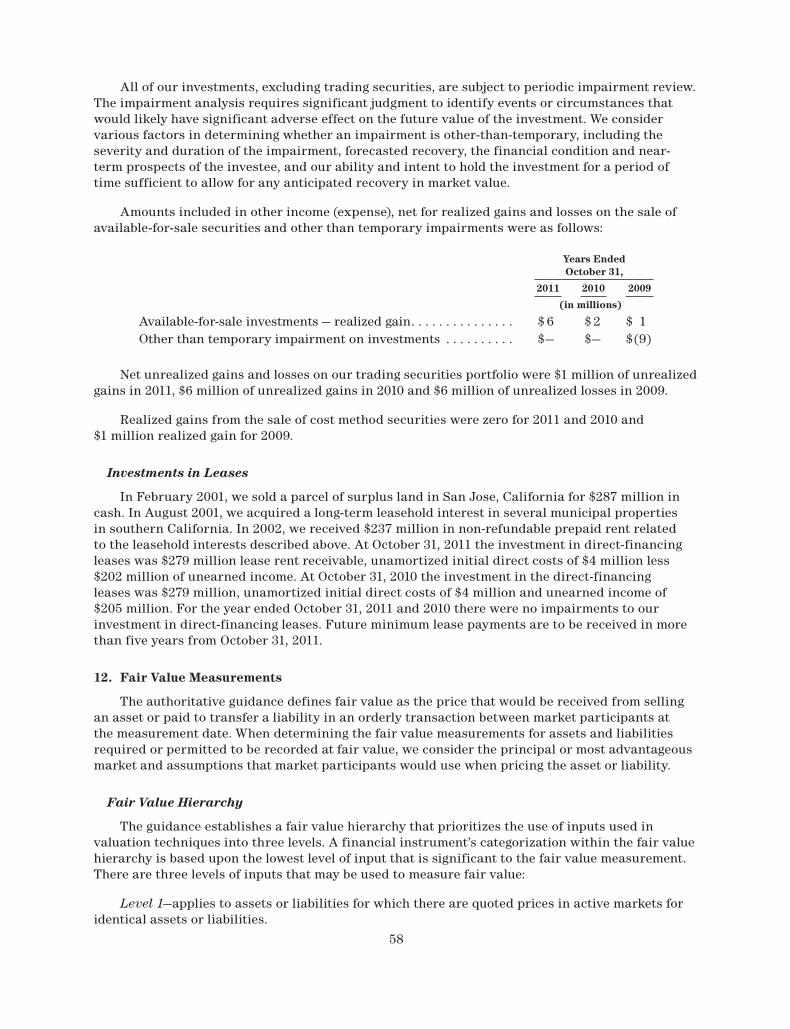
58
All of our investments, excluding trading securities, are subject to periodic impairment review. The impairment analysis requires significant judgment to identify events or circumstances that would likely have significant adverse effect on the future value of the investment. We consider various factors in determining whether an impairment is other-than-temporary, including the severity and duration of the impairment, forecasted recovery, the financial condition and near-term prospects of the investee, and our ability and intent to hold the investment for a period of time sufficient to allow for any anticipated recovery in market value.
Amounts included in other income (expense), net for realized gains and losses on the sale of available-for-sale securities and other than temporary impairments were as follows:
Years Ended October 31,
2011 2010 2009
(in millions)
Available-for-sale investments — realized gain . . . . . . . . . . . . . . . $ 6 $2 $ 1Other than temporary impairment on investments . . . . . . . . . . $— $— $(9)
Net unrealized gains and losses on our trading securities portfolio were $1 million of unrealized gains in 2011, $6 million of unrealized gains in 2010 and $6 million of unrealized losses in 2009.
Realized gains from the sale of cost method securities were zero for 2011 and 2010 and $1 million realized gain for 2009.
Investments in Leases
In February 2001, we sold a parcel of surplus land in San Jose, California for $287 million in cash. In August 2001, we acquired a long-term leasehold interest in several municipal properties in southern California. In 2002, we received $237 million in non-refundable prepaid rent related to the leasehold interests described above. At October 31, 2011 the investment in direct-financing leases was $279 million lease rent receivable, unamortized initial direct costs of $4 million less $202 million of unearned income. At October 31, 2010 the investment in the direct-financing leases was $279 million, unamortized initial direct costs of $4 million and unearned income of $205 million. For the year ended October 31, 2011 and 2010 there were no impairments to our investment in direct-financing leases. Future minimum lease payments are to be received in more than five years from October 31, 2011.
12. Fair value Measurements
The authoritative guidance defines fair value as the price that would be received from selling an asset or paid to transfer a liability in an orderly transaction between market participants at the measurement date. When determining the fair value measurements for assets and liabilities required or permitted to be recorded at fair value, we consider the principal or most advantageous market and assumptions that market participants would use when pricing the asset or liability.
Fair Value Hierarchy
The guidance establishes a fair value hierarchy that prioritizes the use of inputs used in valuation techniques into three levels. A financial instrument’s categorization within the fair value hierarchy is based upon the lowest level of input that is significant to the fair value measurement. There are three levels of inputs that may be used to measure fair value:
Level 1—applies to assets or liabilities for which there are quoted prices in active markets for identical assets or liabilities.
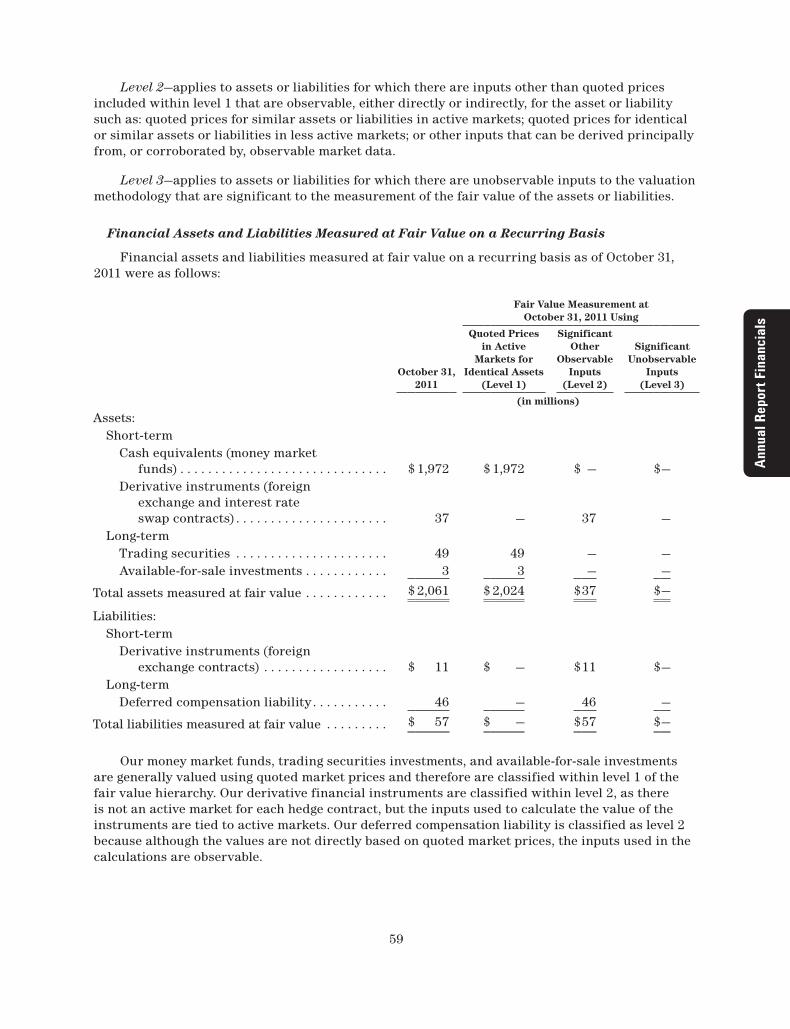
Annu
al R
epor
t Fin
anci
als
59
Level 2—applies to assets or liabilities for which there are inputs other than quoted prices included within level 1 that are observable, either directly or indirectly, for the asset or liability such as: quoted prices for similar assets or liabilities in active markets; quoted prices for identical or similar assets or liabilities in less active markets; or other inputs that can be derived principally from, or corroborated by, observable market data.
Level 3—applies to assets or liabilities for which there are unobservable inputs to the valuation methodology that are significant to the measurement of the fair value of the assets or liabilities.
Financial Assets and Liabilities Measured at Fair Value on a Recurring Basis
Financial assets and liabilities measured at fair value on a recurring basis as of October 31, 2011 were as follows:
Fair value Measurement at October 31, 2011 Using
October 31, 2011
Quoted Prices in Active
Markets for Identical Assets
(Level 1)
Significant Other
Observable Inputs
(Level 2)
Significant Unobservable
Inputs (Level 3)
(in millions)
Assets:Short-term
Cash equivalents (money market funds) . . . . . . . . . . . . . . . . . . . . . . . . . . . . . . $ 1,972 $ 1,972 $ — $—
Derivative instruments (foreign exchange and interest rate swap contracts) . . . . . . . . . . . . . . . . . . . . . . 37 — 37 —
Long-termTrading securities . . . . . . . . . . . . . . . . . . . . . . 49 49 — —Available-for-sale investments . . . . . . . . . . . . 3 3 — —
Total assets measured at fair value . . . . . . . . . . . . $ 2,061 $ 2,024 $37 $—
Liabilities:Short-term
Derivative instruments (foreign exchange contracts) . . . . . . . . . . . . . . . . . . $ 11 $ — $11 $—
Long-termDeferred compensation liability . . . . . . . . . . . 46 — 46 —
Total liabilities measured at fair value . . . . . . . . . $ 57 $ — $57 $—
Our money market funds, trading securities investments, and available-for-sale investments are generally valued using quoted market prices and therefore are classified within level 1 of the fair value hierarchy. Our derivative financial instruments are classified within level 2, as there is not an active market for each hedge contract, but the inputs used to calculate the value of the instruments are tied to active markets. Our deferred compensation liability is classified as level 2 because although the values are not directly based on quoted market prices, the inputs used in the calculations are observable.
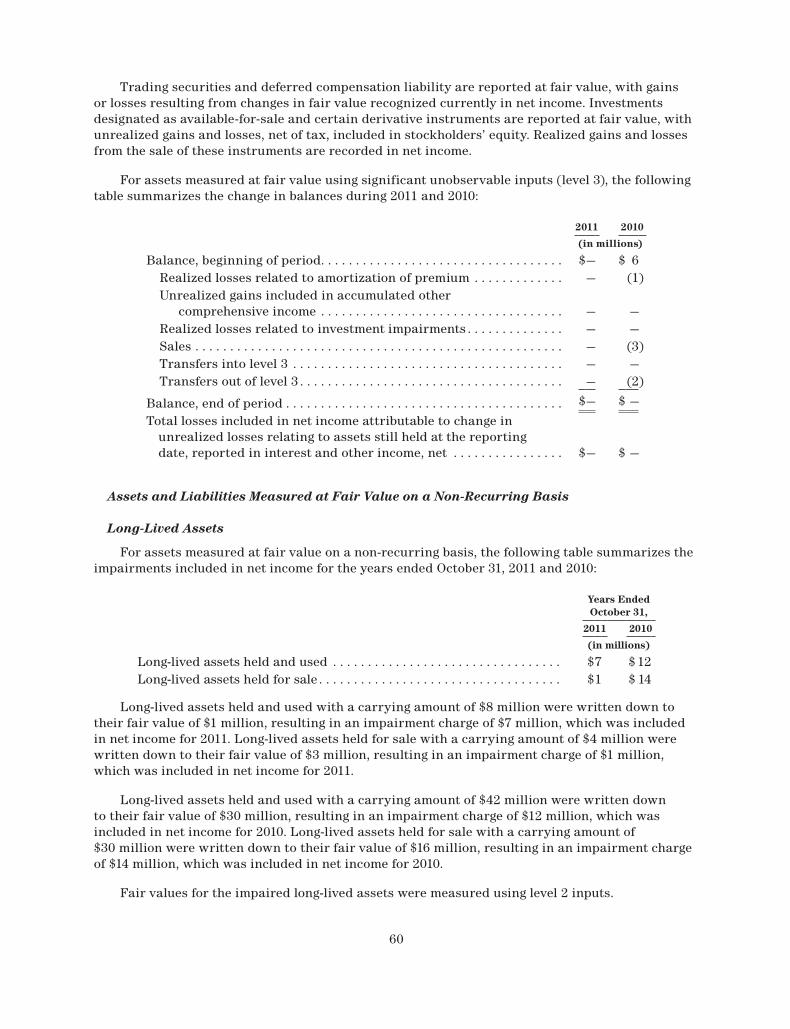
60
Trading securities and deferred compensation liability are reported at fair value, with gains or losses resulting from changes in fair value recognized currently in net income. Investments designated as available-for-sale and certain derivative instruments are reported at fair value, with unrealized gains and losses, net of tax, included in stockholders’ equity. Realized gains and losses from the sale of these instruments are recorded in net income.
For assets measured at fair value using significant unobservable inputs (level 3), the following table summarizes the change in balances during 2011 and 2010:
2011 2010
(in millions)
Balance, beginning of period . . . . . . . . . . . . . . . . . . . . . . . . . . . . . . . . . . . $— $ 6Realized losses related to amortization of premium . . . . . . . . . . . . . — (1)Unrealized gains included in accumulated other
comprehensive income . . . . . . . . . . . . . . . . . . . . . . . . . . . . . . . . . . . — —Realized losses related to investment impairments . . . . . . . . . . . . . . — —Sales . . . . . . . . . . . . . . . . . . . . . . . . . . . . . . . . . . . . . . . . . . . . . . . . . . . . . — (3)Transfers into level 3 . . . . . . . . . . . . . . . . . . . . . . . . . . . . . . . . . . . . . . . — —Transfers out of level 3 . . . . . . . . . . . . . . . . . . . . . . . . . . . . . . . . . . . . . . — (2)
Balance, end of period . . . . . . . . . . . . . . . . . . . . . . . . . . . . . . . . . . . . . . . . $— $ —
Total losses included in net income attributable to change in unrealized losses relating to assets still held at the reporting date, reported in interest and other income, net . . . . . . . . . . . . . . . . $— $ —
Assets and Liabilities Measured at Fair Value on a Non-Recurring Basis
Long-Lived Assets
For assets measured at fair value on a non-recurring basis, the following table summarizes the impairments included in net income for the years ended October 31, 2011 and 2010:
Years Ended October 31,
2011 2010
(in millions)
Long-lived assets held and used . . . . . . . . . . . . . . . . . . . . . . . . . . . . . . . . . $7 $12Long-lived assets held for sale . . . . . . . . . . . . . . . . . . . . . . . . . . . . . . . . . . . $1 $ 14
Long-lived assets held and used with a carrying amount of $8 million were written down to their fair value of $1 million, resulting in an impairment charge of $7 million, which was included in net income for 2011. Long-lived assets held for sale with a carrying amount of $4 million were written down to their fair value of $3 million, resulting in an impairment charge of $1 million, which was included in net income for 2011.
Long-lived assets held and used with a carrying amount of $42 million were written down to their fair value of $30 million, resulting in an impairment charge of $12 million, which was included in net income for 2010. Long-lived assets held for sale with a carrying amount of $30 million were written down to their fair value of $16 million, resulting in an impairment charge of $14 million, which was included in net income for 2010.
Fair values for the impaired long-lived assets were measured using level 2 inputs.

Annu
al R
epor
t Fin
anci
als
61
13. Derivatives
We are exposed to foreign currency exchange rate fluctuations and interest rate changes in the normal course of our business. As part of risk management strategy, we use derivative instruments, primarily forward contracts, purchased options, and interest rate swaps, to hedge economic and/or accounting exposures resulting from changes in foreign currency exchange rates and interest rates.
Fair Value Hedges
We are exposed to interest rate risk due to the mismatch between the interest expense we pay on our loans at fixed rates and the variable rates of interest we receive from cash, cash equivalents and other short-term investments. We have issued long-term debt in U.S. dollars at fixed interest rates based on the market conditions at the time of financing. We believe that the fair value of our fixed rate debt changes when the underlying market rates of interest change, and we may use interest rate swaps to modify such market risk. The interest rate swaps effectively change our fixed interest rate payments to U.S. dollar LIBOR-based variable interest expense to match the floating interest income from our cash, cash equivalents and other short term investments. By entering into these interest rate swaps we are also hedging the movements in the fair value of the fixed-rate debt on our balance sheet. However, not all of our fixed rate debt’s fair value is hedged in this manner, and we may choose to terminate previously executed swaps. For derivative instruments that are designated and qualify as fair value hedges, we recognize the gain or loss on the derivative instrument, as well as the offsetting loss or gain on the hedged item attributable to the hedged risk, in interest expense, in the consolidated statement of operations. These fair value hedges are 100 percent effective, and there is no impact on earnings due to hedge ineffectiveness. The fair value of the swaps is recorded on the consolidated balance sheet at each period end, with an offsetting entry in senior notes. As of October 31, 2011, there were 4 interest rate swap contracts designated as fair value hedges associated with our 2012 senior notes. The notional amount of these interest rate swap contracts, receive-fixed/pay-variable, was $250 million. On November 25, 2008, we terminated two interest rate swap contracts associated with our 2017 senior notes that represented the notional amount of $400 million. The asset value, including interest receivable, upon termination was approximately $43 million and the amount to be amortized at October 31, 2011 was $31 million. On June 6, 2011, we also terminated five interest rate swap contracts associated with our 2015 senior notes that represented the notional amount of $500 million. The asset value, including interest accrual, upon termination was approximately $31 million and the amount to be amortized at October 31, 2011 was $24 million. On Aug 9, 2011, we terminated five interest rate swap contracts related to our 2020 senior notes that represented the notional amount of $500 million. The asset value, including interest receivable, upon termination for these contracts was approximately $34 million and the amount to be amortized at October 31, 2011 was $32 million. The proceeds from all such terminated interest rate swaps are recorded as operating cash flows and the gain is being deferred and amortized over the remaining life of the respective senior notes.
Cash Flow Hedges
We enter into foreign exchange contracts to hedge our forecasted operational cash flow exposures resulting from changes in foreign currency exchange rates. These foreign exchange contracts, carried at fair value, have maturities between one and twelve months. These derivative instruments are designated and qualify as cash flow hedges under the criteria prescribed in the authoritative guidance. The changes in the value of the effective portion of the derivative instrument are recognized in accumulated other comprehensive income. Amounts associated with cash flow hedges are reclassified to cost of sales in the consolidated statement of operations when either the forecasted transaction occurs or it becomes probable that the forecasted transaction will not occur. Changes in the fair value of the ineffective portion of derivative instruments are recognized in cost of sales in the consolidated statement of operations in the current period.
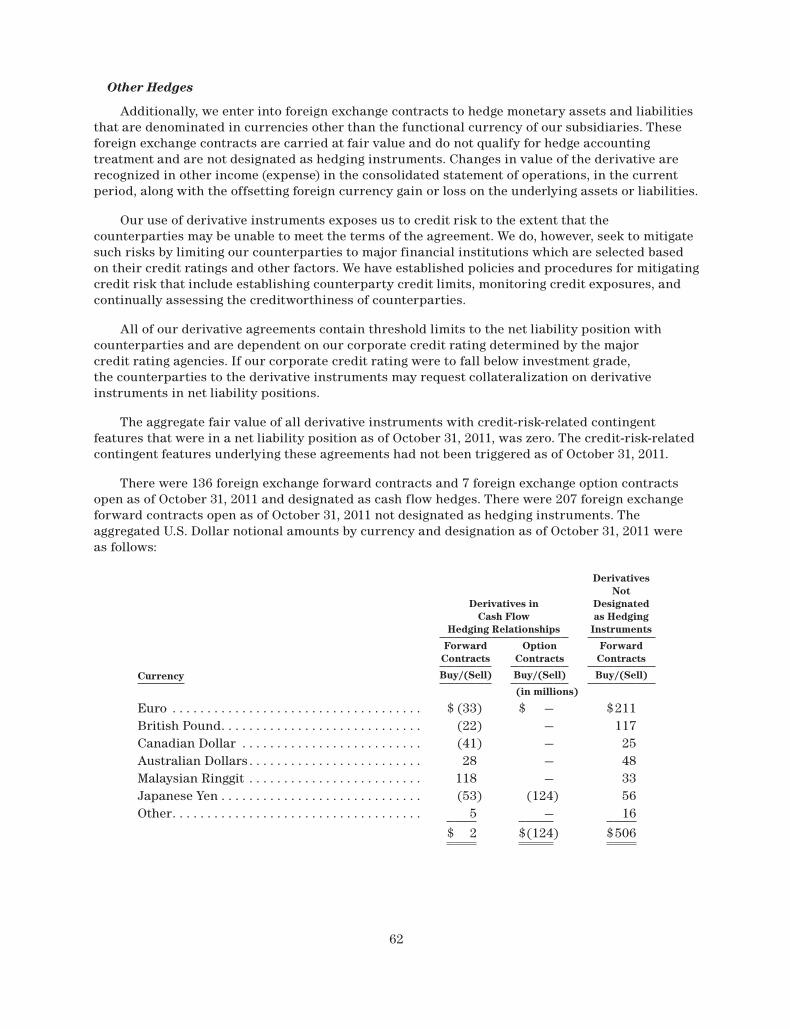
62
Other Hedges
Additionally, we enter into foreign exchange contracts to hedge monetary assets and liabilities that are denominated in currencies other than the functional currency of our subsidiaries. These foreign exchange contracts are carried at fair value and do not qualify for hedge accounting treatment and are not designated as hedging instruments. Changes in value of the derivative are recognized in other income (expense) in the consolidated statement of operations, in the current period, along with the offsetting foreign currency gain or loss on the underlying assets or liabilities.
Our use of derivative instruments exposes us to credit risk to the extent that the counterparties may be unable to meet the terms of the agreement. We do, however, seek to mitigate such risks by limiting our counterparties to major financial institutions which are selected based on their credit ratings and other factors. We have established policies and procedures for mitigating credit risk that include establishing counterparty credit limits, monitoring credit exposures, and continually assessing the creditworthiness of counterparties.
All of our derivative agreements contain threshold limits to the net liability position with counterparties and are dependent on our corporate credit rating determined by the major credit rating agencies. If our corporate credit rating were to fall below investment grade, the counterparties to the derivative instruments may request collateralization on derivative instruments in net liability positions.
The aggregate fair value of all derivative instruments with credit-risk-related contingent features that were in a net liability position as of October 31, 2011, was zero. The credit-risk-related contingent features underlying these agreements had not been triggered as of October 31, 2011.
There were 136 foreign exchange forward contracts and 7 foreign exchange option contracts open as of October 31, 2011 and designated as cash flow hedges. There were 207 foreign exchange forward contracts open as of October 31, 2011 not designated as hedging instruments. The aggregated U.S. Dollar notional amounts by currency and designation as of October 31, 2011 were as follows:
Derivatives in Cash Flow
Hedging Relationships
Derivatives Not
Designated as Hedging
Instruments
Forward Contracts
Option Contracts
Forward Contracts
Currency Buy/(Sell) Buy/(Sell) Buy/(Sell)
(in millions)
Euro . . . . . . . . . . . . . . . . . . . . . . . . . . . . . . . . . . . . $ (33) $ — $211British Pound . . . . . . . . . . . . . . . . . . . . . . . . . . . . . (22) — 117Canadian Dollar . . . . . . . . . . . . . . . . . . . . . . . . . . (41) — 25Australian Dollars . . . . . . . . . . . . . . . . . . . . . . . . . 28 — 48Malaysian Ringgit . . . . . . . . . . . . . . . . . . . . . . . . . 118 — 33Japanese Yen . . . . . . . . . . . . . . . . . . . . . . . . . . . . . (53) (124) 56Other . . . . . . . . . . . . . . . . . . . . . . . . . . . . . . . . . . . . 5 — 16
$ 2 $(124) $506

Annu
al R
epor
t Fin
anci
als
63
The gross fair values and balance sheet location of derivative instruments held in the consolidated balance sheet as of October 31, 2011 and October 31, 2010 were as follows:
Fair values of Derivative Instruments
Asset Derivatives Liability Derivatives
Fair value Fair value
Balance Sheet LocationOctober 31,
2011October 31,
2010 Balance Sheet LocationOctober 31,
2011October 31,
2010
(in millions)
Derivatives designated as hedging instruments:
Fair value hedges
Interest rate contracts
Other current assets. . . . . . . . . . . . $ 3 $ — Other accrued liabilities $ — $ —
Other assets . . . . . . . . . . . . . . . . . . . $ — $ 61 Other long-term liabilities $ — $ —
Cash flow hedges
Foreign exchange contracts
Other current assets. . . . . . . . . . . . $ 7 $ 13 Other accrued liabilities $ 3 $15
$ 10 $ 74 $ 3 $15
Derivatives not designated as hedging instruments:
Foreign exchange contracts
Other current assets. . . . . . . . . . . . $ 27 $ 11 Other accrued liabilities $ 8 $ 7
Total derivatives . . . . . . . . . . . . . . . . . $ 37 $ 85 $11 $22
The effect of derivative instruments for interest rate swap contracts and for foreign exchange contracts designated as hedging instruments and not designated as hedging instruments in our consolidated statement of operations were as follows:
2011 2010 2009
(in millions)
Derivatives designated as hedging instruments:Fair Value HedgesGain on interest rate swap contracts, including interest accrual,
recognized in interest expense. . . . . . . . . . . . . . . . . . . . . . . . . . . . . . . $27 $ 78 $ 35Loss on hedged item, recognized in interest expense. . . . . . . . . . . . . . $ (3) $(57) $(33)Cash Flow HedgesGain recognized in accumulated other comprehensive income. . . . . . $ — $ 4 $ 1Gain (loss) reclassified from accumulated
other comprehensive income into cost of sales . . . . . . . . . . . . . . . . . $ (5) $ 7 $(23)Derivatives not designated as hedging instruments:Gain (loss) recognized in other income (expense), net . . . . . . . . . . . . . $13 $(14) $ 82
The estimated net amount of existing loss at October 31, 2011 that is expected to be reclassified from other comprehensive income to the cost of sales within the next twelve months is $3 million.
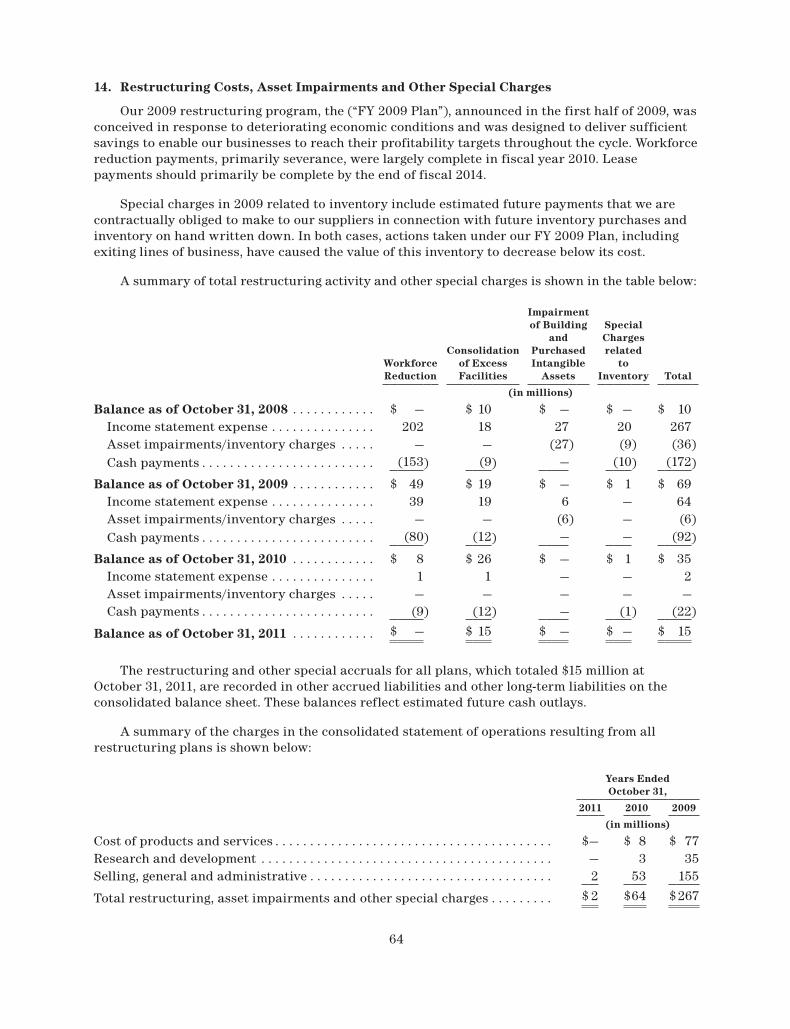
64
14. Restructuring Costs, Asset Impairments and Other Special Charges
Our 2009 restructuring program, the (“FY 2009 Plan”), announced in the first half of 2009, was conceived in response to deteriorating economic conditions and was designed to deliver sufficient savings to enable our businesses to reach their profitability targets throughout the cycle. Workforce reduction payments, primarily severance, were largely complete in fiscal year 2010. Lease payments should primarily be complete by the end of fiscal 2014.
Special charges in 2009 related to inventory include estimated future payments that we are contractually obliged to make to our suppliers in connection with future inventory purchases and inventory on hand written down. In both cases, actions taken under our FY 2009 Plan, including exiting lines of business, have caused the value of this inventory to decrease below its cost.
A summary of total restructuring activity and other special charges is shown in the table below:
Workforce Reduction
Consolidation of Excess Facilities
Impairment of Building
and Purchased Intangible
Assets
Special Charges related
to Inventory Total
(in millions)
Balance as of October 31, 2008 . . . . . . . . . . . . $ — $ 10 $ — $ — $ 10Income statement expense . . . . . . . . . . . . . . . 202 18 27 20 267Asset impairments/inventory charges . . . . . — — (27) (9) (36)Cash payments . . . . . . . . . . . . . . . . . . . . . . . . . (153) (9) — (10) (172)
Balance as of October 31, 2009 . . . . . . . . . . . . $ 49 $ 19 $ — $ 1 $ 69Income statement expense . . . . . . . . . . . . . . . 39 19 6 — 64Asset impairments/inventory charges . . . . . — — (6) — (6)Cash payments . . . . . . . . . . . . . . . . . . . . . . . . . (80) (12) — — (92)
Balance as of October 31, 2010 . . . . . . . . . . . . $ 8 $ 26 $ — $ 1 $ 35Income statement expense . . . . . . . . . . . . . . . 1 1 — — 2Asset impairments/inventory charges . . . . . — — — — —Cash payments . . . . . . . . . . . . . . . . . . . . . . . . . (9) (12) — (1) (22)
Balance as of October 31, 2011 . . . . . . . . . . . . $ — $ 15 $ — $ — $ 15
The restructuring and other special accruals for all plans, which totaled $15 million at October 31, 2011, are recorded in other accrued liabilities and other long-term liabilities on the consolidated balance sheet. These balances reflect estimated future cash outlays.
A summary of the charges in the consolidated statement of operations resulting from all restructuring plans is shown below:
Years Ended October 31,
2011 2010 2009
(in millions)
Cost of products and services . . . . . . . . . . . . . . . . . . . . . . . . . . . . . . . . . . . . . . . . $— $ 8 $ 77Research and development . . . . . . . . . . . . . . . . . . . . . . . . . . . . . . . . . . . . . . . . . . — 3 35Selling, general and administrative . . . . . . . . . . . . . . . . . . . . . . . . . . . . . . . . . . . 2 53 155
Total restructuring, asset impairments and other special charges . . . . . . . . . $ 2 $64 $267

Annu
al R
epor
t Fin
anci
als
65
15. Retirement Plans and Post Retirement Pension Plans
General. Substantially all of our employees are covered under various defined benefit and/or defined contribution retirement plans. Additionally, we sponsor post-retirement health care benefits for our eligible U.S. employees.
Agilent provides U.S. employees, who meet eligibility criteria under the Agilent Technologies, Inc. Retirement Plan (“RP”), defined benefits which are based on an employee’s base or target pay during the years of employment and on length of service. For eligible service through October 31, 1993, the benefit payable under the Agilent Retirement Plan is reduced by any amounts due to the eligible employee under our defined contribution Deferred Profit-Sharing Plan (“DPSP”), which was closed to new participants as of November 1993.
In addition, in the U.S., Agilent maintains the Supplemental Benefits Retirement Plan (“SBRP”), a supplemental unfunded non-qualified defined benefit plan to provide benefits that would be provided under the RP but for limitations imposed by the Internal Revenue Code. The RP and the SBRP comprise the “U.S. Plans”.
As of October 31, 2011 and 2010, the fair value of plan assets of the DPSP for U.S. Agilent Employees was $515 million and $516 million, respectively. Note that the projected benefit obligation for the DPSP equals the fair value of plan assets.
Eligible employees outside the U.S. generally receive retirement benefits under various retirement plans based upon factors such as years of service and/or employee compensation levels. Eligibility is generally determined in accordance with local statutory requirements.
401(k) defined contribution plan. Eligible U.S. employees may participate in the Agilent Technologies, Inc. 401(k) Plan (the “401(k) Plan”). Enrollment in the 401(k) Plan is automatic for employees who meet eligibility requirements unless they decline participation. Under the 401(k) Plan, we provide matching contributions to employees up to a maximum of 4 percent of an employee’s annual eligible compensation. The maximum contribution to the 401(k) Plan is 50 percent of an employee’s annual eligible compensation, subject to regulatory limitations. The 401(k) Plan employer expense included in income from operations was $24 million in 2011, $21 million in 2010 and $23 million in 2009.
Post‑retirement medical benefit plans. In addition to receiving retirement benefits, U.S. employees who meet eligibility requirements as of their termination date may participate in the Agilent Technologies, Inc. Health Plan for Retirees. Eligible retirees who were less than age 50 as of January 1, 2005 and who retire after age 55 with 15 or more years of service are eligible for a fixed amount which can be utilized to pay for either Agilent sponsored plans and/or individual medicare plans. Eligible retirees who were at least age 50 as of January 1, 2005 and who retire after age 55 with 15 or more years of service currently choose from managed-care, indemnity options or individual medicare plans, with the company subsidization level or stipend dependent on a number of factors including eligibility and length of service. See Plan Amendments below for changes to these benefits.
Plan Amendments. On July 14, 2009 the Compensation Committee of the Board of Directors approved design changes to Agilent’s U.S. RP. Effective October 31, 2009, benefits under the previous U.S. RP. formula were frozen and all future benefit accruals for existing employees and new hires are calculated using the new formula. The new formula allocates a percentage of each month’s eligible earnings to be payable as a lump sum at age 65 whereas the previous formula defined a monthly annuity payable at age 65. Due to these plan amendments, we recorded gains of $117 million and $15 million in accumulated other comprehensive loss in 2009 for the U.S. Plans and U.S. Post-Retirement Benefit Plans, respectively.

66
On April 1, 2011, changes to the Agilent Technologies, Inc. Health Plan for Retirees were approved. Effective January 1, 2012, employees who were at least age 50 as of January 1, 2005 and who retire after age 55 with 15 or more years of service are eligible for fixed dollar subsidies and stipends. Grandfathered retirees receive a fixed monthly subsidy toward pre-65 premium costs (subsidy capped at 2011 levels) and a fixed monthly stipend post-65. The subsidy amounts will not increase. In connection with these changes, we reduced our Accumulated Prospective Benefit Obligation by $194 million with the offset going to accumulated other comprehensive income.
Components of net periodic cost. The company uses alternate methods of amortization as allowed by the authoritative guidance which amortizes the actuarial gains and losses on a consistent basis for the years presented. For U.S. Plans, gains and losses are amortized over the average future working lifetime. For most Non-U.S. Plans and U.S. Post-Retirement Benefit Plans, gains and losses are amortized using a separate layer for each year’s gains and losses. For the years ended October 31, 2011, 2010 and 2009, components of net periodic benefit cost and other amounts recognized in other comprehensive income were comprised of:
Pensions
U.S. Post-Retirement
Benefit PlansU.S. Plans Non-U.S. Plans
2011 2010 2009 2011 2010 2009 2011 2010 2009
(in millions)
Net periodic benefit cost (benefit)Service cost — benefits earned during
the period . . . . . . . . . . . . . . . . . . . . . . $ 42 $ 41 $ 33 $ 32 $ 30 $ 34 $ 3 $ 3 $ 3Interest cost on benefit obligation . . . . . 28 27 43 72 72 73 21 26 29Expected return on plan assets . . . . . . . (44) (41) (38) (94) (87) (86) (21) (20) (20)Amortization of net actuarial loss . . . . . 4 7 3 40 35 41 14 16 8Amortization of prior service benefit. . . (12) (12) (3) (1) (1) (2) (26) (14) (15)
Net periodic benefit cost (benefit) . . . . . . . 18 22 38 49 49 60 (9) 11 5Curtailments and settlements . . . . . . . . (1) — — — — (3) — — (13)
Total periodic benefit cost (benefit) . . . . . $ 17 $ 22 $ 38 $ 49 $ 49 $ 57 $ (9) $ 11 $ (8)Other changes in plan assets and
benefit obligations recognized in other comprehensive (income) lossNet actuarial (gain) loss . . . . . . . . . . . . . $ 31 $(25) $ 47 $ 40 $ 42 $ 171 $ 12 $(10) $125Amortization of net actuarial loss . . . . . (4) (7) (3) (40) (35) (41) (14) (16) (8)Prior service cost (benefit) . . . . . . . . . . . — — (114) 6 — — (194) — —Amortization of prior service benefit. . . 12 12 3 1 1 2 26 14 15Foreign currency . . . . . . . . . . . . . . . . . . . — — — 11 11 17 — — —
Total recognized in other comprehensive (income) loss . . . . . . . . . . . . . . . . . . . . . . . $ 39 $(20) $ (67) $ 18 $ 19 $149 $(170) $(12) $132
Total recognized in net periodic benefit cost (benefit) and other comprehensive (income) loss . . . . . . . . . . . . . . . . . . . . . . . $ 56 $ 2 $ (29) $ 67 $ 68 $206 $(179) $ (1) $124
In 2009, as a result of reductions in workforce, we recorded a $3 million curtailment gain and a $13 million curtailment gain in the income statement for the Non-U.S. Plans and U.S. Post-Retirement Benefit Plans, respectively.

Annu
al R
epor
t Fin
anci
als
67
In 2010, due to reductions in workforce which impacted two non-U.S. plans, we recorded curtailment losses as required by authoritative guidance with no impact to the income statement.
In 2011, due to payments exceeding the sum of service cost plus interest cost in the U.S. Supplemental Benefits Retirement Plan, we recorded a $1 million settlement gain in the income statement as required by authoritative guidance.
Funded status. As of October 31, 2011 and 2010, the funded status of the defined benefit and post-retirement benefit plans was:
U.S. Defined Benefit Plans
Non-U.S. Defined Benefit Plans
U.S. Post-Retirement
Benefit Plans
2011 2010 2011 2010 2011 2010
(in millions)
Change in fair value of plan assets:Fair value — beginning of year . . . . . . . . . . . . . . . . . . $ 538 $ 482 $ 1,598 $1,475 $ 263 $ 251Actual return on plan assets . . . . . . . . . . . . . . . . . . . 37 68 35 115 18 35Employer contributions. . . . . . . . . . . . . . . . . . . . . . . . 30 30 59 47 — 1Participants’ contributions . . . . . . . . . . . . . . . . . . . . . — — 7 2 — —Benefits paid. . . . . . . . . . . . . . . . . . . . . . . . . . . . . . . . . (27) (42) (46) (57) (23) (24)Currency impact. . . . . . . . . . . . . . . . . . . . . . . . . . . . . . — — 31 16 — —
Fair value — end of year . . . . . . . . . . . . . . . . . . . . . . . . . $ 578 $ 538 $ 1,684 $1,598 $ 258 $ 263
Change in benefit obligation:Benefit obligation — beginning of year . . . . . . . . . . . $ 575 $ 548 $ 1,742 $1,610 $ 502 $ 490Service cost. . . . . . . . . . . . . . . . . . . . . . . . . . . . . . . . . . 42 41 32 30 3 4Interest cost . . . . . . . . . . . . . . . . . . . . . . . . . . . . . . . . . 28 27 72 72 21 26Participants’ contributions . . . . . . . . . . . . . . . . . . . . . — — 7 2 — —Plan amendment. . . . . . . . . . . . . . . . . . . . . . . . . . . . . . — — 6 — (194) —Actuarial (gain) loss . . . . . . . . . . . . . . . . . . . . . . . . . . 21 3 (20) 79 8 4Benefits paid. . . . . . . . . . . . . . . . . . . . . . . . . . . . . . . . . (29) (44) (46) (57) (21) (22)Curtailments. . . . . . . . . . . . . . . . . . . . . . . . . . . . . . . . . — — — (9) — —Currency impact. . . . . . . . . . . . . . . . . . . . . . . . . . . . . . — — 37 15 — —
Benefit obligation — end of year. . . . . . . . . . . . . . . . . . . $ 637 $ 575 $1,830 $ 1,742 $ 319 $ 502
Overfunded (underfunded) status of PBO . . . . . . . . $ (59) $ (37) $ (146) $ (144) $ (61) $ (239)
Amounts recognized in the consolidated balance sheet consist of:
Other assets . . . . . . . . . . . . . . . . . . . . . . . . . . . . . . . . . . . $ — $ — $ 18 $ 12 $ — $ —Employee compensation and benefits . . . . . . . . . . . . . . (2) (2) — — — —Retirement and post-retirement benefits . . . . . . . . . . . (57) (35) (164) (156) (61) (239)
Net asset (liability) . . . . . . . . . . . . . . . . . . . . . . . . . . . . . $ (59) $ (37) $ (146) $ (144) $ (61) $ (239)
Amounts Recognized in Accumulated Other Comprehensive Income (loss):
Actuarial (gains) losses. . . . . . . . . . . . . . . . . . . . . . . . . . $ 66 $ 39 $ 524 $ 513 $ 188 $ 191Prior service costs (benefits) . . . . . . . . . . . . . . . . . . . . . (91) (103) (9) (16) (253) (86)
Total. . . . . . . . . . . . . . . . . . . . . . . . . . . . . . . . . . . . . . . . . . $ (25) $ (64) $ 515 $ 497 $ (65) $ 105

68
The amounts in accumulated other comprehensive income expected to be recognized as components of net expense during 2012 are as follows:
U.S. Defined Benefit Plans
Non-U.S. Defined Benefit Plans
U.S. Post-Retirement Benefit Plans
(in millions)
Amortization of net prior service cost (benefit) . . . . $(12) $ (1) $(35)Amortization of actuarial net loss (gain) . . . . . . . . . . $ 7 $43 $ 16
Investment policies and strategies as of October 31, 2011, 2010 and 2009. In the U.S., our Agilent Retirement Plan and post-retirement benefit target asset allocations are approximately 80 percent to equities and approximately 20 percent to fixed income investments. Our DPSP target asset allocation is approximately 60 percent to equities and approximately 40 percent to fixed income investments. Approximately, 5 percent of our U.S. equity portfolio consists of limited partnerships. The general investment objective for all our plan assets is to obtain the optimum rate of investment return on the total investment portfolio consistent with the assumption of a reasonable level of risk. The safety and protection of principal is a primary concern, and we believe that a well-diversified investment portfolio will result in the highest attainable investment return (income plus capital appreciation) with the lowest overall risk. Specific investment objectives for the plans’ portfolios are to: maintain and enhance the purchasing power of the plans’ assets; achieve investment returns consistent with the level of risk being taken; and earn performance rates of return in accordance with the benchmarks adopted for each asset class. Outside the U.S., our target asset allocation is from 40 to 60 percent to equities, from 40 to 60 percent to fixed income investments, and from zero to 10 percent to real estate investments, depending on the plan. All plans’ assets are broadly diversified. Due to fluctuations in equity markets, our actual allocations of plan assets at October 31, 2011 and 2010 differ from the target allocation. Our policy is to bring the actual allocation in line with the target allocation.
Equity securities include exchange-traded common stock and preferred stock of companies from broadly diversified industries. Fixed income securities include corporate bonds of companies from diversified industries, government securities, mortgage-backed securities, asset-backed securities and other. Other investments include a group trust consisting primarily of private equity partnerships as well as other investments. Portions of the cash and cash equivalent, equity, and fixed income investments are held in commingled funds.
Fair Value. The measurement of the fair value of pension and post-retirement plan assets uses the valuation methodologies and the inputs as described in Note 12.
Cash and Cash Equivalents — Cash and cash equivalents consist of short-term investment funds. The funds also invest in short-term domestic fixed income securities and other securities with debt-like characteristics emphasizing short-term maturities and quality. Cash and cash equivalents are classified as Level 1 investments except when the cash and cash equivalents are held in commingled funds, which have a daily net value derived from quoted prices for the underlying securities in active markets; these are classified as Level 2 investments.
Equity — Some equity securities consisting of common and preferred stock are held in commingled funds, which have daily net asset values derived from quoted prices for the underlying securities in active markets; these are classified as Level 2 investments.
Fixed Income — Some of the fixed income securities are held in commingled funds, which have daily net asset values derived from the underlying securities; these are classified as Level 2 investments.

Annu
al R
epor
t Fin
anci
als
69
Other Investments — Other investments includes property based pooled vehicles which invest in real estate. Market net asset values are regularly published in the financial press or on corporate websites and so these investments are classified as Level 2. Other investments also includes partnership investments where, due to their private nature, pricing inputs are not readily observable. Asset valuations are developed by the general partners that manage the partnerships. These valuations are based on proprietary appraisals, application of public market multiples to private company cash flows, utilization of market transactions that provide valuation information for comparable companies and other methods. Holdings of limited partnerships are classified as Level 3.
The following table presents the fair value of U.S. Defined Benefit Plans assets classified under the appropriate level of the fair value hierarchy as of October 31, 2011.
Fair value Measurement at October 31, 2011 Using
October 31, 2011
Quoted Prices in Active
Markets for Identical Assets
(Level 1)
Significant Other
Observable Inputs
(Level 2)
Significant Unobservable
Inputs (Level 3)
(in millions)
Cash and Cash Equivalents . . . . . . . . . . . . . . . . . . $ 28 $ — $ 28 $ —Equity . . . . . . . . . . . . . . . . . . . . . . . . . . . . . . . . . . . . 405 141 264 —Fixed Income . . . . . . . . . . . . . . . . . . . . . . . . . . . . . . 119 5 114 —Other Investments . . . . . . . . . . . . . . . . . . . . . . . . . . 26 — — 26
Total assets measured at fair value . . . . . . . . . . $578 $146 $406 $26
For U.S. Defined Benefit Plans assets measured at fair value using significant unobservable inputs (level 3), the following table summarizes the change in balances during 2011 and 2010:
Years Ended October 31.
2011 2010
Balance, beginning of year . . . . . . . . . . . . . . . . . . . . . . . . . . . . . . . . . . . . . . . . . . . . . . . . . $29 $32Realized gains. . . . . . . . . . . . . . . . . . . . . . . . . . . . . . . . . . . . . . . . . . . . . . . . . . . . . . . . . . 8 6Unrealized gains/(losses) . . . . . . . . . . . . . . . . . . . . . . . . . . . . . . . . . . . . . . . . . . . . . . . . (3) —Purchases, sales, issuances, and settlements. . . . . . . . . . . . . . . . . . . . . . . . . . . . . . . . — —Transfers in (out) . . . . . . . . . . . . . . . . . . . . . . . . . . . . . . . . . . . . . . . . . . . . . . . . . . . . . . . (8) (9)
Balance, end of year . . . . . . . . . . . . . . . . . . . . . . . . . . . . . . . . . . . . . . . . . . . . . . . . . . . . . . $26 $29
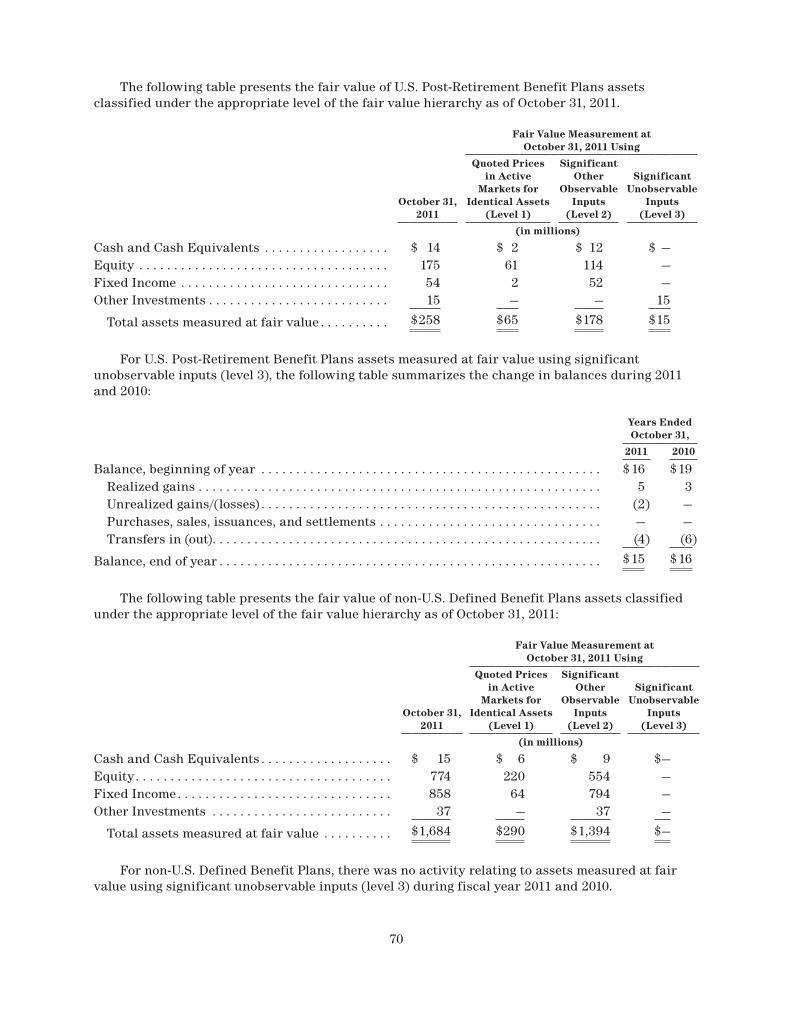
70
The following table presents the fair value of U.S. Post-Retirement Benefit Plans assets classified under the appropriate level of the fair value hierarchy as of October 31, 2011.
Fair value Measurement at October 31, 2011 Using
October 31, 2011
Quoted Prices in Active
Markets for Identical Assets
(Level 1)
Significant Other
Observable Inputs
(Level 2)
Significant Unobservable
Inputs (Level 3)
(in millions)
Cash and Cash Equivalents . . . . . . . . . . . . . . . . . . $ 14 $ 2 $ 12 $ —Equity . . . . . . . . . . . . . . . . . . . . . . . . . . . . . . . . . . . . 175 61 114 —Fixed Income . . . . . . . . . . . . . . . . . . . . . . . . . . . . . . 54 2 52 —Other Investments . . . . . . . . . . . . . . . . . . . . . . . . . . 15 — — 15
Total assets measured at fair value . . . . . . . . . . $258 $65 $178 $15
For U.S. Post-Retirement Benefit Plans assets measured at fair value using significant unobservable inputs (level 3), the following table summarizes the change in balances during 2011 and 2010:
Years Ended October 31,
2011 2010
Balance, beginning of year . . . . . . . . . . . . . . . . . . . . . . . . . . . . . . . . . . . . . . . . . . . . . . . . . $16 $19Realized gains . . . . . . . . . . . . . . . . . . . . . . . . . . . . . . . . . . . . . . . . . . . . . . . . . . . . . . . . . . 5 3Unrealized gains/(losses) . . . . . . . . . . . . . . . . . . . . . . . . . . . . . . . . . . . . . . . . . . . . . . . . . (2) —Purchases, sales, issuances, and settlements . . . . . . . . . . . . . . . . . . . . . . . . . . . . . . . . — —Transfers in (out) . . . . . . . . . . . . . . . . . . . . . . . . . . . . . . . . . . . . . . . . . . . . . . . . . . . . . . . . (4) (6)
Balance, end of year . . . . . . . . . . . . . . . . . . . . . . . . . . . . . . . . . . . . . . . . . . . . . . . . . . . . . . . $15 $16
The following table presents the fair value of non-U.S. Defined Benefit Plans assets classified under the appropriate level of the fair value hierarchy as of October 31, 2011:
Fair value Measurement at October 31, 2011 Using
October 31, 2011
Quoted Prices in Active
Markets for Identical Assets
(Level 1)
Significant Other
Observable Inputs
(Level 2)
Significant Unobservable
Inputs (Level 3)
(in millions)
Cash and Cash Equivalents . . . . . . . . . . . . . . . . . . . $ 15 $ 6 $ 9 $—Equity . . . . . . . . . . . . . . . . . . . . . . . . . . . . . . . . . . . . . 774 220 554 —Fixed Income . . . . . . . . . . . . . . . . . . . . . . . . . . . . . . . 858 64 794 —Other Investments . . . . . . . . . . . . . . . . . . . . . . . . . . 37 — 37 —
Total assets measured at fair value . . . . . . . . . . $1,684 $290 $1,394 $—
For non-U.S. Defined Benefit Plans, there was no activity relating to assets measured at fair value using significant unobservable inputs (level 3) during fiscal year 2011 and 2010.

Annu
al R
epor
t Fin
anci
als
71
The table below presents the combined projected benefit obligation (“PBO”), accumulated benefit obligation (“ABO”) and fair value of plan assets, grouping plans using comparisons of the PBO and ABO relative to the plan assets as of October 31, 2011 or 2010.
2011 2010
Benefit Obligation
Fair value of Plan Assets
Benefit Obligation
Fair value of Plan Assets
PBO PBO
(in millions)
U.S. defined benefit plans where PBO exceeds the fair value of plan assets . . . . . . . . . . . . . . . $ 637 $ 578 $ 575 $ 538
U.S. defined benefit plans where fair value of plan assets exceeds PBO . . . . . . . . . . . . . . . . . . . . . . . — — — —
Total. . . . . . . . . . . . . . . . . . . . . . . . . . . . . . . . . . . . . . . . . . $ 637 $ 578 $ 575 $ 538
Non-U.S. defined benefit plans where PBO exceeds or is equal to the fair value of plan assets . . . $ 1,760 $1,598 $1,669 $1,513
Non-U.S. defined benefit plans where fair value of plan assets exceeds PBO . . . . . . . . . . . . . . . . . . . . . . . 70 86 73 85
Total. . . . . . . . . . . . . . . . . . . . . . . . . . . . . . . . . . . . . . . . . . $1,830 $1,684 $ 1,742 $1,598
ABO ABO
U.S. defined benefit plans where ABO exceeds the fair value of plan assets . . . . . . . . . . . . . . . $ 624 $ 578 $ 568 $ 538
U.S. defined benefit plans where the fair value of plan assets exceeds ABO. . . . . . . . . . . . . . . . . . . . . . . — — — —
Total. . . . . . . . . . . . . . . . . . . . . . . . . . . . . . . . . . . . . . . . . . $ 624 $ 578 $ 568 $ 538
Non-U.S. defined benefit plans where ABO exceeds or is equal to the fair value of plan assets . . . $1,699 $1,598 $1,602 $1,513
Non-U.S. defined benefit plans where fair value of plan assets exceeds ABO. . . . . . . . . . . . . . . . . . . . . . . 67 86 70 85
Total. . . . . . . . . . . . . . . . . . . . . . . . . . . . . . . . . . . . . . . . . . $ 1,766 $1,684 $1,672 $1,598
Contributions and estimated future benefit payments. During fiscal year 2012, we expect to contribute $30 million to the U.S. defined benefit plans, $52 million to plans outside the U.S., and zero to the Post-retirement Medical Plans. The following table presents expected future benefit payments for the next 10 years.
U.S. Defined Benefit Plans
Non-U.S. Defined Benefit Plans
U.S. Post-Retirement Benefit Plans
(in millions)
2012 . . . . . . . . . . . . . . . . . . . . . . . . . . . . . . . . . . . . . . . . . $ 52 $ 47 $ 262013 . . . . . . . . . . . . . . . . . . . . . . . . . . . . . . . . . . . . . . . . . $ 55 $ 50 $ 262014 . . . . . . . . . . . . . . . . . . . . . . . . . . . . . . . . . . . . . . . . . $ 55 $ 52 $ 262015 . . . . . . . . . . . . . . . . . . . . . . . . . . . . . . . . . . . . . . . . . $ 55 $ 57 $ 272016 . . . . . . . . . . . . . . . . . . . . . . . . . . . . . . . . . . . . . . . . . $ 56 $ 62 $ 272017 - 2021 . . . . . . . . . . . . . . . . . . . . . . . . . . . . . . . . . . . $241 $404 $130

72
Assumptions. The assumptions used to determine the benefit obligations and expense for our defined benefit and post-retirement benefit plans are presented in the tables below. The expected long-term return on assets below represents an estimate of long-term returns on investment portfolios consisting of a mixture of equities, fixed income and alternative investments in proportion to the asset allocations of each of our plans. We consider long-term rates of return, which are weighted based on the asset classes (both historical and forecasted) in which we expect our pension and post-retirement funds to be invested. Discount rates reflect the current rate at which pension and post-retirement obligations could be settled based on the measurement dates of the plans — October 31. The U.S. discount rates at October 31, 2011 and 2010 were determined based on the results of matching expected plan benefit payments with cash flows from a hypothetically constructed bond portfolio. The U.S. discount rates at October 31, 2009 were determined by matching the expected plan benefit payments against an industry discount curve as well as reviewing the movement of industry benchmarks. The non-U.S. rates were generally based on published rates for high-quality corporate bonds. The range of assumptions that were used for the non-U.S. defined benefit plans reflects the different economic environments within various countries.
Assumptions used to calculate the net periodic cost in each year were as follows:
For years ended October 31,
2011 2010 2009
U.S. defined benefit plans:Discount rate . . . . . . . . . . . . . . . . . . . . . . . . . . 5.0% 5.25% 8.5%Average increase in compensation levels . . . 3.5% 3.5% 3.5%Expected long-term return on assets . . . . . . 8.25% 8.5% 8.5%
Non-U.S. defined benefit plans:Discount rate . . . . . . . . . . . . . . . . . . . . . . . . . . 2.0-5.25% 2.25-5.75% 2.25-6.5%Average increase in compensation levels . . . 2.5-3.75% 2.5-3.75% 2.5-4.0%Expected long-term return on assets . . . . . . 4.0-6.75% 4.25-7.0% 4.5-7.25%
U.S. post-retirement benefits plans:Discount rate . . . . . . . . . . . . . . . . . . . . . . . . . . 5.5% 5.5% 8.5%Expected long-term return on assets . . . . . . 8.25% 8.5% 8.5%Current medical cost trend rate. . . . . . . . . . . 10.0% 10.0% 10.0%Ultimate medical cost trend rate . . . . . . . . . . 4.75% 5.0% 5.0%Medical cost trend rate decreases to ultimate
rate in year . . . . . . . . . . . . . . . . . . . . . . . . . 2025 2019 2018

Annu
al R
epor
t Fin
anci
als
73
Assumptions used to calculate the benefit obligation were as follows:
As of the Years Ending October 31,
2011 2010
U.S. defined benefit plans:Discount rate . . . . . . . . . . . . . . . . . . . . . . . . . . . . . . . . . . . . . 4.5% 5.0%Average increase in compensation levels . . . . . . . . . . . . . . 3.5% 3.5%Expected long-term return on assets . . . . . . . . . . . . . . . . . 8.0% 8.25%
Non-U.S. defined benefit plans:Discount rate . . . . . . . . . . . . . . . . . . . . . . . . . . . . . . . . . . . . . 2.0-5.5% 2.0-5.25%Average increase in compensation levels . . . . . . . . . . . . . . 2.5-3.25% 2.5-3.75%Expected long-term return on assets . . . . . . . . . . . . . . . . . 4.0-6.5% 4.0-6.75%
U.S. post-retirement benefits plans:Discount rate . . . . . . . . . . . . . . . . . . . . . . . . . . . . . . . . . . . . . 4.75% 5.5%Expected long-term return on assets . . . . . . . . . . . . . . . . . 8.0% 8.25%Current medical cost trend rate. . . . . . . . . . . . . . . . . . . . . . 9.0% 10.0%Ultimate medical cost trend rate . . . . . . . . . . . . . . . . . . . . . 4.5% 4.75%Medical cost trend rate decreases to ultimate
rate in year . . . . . . . . . . . . . . . . . . . . . . . . . . . . . . . . . . . . 2026 2025
Due to the benefit changes discussed previously, health care trend rates do not have a significant effect on the total service and interest cost components or on the post-retirement benefit obligation amounts reported for the U.S. Post-Retirement Benefit Plan for the year ended October 31, 2011.
16. Guarantees
Standard Warranty
A summary of the standard warranty accrual activity is shown in the table below. The standard warranty accrual balances are held in other accrued and other long-term liabilities.
October 31,
2011 2010
(in millions)
Balance as of October 31, 2010 and 2009 . . . . . . . . . . . . . . $ 45 $ 28Reserve acquired upon close of Varian acquisition . . . . . — 13Accruals for warranties issued during the period . . . . . . 61 57Changes in estimates . . . . . . . . . . . . . . . . . . . . . . . . . . . . . . 11 (4)Settlements made during the period . . . . . . . . . . . . . . . . . (67) (49)
Balance as of October 31, 2011 and 2010 . . . . . . . . . . . . . . $ 50 $ 45

74
Indemnifications to Avago
In connection with the sale of our semiconductor products business in December 2005, we agreed to indemnify Avago, its affiliates and other related parties against certain damages and expenses that it might incur in the future. The continuing indemnifications primarily cover damages and expenses relating to liabilities of the businesses that Agilent retained and did not transfer to Avago, as well as pre-closing taxes and other specified items. In our opinion, the fair value of these indemnification obligations was not material as of October 31, 2011.
Indemnifications to Verigy
In connection with the spin-off of Verigy, we agreed to indemnify Verigy and its affiliates against certain damages which it might incur in the future. These indemnifications primarily cover damages relating to liabilities of the businesses that Agilent did not transfer to Verigy, liabilities that might arise under limited portions of Verigy’s IPO materials that relate to Agilent, and costs and expenses incurred by Agilent or Verigy to effect the IPO, arising out of the distribution of Agilent’s remaining holding in Verigy ordinary shares to Agilent’s stockholders, or incurred to effect the separation of the semiconductor test solutions business from Agilent to the extent incurred prior to the separation on June 1, 2006. On July 4, 2011, Verigy announced the completion by Advantest Corporation of its acquisition of Verigy. Verigy will operate as a wholly-owned subsidiary of Advantest and our indemnification obligations to Verigy should be unaffected. In our opinion, the fair value of these indemnification obligations was not material as of October 31, 2011.
Indemnifications to Hewlett-Packard
We have given multiple indemnities to Hewlett-Packard in connection with our activities prior to our spin-off from HP for the businesses that constituted Agilent prior to the spin-off. These indemnifications cover a variety of aspects of our business, including, but not limited to, employee, tax, intellectual property and environmental matters. The agreements containing these indemnifications have been previously disclosed as exhibits to our registration statement on Form S-1 filed on August 16, 1999. In our opinion, the fair value of these indemnification obligations was not material as of October 31, 2011.
Indemnifications to Varian Medical Systems and Varian Semiconductor Equipment Associates
In connection with our acquisition of Varian, we are subject to certain indemnification obligations to Varian Medical Systems (formerly Varian Associates, Inc. (“VAI”)) and Varian Semiconductor Equipment Associates (“VSEA”) in connection with the Instruments business as conducted by VAI prior to the Distribution (as described in Note 1 of Varian’s Annual Report on Form 10-K filed on November 25, 2009). These indemnification obligations cover a variety of aspects of our business, including, but not limited to, employee, tax, intellectual property, litigation and environmental matters. Certain of the agreements containing these indemnification obligations are disclosed as exhibits to Varian’s Annual Report on Form 10-K filed on November 25, 2009. On November 10, 2011, Applied Materials announced that it had completed the acquisition of VSEA, which is now a wholly-owned subsidiary of Applied Materials; our indemnification obligations to VSEA should be unaffected. In our opinion, the fair value of these indemnification obligations was not material as of October 31, 2011.
Indemnifications to Officers and Directors
Our corporate by-laws require that we indemnify our officers and directors, as well as those who act as directors and officers of other entities at our request, against expenses, judgments, fines, settlements and other amounts actually and reasonably incurred in connection with any

Annu
al R
epor
t Fin
anci
als
75
proceedings arising out of their services to Agilent and such other entities, including service with respect to employee benefit plans. In addition, we have entered into separate indemnification agreements with each director and each board-appointed officer of Agilent which provide for indemnification of these directors and officers under similar circumstances and under additional circumstances. The indemnification obligations are more fully described in the by-laws and the indemnification agreements. We purchase standard insurance to cover claims or a portion of the claims made against our directors and officers. Since a maximum obligation is not explicitly stated in our by-laws or in our indemnification agreements and will depend on the facts and circumstances that arise out of any future claims, the overall maximum amount of the obligations cannot be reasonably estimated. Historically, we have not made payments related to these obligations, and the fair value for these indemnification obligations was not material as of October 31, 2011.
Other Indemnifications
As is customary in our industry and as provided for in local law in the U.S. and other jurisdictions, many of our standard contracts provide remedies to our customers and others with whom we enter into contracts, such as defense, settlement, or payment of judgment for intellectual property claims related to the use of our products. From time to time, we indemnify customers, as well as our suppliers, contractors, lessors, lessees, companies that purchase our businesses or assets and others with whom we enter into contracts, against combinations of loss, expense, or liability arising from various triggering events related to the sale and the use of our products and services, the use of their goods and services, the use of facilities and state of our owned facilities, the state of the assets and businesses that we sell and other matters covered by such contracts, usually up to a specified maximum amount. In addition, from time to time we also provide protection to these parties against claims related to undiscovered liabilities, additional product liability or environmental obligations. In our experience, claims made under such indemnifications are rare and the associated estimated fair value of the liability was not material as of October 31, 2011.
In connection with the sale of several of our businesses, we have agreed to indemnify the buyers of such business, their respective affiliates and other related parties against certain damages that they might incur in the future. The continuing indemnifications primarily cover damages relating to liabilities of the businesses that Agilent retained and did not transfer to the buyers, as well as other specified items. In our opinion, the fair value of these indemnification obligations was not material as of October 31, 2011.
17. Commitments and Contingencies
Operating Lease Commitments: We lease certain real and personal property from unrelated third parties under non-cancelable operating leases. Future minimum lease payments under operating leases at October 31, 2011 were $51 million for 2012, $43 million for 2013, $28 million for 2014, $19 million for 2015, $12 million for 2016 and $12 million thereafter. Future minimum sublease income under leases at October 31, 2011 was $7 million for 2012, $6 million for 2013, $5 million for 2014, $3 million for 2015 and $1 million thereafter. Certain leases require us to pay property taxes, insurance and routine maintenance, and include escalation clauses. Total rent expense, including charges relating to the consolidation of excess facilities was $82 million in 2011, $89 million in 2010 and $95 million in 2009.
We are involved in lawsuits, claims, investigations and proceedings, including patent, commercial and environmental matters. There are no matters pending that we currently believe are reasonably possible of having a material impact to our business, consolidated financial condition, results of operations or cash flows.
76
18. Short-Term Debt
Credit Facility
On October 20, 2011, we entered into a five-year credit agreement, which provides for a $400 million unsecured credit facility that will expire on October 20, 2016. The company may use amounts borrowed under the facility for general corporate purposes. As of October 31, 2011 the company has no borrowings outstanding under the facility. The Credit Agreement replaced the Company’s prior Five-Year Credit Agreement dated as of May 11, 2007, which was terminated upon the execution of the Credit Agreement. We were in compliance with the covenants for the credit facilities during the year ended October 31, 2011.
2012 Senior Notes
On September 9, 2009, the company issued an aggregate principal amount of $250 million in senior notes maturing in 2012 (“2012 senior notes”). The 2012 senior notes were issued at 99.91% of their principal amount, bear interest at a fixed rate of 4.45% per annum, and mature on September 14, 2012. Interest is payable semi-annually on March 14th and September 14th of each year, and payments commenced on March 14, 2010.
Upon the closing of the offering of the 2012 senior notes, we entered into interest rate swaps with an aggregate notional amount of $250 million. Under the interest rate swaps, we will receive fixed-rate interest payments and will make payments based on the U.S. dollar LIBOR plus 258 basis points with respect to the 2012 senior notes. The economic effect of these swaps will be to convert the fixed-rate interest expense on the senior notes to a variable LIBOR-based interest rate. The hedging relationship qualifies for the shortcut method of assessing hedge effectiveness, and consequently we do not expect any ineffectiveness during the life of the swap and any movement in the value of the swap would be reflected in the movement in fair value of the senior notes. At October 31, 2011, the fair value of the swaps on 2012 senior notes was an asset of $3 million, with a corresponding increase in the carrying value of senior notes.
All notes issued are unsecured and rank equally in right of payment with all of Agilent’s other senior unsecured indebtedness. The company incurred issuance costs of $2 million in connection with the 2012 senior notes. These costs were capitalized in other assets on the consolidated balance sheet and the costs are being amortized to interest expense over the term of the senior notes.
World Trade Debt
We satisfied the financing obligation of World Trade in its entirety on December 10, 2010 using the proceeds of our senior notes issued in July 2010 and existing cash on our balance sheet.
Short-Term Restricted Cash & Cash Equivalents
As of October 31, 2010, $1,550 million was reported as short-term restricted cash and cash equivalents in our consolidated balance sheet which was held in commercial paper maintained in connection with our World Trade repurchase obligation. This restricted cash, held by one of our wholly-owned subsidiaries, has been reclassified to cash and cash equivalents following the December 10, 2010 settlement of the World Trade repurchase obligation.

Annu
al R
epor
t Fin
anci
als
77
19. Long-Term Debt
Senior Notes
The following table summarizes the company’s long-term senior notes and the related interest rate swaps:
October 31, 2011 October 31, 2010
Amortized Principal Swap Total
Amortized Principal Swap Total
(in millions)
2012 Senior Notes . . . . . . . . . . . . . . . . . . . . . . . . . $ — $ — $ — $ 250 $ 6 $ 2562013 Senior Notes . . . . . . . . . . . . . . . . . . . . . . . . . 250 — 250 249 — 2492015 Senior Notes . . . . . . . . . . . . . . . . . . . . . . . . . 499 24 523 499 37 5362017 Senior Notes . . . . . . . . . . . . . . . . . . . . . . . . . 598 31 629 598 35 6332020 Senior Notes . . . . . . . . . . . . . . . . . . . . . . . . . 498 32 530 498 18 516
Total . . . . . . . . . . . . . . . . . . . . . . . . . . . . . . . . . . . . $1,845 $ 87 $1,932 $2,094 $96 $ 2,190
2012 Senior Notes
The 2012 senior notes are repayable within one year and have been reclassified to short-term debt, see Note 18, “Short-term debt”.
2013 Senior Notes
In July 2010, the company issued an aggregate principal amount of $250 million in senior notes (“2013 senior notes”). The 2013 senior notes were issued at 99.82% of their principal amount. The notes will mature on July 15, 2013, and bear interest at a fixed rate of 2.50% per annum. The interest is payable semi-annually on January 15th and July 15th of each year, payments commenced on January 15, 2011.
2015 Senior Notes
In September 2009, the company issued an aggregate principal amount of $500 million in senior notes (“2015 senior notes”). The senior notes were issued at 99.69% of their principal amount. The notes will mature on September 14, 2015, and bear interest at a fixed rate of 5.50% per annum. The interest is payable semi-annually on March 14th and September 14th of each year, payments commenced on March 14, 2010.
On June 6, 2011, we terminated our interest rate swap contracts related to our 2015 senior notes that represented the notional amount of $500 million. The asset value, including interest receivable, upon termination for these contracts was approximately $31 million and the amount to be amortized at October 31, 2011 was $24 million. The gain is being deferred and amortized to interest expense over the remaining life of the 2015 senior notes.
2017 Senior Notes
In October 2007, the company issued an aggregate principal amount of $600 million in senior notes (“2017 senior notes”). The 2017 senior notes were issued at 99.60% of their principal amount. The notes will mature on November 1, 2017, and bear interest at a fixed rate of 6.50% per annum. The interest is payable semi-annually on May 1st and November 1st of each year and payments commenced on May 1, 2008.
78
On November 25, 2008, we terminated two interest rate swap contracts associated with our 2017 senior notes that represented the notional amount of $400 million. The asset value, including interest receivable, upon termination was approximately $43 million and the amount to be amortized at October 31, 2011 was $31 million. The gain is being deferred and amortized to interest expense over the remaining life of the 2017 senior notes.
2020 Senior Notes
In July 2010, the company issued an aggregate principal amount of $500 million in senior notes (“2020 senior notes”). The 2020 senior notes were issued at 99.54% of their principal amount. The notes will mature on July 15, 2020, and bear interest at a fixed rate of 5.00% per annum. The interest is payable semi-annually on January 15th and July 15th of each year, payments commenced on January 15, 2011.
On August 9, 2011, we terminated our interest rate swap contracts related to our 2020 senior notes that represented the notional amount of $500 million. The asset value, including interest receivable, upon termination for these contracts was approximately $34 million and the amount to be amortized at October 31, 2011 was $32 million. The gain is being deferred and amortized to interest expense over the remaining life of the 2020 senior notes.
All notes issued are unsecured and rank equally in right of payment with all of Agilent’s other senior unsecured indebtedness. The company incurred issuance costs of $5 million in connection with the 2017 senior notes, incurred $3 million in connection with the 2015 senior notes and incurred $5 million in connection with 2013 and 2020 senior notes. These costs were capitalized in other assets on the consolidated balance sheet and the costs are being amortized to interest expense over the term of the senior notes.
20. Stockholders’ Equity
Stock Repurchase Program
On November 19, 2009 our Board of Directors approved a share-repurchase program to reduce or eliminate dilution of basic outstanding shares in connection with issuances of stock under the company’s equity incentive plans. The share-repurchase program does not require the company to acquire a specific number of shares and may be suspended or discontinued at any time. There is no fixed termination date for the new share-repurchase program. For the year ended October 31, 2011, we repurchased approximately 12 million shares for $497 million. For the year ended October 31, 2010, we repurchased 13 million shares for $411 million. All such shares and related costs are held as treasury stock and accounted for using the cost method.

Annu
al R
epor
t Fin
anci
als
79
Accumulated other comprehensive income
The following table summarizes the components of our accumulated other comprehensive income as of October 31, 2011 and 2010, net of tax effect:
October 31,
2011 2010
(in millions)
Unrealized gain on equity securities, net of $(8) of tax for 2011 and 2010 . . . . . . . . . . . . . . . . . . . . . . . . . . . . . . . . $ (6) $ (2)
Foreign currency translation, net of $(102) of tax for 2011 and 2010 . . . . . . . . . . . . . . . . . . . . . . . . . . . . . . . . 452 358
Unrealized losses on defined benefit plans, net of tax of $84 and $88 for 2011 and 2010, respectively . . . . . . . . (331) (442)
Unrealized gains (losses) on derivative instruments, net of tax of $(2) and $(1) for 2011 and 2010, respectively . . . . . . . 1 (2)
Total accumulated other comprehensive income . . . . . . . . . . . $ 116 $ (88)
21. Segment Information
Description of segments. We are a measurement company, providing core bio-analytical and electronic measurement solutions to the life sciences, chemical analysis, communications and electronics industries. The three operating segments were determined based primarily on how the chief operating decision maker views and evaluates our operations. Operating results are regularly reviewed by the chief operating decision maker to make decisions about resources to be allocated to the segment and to assess its performance. Other factors, including market separation and customer specific applications, go-to-market channels, products and services and manufacturing are considered in determining the formation of these operating segments.
A description of our three reportable segments is as follows:
Our life sciences business provides application-focused solutions that include instruments, software, consumables, and services that enable customers to identify, quantify and analyze the physical and biological properties of substances and products. Key product categories in life sciences include: DNA and RNA microarrays and associated scanner, software, and reagents; microfluidics-based sample analysis systems; liquid chromatography systems, columns and components; liquid chromatography mass spectrometry systems; capillary electrophoresis systems; laboratory software and informatics systems; bio-reagents and related products; laboratory automation and robotic systems, dissolution testing; Nuclear Magnetic Resonance and Magnetic Resonance Imaging systems along with X-Ray crystallography, and services and support for the aforementioned products.
Our chemical analysis business provides application-focused solutions that include instruments, software, consumables, and services that enable customers to identify, quantify and analyze the physical and biological properties of substances and products. Key product categories in chemical analysis include: gas chromatography systems, columns and components; gas chromatography mass spectrometry systems; inductively coupled plasma mass spectrometry instruments; atomic absorption instruments; inductively coupled plasma optical emission spectrometry instruments; software and data systems; vacuum pumps and measurement technologies; services and support for our products.

80
Our electronic measurement business provides electronic measurement instruments and systems, software design tools and related services that are used in the design, development, manufacture, installation, deployment and operation of electronics equipment, and microscopy products. Related services include start-up assistance, instrument productivity and application services and instrument calibration and repair. We also offer customization, consulting and optimization services throughout the customer’s product lifecycle.
A significant portion of the segments’ expenses arise from shared services and infrastructure that we have historically provided to the segments in order to realize economies of scale and to efficiently use resources. These expenses, collectively called corporate charges, include costs of centralized research and development, legal, accounting, real estate, insurance services, information technology services, treasury and other corporate infrastructure expenses. Charges are allocated to the segments, and the allocations have been determined on a basis that we consider to be a reasonable reflection of the utilization of services provided to or benefits received by the segments.
The following tables reflect the results of our reportable segments under our management reporting system. These results are not necessarily in conformity with U.S. GAAP. The performance of each segment is measured based on several metrics, including adjusted income from operations. These results are used, in part, by the chief operating decision maker in evaluating the performance of, and in allocating resources to, each of the segments.
The profitability of each of the segments is measured after excluding restructuring and asset impairment charges, investment gains and losses, interest income, interest expense, acquisition and integration costs, non-cash amortization and other items as noted in the reconciliations below.
Life SciencesChemical Analysis
Electronic Measurement
Total Segments
(in millions)
Year ended October 31, 2011:Total segment revenue. . . . . . . . . . . . . . . . . . . . . . . $1,792 $ 1,518 $3,316 $6,626Varian acquisition deferred revenue
fair value adjustment . . . . . . . . . . . . . . . . . . . . . $ (4) $ (7) — $ (11)
Total net revenue . . . . . . . . . . . . . . . . . . . . . . . . . . . $1,788 $ 1,511 $3,316 $ 6,615
Income from operations . . . . . . . . . . . . . . . . . . . . . $ 237 $ 313 $ 760 $ 1,310Depreciation expense . . . . . . . . . . . . . . . . . . . . . . . $ 39 $ 28 $ 75 $ 142Share-based compensation expense . . . . . . . . . . . $ 20 $ 17 $ 36 $ 73
Year ended October 31, 2010:Total segment revenue. . . . . . . . . . . . . . . . . . . . . . . $1,479 $1,200 $2,784 $5,463Varian acquisition deferred revenue
fair value adjustment . . . . . . . . . . . . . . . . . . . . . $ (15) $ (4) $ — $ (19)
Total net revenue . . . . . . . . . . . . . . . . . . . . . . . . . . . $1,464 $ 1,196 $2,784 $5,444
Income from operations . . . . . . . . . . . . . . . . . . . . . $ 221 $ 279 $ 438 $ 938Depreciation expense . . . . . . . . . . . . . . . . . . . . . . . $ 34 $ 24 $ 66 $ 124Share-based compensation expense . . . . . . . . . . . $ 17 $ 13 $ 34 $ 64
Year ended October 31, 2009:Total net revenue . . . . . . . . . . . . . . . . . . . . . . . . . . . $1,219 $ 844 $2,418 $4,481Income from operations . . . . . . . . . . . . . . . . . . . . . $ 174 $ 216 $ 1 $ 391Depreciation expense . . . . . . . . . . . . . . . . . . . . . . . $ 27 $ 14 $ 71 $ 112Share-based compensation expense . . . . . . . . . . . $ 18 $ 12 $ 36 $ 66

Annu
al R
epor
t Fin
anci
als
81
The following table reconciles reportable segments’ income from operations to Agilent’s total enterprise income before taxes:
Years Ended October 31,
2011 2010 2009
(in millions)
Total reportable segments’ income from operations . . . . . . . . . . . . . . . . . $1,310 $ 938 $ 391Restructuring related costs . . . . . . . . . . . . . . . . . . . . . . . . . . . . . . . . . . . . . . (2) (65) (252)Asset Impairments . . . . . . . . . . . . . . . . . . . . . . . . . . . . . . . . . . . . . . . . . . . . . (9) (19) (44)Transformational programs . . . . . . . . . . . . . . . . . . . . . . . . . . . . . . . . . . . . . (51) (39) —Amortization of intangibles . . . . . . . . . . . . . . . . . . . . . . . . . . . . . . . . . . . . . . (113) (77) (45)Retirement plans net curtailment and settlement . . . . . . . . . . . . . . . . . . . 1 — 16Acquisition and integration costs . . . . . . . . . . . . . . . . . . . . . . . . . . . . . . . . . (54) (102) —Varian acquisition related fair value adjustments . . . . . . . . . . . . . . . . . . . (9) (51) —Other . . . . . . . . . . . . . . . . . . . . . . . . . . . . . . . . . . . . . . . . . . . . . . . . . . . . . . . . . (2) (19) (19)Interest Income . . . . . . . . . . . . . . . . . . . . . . . . . . . . . . . . . . . . . . . . . . . . . . . . 14 20 29Interest Expense . . . . . . . . . . . . . . . . . . . . . . . . . . . . . . . . . . . . . . . . . . . . . . . (86) (96) (88)Gain on sale of network solutions division, net . . . . . . . . . . . . . . . . . . . . . — 132 —Other income (expense), net . . . . . . . . . . . . . . . . . . . . . . . . . . . . . . . . . . . . . 33 70 19
Income before taxes, as reported . . . . . . . . . . . . . . . . . . . . . . . . . . . . . . . . . $1,032 $ 692 $ 7
Major customers. No customer represented 10 percent or more of our total net revenue in 2011, 2010 or 2009.
The following table presents assets and capital expenditures directly managed by each segment. Unallocated assets primarily consist of cash, cash equivalents, accumulated amortization of other intangibles, the valuation allowance relating to deferred tax assets and other assets.
Life SciencesChemical Analysis
Electronic Measurement
Total Segments
(in millions)
As of October 31, 2011:Assets . . . . . . . . . . . . . . . . . . . . . . . . . . . . . . . . . . . . . $1,837 $1,772 $2,156 $ 5,765Capital expenditures . . . . . . . . . . . . . . . . . . . . . . . . . $ 41 $ 23 $ 124 $ 188
As of October 31, 2010:Assets . . . . . . . . . . . . . . . . . . . . . . . . . . . . . . . . . . . . . $1,564 $1,635 $2,245 $5,444Capital expenditures . . . . . . . . . . . . . . . . . . . . . . . . . $ 30 $ 15 $ 76 $ 121

82
The following table reconciles segment assets to Agilent’s total assets:
October 31,
2011 2010
(in millions)
Total reportable segments’ assets . . . . . . . . . . . . . . . . . . . . . . . . . . . . $ 5,765 $5,444Cash, cash equivalents and short-term investments. . . . . . . . . . . . . 3,527 4,199Prepaid expenses. . . . . . . . . . . . . . . . . . . . . . . . . . . . . . . . . . . . . . . . . . 107 118Investments . . . . . . . . . . . . . . . . . . . . . . . . . . . . . . . . . . . . . . . . . . . . . . 114 135Long-term and other receivables . . . . . . . . . . . . . . . . . . . . . . . . . . . . . 221 283Other, including valuation allowance . . . . . . . . . . . . . . . . . . . . . . . . . (677) (483)
Total assets . . . . . . . . . . . . . . . . . . . . . . . . . . . . . . . . . . . . . . . . . . . . . . . $9,057 $9,696
The following table presents summarized information for net revenue and long-lived assets by geographic region for continuing operations. Long lived assets consist of property, plant, and equipment, long-term receivables and other long-term assets excluding intangible assets. The rest of the world primarily consists of Southeast Asia and Europe.
United States China Japan
Rest of the
World Total
(in millions)
Net revenue:Year ended October 31, 2011 . . . . . . . . . . . . . . $2,016 $1,035 $700 $2,864 $ 6,615Year ended October 31, 2010 . . . . . . . . . . . . . . $1,760 $ 744 $549 $2,391 $5,444Year ended October 31, 2009. . . . . . . . . . . . . . $1,495 $ 598 $ 476 $ 1,912 $ 4,481
United States Japan
Rest of the
World Total
(in millions)
Long-lived assets:October 31, 2011 . . . . . . . . . . . . . . . . . . . . . . . . . . . . . . . $567 $ 170 $551 $1,288October 31, 2010 . . . . . . . . . . . . . . . . . . . . . . . . . . . . . . . $654 $180 $515 $1,349

Annu
al R
epor
t Fin
anci
als
83
QUARTERLY SUMMARY
(Unaudited)
Three Months Ended
January 31, April 30, July 31, October 31,
(in millions, except per share data)
2011Net revenue. . . . . . . . . . . . . . . . . . . . . . . . . . . . $ 1,519 $ 1,677 $ 1,691 $ 1,728Gross profit. . . . . . . . . . . . . . . . . . . . . . . . . . . . 816 900 892 921Income from operations . . . . . . . . . . . . . . . . . 211 266 281 313
Net income . . . . . . . . . . . . . . . . . . . . . . . . . . $ 193 $ 200 $ 330 $ 289Net income per share — Basic: . . . . . . . . . . . $ 0.56 $ 0.58 $ 0.95 $ 0.83Net income per share — Diluted: . . . . . . . . . $ 0.54 $ 0.56 $ 0.92 $ 0.82Weighted average shares used in
computing net income per share:Basic . . . . . . . . . . . . . . . . . . . . . . . . . . . . . . . 347 347 348 347Diluted. . . . . . . . . . . . . . . . . . . . . . . . . . . . . . 355 355 357 351
Range of stock prices on NYSE . . . . . . . . . . . $34.38-44.45 $39.94-50.68 $41.29-55.33 $28.67-42.782010Net revenue. . . . . . . . . . . . . . . . . . . . . . . . . . . . $ 1,213 $ 1,271 $ 1,384 $ 1,576Gross profit. . . . . . . . . . . . . . . . . . . . . . . . . . . . 660 711 725 834Income from operations . . . . . . . . . . . . . . . . . 94 154 115 203
Net income . . . . . . . . . . . . . . . . . . . . . . . . . . $ 79 $ 108 $ 205 $ 292Net income per share — Basic: . . . . . . . . . . . $ 0.23 $ 0.31 $ 0.59 $ 0.84Net income per share — Diluted: . . . . . . . . . $ 0.22 $ 0.31 $ 0.58 $ 0.83Weighted average shares used in
computing net income per share:Basic . . . . . . . . . . . . . . . . . . . . . . . . . . . . . . . 348 348 347 346Diluted. . . . . . . . . . . . . . . . . . . . . . . . . . . . . . 354 354 352 352
Range of stock prices on NYSE . . . . . . . . . . . $ 24.69-31.77 $28.13-37.43 $26.74-36.89 $26.68-35.33

84
RISKS, UNCERTAINTIES AND OTHER FACTORS THAT MAY AFFECT FUTURE RESULTS
Depressed general economic conditions may adversely affect our operating results and financial condition.
Our business is sensitive to changes in general economic conditions, both inside and outside the U.S. An economic downturn may adversely impact our business resulting in:
•reduceddemandforourproductsandincreasesinordercancellations;
•increasedriskofexcessandobsoleteinventories;
•increasedpricepressureforourproductsandservices;
•reducedaccesstothecreditmarketstomeetshorttermcashneedsintheU.S.;and
•greaterriskofimpairmenttothevalue,andadetrimenttotheliquidity,ofourinvestmentportfolio.
Our operating results and financial condition could be harmed if the markets into which we sell our products decline or do not grow as anticipated.
Visibility into our markets is limited. Our quarterly sales and operating results are highly dependent on the volume and timing of orders received during the fiscal quarter, which are difficult to forecast and may be cancelled by our customers. In addition, our revenues and earnings forecasts for future fiscal quarters are often based on the expected seasonality or cyclicality of our markets. However, the markets we serve do not always experience the seasonality or cyclicality that we expect. Any decline in our customers’ markets or in general economic conditions, including declines related to the current market disruptions described above, would likely result in a reduction in demand for our products and services. For example, we experienced weakness in almost all sectors during 2009 due to declines in market activity caused largely by the continued global economic downturn. The broader semiconductor market is one of the drivers for our electronic measurement business, and therefore, a decrease in the semiconductor market could harm our electronic measurement business. Also, if our customers’ markets decline, we may not be able to collect on outstanding amounts due to us. Such declines could harm our consolidated financial position, results of operations, cash flows and stock price, and could limit our ability to sustain profitability. Also, in such an environment, pricing pressures could intensify. Since a significant portion of our operating expenses is relatively fixed in nature due to sales, research and development and manufacturing costs, if we were unable to respond quickly enough these pricing pressures could further reduce our operating margins.
If we do not introduce successful new products and services in a timely manner, our products and services will become obsolete, and our operating results will suffer.
We generally sell our products in industries that are characterized by rapid technological changes, frequent new product and service introductions and changing industry standards. In addition, many of the markets in which we operate are seasonal and cyclical. Without the timely introduction of new products, services and enhancements, our products and services will become technologically obsolete over time, in which case our revenue and operating results would suffer. The success of our new products and services will depend on several factors, including our ability to:
•properlyidentifycustomerneeds;
•innovateanddevelopnewtechnologies,servicesandapplications;

Annu
al R
epor
t Fin
anci
als
85
•successfullycommercializenewtechnologiesinatimelymanner;
•manufactureanddeliverourproductsinsufficientvolumesontime;
•differentiateourofferingsfromourcompetitors’offerings;
•priceourproductscompetitively;
•anticipateourcompetitors’developmentofnewproducts,servicesortechnologicalinnovations; and
•controlproductqualityinourmanufacturingprocess.
Dependence on contract manufacturing and outsourcing other portions of our supply chain may adversely affect our ability to bring products to market and damage our reputation. Dependence on outsourced information technology and other administrative functions may impair our ability to operate effectively.
As part of our efforts to streamline operations and to cut costs, we have been outsourcing aspects of our manufacturing processes and other functions and will continue to evaluate additional outsourcing. If our contract manufacturers or other outsourcers fail to perform their obligations in a timely manner or at satisfactory quality levels, our ability to bring products to market and our reputation could suffer. For example, during a market upturn, our contract manufacturers may be unable to meet our demand requirements, which may preclude us from fulfilling our customers’ orders on a timely basis. The ability of these manufacturers to perform is largely outside of our control. In addition, we outsource significant portions of our information technology (“IT”) function and other administrative functions. Since IT is critical to our operations, any failure to perform on the part of the IT providers could impair our ability to operate effectively. In addition to the risks outlined above, problems with manufacturing or IT outsourcing could result in lower revenues, unexecuted efficiencies, and impact our results of operations and our stock price. Much of our outsourcing takes place in developing countries and, as a result, may be subject to geopolitical uncertainty.
Failure to adjust our purchases due to changing market conditions or failure to estimate our customers’ demand could adversely affect our income.
Our income could be harmed if we are unable to adjust our purchases to market fluctuations, including those caused by the seasonal or cyclical nature of the markets in which we operate. The sale of our products and services are dependent, to a large degree, on customers whose industries are subject to seasonal or cyclical trends in the demand for their products. For example, the consumer electronics market is particularly volatile, making demand difficult to anticipate. During a market upturn, we may not be able to purchase sufficient supplies or components to meet increasing product demand, which could materially affect our results. In the past we have seen a shortage of parts for some of our products. In addition, some of the parts that require custom design are not readily available from alternate suppliers due to their unique design or the length of time necessary for design work. Should a supplier cease manufacturing such a component, we would be forced to reengineer our product. In addition to discontinuing parts, suppliers may also extend lead times, limit supplies or increase prices due to capacity constraints or other factors. In order to secure components for the production of products, we may continue to enter into non-cancelable purchase commitments with vendors, or at times make advance payments to suppliers, which could impact our ability to adjust our inventory to declining market demands. Prior commitments of this type have resulted in an excess of parts when demand for our communications and electronics products has decreased. If demand for our products is less than we expect, we may experience additional excess and obsolete inventories and be forced to incur additional charges.

86
Our operating results may suffer if our manufacturing capacity does not match the demand for our products.
Because we cannot immediately adapt our production capacity and related cost structures to rapidly changing market conditions, when demand does not meet our expectations, our manufacturing capacity will likely exceed our production requirements. If, during a general market upturn or an upturn in one of our segments, we cannot increase our manufacturing capacity to meet product demand, we will not be able to fulfill orders in a timely manner and could lead to order cancellations. This inability could materially and adversely limit our ability to improve our results. By contrast, if during an economic downturn we had excess manufacturing capacity, then our fixed costs associated with excess manufacturing capacity would adversely affect our income, margins, and operating results.
Economic, political and other risks associated with international sales and operations could adversely affect our results of operations.
Because we sell our products worldwide, our business is subject to risks associated with doing business internationally. We anticipate that revenue from international operations will continue to represent a majority of our total revenue. In addition, many of our employees, contract manufacturers, suppliers, job functions and manufacturing facilities are located outside the U.S. Accordingly, our future results could be harmed by a variety of factors, including:
•interruptiontotransportationflowsfordeliveryofpartstousandfinishedgoodstoourcustomers;
•changesinforeigncurrencyexchangerates;
•changesinaspecificcountry’sorregion’spolitical,economicorotherconditions;
•tradeprotectionmeasuresandimportorexportlicensingrequirements;
•negativeconsequencesfromchangesintaxlaws;
•difficultyinstaffingandmanagingwidespreadoperations;
•differinglaborregulations;
•differingprotectionofintellectualproperty;
•unexpectedchangesinregulatoryrequirements;and
•geopoliticalturmoil,includingterrorismandwar.
We centralized most of our accounting processes to two locations: India and Malaysia. These processes include general accounting, cost accounting, accounts payable and accounts receivables functions. If conditions change in those countries, it may adversely affect operations, including impairing our ability to pay our suppliers and collect our receivables. Our results of operations, as well as our liquidity, may be adversely affected and possible delays may occur in reporting financial results.
Additionally, we must comply with complex foreign and U.S. laws and regulations, such as the U.S. Foreign Corrupt Practices Act, the U.K. Bribery Act, and other local laws prohibiting corrupt payments to governmental officials, and anti-competition regulations. Violations of these laws and regulations could result in fines and penalties, criminal sanctions, restrictions on our business conduct and on our ability to offer our products in one or more countries, and could also materially affect our brand, our ability to attract and retain employees, our international operations, our business and our operating results. Although we have implemented policies and procedures designed to ensure compliance with these laws and regulations, there can be no assurance that our employees, contractors, or agents will not violate our policies.

Annu
al R
epor
t Fin
anci
als
87
In addition, although the majority of our products are priced and paid for in U.S. dollars, a significant amount of certain types of expenses, such as payroll, utilities, tax, and marketing expenses, are paid in local currencies. Our hedging programs reduce, but do not always entirely eliminate, within any given twelve month period, the impact of currency exchange rate movements, and therefore fluctuations in exchange rates, including those caused by currency controls, could impact our business operating results and financial condition by resulting in lower revenue or increased expenses. However, for expenses beyond that twelve month period, our hedging strategy does not mitigate our exposure. In addition, our currency hedging programs involve third party financial institutions as counterparties. The weakening or failure of financial institution counterparties may adversely affect our hedging programs and our financial condition through, among other things, a reduction in available counterparties, increasingly unfavorable terms, and the failure of the counterparties to perform under hedging contracts.
Our business will suffer if we are not able to retain and hire key personnel.
Our future success depends partly on the continued service of our key research, engineering, sales, marketing, manufacturing, executive and administrative personnel. If we fail to retain and hire a sufficient number of these personnel, we will not be able to maintain or expand our business. The markets in which we operate are very dynamic, and our businesses continue to respond with reorganizations, workforce reductions and site closures. We believe our pay levels are very competitive within the regions that we operate. However, there is also intense competition for certain highly technical specialties in geographic areas where we continue to recruit, and it may become more difficult to retain our key employees, especially in light of our ongoing restructuring efforts.
If we do not achieve the contemplated benefits of our acquisition of Varian, Inc., our business and financial condition may be materially impaired.
We may not achieve the desired benefits from our acquisition of Varian. The acquisition involves the integration of Varian with the rest of our company. If we cannot successfully integrate Varian’s operations, we may experience material negative consequences to our business, financial condition or results of operations. The integration of two businesses that have previously operated separately will be a costly and time-consuming process that will involve a number of risks, including, but not limited to:
•diversionofseniormanagement’sattentionfromthemanagementofdailyoperationstotheintegration of operations;
•difficultiesintheassimilationofdifferentpracticesandsalesanddistributionmethodologies, as well as in the assimilation and retention of geographically dispersed, decentralized operations and personnel;
•difficultiesandunanticipatedexpensesrelatedtotheintegrationoffacilities,departments,systems, including accounting systems, computer and other technologies, books and records and procedures, as well as in maintaining uniform standards, including internal accounting controls, procedures and policies;
•difficultiesanduncertaintiesinachievinganticipatedcostreductionsandoperationalsynergies; and
•theuseofcashresourcesandincreasedcapitalexpendituresonintegrationandimplementation activities in excess of our current expectations, which could offset any such savings and other synergies resulting from the Varian acquisition and limit other potential uses of our cash, including stock repurchases and retirement of outstanding debt.

88
Even if we are able to successfully integrate the operations of Varian, we may not be able to realize the cost savings, synergies and growth that we anticipate from the acquisition in the time frame that we currently expect, and the costs of achieving these benefits may be higher than what we currently expect, because of a number of risks, including, but not limited to:
•thepossibilitythattheacquisitionmaynotfurtherourbusinessstrategyasweexpected;
•thefactthattheacquisitionwillsubstantiallyexpandourlifesciencesandchemicalanalysisbusinesses, and we may not experience anticipated growth in that market; and
•theriskofintellectualpropertydisputeswithrespecttoVarian’sproducts.
As a result of these risks, the Varian acquisition may not contribute to our earnings as expected, we may not achieve expected cost synergies or our return on invested capital targets when expected, or at all, and we may not achieve the other anticipated strategic and financial benefits of this transaction.
Our acquisitions, strategic alliances, joint ventures and divestitures may result in financial results that are different than expected.
In the normal course of business, we frequently engage in discussions with third parties relating to possible acquisitions, strategic alliances, joint ventures and divestitures, and generally expect to complete several transactions per year. For example, during fiscal 2010, we closed our acquisition of Varian, Inc. and the sale of our Network Solutions Division. During fiscal 2011, we completed the acquisitions of A2 Technologies, Lab901 and Biocius Life Sciences Inc. During fiscal 2012, we announced our acquisitions of Accelicon Technologies, BioSystem Development LLC and Halo Genomics AB. As a result of such transactions, our financial results may differ from our own or the investment community’s expectations in a given fiscal quarter, or over the long term. Such transactions often have post-closing arrangements including but not limited to post-closing adjustments, transition services, escrows or indemnifications, the financial results of which can be difficult to predict. In addition, acquisitions, including the Varian acquisition, and strategic alliances may require us to integrate a different company culture, management team and business infrastructure. We may have difficulty developing, manufacturing and marketing the products of a newly acquired company in a way that enhances the performance of our combined businesses or product lines to realize the value from expected synergies. Depending on the size and complexity of an acquisition, our successful integration of the entity depends on a variety of factors, including:
•theretentionofkeyemployees;
•themanagementoffacilitiesandemployeesindifferentgeographicareas;
•theretentionofkeycustomers;
•thecompatibilityofoursalesprogramsandfacilitieswiththoseoftheacquiredcompany;and
•thecompatibilityofourexistinginfrastructurewiththatofanacquiredcompany.
In addition, effective internal controls are necessary for us to provide reliable and accurate financial reports and to effectively prevent fraud. The integration of acquired businesses is likely to result in our systems and controls becoming increasingly complex and more difficult to manage. We devote significant resources and time to comply with the internal control over financial reporting requirements of the Sarbanes-Oxley Act of 2002. However, we cannot be certain that these measures will ensure that we design, implement and maintain adequate control over our financial processes and reporting in the future, especially in the context of acquisitions of other businesses. Any difficulties in the assimilation of acquired businesses into our control system could harm our
Annu
al R
epor
t Fin
anci
als
89
operating results or cause us to fail to meet our financial reporting obligations. Inferior internal controls could also cause investors to lose confidence in our reported financial information, which could have a negative effect on the trading price of our stock and our access to capital.
A successful divestiture depends on various factors, including our ability to:
•effectivelytransferliabilities,contracts,facilitiesandemployeestothepurchaser;
•identifyandseparatetheintellectualpropertytobedivestedfromtheintellectualpropertythat we wish to keep; and
•reducefixedcostspreviouslyassociatedwiththedivestedassetsorbusiness.
In addition, if customers of the divested business do not receive the same level of service from the new owners, this may adversely affect our other businesses to the extent that these customers also purchase other Agilent products. All of these efforts require varying levels of management resources, which may divert our attention from other business operations. Further, if market conditions or other factors lead us to change our strategic direction, we may not realize the expected value from such transactions. If we do not realize the expected benefits or synergies of such transactions, our consolidated financial position, results of operations, cash flows and stock price could be negatively impacted.
The impact of consolidation of competitors in the electronic measurement and life sciences markets is difficult to predict and may harm our business.
The electronic measurement and life sciences industries are intensely competitive and have been subject to increasing consolidation. For instance, in June 2011, Danaher Corporation completed its acquisition of Beckman Coulter, Inc., and in August 2011, Thermo Fisher Scientific completed its acquisition of Phadia. Consolidation in the electronic measurement and life sciences industries could result in existing competitors increasing their market share through business combinations, which could have a material adverse effect on our business, financial condition and results of operations. We may not be able to compete successfully in an increasingly consolidated industry and cannot predict with certainty how industry consolidation will affect our competitors or us.
Environmental contamination from past operations could subject us to unreimbursed costs and could harm on-site operations and the future use and value of the properties involved and environmental contamination caused by ongoing operations could subject us to substantial liabilities in the future.
Some of our properties are undergoing remediation by the Hewlett-Packard Company (“HP”) for subsurface contaminations that were known at the time of our separation from HP. HP has agreed to retain the liability for this subsurface contamination, perform the required remediation and indemnify us with respect to claims arising out of that contamination. HP will have access to our properties to perform remediation. While HP has agreed to minimize interference with on-site operations at those properties, remediation activities and subsurface contamination may require us to incur unreimbursed costs and could harm on-site operations and the future use and value of the properties. We cannot be sure that HP will continue to fulfill its indemnification or remediation obligations. In addition, the determination of the existence and cost of any additional contamination caused by us could involve costly and time-consuming negotiations and litigation.
We have agreed to indemnify HP for any liability associated with contamination from past operations at all other properties transferred from HP to us, other than those properties currently undergoing remediation by HP. While we are not aware of any material liabilities associated with any potential subsurface contamination at any of those properties, subsurface contamination may exist, and we may be exposed to material liability as a result of the existence of that contamination.

90
Our current and historical manufacturing processes involve, or have involved, the use of substances regulated under various international, federal, state and local laws governing the environment. As a result, we may become subject to liabilities for environmental contamination, and these liabilities may be substantial. While we have divested substantially all of our semiconductor related businesses to Avago and Verigy and regardless of indemnification arrangements with those parties, we may still become subject to liabilities for historical environmental contamination related to those businesses. Although our policy is to apply strict standards for environmental protection at our sites inside and outside the U.S., even if the sites outside the U.S. are not subject to regulations imposed by foreign governments, we may not be aware of all conditions that could subject us to liability.
As part of our acquisition of Varian, we assumed the liabilities of Varian, including Varian’s costs and potential liabilities for environmental matters. One such cost is our obligation, along with the obligation of Varian Semiconductor Equipment Associates, Inc. (“VSEA”) (under the terms of a Distribution Agreement between Varian, VSEA and Varian Medical Systems, Inc. (“VMS”)) to each indemnify VMS for one-third of certain costs (after adjusting for any insurance proceeds and tax benefits recognized or realized by VMS for such costs) relating to (a) environmental investigation, monitoring and/or remediation activities at certain facilities previously operated by Varian Associates, Inc. (“VAI”) and third-party claims made in connection with environmental conditions at those facilities, and (b) U.S. Environmental Protection Agency or third-party claims alleging that VAI or VMS is a potentially responsible party under the Comprehensive Environmental Response Compensation and Liability Act of 1980, as amended (“CERCLA”) in connection with certain sites to which VAI allegedly shipped manufacturing waste for recycling, treatment or disposal (the “CERCLA sites”). With respect to the facilities formerly operated by VAI, VMS is overseeing the environmental investigation, monitoring and/or remediation activities, in most cases under the direction of, or in consultation with, federal, state and/or local agencies, and handling third-party claims. VMS is also handling claims relating to the CERCLA sites. Although any ultimate liability arising from environmental- related matters could result in significant expenditures that, if aggregated and assumed to occur within a single fiscal year, could be material to our financial statements, the likelihood of such occurrence is considered remote. Based on information currently available and our best assessment of the ultimate amount and timing of environmental-related events, management believes that the costs of environmental-related matters are unlikely to have a material adverse effect on our financial condition or results of operations.
Our customers and we are subject to various governmental regulations, compliance with which may cause us to incur significant expenses, and if we fail to maintain satisfactory compliance with certain regulations, we may be forced to recall products and cease their manufacture and distribution, and we could be subject to civil or criminal penalties.
Our businesses are subject to various significant international, federal, state and local regulations, including but not limited to health and safety, packaging, product content, labor and import/export regulations. These regulations are complex, change frequently and have tended to become more stringent over time. We may be required to incur significant expenses to comply with these regulations or to remedy violations of these regulations. Any failure by us to comply with applicable government regulations could also result in cessation of our operations or portions of our operations, product recalls or impositions of fines and restrictions on our ability to carry on or expand our operations. In addition, because many of our products are regulated or sold into regulated industries, we must comply with additional regulations in marketing our products.
Our products and operations are also often subject to the rules of industrial standards bodies, like the International Standards Organization, as well as regulation by other agencies such as the U.S. Federal Communications Commission. We also must comply with work safety rules. If we fail to adequately address any of these regulations, our businesses could be harmed.

Annu
al R
epor
t Fin
anci
als
91
Some of our chemical analysis products are used in conjunction with chemicals whose manufacture, processing, distribution and notification requirements are regulated by the U.S. Environmental Protection Agency under the Toxic Substances Control Act, and by regulatory bodies in other countries with laws similar to the Toxic Substances Control Act. We must conform the manufacturing, processing, distribution of and notification about these chemicals to these laws and adapt to regulatory requirements in all countries as these requirements change. If we fail to comply with these requirements in the manufacture or distribution of our products, then we could be made to pay civil penalties, face criminal prosecution and, in some cases, be prohibited from distributing our products in commerce until the products or component substances are brought into compliance.
A number of our products from our life sciences and chemical analysis businesses are subject to regulation by the United States Food and Drug Administration (“FDA”) and certain similar foreign regulatory agencies. In addition, a number of our products may be in the future subject to regulation by the FDA and certain similar foreign regulatory agencies. If we or any of our suppliers or distributors fail to comply with FDA and other applicable regulatory requirements or are perceived to potentially have failed to comply, we may face, among other things, adverse publicity affecting both us and our customers, investigations or notices of non compliance, fines, injunctions, and civil penalties; partial suspensions or total shutdown of production facilities or the imposition of operating restrictions; increased difficulty in obtaining required FDA clearances or approvals; seizures or recalls of our products or those of our customers; or the inability to sell our products.
Our business may suffer if we fail to comply with government contracting laws and regulations.
We derive a portion of our revenues from direct and indirect sales to U.S., state, local, and foreign governments and their respective agencies. Such contracts are subject to various procurement laws and regulations, and contract provisions relating to their formation, administration and performance. Failure to comply with these laws, regulations or provisions in our government contracts could result in the imposition of various civil and criminal penalties, termination of contracts, forfeiture of profits, suspension of payments, or suspension from future government contracting. If our government contracts are terminated, if we are suspended from government work, or if our ability to compete for new contracts is adversely affected, our business could suffer.
Our retirement and post retirement pension plans are subject to financial market risks that could adversely affect our future results of operations and cash flows.
We have significant retirement and post retirement pension plans assets and obligations. The performance of the financial markets and interest rates impact our plan expenses and funding obligations. Significant decreases in market interest rates, decreases in the fair value of plan assets and investment losses on plan assets will increase our funding obligations, and adversely impact our results of operations and cash flows.
Third parties may claim that we are infringing their intellectual property and we could suffer significant litigation or licensing expenses or be prevented from selling products or services.
From time to time, third parties may claim that one or more of our products or services infringe their intellectual property rights. We analyze and take action in response to such claims on a case by case basis. Any dispute or litigation regarding patents or other intellectual property could be costly and time-consuming due to the complexity of our technology and the uncertainty of intellectual property litigation and could divert our management and key personnel from our

92
business operations. A claim of intellectual property infringement could force us to enter into a costly or restrictive license agreement, which might not be available under acceptable terms or at all, could require us to redesign our products, which would be costly and time-consuming, and/or could subject us to significant damages or to an injunction against development and sale of certain of our products or services. Our intellectual property portfolio may not be useful in asserting a counterclaim, or negotiating a license, in response to a claim of intellectual property infringement. In certain of our businesses we rely on third party intellectual property licenses and we cannot ensure that these licenses will be available to us in the future on favorable terms or at all.
Third parties may infringe our intellectual property and we may suffer competitive injury or expend significant resources enforcing our rights.
Our success depends in large part on our proprietary technology. We rely on various intellectual property rights, including patents, copyrights, trademarks and trade secrets, as well as confidentiality provisions and licensing arrangements, to establish our proprietary rights. If we do not enforce our intellectual property rights successfully our competitive position may suffer which could harm our operating results.
Our pending patent applications, and our pending copyright and trademark registration applications, may not be allowed or competitors may challenge the validity or scope of our patents, copyrights or trademarks. In addition, our patents, copyrights, trademarks and other intellectual property rights may not provide us a significant competitive advantage.
We may need to spend significant resources monitoring our intellectual property rights and we may or may not be able to detect infringement by third parties. Our competitive position may be harmed if we cannot detect infringement and enforce our intellectual property rights quickly or at all. In some circumstances, we may choose to not pursue enforcement because an infringer has a dominant intellectual property position or for other business reasons. In addition, competitors might avoid infringement by designing around our intellectual property rights or by developing non-infringing competing technologies. Intellectual property rights and our ability to enforce them may be unavailable or limited in some countries which could make it easier for competitors to capture market share and could result in lost revenues. Furthermore, some of our intellectual property is licensed to others which allow them to compete with us using that intellectual property.
We are subject to ongoing tax examinations of our tax returns by the Internal Revenue Service and other tax authorities. An adverse outcome of any such audit or examination by the IRS or other tax authority could have a material adverse effect on our results of operations, financial condition and liquidity.
We are subject to ongoing tax examinations of our tax returns by the U.S. Internal Revenue Service and other tax authorities in various jurisdictions. We regularly assess the likelihood of adverse outcomes resulting from ongoing tax examinations to determine the adequacy of our provision for income taxes. These assessments can require considerable estimates and judgments. Intercompany transactions associated with the sale of inventory, services, intellectual property and cost share arrangements are complex and affect our tax liabilities. The calculation of our tax liabilities involves dealing with uncertainties in the application of complex tax laws and regulations in a multitude of jurisdictions. There can be no assurance that the outcomes from ongoing tax examinations will not have an adverse effect on our operating results and financial condition. A difference in the ultimate resolution of tax uncertainties from what is currently estimated could have an adverse effect on our operating results and financial condition.
Annu
al R
epor
t Fin
anci
als
93
If tax incentives change or cease to be in effect, our income taxes could increase significantly.
Agilent benefits from tax incentives extended to its foreign subsidiaries to encourage investment or employment. Several jurisdictions have granted Agilent tax incentives which require renewal at various times in the future. The incentives are conditioned on achieving various thresholds of investments and employment, or specific types of income. Agilent’s taxes could increase if the incentives are not renewed upon expiration. If Agilent cannot or does not wish to satisfy all or parts of the tax incentive conditions, we may lose the related tax incentive and could be required to refund tax incentives previously realized. As a result, our effective tax rate could be higher than it would have been had we maintained the benefits of the tax incentives.
We have substantial cash requirements in the United States while most of our cash is generated outside of the United States. The failure to maintain a level of cash sufficient to address our cash requirements in the United States could adversely affect our financial condition and results of operations.
Although the cash generated in the United States from our operations covers our normal operating requirements and debt service requirements, a substantial amount of additional cash is required for special purposes such as the satisfaction of our ongoing debt obligations, including our senior notes coming due in September 2012, the repurchases of our stock and acquisitions of third parties. Our business operating results, financial condition, and strategic initiatives could be adversely impacted if we were unable to address our U.S. cash requirements through (1) the efficient and timely repatriations of overseas cash or (2) other sources of cash obtained at an acceptable cost.
We have outstanding debt and may incur other debt in the future, which could adversely affect our financial condition, liquidity and results of operations.
We currently have outstanding an aggregate principal amount of $2.1 billion in senior unsecured notes. We also are a party to a five-year senior unsecured revolving credit facility which expires in October, 2016 and under which we may borrow up to $400 million. We may borrow additional amounts in the future and use the proceeds from any future borrowing for general corporate purposes, other future acquisitions, expansion of our business or repurchases of our outstanding shares of common stock.
Our incurrence of this debt, and increases in our aggregate levels of debt, may adversely affect our operating results and financial condition by, among other things:
•increasingourvulnerabilitytodownturnsinourbusiness,tocompetitivepressuresandtoadverse economic and industry conditions;
•requiringthededicationofanincreasedportionofourexpectedcashfromoperationstoservice our indebtedness, thereby reducing the amount of expected cash flow available for other purposes, including capital expenditures, acquisitions and stock repurchases; and
•limitingourflexibilityinplanningfor,orreactingto,changesinourbusinessandourindustry.
Our current revolving credit facility imposes restrictions on us, including restrictions on our ability to create liens on our assets and the ability of our subsidiaries to incur indebtedness, and requires us to maintain compliance with specified financial ratios. Our ability to comply with these ratios may be affected by events beyond our control. In addition, the indenture governing our senior notes contains covenants that may adversely affect our ability to incur certain liens or

94
engage in certain types of sale and leaseback transactions. If we breach any of the covenants and do not obtain a waiver from the lenders, then, subject to applicable cure periods, our outstanding indebtedness could be declared immediately due and payable.
If we suffer a loss to our factories, facilities or distribution system due to catastrophe, our operations could be seriously harmed.
Our factories, facilities and distribution system are subject to catastrophic loss due to fire, flood, terrorism or other natural or man-made disasters. In particular, several of our facilities could be subject to a catastrophic loss caused by earthquake due to their locations. Our production facilities, headquarters and Agilent Technologies Laboratories in California, and our production facilities in Japan, are all located in areas with above-average seismic activity. If any of these facilities were to experience a catastrophic loss, it could disrupt our operations, delay production, shipments and revenue and result in large expenses to repair or replace the facility. In addition, since we have consolidated our manufacturing facilities, we are more likely to experience an interruption to our operations in the event of a catastrophe in any one location. Although we carry insurance for property damage and business interruption, we do not carry insurance or financial reserves for interruptions or potential losses arising from earthquakes or terrorism. Also, our third party insurance coverage will vary from time to time in both type and amount depending on availability, cost and our decisions with respect to risk retention. Economic conditions and uncertainties in global markets may adversely affect the cost and other terms upon which we are able to obtain third party insurance. If our third party insurance coverage is adversely affected, or to the extent we have elected to self-insure, we may be at a greater risk that our operations will be harmed by a catastrophic loss.
Our results of operations, financial condition and liquidity could be adversely affected if our long-term leasehold counterparty becomes insolvent and the credit support on the leasehold transaction fails.
In February 2001, we sold a parcel of surplus land in San Jose, California for $287 million in cash. In August 2001, we completed a like-kind exchange by acquiring a long-term leasehold interest in several municipal properties in southern California for a total value of $289 million. In 2002, we received $237 million in non-refundable prepaid rent related to the leasehold interests described above. We contracted with a third party to provide credit protection for certain aspects of the transaction, including a future bankruptcy of the municipality. The current third party insurer is a subsidiary of American International Group Inc. (“AIG”) which experienced a credit rating downgrade by Moody’s Investors Service and Standard & Poor’s and has been the recipient of U.S. federal government sponsored loans. If the municipality was to become insolvent and the credit support on the transaction was to fail, our results of operations, financial condition and liquidity could be adversely affected.
Adverse conditions in the global banking industry and credit markets may adversely impact the value of our cash investments or impair our liquidity.
As of October 31, 2011, we had cash and cash equivalents of approximately $3.53 billion invested or held in a mix of money market funds, time deposit accounts and bank demand deposit accounts. Disruptions in the financial markets may, in some cases, result in an inability to access assets such as money market funds that traditionally have been viewed as highly liquid. Any failure of our counterparty financial institutions or funds in which we have invested may adversely impact our cash and cash equivalent positions and, in turn, our results and financial condition.

Annu
al R
epor
t Fin
anci
als
95
CONTROLS AND PROCEDURES
Evaluation of Disclosure Controls and Procedures
Our management has evaluated, under the supervision and with the participation of our Chief Executive Officer and Chief Financial Officer, the effectiveness of our disclosure controls and procedures as of October 31, 2011, pursuant to and as required by Rule 13a-15(b) under the Securities Exchange Act of 1934 (“Exchange Act”). Based on that evaluation, our Chief Executive Officer and Chief Financial Officer have concluded that, as of October 31, 2011, the company’s disclosure controls and procedures, as defined by Rule 13a-15(e) under the Exchange Act, were effective and designed to ensure that (i) information required to be disclosed in the company’s reports filed under the Exchange Act is recorded, processed, summarized and reported within the time periods specified in the SEC’s rules and forms, and (ii) information is accumulated and communicated to management, including the Chief Executive Officer and Chief Financial Officer, as appropriate to allow timely decisions regarding required disclosures.
Management’s Report on Internal Control over Financial Reporting
Our management is responsible for establishing and maintaining adequate internal control over financial reporting, as such term is defined in Exchange Act Rule 13a-15(f). Under the supervision and with the participation of our management, including our Chief Executive Officer and Chief Financial Officer, we conducted an evaluation of the effectiveness of our internal control over financial reporting based on the framework in Internal Control — Integrated Framework issued by the Committee of Sponsoring Organizations of the Treadway Commission. Based on the results of this evaluation, our management concluded that our internal control over financial reporting was effective as of October 31, 2011.
The effectiveness of our internal control over financial reporting as of October 31, 2011 has been audited by PricewaterhouseCoopers LLP, an independent registered public accounting firm, as stated in their report which appears in this annual report.
Changes in Internal Control Over Financial Reporting
There were no changes in our internal control over financial reporting that occurred during Agilent’s last fiscal quarter that have materially affected, or are reasonably likely to materially affect, our internal control over financial reporting.

This page is intentionally left blank.


© Agilent technologies, inc. 2012 www.agilent.com
225211_Agilednt_CVR & Tabs_R3.indd 6 1/30/12 3:35 PM