Embed Size (px)
Citation preview

Page 1
Wednesday, January 9, 2008Westin St. Francis HotelSan Francisco, CA
Agilent TechnologiesJP Morgan 26th Annual Healthcare Conference
Page 2
Adrian T. DillonExecutive Vice President, Finance and AdministrationChief Financial Officer
Agilent TechnologiesJP Morgan 26th Annual Healthcare Conference
Page 3
These presentations contain forward-looking statements (including, without limitation, statements regarding the enhancement of shareholder value, our reduction of infrastructure costs in connection with our restructuring efforts, our ongoing share repurchase program, and information and future guidance on our goals, priorities, orders, revenues, demand, growth opportunities, customer service and innovation plans, new product introductions, financial condition, earnings, liquidity, capital structure, operating performance, cost structure, cyclicality, the continued strengths and expected growth of the markets we sell into, operations, operating earnings, balance sheet models and our ability to be free cash flow positive under any normal economic environment) that involve risks and uncertainties that could cause results of Agilent to differ materially from management’s current expectations.
In addition, other risks that the company faces in running its operations include the ability to execute successfully through business cycles while it continues to implement cost reductions; the ability to meet and achieve the benefits of its cost-reduction goals and otherwise successfully adapt its cost structures to continuing changes in business conditions; ongoing competitive, pricing and gross margin pressures; the risk that our cost-cutting initiatives will impair our ability to develop products and remain competitive and to operate effectively; the impact of geopolitical uncertainties on our markets and our ability to conduct business; the ability to improve asset performance to adapt to changes in demand; the ability to successfully introduce new products at the right time, price and mix, and other risks detailed in the company's filings with the Securities and Exchange Commission, including our Annual Report on Form 10-K for the twelve-month period ended October 31, 2007.
The company assumes no obligation to update the information in these presentations. These presentations and the Q&A that follows include non-GAAP numbers. A presentation of the most directly comparable GAAP numbers and the reconciliations between the non-GAAP and GAAP numbers can be found at http://www.investor.agilent.com under “GAAP Reconciliations” and accompany this slide set.
Safe Harbor Statement
Page 4
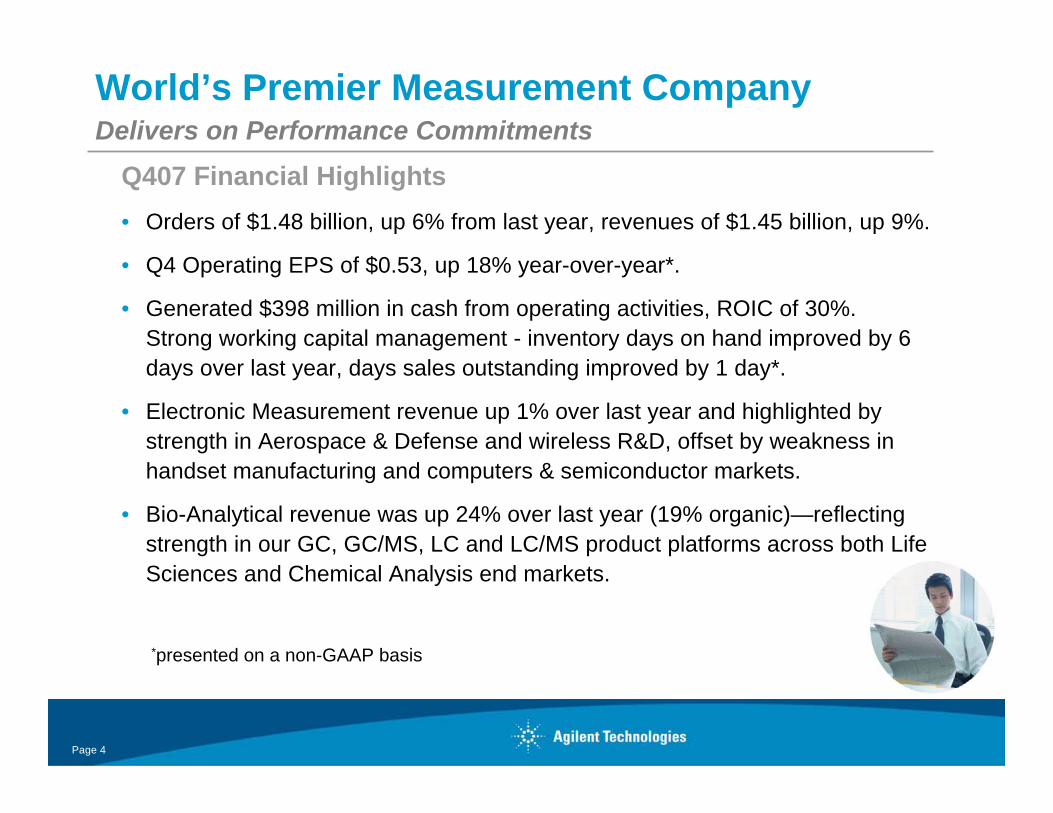
World’s Premier Measurement CompanyDelivers on Performance Commitments
Q407 Financial Highlights• Orders of $1.48 billion, up 6% from last year, revenues of $1.45 billion, up 9%.
• Q4 Operating EPS of $0.53, up 18% year-over-year*.
• Generated $398 million in cash from operating activities, ROIC of 30%. Strong working capital management - inventory days on hand improved by 6 days over last year, days sales outstanding improved by 1 day*.
• Electronic Measurement revenue up 1% over last year and highlighted by strength in Aerospace & Defense and wireless R&D, offset by weakness in handset manufacturing and computers & semiconductor markets.
• Bio-Analytical revenue was up 24% over last year (19% organic)—reflecting strength in our GC, GC/MS, LC and LC/MS product platforms across both Life Sciences and Chemical Analysis end markets.
*presented on a non-GAAP basis
Page 5
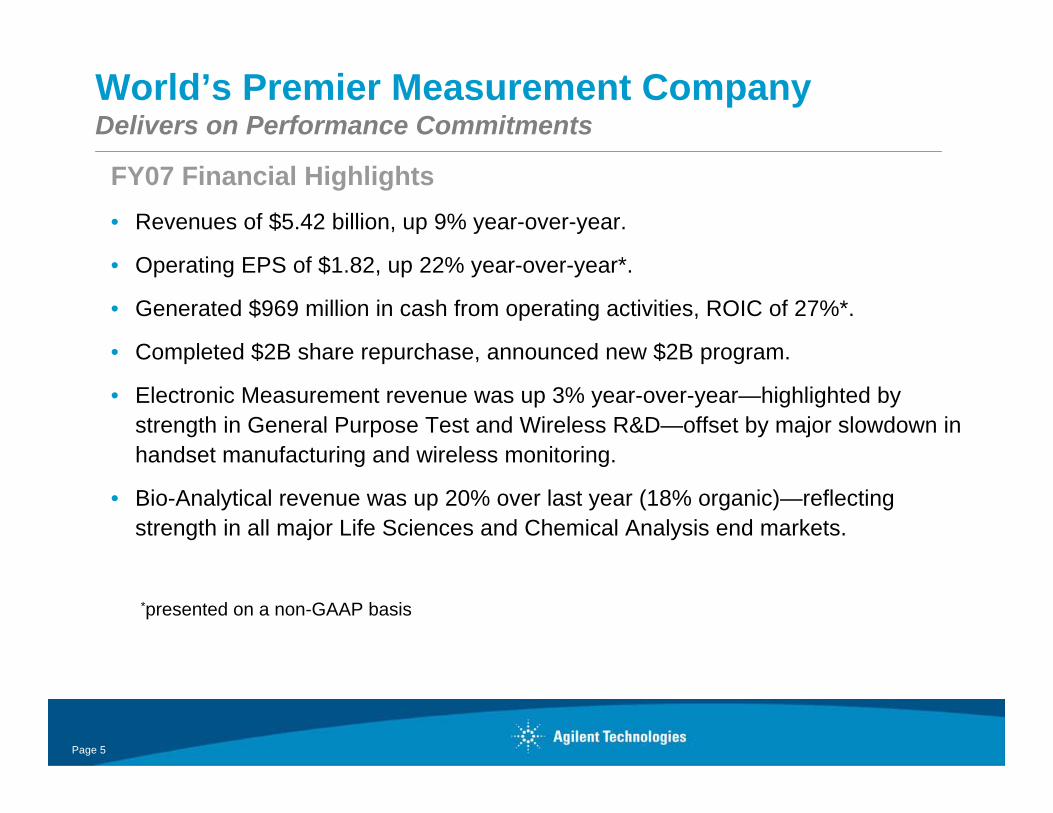
World’s Premier Measurement CompanyDelivers on Performance Commitments
FY07 Financial Highlights• Revenues of $5.42 billion, up 9% year-over-year.
• Operating EPS of $1.82, up 22% year-over-year*.
• Generated $969 million in cash from operating activities, ROIC of 27%*.
• Completed $2B share repurchase, announced new $2B program.
• Electronic Measurement revenue was up 3% year-over-year—highlighted by strength in General Purpose Test and Wireless R&D—offset by major slowdown in handset manufacturing and wireless monitoring.
• Bio-Analytical revenue was up 20% over last year (18% organic)—reflecting strength in all major Life Sciences and Chemical Analysis end markets.
*presented on a non-GAAP basis
Page 6
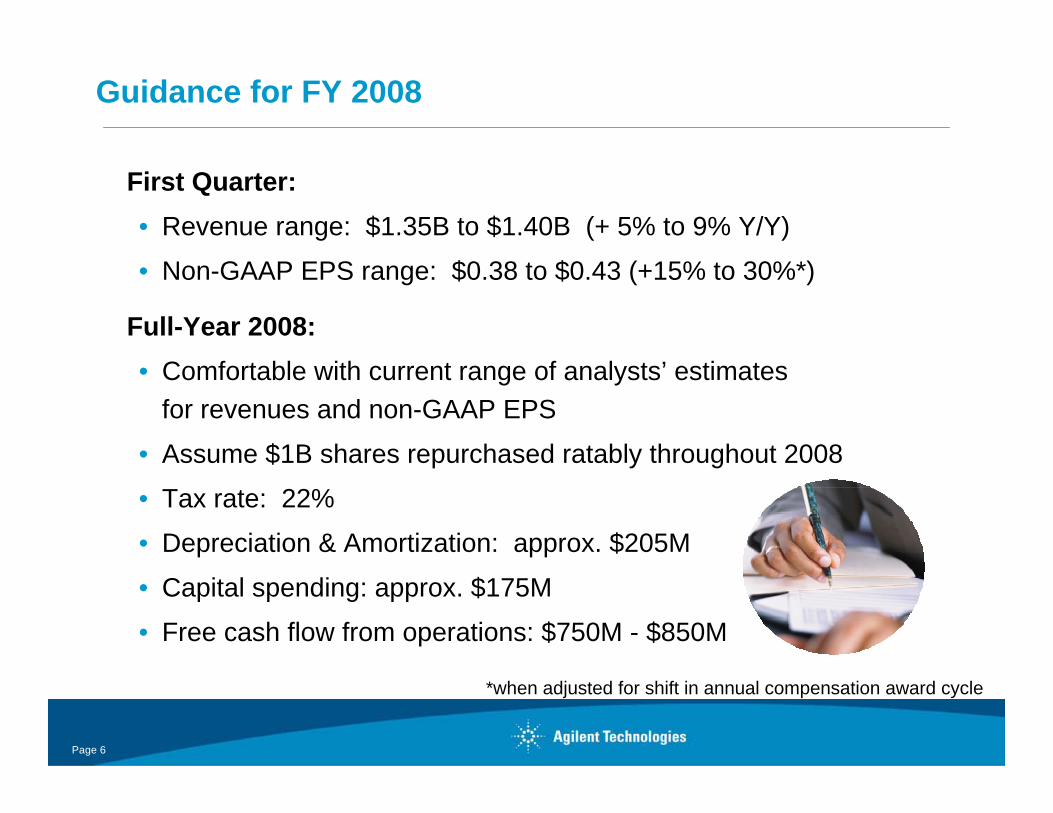
First Quarter:• Revenue range: $1.35B to $1.40B (+ 5% to 9% Y/Y)
• Non-GAAP EPS range: $0.38 to $0.43 (+15% to 30%*)
Full-Year 2008:• Comfortable with current range of analysts’ estimates
for revenues and non-GAAP EPS
• Assume $1B shares repurchased ratably throughout 2008
• Tax rate: 22%
• Depreciation & Amortization: approx. $205M
• Capital spending: approx. $175M
• Free cash flow from operations: $750M - $850M
Guidance for FY 2008
*when adjusted for shift in annual compensation award cycle
Page 7
FY06 Revenue$900 Million
FY06 Revenue$700 Million
FY06 Revenue$1.4 Billion
FY06 Revenue$2 Billion
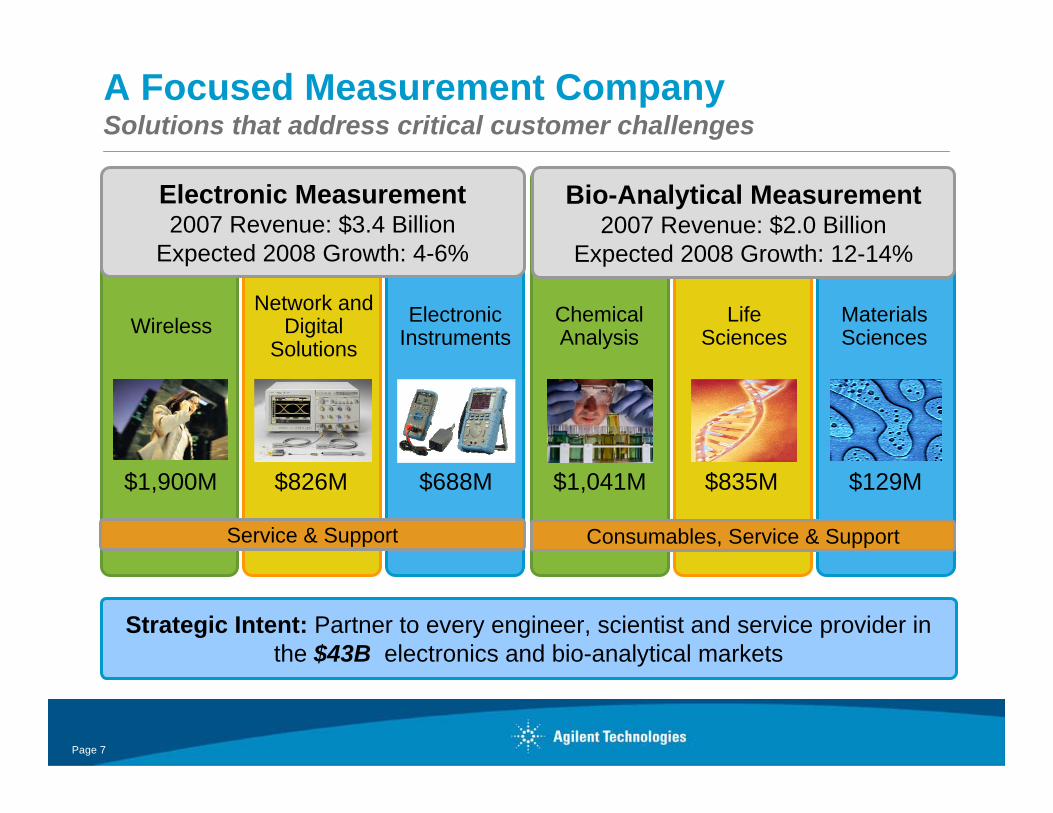
Materials Sciences
$129M
Chemical Analysis
$1,041M
Life Sciences
$835M
Consumables, Service & Support
Wireless
$1,900M
ElectronicInstruments
$688M
Electronic Measurement2007 Revenue: $3.4 Billion
Expected 2008 Growth: 4-6%
Bio-Analytical Measurement2007 Revenue: $2.0 Billion
Expected 2008 Growth: 12-14%
Network andDigital
Solutions
$826M
Service & Support
Strategic Intent: Partner to every engineer, scientist and service provider in the $43B electronics and bio-analytical markets
A Focused Measurement CompanySolutions that address critical customer challenges
Page 8
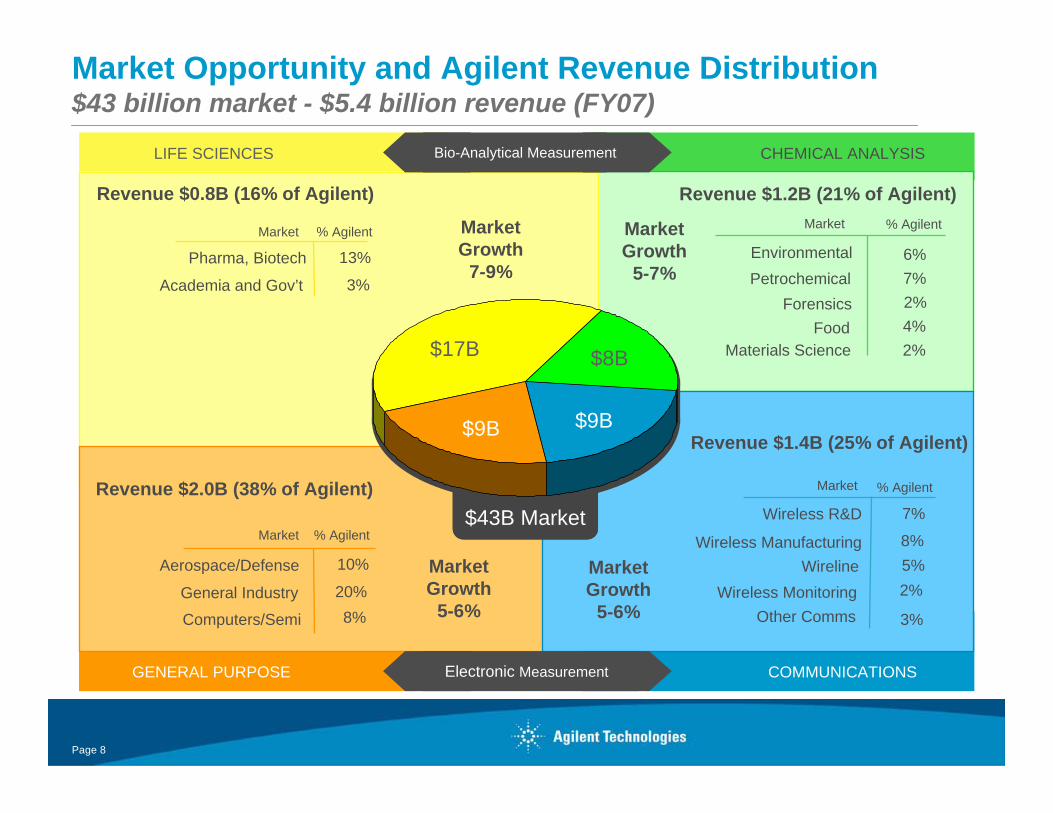
Market Opportunity and Agilent Revenue Distribution$43 billion market - $5.4 billion revenue (FY07)
GENERAL PURPOSE COMMUNICATIONS
LIFE SCIENCES CHEMICAL ANALYSISBio-Analytical Measurement
$6B$14B
$7.5B$13B
$40B Market
Revenue $1.4B (25% of Agilent)
Revenue $2.0B (38% of Agilent)
Revenue $1.2B (21% of Agilent)Revenue $0.8B (16% of Agilent)
Electronic Measurement
13% Pharma, Biotech
Academia and Gov’t 3%
Market % Agilent Market Growth
5-7%
% Agilent
FoodForensics
PetrochemicalEnvironmental
4% 2% 7% 6%
10% Aerospace/Defense
General Industry
Computers/Semi
20% 8%
% Agilent 8% Wireless Manufacturing
Wireless R&D
Wireless Monitoring
7%
2% Wireline 5%
Other Comms 3%
Market % Agilent
Materials Science 2%
Market Market Growth
7-9%
Market Growth
5-6%
Market
MarketGrowth
5-6%
$43B Market
$8B$17B
$9B $9B
Page 9
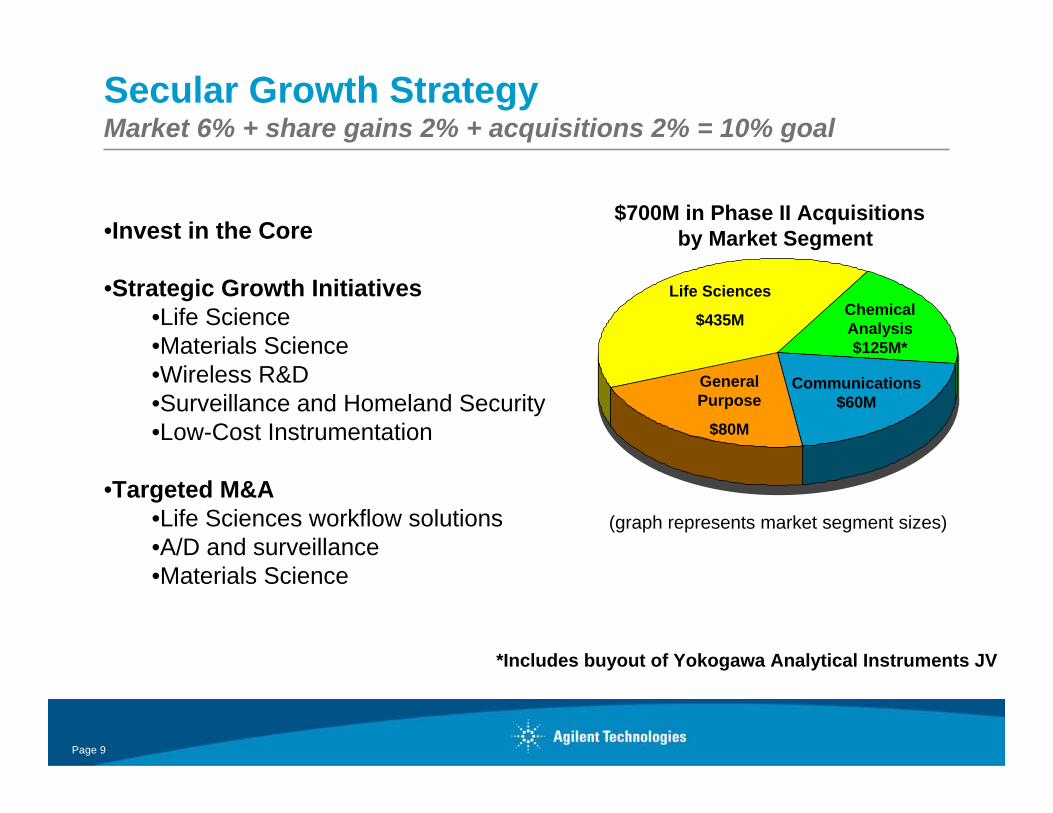
Secular Growth StrategyMarket 6% + share gains 2% + acquisitions 2% = 10% goal
Life Sciences
$435M
$700M in Phase II Acquisitionsby Market Segment
Chemical Analysis $125M*
Communications $60M
General Purpose
$80M
(graph represents market segment sizes)
•Invest in the Core
•Strategic Growth Initiatives•Life Science•Materials Science•Wireless R&D•Surveillance and Homeland Security•Low-Cost Instrumentation
•Targeted M&A •Life Sciences workflow solutions•A/D and surveillance•Materials Science
*Includes buyout of Yokogawa Analytical Instruments JV
Page 10
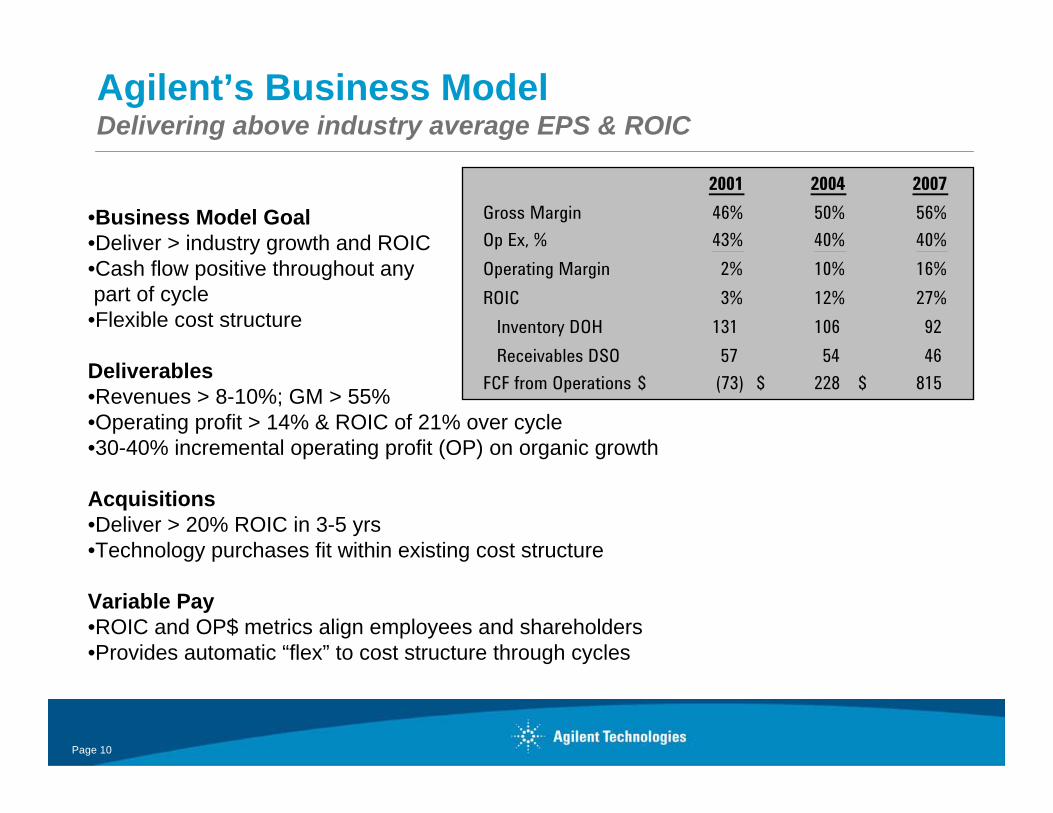
•Business Model Goal•Deliver > industry growth and ROIC•Cash flow positive throughout anypart of cycle•Flexible cost structure
Deliverables•Revenues > 8-10%; GM > 55%•Operating profit > 14% & ROIC of 21% over cycle•30-40% incremental operating profit (OP) on organic growth
Acquisitions•Deliver > 20% ROIC in 3-5 yrs•Technology purchases fit within existing cost structure
Variable Pay•ROIC and OP$ metrics align employees and shareholders•Provides automatic “flex” to cost structure through cycles
Agilent’s Business ModelDelivering above industry average EPS & ROIC
2001 2004 2007Gross Margin 46% 50% 56%Op Ex, % 43% 40% 40%Operating Margin 2% 10% 16%ROIC 3% 12% 27%
Inventory DOH 131 106 92Receivables DSO 57 54 46
FCF from Operations (73)$ 228$ 815$
Page 11
Summary - Going From Good to Great
Build great operating model
• 20% + ROIC over cycle– Consistent performance criteria across
businesses• Cash flow positive throughout cycle• Consistent, disciplined performanceLeverage operating model
• Accelerate profitable growth• 30% - 40% incremental profitability• Maintain consistent, disciplined performance
Page 12
Agilent TechnologiesJP Morgan 26th Annual Healthcare Conference
Nicolas (Nick) Roelofs, Ph.D.Vice President and General ManagerLife Sciences Solutions
Page 13
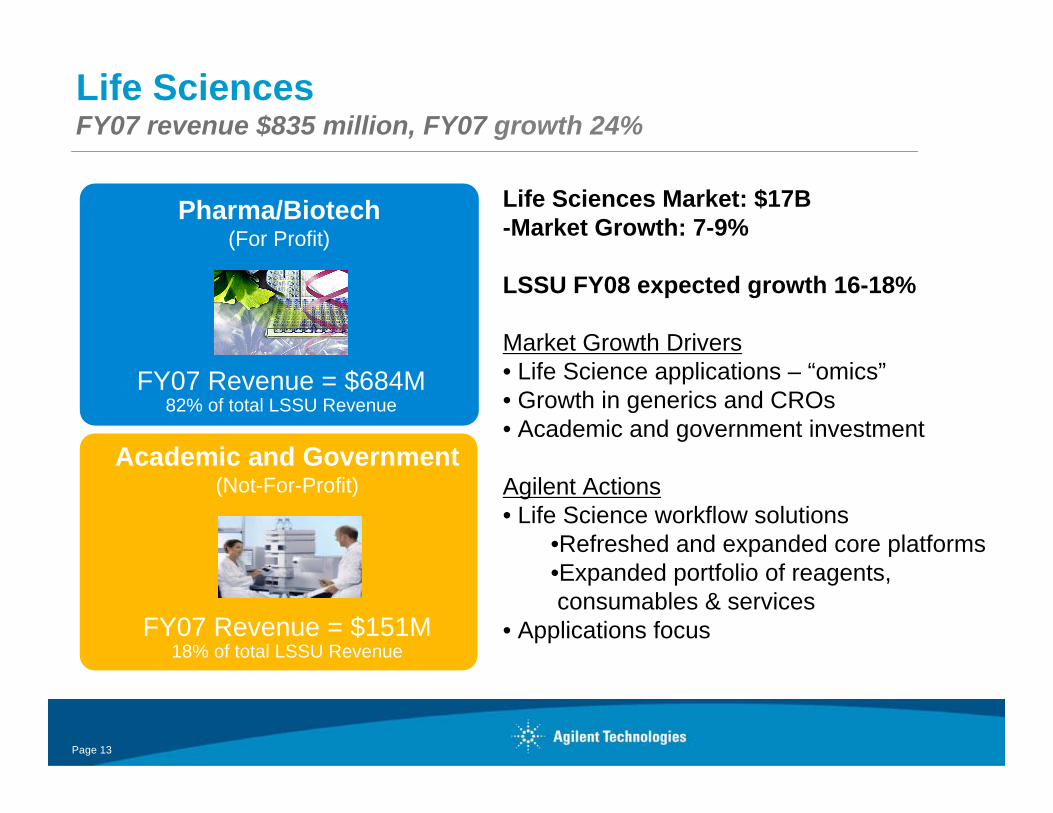
Life Sciences FY07 revenue $835 million, FY07 growth 24%
Academic and Government(Not-For-Profit)
FY07 Revenue = $151M18% of total LSSU Revenue
Pharma/Biotech(For Profit)
FY07 Revenue = $684M82% of total LSSU Revenue
Life Sciences Market: $17B-Market Growth: 7-9%
LSSU FY08 expected growth 16-18%
Market Growth Drivers• Life Science applications – “omics”• Growth in generics and CROs • Academic and government investment
Agilent Actions• Life Science workflow solutions
•Refreshed and expanded core platforms•Expanded portfolio of reagents,consumables & services
• Applications focus
Page 14
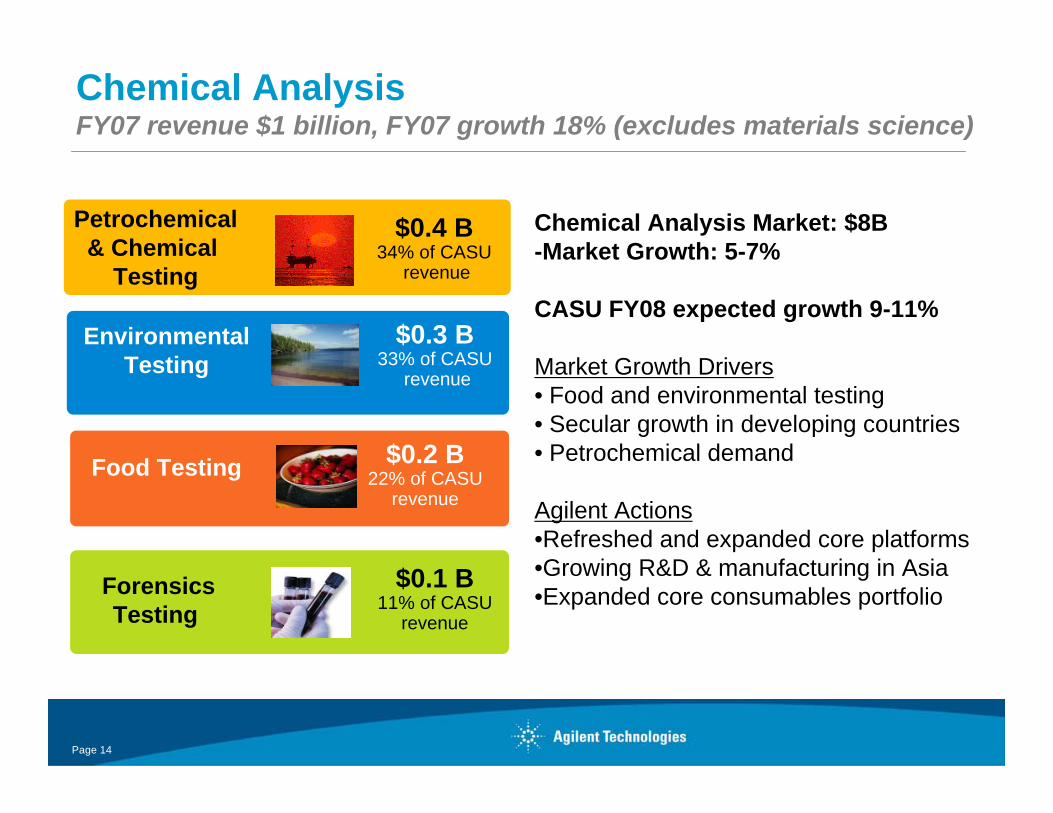
Chemical Analysis FY07 revenue $1 billion, FY07 growth 18% (excludes materials science)
Chemical Analysis Market: $8B-Market Growth: 5-7%
CASU FY08 expected growth 9-11%
Market Growth Drivers• Food and environmental testing• Secular growth in developing countries• Petrochemical demand
Agilent Actions•Refreshed and expanded core platforms •Growing R&D & manufacturing in Asia•Expanded core consumables portfolio
Petrochemical& Chemical
Testing
$0.4 B34% of CASU
revenue
EnvironmentalTesting
$0.3 B34% of total revenue
Food Testing $0.2 B22% of CASU
revenue
ForensicsTesting
$0.1 B11% of CASU
revenue
$0.3 B33% of CASU
revenue
Page 15
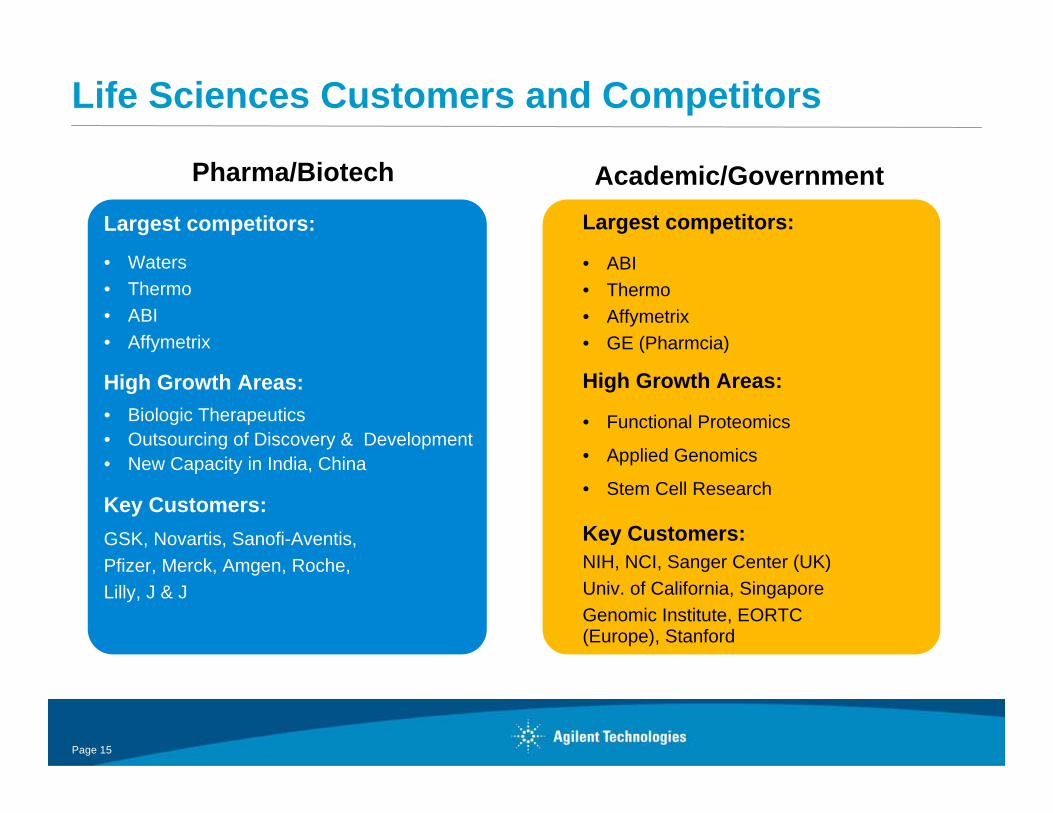
Life Sciences Customers and Competitors
Pharma/Biotech
Largest competitors:
• Waters• Thermo• ABI• Affymetrix
High Growth Areas:• Biologic Therapeutics• Outsourcing of Discovery & Development• New Capacity in India, China
Key Customers:GSK, Novartis, Sanofi-Aventis, Pfizer, Merck, Amgen, Roche, Lilly, J & J
Academic/GovernmentLargest competitors:
• ABI• Thermo• Affymetrix• GE (Pharmcia)
High Growth Areas:
• Functional Proteomics
• Applied Genomics
• Stem Cell Research
Key Customers:NIH, NCI, Sanger Center (UK)Univ. of California, SingaporeGenomic Institute, EORTC(Europe), Stanford
Page 16
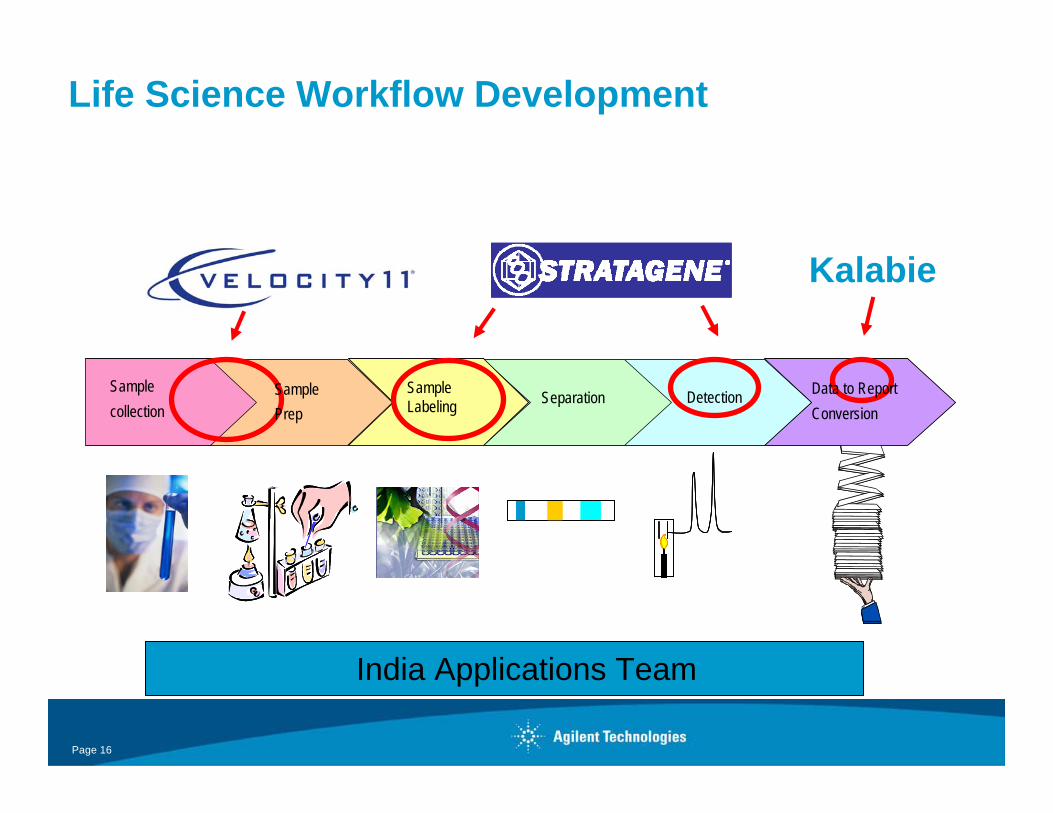
Life Science Workflow Development
DetectionSeparationSample IntroSample Prep
Sample collection
DetectionSeparationSampleLabeling Conversion
Kalabie
Data to Report SamplePrep
India Applications Team
Page 17
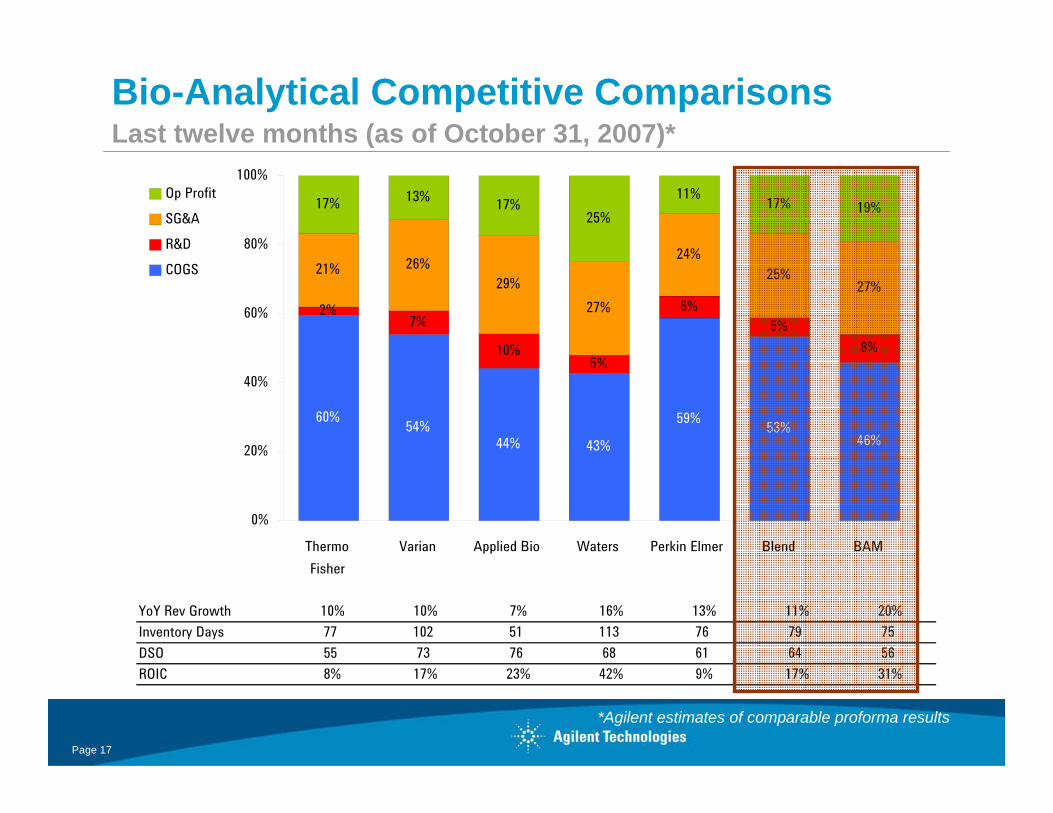
Bio-Analytical Competitive ComparisonsLast twelve months (as of October 31, 2007)*
*Agilent estimates of comparable proforma results
YoY Rev Growth 10% 10% 7% 16% 13% 11% 20%Inventory Days 77 102 51 113 76 79 75DSO 55 73 76 68 61 64 56ROIC 8% 17% 23% 42% 9% 17% 31%
60% 54%44% 43%
59% 53%46%
2%7%
10%5%
6%5%
8%
21% 26%29%
27%
24%25%
27%
17% 11% 17%25%
17%13%19%
0%
20%
40%
60%
80%
100%
ThermoFisher
Varian Applied Bio Waters Perkin Elmer Blend BAM
Op ProfitSG&AR&DCOGS
Page 18
Life Science BusinessStrategy
Leading workflow partner for life science solutions in the Pharmaceutical and Academic/Government
markets.
Key Strategies:• Move all Life Sciences businesses to Agilent operating model• Drive market share in technology-expanding platforms – LC, LC/MS, microfluidics,
microarray • Build on the scaffold of Stratagene and Velocity11 to create new application based
opportunities• Expand market share in the Academic / Government market segments• Capitalize on geographic opportunities – Asia Pacific, Eastern Europe
and Latin America• Leverage Diagnostic Capabilities
Page 19
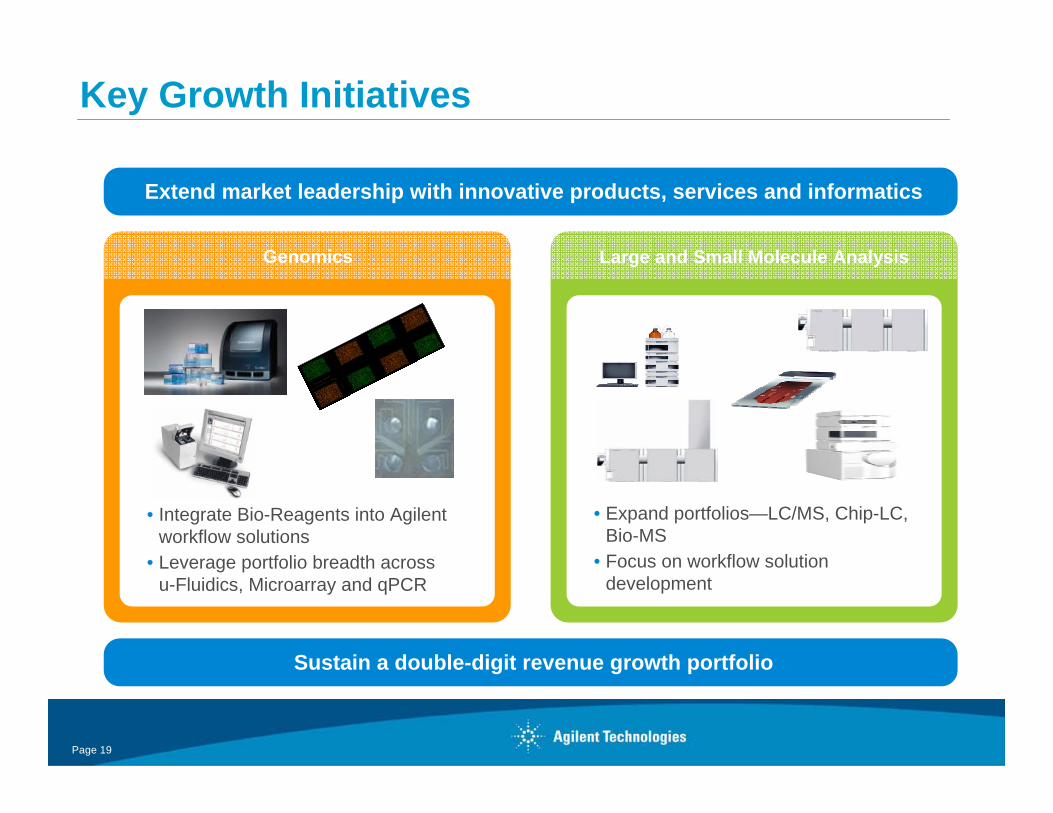
Key Growth Initiatives
Sustain a double-digit revenue growth portfolio
Genomics Large and Small Molecule Analysis
Extend market leadership with innovative products, services and informatics
• Integrate Bio-Reagents into Agilent workflow solutions
• Leverage portfolio breadth across u-Fluidics, Microarray and qPCR
• Expand portfolios—LC/MS, Chip-LC, Bio-MS
• Focus on workflow solution development
Page 20
Wednesday, January 9, 2008Westin St. Francis HotelSan Francisco, CA
Agilent TechnologiesJP Morgan 26th Annual Healthcare Conference
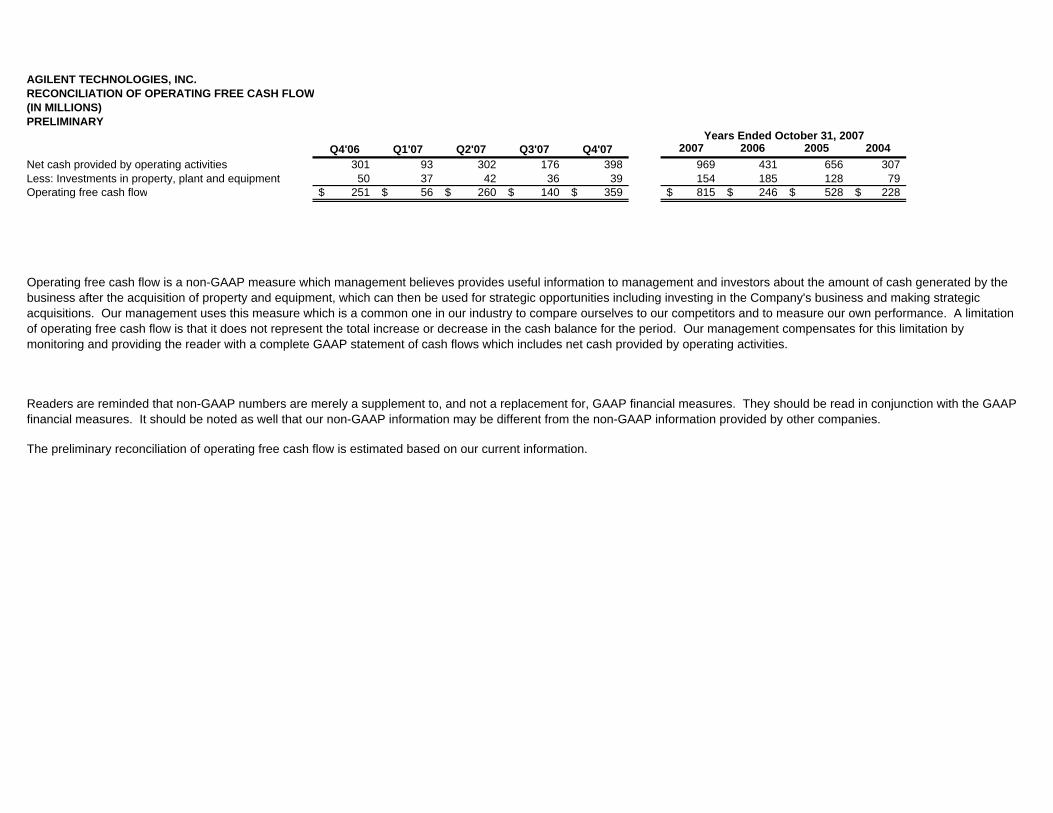
AGILENT TECHNOLOGIES, INC.RECONCILIATION OF OPERATING FREE CASH FLOW(IN MILLIONS)PRELIMINARY
Q4'06 Q1'07 Q2'07 Q3'07 Q4'07 2007 2006 2005 2004 Net cash provided by operating activities 301 93 302 176 398 969 431 656 307Less: Investments in property, plant and equipment 50 37 42 36 39 154 185 128 79Operating free cash flow 251$ 56$ 260$ 140$ 359$ 815$ 246$ 528$ 228$
The preliminary reconciliation of operating free cash flow is estimated based on our current information.
Operating free cash flow is a non-GAAP measure which management believes provides useful information to management and investors about the amount of cash generated by the business after the acquisition of property and equipment, which can then be used for strategic opportunities including investing in the Company's business and making strategic acquisitions. Our management uses this measure which is a common one in our industry to compare ourselves to our competitors and to measure our own performance. A limitation of operating free cash flow is that it does not represent the total increase or decrease in the cash balance for the period. Our management compensates for this limitation by monitoring and providing the reader with a complete GAAP statement of cash flows which includes net cash provided by operating activities.
Readers are reminded that non-GAAP numbers are merely a supplement to, and not a replacement for, GAAP financial measures. They should be read in conjunction with the GAAP financial measures. It should be noted as well that our non-GAAP information may be different from the non-GAAP information provided by other companies.
Years Ended October 31, 2007
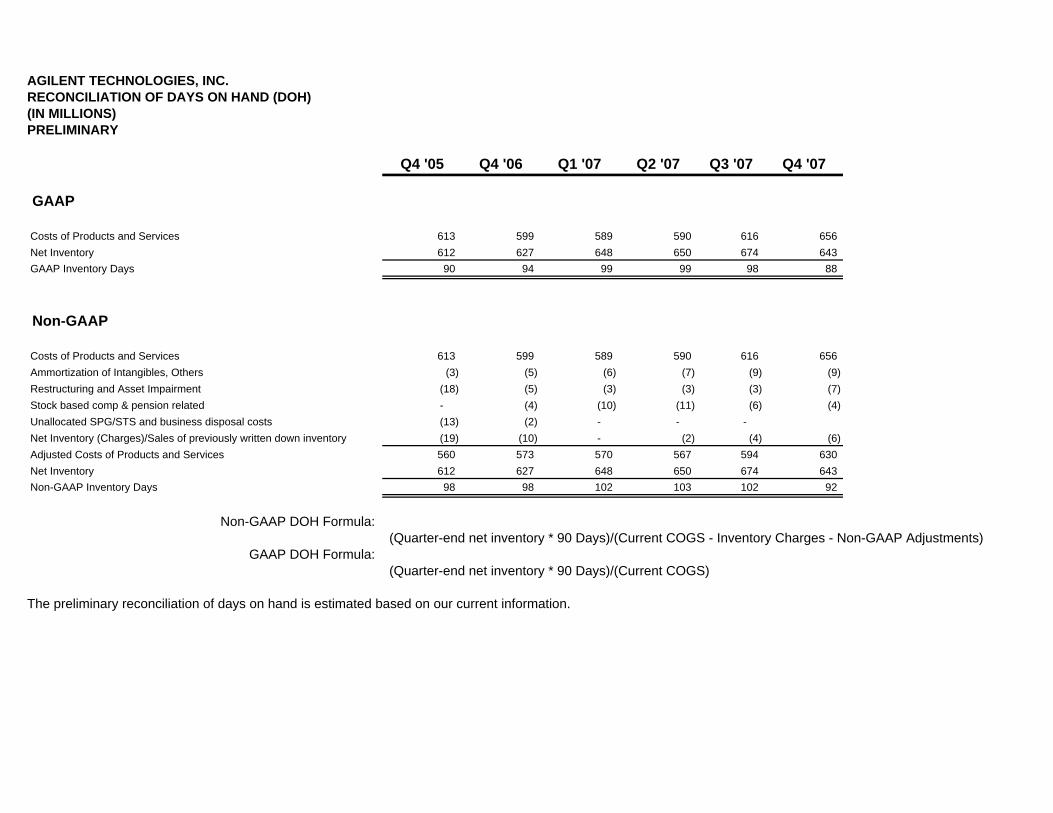
AGILENT TECHNOLOGIES, INC.RECONCILIATION OF DAYS ON HAND (DOH)(IN MILLIONS)PRELIMINARY
Q4 '05 Q4 '06 Q1 '07 Q2 '07 Q3 '07 Q4 '07
GAAP
Costs of Products and Services 613 599 589 590 616 656 Net Inventory 612 627 648 650 674 643 GAAP Inventory Days 90 94 99 99 98 88
Non-GAAP
Costs of Products and Services 613 599 589 590 616 656 Ammortization of Intangibles, Others (3) (5) (6) (7) (9) (9) Restructuring and Asset Impairment (18) (5) (3) (3) (3) (7) Stock based comp & pension related - (4) (10) (11) (6) (4) Unallocated SPG/STS and business disposal costs (13) (2) - - - Net Inventory (Charges)/Sales of previously written down inventory (19) (10) - (2) (4) (6) Adjusted Costs of Products and Services 560 573 570 567 594 630 Net Inventory 612 627 648 650 674 643 Non-GAAP Inventory Days 98 98 102 103 102 92
Non-GAAP DOH Formula:(Quarter-end net inventory * 90 Days)/(Current COGS - Inventory Charges - Non-GAAP Adjustments)
GAAP DOH Formula:(Quarter-end net inventory * 90 Days)/(Current COGS)
The preliminary reconciliation of days on hand is estimated based on our current information.
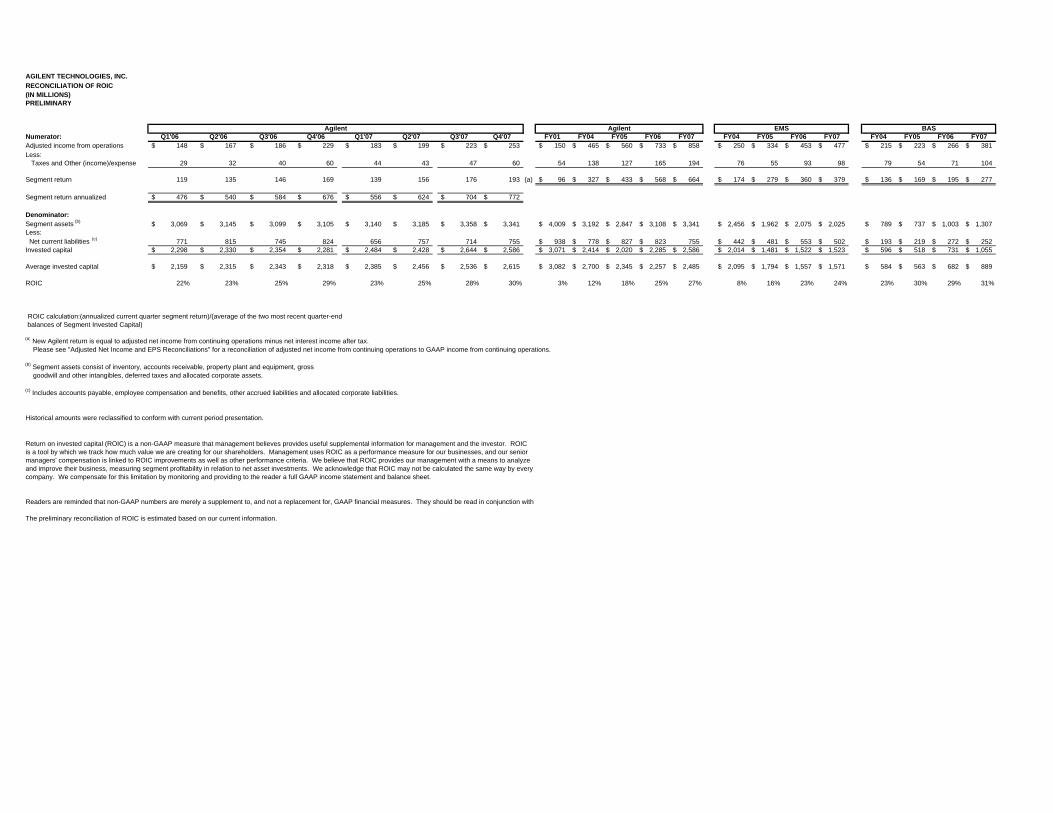
AGILENT TECHNOLOGIES, INC.RECONCILIATION OF ROIC(IN MILLIONS)PRELIMINARY
Numerator: Q1'06 Q2'06 Q3'06 Q4'06 Q1'07 Q2'07 Q3'07 Q4'07 FY01 FY04 FY05 FY06 FY07 FY04 FY05 FY06 FY07 FY04 FY05 FY06 FY07Adjusted income from operations 148$ 167$ 186$ 229$ 183$ 199$ 223$ 253$ 150$ 465$ 560$ 733$ 858$ 250$ 334$ 453$ 477$ 215$ 223$ 266$ 381$ Less: Taxes and Other (income)/expense 29 32 40 60 44 43 47 60 54 138 127 165 194 76 55 93 98 79 54 71 104
Segment return 119 135 146 169 139 156 176 193 (a) 96$ 327$ 433$ 568$ 664$ 174$ 279$ 360$ 379$ 136$ 169$ 195$ 277$
Segment return annualized 476$ 540$ 584$ 676$ 556$ 624$ 704$ 772$
Denominator:Segment assets (b) 3,069$ 3,145$ 3,099$ 3,105$ 3,140$ 3,185$ 3,358$ 3,341$ 4,009$ 3,192$ 2,847$ 3,108$ 3,341$ 2,456$ 1,962$ 2,075$ 2,025$ 789$ 737$ 1,003$ 1,307$ Less: Net current liabilities (c) 771 815 745 824 656 757 714 755 938$ 778$ 827$ 823$ 755 442$ 481$ 553$ 502$ 193$ 219$ 272$ 252$ Invested capital 2,298$ 2,330$ 2,354$ 2,281$ 2,484$ 2,428$ 2,644$ 2,586$ 3,071$ 2,414$ 2,020$ 2,285$ 2,586$ 2,014$ 1,481$ 1,522$ 1,523$ 596$ 518$ 731$ 1,055$
Average invested capital 2,159$ 2,315$ 2,343$ 2,318$ 2,385$ 2,456$ 2,536$ 2,615$ 3,082$ 2,700$ 2,345$ 2,257$ 2,485$ 2,095$ 1,794$ 1,557$ 1,571$ 584$ 563$ 682$ 889$
ROIC 22% 23% 25% 29% 23% 25% 28% 30% 3% 12% 18% 25% 27% 8% 16% 23% 24% 23% 30% 29% 31%
ROIC calculation:(annualized current quarter segment return)/(average of the two most recent quarter-end balances of Segment Invested Capital)
(a) New Agilent return is equal to adjusted net income from continuing operations minus net interest income after tax. Please see "Adjusted Net Income and EPS Reconciliations" for a reconciliation of adjusted net income from continuing operations to GAAP income from continuing operations.
(b) Segment assets consist of inventory, accounts receivable, property plant and equipment, gross goodwill and other intangibles, deferred taxes and allocated corporate assets.
(c) Includes accounts payable, employee compensation and benefits, other accrued liabilities and allocated corporate liabilities.
Historical amounts were reclassified to conform with current period presentation.
The preliminary reconciliation of ROIC is estimated based on our current information.
Readers are reminded that non-GAAP numbers are merely a supplement to, and not a replacement for, GAAP financial measures. They should be read in conjunction with
Return on invested capital (ROIC) is a non-GAAP measure that management believes provides useful supplemental information for management and the investor. ROIC is a tool by which we track how much value we are creating for our shareholders. Management uses ROIC as a performance measure for our businesses, and our senior managers' compensation is linked to ROIC improvements as well as other performance criteria. We believe that ROIC provides our management with a means to analyze and improve their business, measuring segment profitability in relation to net asset investments. We acknowledge that ROIC may not be calculated the same way by every company. We compensate for this limitation by monitoring and providing to the reader a full GAAP income statement and balance sheet.
EMS BASAgilent Agilent
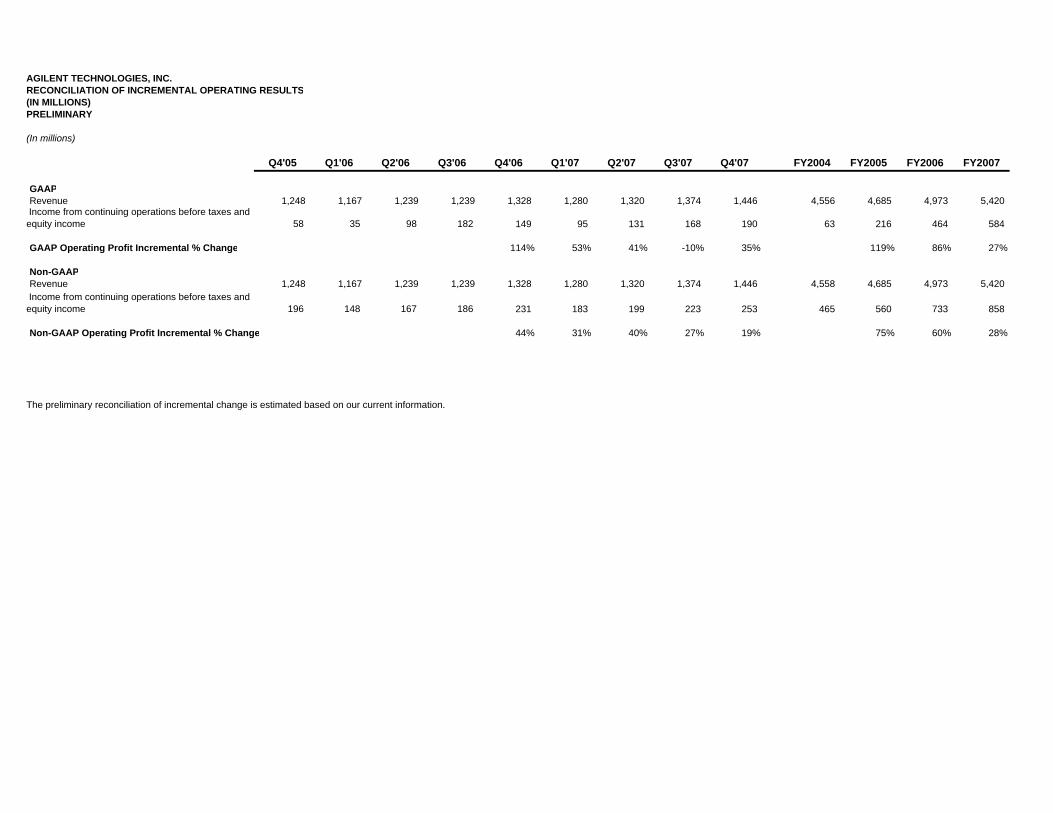
AGILENT TECHNOLOGIES, INC.RECONCILIATION OF INCREMENTAL OPERATING RESULTS(IN MILLIONS)PRELIMINARY
(In millions)
Q4'05 Q1'06 Q2'06 Q3'06 Q4'06 Q1'07 Q2'07 Q3'07 Q4'07 FY2004 FY2005 FY2006 FY2007
GAAPRevenue 1,248 1,167 1,239 1,239 1,328 1,280 1,320 1,374 1,446 4,556 4,685 4,973 5,420
Income from continuing operations before taxes and equity income 58 35 98 182 149 95 131 168 190 63 216 464 584
GAAP Operating Profit Incremental % Change 114% 53% 41% -10% 35% 119% 86% 27%
Non-GAAPRevenue 1,248 1,167 1,239 1,239 1,328 1,280 1,320 1,374 1,446 4,558 4,685 4,973 5,420
Income from continuing operations before taxes and equity income 196 148 167 186 231 183 199 223 253 465 560 733 858
Non-GAAP Operating Profit Incremental % Change 44% 31% 40% 27% 19% 75% 60% 28%
The preliminary reconciliation of incremental change is estimated based on our current information.
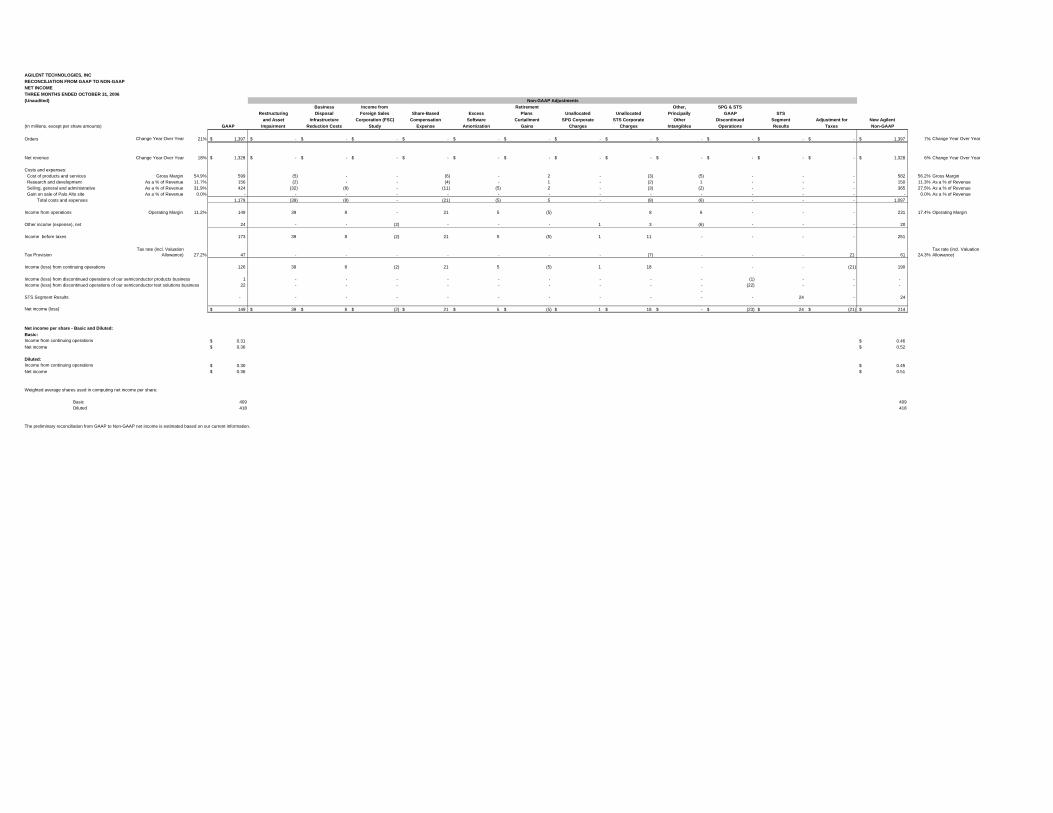
AGILENT TECHNOLOGIES, INCRECONCILIATION FROM GAAP TO NON-GAAP NET INCOMETHREE MONTHS ENDED OCTOBER 31, 2006(Unaudited)
Business Income from Retirement Other, SPG & STSRestructuring Disposal Foreign Sales Share-Based Excess Plans Unallocated Unallocated Principally GAAP STS
and Asset Infrastructure Corporation (FSC) Compensation Software Curtailment SPG Corporate STS Corporate Other Discontinued Segment Adjustment for New Agilent(In millions, except per share amounts) GAAP Impairment Reduction Costs Study Expense Amortization Gains Charges Charges Intangibles Operations Results Taxes Non-GAAP
Orders Change Year Over Year 21% 1,397$ -$ -$ -$ -$ -$ -$ -$ -$ -$ -$ -$ -$ 1,397$ 7% Change Year Over Year
Net revenue Change Year Over Year 18% 1,328$ -$ -$ -$ -$ -$ -$ -$ -$ -$ -$ -$ -$ 1,328$ 6% Change Year Over Year
Costs and expenses: Cost of products and services Gross Margin 54.9% 599 (5) - - (6) - 2 - (3) (5) - - - 582 56.2% Gross Margin Research and development As a % of Revenue 11.7% 156 (2) - - (4) - 1 - (2) 1 - - - 150 11.3% As a % of Revenue Selling, general and administrative As a % of Revenue 31.9% 424 (32) (8) - (11) (5) 2 - (3) (2) - - - 365 27.5% As a % of Revenue Gain on sale of Palo Alto site As a % of Revenue 0.0% - - - - - - - - - - - - - - 0.0% As a % of Revenue Total costs and expenses 1,179 (39) (8) - (21) (5) 5 - (8) (6) - - - 1,097
Income from operations Operating Margin 11.2% 149 39 8 - 21 5 (5) 8 6 - - - 231 17.4% Operating Margin
Other income (expense), net 24 - - (2) - - - 1 3 (6) - - - 20
Income before taxes 173 39 8 (2) 21 5 (5) 1 11 - - - - 251
Tax ProvisionTax rate (incl. Valuation
Allowance) 27.2% 47 - - - - - - - (7) - - - 21 61 24.3%Tax rate (incl. Valuation Allowance)
Income (loss) from continuing operations 126 39 8 (2) 21 5 (5) 1 18 - - - (21) 190
Income (loss) from discontinued operations of our semiconductor products business 1 - - - - - - - - - (1) - - - Income (loss) from discontinued operations of our semiconductor test solutions business 22 - - - - - - - - - (22) - - -
- STS Segment Results - - - - - - - - - - - 24 - 24
Net income (loss) 149$ 39$ 8$ (2)$ 21$ 5$ (5)$ 1$ 18$ -$ (23)$ 24$ (21)$ 214$
Net income per share - Basic and Diluted:Basic:Income from continuing operations 0.31$ 0.46$ Net income 0.36$ 0.52$
Diluted:Income from continuing operations 0.30$ 0.45$ Net income 0.36$ 0.51$
Weighted average shares used in computing net income per share:
Basic 409 409 Diluted 418 418
The preliminary reconciliation from GAAP to Non-GAAP net income is estimated based on our current information.
Non-GAAP Adjustments
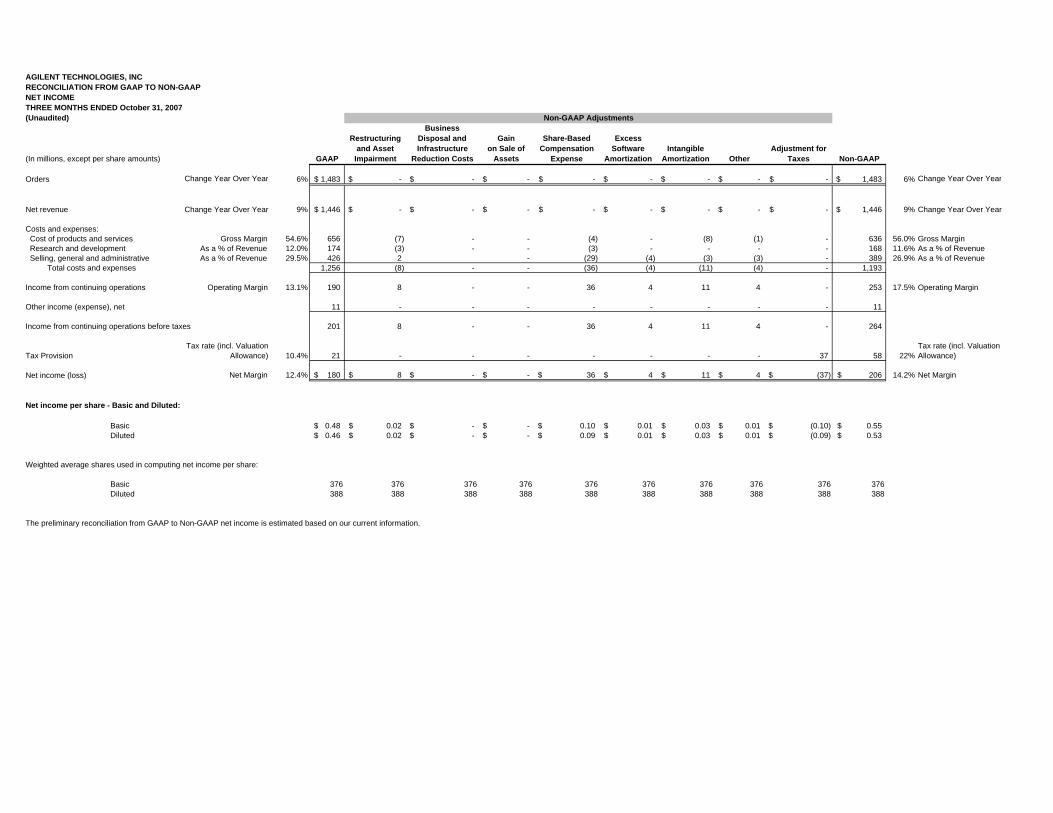
AGILENT TECHNOLOGIES, INCRECONCILIATION FROM GAAP TO NON-GAAP NET INCOMETHREE MONTHS ENDED October 31, 2007(Unaudited)
BusinessRestructuring Disposal and Gain Share-Based Excess
and Asset Infrastructure on Sale of Compensation Software Intangible Adjustment for(In millions, except per share amounts) GAAP Impairment Reduction Costs Assets Expense Amortization Amortization Other Taxes Non-GAAP
Orders Change Year Over Year 6% 1,483$ -$ -$ -$ -$ -$ -$ -$ -$ 1,483$ 6% Change Year Over Year
Net revenue Change Year Over Year 9% 1,446$ -$ -$ -$ -$ -$ -$ -$ -$ 1,446$ 9% Change Year Over Year
Costs and expenses: Cost of products and services Gross Margin 54.6% 656 (7) - - (4) - (8) (1) - 636 56.0% Gross Margin Research and development As a % of Revenue 12.0% 174 (3) - - (3) - - - - 168 11.6% As a % of Revenue Selling, general and administrative As a % of Revenue 29.5% 426 2 - (29) (4) (3) (3) - 389 26.9% As a % of Revenue Total costs and expenses 1,256 (8) - - (36) (4) (11) (4) - 1,193
Income from continuing operations Operating Margin 13.1% 190 8 - - 36 4 11 4 - 253 17.5% Operating Margin
Other income (expense), net 11 - - - - - - - - 11
Income from continuing operations before taxes 201 8 - - 36 4 11 4 - 264
Tax ProvisionTax rate (incl. Valuation
Allowance) 10.4% 21 - - - - - - - 37 58 22%Tax rate (incl. Valuation Allowance)
Net income (loss) Net Margin 12.4% 180$ 8$ -$ -$ 36$ 4$ 11$ 4$ (37)$ 206$ 14.2% Net Margin
Net income per share - Basic and Diluted:
Basic 0.48$ 0.02$ -$ -$ 0.10$ 0.01$ 0.03$ 0.01$ (0.10)$ 0.55$ Diluted 0.46$ 0.02$ -$ -$ 0.09$ 0.01$ 0.03$ 0.01$ (0.09)$ 0.53$
Weighted average shares used in computing net income per share:
Basic 376 376 376 376 376 376 376 376 376 376 Diluted 388 388 388 388 388 388 388 388 388 388
The preliminary reconciliation from GAAP to Non-GAAP net income is estimated based on our current information.
Non-GAAP Adjustments
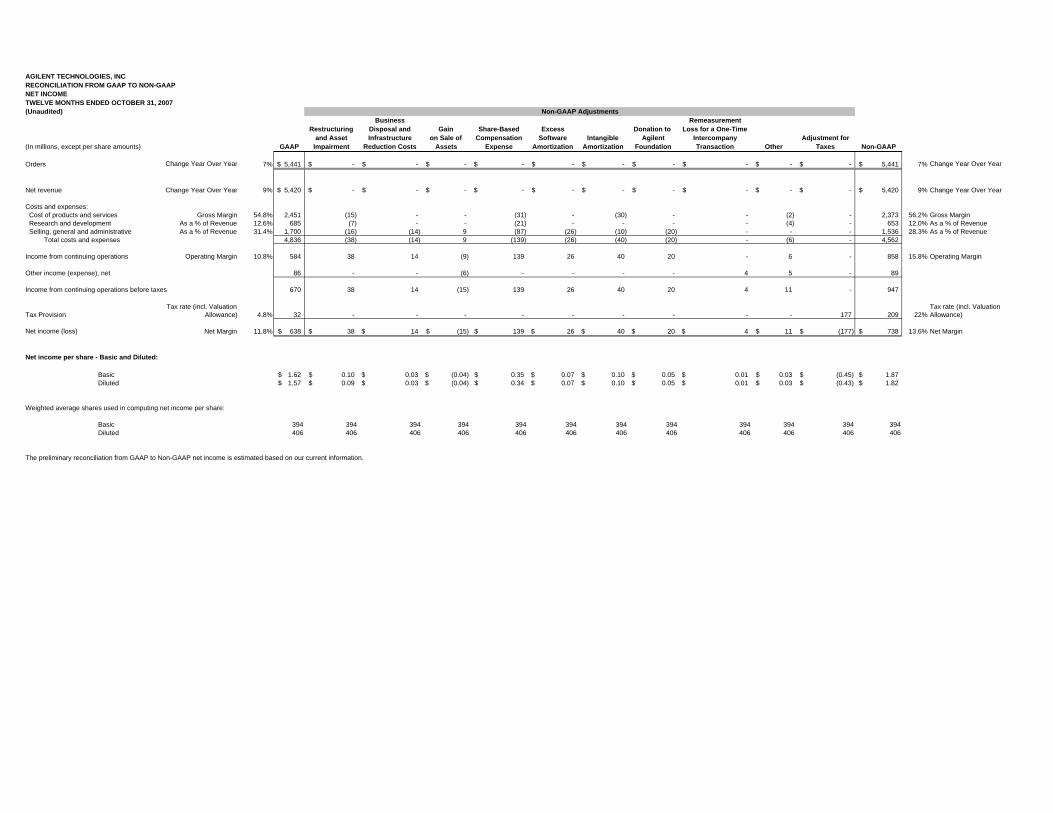
AGILENT TECHNOLOGIES, INCRECONCILIATION FROM GAAP TO NON-GAAP NET INCOMETWELVE MONTHS ENDED OCTOBER 31, 2007(Unaudited)
Business RemeasurementRestructuring Disposal and Gain Share-Based Excess Donation to Loss for a One-Time
and Asset Infrastructure on Sale of Compensation Software Intangible Agilent Intercompany Adjustment for(In millions, except per share amounts) GAAP Impairment Reduction Costs Assets Expense Amortization Amortization Foundation Transaction Other Taxes Non-GAAP
Orders Change Year Over Year 7% 5,441$ -$ -$ -$ -$ -$ -$ -$ -$ -$ -$ 5,441$ 7% Change Year Over Year
Net revenue Change Year Over Year 9% 5,420$ -$ -$ -$ -$ -$ -$ -$ -$ -$ -$ 5,420$ 9% Change Year Over Year
Costs and expenses: Cost of products and services Gross Margin 54.8% 2,451 (15) - - (31) - (30) - - (2) - 2,373 56.2% Gross Margin Research and development As a % of Revenue 12.6% 685 (7) - - (21) - - - - (4) - 653 12.0% As a % of Revenue Selling, general and administrative As a % of Revenue 31.4% 1,700 (16) (14) 9 (87) (26) (10) (20) - - - 1,536 28.3% As a % of Revenue Total costs and expenses 4,836 (38) (14) 9 (139) (26) (40) (20) - (6) - 4,562
Income from continuing operations Operating Margin 10.8% 584 38 14 (9) 139 26 40 20 - 6 - 858 15.8% Operating Margin
Other income (expense), net 86 - - (6) - - - - 4 5 - 89
Income from continuing operations before taxes 670 38 14 (15) 139 26 40 20 4 11 - 947
Tax ProvisionTax rate (incl. Valuation
Allowance) 4.8% 32 - - - - - - - - - 177 209 22%Tax rate (incl. Valuation Allowance)
Net income (loss) Net Margin 11.8% 638$ 38$ 14$ (15)$ 139$ 26$ 40$ 20$ 4$ 11$ (177)$ 738$ 13.6% Net Margin
Net income per share - Basic and Diluted:
Basic 1.62$ 0.10$ 0.03$ (0.04)$ 0.35$ 0.07$ 0.10$ 0.05$ 0.01$ 0.03$ (0.45)$ 1.87$ Diluted 1.57$ 0.09$ 0.03$ (0.04)$ 0.34$ 0.07$ 0.10$ 0.05$ 0.01$ 0.03$ (0.43)$ 1.82$
Weighted average shares used in computing net income per share:
Basic 394 394 394 394 394 394 394 394 394 394 394 394 Diluted 406 406 406 406 406 406 406 406 406 406 406 406
The preliminary reconciliation from GAAP to Non-GAAP net income is estimated based on our current information.
Non-GAAP Adjustments
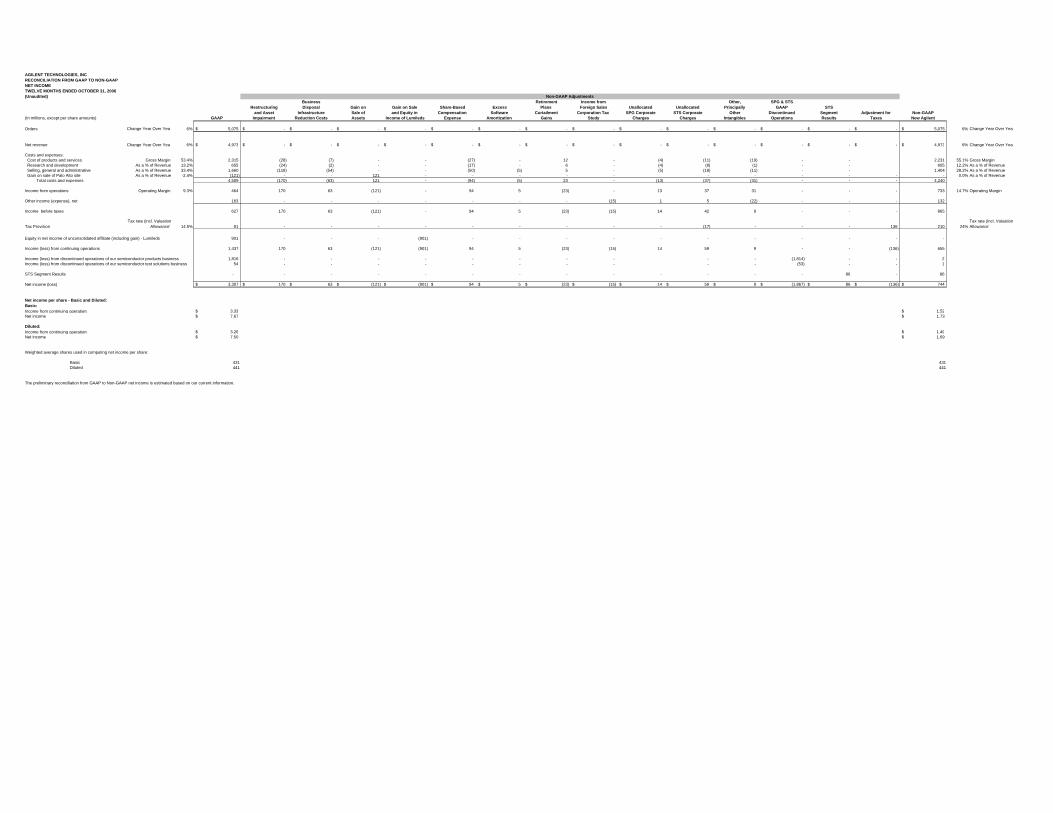
AGILENT TECHNOLOGIES, INCRECONCILIATION FROM GAAP TO NON-GAAP NET INCOMETWELVE MONTHS ENDED OCTOBER 31, 2006(Unaudited)
Business Retirement Income from Other, SPG & STSRestructuring Disposal Gain on Gain on Sale Share-Based Excess Plans Foreign Sales Unallocated Unallocated Principally GAAP STS
and Asset Infrastructure Sale of and Equity in Compensation Software Curtailment Corporation Tax SPG Corporate STS Corporate Other Discontinued Segment Adjustment for Non-GAAP(In millions, except per share amounts) GAAP Impairment Reduction Costs Assets Income of Lumileds Expense Amortization Gains Study Charges Charges Intangibles Operations Results Taxes New Agilent
Orders Change Year Over Year 6% 5,075$ -$ -$ -$ -$ -$ -$ -$ -$ -$ -$ -$ -$ -$ -$ 5,075$ 6% Change Year Over Year
Net revenue Change Year Over Year 6% 4,973$ -$ -$ -$ -$ -$ -$ -$ -$ -$ -$ -$ -$ -$ -$ 4,973$ 6% Change Year Over Year
Costs and expenses: Cost of products and services Gross Margin 53.4% 2,315 (28) (7) - - (27) - 12 - (4) (11) (19) - - 2,231 55.1% Gross Margin Research and development As a % of Revenue 13.2% 655 (24) (2) - - (17) - 6 - (4) (8) (1) - - 605 12.2% As a % of Revenue Selling, general and administrative As a % of Revenue 33.4% 1,660 (118) (54) - - (50) (5) 5 - (5) (18) (11) - - 1,404 28.2% As a % of Revenue Gain on sale of Palo Alto site As a % of Revenue -2.4% (121) - - 121 - - - - - - - - - - - 0.0% As a % of Revenue Total costs and expenses 4,509 (170) (63) 121 - (94) (5) 23 - (13) (37) (31) - - - 4,240
Income from operations Operating Margin 9.3% 464 170 63 (121) - 94 5 (23) - 13 37 31 - - - 733 14.7% Operating Margin
Other income (expense), net 163 - - - - - - - (15) 1 5 (22) - - - 132
Income before taxes 627 170 63 (121) - 94 5 (23) (15) 14 42 9 - - - 865
Tax ProvisionTax rate (incl. Valuation
Allowance) 14.5% 91 - - - - - - - - - (17) - - - 136 210 24%Tax rate (incl. Valuation Allowance)
Equity in net income of unconsolidated affiliate (including gain) - Lumileds 901 - - - (901) - - - - - - - - - - -
Income (loss) from continuing operations 1,437 170 63 (121) (901) 94 5 (23) (15) 14 59 9 - - (136) 655
Income (loss) from discontinued operations of our semiconductor products business 1,816 - - - - - - - - - - (1,814) - - 2 Income (loss) from discontinued operations of our semiconductor test solutions business 54 - - - - - - - - - - (53) - - 1
STS Segment Results - - - - - - - - - - - - - 86 - 86
Net income (loss) 3,307$ 170$ 63$ (121)$ (901)$ 94$ 5$ (23)$ (15)$ 14$ 59$ 9$ (1,867)$ 86$ (136)$ 744$
Net income per share - Basic and Diluted: Basic: Income from continuing operations 3.33$ 1.52$ Net income 7.67$ 1.73$
Diluted:Income from continuing operations 3.26$ 1.49$ Net income 7.50$ 1.69$
Weighted average shares used in computing net income per share:
Basic 431 431 Diluted 441 441
The preliminary reconciliation from GAAP to Non-GAAP net income is estimated based on our current information.
Non-GAAP Adjustments