Embed Size (px)
Citation preview

Agilent Application Solution
Analysis of bisphenol A leaching from baby feeding bottles
Application Note
Consumer Products
Abstract
Bisphenol A can leach out from the plastic surfaces of food containers and
has been detected in various matrices such as plasma, urine and groundwater.
Bipshenol A is an endocrine disruptor, which can mimic the body’s own hormones
such as estrogen and may lead to negative health effects. In this Application Note,
we describe a method to quantify bisphenol A and a structurally similar analog
bisphenol F extracted from baby feeding bottles. The method was developed on an
Agilent 1260 Infinity LC system using an Agilent ZORBAX Eclipse Plus C18 column.
Partial method validation was performed to demonstrate linearity, robustness and
precision of area and retention time. The dilution series was generated automati-
cally using an Agilent 7696A Sample Prep WorkBench, saving analyst time. The
limit of quantitation (LOQ) for bisphenol A was found to be 1.06 ng/mL. During
sample recovery studies, 80% recovery was obtained for bisphenol A. The method
was transferred to an ultrahigh performance liquid chromatography (UHPLC)
method using an Agilent 1290 Infinity LC System. The UHPLC method has the same
experimental conditions but showed narrower and higher peaks, better resolution,
and improved signal-to-noise response. Both methods can be applied for
bisphenol A quantification in quality control of food containers such as baby
feeding bottles.
Author
Syed Salman Lateef
Agilent Technologies, Inc.
Bangalore, India

2
Introduction
Bisphenol A (BPA) is a monomer used to make polycarbonate plastic and epoxy resins. Traces of BPA can leach out of these polycarbonate plastic surfaces under various environmental conditions such as heat or pH changes and eventually are consumed by humans. BPA was detected in various matrices such as urine, groundwater and plasma. Based on the assump-tion that a threshold exists above which toxic effects are seen, the U.S. Environmental Protection Agency (US EPA) has established 50 µg/kg body weight/day as the reference dose (RfD) for BPA1. Baby bottles made of poly-carbonate plastic are a potential risk to children. In this Application Note, we used a structurally similar commer-cially available compound bisphenol F, (BPF), (Figure 1) along with BPA to determine separation efficiency.
Ballesteros-Gomez et.al., reviewed various analytical methods used to separate, identify and quantify BPA2. Also, the ASTM standard test method, D 7574-09, describes a SPE based offline method for extracting bisphenol A from environmental waters3. BPA is a fluorescent com-pound, and fluorescence detector (FLD) is sensitive to detect BPA concentra-tion in baby bottles. In this Application Note, a method is described to simulta-neously quantify BPA and BPF using a SPE based offline extraction procedure with (U)HPLC/FLD detection.
Experimental
Instruments and softwareAn Agilent 1260 Infinity Binary LC system consisting of the following modules was used:
• Agilent 1260 Infinity Binary Pump (G1312B)
• Agilent 1260 Infinity Autosampler and Thermostat (G1367E, G1330B)
• Agilent 1260 Infinity Thermostatted Column Compartment (TCC) (G1316A)
• Agilent 1260 Infinity Fluorescence Detector (G1321B) with 8 µL flow cell
The UHPLC analysis was developed and performed using an Agilent 1290 Infinity LC System consisting of the following modules:
• Agilent 1290 Infinity Binary Pump (G4220A)
• Agilent 1290 Infinity Autosampler and Thermostat (G4226A, G1330B)
• Agilent 1290 Infinity Thermostatted Column Compartment (G1316C)
• Agilent 1260 Infinity Fluorescence Detector (G1321B) with 8 µL flow cell
Software:
• Agilent ChemStation B.04.02
Sample preparation:
• Agilent 7696A Sample Prep WorkBench
OH
CH3
OH
CH3
HO
HO
Bisphenol A
Bisphenol F
Figure 1 Molecular structures of bisphenol A and bisphenol F
3
Reagents and materialsAll chemicals and solvents used were HPLC grade. Purified water was used from a Milli Q water purification system (Millipore Q-POD Element, USA). Acetonitrile and methanol super gradi-ent were purchased from Lab-Scan (Bangkok, Thailand) and potassium phosphate monobasic was obtained from Fluka (Germany). Standards of bisphenol A and bisphenol F were purchased from Sigma-Aldrich (India). BPA-free baby bottles manufactured in USA and three different brands of poly-carbonate baby bottles manufactured locally were purchased.
Chromatographic parameters The chromatographic parameters for reverse phase liquid chromatography using Agilent 1260 and Agilent 1290 Infinity LC systems are shown in Table 1.
Column: Agilent ZORBAX Eclipse Plus C18 Agilent ZORBAX Eclipse Plus C18 4.6×100 mm 5 µm (p/n 959996 902) 4.6×100 mm 1.8 µm (p/n 959964 902)
TCC temperature: 40 °C
FLD: Ex: 230. Em: 316
FLD acquisition rate, 9.26 Hz, 15 gain:
Sample thermostat: 4 °C
Mobile phase A: 10 mM monobasic potassium phosphate in water
Mobile phase B: 100% Acetonitrile
Gradient: Time (min) %B
0 5 2 5 2.1 35 12.5 35 12.6 70 17 70 18.1 5 23 5
Flow: 0.9 mL/min
Injection volume: 20 µL. 5 sec needle wash at flush port for 5 sec, using mobile phase A
Table 1 Chromatographic parameters used in the Agilent 1260 Infinity LC and Agilent 1290 Infinity LC systems.
Parameters Agilent 1260 Infinity LC system Agilent 1290 Infinity LC system

4
Preparation of standardsBPA and BPF were accurately weighed out and dissolved in 100% methanol separately to obtain stock solutions of about 300 µg/mL each, which were stored at 4 °C when not in use. A 400 ng/mL solution of BPA and BPF was prepared freshly by diluting the stock solutions using the dilution buffer of 5% acetonitrile and 95% 10 mM monobasic potassium phos-phate in water. Linearity levels shown in Table 2, were prepared by subse-quent dilution of a 400 ng/mL solution. The Agilent 7696A Sample Prep WorkBench was used to make linearity levels, using serial dilutions. In the first sequence, 400 µL of dilution solution was added to all the vials. In the second sequence, 300 µL of 400 ng/mL solution was added to a Level 7 vial from the first sequence and vortexed for 15 seconds. Serial dilutions were carried out by taking 300 µL from the previous level and added to the next level vial. Note that instead of running two sequences, the steps can also be programmed into one method and running one sequence. The syringe parameters used in the setup of the Agilent 7696A Sample Prep WorkBench are given in Table 3. An Agilent Application Note5, describes in detail the set up of 7696A Sample Prep WorkBench4.
Add 250 mL boiling water (MilliQ) into polycarbonate baby bottle
Place baby bottle in boiling water for 30 min
Transfer the water from the baby bottle into amber colored bottles
Acidify using concentrated HCl to pH 2.0 and store at 4 °C
Precondition SPE using 6 mL methanol and 6 mL water.
Add 50 ml acidified water.
Elute using 2 × 4 mL of 100% methanol
Evaporate under a stream of nitrogen at 60 °C and reconstitute in 1 mL of dilution buffer
Figure 2 Extraction of BPA from baby bottles and sample preparation using SPE.
Sample preparationBPA from polycarbonate baby bot-tles was extracted following the schematic shown in Figure 2. An SPE adapter (p/n 12131001) and 3 mm OD tubing (p/n 5062-2483) were used to load the sample onto an Agilent Bond Elut Plexa SPE column, 200 mg, 6 mL (p/n 12109206). An Agilent 20 port vacuum extraction manifold (p/n 12234104) was used for the setup of SPE. We followed the sample handling precautions as described in the ASTM method3. The reconstituted solution from the final step (Figure 2) was used directly for sample analysis.
Table 2 Dilution table for bisphenol A and bisphenol F.
Solvent prewash 1
Dispense wash
Dispense pumps
Dispense settings
Number of pumps or washes 1 1 3
Wash volume (µL) 50 50 20
Draw speed (µL/min) 1250 1250 1250 1250
Dispense speed (µL/min) 2500 2500 2500 2500
Needle dept off set (mm) -2.0 -2.0 -2.0 -2.0
Viscosity delay (s) 0 0 0 0
Turret solvent A
Air gap (% syr. vol.) 0 0
Table 3 500 µL syringe parameters used for the Agilent 7696A Sample Prep WorkBench.
Linearity levels
Bisphenol A (ng/mL)
Bisphenol F (ng/mL)
LOD 0.195105 0.195105
1 1.06224 1.06224
2 2.478559 2.478559
3 5.783305 5.783305
4 13.49438 13.49438
5 31.48688 31.48688
6 73.46939 73.46939
7 171.4286 171.4286

5
An Agilent ZORBAX Eclipse Plus C18 column was used for further experi-ments. A low temperature (35 °C) of the TCC provided optimal separation of BPA from a closely eluting impurity, however 40 °C was found to be better when analyzing matrix samples. A linear gradient separated the two bis-phenols, however a preliminary method robustness study showed large varia-tion when the gradient was modified. A step gradient method was therefore adapted, which gave comparatively robust results. The ASTM method recommended storing bisphenols at low temperature, therefore the auto-sampler was maintained at 4 °C during the analysis. Figure 3 shows a chroma-togram separating the two bisphenols using the final method.
Finally, three different brands of baby bottles were analyzed to determine the leaching concentrations of the two bisphenols using the standard HPLC method.
The method was then transferred to an Agilent 1290 Infinity LC system and run on a 1.8 µm column using the same experimental conditions to test resolu-tion and sensitivity of the method. For this method, we also evaluated LOD, LOQ, linearity of each standard and precision of the method by area and RT RSD.
Results and Discussion
Separation and detectionThe separation of BPA and BPF was tested on C18 columns using acidic and basic mobile phases during method development. Extracted water samples from baby bottles were also tested before finalizing the method.
Procedure
The reconstituted extracts from the baby bottles were injected to measure the approximate concentration of BPA before establishing the linearity range. A 20 µL solution of mobile phase A was injected as blank, followed by each linearity level in six replicates. Area and retention time (RT) information for each level was used to calculate the relative standard deviation (RSD) values. The average area of each linearity level in the linearity range was plotted against the concentration to obtain a calibration curve. The limit of detection (LOD) and limit of quan-titation (LOQ) for BPA and BPF were established from the lower linearity level injections.
To evaluate the robustness of the method, six critical method parameters were evaluated:
• Flow rate ±2%
• Column temperature ±2.5%
• Injector volume ±5%
• Excitation and emission wavelength ±3%
• Step gradient ±10%
• Buffer concentration ±10%
For each robustness parameter, a standard concentration of 30 ng/mL solution of BPA and BPF was injected in seven replicates.
To perform the recovery studies, we extracted samples from BPA-free baby bottles as described in Figure 2. To 50 mL of this sample, either a low or a higher quantity of BPA and BPF was spiked. Both spiked samples were sub-jected to SPE. The resulting concentra-tions of the samples were determined using the calibration curves. The theo-retical concentrations were compared against the experimental values to obtain the recovery values.
Figure 3 Separation of 30 ng/mL solution of bisphenol F and bisphenol A using an Agilent ZORBAX Eclipse Plus C18 column. The chromatogram was collected using FLD settings of excitation at 230 and emission at 316 nm.
min6 7 8 9 10 11 12
LU
5
10
15
20
25
30
7.45
0
10.6
29
11.2
02
Bisphenol F
Bisphenol A
Unknown impurity

6
Limit of Detection (LOD) and Limit of Quantitation (LOQ)The analyte concentration that pro-vides a signal-to-noise ratio (S/N) of > 3 was considered as LOD and the analyte concentration with S/N ratio > 10 was considered as LOQ. A peak-to-peak method was used to cal-culate noise. Figure 4 shows a chroma-togram of BPA at the LOQ level overlaid with a blank (mobile phase) injection. For BPA, the LOD was 0.19 ng/mL with S/N = 4.3 and LOQ was 1.06 ng/mL with S/N = 15.1.
LinearityCalibration curves with linearity range (see Table 2) were prepared using an Agilent 7696A Sample Prep WorkBench. The WorkBench auto-mates the sample handling, providing consistent results. Different sets of linearity ranges can be prepared by simply rerunning the program. The linearity levels were established start-ing from the LOQ level of BPA. LOD and LOQ values, along with the linearity results are included in Table 4. LOD and LOQ values can be further decreased by increasing the injection volume but it was not necessary for this application since the values obtained from baby bottles were found to be within the linearity range.
Precision of retention time (RT) and areaThe area precision was measured as RSD(%) across the linearity levels. The maximum RSD value of 5.6% and 7.2% for level 1 (L1) were obtained for BPA and BPF respectively. Similarly, RT precision calculations showed a maximum RSD value of only 0.14% and 0.11% for the BPA and BPF. Graphical representation of area RSD values are shown in Figure 5.
min9 9.5 10 10.5 11 11.5 12 12.5
LU
2.9
3
3.1
3.2
3.3
3.4
3.5
3.6
3.7 10.6
75
11.2
49
10.6
48
Bisphenol AUnknown imp
Figure 4 A 20 µL injection of LOQ level, 1.06 ng/mL (21 pg on column) solution, of bisphenol A overlaid with blank injection. S/N ratio obtained at this concentration was 15.
Linearity level
RSD (%)
0
1
2
3
4
5
6
7
8
0 1 2 3 4 5 6 7 8
Bisphenol F
Bisphenol A
Figure 5 Area precision measured as RSD(%) for six replicates at each concentration level for BPA and BPF.
Sl no. NameLOD ng/mL S/N
LOQ ng/mL S/N Linearity range R2 value No. of levels
1 Bisphenol F 0.19 5.1 0.46 12.4 1.06 –171.43 0.99999 7
2 Bisphenol A 0.19 4.3 1.06 15.1 1.06–171.43 0.99998 7
Table 4 LOD, LOQ and linearity for BPA and BPF. Samples were prepared using an Agilent 7696A Sample Prep WorkBench. BPA levels found in polycarbonate baby bottles were within the linearity range.

7
was converted to concentration values. The low and high concentration values were compared against the theoretical value. The recovery experiment results are shown in Table 6. BPA shows a recovery value of 80% at the high concentration value. The value of 80% is higher than the value reported in the ASTM method where an average single laboratory results shows a recovery of 70%.
extent the performance remains unaf-fected by deliberately changing method parameters. However, some param-eters are critical and must be carefully controlled.
Recovery from sample matrixBPA-free baby bottles were used as blank matrix. The recoveries of the BPA and BPF were tested by spiking experi-ments in duplicates. A low standard spike contained BPA (30 ng) and BPF (30 ng) each spiked into 50 mL water extracts of BPA-free bottles. Another high standard spike consisted of BPA (50 ng), BPF (50 ng) each spiked into a 50 mL water extracts from BPA-free bottles. The analytes were extracted from the water sample as described above. Using the aqueous linearity curve (see section Linearity), the area
RobustnessTo test the robustness of the method, a standard solution containing 30 ng/mL of BPA and BPF was used. Six critical method parameters (flow rate, column temperature, injector volume, excita-tion and emission wavelength, step gradient and buffer concentration) were varied separately and data were collected for seven replicate injections. The compound peak areas from the last six replicates were compared for analy-sis. The allowed deviation for the area and retention time was set to ± 5% and ± 3% respectively.
The results of the robustness tests are summarized in Table 5. The red numbers indicate where the result exceeded the allowed deviation. A flow rate change of +2% resulted in a decreased area of the two bisphenols. Specifically for bisphenol A, the peak area was found to have the negative deviation caused by 2.5% change in column temperature. The resolution of BPA compared to the impurity (see RT 10.6, Figure 3) showed poor results when the temperature was increased and improved results when the tem-perature was decreased to 35 °C. A temperature of 40 °C was found to be better for sample analysis. Robustness results show the importance of main-taining the column temperature during the analysis. Setting the FLD excita-tion at 230 nm and emission at 316 nm was found to be ideal, as it displays the maximum peak area. The emission setting of 316 nm is robust since a variation of 3 nm does not deviate the area percentage from the allowed limit. The excitation wavelength however, needs to be controlled. A change in buffer concentration is also critical as a deviation of 10% decreases the peak area for both BPA and BPF. Robustness results indicate that the method is reliable for normal usage and to a great
Resolution BPF of BPA with BPA Parameters Changes % area % RT unknown % area % RT
Flow: 0.9 mL/min ± 2% High: 0.92 mL/min -4.6 -1.2 1.9 -5.1 -1.2 Low: 0.88 mL/min 0.1 1.9 1.9 -1.9 2.2
TCC: 40 °C ± 2.5% High: 41 °C -4.2 -0.4 1.7 -5.0 -0.6 Low: 39 °C -3.1 0.9 2.1 -10.0 1.3
Injector: 20 µL ± 5% High: 21 µL 2.6 0.2 1.9 0.0 0.2 Low: 19 µL -7.6 0.1 1.9 -9.8 0.1
Wavelength: 233–316 -2.2 0.0 1.9 -5.7 0.0 230–316 ±3 nm 227–316 -7.0 0.2 1.9 -4.6 0.2 230–319 -3.2 0.1 1.9 -4.5 0.1 230–313 -3.5 0.1 1.9 -3.0 0.1
Step gradient starting High: 2.2 min -3.8 2.9 1.9 -4.1 2.0 point: 2 min ±10% Low: 1.8 min -3.3 -2.4 1.9 -3.8 -1.5
Buffer concentration: High: 11 mM -4.2 0.2 1.9 -6.0 0.2 10 mM ±10% Low: 9 mM -5.9 0.1 1.8 -9.8 0.1
Compound nameRecovery low conc. (%)
Recovery high conc. (%)
Bisphenol F 70.2 75.9
70.1 74.1
Bisphenol A 76.9 79.6
75.1 81.1
Table 6 Recovery results from spiking experiments performed in duplicates.
Table 5 Robustness test method results compared to the standard method at concentration of 30 ng/mL. The red values in the table indicate that the deviations exceeding the allowed limits of 5% for area and 3% for retention time.

8
by Sun et al., who showed a value of 0.6 ng/mL5. If a baby of 10 kg were to drink 250 mL from brand 2 baby bottle, the baby would consume 0.1 µg/kg/day of BPA. This value is less than the reference dose of 50 µg/kg/day estab-lished by the EPA but is of concern according to some other studies6. The results also show that BPF was not detected in any bottle.
Sample analysisThe content of BPA and BPF in baby bottles was determined using the extraction procedure and the devel-oped chromatographic method. Baby bottles labeled as brand 1, brand 2, and brand 3, were analyzed in dupli-cates. The results of the analysis were compared against the calibration curve prepared prior to sample analysis. Blank water samples subjected to SPE did not show BPA, suggesting that no BPA leached out of plastics used in the experiment3. Different amounts of BPA were detected in the three brands of baby bottles (see Figure 6A). The BPA emission spectra from the standard was overlaid with the spectra from the sample. A good overlap was observed confirming the presence of BPA (see Figure 6B). Different brand analy-sis showed a high concentration of 4 ng/mL while a low value of 0.5 ng/mL (see Table 7). These values are con-sistent with those observed earlier
LU
3
5
7
9
6.79
8
7.84
1
10.6
79
11.2
45
LU
3
5
7
9
6.79
3
7.82
0
10.6
73
11.2
63
min5 6 7 8 9 10 11 12
LU
3
5
7
9
7.00
9
7.80
5 10.6
60
11.2
48
BPA
BPA
BPA
BPF at 7.4 min not found
nm280 300 320 340 360 380
Norm.
0
1
2
3
4
5
6
7
Standard
Brand 2Brand 3
Brand 2
Brand 1[A] [B]
Figure 6 [A] The overlay of chromatogram from three different baby bottles analyzed for BPA and BPF. [B] The overlay of the emission spectrum of BPA from standard and that obtained from brand 2 sample.
Table 7 Concentration of BPA and BPF extracted in 250 mL water from different brands of baby bottles.
Compound name
BPF (ng/mL)
BPA (ng/mL)
Brand 1 0 0.76
0 0.52
Brand 2 0 4.26
0 4.46
Brand 3 0 2.08
0 2.58

9
UHPLC methodThe HPLC method was transferred to an UHPLC method on an Agilent 1290 Infinity LC system keeping the same run time as shown in Figure 7. The transfer was performed to study the effect on resolution and sensitivity. The UHPLC method used the same mobile phase, gradient, and detector settings. The column dimensions were kept the same but the particle size was reduced from 5 µm to 1.8 µm for the UHPLC method. The peaks in the UHPLC method elute about 1.2 min-utes earlier, which is due to the lower delay volume in an Agilent 1290 Infinity LC system. The UHPLC method also showed narrower peaks and better resolution compared to the HPLC method. The peak properties such as peak area, peak height, peak width, resolution and S/N at the lowest lin-earity level L1 and the highest linearity level L7 are compared in Table 8. The results show that resolution of BPA increased from 1.9 in the HPLC method to 2.5 in the UHPLC method. The S/N ratio almost doubled thereby adding sensitivity and allowing the possibility to redefine the LOQ and LOD levels.
LU
0
50
100
150
6.26
7
7.46
8
10.6
67
11.2
55
min5 6 7 8 9 10 11 12
LU
0
50
100
150
5.19
4
6.28
8
9.46
5
10.0
22
1260 HPLC methodColumn: 4.6 × 100 × 5 µm
1290 UHPLC methodColumn: 4.6 × 100 × 1.8 µm
Unknown
Unknown
Bisphenol F
Bisphenol F
Bisphenol A
Bisphenol A
Unknown
Unknown
[A]
[B]
Figure 7 An overlaid chromatogram of the HPLC method [A] and UHPLC method [B] separating the level 7 standards for BPA and BPF on an Agilent ZORBAX Eclipse Plus C18 4.6×100 column. A 5 µm particle size was used for HPLC method while 1.8 µm was used for UHPLC method.
HPLC method UHPLC method
Compound name (Level)
Peak area
Peak width at half height
Peak height Resolution S/N
Peak area
Peak width at half height
Peak height Resolution S/N
BPF (L7) 1037.0 0.10 163.7 - 3683.0 930.5 0.07 199.6 - 6784.8
BPA (L7) 934.1 0.19 76.3 1.9 1715.7 825.8 0.13 96.4 2.5 3276.7
BPF (L1) 7.5 0.10 1.1 - 27.4 7.2 0.07 1.4 - 42.6
BPA (L1) 8.1 0.20 0.6 1.8 15.1 9.4 0.14 1.0 2.5 31.6
Table 8 Comparison of peak area, peak width at half height, peak height, resolution and S/N ratio between HPLC and UHPLC method from first level and last linearity level. The UHPLC method provides better sensitivity and resolution compared to the HPLC method.
10
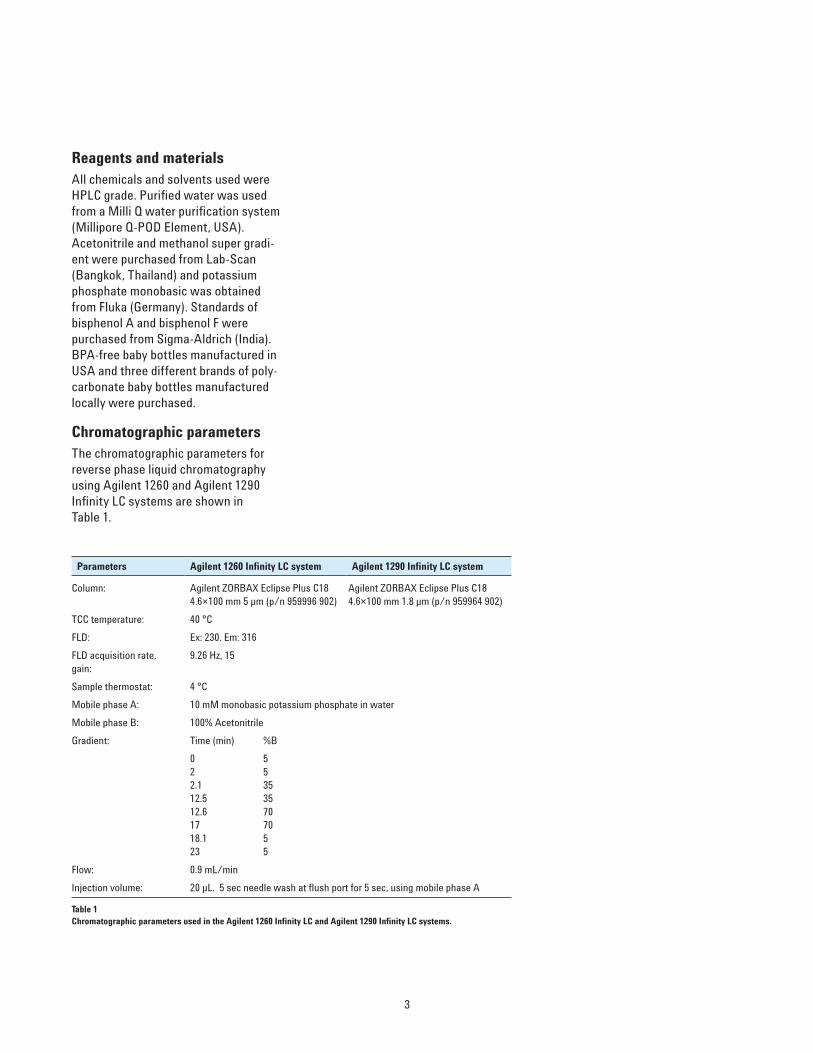
The calibration for BPA and BPF, when using the same calibration levels (see Table 2) was found to be linear - R2: 0.99991 for BPF and R2: 0.99993 for BPA. RSD(%) deviation on area and RT was calculated for all concentration levels. The results show that RSD(%) on area deviation was comparatively lower in the UHPLC method. As shown in Figure 8, a value of 3.0% was found for level 1 for BPA. The maximum RSD of RT for both BPA and BPF was less than 0.1%.
Conclusion
Bisphenol A and bisphenol F were separated and quantified using an Agilent 1260 Infinity LC system and an Agilent ZORBAX Eclipse Plus C18 column. Calibration standards were prepared using the Agilent 7696A Sample Prep WorkBench. A method was developed and partially validated. This method quantifies bisphenol A and bisphenol F from various baby bottles with 80% recovery values. The method can be applied to determine BPA and BPF levels for quality control of baby bottles. A method transfer to an Agilent 1290 Infinity LC system was effectively carried out by keeping the same detector and method condi-tions. Both HPLC and UHPLC methods were linear and give precise results. The UHPLC method however showed better resolution, S/N ratio, narrower peak width and increased peak height compared to the HPLC method.
Linearity level
RSD (%)
0
0.5
1
1.5
2
2.5
3
3.5
4
0 1 2 3 4 5 6 7 8
Bisphenol F
Bisphenol A
Figure 8 Area precision measured as RSD (%) for BPF and BPA with UHPLC. Six replicates at each concentration level were measured.
11
References
1. U.S. Environmental Protection Agency (U.S. EPA), Bisphenol A. (CASRN 80-05-7), http://www.epa.gov/iris/subst/0356.htm
2. A.Ballesteros-Gomez; S. Rubio; D.Perez-Bendito, “Analytical meth-ods for the determination of bis-phenol A in food,” j. Chrom A, 1216: 449-469, 2009.
3. ASTM method,”Standard Test Method for Determination of Bisphenol A in Environmental Waters by Liquid Chromatography/Tandem Mass Spectrometry,” D7574-09.
4. W.D. Snyder,” Agilent 7696A Sample Prep WorkBench: How to automate Preparation of a Sample Set by Serial Dilution for Measurement of Flame Ionization Detector Performance,” Agilent Application note, Publication Number, 5990-6850EN, 2010.
5. Y. Sun, M. Wada, O. Al-Dirbashi, N. Kuroda, H. Nakazawa, K. Nakashima, “High-Performance Liquid Chromatography with Peroxyoxalate Chemluminescence Detection of Bisphenol A Migrated from Polycarbonate baby bottles using 4-(4,5-diphenyl-1H-imidazol-2-yl)benzoyl chloride as a label,” J.Chrom B, 749: 49-56, 2000.
6. S.K. Ritter, “Debating BPA’s Toxicity. The Precautionary Principle Serves as a Dividing Line in Arguments Over the Safety of Bisphenol A,” Chemical & Engineering News, 89: 14-19, 2011.
www.agilent.com/chem/lc
© Agilent Technologies, Inc., 2011, 2017Published in USA, July 1, 2017Publication Number 5990-9398EN