Embed Size (px)
Citation preview

Aggregates Monitoring 2011
for
Bracknell Forest Reading
Slough West Berkshire
Windsor & Maidenhead Wokingham
for the period January 2011 – December 2011
01/13 February 2013

Contents page
Executive Summary i-ii
1 Scope of this Report 1 2 The NPPF and Guidance on the Managed Aggregate Supply System 1 3 Quarries 2 4 Rail Depots 3 5 Aggregates Recycling 3 6 Environment 4 7 Aggregate Consumption 4 8 Local Development Documents 4
Tables
1 Sand and Gravel – Sales, Permissions and Reserves 2011 6 2 Sales of Sand and Gravel 2002-2011 7 3 Sands and Gravels – Comparison between apportionment, 8
sales, permissions and reserves 2002-2011 4 Sand and Gravel Landbank 2002-2011 8 5 Sales of Aggregate at SE Rail depots 2003-2011 9
Appendices
A Active and Inactive Aggregate Quarries and Rail Depots 10
and Withdrawn Applications in 2011. C Key Milestones for DPDs at January 2013 13
at end 2011 B Planning Applications: Permissions, Refusals, Undetermined 12

Executive Summary
Scope of this Report
This Aggregates Monitoring (AM) 2011 report for the six unitary authorities (6UAs) in Berkshire has been prepared from returns made by the operators of quarries, rail depots and recycling and secondary sites. The 6UAs have provided data on applications and remaining allocations in the Replacement Minerals Local Plan for Berkshire incorporating the Alterations adopted in December 1997 and May 2001 (RMLP). The report also puts the findings in the context of the National Planning Policy Framework (NPPF) and Guidance on the Managed Aggregates Supply System (MASS).
The NPPF and Guidance on the Managed Aggregate Supply System
The NPPF reaffirms policy in earlier documents emphasising the importance of Mineral Planning Authorities (MPAs) making provision for a steady and adequate supply of minerals, taking into account the part substitute and secondary materials might provide; to define mineral safeguarding areas; to safeguard wharves and rail heads; and at the earliest opportunity to require the restoration of workings and aftercare to a high standard.
The NPPF extends the safeguarding requirements to include the consideration of processing facilities for bulk transport, and for plant such as for concrete batching or coated materials.
New elements in the NPPF state that MPAs should participate in an Aggregates Working Party (AWP); prepare an annual Local Aggregates Assessment (LAA); and consult and take into account the views of the AWP on the preparation of the MPAs’ LAAs and the provision to be made in their minerals plan.
The Guidance for MASS builds on the NPPF and sets out the ‘bottom up’ process to determine the appropriate level of aggregate extraction. It also gives advice to MPAs on the supply options that an LAA should cover and the sources from which data may be obtained.
Quarries
Sales of land-won sand and gravel in 2011 were some 1.1Mt tonnes compared with 1.0Mt in 2010.
Permitted reserves of sand and gravel now stand at 9.1Mt. Reserves have declined by some 36% in the ten years from 2002 to 2011.
i Planning permissions over the years 2002-2011 have kept pace with sales, ie
tonnage sold has been replaced by as much in new permissions.
The landbank based on the Proposed Changes to Policy M3 of the South East Plan stands at 6.8 years, but is over 7 years at the current rate of sales.
Rail Depots
Sales at the three active rail depots amounted to some 0.9Mt an increase of 20% on the previous year
84% of the sales was crushed rock, 90% of which came from South West England. The other 16% of sales was marine dredged sand and gravel from Thames wharves.
Aggregate Recycling
An incomplete survey identified sales of over 0.2Mt from Construction Demolition and Excavation Waste (CDEW) in substitution of primary aggregate.
Environment
Two of the quarries that were active in 2011 are within the Area of Outstanding Natural Beauty (AONB), together with one inactive quarry. Four active and one inactive quarry, and one rail depot are in Green Belt.
Aggregate Consumption
The 2011 survey did not include detailed data that would provide accurate consumption figures for the 6UAs.
Comparing the data recorded in 2011 with that in the national survey of 2009 which included figures for cross boundary movements, it is likely aggregate consumption by the 6UAs in 2011 was no less than 1.8Mt and perhaps 2Mt.
Local Development Documents
The minerals plan for the 6UAs is the 2001 RMLP for Berkshire. Steps are being taken by the Authorities to prepare for minerals (and waste) local plans, and West Berkshire intend to commence its minerals and waste specific plan in 2013.
ii

1. Scope of this report
1.1 This AM2011 report for the six Unitary Authorities in Berkshire is a monitor on primary aggregates sales from land-won sand and gravel sites and rail depots for 2011, permitted reserves at the sand and gravel sites at the end of 2011, and sales of recycled and secondary materials as aggregate at recycling sites. Data has been provided by operators and the individual returns have been collated. Only three of the Unitary Authorities have active sand and gravel quarries (West Berkshire, Windsor & Maidenhead and Wokingham) and only two have rail depots (West Berkshire and Slough). Returns from the operators of these sites have been good with only one estimate having to be made. However, the number of returns from the operators of recycling and secondary sites have been disappointing.
1.2 The report also updates the position on the current Replacement Minerals Local Plan and proposals for DPDs (see section 8 below and Appendix C).
2. The NPPF and Guidance on the Managed Aggregate Supply System
2.1 The planning context for this report is the National Planning Policy Framework (NPPF) and the Guidance on the Managed Aggregate Supply System (MASS)*. The NPPF states that minerals are essential to support economic growth and our quality of life. MPAs should, inter alia: - identify and include policies for extraction of mineral resource of local and national importance in their area whilst taking account of the contribution that
substitute or secondary materials might make to mineral supplies, - define Mineral Safeguarding Areas and adopt appropriate policies in order that mineral resources are not needlessly sterilised, - safeguard existing planned and potential rail heads, links to quarries, wharfage and processing facilities for bulk transport by rail, sea or inland waterways of minerals, including recycled, secondary and marine-dredged materials
- safeguard planned and potential sites for concrete batching, the manufacture of coated materials, other concrete products and the handling, processing and
distribution of substitute, recycled and secondary aggregate material - set out policies to encourage prior extraction of minerals where practicable and environmentally feasible
*National Planning Policy Framework, DCLG March 2012. Guidance on the Managed Aggregate Supply System, DCLG October 2012
1

- recognise that some noisy short term activities are unavoidable to facilitate minerals extraction - put in place policies to ensure that worked land is reclaimed at the earliest
opportunity and that high quality restoration and aftercare takes place.
2.2 MPAs should plan for a steady and adequate supply of aggregates by - preparing an annual Local Aggregates Assessment (LAA), either individually or jointly by agreement with other MPAs - participate in the operation of an Aggregates Working Party (Berkshire is in the South East England AWP) and taking the advice of the AWP into account when preparing their LAA - make provision for the land won or other elements of their LAA in their mineral plans, taking account of the advice of the AWPs and the National Aggregate Coordinating Group (NCG) as appropriate.
2.3 The Guidance on the Managed Aggregates Supply System (MASS) gives advice to MPAs on the supply options that an LAA should cover and advice on aggregate landbanks and their use. The Guidance sets out a ‘bottom up’ process in which LAAs are a key element. The AWP will draw together the figures for all the LAAs of the MPAs in its area and forward those figures annually to the NCG. The NCG will consider whether the totals provided by the AWPs make appropriate provision to maintain a steady and adequate supply of aggregate.
3. Quarries
Landwon Sand and Gravel
3.1 There were 10 active sand and gravel quarries producing aggregates in 2011 in three of the Unitary Authorities in 2011 (see Appendix A). Five of these were in West Berkshire, four in Windsor & Maidenhead and one in Wokingham. In addition there were two inactive quarries.
3.2 Sales, permissions and reserves data for sand and gravel in 2011 are shown in Table 1. Sales were some 1.1Mt in 2011, compared with some 1.0Mt of sales in 2010. There was one planning permission for 0.8Mt in 2011 (see Appendix B). This was the renewal of an earlier permission. Permitted reserves at the end of 2011 were some 9.1Mt. compared with some 9.8Mt at the end of 2010 (see Table 3).
3.3.1 Sales of land-won sand and gravel in 2011 were some 25% higher than in 2010. The figures exceed those for any of the last 9 years and have returned to the level at the turn of the century (see Table 2). Planning permissions over the ten
2

years 2002-2011 have kept pace with sales ie replacing the tonnages sold each year (see Table 3). There was only one undetermined application at the end of 2011, proposing to extract 760,000 tonnes of aggregate (see Appendix B). (although outside the period covered by this AM report, the application was refused and the subsequent appeal dismissed).
3.4 Reserves have declined by some 36%, some 5Mt since 2002 and the landbank for the six authorities as apportioned in the ‘Proposed Changes to Policy M3’** has declined to 6.8 years (see Table 4). This is below the ‘maintenance of landbanks of at least 7 years for sand and gravel’ referred to in the NPPF, but at the current rate of sales there is a landbank of over 7 years.
4. Rail Depots
Crushed Rock and Marine Sand & Gravel
4.1 There were 3 active rail depots in 2011, two at Theale and one at Colnbrook. Sales amounted to some 0.9Mt, an increase of over 20% on the previous year. Some 84% was crushed rock, the remainder marine sand and gravel. Over 90% of the crushed rock was imported from the South West, the other 10% from South Wales and Northern Ireland.
5. Aggregates Recycling
5.1 The number of returns from operators of recycling sites to the AM2011 survey was disappointing. Of 23 sites contacted, only 11 replied. Five of these made no sales, were under restoration, or were closed. The 6 active sites which made returns provided sales of over 200,000 tonnes of recycled aggregates from CDEW. Some 30% of this was to a regular size specification, 40% of mixed size specification and 30% for constructional fill. These five sites have a capacity of over 400,000 tonnes ie double that currently handled.
5.2 The lack of returns from operators means that the above figures are only a partial and incomplete record of recycling in the six Unitary Authorities in 2011. However, with less than half the returns being made, it may be assumed that recycling in 2011 would be perhaps at least double the figures recorded.
**Revocation of Regional Strategies, letter signed by Steve Quartermain, DCLG Chief Planner 26 July 2010 advising MPAs in the South East to work from these apportionment figures.
3

6. Environment
6.1 Two of the quarries that were active in 2011 are within the AONB, together with one inactive quarry. Four active quarries, one inactive quarry and one rail depot are in Green Belt.
7. Aggregate Consumption
7.1 The AM2009 four yearly national survey of primary aggregates*** showed that the six Unitary Authorities consumed 1.8Mt in that year, 0.8Mt of land-won
sand and gravel, 0.1Mt of marine dredged sand and gravel and 0.9Mt of crushed rock.
7.2 The 2011 survey does not include data to give accurate consumption figures. However, some assumptions may be made through comparisons with the AM2009 national survey. In 2009 net exports were 4% of the land-won sand & gravel extraction. If the same ratio applied in 2011, net imports would result in consumption from land-won sand and gravel at 1.1Mt. Imports of marine sand and gravel in 2011 were maintained at 0.1Mt. At 0.8Mt, crushed rock imports by rail were 0.1Mt less than crushed rock imports in 2009. It appears likely that consumption in 2011 would not be less than in 2009 and might be some 2Mt.
8. Local Development Documents 8.1 The current, adopted Minerals Plan for the six Unitary Authorities is the
Replacement Minerals Local Plan for Berkshire May 2001, incorporating Alterations adopted in December 1997 and May 2001. A number of policies in the RMLP are saved until they are replaced by national or local minerals and waste policies. Planning decisions are taken in accordance with these policies unless material considerations indicate other wise.
***Collation of the results of the 2009 aggregate minerals survey for England and Wales, BGS for DCLG May 2011.
4
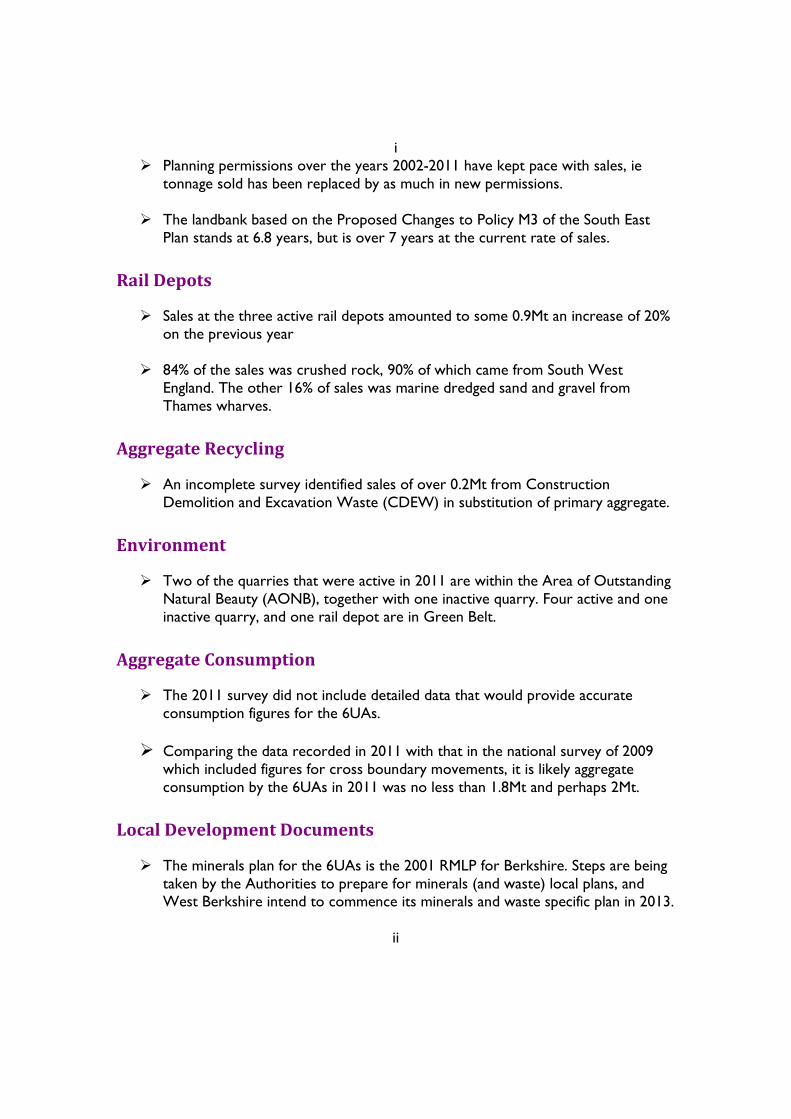
8.2 The RMLP identified some 14 Preferred Areas for aggregate extraction thought to contain nearly 12Mt of aggregate, and sites to be safeguarded for possible rail depots. Clearly much aggregate has been extracted in the ensuing years and the rail depot at Colnbrook has been established. However, parts of the Preferred Areas have not been subject of a planning application and appear to contain perhaps 5Mt or more tonnes of aggregate.
8.3 Each Unitary Authority in Berkshire is now responsible for minerals and waste planning in its own area. Currently, only West Berkshire has proposals to develop a Minerals & Waste Specific DPD. Work commenced on this DPD in 2012 with a view to commencing stakeholder involvement during 2013, and with an anticipated adoption date in 2015.
8.4 Joint working by all Berkshire UAs continues to maintain the evidence base for Berkshire as a single entity. The six Unitary Authorities have agreed to work together on the production of one Local Aggregate Assessment for Berkshire.
8.5 Slough BC is consolidating all its planning policies, including minerals into a Composite Plan. Other Berkshire UAs have set out their own timetables – see Appendix C.
5

TABLE 1: SAND & GRAVELS - SALES, PERMISSIONS AND RESERVES 2011 ( Berks Unitary Authorities, thousand tonnes)
Unitary Authority Soft Sand (Building Sand) Sharp Sands and Gravels Total: All Sands and Gravels
Reserves at start of year
Sales during year
Permissions during year
Reserves at end of year
Reserves at start of year
Sales during year
Permissions during year
Reserves at end of year
Reserves at start of year
Sales during year
Permissions during year
Reserves at end of year
Bracknell Forest
Reading
Slough
West Berkshire
Windsor & Maidenhead}
Wokingham }
0 0 0
0 0 0
0 0 0
c c 0
0 0 0
0
0
0
c
0
0 0 0 0
0 0 0 0
0 0 0 0
1,556 275* 0 729*
800 8,288 852 8,365
0
0 0 0 0
0 0 0 0
0 0 0 0
1,556 275* 0 729*
800 8,288 852 8,365
0 Totals c c 0 c 9,844 1,127 800 9,094 9,844 1,127 800 9,094 Source: AM2011 Survey
Footnotes to Table 1 c = confidential figure or figure which cannot be recorded without revealing a confidential figure 0 = nil sales or less than 500 tonnes The figures include an estimate for 1 site for which a return was not received *To protect confidentiality, West Berks sales and reserves include a small percentage of soft sand Wokingham sales and reserve figures are added to Windsor & Maidenhead in order to preserve confidentiality for the one active quarry. The permitted reserves do not include reserves at dormant sites. The figures for sharp sands and gravels include some 3% sold for construction fill. Reserves at the end of the year reflect not just sales and permissions, but also operators reassessments of reserves.
6

TABLE 2: SALES OF SOFT SAND AND SHARP SAND AN GRAVEL 2002-2011 (SE Region, thousand tonnes)
YEAR
Soft Sand Sharp Sands and Gravels
All Sands and Gravels
Sales % change on
previous year
Sales % change on
previous year
Sales % change on previous year
2002 3,064 0 8,418 -10 11,482 -7% 2003 2,662 -13 7,976 -5 10,638 -7% 2004 2,624 0 7,781 -2 10,405 -2% 2005 1,749 -33 7,604 -5 9,713 -6% 2006 1,776 1 7,027 -8 8,804 -9% 2007 1,906 7 6,596 -4 8,502 -3% 2008 2,268 19 5,031 -24% 7,299 -14% 2009 1,387 -39 4,620 -8 6,007 -18% 2010 1,676 21 *4,504 -3 *6180 3% 2011 1,524 -9 4,300 -5 5,824 -6%
Percentage Change 2002-2011 -50% -49% -49%
Sources: AM2010 Table 2 and Table 1 of this report
Note: aggregate for construction fill has been included with sharp sand and gravels
* includes corrected figure for Berkshire
12

TABLE 3: SANDS AND GRAVELS - COMPARISON BETWEEN APPORTIONMENT, SALES, PERMISSIONS AND RESERVES 2002-2011 (Berkshire Unittary Authorities, million tonnes)
Year Regional Apportionment Sales
Planning permissions
Reserves
2002 1.5 1.0 1.2 14.2 2003 1.5 1.0 1.1 13.5 2004 1.57 1.0 0 12.0 2005 1.57 0.6 0.4 9.1 2006 1.57 0.6 0.0 9.9 2007 1.57 0.8 0.7 9.0 2008 1.57 0.8 2.8 12.6 2009 1.33 0.8 2.1 10.0 2010 1.33 *1.0 0.2 9.8 2011 1.33 1.1 0.8 9.1
10 year total 8.7 9.3
10 year average 0.9 0.9
last 3 year average 1.0 1.0
Sources: AM2002-2011 surveys
Footnote to Table 3 Apportionment has varied over the years. 2009-2011 based on 'Proposed Changes' to Policy M3 * corrected from published AM2010 figure
TABLE 4: SAND & GRAVEL LANDBANK 2002-2011 (Berkshire Unitary Authorities)
Year All Sands and Gravels
Apportionment (million tonnes)
Reserves (thousand
tonnes) Landbank at end
of 2002-2011
2002 2003 2004 2005 2006 2007 2008 2009 2010 2011
1.5 1.5
1.57 1.57 1.57 1.57 1.57 1.33 1.33 1.33
14,196 13,490 11,996 9,089 9,829 8,990
12,566 9,991 9,845 9,094
9.5 9.0 7.6 5.8 6.3 5.7 8.0 7.5 7.4 6.8
Sources: AM2002-2011
Footnote to Table 4 Apportionment has varied over the years. 2009-2011 based on 'Proposed Changes' to Policy M3

TABLE 5: SALES OF AGGREGATE AT SE RAIL DEPOTS 2003-2011 (thousand tonnes)
County n/a 2003 2004 2005 2006 2007 2008 2009 2010 2011
Berks and Hants 2,095 2,299 1,762 1737 1,935 1369 1,094 1,054 1,215 Bucks, Milton Keynes 996 689 790 791 887 733 447 729 659 and Oxfordshire Kent 359 582 575 572 594 581 414 356 446 Surrey & West Sussex 594 587 557 557 669 657 621 888 949 Totals 4,044 4,157 3,685 3,657 4,085 3,340 2,576 3,027 3,269
Source: AM2010 Table 9 and AM2011 survey
Footnotes to Table 5 Some 90% of the aggregate received at rail depots is crushed rock, 5% land-won sand & gravel and 5% marine aggregate.
9

Appendix A Active and Inactive Aggregate Sites, Rail Depots and Recycling and Secondary Aggregate sites in 2011
Sand & Gravel
Site Operator Grid Ref Type of Aggregate
Horton Brook Quarry Aggregate Industries Jayflex TQ 025 775 s&g Eversley Quarry, (Fleethill Farm) CEMEX SU 850 625 sand/s&g Kingsmead Quarry, Horton CEMEX TQ 010 753 s&g Kennetholme 2, Midgham S Grundon Ltd SU 552 661 s&g Old Kiln Farm, Chieveley S Grundon Ltd SU 484 726 ssand/s&g Harts Hill Copse, Upper Bucklebury Harleyford Aggregates Ltd SU 531 687 ssand/s&g Midgham Quarry, Bath Road Marley Eternit Ltd SU 552 666 s&g Sheephouse Farm, Maidenhead Summerleaze Ltd SU 890 835 s&g Upper Bray Road, Maidenhead Summerleaze SU 903 790 s&g Lower Farm Greenham Tarmac Ltd SU 500664 sand/s&g Craven Keep, Hampstead Marshall Earthline Ltd SU 417 665 s&g Star Works, Knowl Hill S Grundon Ltd SU 815 797 s&g
Rail Depots
Site Operator Grid Ref Type of Aggregate
Colnbrook Aggregate Industries TQ 042 777 s&g/cr Theale Aggregate Industries SU 635 706 s&g/cr Theale Hanson SU 635 704 cr

Sites Producing Secondary & Recycled Aggregates
Site Operator Grid Ref Type of Aggregate
Copyhold Fm Quarry, Priors Ct Road, Curridge
Copyhold WTS SU 493 729 C&D
St Georges Lane, Ascot Shorts Transfer Station SU 927 685 C&D Whitehouse Farm, Silchester Road, Tadley
J Stacey SU 608 627 C&D
Hindhay Quarry, Maidenhead Summerleaze SU 867 830 C&D Poyle Recycling Centre Wiggins Transport Ltd TQ 027 760 C&D
No response from the following possible sites in 2011 survey:
Trafford Road, Reading M Collard SU 704 742 C&D Barton Court Farm, Station Road, Kintbury
Hills Waste SU 387 676 C&D
Horwood, Kimber Lane, Maidenhead
Horwoods SU 886 790 C&D
Horwoods Yard, Green Lane, Maidenhead
Horwoods SU 895 806 C&D
Gallymead House Transfer Station Rosary Fm
Lanz Farms TQ 037 765 C&D
Reading Quarry, Berry Lane, Pingewwod
J Mould SU 686 697 C&D
Unit 3, 40 Wigmore Lane Reading Reynolds Skip Hire SU 693 743 C&D St Georges Lane, Fowfields, South Ascot
St Georges Lane WTS SU 927 685 C&D
Simpson Way, Slough Simpson Environmental Services
SU 969 805 C&D
Stafferton Way, Braywick, Maidenhead
TWA Sewage works SU 895 803 C&D
Avon Site, Colthrop United Asphalt SU 535 670 C&D Herons Nest WTS, Sheffield Bottom, Theale
Hadleys SU 676 706 C&D
Slough Scrap Metal Johal TQ 025 774 C&D Weirside, Green Lane., Burghfield, Reading
Rawlings SU 682 706 C&D

Quarries
Rail Depots
Recycling and Secondary
Appendix B Aggregate Applications: Permitted, Refused, Undetermined or Withdrawn in 2011
Mineral NGR Applicant Site type Reserves (tonnes)
Permitted, Refused, Undetermined or Withdrawn
AONB SSSI/ NNR
SPA/ SAC
Green Belt
West Berkshire: Old Kiln Farm, Chievely
Soft sand SU 484 726 S Grundon Ltd New: adjacent to existing where permission has expired.
760,000 Undetermined AONB
Windsor & Maidenhead: Land north of Horton
Sand & gravel Rayner Family Trust
Lateral extension renewal
(800,000) Permitted Jan 2011
GB
- -
none
-Capacity
none
12

Appendix C
Key Milestones for Minerals DPDs (and SPDs) in Berkshire Unitary Authorities February 2013
MPA DPD or SPD title Comments Berkshire Unitary Authorities
The Minerals Plan for the six Unitary Authorities is the Replacement Minerals Local Plan for Berkshire, incorporating the Alterations adopted in December 1997 and May 2001.
New working arrangements have been put in place between Berkshire UAs for maintaining an evidence base for Berkshire. The Unitary authorities have agreed to prepare one joint Local Aggregates Assessment.
Bracknell Forest
The future of minerals and waste planning is currently under review.. A new Local Plan for Bracknell Forest is included in the current LDS which will consider the need for minerals and waste and management policies Evidence gathering & SA Scoping Sept 2012-Dec 2013 Public Participation Jan 2014-Mar 2015
Reading Reading Borough Council is currently considering the way forward and has not decided on any milestones.
Slough Slough Borough Council is producing a Composite Slough Local Development Plan demonstrating compliance with the National Planning Policy Framework. This incorporates recently adopted Development Plan Documents, and any Saved Local Plans policies(including those from the 2001 Replacement Berkshire Minerals Local Plan). Following a period for comment closing at the end of March 2013, a Final Document will be published by July 2013.
West Berkshire West Berks intend to progress a minerals & waste DPD through consultation in 2013 with aim of adoption in 2015/2016.
Wokingham The future of minerals and waste planning is currently under review. A new Minerals and Waste Local Plan for Wokingham Borough is included in the LDS (Jun2012-Jun 2015): SA Scoping Report consultation Jan – Feb 2014 Issues and Options consultation Mar – Apr 2014
Pre Submission consultation Jun – July 2014

MPA DPD or SPD title Comments Royal Borough of Windsor & Maidenhead
Whilst the future of minerals and waste planning is currently under review within the context of joint working with the Berkshire UAs, until such time as RMLP is reviewed, the Council is seeking to include skeleton policies on sharp sand and gravel to directly link into and support existing saved policies in RMLP within its own Borough Local Plan. Consultation on the draft BLP will be undertaken during the summer of 2013 with the aim of submitting the Plan in March 2014.
13


![AWP [UandiStar.org]](https://img.pdfslide.us/doc/110x75/563dbaa4550346aa9aa72043/awp-uandistarorg.jpg)