Embed Size (px)
Citation preview
CONTENTS
AGGREGATE PROTECTION GUIDANCE
Arizona Rock Products AssociationPhoenix, Arizona
PREPARED BYHaley & Aldrich, Inc.Phoenix, Arizona
APRIL 2015

AGGREGATE PROTECTION GUIDANCE
PREPARED FOR: ARIZONA ROCK PRODUCTS ASSOCIATION PAGE 1 OF 15
The passage of the Aggregate Protection Act (SB 1598) created a significant opportunity for counties, municipalities, and special districts to work productively with the mining industry to ensure the sustainable growth of our communi-ties. This can be achieved because SB 1598 establishes a framework and new requirements for planners and commu-nity leaders to responsibly address one of the most critical elements affecting the viability of future development; the availability of affordable construction materials. These valuable construction materials primarily consist of sand, aggregate, and crushed rock or stone but can also include cinder, decomposed granite, and pumice all of which are the crucial building materials for every residential, commercial, industrial, and infrastructure project.
Figure 1: Residential development encroaching on active mining operations frequently creates conflicts over noise, dust, and traffic concerns.
Over the years, population growth in Arizona has signifi-cantly expanded the urban boundaries of many communities. This expansion has resulted in the development of residen-tial communities in rural areas, often in close proximity to existing aggregate operations. Ironically, while the location of these mines assured an abundance of low cost construc-tion materials, the industrial nature of these operations frequently creates conflict with the local residents over concerns about noise, dust, and traffic impacts. Further, some areas of Arizona are experiencing shortages of
permitted aggregate resources, which results in producers having to transport aggregate from more distant quarries. This results in higher materials prices, increased traffic and congestion, and greater vehicle emissions.
These conditions can be particularly intense where local zoning regulation, or the absence of such regulations, have allowed the construction of residential communities imme-diately adjacent to ongoing or planned mining operations. Oftentimes, when mines and communities interact in an unplanned manner, citizen frustration can quickly esca-late, and community leaders and regulators are frequently barraged by complaints, with only limited authority and few viable options to retro-actively address these conditions. Where mitigation alternatives are possible, such as modi-fying traffic patterns or hours of operation, the alternatives are oftentimes difficult and costly to implement because they were not originally contemplated during the develop-ment of the area.
In many areas, communities have failed to recognize the importance of locally available aggregate resources and purposefully or inadvertently prohibited quarry development or allowed community development to overlay or encroach upon valuable aggregate deposits. This often results in the loss or “sterilization” of valuable aggregate resources as communities or other permanent development is built over these deposits. Unfortunately, these types of planning decisions do not alter the future aggregate demands of their communities and the loss of aggregate reserves will inevi-tably lead to material shortages and resultant increases in aggregate costs.
As the population of Arizona continues to grow, it becomes readily apparent that neither of these scenarios achieves a balanced and sustainable development model. However, when community planners fully understand and embrace their need for affordable aggregate resources, then communities can develop adaptive management strategies and achieve financially and environmentally-sustainable growth well into the future. As part of this process, it is imperative to encourage proper land use development and planning within communities to ensure long-term aggregate resource availability.
INTRODUCTION
AGGREGATE PROTECTION GUIDANCE
PREPARED FOR: ARIZONA ROCK PRODUCTS ASSOCIATION PAGE 2 OF 15
BACKGROUND AND INTENTSB 1598 simply requires that General Plans be revised or amended to identify aggregates in the planning area and that planners develop policies to preserve these aggregates for future use by avoiding incompatible land uses. The excerpted requirements of the law are included below:
As part of a proactive public outreach program, the Arizona Rock Products Association (ARPA) committed to developing a practical guidance document which could serve as an important resource for planners who are amending General Plans to conform to the requirements of SB 1598. This docu-ment provides information essential to identifying aggregate resources in municipal or county planning areas and offers practical guidance in developing strategies and policies for protecting those resources. This guidance document will also assist planners working for state, county, and municipal governments in understanding:
• The nature and availability of aggregate deposits
• Methods for calculating future aggregate needs of their communities and planning districts
• The relationship between the aggregate availability and development cost
• Environmental benefits from proper planning of future aggregate production
• Ways to avoid unnecessary conflict between aggregate production and various land uses
• Strategies for influencing productive reclamation and post-mining land use to achieve long-term planning goals.
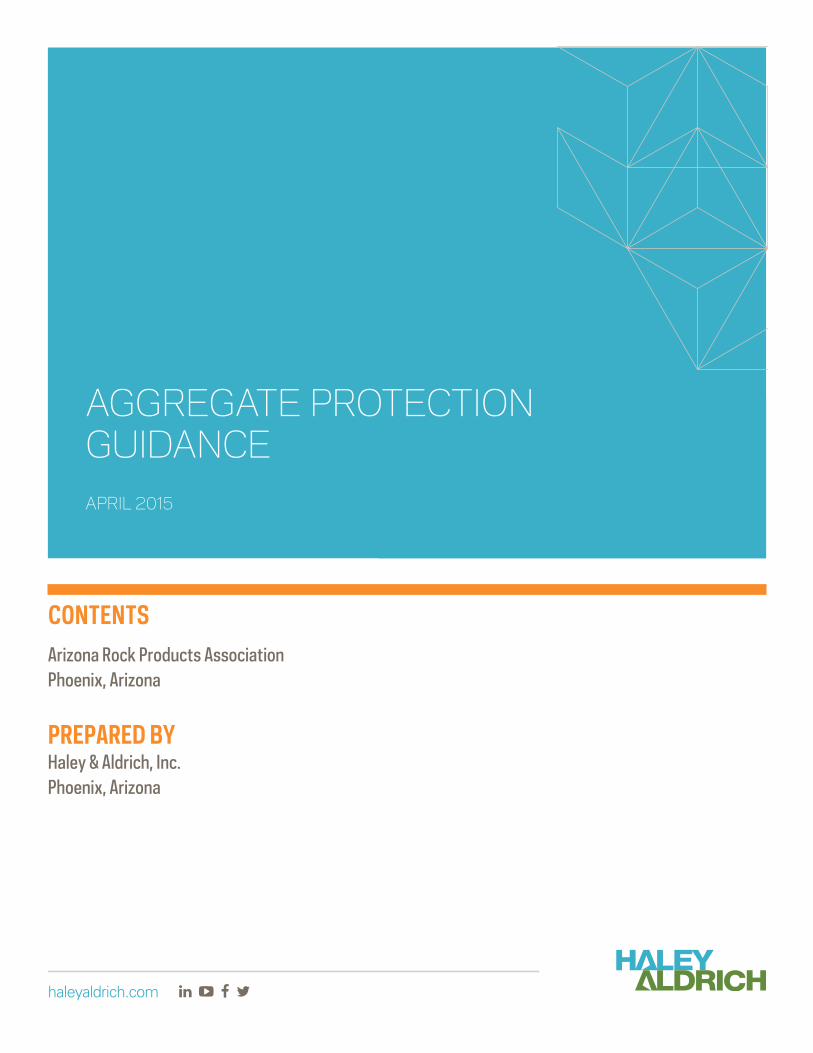
Because of the mining exemptions granted in Arizona Revised Statutes (A.R.S), county planners have less input on the location or regulation of aggregate mining operations in unincorporated areas of the state. But, county planners can identify the regional sources of aggregates in their planning jurisdictions and encourage the responsible management of those resources by addressing related transportation, devel-opment and mine reclamation efforts. Therefore, General Plans should identify aggregate production areas, discuss the intrinsic value of these resources, and link the viability of these areas with low cost infrastructure and development growth for the county.
Figure 2: The majority of aggregates are mined from unconsolidated alluvial deposits found in and along active river systems.
UNDERSTANDING AGGREGATE RESOURCESMineral deposits, by their very nature, are unique and finite resources. The conditions that create economically-extract-able resources result from a complex interaction of geologic and depositional environments. Unfortunately, society cannot influence the location of these resources, nor can we change the unique characteristics of these deposits. As such, communities that are endowed with abundant mineral resources suitable for mining possess a valuable and essen-tial component to long-term sustainability. Like any other valuable commodity, planners should diligently protect and responsibly use these materials for the benefit of existing and future generations.
Although aggregate resources in Arizona tend to be more prevalent than other types of mineral deposits (such as potash, copper or gold), exacting physical and chemical specifications of the construction industry significantly influ-ence the suitability of these materials for use in concrete, asphalt and other durable construction materials. Further, limitations associated with land position and configuration, permitting requirements and proximity to the market signifi-
9-461.05. General plans; authority; scope
(g) Includes sources of currently identified aggregates from maps that are available from state agencies, policies to preserve currently identified aggregates sufficient for future development and policies to avoid incompatible land uses, except that this subdivision shall not be construed to affect any permitted under-ground storage facility or limit any person’s right to obtain a permit for an underground storage facility pursuant to title 45, chapter 3.1.
AGGREGATE PROTECTION GUIDANCE
PREPARED FOR: ARIZONA ROCK PRODUCTS ASSOCIATION PAGE 3 OF 15
cantly impacts the viability of any given aggregate resource. Consequently, while aggregate resources may be somewhat more abundant, these other factors inevitably reduce the location, quantity, and availability of economically-extract-able resources.
Thus, if development is allowed to encroach near or over these deposits, vast tracts of aggregate resources can become permanently and irrevocably inaccessible to extraction. However, these resources cannot simply be moved to a more convenient or remote location nor can replacement deposits be easily developed. This sterilization process is largely permanent and can significantly impact the cost of resources for future development because construction materials will need to be imported from more distant mines not impacted by urbanization. As discussed in later sections, the proximity of aggregate resources to the point of use has the greatest impact on the cost of those aggregates and the resultant construction products that use these materials. There are also dramatic environmental, safety and infrastructure impacts associated with hauling aggregate resources great distances to their points of use.
In Arizona, the most prevalent type of aggregate deposits is known as alluvial materials. Simply stated, alluvial materials are transported and deposited by streams and rivers. Alluvial systems erode bedrock materials from higher elevations and transport these materials downstream. Major river systems in Arizona, such as the Gila, Salt, Colorado, San Pedro, and Santa Cruz, have created vast aggregate deposits within the floodplains and floodways of these systems.
Alluvial materials are highly valued because the transport and depositional forces that create these deposits have also washed, sorted, and broken down the rocks. These processes tend to remove less desirable materials and make mining and processing easier. Also, these types of deposits are often unconsolidated (meaning that the materials are not cemented or lithified) and thus can be easily excavated.
These factors generally make alluvial deposits more desir-able because they generate less waste material and can be more economically mined and processed than other aggre-gate sources.
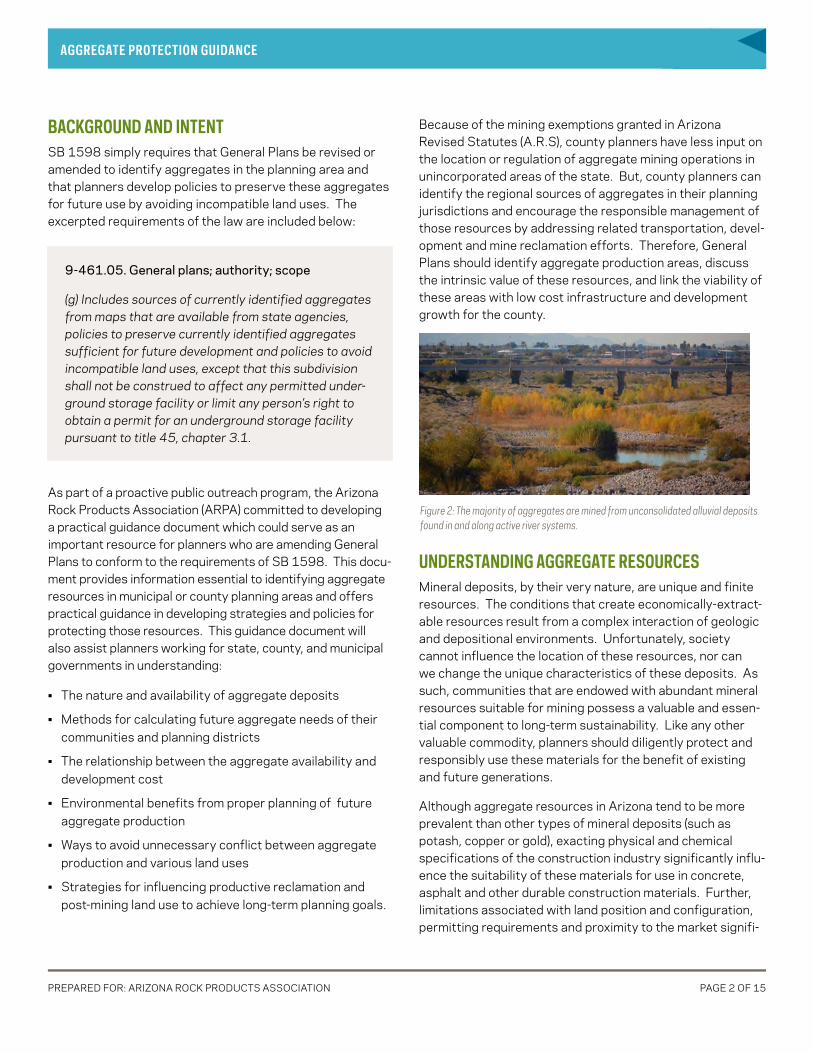
In areas with insufficient quality or quantities of alluvial materials, aggregates have to be produced by mining and processing competent bedrock deposits. These types of deposits typically require more expensive mining techniques,
such as drilling and blasting and extensive processing, to produce suitable aggregate materials. Although there can be very large rock deposits, the increased mining and processing requirements of crushed stone or “manufactured” aggregates typically make them more expensive and less desirable as compared to alluvial materials. Approximately 15 percent percent of all aggregates produced in Arizona are from crushed stone deposits and in some areas bedrock deposits may be the only source of construction aggre-gates. Therefore, suitable bedrock deposits also need to be protected from development or conservation easements.
Figure 3: Aggregates can also be “manufactured” from mined bedrock deposits.
HOW GREEN ARE YOUR AGGREGATES? What are the benefits of locally-produced aggregates? The answers may surprise you when you consider the total impacts of importing aggregates into your community. In addition to their lower costs, locally-produced aggregates require less fuel for transport; produce less traffic congestion, traffic accidents and reduced road wear; have lower air emissions and a smaller carbon footprint over imported aggregates.
Local studies in Arizona have not evaluated this, but in California where longer hauls (average 50 miles) are commonplace the effects of transportation can be signifi-cant. In 2005, the California Department of Transportation (Caltrans) estimated that transporting aggregates from mines to consumers generated 18.8 million truck trips per

AGGREGATE PROTECTION GUIDANCE
PREPARED FOR: ARIZONA ROCK PRODUCTS ASSOCIATION PAGE 4 OF 15
year. With an average haul distance of 50 miles, these trips generated over 940 million miles of transportation-related impacts to the state.
But, if they reduced the haul distance by 30 percent (to 35 miles) the effect was reducing truck miles by 282 million miles and reducing diesel fuel consumption by approximately 44 million gallons. This in turn reduces truck emissions (CO, NOx, PM10, SOx and VOCs) by approximately 835 tons per year. Additionally, Caltrans estimated that reduced haul distances would generate a state-wide transportation cost savings of $705 million, reduce capital project costs by over $108 million and generate from $12 to $18 million in pavement rehabilitation cost savings. They also note that reduced travel distances would also reduce congestion and traffic-related accidents on the roadways.
But what does that mean in Arizona? At peak production levels in 2006, Arizona produced 94.1 million tons of aggre-gates plus an additional 15 million tons of crushed stone.
At 25 tons per truck, this generated 8.73 million truck trips (including empty trucks returning to the mines) travel-ling more than 174 million miles (conservatively assuming a 20 mile haul distance) in Arizona. Using California Air Resources Board emission factors, these trips required more than 26.7 million gallons of diesel fuel and generated more than 506.9 tons of truck emissions.
Clearly, transportation related factors are significant. Thus, developing local sources would significantly reduce both the impacts and costs related to transporting aggregates. This reduces project costs, makes roadways safer and less
congested, reduces maintenance costs associated with pavement rehabilitation, and makes the air cleaner.
DETERMINING AGGREGATE DEMAND IN YOUR PLANNING AREAThe maintenance and upgrade of existing infrastructure, as well as future development, requires substantial amounts of construction aggregates. The demand for aggregates from existing development is created when infrastructure is maintained or replaced and when new commercial, munic-ipal, or residential construction replaces or revitalizes aging development. While this baseline aggregate demand can be significant, it is comparatively lower than the aggregate needs of rapidly expanding communities with new develop-ment and expanding infrastructure. However, it is incorrect to assume that aggregate needs of fully “built-out” commu-nities are zero. Therefore, to realistically quantify the total aggregate needs of your planning area one must consider both the baseline as well as future aggregate demands.
Future aggregate needs for a particular planning area can be simply estimated based on existing population as well as future growth projections already established for your plan-ning areas. The existing population is used to benchmark the baseline aggregate demands and the growth projections will determine the increased future aggregate needs associated with planned development.
The California Department of Conservation-California Geological Survey (CGS) has extensively studied aggregate demand and supply trends for nearly three decades. In their long-term analysis of the various market and production areas of California, the CGS calculated a long-term average per capita aggregate consumption rate of approximately 6.6 tons per person per year (tons/person/year). It is important to note that this value represents a long-term average consumption rate for California. On a short term basis, this number could be much higher or lower depending on market conditions and the intensity and rates of development.
But Arizona is much different than California, and according to the United States Geologic Survey (USGS) Mineral Industry Surveys, Arizona has produced nearly 750 million tons of construction sand and gravel and 134 million tons of crushed stone from the years 2000 to 2011. During this time, the per capita consumption of these materials
In 2006, Arizona produced 109 million tons of aggregates and crushed stone. Transportation of these materials generated 8.73 million truck trips travelling more than 174 million miles. This required more than 26.7 million gallons of diesel fuel and generated over 506.9 tons of truck emissions!

AGGREGATE PROTECTION GUIDANCE
PREPARED FOR: ARIZONA ROCK PRODUCTS ASSOCIATION PAGE 5 OF 15
averaged approximately 12.2 tons/person/year. However, during times of peak development activity (2004 to 2007), per capita consumption exceeded 15 tons/person/year and actually peaked at over 17 tons/person/year. Conversely, at the deepest part of the recession, per capita consumption dropped significantly, but never below 6.3 tons/person/year.
Therefore, when estimating per capita consumption for most of the large metropolitan areas in Arizona (Phoenix, Scotts-dale, Mesa, Tucson, etc.) an average per capita consumption rate of approximately 10.0 tons/person/year is realistic. For suburban areas where significant anticipated growth is planned (Florence, Queen Creek, Marana and Buckeye, etc.), one should anticipate per capita consumption rates exceeding 12.0 tons/person/year. When estimating per capita consump-tion in rural communities (Globe-Miami, Winslow, Quartzite and Willcox, etc.) an average per capita consumption rate of approximately 15.0 tons/person/year is appropriate. Natu-rally, a large infrastructure project in these relatively small markets may cause a significant, albeit temporary, increase in per capita demand.
Why are per capita consumption rates for rural communi-ties so high relative to more developed urbanized areas? Because the relative low density of rural development, higher
percentage of single family homes and remoteness to other urban centers equates to relatively higher transportation and infrastructure costs. In fact, Oregon found that some rural counties used 30 percent more aggregates than larger coun-ties with 20 times the population.
Production Year
AZ Construction Sand and Gravel
(million metric tons)
AZ Crushed Stone (million metric tons)
AZ Population (millions-approximate)
AZ Consumption per Capita
(metric tons)
2000 59.4 9.2 5.1 13.52001 52.9 8.3 5.3 11.52002 53.8 8.2 5.5 11.32003 62.6 10.0 5.6 13.02004 79.5 14.1 5.8 15.42005 84.9 12.0 6.1 15.92006 94.1 15.0 6.3 17.32007 85.8 17.1 6.5 15.82008 66.6 14.4 6.6 12.32009 40.2 9.1 6.7 7.42010 36.0 8.2 6.4 6.92011 32.0 8.3 6.4 6.3
Totals 747.8 133.9 6.0 (average) 12.2 (average)
Note: Population data from the Arizona Department of Administration, Office of Employment and Population Statistics
Development Intensity
Approximate Per Capita Consumption
(tons/person/year)
Impact of Large Infrastructure Projects on Per
Capita Demands
Metropolitan 10.0 LowSuburban 12.0 Moderate
Rural 15.0 High

AGGREGATE PROTECTION GUIDANCE
PREPARED FOR: ARIZONA ROCK PRODUCTS ASSOCIATION PAGE 6 OF 15
CALCULATING FUTURE AGGREGATE DEMANDS IN YOUR COMMUNITYUsing the average per capita aggregate demand for Arizona, the population based formula can be expressed as follows:
As an example, if a suburban community had a current popu-lation of 550,000 persons and was experiencing significant development growth, the yearly aggregate consumption of the community would be estimated as follows:
550,000 persons * 12.0 tons/person/year= 6,600,000 tons/year
However, a metropolitan community with the same popula-tion but essentially fully developed, the future aggregate needs of the community would be estimated as follows:
550,000 persons * 10.0 tons/person/year= 5,500,000 tons/year
Finally, a rural community with the same population but spread over a large area, the future aggregate needs of the community would be estimated as follows:
550,000 persons * 15.0 tons/person/year= 8,250,000 tons/year
Using the examples above, changes in development inten-sity or rurality could result in a nearly 50 percent swing in yearly aggregate demand. However, keep in mind that these are average aggregate demands and that year to year changes in these values will likely occur as a result of variable population growth, the construction of large infra-structure or transportation projects, or as a consequence of significant natural events (such as flooding, earthquakes, or fires).
Current population (persons) * 12.2 tons/person/year= X tons/year
THE CALIFORNIA PROBLEMIn 2006, the CGS published a major aggregate study in California. The report updates the original 2002 study which summarized nearly 30 years of data regarding aggre-gate availability and demand. The study projects aggregate demand in over 31 market areas (referred to as produc-tion-consumption areas) in California and compares those estimates to currently permitted aggregate reserves.
Figure 4: California Department of Conservation Aggregate Study (2006) shows critical aggregate supply issues in many metropolitan areas.
The report indicates that only 1 of the 31 market areas in California had permitted aggregate reserves sufficient to meet projected long-term aggregate demands. Further, four areas had critical short-term aggregate deficiencies, defined as having less than 10 years of aggregate reserves. These areas included North San Francisco, Sacramento, Fresno, and Northern Tulare County. An additional six areas (including San Diego, San Bernardino, San Fernando Valley, and Palmdale) had reserves equaling less than 25 percent of the projected aggregate demand. These findings are significant because permitting new aggregate resources in California often exceeds 8 years.

AGGREGATE PROTECTION GUIDANCE
PREPARED FOR: ARIZONA ROCK PRODUCTS ASSOCIATION PAGE 7 OF 15
Although not specifically addressed in the report, the short-ages of aggregate in California are not typically caused by the lack of suitable geologic materials. Rather, the unfortunate combination of intense development pressures, strict envi-ronmental laws, unfavorable mining legislation, and strong community opposition to local mining has effectively sterilized vast reserves of high quality locally-derived aggregates.
HOW TO IDENTIFY AGGREGATE RESOURCES IN YOUR COMMUNITY
What’s the difference between aggregate resources and reserves?
Resources are untested and unproven geologic deposits and reserves are aggregate resources that have been thoroughly explored, tested, permitted for extraction and can be profitably mined.
Unfortunately, the difficulty of locating potential aggregate resources in your community can vary significantly based on the breadth of geologic information known of the area and the amount of existing mining data you can obtain. While detailed geologic mapping may be available for your area, it is extremely unlikely that any map will simply identify “aggregate resources”. Rather, geologic maps will identify specific geologic units and the potential value of those units as aggregate resources can be inferred from the location of existing mining operations or from personal communications with subject matter experts. If you feel that inadequate information is available to make a determination, you are encouraged to consult with an Arizona registered geologist to assist you with the data collection and interpretation effort.
Where sufficient information exists, the best way to identify potential aggregate resources in your community is to locate existing aggregate mines in your area and correlate these mines with known geologic conditions. This process can be conducted using readily-accessible public resources and may not require specialized geologic interpretations or mining knowledge. The process does differ slightly based on available lands and the types of geologic materials used to produce aggregates and some common examples are provided below.
The impact of these aggregate shortages is profound. California is currently importing sand and aggregate into San Diego, Los Angeles, and San Francisco from mines located in Mexico and Canada. Further, some major markets are forced to import aggregates from production areas located more than 80 miles away; the equivalent of importing aggregates from Tucson to Phoenix. The trans-portation of these materials into many of the major Cali-fornia markets has significantly increased both the costs of those aggregates as well as unwanted environmental impacts associated with the added transportation (refer to How Green are your Aggregates).
In terms of cost, the CGS reported that the average cost of aggregates imported from Canada or Mexico are $18-$19/ton, which is significantly greater than the lowest priced aggregates available in some areas of the state with ample local supplies. In these areas, the cost of aggregates was approximately $7-$8/ton. The problem has gotten so serious that Caltrans recently developed an Aggregate Resource Policy that states “Our policy is that Caltrans will continue to work with local and state agencies to help gain approval of new aggregate mining sites throughout the state, acknowl-edging the need for an increased aggregate supply.”
Nearly 50% of all aggregates and crushed stone produced in Arizona are used in roads and infrastructure development. In 2006 alone, transportation costs for all aggregates used for roads and infrastructure in Arizona is estimated at $163 million.
The cost of transportation increases the cost of aggregates by approximately 15 cents/ton/mile. Consequently, trans-porting aggregates 20 miles will increase the price of aggre-gate by approximately $3.00/ton, or about 55 to 60 percent more than locally-sourced aggregates. When you consider that one mile of six-lane interstate requires approximately 113,505 tons of aggregate, these increased transportation costs would raise highway construction costs by approx-imately $340,000 per mile. As previously discussed, the added transportation also creates unnecessary air emissions, traffic congestion, and increased road maintenance.

AGGREGATE PROTECTION GUIDANCE
PREPARED FOR: ARIZONA ROCK PRODUCTS ASSOCIATION PAGE 8 OF 15
By starting with a base map such as an aerial photo or topo-graphic map, the surficial geology for the area can uploaded from the AZGS and draped over the base map. Keep in mind that not all of AZGS mapping is available in GIS format but the mapping exercise can be accomplished using more primi-tive mapping technologies.
In some areas, the AZGS may have prepared more than one map of local geologic conditions and there may be subtle differences between these maps based on their age, scale, and purpose. Although it is very unlikely that the geologic conditions have changed, the maps may show differing colors or symbols when identifying the various rock types. Reference the map legends for the definition of the various symbols and colors shown on a map and use the geologic descriptions as a guide in interpreting the differing rock types.
Step 1: Identify Local Aggregate Mines All aggregate mine sites in Arizona must have a unique mine identification number and be registered with the Arizona State Mine Inspector (ASMI). Further, A.R.S. requires that all aggregate mines located on state or private lands have approved aggregate mined land reclamation plans approved by the ASMI (mines on federal lands also have similar federal requirements). These registration and reclamation require-ments allow the ASMI to precisely locate all permitted mines in the State of Arizona by either physical address or latitude and longitude.
The figure below shows an example of the type of data you can get from the ASMI and how it can be placed on a map. The map shows aggregate mines located in central Phoenix along the Salt River.
Figure 5: Active mining operations provided by the Arizona State Mine Inspector can easily be located on a topographic or aerial base maps.
Step 2: Determine Local Geology Once you have located the mines in your planning area and plot them on a working base map, correlating these sites with known geologic conditions becomes your next priority. The best source for geological information in Arizona is from the Arizona Geologic Survey (AZGS). The AZGS has mapped surficial geology across much of Arizona (their mapping priorities have included significant population centers in Arizona) and accessing this information is accomplished using their interactive website (www.azgs.az.gov) or by contacting them directly.
Figure 6: Surficial Geology on the Tempe Quadrangle is shown using both colors and symbols.
Qefi
Qag
Qag
Qefi

AGGREGATE PROTECTION GUIDANCE
PREPARED FOR: ARIZONA ROCK PRODUCTS ASSOCIATION PAGE 9 OF 15
Example of Typical Alluvial Aggregate Deposits As Figure 9 shows, aggregate mines permitted in the south-west portion of Phoenix show a strong correlation to the coarse-grained sand and gravel deposits (identified as Qr on the map) of the Salt River. These thick alluvial deposits are a world-class source of construction materials but are subject to intense pressure from urbanization and zoning regulations unfavorable to mining. These regulations have essentially prohibited the development of new mining operations.
To complicate matters further, an expansive alluvial unit will typically have varying aggregate qualities along its depo-sitional path. Generally, the rocks nearer to the source of
Figure 7: Map legends help to inter-pret the unique colors and symbols used on geologic maps.
Most maps will contain a legend that identifies the types of rock or unconsolidated materials shown on the map and offer a brief description of the material types shown on the map. As shown above, geologic units are typically denoted by a unique color or symbol and corresponding letter desig-nations (such as Qsgs or Qefi). The first letter or two in each geologic unit generally refers to the geologic age. For example, “Q” refers to Quaternary, which represents the last 1.6 million years of geologic history. Quaternary-aged units are often unconsolidated (except for lava flows and a few other types of deposits) and are the predominant source of aggregates in Arizona.
Step 3: Correlate Geology with Active Mining Operations When the surficial geology and permitted mining operations are placed on a single map, a correlation between mine location and geologic materials often becomes apparent. This correlation suggests that the mines in a given area have been purposefully located to extract a desirable geologic resource or unit unique to that area.
Remember that deposits are unique because specific depo-sitional environments have concentrated, processed, and placed these materials in a manner to create an economically extractable resource. As Figure 8 suggests, it would be a reasonable assumption that future mines in the area would be located in the yellow alluvial materials (identified as Qr on the map) generally located within the Santa Cruz River floodplain.
However, it is very important to recognize that not all of the yellow alluvial (Qr) materials identified on Figure 8 will contain aggregates of sufficient quantity or quality to warrant economic extraction. More realistically, the majority of the economically extractible aggregates located in any given area may never be mined because of other factors unrelated to material quality and quantity such as existing land uses, unsuitable parcel size or shape and zoning restric-tions. See text box on page 7 for more information regarding aggregate resources and reserves.
Figure 8: Locating mining sites on geologic mapping in the Tucson area shows strong correlation with recent alluvial deposits denoted as Qr (Recent Quaternary Alluvium).
Qr
Qr
Qr
Figure 9: Overlaying mining sites on Phoenix Geologic Map shows strong correlation with recent alluvial deposits denoted as Qr (Recent Quaternary Alluvium).

AGGREGATE PROTECTION GUIDANCE
PREPARED FOR: ARIZONA ROCK PRODUCTS ASSOCIATION PAGE 10 OF 15
STEPS FOR PREVENTING THE STERILIZATION OF VALUABLE AGGREGATE RESOURCES
Figure 11: Ways that surface development sterilizes mineral resources (adapted from the British Geological Survey).
As previously discussed, sterilization primarily occurs when development or unfavorable zoning regulations permanently prevents the extraction of valuable mineral resources. However, this can occur when development is placed directly over mineral resources or when development is placed sufficiently close to mineral resources that the development footprint (including prudent setbacks) interferes with mineral extraction. This is perhaps best illustrated in the report by the British Geological Survey titled “Mineral Safeguarding in England: Good Practice Advice” dated 2011 (see Figure 11).
The best way to prevent sterilization is to implement a process for identifying aggregate resources and developing policies for protecting those resources. The process can be divided into three discrete steps.
Step 1: Identify Aggregate Resources You Intend on ProtectingThis process was discussed above and essentially requires the identification of active mining sites in the planning jurisdictions and correlating these mines to known geologic conditions. Once you have identified a relationship between active mining operations and a specific geologic unit(s), portions of these units should be considered as potential aggregate resources across the entire planning area. For example, if active mining operations are isolated to recent alluvial deposits (identified by Qr or alike), then all mapped recent alluvial deposits (Qr) in the planning area could poten-tially have suitable aggregate resources to be economically mined. Other factors, such as proximity to existing neighbor-
the material (mountains or uplands) will likely be coarser, more angular, with less fine materials (sand and silt) than in the same unit downstream, where the materials may be more rounded, smaller, and contain more fines. These variations can have significant impacts on the usefulness of aggregates from the same geologic unit, but in different geographic locations.
Example of Rock Deposits for Manufactured AggregatesIn areas where alluvial materials are not present or of insufficient quality, aggregate production will often target a specific bedrock unit to manufacture aggregates called crushed rock. In these cases, the process for identifying aggregate resources would be very similar to those eval-uations performed for alluvial deposits. However, you will often determine that the shape of these deposits is substantially different to those long sinuous alluvial deposits that frequently overlay active stream systems. You will frequently find that the shape of these deposits is largely controlled by the initial rock forming event rather than by the erosion and subsequent deposition of material clasts.
Using the steps outlined above, Figure 10 shows that an aggregate mining operation (Palo Verde Sand and Rock) is extracting a specific geologic material identified in AZGS mapping as Tv (Tertiary-aged Volcanic Rocks). Assuming that this is the most economical source of aggregates in the area, it is reasonable to presume that additional aggregate production in the area would also be sourced from similar rock types. Consequently, sufficient volumes of these exposed volcanic rocks identified in this planning area should be considered for future aggregate sources.
Figure 10: Active mining from a basalt unit (Tv) suggests that other basalt deposits in the area are potential aggregate sources.
Palo Verde Sand and Rock

AGGREGATE PROTECTION GUIDANCE
PREPARED FOR: ARIZONA ROCK PRODUCTS ASSOCIATION PAGE 11 OF 15
holders such as other public agencies, internal departments, developers, and the community. The intent of such commu-nication and consultation process is to demonstrate the intrinsic value of these aggregate resources, the need for communities to have adequate supplies of low cost aggre-gates, and the implications of allowing these resources to be inadvertently or purposefully sterilized.
Documenting this process in the General Plan and by following the required notification process for amending General Plans substantially addresses this need. However, by taking the extra steps of communicating the process to a broader stakeholder group it is possible to gain additional support for implementing responsible policies for protecting these valuable resources.
Step 3: Implement Policies to Prevent Sterilization and Ensure Future Aggregate Availability In an ideal world, it would be possible to protect all aggre-gate resources needed to achieve long term demand in a particular planning area and prevent conflicting develop-ment in those areas that would preclude extraction of those resources. However, in the real world there are always competing interests for developable property and land owners enjoy significant rights to develop property (in conformance with local zoning regulations) in ways they see fit.
But recognizing a greater public benefit, communities have also enjoyed broad legal authority to condemn, protect, and acquire properties that possess certain environmental, social, or resource significance. This includes areas with unique cultural or biological resources, areas that impact or protect air quality, view sheds, or aquifer quality (water sheds). Arguably, communities evoke such authority when the absence of such resources will permanently and significantly impact public health, property values or the quality of life.
Under this precedence, communities could exercise reason-able controls over the development of aggregate resources just as they exercise control over other types of development because the absence of such controls will have permanent and lasting negative consequences for the community. In the case of aggregate shortages, these consequences would clearly and definitively include higher development and infra-structure costs, increased road congestion and adverse air quality impacts.
hoods, parcel size, or access to transportation could further refine your planning area.
How much area do I reserve for future mineral extraction? Assuming that the average mine will produce about a 125,000 tons of aggregate per acre; a 50 acre mine will likely produce less than a 2-year aggregate supply for a community of 500,000 people during its lifetime.
The City of Phoenix consumes approximately 18 million tons of aggregates per year which would exhaust the aggregate supply of a 50-acre mine site in less than 4 months.
Keep in mind that this does not mean that all suitable geologic deposits in the planning area will ultimately be mined, but rather it allows for the possibility that some of these areas will be mined if the critical resource, social and economic factors are all favorable for mining. Further, it is highly likely that these factors will make the majority of these resources impracticable or uneconomic to extract. Unfortu-nately, it is impossible to determine which of these resources can be economically mined without further studies. There-fore, the most reasonable action would be to identify all similar geologic deposits as having the potential to yield extractable aggregate resources and allow the marketplace the opportunity to develop economically viable mines.
Step 2: Communicate and Consult Findings
“Since aggregate is so vital to the state, it is important to adequately plan for protection and utilization of this natural resource.” (Planning for Aggregate; A guide to planning for aggregate resources in Oregon)
Once suitable geologic resources have been mapped, it’s important to communicate the findings with the stake-

AGGREGATE PROTECTION GUIDANCE
PREPARED FOR: ARIZONA ROCK PRODUCTS ASSOCIATION PAGE 12 OF 15
Consequently, one way to begin protecting aggregate resources is to examine the role of the local zoning and enti-tlement process. Here are some recommended actions:
• Recommendation 1: Areas that have been identified as having potential aggregate resources should have a unique zoning or land use designation. This designation (such as Aggregate Development Areas) could clearly identify the aggregate development potential of the area.
• Recommendation 2: Conflicting development proposals in Aggregate Development Areas could be required to conduct a highest and best land use study that includes aggregate production as a potential alternative.
• Recommendation 3: Proposals for residential development in Aggregate Development Areas could be required to estab-lish buffers (occupied by green-space or golf courses, for instance) to mitigate potential noise and dust impacts from adjacent (both existing and possible future) mining areas.
• Recommendation 4: Conversely, all proposals for mine development in Aggregate Development Areas could be required to establish buffers along any shared property boundaries with existing or planned residential develop-ment to mitigate potential noise and dust complaints.
• Recommendation 5: Residential homes sold in Aggregate Development Areas (especially those built within 2,000 feet of active or planned mining operations) could have a deed restriction or mandatory pre-sale notification that acknowledges the potential for aggregate mining in the area.
• Recommendation 6: Commercial transportation corridors could be planned and established to safely route mine traffic away from residential areas, schools, and other sensitive areas.
• Recommendation 7: Identify preferred post-mining land uses within Aggregate Development Areas to guide prepa-ration of reclamation plans that achieve long term develop-ment goals for the area. For instance, Oregon’s statewide Planning Goal 5 (OAR 660-023-0180(4)(f)) requires that post-mining land uses conform with pre-mining comprehen-sive plan and zoning designations.
The University of Minnesota Outreach, Research and Education Park (UMore Park) is a 5,000 acre development project located southeast of the Twin Cities. The plan envisions a unique mixed use development supporting up to 30,000 residents. The plan envisions “a sustainable community integrating environmental, socio-cultural, and economic opportunities with a specific focus on innovations in renewable energy, education and lifelong learning and wellness, the natural envi-ronment and regional economic development.”
The plan incorporates a long term aggregate mining operation on the property that supplies aggregates, ready mix and asphalt to the growing community but also constructs reclaimed areas and urban lakes that form a framework of the storm water management system and the parks and open space of the new community.

AGGREGATE PROTECTION GUIDANCE
PREPARED FOR: ARIZONA ROCK PRODUCTS ASSOCIATION PAGE 13 OF 15
affected parties have an opportunity to review and comment on draft plans prior to ASMI approval.
Consequently, communities have a unique opportunity to achieve their long-term planning goals for an area and still extract the valuable aggregate resources that lie within. This can be accomplished by identifying post-mining land use strategies for Aggregate Development Areas and working productively with mine operators to guide the reclamation plan development process to achieve desired long-term development goals. In many cases, much of the site prepa-ration including rough grading and backfilling can be accom-plished by the operator during the mine operation or recla-mation process. Examples of long term development goals that are easily integrated into mining operations:
• Habitat preservation and conservation easements
• Greenway and public parks
• Golf course development
• Flood control and aquifer storage facilities
• Inert backfilling with subsequent commercial or residential development.
IN CONCLUSIONSatisfying the competing interests and diverse opinions of your community makes land use planning especially challenging, and we recognize that adding a requirement to address aggregate resources does not make planning any easier. But, take a moment to consider the political and financial implications of not protecting these valuable resources.
Fortunately, we don’t have to look very far to find an excellent example of bad planning. Even though they are blessed with abundant natural resources, California is forced to import construction materials from Mexico and Canada and their average haul distances exceed 50 miles. This both increases the base cost of aggregates and more than doubles the transportation costs. The result is that California aggre-gates are 200 to 300 percent more expensive than Arizona aggregates. Plus, we have lower transportation impacts such as pavement wear, congestion, and vehicle emissions.
• Recommendation 8: Encourage mining operational practices that reduce or mitigate noise, dust, view shed, light, and traffic impacts from active and future mining operations. Use vegetative berms and other measures to enhance the visual appeal of active operations.
• Recommendation 9: Develop a well-defined process to evaluate proposed residential or commercial development within Aggregate Development Areas. The process would determine if mining is the preferred or highest and best land use.
• Recommendation 10: Quantify the financial and environmental impacts associated with the loss of locally-available aggregates in your community.
• Recommendation 11: Add mining and mineral processing to the activities allowed under certain commercial zoning designations.
ACHIEVING PRODUCTIVE POST-MINING LAND USESIt is helpful to understand that mine sites possess a finite resource and that depending on resource volume and production rates, all mines will eventually run out of mineable materials. Therefore, mining operations should be consid-ered as temporary or interim property uses.
Further, all mining operations in Arizona are required to prepare an ASMI-approved reclamation plan. The require-ments for reclamation plans include the identification of a potential post-mining land use and a reclamation strategy that, when implemented, achieves that desired post-mining land use. Approved reclamation plans are required prior to new mine operation and community planners and other
Figure 12: By focusing on a productive post mining land use, communities can build attractive public amenities such as this golf course following mining.

AGGREGATE PROTECTION GUIDANCE
PREPARED FOR: ARIZONA ROCK PRODUCTS ASSOCIATION PAGE 14 OF 15
Price does matter and the availability of low cost aggregates makes residential, commercial and infrastructure develop-ment (and maintenance) more affordable. Consider that 50 percent of all aggregates produced in Arizona are used for roads and infrastructure. This means that municipali-ties, and ultimately taxpayers, bear the greatest burden of increased transportation and aggregate costs. Remember that for every 20 miles aggregates are transported the cost of those aggregates essentially double and the cost of a single mile of freeway increases over $340,000.
Mining should be considered an interim property use and that every mine is required to have an approved reclamation plan. Municipalities have input into the reclamation planning process and can ask for post-mining land uses that conform to their General Plans. This means that you can enjoy the benefits of locally-sourced aggregates and still achieve the long-term planning goals of your area. In the short term, you can also work proactively with mine operators to reduce the potential for dust, noise, visibility, and traffic impacts before they become problematic for the community.
Every acre of a mining property can generate up to a 125,000 tons of finished aggregates. This equates to a significant source of royalties, taxes and family-wage jobs that are simply lost if those resources become sterilized. Also, keep in mind that a city the size of Phoenix consumes 18 to 20 million tons of aggregates per year. Smaller communities with greater development potential and rural communities will consume much more aggregates on a per capita basis than those communities that are essentially built out.
If all else fails, retain a professional geologist to quantify your aggregate needs and identify aggregate resources in your planning area. Their report can become a valuable reference in complying with SB 1598.
Lastly, remember that effective planning can mitigate many of the land use conflicts associated with co-locating residential development and active mining operations. By working proac-tively with developers and mining companies, planners can ensure that both uses can reasonably and peacefully co-exist.
Figure 13: Balancing the competing interests and diverse opinions of your commu-nity makes land use planning especially difficult.

AGGREGATE PROTECTION GUIDANCE
PREPARED FOR: ARIZONA ROCK PRODUCTS ASSOCIATION PAGE 15 OF 15
BIBLIOGRAPHY:
Arizona Geological Survey. Geologic maps (website http://www.azgs.az.gov/).
Arizona Department of Administration, Office of Employment and Population Statistics. Population Estimates (website http://www.workforce.az.gov/).
British Geological Survey, 2011. Mineral Safeguarding in England: Good Practice Advice. Minerals and Waste Programme, Open Report OF/11/046.
California Construction and Industrial Materials Association (CalCIMA). (website http://calcima.org/)
California Department of Transportation (Caltrans), 2007. Construction Aggregate Supply Limitations, Estimates of Economic Impact.
Caltrans, 2011. Aggregate Resource Policy Statement and Tools. Memorandum.
California Geological Survey (Department of Conservation), 2006. Aggregate Availability in California, Map Sheet 52.
Design Workshop, Inc., 2008. Concept Master Plan Summary; For the University of Minnesota’s New Sustainable Community at UMore Park.
National Stone, Sand & Gravel Association. Guiding Principles for Sustainability.
Oregon Department of Land Conservation and Development and Oregon Department of Transportation, 2001. Planning for Aggregate, A guide to planning for aggregate resources in Oregon.
The United States Census Bureau, 2013. 2010 Population Estimate for the City of Phoenix. (website http://quickfacts.census.gov)
United States Geologic Survey. Mineral Yearbooks, 2000-2011.

OFFICESANN ARBOR, MI BOISE, ID BOSTON, MA BURLINGTON, MA CLEVELAND, OH
COLUMBUS, OH COSTA MESA, CA DAYTON, OH GREENVILLE, SC HARTFORD, CT
KANSAS CITY, KS MANCHESTER, NH MCLEAN, VA OAKLAND, CA PARSIPPANY, NJ
PHOENIX, AZ PORTLAND, ME ROCHESTER, NY ROCKFORD, MI SAN DIEGO, CA
SAN JOSE, CA SANTA BARBARA, CA TUCSON, AZ WALNUT CREEK, CA WOODLAND HILLS, CA
KEY CONTACTS AND RESOURCES:
Arizona State Mine Inspector 1700 West Washington, 4th FloorPhoenix, Arizona 85007(602) 542-5971 www.asmi.state.az.us
Arizona Geological Survey 416 West Congress Street, Suite 100Tucson, Arizona 85701-1381(520) 770-3500www.azgs.az.gov
Arizona Rock Products Association Steve Trussell, Executive Director916 West Adams StreetPhoenix, Arizona 85007(602) 271-0346www.azrockproducts.org
The Author Eric Mears, RG, Vice President and Mining Market Segment LeaderHaley & AldrichOne Arizona Center400 East Van Buren Street, Suite 545Phoenix, Arizona 85004-2285(602) [email protected]


![Block & Aggregate Drop Inlet Protection, BA-1 · Block & Aggregate Drop Inlet Protection ... • Maximum of 1 block per side used as a de-watering flow path. [1] ... Temporary flow](https://img.pdfslide.us/doc/110x75/5aee5a127f8b9a585f919079/block-aggregate-drop-inlet-protection-ba-1-aggregate-drop-inlet-protection-.jpg)