Embed Size (px)
Citation preview
Version 1.0 – 27 June 2000
Aggregate Emission DataEstimation Technique Manual
For
The Aquaculture of
BarramundiPrawns
CrocodilesPearl oysters
Red clawTropical abalone
In Tropical Australia
2
Emission Estimation Technique ManualFor Tropical Aquaculture
Table of contents
1.0 INTRODUCTION 42.0 DEFINITION OF AQUACULTURE 53.0 OVERVIEW OF AQUACULTURE IN NORTHERN
AUSTRALIA 63.1 Pearls 6
3.2 Prawns 6
3.3 Crocodiles 6
3.4 Barramundi 7
3.5 Red Claw 7
3.6 Tropical Abalone 7
3.7 Other Species 7
3.8 Licensing 8
3.9 Farming systems 8
3.10 Hatcheries 11
4.0 EFFLUENT DISCHARGE 124.1 Chemical use in aquaculture 12
4.2 Abnormal-condition pollutants 12
4.3 Associated emissions 13
4.4 Nutrients 14
5.0 ESTIMATING EMISSIONS 165.1 Estimating category 1 emissions 16
5.2 Estimating category 3 emissions 165.2.1 Direct measure 175.2.2 Mass balance 185.2.3 Emission factors 19
5.3 Estimating techniques appropriate to specific farming systems 205.3.1 Intensive systems and Semi-Intensive systems 205.3.2 Extensive systems 22
6.0 REFERENCES 23
APPENDIX A 24
3
List of Tables
TABLE 1. EXAMPLES OF TOTAL N AND TOTAL P PATHWAYSFROM PONDS REPORTED UNDER DIFFERENTCONDITIONS 15
TABLE 2. AVERAGE PERCENTAGE OF N AND P IN FINFISHAND PRAWNS 19
List of Figures
FIGURE 1. INTENSIVE FARMING SYSTEM 9FIGURE 2. SEMI-INTENSIVE FARMING SYSTEM 10FIGURE 3. EXTENSIVE FARMING SYSTEM 11FIGURE 4. FORMATION OF ANOXIC FOOT PRINTS UNDER
CAGES 13FIGURE 5. NITROGEN PATHWAYS FROM A PRAWN POND 14
4
1.0 Introduction
The purpose of this Emission Estimation Technique (EET) Manual is to assist Stateand Territory authorities in estimating emissions of listed substances for the NationalPollution Inventory (NPI). This manual contains a general summary of the aquacultureindustry in tropical Australia and describes the procedures and recommended methodsfor estimating emissions from Tropical Aquaculture Facilities.
The species covered by this manual are:• prawns (Penaeus spp.)• barramundi (Lates calcarifer) and other fin fish• pearl oyster (Pinctada spp.)• red Claw (Cherax quadricarinatus)• donkeys Ear Abalone (Haliotis asinina)• crocodiles (Crocodylus porosis; Crocodylus johnstoni) The methods described in this manual are based on farming systems which arecommonly used for the above species and may be used as a guide for estimatingemissions from other species which use similar farming methods.
EET Manual:Tropical Aquaculture
This manual was drafted by the Northern Territory University on behalf of theCommonwealth Government (Environment Australia). It has been developed througha process of consultation with Queensland, West Australia and Northern TerritoryFishery and Primary Industry departments and environmental protection authorities,and with the participation of industry representatives.
5
2.0 Definition of Aquaculture For the purposes of this manual, aquaculture has been defined according to thedefinition used by the FAO for statistical purposes: ‘The farming of aquatic organisms including fish, molluscs, crustaceans, aquaticplants and (for the purposes of this project) crocodiles. Farming implies some sort ofintervention in the rearing process to enhance production, such as regular stocking,feeding, protection from predators, etc. Farming also implies individual or corporateownership of the stock being cultivated.’ (Seventh Session of the Indo-PacificFisheries Council (IPFC) Working Party of Experts on Aquaculture, 1988, Bangkok).<www.fao.org/docrep/t8582e/t8582e03.htm>
6
3.0 Overview of Aquaculture in Northern Australia With the exception of pearl farming, which is concentrated in the Northern Territoryand the Northern region of West Australia, the bulk of aquaculture activity in tropicalAustralia is conducted on the eastern coastal strip of Queensland. The reasons for thisinclude the availability of suitable land, proximity to markets and access to labour.Aquaculture in tropical Australia remains small and, in most cases, is still in a rapidlydeveloping phase. With the help of organisations such as State and TerritoryDepartments of Primary Industries and Fisheries, Universities, Australian Institute ofMarine Science (AIMS) and the CSIRO, methods of farming are constantly beingmodified to better suit local conditions, to give higher yields and to reduce effluentoutfall. 3.1 Pearls Measured on a dollar return basis, pearl farming is currently the largest aquacultureindustry in tropical Australia (NT DPIF). Although pearl cultivation is the focus ofconsiderable research, much of the research is ‘commercial in confidence’ and thepearling industry is often seen as somewhat secretive. Despite this, pearl farming isgenerally regarded as environmentally benign and seldom arouses suspicionsregarding pollution. 3.2 Prawns Prawn farming is a rapidly developing industry and, if projects mooted for theNorthern Territory and West Australia are realised, may overtake pearls as the highestdollar earner of all the Australian aquaculture species in the next 10–15 years. Of the species farmed in the tropics, prawn farming is perceived as having the greatestenvironmental impact. This perception is partially based on the Asian experience,where prawn farming is a very big business (one farm alone in Sumatra covers 10,000hectares), but often a poorly managed one. The results of poor management and lowenvironmental standards have led to considerable environmental degradation inseveral areas of Asia. In Australia prawn farms generally have a good environmentalrecord, however they are often located in, or adjacent to, areas that areenvironmentally and/or politically sensitive (the Great Barrier Reef Marine Park, forinstance). Public sentiment, especially from recreational fishers, is often rousedagainst developments if there is any suggestion that they may impact on recreationalareas. Large amounts of money and effort are currently being expended on research into allaspects of prawn farming, including ways of reducing nutrient loads in effluentreleased into the environment. The industry is highly dynamic and growers seemwilling to adopt new practices in all aspects of the industry, including wastemanagement. 3.3 Crocodiles Crocodiles are farmed for both meat and skins. In several cases, farms are alsopresented as tourist attractions. By comparison with overseas crocodile and alligator
7
industry, the Australian industry is small (Vicki Simlesa NT DPIF). Future expansionwill probably depend on streamlining and adopting new cultivation methods to enablelocal growers to be more competitive on the international market. Two of the futuredirections mooted for crocodile farming are the introduction of standardised, pelletisedfood and the reduction of the use of standing water in growing pens (Bernie Davis,Qld DPI, Oonoonba). If these measures are adopted in Australia, crocodile farmingshould cease to be an aquaculture activity and should be more properly regarded as ananimal feed lot for the purposes of estimating effluent discharge. At present, farm effluent from crocodile farms is generally retained either in settlingponds or septic systems within the farm boundaries. Notwithstanding the possiblerelease of effluent from ponds during monsoonal flooding, crocodile farms are notgenerally sources of emissions. There may, however, be some issues to be addressedregarding the amount of ammonia that is volatilised from larger, intensive grow-outfacilities. 3.4 Barramundi Barramundi is currently the principal finfish farmed in tropical Australia. It is unlikelyto be overtaken in the foreseeable future despite research being carried out on theculture of several other species of finfish. At present barramundi farming in the tropicsis overwhelmingly concentrated in Queensland—there are currently three farmsoperating in the Northern Territory (NT DPIF, Aquaculture Branch) and one farm innorth Western Australia (WA DPIF). This is set to change in the near future with alarge cage culture system planned for the Tiwi Islands in the Northern Territory andpossible expansion in West Australia. With only one exception—a small cage farm inthe Hinchinbrook area—farms in Queensland use fresh water ponds from whicheffluent is usually discharged within the farm boundaries. Existing farms are small andhave little pollution potential. This will change with the introduction of large marineprojects 3.5 Red Claw Red claw farming is mainly conducted in Queensland. The industry remains smalldespite an apparently good market potential and recent move to establish red clawfarming in the Ord River region of Western Australia and in the Northern Territory.Farms are exclusively fresh water and wastewater is either recycled or discharged ontoground within the farm boundaries. Therefore, the potential for pollution from thisindustry is a very low. 3.6 Tropical Abalone Tropical abalone is not at present farmed in Australia, except for some experimentalwork in Queensland and Western Australia on the donkey ear abalone H. asinina. Thisspecies is cultivated in Thailand and the Philippines and has potential for cultivation intropical Australia. 3.7 Other Species
8
There are a number of marine and fresh water species currently under scrutiny fortheir aquaculture potential and it is likely that at least some of those being studied willprove viable. A few, such as eels and mud crabs, are already being produced andmarketed on a small scale in Queensland. 3.8 Licensing Licensing conditions for aquaculture vary considerably between Western Australia,Queensland and the Northern Territory. The industry in Queensland is tightlycontrolled, with farmers required to comply with legislations framed by localgovernments, state government (in the form of the Environmental ProtectionAuthority) and commonwealth government (in the form of the Great Barrier ReefMarine Park Authority). The Queensland Environmental Protection Authority isresponsible for licensing aquaculture operations. License conditions lay out thepermissible effluent from individual farms and stipulate a regular outfall-monitoringprogram. Effluent is sampled by the farmer at the point where it leaves the farm andthe samples independently analysed for pH; Dissolved Oxygen; 5-day BiochemicalOxygen Demand; Suspended Solids; Total Nitrogen and Total Phosphorus.Effluent release times are also stipulated. Western Australian licenses impose overall stringent monitoring and reportingconditions on all aquaculture and include monthly reporting requirements for pH;Dissolved Oxygen; 5-day Biochemical Oxygen Demand; Suspended Solids; TotalNitrogen and Total Phosphorus, as well as Temperature, Salinity and Turbidity. Water monitoring regimes and conditions in the Northern Territory are determined ona case–by–case basis and are less prescriptive than those in WA and Qld. At presentassessment is under the Environmental Assessment Act, the Water Act and the WasteManagement Act, however there is a need in the NT to develop baseline studies onbackground nutrient levels. 3.9 Farming systems Broadly speaking, aquaculture farming systems fall into three categories:
9
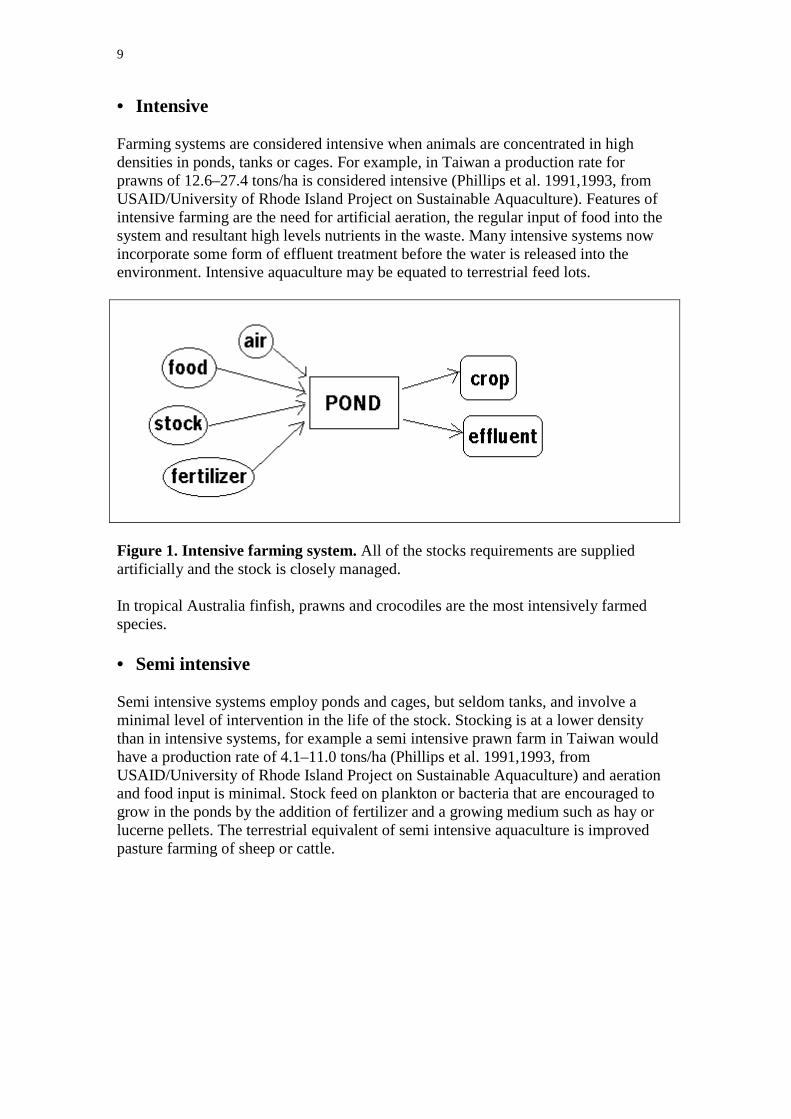
• Intensive Farming systems are considered intensive when animals are concentrated in highdensities in ponds, tanks or cages. For example, in Taiwan a production rate forprawns of 12.6–27.4 tons/ha is considered intensive (Phillips et al. 1991,1993, fromUSAID/University of Rhode Island Project on Sustainable Aquaculture). Features ofintensive farming are the need for artificial aeration, the regular input of food into thesystem and resultant high levels nutrients in the waste. Many intensive systems nowincorporate some form of effluent treatment before the water is released into theenvironment. Intensive aquaculture may be equated to terrestrial feed lots.
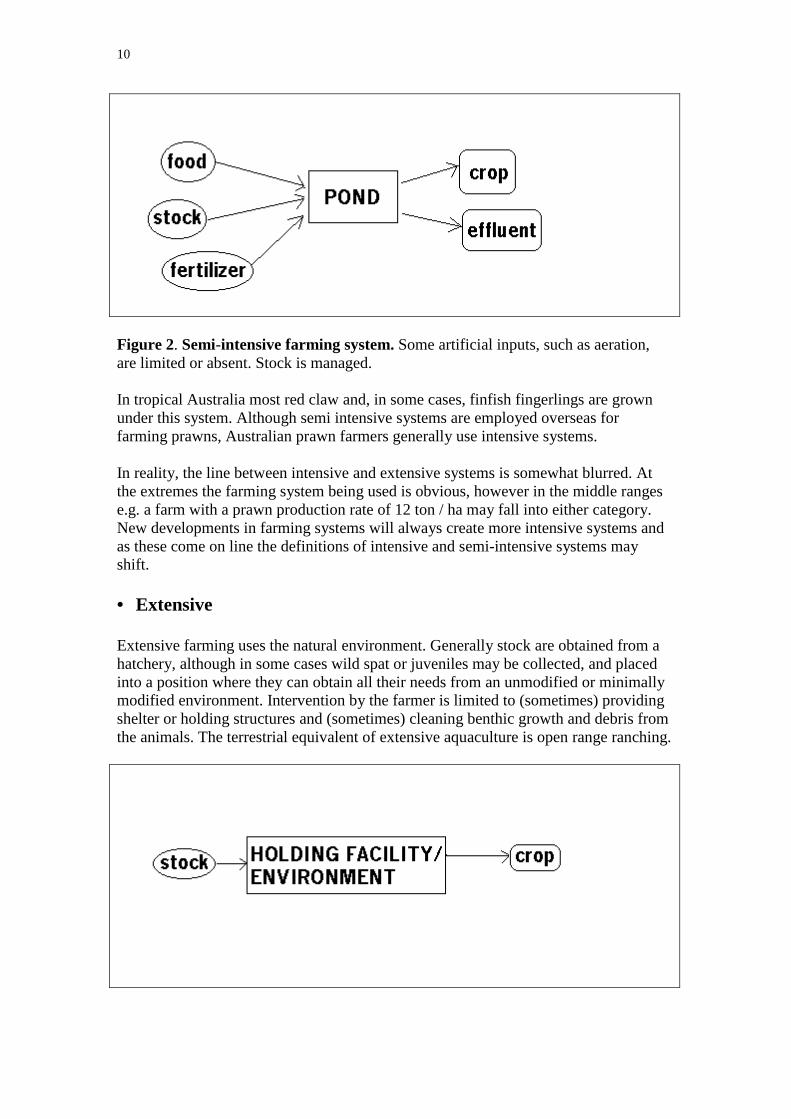
Figure 1. Intensive farming system. All of the stocks requirements are suppliedartificially and the stock is closely managed. In tropical Australia finfish, prawns and crocodiles are the most intensively farmedspecies. • Semi intensive Semi intensive systems employ ponds and cages, but seldom tanks, and involve aminimal level of intervention in the life of the stock. Stocking is at a lower densitythan in intensive systems, for example a semi intensive prawn farm in Taiwan wouldhave a production rate of 4.1–11.0 tons/ha (Phillips et al. 1991,1993, fromUSAID/University of Rhode Island Project on Sustainable Aquaculture) and aerationand food input is minimal. Stock feed on plankton or bacteria that are encouraged togrow in the ponds by the addition of fertilizer and a growing medium such as hay orlucerne pellets. The terrestrial equivalent of semi intensive aquaculture is improvedpasture farming of sheep or cattle.
10
Figure 2. Semi-intensive farming system. Some artificial inputs, such as aeration,are limited or absent. Stock is managed. In tropical Australia most red claw and, in some cases, finfish fingerlings are grownunder this system. Although semi intensive systems are employed overseas forfarming prawns, Australian prawn farmers generally use intensive systems. In reality, the line between intensive and extensive systems is somewhat blurred. Atthe extremes the farming system being used is obvious, however in the middle rangese.g. a farm with a prawn production rate of 12 ton / ha may fall into either category.New developments in farming systems will always create more intensive systems andas these come on line the definitions of intensive and semi-intensive systems mayshift. • Extensive
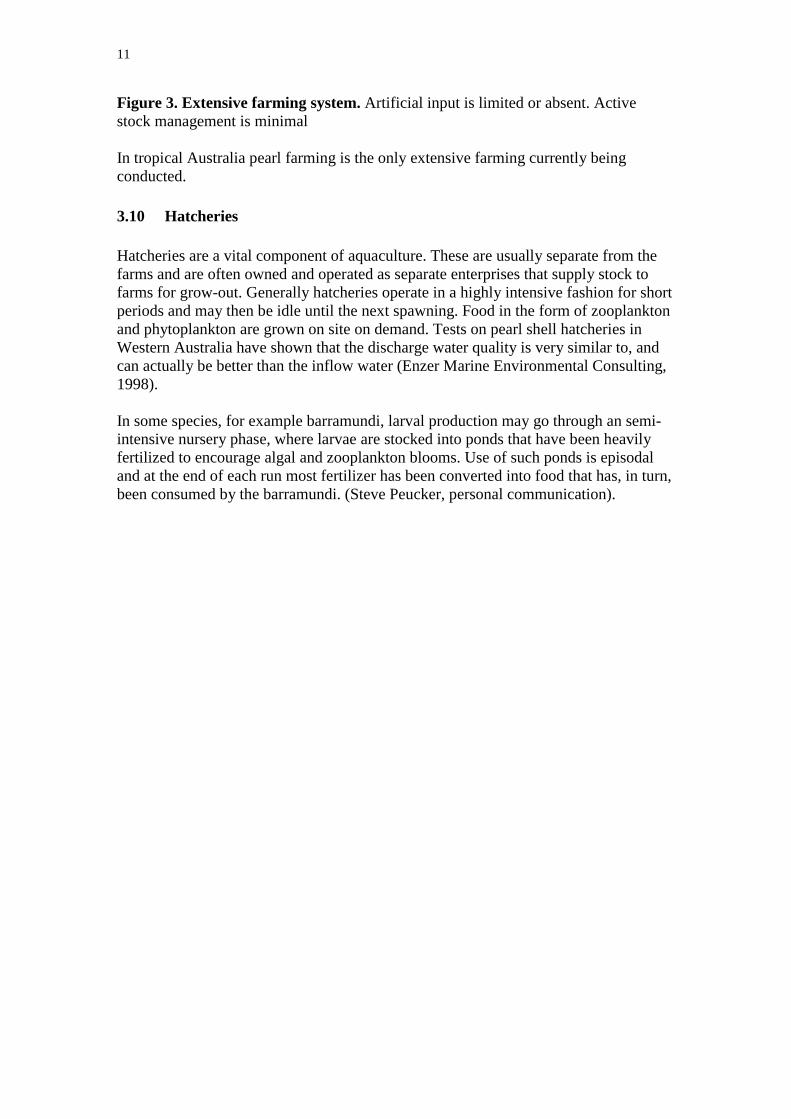
Extensive farming uses the natural environment. Generally stock are obtained from ahatchery, although in some cases wild spat or juveniles may be collected, and placedinto a position where they can obtain all their needs from an unmodified or minimallymodified environment. Intervention by the farmer is limited to (sometimes) providingshelter or holding structures and (sometimes) cleaning benthic growth and debris fromthe animals. The terrestrial equivalent of extensive aquaculture is open range ranching.
11
Figure 3. Extensive farming system. Artificial input is limited or absent. Activestock management is minimal
In tropical Australia pearl farming is the only extensive farming currently beingconducted.
3.10 Hatcheries
Hatcheries are a vital component of aquaculture. These are usually separate from thefarms and are often owned and operated as separate enterprises that supply stock tofarms for grow-out. Generally hatcheries operate in a highly intensive fashion for shortperiods and may then be idle until the next spawning. Food in the form of zooplanktonand phytoplankton are grown on site on demand. Tests on pearl shell hatcheries inWestern Australia have shown that the discharge water quality is very similar to, andcan actually be better than the inflow water (Enzer Marine Environmental Consulting,1998).
In some species, for example barramundi, larval production may go through an semi-intensive nursery phase, where larvae are stocked into ponds that have been heavilyfertilized to encourage algal and zooplankton blooms. Use of such ponds is episodaland at the end of each run most fertilizer has been converted into food that has, in turn,been consumed by the barramundi. (Steve Peucker, personal communication).
12
4.0 Effluent discharge
Aquatic species are generally very susceptible to chemical pollution, hence, by its verynature the aquaculture industry is largely self-regulating as far as pollutants areconcerned. In general, chemical use in aquaculture is kept at a minimum and effluentis usually comprised principally of the nutrients and suspended solids. Suspendedsolids are considered a significant effluent by the aquaculture industry and arereportable under both Qld and W.A. licensing rules, however at the present time theyare not included under the current NPI listing.
4.1 Chemical use in aquaculture
There is a range of minor-use chemicals that are added for special purposes. Theseinclude:
• antibiotics which may be used to control outbreaks of disease. Use of these areregulated by veterinarians;
• ‘tea seed cake’ containing the natural product saponin used to kill fish in prawnponds;
• colouring which may be added for final conditioning in prawns.
These are generally complex materials and may contain minor NPI substances,however even under the most liberal use they will not reach reportable levels.
Chlorine (Cl), which is used for cleaning and sterilizing, may reach aggregateemission levels equal to reportable thresholds in larger facilities. This is especiallytrue for some crocodile farms where there is regular use of chlorine for cleaning pensand abattoir facilities. There are reports of the use of Copper Sulphate (CuSO4) forcleaning and the control of fungal diseases on crocodile farms, however this use isnow very minor and appears to be largely discontinued on most farms. Similarly theuse of Acetic Acid (ethanoic acid) in prepacking treatment of crocodile meat seemsto be being phased out in favour of chlorine.
4.2 Abnormal-condition pollutants
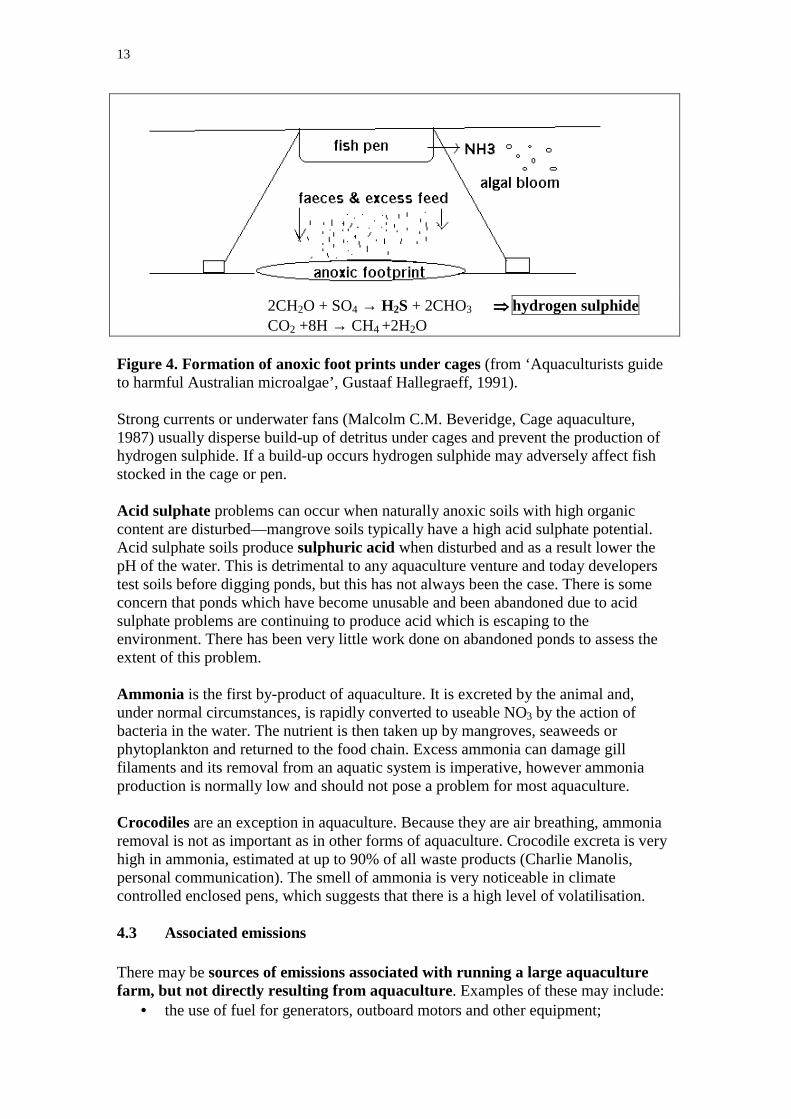
Production of hydrogen sulphide may occur when conditions in a pond or in thesubstrate below a cage become anoxic. Hydrogen sulphide is toxic and its presence isdetrimental to the profitable management of an aquaculture farm. It is rare, but itsoccurrence in cages can present a problem. A build up of detritus composed of uneatenfood and faecal matter can occur on the seabed under the cages and can becomeanoxic unless dispersed. The first the farm manager may know of this is when bubblesof hydrogen sulphide appear on the surface. If the natural current is not strong enough,large farms may use underwater ‘fans’ to disperse the detritus. Environmentalreactions in detrital build-up vary with conditions. At present there appears to be verylittle data based on tropical conditions, and even if there were it is likely that detritalbuild up will react differently from site to site.
13
2CH2O + SO4 → H2S + 2CHO3 ���� hydrogen sulphideCO2 +8H → CH4 +2H2O
Figure 4. Formation of anoxic foot prints under cages (from ‘Aquaculturists guideto harmful Australian microalgae’, Gustaaf Hallegraeff, 1991).
Strong currents or underwater fans (Malcolm C.M. Beveridge, Cage aquaculture,1987) usually disperse build-up of detritus under cages and prevent the production ofhydrogen sulphide. If a build-up occurs hydrogen sulphide may adversely affect fishstocked in the cage or pen.
Acid sulphate problems can occur when naturally anoxic soils with high organiccontent are disturbed—mangrove soils typically have a high acid sulphate potential.Acid sulphate soils produce sulphuric acid when disturbed and as a result lower thepH of the water. This is detrimental to any aquaculture venture and today developerstest soils before digging ponds, but this has not always been the case. There is someconcern that ponds which have become unusable and been abandoned due to acidsulphate problems are continuing to produce acid which is escaping to theenvironment. There has been very little work done on abandoned ponds to assess theextent of this problem.
Ammonia is the first by-product of aquaculture. It is excreted by the animal and,under normal circumstances, is rapidly converted to useable NO3 by the action ofbacteria in the water. The nutrient is then taken up by mangroves, seaweeds orphytoplankton and returned to the food chain. Excess ammonia can damage gillfilaments and its removal from an aquatic system is imperative, however ammoniaproduction is normally low and should not pose a problem for most aquaculture.
Crocodiles are an exception in aquaculture. Because they are air breathing, ammoniaremoval is not as important as in other forms of aquaculture. Crocodile excreta is veryhigh in ammonia, estimated at up to 90% of all waste products (Charlie Manolis,personal communication). The smell of ammonia is very noticeable in climatecontrolled enclosed pens, which suggests that there is a high level of volatilisation.
4.3 Associated emissions
There may be sources of emissions associated with running a large aquaculturefarm, but not directly resulting from aquaculture. Examples of these may include:
• the use of fuel for generators, outboard motors and other equipment;
14
• disposal of waste and sewage from workers camps or villages;• operations of an abattoir and the associated disposal of carcasses or other by-
products.
A survey may need to be carried out to assess the extent of such facilities (Appendix1) and relevant NPI manuals should be referred to regarding these activities.
4.4 Nutrients
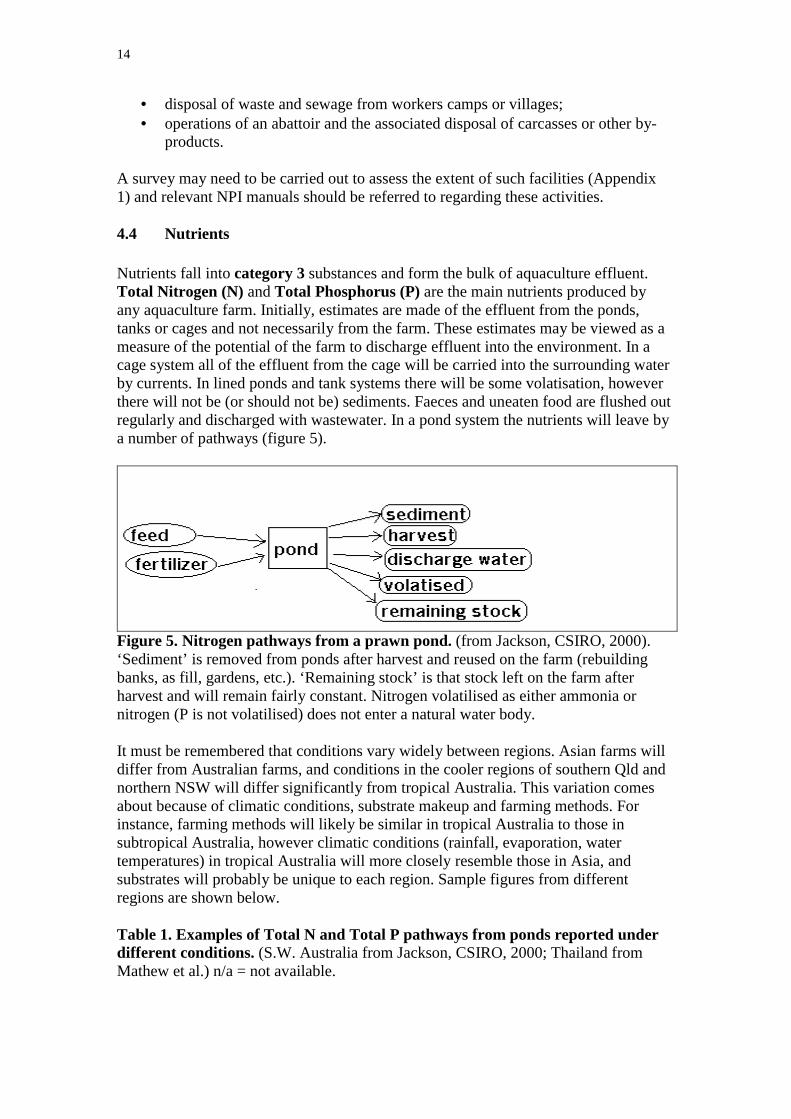
Nutrients fall into category 3 substances and form the bulk of aquaculture effluent.Total Nitrogen (N) and Total Phosphorus (P) are the main nutrients produced byany aquaculture farm. Initially, estimates are made of the effluent from the ponds,tanks or cages and not necessarily from the farm. These estimates may be viewed as ameasure of the potential of the farm to discharge effluent into the environment. In acage system all of the effluent from the cage will be carried into the surrounding waterby currents. In lined ponds and tank systems there will be some volatisation, howeverthere will not be (or should not be) sediments. Faeces and uneaten food are flushed outregularly and discharged with wastewater. In a pond system the nutrients will leave bya number of pathways (figure 5).
Figure 5. Nitrogen pathways from a prawn pond. (from Jackson, CSIRO, 2000).‘Sediment’ is removed from ponds after harvest and reused on the farm (rebuildingbanks, as fill, gardens, etc.). ‘Remaining stock’ is that stock left on the farm afterharvest and will remain fairly constant. Nitrogen volatilised as either ammonia ornitrogen (P is not volatilised) does not enter a natural water body.
It must be remembered that conditions vary widely between regions. Asian farms willdiffer from Australian farms, and conditions in the cooler regions of southern Qld andnorthern NSW will differ significantly from tropical Australia. This variation comesabout because of climatic conditions, substrate makeup and farming methods. Forinstance, farming methods will likely be similar in tropical Australia to those insubtropical Australia, however climatic conditions (rainfall, evaporation, watertemperatures) in tropical Australia will more closely resemble those in Asia, andsubstrates will probably be unique to each region. Sample figures from differentregions are shown below.
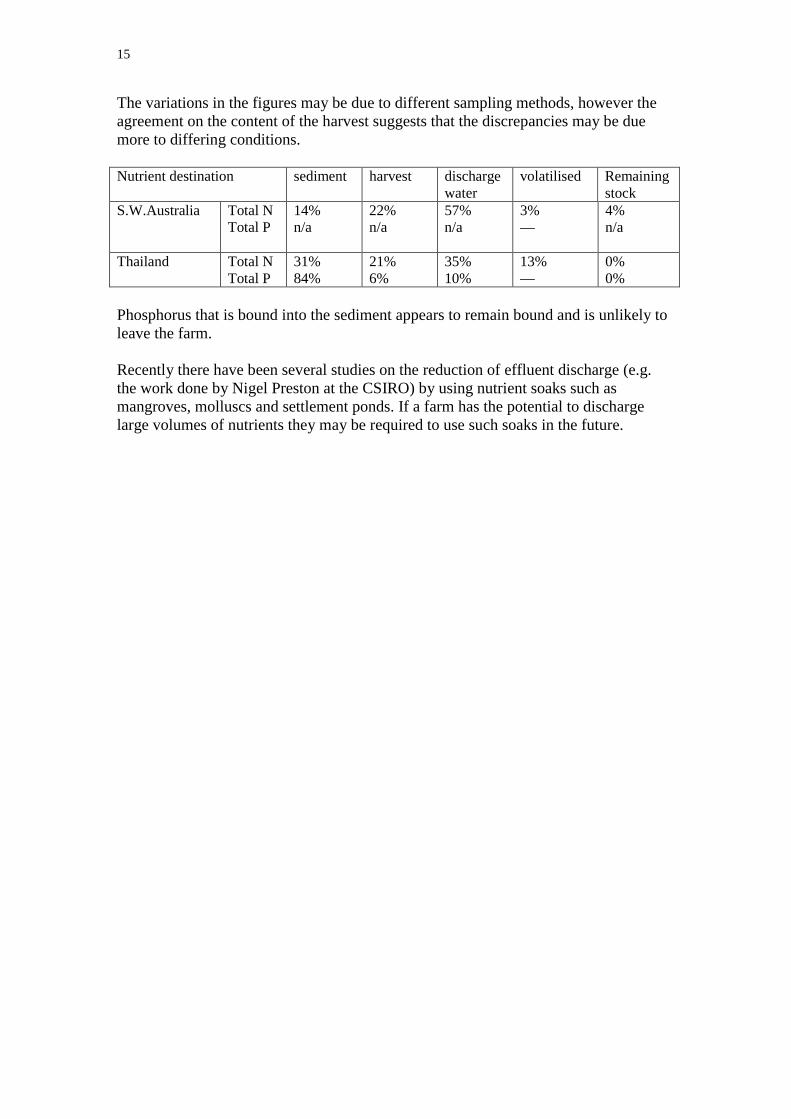
Table 1. Examples of Total N and Total P pathways from ponds reported underdifferent conditions. (S.W. Australia from Jackson, CSIRO, 2000; Thailand fromMathew et al.) n/a = not available.
15
The variations in the figures may be due to different sampling methods, however theagreement on the content of the harvest suggests that the discrepancies may be duemore to differing conditions.
Nutrient destination sediment harvest dischargewater
volatilised Remainingstock
S.W.Australia Total NTotal P
14%n/a
22%n/a
57%n/a
3%—
4%n/a
Thailand Total NTotal P
31%84%
21%6%
35%10%
13%—
0%0%
Phosphorus that is bound into the sediment appears to remain bound and is unlikely toleave the farm.
Recently there have been several studies on the reduction of effluent discharge (e.g.the work done by Nigel Preston at the CSIRO) by using nutrient soaks such asmangroves, molluscs and settlement ponds. If a farm has the potential to dischargelarge volumes of nutrients they may be required to use such soaks in the future.
16
5.0 Estimating emissions
This section describes techniques for estimating category 1 emissions and the category3 nutrients Total N and Total P.
Information on NPI substances is contained in the NPI Guide handbook.
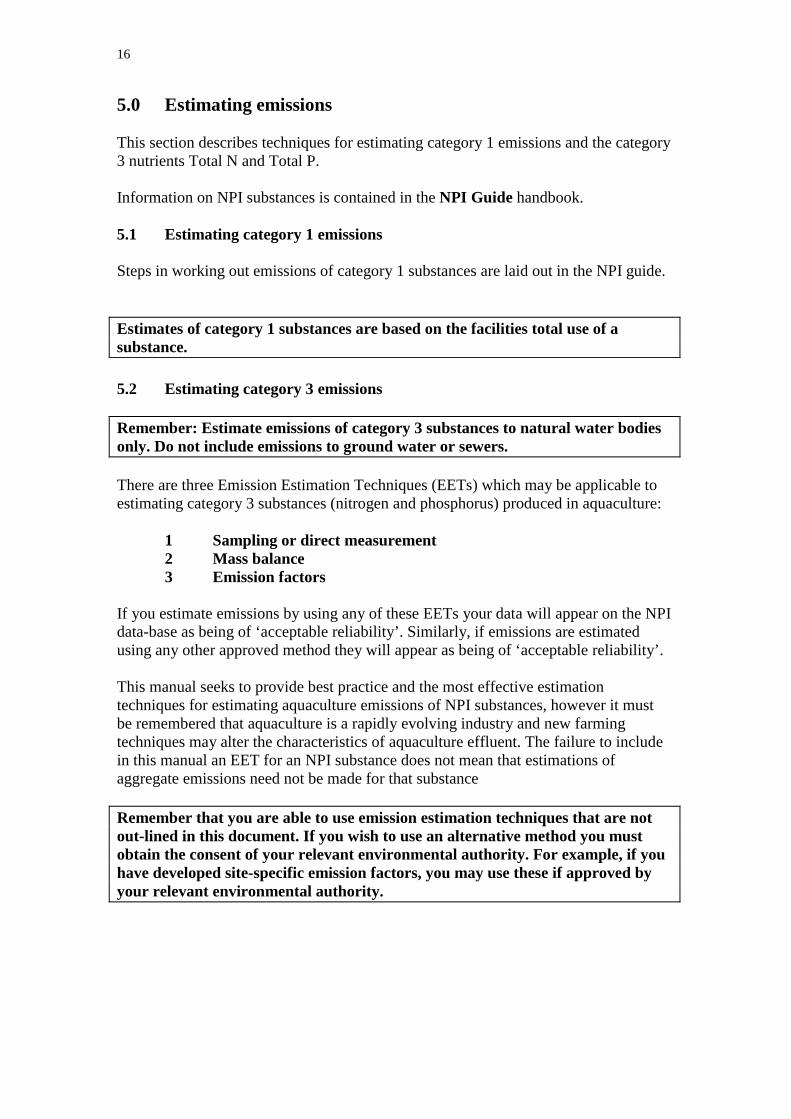
5.1 Estimating category 1 emissions
Steps in working out emissions of category 1 substances are laid out in the NPI guide.
Estimates of category 1 substances are based on the facilities total use of asubstance.
5.2 Estimating category 3 emissions
Remember: Estimate emissions of category 3 substances to natural water bodiesonly. Do not include emissions to ground water or sewers.
There are three Emission Estimation Techniques (EETs) which may be applicable toestimating category 3 substances (nitrogen and phosphorus) produced in aquaculture:
1 Sampling or direct measurement2 Mass balance3 Emission factors
If you estimate emissions by using any of these EETs your data will appear on the NPIdata-base as being of ‘acceptable reliability’. Similarly, if emissions are estimatedusing any other approved method they will appear as being of ‘acceptable reliability’.
This manual seeks to provide best practice and the most effective estimationtechniques for estimating aquaculture emissions of NPI substances, however it mustbe remembered that aquaculture is a rapidly evolving industry and new farmingtechniques may alter the characteristics of aquaculture effluent. The failure to includein this manual an EET for an NPI substance does not mean that estimations ofaggregate emissions need not be made for that substance
Remember that you are able to use emission estimation techniques that are notout-lined in this document. If you wish to use an alternative method you mustobtain the consent of your relevant environmental authority. For example, if youhave developed site-specific emission factors, you may use these if approved byyour relevant environmental authority.
17
5.2.1 Direct measure
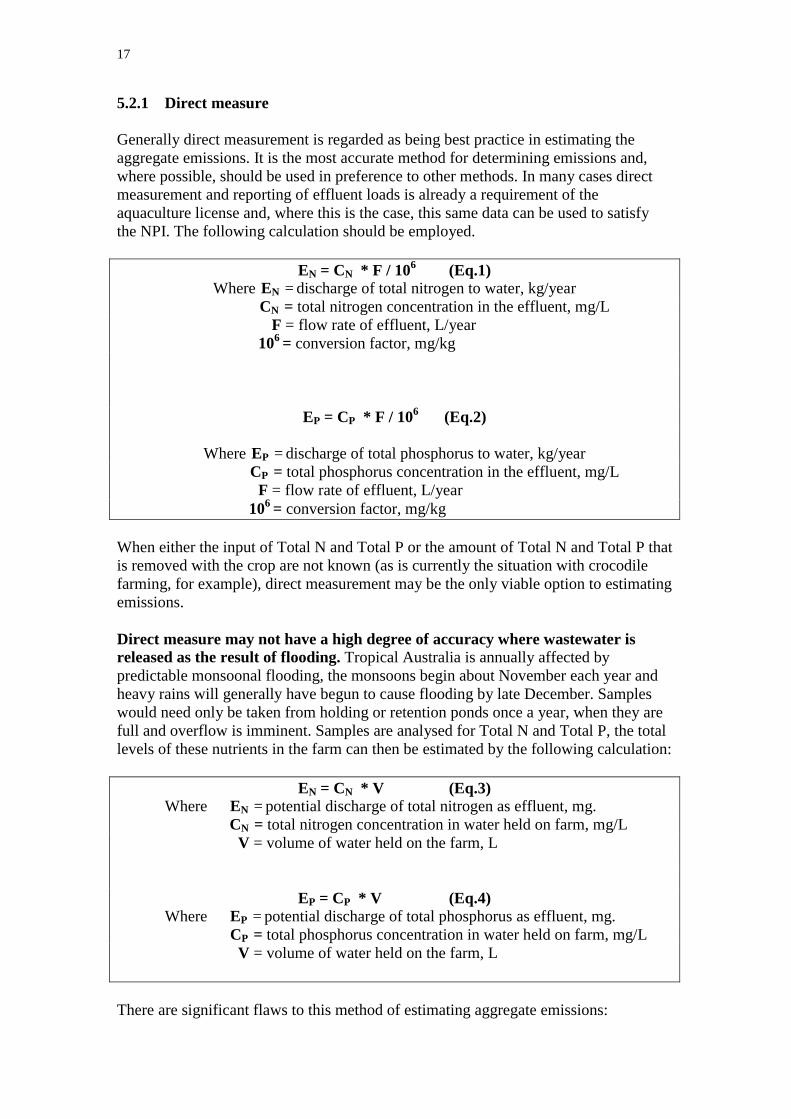
Generally direct measurement is regarded as being best practice in estimating theaggregate emissions. It is the most accurate method for determining emissions and,where possible, should be used in preference to other methods. In many cases directmeasurement and reporting of effluent loads is already a requirement of theaquaculture license and, where this is the case, this same data can be used to satisfythe NPI. The following calculation should be employed.
EN = CN * F / 106 (Eq.1)Where EN = discharge of total nitrogen to water, kg/year
CN = total nitrogen concentration in the effluent, mg/L F = flow rate of effluent, L/year
106 = conversion factor, mg/kg
EP = CP * F / 106 (Eq.2)
Where EP = discharge of total phosphorus to water, kg/year CP = total phosphorus concentration in the effluent, mg/L
F = flow rate of effluent, L/year106 = conversion factor, mg/kg
When either the input of Total N and Total P or the amount of Total N and Total P thatis removed with the crop are not known (as is currently the situation with crocodilefarming, for example), direct measurement may be the only viable option to estimatingemissions.
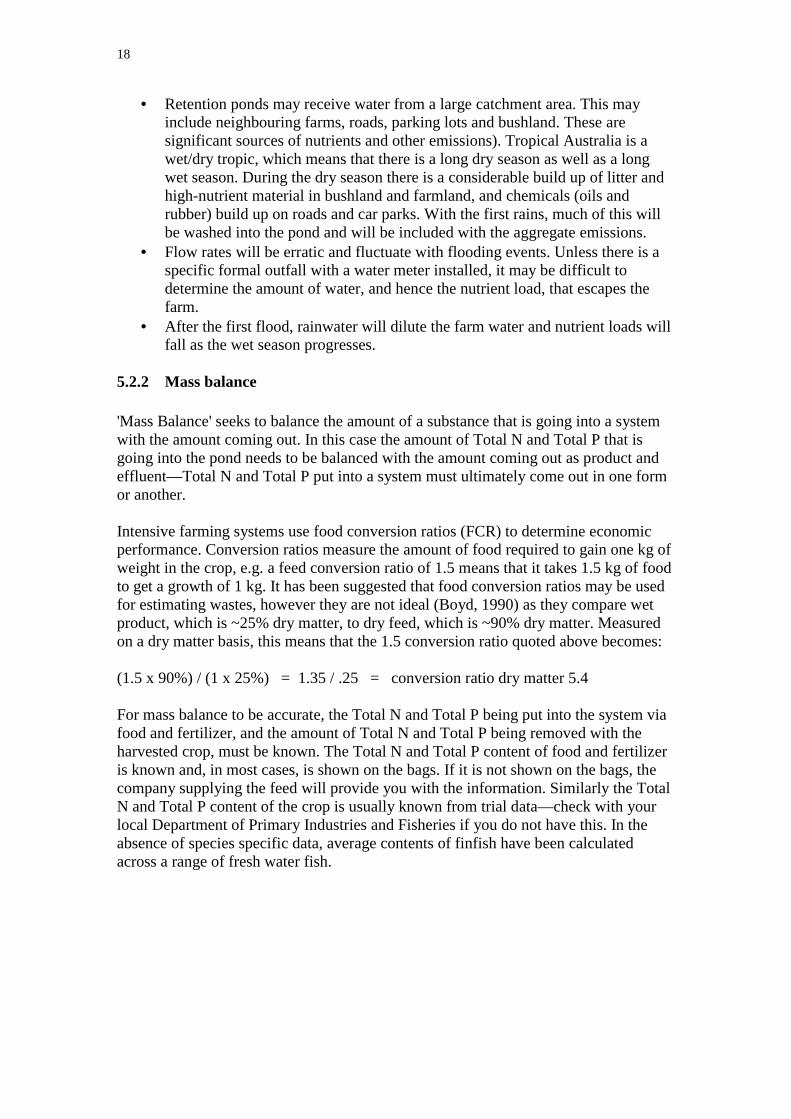
Direct measure may not have a high degree of accuracy where wastewater isreleased as the result of flooding. Tropical Australia is annually affected bypredictable monsoonal flooding, the monsoons begin about November each year andheavy rains will generally have begun to cause flooding by late December. Sampleswould need only be taken from holding or retention ponds once a year, when they arefull and overflow is imminent. Samples are analysed for Total N and Total P, the totallevels of these nutrients in the farm can then be estimated by the following calculation:
EN = CN * V (Eq.3)Where EN = potential discharge of total nitrogen as effluent, mg.
CN = total nitrogen concentration in water held on farm, mg/L V = volume of water held on the farm, L
EP = CP * V (Eq.4)Where EP = potential discharge of total phosphorus as effluent, mg.
CP = total phosphorus concentration in water held on farm, mg/L V = volume of water held on the farm, L
There are significant flaws to this method of estimating aggregate emissions:
18
• Retention ponds may receive water from a large catchment area. This mayinclude neighbouring farms, roads, parking lots and bushland. These aresignificant sources of nutrients and other emissions). Tropical Australia is awet/dry tropic, which means that there is a long dry season as well as a longwet season. During the dry season there is a considerable build up of litter andhigh-nutrient material in bushland and farmland, and chemicals (oils andrubber) build up on roads and car parks. With the first rains, much of this willbe washed into the pond and will be included with the aggregate emissions.
• Flow rates will be erratic and fluctuate with flooding events. Unless there is aspecific formal outfall with a water meter installed, it may be difficult todetermine the amount of water, and hence the nutrient load, that escapes thefarm.
• After the first flood, rainwater will dilute the farm water and nutrient loads willfall as the wet season progresses.
5.2.2 Mass balance
'Mass Balance' seeks to balance the amount of a substance that is going into a systemwith the amount coming out. In this case the amount of Total N and Total P that isgoing into the pond needs to be balanced with the amount coming out as product andeffluent—Total N and Total P put into a system must ultimately come out in one formor another.
Intensive farming systems use food conversion ratios (FCR) to determine economicperformance. Conversion ratios measure the amount of food required to gain one kg ofweight in the crop, e.g. a feed conversion ratio of 1.5 means that it takes 1.5 kg of foodto get a growth of 1 kg. It has been suggested that food conversion ratios may be usedfor estimating wastes, however they are not ideal (Boyd, 1990) as they compare wetproduct, which is ~25% dry matter, to dry feed, which is ~90% dry matter. Measuredon a dry matter basis, this means that the 1.5 conversion ratio quoted above becomes:
(1.5 x 90%) / (1 x 25%) = 1.35 / .25 = conversion ratio dry matter 5.4
For mass balance to be accurate, the Total N and Total P being put into the system viafood and fertilizer, and the amount of Total N and Total P being removed with theharvested crop, must be known. The Total N and Total P content of food and fertilizeris known and, in most cases, is shown on the bags. If it is not shown on the bags, thecompany supplying the feed will provide you with the information. Similarly the TotalN and Total P content of the crop is usually known from trial data—check with yourlocal Department of Primary Industries and Fisheries if you do not have this. In theabsence of species specific data, average contents of finfish have been calculatedacross a range of fresh water fish.
19
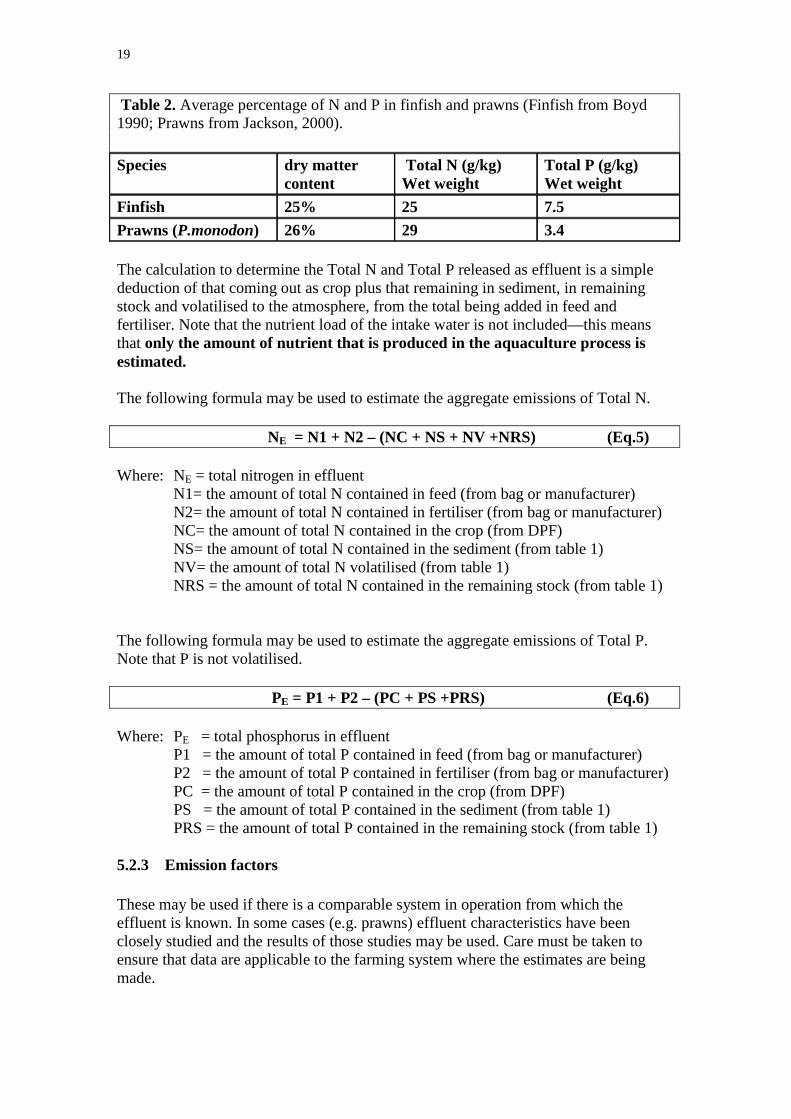
Table 2. Average percentage of N and P in finfish and prawns (Finfish from Boyd1990; Prawns from Jackson, 2000).
Species dry mattercontent
Total N (g/kg)Wet weight
Total P (g/kg)Wet weight
Finfish 25% 25 7.5Prawns (P.monodon) 26% 29 3.4
The calculation to determine the Total N and Total P released as effluent is a simplededuction of that coming out as crop plus that remaining in sediment, in remainingstock and volatilised to the atmosphere, from the total being added in feed andfertiliser. Note that the nutrient load of the intake water is not included—this meansthat only the amount of nutrient that is produced in the aquaculture process isestimated.
The following formula may be used to estimate the aggregate emissions of Total N.
NE = N1 + N2 – (NC + NS + NV +NRS) (Eq.5)
Where: NE = total nitrogen in effluentN1= the amount of total N contained in feed (from bag or manufacturer)N2= the amount of total N contained in fertiliser (from bag or manufacturer)NC= the amount of total N contained in the crop (from DPF)NS= the amount of total N contained in the sediment (from table 1)NV= the amount of total N volatilised (from table 1)NRS = the amount of total N contained in the remaining stock (from table 1)
The following formula may be used to estimate the aggregate emissions of Total P.Note that P is not volatilised.
PE = P1 + P2 – (PC + PS +PRS) (Eq.6)
Where: PE = total phosphorus in effluentP1 = the amount of total P contained in feed (from bag or manufacturer)P2 = the amount of total P contained in fertiliser (from bag or manufacturer)PC = the amount of total P contained in the crop (from DPF)PS = the amount of total P contained in the sediment (from table 1)PRS = the amount of total P contained in the remaining stock (from table 1)
5.2.3 Emission factors
These may be used if there is a comparable system in operation from which theeffluent is known. In some cases (e.g. prawns) effluent characteristics have beenclosely studied and the results of those studies may be used. Care must be taken toensure that data are applicable to the farming system where the estimates are beingmade.
20
5.3 Estimating techniques appropriate to specific farming systems
Estimating effluent techniques are generally applicable to farming systems rather thanto individual species because, although the species may be very different, the sameprinciples apply.
5.3.1 Intensive systems and Semi-Intensive systems
The best practice for estimating aggregate emissions from either intensive or semi-intensive systems is by direct measure. This is not, however, always practicable, so indefault accurate estimates may be obtained in most cases by mass balance.
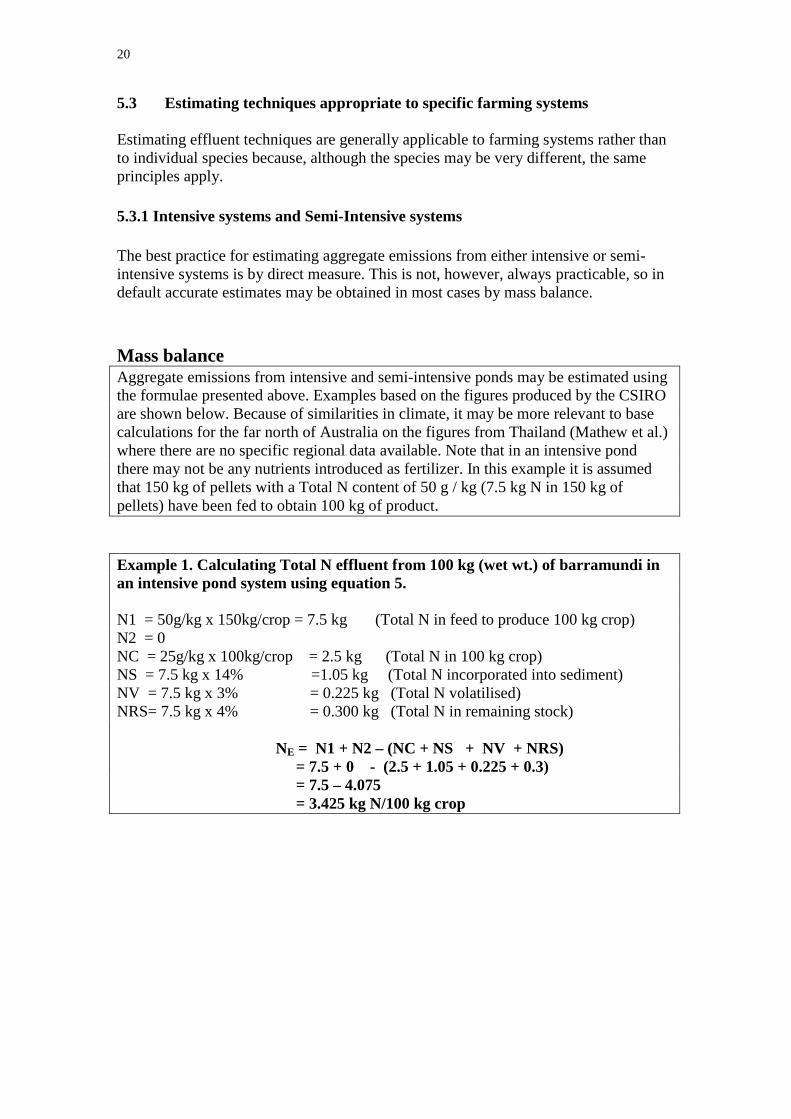
Mass balanceAggregate emissions from intensive and semi-intensive ponds may be estimated usingthe formulae presented above. Examples based on the figures produced by the CSIROare shown below. Because of similarities in climate, it may be more relevant to basecalculations for the far north of Australia on the figures from Thailand (Mathew et al.)where there are no specific regional data available. Note that in an intensive pondthere may not be any nutrients introduced as fertilizer. In this example it is assumedthat 150 kg of pellets with a Total N content of 50 g / kg (7.5 kg N in 150 kg ofpellets) have been fed to obtain 100 kg of product.
Example 1. Calculating Total N effluent from 100 kg (wet wt.) of barramundi inan intensive pond system using equation 5.
N1 = 50g/kg x 150kg/crop = 7.5 kg (Total N in feed to produce 100 kg crop)N2 = 0NC = 25g/kg x 100kg/crop = 2.5 kg (Total N in 100 kg crop)NS = 7.5 kg x 14% =1.05 kg (Total N incorporated into sediment)NV = 7.5 kg x 3% = 0.225 kg (Total N volatilised)NRS= 7.5 kg x 4% = 0.300 kg (Total N in remaining stock)
NE = N1 + N2 – (NC + NS + NV + NRS)= 7.5 + 0 - (2.5 + 1.05 + 0.225 + 0.3)= 7.5 – 4.075= 3.425 kg N/100 kg crop
21
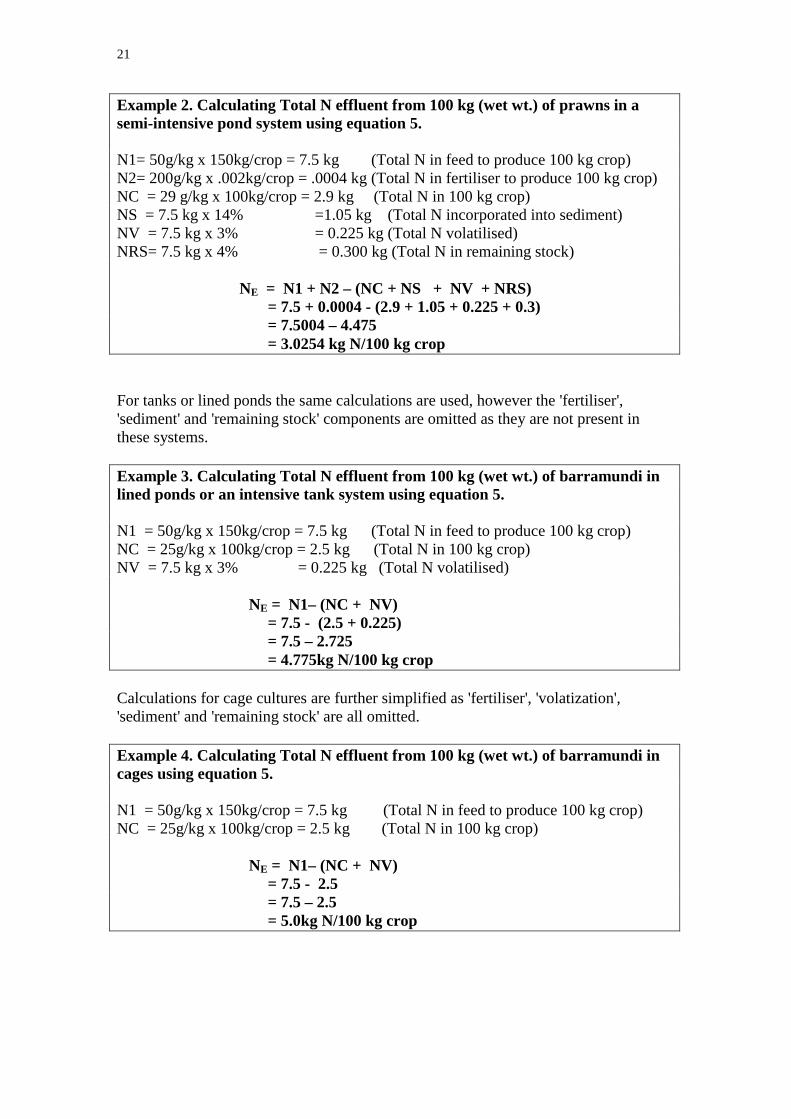
Example 2. Calculating Total N effluent from 100 kg (wet wt.) of prawns in asemi-intensive pond system using equation 5.
N1= 50g/kg x 150kg/crop = 7.5 kg (Total N in feed to produce 100 kg crop)N2= 200g/kg x .002kg/crop = .0004 kg (Total N in fertiliser to produce 100 kg crop)NC = 29 g/kg x 100kg/crop = 2.9 kg (Total N in 100 kg crop)NS = 7.5 kg x 14% =1.05 kg (Total N incorporated into sediment)NV = 7.5 kg x 3% = 0.225 kg (Total N volatilised)NRS= 7.5 kg x 4% = 0.300 kg (Total N in remaining stock)
NE = N1 + N2 – (NC + NS + NV + NRS)= 7.5 + 0.0004 - (2.9 + 1.05 + 0.225 + 0.3)= 7.5004 – 4.475= 3.0254 kg N/100 kg crop
For tanks or lined ponds the same calculations are used, however the 'fertiliser','sediment' and 'remaining stock' components are omitted as they are not present inthese systems.
Example 3. Calculating Total N effluent from 100 kg (wet wt.) of barramundi inlined ponds or an intensive tank system using equation 5.
N1 = 50g/kg x 150kg/crop = 7.5 kg (Total N in feed to produce 100 kg crop)NC = 25g/kg x 100kg/crop = 2.5 kg (Total N in 100 kg crop)NV = 7.5 kg x 3% = 0.225 kg (Total N volatilised)
NE = N1– (NC + NV)= 7.5 - (2.5 + 0.225)= 7.5 – 2.725= 4.775kg N/100 kg crop
Calculations for cage cultures are further simplified as 'fertiliser', 'volatization','sediment' and 'remaining stock' are all omitted.
Example 4. Calculating Total N effluent from 100 kg (wet wt.) of barramundi incages using equation 5.
N1 = 50g/kg x 150kg/crop = 7.5 kg (Total N in feed to produce 100 kg crop)NC = 25g/kg x 100kg/crop = 2.5 kg (Total N in 100 kg crop)
NE = N1– (NC + NV)= 7.5 - 2.5= 7.5 – 2.5= 5.0kg N/100 kg crop
22
Emission factors
Because of the likelihood of considerable variations between calculations fortemperate, sub-tropical and tropical conditions, it is not recommended that emissionfactors be used except to gain a very broad idea of your emissions.
As a general rule of thumb prawn farms produce a total of about 1–2 kg of N/ha/dayand 0.1–0.2 kg of P/ha/day (Jackson, 2000).
It has been estimated that effluent from finfish cage culture is in the order of 75–95 kgN and 10–20 kg P/tonne of fish produced (Enell and Lof, 1983 from Pillay, 1992).Care should be taken, however, when referring to any data on cage culture as it isvirtually all derived from temperate systems (the figures above relate to northernEurope) and may vary considerably under tropical conditions.
5.3.2 Extensive systems
There is no input of N or P into the system. No calculations are required.
23
6.0 References
Anon. 1996. Barramundi Farming in the Northern Territory. Dept of Primary Industryand Fisheries.
Beveridge, M. C .M.,1987. Cage Aquaculture. Published by: Fishing News Books,Oxford, U.K.
Boyd, C., 1999. Cleaner effluent for prawn farms. Austasia Aquaculture, Oct/Nov1999, Pp 7–9.
Boyd,C.E., 1990. Water Quality in Ponds for Aquaculture. Alabama AgricultureExperiment Station, Auburn University, Alabama. Published byBirmingham Publishing Co.
Briggs, M. R. P.,Funge-Smith, S. J., Unsustainable Shrimp Culture – Causes andPotential Solutions from Experience in Thailand..
Cavicchiolo, M., 2000. Qld Environment Protection Authority. Personalcommunication.
Costa-Pierce, B.A., 1998. Impacts of Coastal Zone Aquaculture. Sustainable Oceansand Coastal Zones 1998 United Nations Year of the Oceans, Chapter 6.http://www.cnlm.uci.edu/~sustain/suscoasts/chapter5.htm
Davis, B., 2000. Qld. DPI, Oonoonba Townsville. Personal communication.
Hales, P. 2000. Qld. DPI, Northern Fisheries Centre, Cairns. Personal communication.
Hinton, A.W. and Jones, C.M., 1998. Redclaw Crayfish Farming, an EconomicPerspective. Qld DPI, Choice Seminar Series.
Jackson, C. 2000. CSIRO Cleveland Qld., Personal communication.
Johnson, S., 2000. Qld. DPI, Oonoonba Townsville. Personal communication.
Manolas, S. C., 2000 Wildlife Management International, Personal communication.
Mitchell, G. E., Reed, A.W. and Houlihan, D. B. 1994. Composition of CrocodileMeat (Crocodylus porosus and C. Johnstoni). Qld. DPI-IFIQ 2684798.
Pillay, T. V. R., 1992. Aquaculture and the Environment. Published by: Fishing NewsBooks, Oxford, U.K.
Preston, N. 2000. CSIRO. Cleveland Qld., Personal communication.
Pruder, G. D., 1992. Marine Shrimp Pond Effluent: Characterization andEnvironmental impact. Proceedings of the Special Session on ShrimpFarming. World Aquaculture Society, Baton Rouge, LA USA. Pp 187–194.
24
Rimmer, M.A. and Rutledge, W. P., 1991.Pond Rearing of Barramundi Larvae.Austasia Aquaculture, April 1991, Pp 19–21.
Robertson, C. 2000. Qld. DPI, Northern Fisheries Centre, Cairns. Personalcommunication.
Simlesa, V., 2000. Northern Territory DPIF. Personal communication.
Thorne, Tina., 2000 Fisheries Western Australia, Personal communication.
Trott, L., 2000. Australian Institute of Marine Science. Personal communication.
Webb, G.J.W., Gregory, J. H. and Manolis, S.C. 1991. Feeding, Growth and FoodConversion Rates of Wild Juvenile Saltwater Crocodiles (Crocodylusporosus). Journal of Herpetology, 25 / 4, Pp 462–473.
Wells, F. E.,1998. The Environmental Impact of Pearling (Pinctada maxima) inWestern Australia. Enzer Marine.
Winsfield, M. 2000. Qld. DPI, Walkamin Research Facility. Personal communication.
25
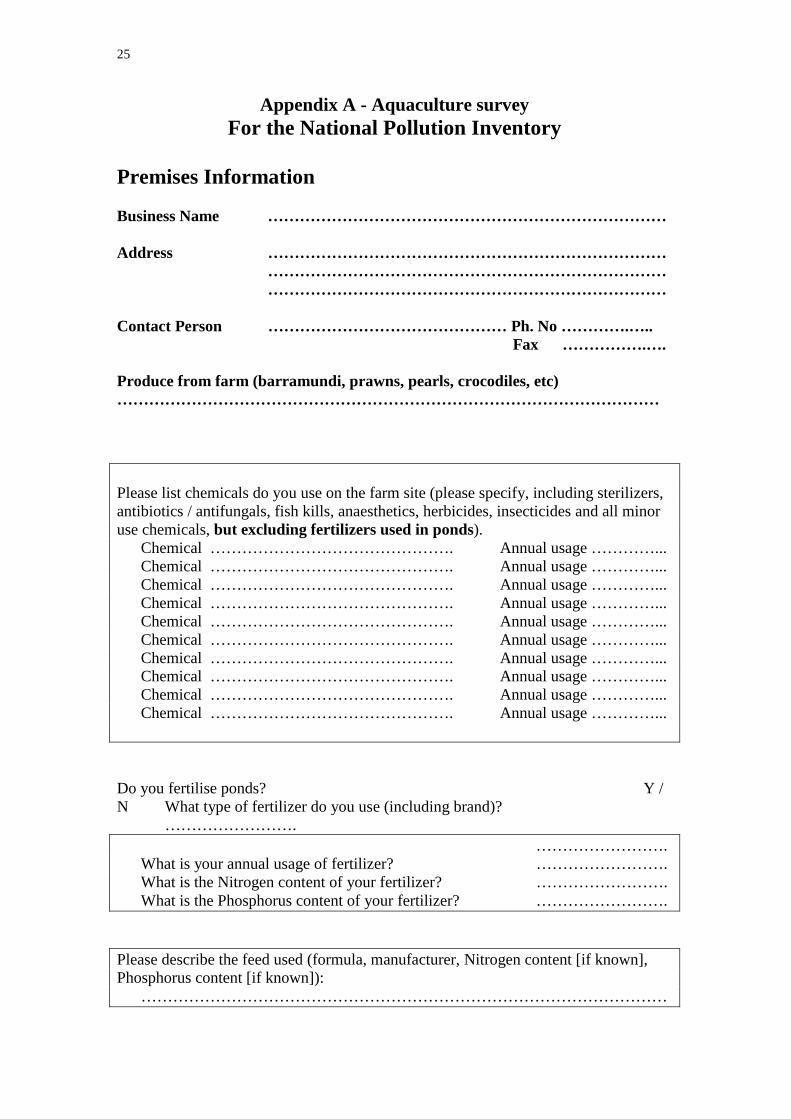
Appendix A - Aquaculture surveyFor the National Pollution Inventory
Premises Information
Business Name …………………………………………………………………
Address ………………………………………………………………………………………………………………………………………………………………………………………………………
Contact Person ……………………………………… Ph. No ………….…..Fax …………….….
Produce from farm (barramundi, prawns, pearls, crocodiles, etc)…………………………………………………………………………………………
Please list chemicals do you use on the farm site (please specify, including sterilizers,antibiotics / antifungals, fish kills, anaesthetics, herbicides, insecticides and all minoruse chemicals, but excluding fertilizers used in ponds).
Chemical ………………………………………. Annual usage …………...Chemical ………………………………………. Annual usage …………...Chemical ………………………………………. Annual usage …………...Chemical ………………………………………. Annual usage …………...Chemical ………………………………………. Annual usage …………...Chemical ………………………………………. Annual usage …………...Chemical ………………………………………. Annual usage …………...Chemical ………………………………………. Annual usage …………...Chemical ………………………………………. Annual usage …………...Chemical ………………………………………. Annual usage …………...
Do you fertilise ponds? Y /N What type of fertilizer do you use (including brand)?
…………………….…………………….
What is your annual usage of fertilizer? …………………….What is the Nitrogen content of your fertilizer? …………………….What is the Phosphorus content of your fertilizer? …………………….
Please describe the feed used (formula, manufacturer, Nitrogen content [if known],Phosphorus content [if known]):
………………………………………………………………………………………
26
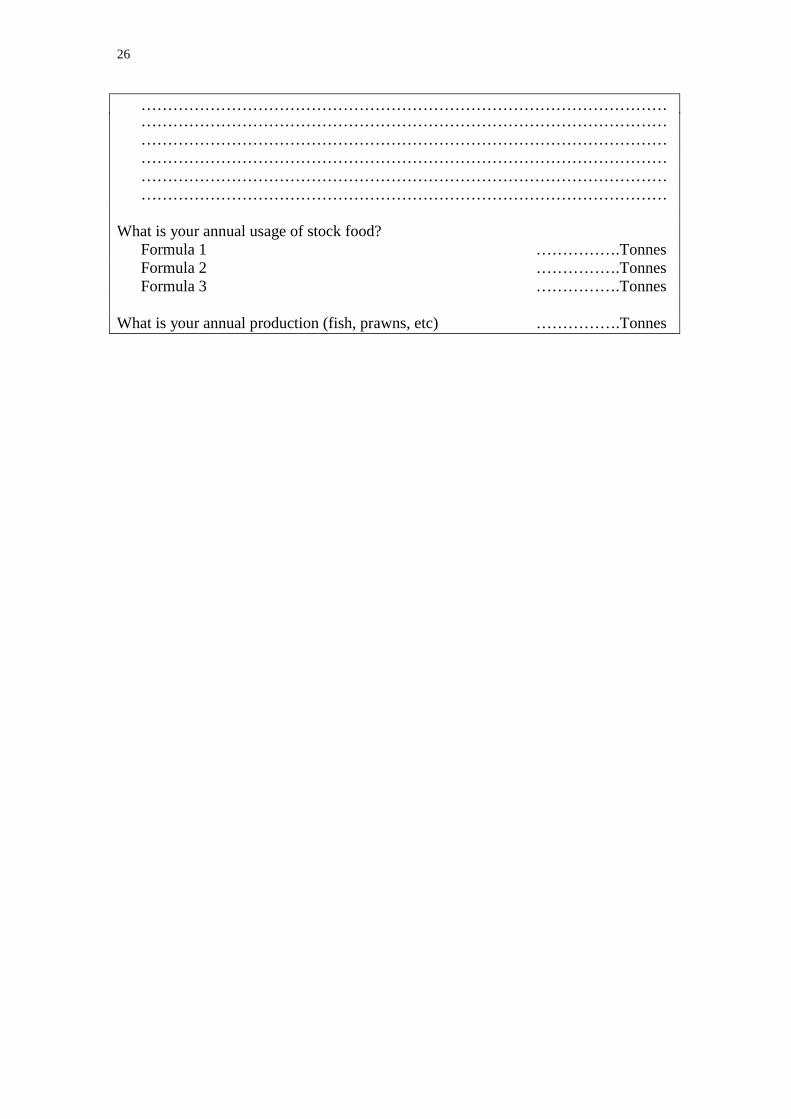
………………………………………………………………………………………………………………………………………………………………………………………………………………………………………………………………………………………………………………………………………………………………………………………………………………………………………………………………………………………………………………………………………………
What is your annual usage of stock food? Formula 1 …………….TonnesFormula 2 …………….TonnesFormula 3 …………….Tonnes
What is your annual production (fish, prawns, etc) …………….Tonnes
27
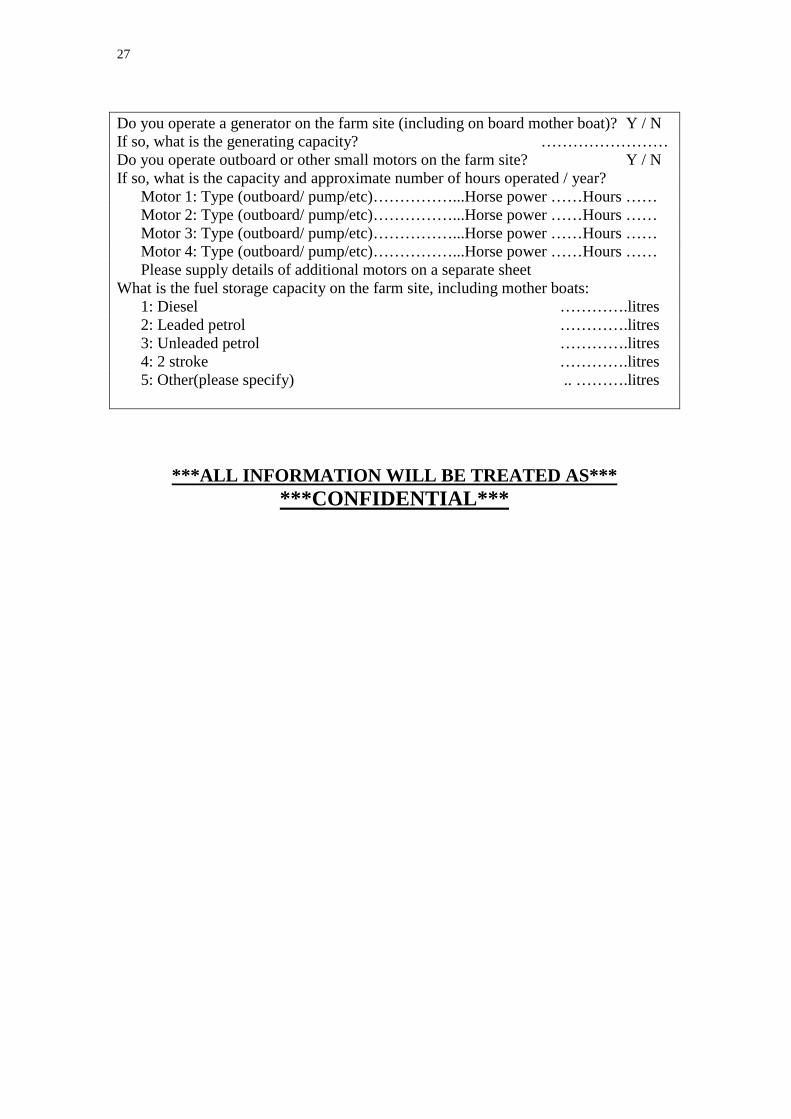
Do you operate a generator on the farm site (including on board mother boat)? Y / NIf so, what is the generating capacity? ……………………Do you operate outboard or other small motors on the farm site? Y / NIf so, what is the capacity and approximate number of hours operated / year?
Motor 1: Type (outboard/ pump/etc)……………...Horse power ……Hours ……Motor 2: Type (outboard/ pump/etc)……………...Horse power ……Hours ……Motor 3: Type (outboard/ pump/etc)……………...Horse power ……Hours ……Motor 4: Type (outboard/ pump/etc)……………...Horse power ……Hours ……Please supply details of additional motors on a separate sheet
What is the fuel storage capacity on the farm site, including mother boats:1: Diesel ………….litres2: Leaded petrol ………….litres3: Unleaded petrol ………….litres4: 2 stroke ………….litres5: Other(please specify) .. ……….litres
***ALL INFORMATION WILL BE TREATED AS******CONFIDENTIAL***