Embed Size (px)
Citation preview
AggregateDemand and Supply
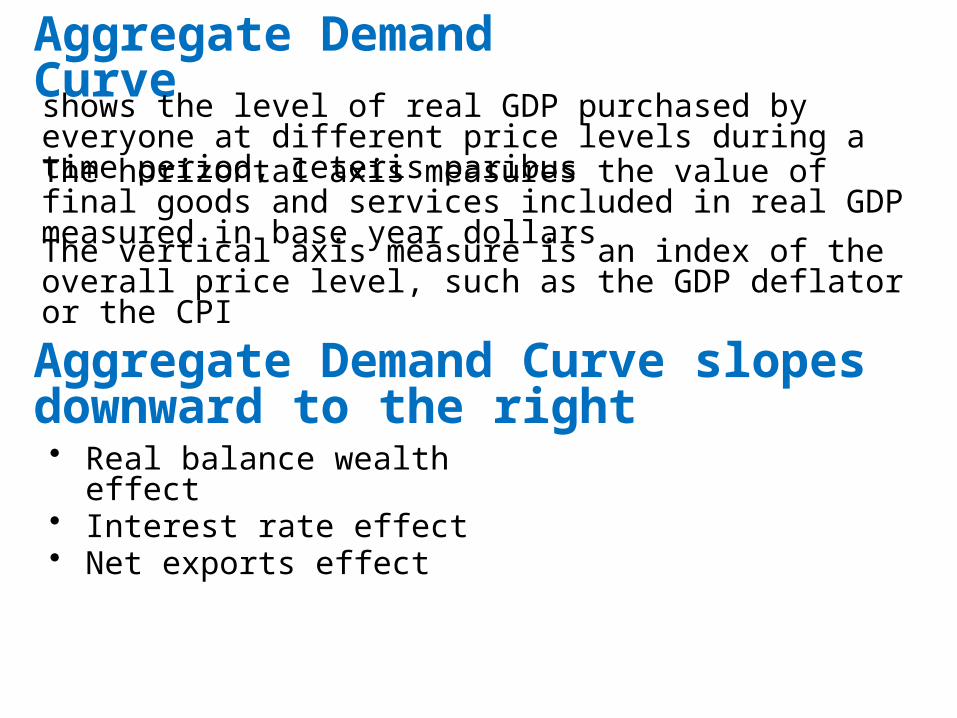
Aggregate Demand Curveshows the level of real GDP purchased by everyone at different price levels during a time period, ceteris paribus
The horizontal axis measures the value of final goods and services included in real GDP measured in base year dollars
The vertical axis measure is an index of the overall price level, such as the GDP deflator or the CPI
Aggregate Demand Curve slopes downward to the right• Real balance wealth effect• Interest rate effect• Net exports effect

Interest Rate EffectAssuming fixed credit, an increase in the price level translates through higher interest rates into a lower real GDP
Net Exports EffectA higher domestic price level makes U.S. goods more expensive compared to foreign goods, exports decrease, imports increase, decreasing real GDP
Real Balance EffectConsumers spend more on goods and services because lower prices make their dollars more valuable
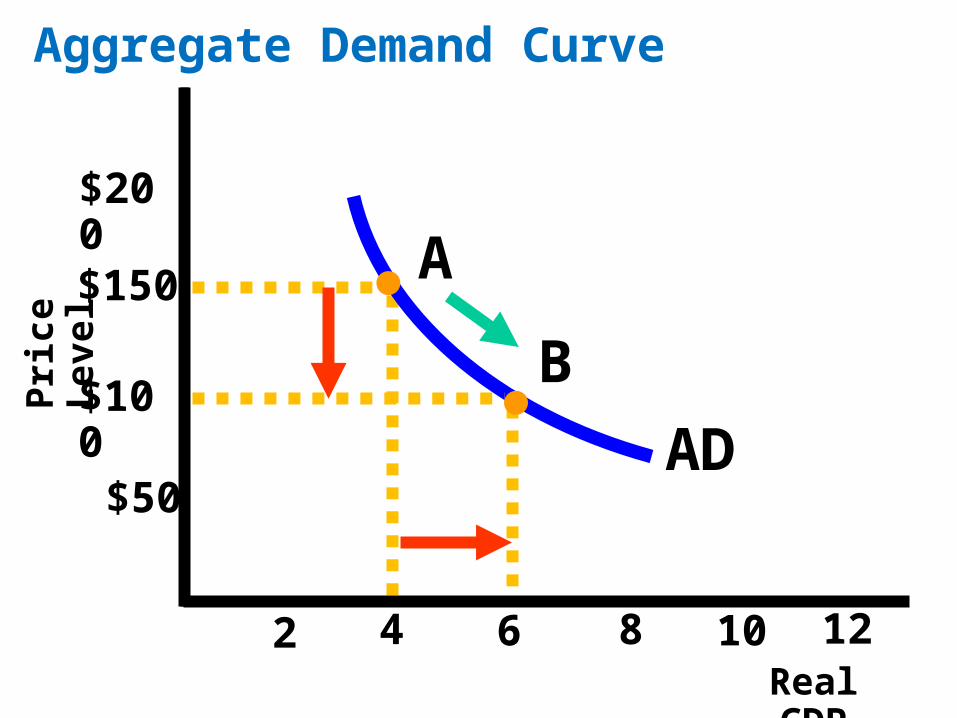
Aggregate Demand Downward Slope
$200
$150
$100
$50
2 4 6 8
B
A
1210
AD
Aggregate Demand CurveP
rice
Lev
el
Real GDP

Shifts in Aggregate Demand Curve• Consumption, • Investments, • Government spending and • Net exports can change

200
150
100
50
2 4 6 8
BA
1210
AD2
AD1
Shift in Aggregate Demand CurveP
rice
Lev
el (
CP
I)
Real GDP

Increases in C,I, G, (X-M)
Increases (shifts) in the aggregate demand curve
lead to

Aggregate Supply CurveShows the level of real GDP produced at different price levels during a time period, ceteris paribus
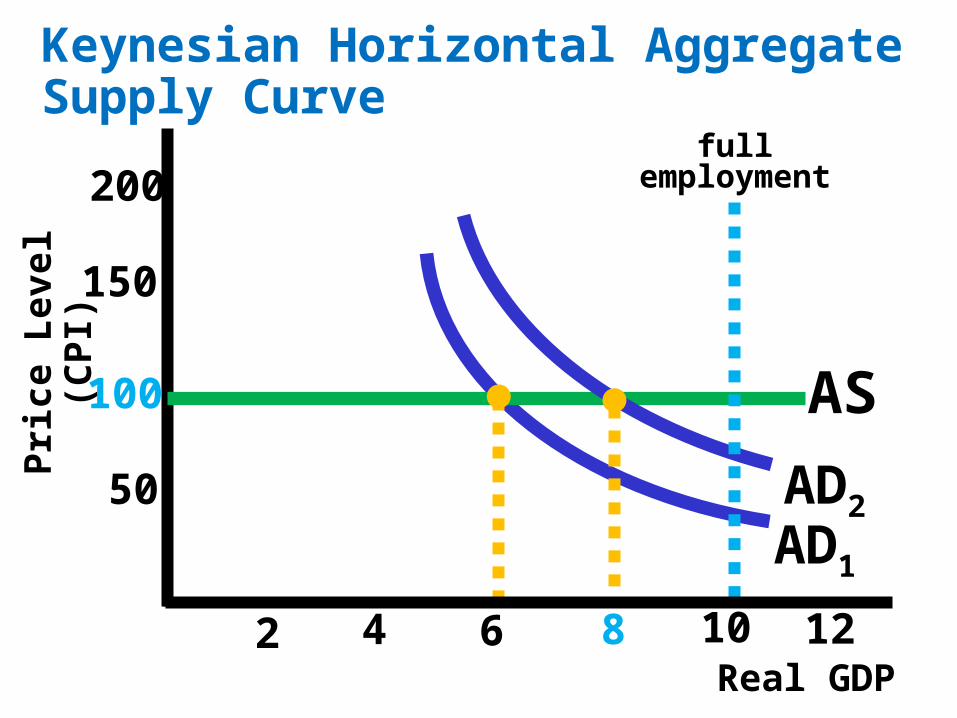
Keynes assumes fixed product prices and wagesDuring a deep recession or depression, there are many idle resources in the economyProducers are willing to sell additional output at current prices because there is plenty of resources to go around for everyone who wants themIdle resources mean fixed wages: Unemployed workers willing to work for the prevailing wage diminishes the power of workers to increase their wages
What kind of supply curve would explain fixed prices and wages?A horizontal supply curve
200
150
100
50
2 4 6 8Real GDP
Pri
ce L
evel
(C
PI)
12
AS
AD2
AD1
Keynesian Horizontal Aggregate Supply Curve
full employment
10

Government spending (G)
increases
Aggregate demand increases and the
economy moves from E1 to E2
Price level remains constant, while real GDP
and employment rise

Keynesians believe what a shift in aggregate demand will restore a depressed economy to full employment
Classical view of the aggregate supply curvea vertical line at the full employment output
Classical economists believe
Understanding the Different Theories
the economy normally operates at its full employment levelthe price level of products and production costs change by the same percentage in order to maintain full employment

200
150
100
50
2 4 6 8 10 12 14 16Real GDP
Full employment
Classical Aggregate Supply Curve
AS
Pri
ce L
evel
(C
PI)
17
AD1
AD2
Surplus

Aggregate demand decreases at full
employment
Unemployment causes a decrease in prices
The economy moves to a level of full employment

YK Real GDP
Keynesian Range
Ranges of the Aggregate Supply Curve
ASP
rice
Lev
el
Inte
rmed
iate
Range
Cla
ssic
al
Ran
ge
YF
Full Employment

2 4 6 8 10 12
AS
0
$50
$100
$150
$200
Full Employment
AD1
AD3
AD4
Increasing Demand
AD6
AD5
AD2
200
150
100
50
2 4 6 8 10 12 14 16full
employment
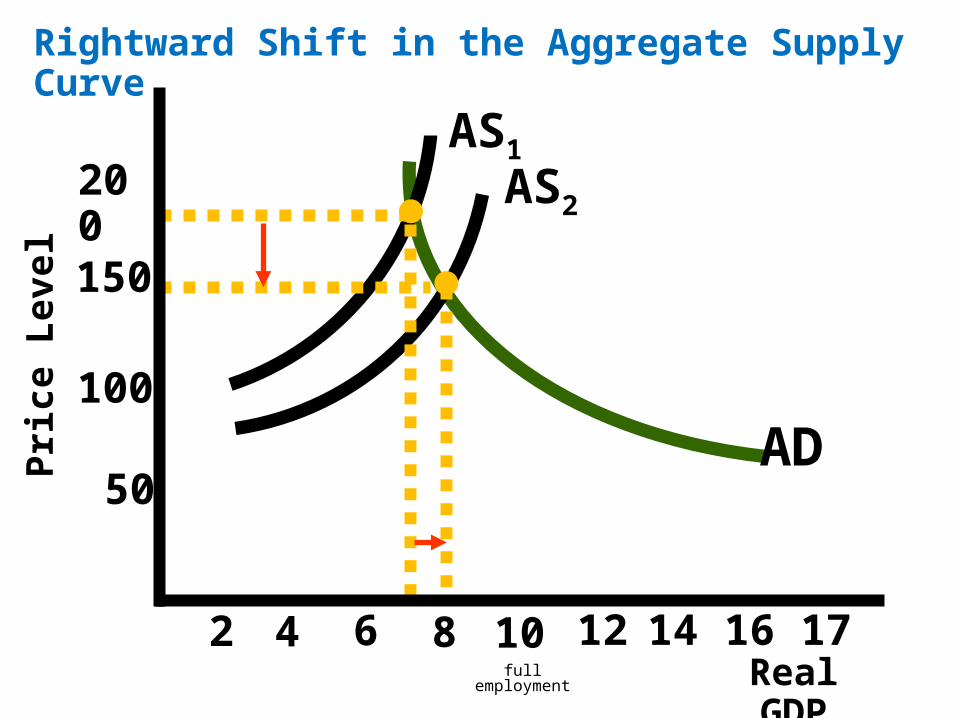
Rightward Shift in the Aggregate Supply CurveP
rice
Lev
el
17
AS1
AD
AS2
Real GDP

Types of Inflation• Cost push• Demand pull
Cost Push InflationA rise in the general price level resulting from an increase in the cost of production
Demand Pull InflationA rise in the general price level resulting from an excess of total spending

200
150
100
50
2 4 6 8 10 12 14 16
Pri
ce L
evel
17
AD
AS1
Real GDP
AS2
Cost Push Inflation

200
150
100
50
2 4 6 8 10 12 14 16
Pri
ce L
evel
17
AD1
AS
Real GDP
AD2
Demand Pull Inflation

StagflationHigh unemployment and rapid inflation exist simultaneously
The business cycleShifts in the aggregate demand and aggregate supply curves
Other Shifts in AD & AS

200
150
100
50
2 4 6 8 10 12 14 16 17
AD1
AS1
Real GDP
AD2
AS2
Rightward Shift in Demand and SupplyP
rice
Lev
el

Increase in aggregate demand and supply
Increase in real GDP
Increase in price level