Embed Size (px)
Citation preview
Agglomeration Effects
in the Diffusion of Advanced Manufacturing Technologies
(Job Market Paper)
Joung Yeo Angela No
University of Toronto*
November 20, 2002
Abstract
Knowledge spillovers associated with the diffusion of new technologies have long been viewed as an important driver of economic growth. However, this claim has largely resisted econometric scrutiny because patterns of technology adoption are generally not observable. This paper overcomes this problem by exploiting a proprietary panel data set that reports the adoption of 22 advanced manufacturing technologies by 1,902 Canadian plants. The paper starts with documenting the fact that the adoption of these technologies is more highly concentrated geographically (i.e., agglomerated) than other forms of economic activity. Motivated by this fact, I test for knowledge spillovers by investigating how a plant’s probability of adopting a new technology depends on the presence of prior adopters. The results indicate that technology adoption is facilitated by the presence of prior adopters with four characteristics. First, they are adopters of the same technology (as opposed advanced technologies more generally). Second, they reside in the same region. Third, they are similar to the potential adopter in that they purchase a similar set of intermediate goods and services, and finally, they are dissimilar to the potential adopter in that they do not operate in the same product market (i.e., the same 4-digit SIC code). These results are robust to controlling for the effects of regional labour pooling, regional linkages to suppliers and buyers, as well as industry, region, and technology fixed effects. These findings strongly suggest that agglomeration in the adoption of new technologies is driven by knowledge spillovers. Key words: Technology adoption, Agglomeration, Knowledge spillovers, Micro-data JEL Classification: O3, R3
* I am grateful to Dan Trefler, Diego Puga and Nadia Soboleva for helpful comments. I would like to thank Adonis Yatchew and seminar participants at the University of Toronto. I also thank John Baldwin and Statistics Canada for providing the data, and Industry Canada for financial support. Any errors and omissions are my own. Author’s contact information: email: [email protected], phone: (416) 946-3584, fax: (416) 978-5519, homepage: http://www.chass.utoronto.ca/~jyano
2
1. Introduction
Knowledge spillovers associated with the diffusion of new technologies have long
been viewed as important drivers of modern economic growth (e.g., Rosenberg 1982;
Landes 1990; Romer 1990). Since knowledge spillovers both facilitate and are facilitated
by regional economic agglomerations (e.g., Marshall 1920; Krugman 1991a, 1991b;
Porter 1998), it is natural to wonder whether knowledge spillovers also lead to
agglomeration effects in the adoption of new technologies. Specifically, is the adoption of
new technologies more highly agglomerated than other forms of economic activity and, if
so, can this be explained by knowledge spillovers?
Figure 1 provides a simple answer to the first part of this question. It shows that
geographic concentration is higher for plants using advanced manufacturing technologies
than is for all plants in an industry.1 This fact is new to the literature and raises an
obvious question: What explains the high degree of geographic agglomeration among
adopters of advanced manufacturing technologies? One potential explanation appeals to
knowledge spillovers across technology adopters. Unfortunately, this is not an easy
hypothesis to explore. Firstly, we rarely observe knowledge spillovers directly.
Secondly, there are alternative potential explanations such as labour pooling, forward and
backward linkages between suppliers and purchasers (e.g., Krugman 1991a; Fujita,
Krugman and Venables 1999; Porter 1990), and local amenities which have nothing to do
with spillovers such as transportation infrastructure and even weather.2
In this paper I will investigate each of these explanations. While I find some
support for almost all of them, my most interesting result is that a plant is more likely to
adopt a specific technology (e.g., a flexible manufacturing cell) if that specific technology
has already been adopted by other plants in the same region. This effect cannot be traced
back to a spurious correlation operating at the industry level, the region level, or even the
industry-region level. For one, the result holds even after controlling for labour pooling,
backward linkages to suppliers, forward linkages with buyers, and even industry, region,
and technology fixed effects. For another, the result is strongest when prior adopters are
1 I expand on this in section 2. 2 See Hanson (2000) for discussion of the issues associated with identifying agglomeration effects.
3
in a different industry than the new adopter. In short, my finding strongly indicates that
there is communication across plants in the same region.
Such communication implies that there are localized, learning-based knowledge
spillovers as in Case (1992), Jaffe, Trajtenberg, and Henderson (1993), Powell and
Brantley (1992), and von Hippel (1988). More specifically, in the decision to adopt a new
technology, potential adopters often face uncertainties about implementation costs. Since
certain types of information about the implementation of a new technology are tacit,
learning about tacit information will happen through direct observation of early adopters,
demonstration effects, word-of-mouth, and other informal mechanisms. Hence, the rapid
and complete diffusion of a new technology will be facilitated by proximity to prior
adopters.3
The analysis in this paper is based upon a proprietary panel data set on the
adoption of 22 advanced manufacturing technologies by 1,902 Canadian plants. I use
this data to address the following questions. First, and most importantly, are there
regional knowledge spillovers linking prior adopters to potential adopters? And, does the
extent of spillovers depend on whether the prior adopters are ‘similar’ to the potential
adopters where similar is measured in terms of the pattern of input usage? Second, what
is the sectoral scope of agglomeration? That is, are agglomeration effects facilitated by
regional specialization in just a few industries as in Marshall (1920) or are they facilitated
by regional diversification as in Jacobs (1969)? Third, what is the technological scope of
knowledge spillovers? If prior adopters primarily adopt technology 2, does this impact a
potential adopter of any technology or only of technology 2?
Fourth, how does a region’s industrial structure (i.e., its mix of large and small
plants) contribute to the speed of learning in the region? Saxenian (1994) claims that
Silicon Valley, with its many small firms, provided a more flexible and open
environment than did Massachusetts’s Route 128 which only had few dominant players.
To test this, I examine how different organinzational forms -- small vs. large, and single-
plant vs. multi-plant firms-- differentially affect the diffusion of knowledge. Fifth, are
there any plant size- or plant status-related difference in the effects of regional
3 The geographic concentration of technology adopters may also be due to other agglomeration effects or ‘common environments’ that plants face. See section 3.

4
agglomeration on the adoption decision? Do small or single-plant firms benefit more
from regional agglomeration?
While the effect of agglomeration on technology adoption is conjectured to be
important in most discussions about agglomeration, there is very little related work.
There are three relevant strands of literature. The first strand of work is by Jaffe,
Trajtenberg, and Henderson (1993) who study the type of knowledge spillover that is
captured by patent citations. The use of patent citations to study knowledge spillovers
has three drawbacks. First, firms often do not patent (Levin et al. 1987; Rosenberg
1982). Second, not all patents contain valuable information, so they are not the best
measure of knowledge spillovers. Third, patents only describe a certain innovation side of
knowledge, and not all innovation activity lend themselves to patenting. In contrast, the
22 advanced manufacturing technologies that are my object of study are often general
purpose technologies which are valuable and universally accessible, therefore, they are
likely candidates for a study of knowledge spillovers.
The second strand in the literature is not about knowledge spillovers per se, but
about the importance of different sources of agglomeration (Rosenthal and Strange 2001;
Dumais, Ellison and Glaeser 2002; and Holmes 2002). In these papers, each source of
agglomeration is examined separately and, to the extent that knowledge spillovers are
considered, they are either imperfectly measured or treated as residuals.
The third related strand of literature examines the impact of agglomeration on
technology adoption. This is the literature most closely related to this paper. However, it
consists of only two studies, namely, Harrison, Kelley and Gant (1996) and Kelley and
Helper (1997). They examine the effects of location attributes on the adoption of
Computer Numerically Controlled (CNC) machines. Unfortunately, these studies are
more of case studies based on the adoption of one specific technology and examine only
a small number of plants in a small subset of industries. Specifically, they study only 342
plants in 21 industries. Further, they do not directly investigate knowledge spillovers or
isolate such spillovers from the effects of other location attributes. In short, they simply
examine the attributes of location that better facilitate technology adoption.
Consequently, identification of the effects of knowledge spillovers are left unanswered.
5
This paper is the first to empirically identify and separately estimate the impact of
knowledge spillovers and other sources of agglomeration on technology adoption.
The paper’s main finding is that technology adoption is facilitated by the presence
of prior technology adopters with 4 characteristics: (1) they are adopters of the same
technology (as opposed to adopters of advanced technology more generally); (2) they
reside in the same region; (3) they are similar to the potential adopter in that they
purchase a similar set of intermediate goods and services; and (4) they are dissimilar to
the potential adopter in that they do not operate in the same product market (i.e., the same
4-digit SIC code). This result holds even after controlling for the effects of regional
labour pooling, regional linkages to suppliers and buyers, as well as industry, region, and
technology fixed effects. These findings strongly suggest that agglomeration in the
adoption of new technologies is driven by knowledge spillovers.
A second important finding of this paper is that the regional industrial structure
affects the learning of technical knowledge in a region. Environments that are
characterized by smaller plants as opposed to larger plants, and single-plant firms as
opposed to multi-plant firms better facilitate the creation and the diffusion of knowledge.
This paper is the first to document that what is observed in Silicon Valley and Route 128
(Saxenian 1996) is not unique to those regions, but a broader experience (observed in
more general data). Finally, this paper finds that small and single-plant firms not only
better facilitate the diffusion of technical knowledge in a region, but also benefit more
from agglomeration economies.
The remainder of the paper is organized as follows. Section 2 documents the
higher concentration of technology adopting plants than all manufacturing plants.
Section 3 discusses the different sources of agglomeration externalities, and competing
theories of agglomeration economies. Section 4 describes the data sources. Section 5
explains the model specification and construction of variables. Section 6 presents the
results of agglomeration effects on technology adoption. Section 7 examines the
organization characteristics of plants that are more likely to adopt technologies. Section
8 concludes.
6
2. The Geographic Concentration of Advanced Technology Adopters
In this section, I examine the degree of geographic concentration of all plants in
manufacturing industries in Canada and those plants using advanced manufacturing
technologies. As a measure of the degree of agglomeration, I employ Ellison-Glaeser
index of concentration. The Ellison-Glaeser index is defined as:
( )2 2 2
1 1 1
2
1
( ) 1
1 1
M M N
i i i ji i j
N
jj
s x x zG H
H zγ = = =
=
− − −−≡ ≡− −
∑ ∑ ∑∑
.
( )2
i iiG s x≡ −∑ is the spatial Gini coefficient, where ix is location i’s share of
employment in a particular industry. 2
1j
j
H z=
= ∑ is the Herfindahl index of the j plants in
the industry, with zj representing the employment share of the jth plant. Let s1, s2 ,…, sM
be the shares of an industry’s employment in each of M geographic areas, and x1, x2,….,
xM be the shares of total employment in each of M areas.
This index corrects for the random concentration arising from industrial structure
that the spatial Gini does not control for.4 It measures the excess concentration beyond
what would be expected to occur randomly. It takes on a value of zero when an industry
is as concentrated as one would expect to result from a random location process, and
takes a positive value when an industry is concentrated more than what one would expect
to occur randomly.
Figure 1 exhibits the Ellison-Glaeser index of concentration for all manufacturing
plants and advanced technology adopting plants as of 1993 for 2-digit manufacturing
industries at the Economic Region level. The grey bars show the concentration of all
plants in each industry. All 2-digit manufacturing industries have a positive value of the
index, indicating excess geographic concentration. This is a well-documented fact in the
4 The ( )21 ii
x− ∑ term is included so that the index � has the property that E(� )=0 when neither
agglomerative spillovers nor natural advantage is present (see Ellison and Glaeser 1997 for details). A positive value of the spatial Gini can arise when an industry is made up of a small number of large plants and there is no agglomerative force leading to concentration. For a perfectly competitive industry with a

7
literature (see e.g. Krugman 1991b; Ellison and Glaeser 1997). What is more interesting,
however, is the degree of concentration among adopters of advanced technologies, which
is shown by the black bars. It indicates that technology adopters not only exhibit excess
concentration in every industry, but for most industries, the adopters of advanced
technologies are substantially more concentrated than overall plants. This fact has never
been documented in the literature.5 While a positive value of the index does not
necessarily indicate the presence of agglomeration externalities, it is what one would
expect if the regional agglomeration externalities are indeed present. How can this higher
degree of agglomeration among technology adopters be explained? Is it because there
are localized knowledge spillovers across technology adopting plants? Or alternatively,
is it because other agglomeration economies or ‘common environment’ which attract
plants to certain regions also facilitate technology adoption?
3. The Effects of Agglomeration Externalities
In this section, I discuss various aspects of the regional agglomeration that may
affect technology adoption in a region. In section 3.1, the potential explanations for the
observed agglomeration of technology adopters are discussed. In section 3.2, I explain
the competing theories on the economic environment settings that facilitate
agglomeration economies. In section 3.3, I discuss how the organization of economic
activity within a region may affect technology adoption.
3.1 The Sources of Agglomeration Economies
The three main sources of regional agglomeration economies come from
knowledge spillovers, specialized skilled labour, and input sharing (Marshall 1920). I
discuss how each of these sources of agglomeration may facilitate technology adoption in
a region.
large umber of small plants, the spatial Gini measures concentration without any contamination associated with industrial organization. 5 Audretsch and Feldman (1996) show that innovative activity is substantially more concentrated than overall production and that industries that emphasize R&D tend to be more spatially concentrated. A related result is obtained by Jaffe et al (1993), who show that patent citations are highly spatially concentrated.
8
i. Knowledge Spillovers
Probably the most important benefit of clustering is knowledge spillovers.6 There
are two types of knowledge. One is explicit or codified knowledge that can be effectively
expressed using symbolic forms of representation. The other is tacit knowledge that
defies such representation (Reber 1995; Barbiero (n.d.)). Tacit knowledge has come to
be recognized as a central component of the learning economy, and a key to innovation
and value creation. The more easily codifiable (tradable) knowledge can be accessed, the
more crucial tacit knowledge becomes for sustaining or enhancing the competitive
position of the firm (Maskell and Malmberg 1999). Consequently, tacit knowledge is
considered a prime determinant of the geography of innovative activity, since its central
role in the process of learning-through-interacting tends to reinforce the local over the
global (Gertler 2002).
In implementing new technologies, plants face many kinds of uncertainties
regarding costs and benefit analysis, adaptation difficulties, and employee training.
Information on these would reduce some of these uncertainties associated with new
technologies and enable plants to better assess the risks and expectations. Since certain
information regarding technology implementations are tacit (e.g., detailed engineering
characteristics or particular organizational changes in order to fully exploit a technology
capabilities), learning about this type of knowledge will depend on direct observation of
early adopters, demonstration, word-of-mouth, or on other informal mechanisms.
Therefore, the presence of plants that have already adopted new technologies facilitates
knowledge spillovers to other plants in the region. Further, the feedback loop of
knowledge spillovers from technology adopters will facilitate, and are facilitated by, the
regional agglomeration (Case 1992; Jaffe, Trajtenberg, and Henderson 1993; Powell and
Brantley 1992; von Hippel 1988).
ii. Specialized Skilled Labour
Firms may also want to locate in clusters to take advantage of specialized skilled
labour in the region. When a cluster of specific and related industries is developed, the
6 A regional cluster is defined as a group of firms in the same industry, or in closely related industries, that are in close geographic proximity to one another.
9
region draws the specialized human capital into the region. With many plants in the
region, specialized labour faces lower risk in finding other jobs and similarly plants find
it easier to hire workers with the necessary skills. Furthermore, mobility of the
specialized skilled labour within a sector-by-region acts as a carrier of knowledge, and
speeds the diffusion of knowledge. Hence, a region with an abundance of specialized
skilled labour is more likely to facilitate technology adoption.
iii. Upstream and Downstream Linkages
Nearby suppliers and firms in related businesses foster the rapid flow of
information, scientific collaboration, and joint development efforts, and can more readily
influence their suppliers’ technical efforts, accelerating the pace of innovation.7
Furthermore, highly applied technology and specialized skills are difficult to codify,
accumulate, and transfer. Kelley (1993) finds that firms whose customers provide them
with technical information are more likely to adopt programmable automation. Also,
having specialized inputs readily available in a region increases the flexibility and the
competition at the same time as it reduces the risk born by the suppliers and the buyers.8
The advantages of clusters also arise from the characteristics of the local market.
Local customers offer high visibility, ease of communication, and the opportunity for
joint working relationships. Presence of sophisticated and demanding local customers, or
customers with unusually intense needs for the specialized varieties also in demand
elsewhere, or demanding buyers pressure companies to meet high standards, provide a
window into evolving customer needs. Hence, it motivates companies to innovate and
move to more advanced segments. The presence of local suppliers, coupled with local
demand conditions, promotes adoption of technologies in clusters of interconnected
industries (Porter 1990).
7 Both theoretical and empirical work emphasize input suppliers and output demander relationships as an important channel of externalities. See Porter (1999) and Helper (1995). 8 Dore (1983, 1986) argues that the greater security and trust involved in arm’s-length customer supplier firm relationships lead to more investment and a more rapid flow of information. Lane (1991), Piore and Sabel (1984), and Carlssona and Jacobsson (1994) show that vertical integration promotes the adoption of technologies.
10
3.2 The Scope of Agglomeration Economies: Specialization versus Diversification
Given the underlying microfoundations of agglomeration economies discussed in
the previous section, in what kind of economic setting, do these agglomeration economies
best facilitate technology adoption? Is technology adoption more likely in places where
there are clusters of similar activities, or where there is a diversity of different activities?
The Marshall-Arrow-Romer (MAR) assumes that spillovers are limited to occur within
the relevant industry, and the transmission of knowledge spillovers across industries is
assumed to be non-existent or at least trivial. It argues that localization (or
specialization) would facilitate higher knowledge spillovers since firms in the same
industry would use common technologies or face similar problems and hence pay more
attention to one another.9 Each firm learns from other firms through conversation,
reverse engineering, and rapid inter-firm movement of highly skilled labour, and these
facilitate the fast dissemination of ideas among neighboring firms. A good example
would be the auto industry in Detroit.10
On the other hand, Jacobs (1969) focuses on diversification as a crucial source of
externalities.11 Jacobs argues that diversification derives externalities from the
opportunities to interact with others in the same or different industries, making it easier to
copy a practice being used by industry peers and to modify a practice from an outside
industry. Also, with a labour force with a broader mix of skills, including new skills
conducive to working with emerging production technologies, diversity may be the
crucial force for technical information flows (Harrison, Kelley and Gant 1996). A good
example supporting this view is New York.12
9 Localization economies are externalities associated with the presence, in a locality, of a mass of other producers in the same industry or sector 10 There are number of studies that find evidence of localization economies. Henderson (1999) finds that localization (MAR) scale externalities arise from the number of local own industry plants, or points of information spillovers. Also, Rosenthal and Strange (1999) find that localization externalities have much greater impact than urbanization externalities on the agglomeration of economic activities. 11 Diversification economies are externalities associated with the presence of firms from various industries, extensive infrastructure, or a large pool of labour in a given location. 12 Rosenberg (1962) supports this view in a study of the spread of machine tools across industries and describes how an idea is transmitted from one industry to another. Also, Feldman and Audretsch (1999) find that diversity across complementary economic activities sharing a common science base is more conducive to innovation than is specialization. Harrison, Kelley and Gant (1996) find that while both types of externalities are important in the adoption of CNC machines, diversification is more important.
11
3.3 The Role of Industrial Structure in Learning in a Region
The advantages of clusters come from not only by the size and density of cluster,
but also by how the economic activities within a cluster are organized. Saxenian (1994)
argues that industrial systems - which includes three dimensions of local institutions and
culture, industrial structure, and corporate organization - play an important role in
innovativeness of a region. In Saxenian’s (1994) comparative study of California’s
Silicon Valley and Massachusetts’ Route 128 as clusters of electronics and high-
technology, she characterizes Silicon Valley as being flexible and entrepreneurial with
many small venture capitals and Boston as being relatively rigid and hierarchical with
few dominant players. She claims that the ascendance of Silicon Valley can be attributed
to its open and flexible environment. Similarly, Jacobs (1969) and Chinitz (1961) also
suggest that urban efficiencies depend not just on numbers (i.e., city or industry size) but
also on the nature of urban interactions.13
4. The Data
Data for the analysis come from numerous sources. The main source is the 1993
Survey of Innovation and Advanced Technology. It is a unique, confidential and
proprietary data set that surveys approximately 2,500 plants covering an entire
manufacturing sector across Canada. The survey collects information on various aspects
of innovation and adoption of advanced manufacturing technologies. In particular, the
survey reports information on each plant’s adoption of twenty-two advanced
manufacturing technologies. These twenty-two advanced manufacturing technologies are
categorized into 6 different technology groups. These technologies are ‘general-purpose
technologies’ in that they are not specific to any particular industry, but can be used in
13 However, the effects of the industrial system on technology adoption have never been tested empirically. Rosenthal and Strange (2001) find a related result, that the industrial structure affects the agglomeration of economic activities.
12
the production process of any industries.14 These technologies are listed in Table 3 along
with the incidence of use as of 1993.
A very important aspect of this survey is that it reports information on years of
use for each technology by each plant. Using this information on the time dimension of
technology adoption, I construct a panel data set. I construct a panel consists of three
periods from 1984-1987, 1987-1989, and 1990-1992. Use of time intervals enables me to
get around the recollection problem that may arise from the retrospective nature of panel
data.15 In addition, it allows me to have enough variations in regional economies over
different periods.16
Additional information on these plants are obtained from the Annual Survey of
Manufactures (ASM). The ASM is a longitudinal database of Canadian manufacturing
plants which collects information for approximately 35,000 to 40,000 manufacturing
plants each year.17 Among the 2,500 plants surveyed in Survey of Innovation and
Advanced Technology, 1,902 plants are also surveyed in the ASM. Detailed information
on the plants such as geographical location, employment, output, country of ownership,
plant age, and multi-plant status are taken from the ASM for these 1,902 plants.
To measure the regional economic environment, both the ASM and the Census of
Population datasets are used. All variables characterizing the local manufacturing
activities are for the Census Division in which the plant is located, and based on the
information from the ASM. Variables characterizing regional demographic information
are obtained from the Census of Population.18 Information drawn from the Census of
Population include variables such as occupation, education level, and the degree of study.
Other supplementary data come from the National Input Output Tables for years
1983-1992. I use the National Input Output Tables at the most detailed level available,
which consists of 145 3- and 4-digit manufacturing SIC.19 The tables record the value of
14 The concept of General Purpose Technology (GPT) used here is not as broad as the one used in Bresnahan and Trajtenberg (1995). 15 Plants may round the number of years a given technology has been in use. For example, plants may report 5 years instead of 4 or 6 years, and 10 years instead of 9 or 11 years. There are peaks at 5 and 10 years, and lower numbers of new technology adoptions are reported for 4, 6, 9 and 11 years. 16 There are small changes in the economic environment over a period of year. 17 This consists of most manufacturing plants in Canada. 18 The Census of Population is surveyed every 5 years, and for each Census year, there are about 5 million observations that contain detailed information on each individual. 19 The level of National Input Output tables used are ‘w-level’.
13
intermediate inputs and outputs each industry buys and sells to other industries. Based on
this information, forward and backward linkages are calculated.
The units of geography employed in this paper are Economic Regions and Census
Divisions. An Economic Region is a region, within a province or territory, comprised of
one or more of Census Divisions.20 While boundaries tend to stay constant over the years
for most Census Divisions, it is not true for some, especially in the late 1980s.21 In
order to consistently measure the effects of regional economies, I use a constant Census
Division code of 1976.22
5. Estimation and Specification Issues
5.1. Model Specification
I examine the effects of the presence of prior adopters on plant p’s adoption of
WHFKQRORJ\� 2� DW� WLPH� t, after controlling for various aspects of the regional economies.
The dependent variable is
1 if plant in industry in region adopts technology at time
0 otherwisep irt
p i r tADOPTION τ
τ =
where p indexes plant, i indexes industry, r indexes region, 2 indexes technology and t
indexes time. There are three intervals of time periods employed in this study. The first
period is 1985-1987, the second period is 1988-1990 and the third period is 1990-1992.
In each period, a plant makes a choice to adopt or not to adopt technology 2. For each
plant-technology pair, if plant p adopts technology 2 in period 1, the adoption decision is
no longer applicable for plant p for the two subsequent periods. In this case, the
20 There are ten provinces and two territories in Canada, and their boundaries remain constant over time. Each province and territory is divided into number of economic regions. There are total of 68 Economic Regions and 290 Census Divisions across provinces and territories in 1991. 21 There were major re-constructions in census division boundaries in the provinces of Quebec and British Columbia in the late 1980’s. 22 Constant Census Division code based on 1976 has been assigned to all plants in all years using Map Info, by matching postal codes.

14
observation on plant p’s adoption of technology 2 is omitted from the sample for the those
periods.23
The decision to adopt technology 2 by plant p depends on the following factors:
plant characteristics, exogenous time-, technology-, industry- and location- specific
characteristics, the regional agglomeration economies, and knowledge spillovers from
prior adopters. I will explain each of these factors in turn in more detail.
First, plant characteristics are important determinants in technology adoption
decisions. Investigating the effects of the regional agglomeration without conditioning
plant specific characteristics bias the results of the location attributes. While plant
characteristics are included in all regressions, I will discuss the theories regarding
organizational characteristics and their estimates in section 7. In this section, I will
discuss only the external factors in order to focus on the effects of agglomeration on
technology adoption.
The second set of variables are time, technology, industry and location specific
characteristics. Technology adoption may be more likely in the later periods due to
general reductions in the price of technology, better information flow, and/or recognition
of the importance of advanced technologies. To account for time effects, I include two
dummy variables, one for period 2 (1987-1989), and the other for period 3 (1990-1992).
There are technology specific effects. These 22 advanced manufacturing
technologies varies greatly in their usefulness and value to plants, in their price, and in
the difficulties of implementation. For example, computer aided design and engineering
(CAD/CAE), which is the most widely used technology among the 22, is more likely to
have the greater impact on the productivity of plant than automated storage and retrieval
system (AS/RS). Consequently, certain technologies are more likely to be adopted than
others. To control for technology specific effects, dummy variables for each technology
are employed.
The take-up rate of technology varies significantly across industries. Industries
are substantially different in terms of the need for extensive automation as well as the
benefits arising from implementing such advanced manufacturing technologies. For
23 Also, those plants that are born after 1987 or 1990 would not be present in the first and/or the second periods. The sample is therefore an unbalanced panel.
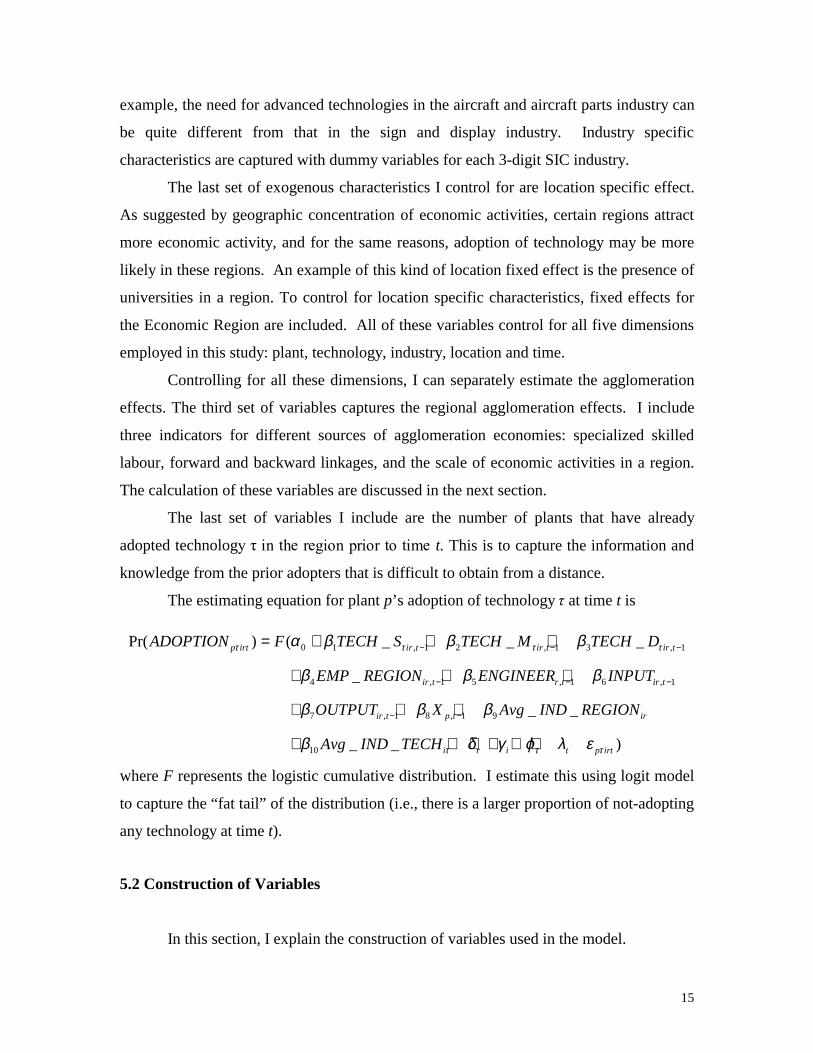
15
example, the need for advanced technologies in the aircraft and aircraft parts industry can
be quite different from that in the sign and display industry. Industry specific
characteristics are captured with dummy variables for each 3-digit SIC industry.
The last set of exogenous characteristics I control for are location specific effect.
As suggested by geographic concentration of economic activities, certain regions attract
more economic activity, and for the same reasons, adoption of technology may be more
likely in these regions. An example of this kind of location fixed effect is the presence of
universities in a region. To control for location specific characteristics, fixed effects for
the Economic Region are included. All of these variables control for all five dimensions
employed in this study: plant, technology, industry, location and time.
Controlling for all these dimensions, I can separately estimate the agglomeration
effects. The third set of variables captures the regional agglomeration effects. I include
three indicators for different sources of agglomeration economies: specialized skilled
labour, forward and backward linkages, and the scale of economic activities in a region.
The calculation of these variables are discussed in the next section.
The last set of variables I include are the number of plants that have already
adopted technolog\�2�LQ�WKH�UHJLRQ�SULRU�WR�WLPH�t. This is to capture the information and
knowledge from the prior adopters that is difficult to obtain from a distance.
The estimating equation for plant p’s adoption of technology 2 at time t is
0 1 , 1 2 , 1 3 , 1
4 , 1 5 , 1 6 , 1
7 , 1 8 , 1 9
10
Pr( ) ( _ _ _
_
_ _
_ _ )
p irt ir t ir t ir t
ir t r t ir t
ir t p t ir
i r i t p irt
ADOPTION F TECH S TECH M TECH D
EMP REGION ENGINEER INPUT
OUTPUT X Avg IND REGION
Avg IND TECH
τ τ τ τ
τ τ τ
α β β β
β β β
β β β
β δ γ ϕ λ ε
− − −
− − −
− −
= + + +
+ + +
+ + +
+ + + + + +
where F represents the logistic cumulative distribution. I estimate this using logit model
to capture the “fat tail” of the distribution (i.e., there is a larger proportion of not-adopting
any technology at time t).
5.2 Construction of Variables
In this section, I explain the construction of variables used in the model.
16
i. Measurement of Similarities Across Industries in terms of their Input Purchases
The knowledge spillovers from prior adopters of technology 2 in the same region
may differ based on the ‘relatedness’ between plants. One of the common criticism of
earlier geographic studies is in the use of highly aggregated industry units, typically at the
2-digit Standard Industrial Classification (SIC) scheme to empirically define ‘related’
industries.24 2-digit SIC are not appropriate for capturing the similarities of industries.,
for example, SIC 39 includes both Broom, Brush and Mop Industry (in SIC 399) and
Jewellery and Silverware Industry (in SIC 392).
In context of studying the effects of knowledge spillovers on technology adoption,
the ‘relatedness’ across industries can be better measured by the similarities in input
purchases. The patterns of input purchases are observed at 145 3- and 4-digit SIC
industries based on the National Input Output tables. For each industry i, its correlations
with every other industry j based on input purchases, ijρ , are calculated. For each
industry i, all other industries are categorized into three groups base on the correlations.
Industries with a correlation equal or greater than 0.50 are categorized as Similar
industries, industries with a correlation between 0.50 and 0.2 are categorized as
Moderately similar industries, and the rest of industries are categorized as Different
industries.25 For each industry, the groups of similar, moderately similar and different
industries are not symmetric, nor of equal size.26
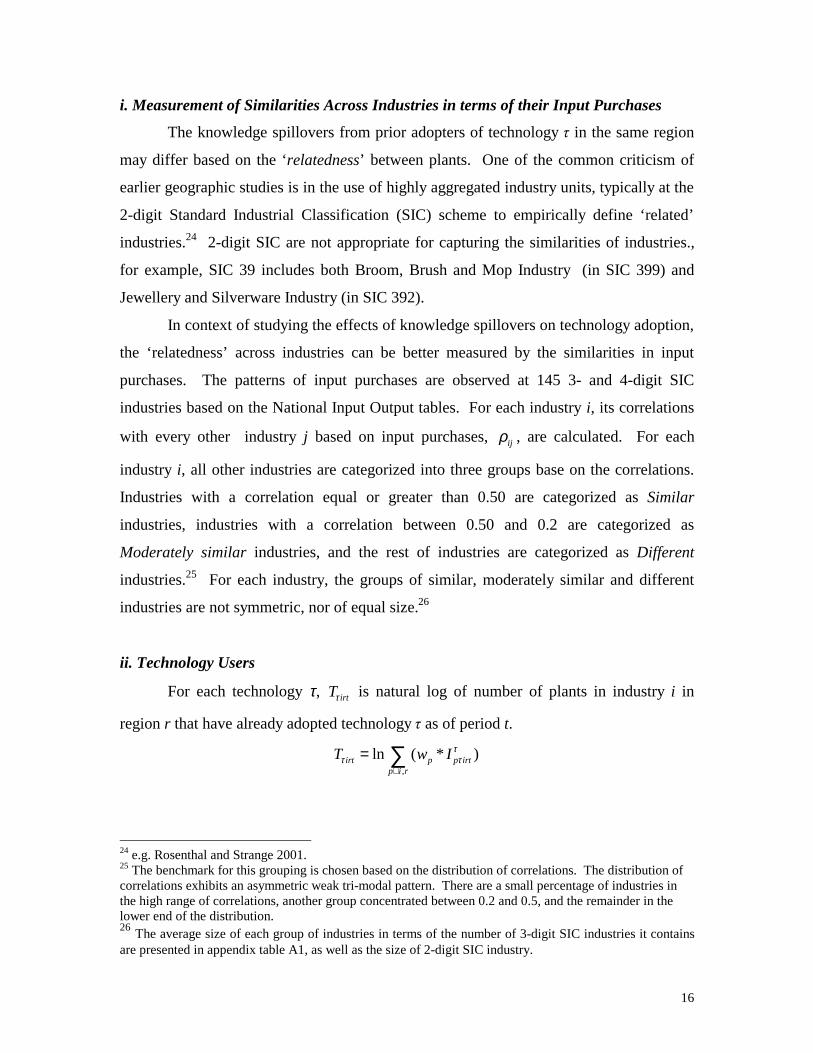
ii. Technology Users
For each technology τ, irtTτ is natural log of number of plants in industry i in
region r that have already adopted technology 2 as of period t.
,
ln ( * )irt p p irtp i r
T w Iττ τ
∈
= ∑
24 e.g. Rosenthal and Strange 2001. 25 The benchmark for this grouping is chosen based on the distribution of correlations. The distribution of correlations exhibits an asymmetric weak tri-modal pattern. There are a small percentage of industries in the high range of correlations, another group concentrated between 0.2 and 0.5, and the remainder in the lower end of the distribution. 26 The average size of each group of industries in terms of the number of 3-digit SIC industries it contains are presented in appendix table A1, as well as the size of 2-digit SIC industry.

17
where 1 if plant in industry in region uses technology at time
0 otherwisep irt
p i r tI τ
τ
τ =
.
w is a plant weight that is provided in the survey to make the sample representative of the
population. The unit of geography used in the calculation of number of technology users
is the Economic Region. Economic Region is used in this case to maintain enough
observations in each region to preserve the representativeness.
Then, the number of plants in similar industries that have already adopted
technology 2 at time t, is calculated simply as,
_ lnirt jrtj F
TECH S Tτ τ∈
=
∑
where i and j indexes industry, F represents groups of industries that are categorized as
similar industries for each industry i. The number of plants in moderately similar
industries and in different industries that have adopted technology 2 at time t are
calculated likewise.
ii. Variables on Other Agglomeration Effects
These measures of the local economies are for the Census Division (CD) in which
the plant is located. The scale of manufacturing activity in a region, EMP_REGION is
measured by the natural log of employment in the manufacturing sector in the Census
Division the plant is located. Similar to technology adopters, EMP_REGION can be
decomposed into three groups: employment in similar industries, moderately similar
industries, and different industries.
Specialized skilled labour in a region, ENGINEER, is calculated as the proportion
of people in population with science or engineering degrees in the Census Division.27
& rtrt
rt
Scientists EngineersENGINEER
population
=
The presence of input suppliers for industry i in region r at time t is calculated as
27 Information on the major of study is obtained from Census of Population. This information has been collected since 1986. Hence, for observations for period one (1985-1987) information from the Census of Population in 1986 is used. Using labour information for 1986 for the first period would not make much difference since changes in the proportion of people with science or engineering degrees tend to be very small.
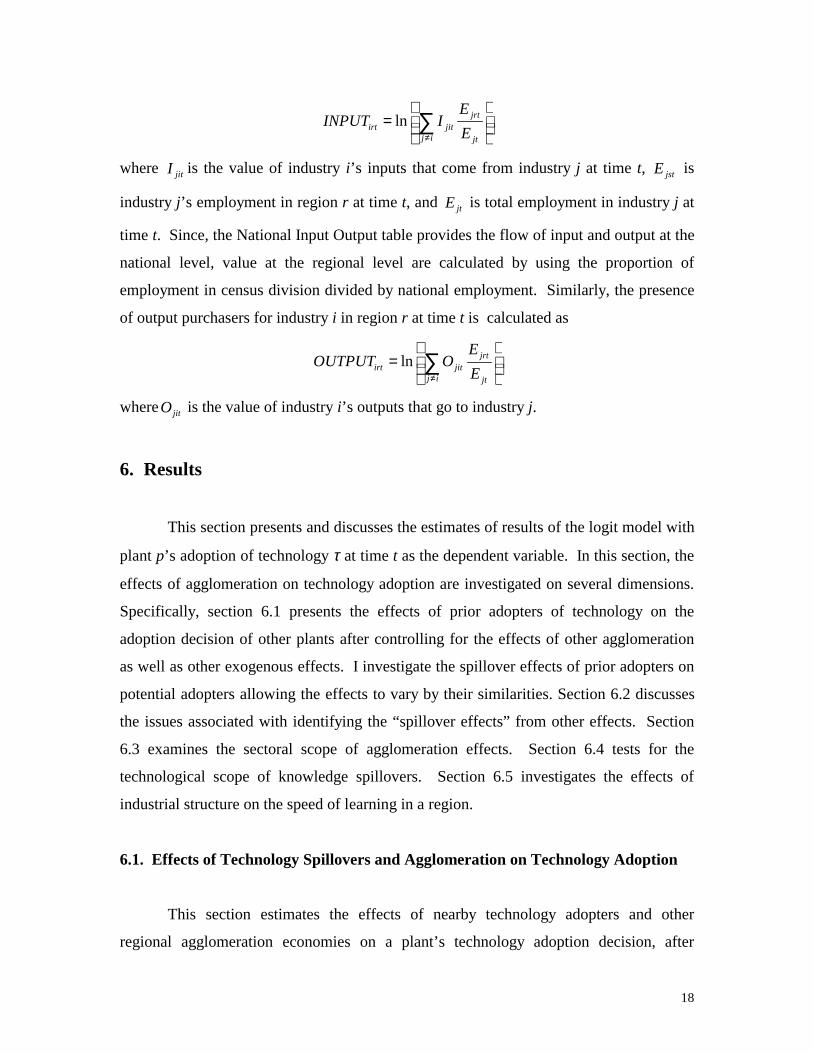
18
ln jrtirt jit
j i jt
EINPUT I
E≠
=
∑
where jitI is the value of industry i’s inputs that come from industry j at time t, jstE is
industry j’s employment in region r at time t, and jtE is total employment in industry j at
time t. Since, the National Input Output table provides the flow of input and output at the
national level, value at the regional level are calculated by using the proportion of
employment in census division divided by national employment. Similarly, the presence
of output purchasers for industry i in region r at time t is calculated as
ln jrtirt jit
j i jt
EOUTPUT O
E≠
=
∑
where jitO is the value of industry i’s outputs that go to industry j.
6. Results
This section presents and discusses the estimates of results of the logit model with
plant p’s adoption of technology τ at time t as the dependent variable. In this section, the
effects of agglomeration on technology adoption are investigated on several dimensions.
Specifically, section 6.1 presents the effects of prior adopters of technology on the
adoption decision of other plants after controlling for the effects of other agglomeration
as well as other exogenous effects. I investigate the spillover effects of prior adopters on
potential adopters allowing the effects to vary by their similarities. Section 6.2 discusses
the issues associated with identifying the “spillover effects” from other effects. Section
6.3 examines the sectoral scope of agglomeration effects. Section 6.4 tests for the
technological scope of knowledge spillovers. Section 6.5 investigates the effects of
industrial structure on the speed of learning in a region.
6.1. Effects of Technology Spillovers and Agglomeration on Technology Adoption
This section estimates the effects of nearby technology adopters and other
regional agglomeration economies on a plant’s technology adoption decision, after
19
controlling for other exogenous effects operating at various levels. In examining the
effects of local prior adopters, I allow the effects of prior adopters to vary depending on
their similarity of input purchases with potential adopters. The key variables of interest
are the measures of prior adopters of technology 2 in three different groups in the same
region: prior technology adopters in similar industries, TECH_S; prior technology
adopters in moderately similar industries, TECH_M; and prior technology adopters in
different industries, TECH_D. Other regional agglomeration externalities that may affect
a plant’s adoption decision are captured by EMP_REGION, INPUT, OUTPUT, and
ENGINEER. Other regressors included are fixed effects and control variables (which
will be discussed in section 6.2), and plant characteristics (which will be discussed in
detail in section 7).
The results are presented in table 4. The coefficient on prior adopters in similar
industries is estimated to be positive and significant. This indicates that the probability
that a plant adopts a technology increases with the number of similar plants in the same
region that have already adopted the same technology. An elasticity of 0.008 means that
doubling ‘the number of technology adopters in similar industries in a region’ increases
the probability of technology adoption in the region by 0.8%. A plant located in a region,
such as Toronto, with about 50 times more ‘adopters in similar industries’ than some
other regions, are 40% more likely to adopt a given technology holding everything else
constant.28 The coefficient on TECH_M is positive and significant, with an elasticity of
0.006 which is smaller than that of TECH_S. The coefficient on adopters in different
industries is estimated to be negative.
The significant effects of local prior technology adopters in three different groups,
after controlling for effects that operate at various levels, strongly indicate the presence of
communication across plants in the same region. This finding is strongly suggestive of
learning-based knowledge spillovers. Further, a very clear decaying pattern of spillover
effects indicates that the effects of prior adopters differ depending on their similarities
with potential adopters. The more similar are the prior and the potential adopters, the
greater are the spillover effects.
28 It is not unusual that certain regions have 50 times more “technology adopters in similar industries” than other regions. However, for confidentiality reasons, I cannot reveal the identity of specific regions.
20
Regional Employment, EMP_REGION, has a positive and significant coefficient,
with an elasticity of 0.012. In other words, a plant located in a region with manufacturing
employment of 300,000 has 12% higher probability of adopting a given technology
compared to a plant located in a region with manufacturing employment of 30,000, given
everything else equal. This suggests that the scale of regional economic activity
positively affect technology adoption in a region. The coefficient on ENGINEER is
estimated to be highly significant with an elasticity of 1.07. This implies that one
percentage point change in the share of scientists and engineers in the population, say
from 4.1% to 5.1% (or, 24% change in the share) increases the probability that a plant
adopts a given technology by 26%.29 This implies that regional specialized skilled labour
is an important determinant of technology adoption. This finding supports the claim that
having an abundance of people who have technological knowledge and know-how
increases the absorptive capacity of the region, and hence increases the likelihood of the
technology adoption in the region.30 The coefficient on the “local presence of input
suppliers in a region” is positive and significant. This means that the adoption of
technology is enhanced by the presence of input suppliers in the region.31 The elasticity
of 0.014 indicates that the magnitude of the effect of local suppliers is similar to the
effect of regional employment.
It is worth noting that the elasticity of prior adopters in similar industries is about
the two thirds of the effects of the regional employment or the input suppliers. Because
there are no previous studies on the effects of knowledge spillovers on technology
adoption, there is no benchmark to evaluate the magnitude of spillover effects from
technology adopters estimated in this paper. However, the relative magnitude of
elasticity of TECH_S as compared to EMP_REGION and INPUT suggests that the
‘spillover effects’ from technology adopters are fairly big.
29 The average share of scientists and engineers in a region is 4.1%, and the variation in a region is fairly small. Since an elasticity in the logit model captures the change in probability due to a percentage change of an independent variable at a local point, the interpretation of elasticities in the logit should be done with care. With the S-shaped cumulative distribution function, an increase in the probability diminishes when moving to the higher value of a variable. 30 This finding is consistent with that of Dumais, Ellison and Glaeser (1997), that labor pooling is one of the most significant externalities of agglomeration. 31 The importance of local suppliers is documented also in Helper and Kelley (1997).
21
6.2 Identification Issues
This section discusses the issues associated with identifying spillover effects from
local prior adopters of technology 2. Column (1) of table 5 presents the results where
time-, technology, industry-, and region- fixed effects are included. Since the effects of
prior adopters operate at the technology-industry-region-time level, this specification
controls for each of the effect separately. The natural experiment that one would like to
test next is whether they are capturing other effects that operate at the industry-region, or
the industry-technology level. I test for the hypothesis of industry-location specific
effects, by implementing a control variable. AVG_IND_REGION is an average adoption
rate of advanced technologies overall among plants in industry i in region r . This
captures the effects that are common to plants in the same industry in the same region,
across technologies. For example, R&D subsidy electrical and electronic products
industries in Ottawa region would have this type of effect by increasing the overall
investment in these industries, but not necessarily increasing the adoption of a specific
technology over and above. Column 2 reports the results. The estimates of technology
adopters stay virtually the same, indicating that the “spillover effects” in column (1) are
not driven by the industry-region specific effects.
Similarly, the industry-technology specific effects are controlled by including
AVG_IND_TECH, an average adoption rate of technology 2 by industry i across regions.
This controls for effects that are common to plants in the same industry adopting the
same technology. For example, plants in the aircraft industry are more likely to take up
Computer Aided Design (CAD) than plants in the petroleum products industries. The
results are presented in the final column. All three coefficients stay significant, and the
magnitudes tend to stay similar, with a small decline in the effect of “prior adopter in
similar industries”. This indicates that the “spillover effects’ presented column (2) may
have captured the industry-technology specific effects to a certain degree. Hence, I use
specification in column (3), which controls for both the industry-region and the industry-
technology effects, as my main regression (note that this is the one presented the previous
section also). The significant coefficients obtained in this specification provides a strong

22
support that the effects captured by prior adopters are not driven by industry-location, or
industry-technology fixed effects.
As a final check, I run linear probability models with more extensive fixed
effects. While a linear probability model is inappropriate for examining a binary
dependent variable, it allows the inclusion of all the fixed effects needed to test for the
alternative hypotheses. I include industry-region and industry-technology fixed effects,
instead of AVG_IND_REGION and AVG_IND_TECH to fully capture the effects at these
levels. The results are presented in table A2 in the Appendix. I obtain the similar results.
That is, the estimates of technology adopters tend to stay same and robust with the
inclusion of additional fixed effects.32 These results strongly suggest that these effects of
prior adopters can not be traced back to a spurious correlation operating at other levels,
nor are they driven by the lack of controls and fixed effects.
6.3. The Sectoral Scope of Agglomeration Effects: Diversification vs. Specialization
In the previous section, the effects of agglomeration on technology adoption were
examined. In this section, I examine how far these agglomeration effects are
transmitted, i.e., what is the scope of these agglomeration effects? The first column of
table 6 presents a specification that examines the effects of prior technology adopters and
the regional employment depending on their similarities to potential adopters. The
coefficients on employment show that the regional agglomeration of employment in
moderately similar industries has a positive effect on technology adoption, while the
agglomeration of similar industries or different industries do not have that effect. This
suggests that while the agglomeration of moderately similar industries in a region
facilitates technology adoption, agglomeration of very similar industries or very different
industries do not increase the probability of technology adoption. This supports Jocob’s
claim of diversification economies. Plants benefit more from having a diverse set of
industries which bring new ideas and practices to one place. However, the learning is
maximized when they are not too different. Technology adoption is more likely in a
32 While the linear probability model can provide a meaningful comparison, the interpretation of coefficients are inappropriate.
23
region where there are plants that are different enough to learn from, but similar enough
for the knowledge to be relevant. This suggests that not only does the size of regional
agglomeration matters, but more importantly, the industries which agglomerate matters.
I then examine the technology adoption along the dimension of product market.
Firms within the same product market face different incentives and concerns than plants
in other industries. On the one hand, firms may have an incentive to keep certain
information from competitors in the same final product market, hence the knowledge
flow among them could be hampered. On the other hand, firms have incentive to ‘move
forward’, facing competitive pressure from others. To investigate whether being in the
same product market has differential effect on technology adoption, I divide the ‘similar
industry’ group into two subgroups –the first includes plants in the same product market,
as defined by own 4-digit SIC industry, and the second includes plants in the rest of
industries in similar industry group.
Column (3) presents the estimates of the product market decomposition
regression. Prior adopters in own 4-digit industry have a smaller estimate than the rest of
similar industries. However, the estimated effects of employment in own 4-digit industry
is bigger than that of the similar industries net of own 4-digit industry. The weaker effect
of technology adopters in the same product market is suggestive of the ‘hampered
knowledge spillover’ effects from plants’ incentive to keep information from
competitors. The stronger effect of employment in the same product market is suggestive
of the ‘away-from-competition’ effects. Being faced with competitors nearby, plants are
motivated to adopt advanced technologies to place themselves in a more competitive
position. While the estimated effects are consistent with the above potential explanation,
there is lack of detailed information in the data that would enable me to identify the
underlying forces that are driving these results.
6.4. The Technological Scope of Knowledge Spillovers
In the previous sections, the effect of local plants that have already adopted a
VSHFLILF�WHFKQRORJ\�2�RQ�RWKHU�SODQWV¶�DGRSWLRQ�GHFLVLRQ�RI�WHFKQRORJ\�2 are examined. In
this section, I examine how a plant’s adoption decision of technology 2 is affected by the

24
presence of other plants that have adopted any technology. In other words, I explore the
technological scope of knowledge spillovers from prior adopters. Specifically, are
knowledge spillovers of one particular technology limited to the adoption of the same
technology, or are they extended to the adoption of other technologies? This
investigation also serves as an identification test of whether knowledge spillover effects
of prior adopters come through a channel that is specific to each technology, or come
through a channel that are common to all technologies, in which case, they may capture
effects that operate at the industry-region level.
Table 7 presents the results for three different specifications. The first column
reports the benchmark result, which examines the effects of nearby plants that have
adopted technology 2 on other plants’ adoption of the same technology. The second and
the third column present the results where a plant’s decision to adopt technology 2 can
depend on other plants that have adopted any of the 22 technologies. In the second
column, I divide all local prior technology adopters into two groups: adopters of the same
group of technology as 2, and adopters of different groups of technologies. In the third
column, I decompose all local prior adopters of technology into three groups: adopters of
the same technology 2, adopters of the same group of technologies other than technology
2, and adopters of different groups of technologies.
The number of local adopters of the same group of technologies other than
technology 2 in similar industry is calculated as
1 1_ lnG
irt gjrtj S g
SameGroupTech S Tττ
− −∈ ≠
=
∑∑
where g indexes technologies and j indexes industries. G includes technologies that are in
the same technology group as technology 2, and S includes the similar industries to
industry i. Similarly, the number of adopters of different group of technologies in similar
industries is calculated as
1_ lnirt ajrtj S a G
DiffGroupTech S Tτ −∈ ∉
=
∑∑
where a indexes technologies, and G includes technologies in the same technology group
DV� 2�� � 7KH� QXPEHU� RI� DGRSWHUV� RI� VDPH� JURXS� RI� WHFKQRORJLHV� DQG� GLIIHUHQW� JURXS� RI�
technologies in moderately similar- and different industries are calculated likewise.
25
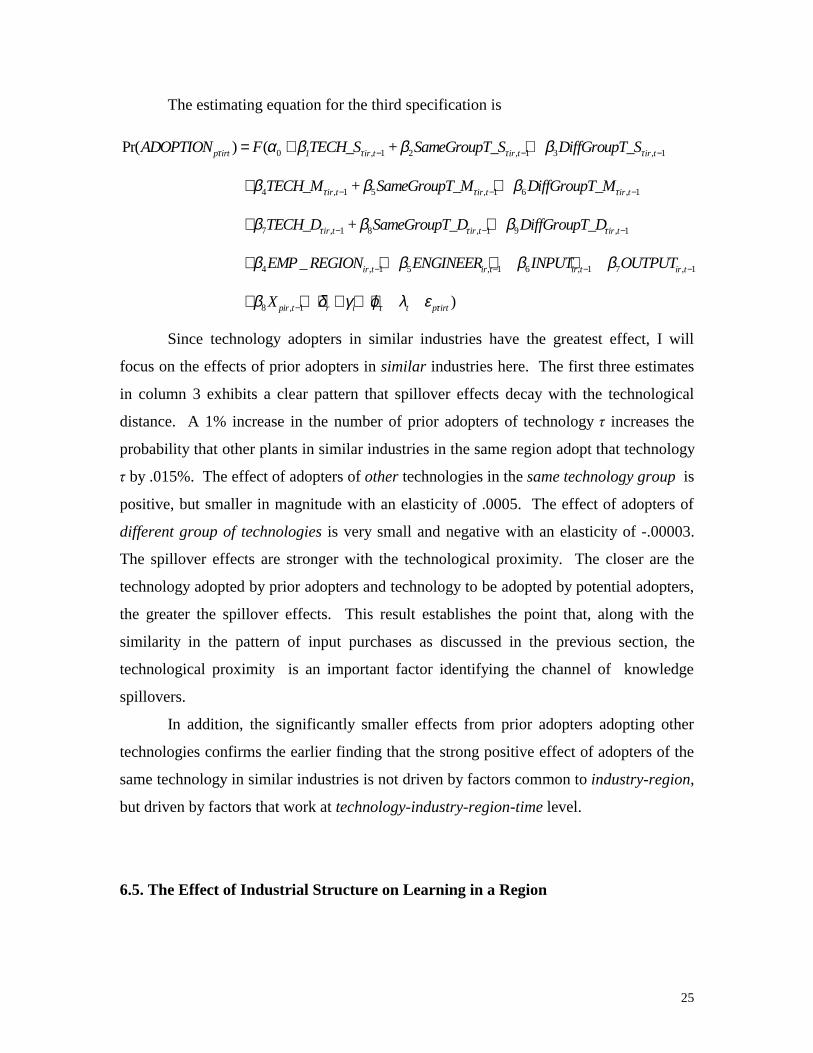
The estimating equation for the third specification is
0 , 1 2 , 1 3 , 1
4 , 1 5 , 1 6 , 1
7 , 1 8 , 1 9 ,
Pr( ) (p irt 1 ir t ir t ir t
ir t ir t ir t
ir t ir t ir t
ADOPTION F TECH_S + SameGroupT_S DiffGroupT_S
TECH_M + SameGroupT_M DiffGroupT_M
TECH_D + SameGroupT_D DiffGroupT_D
τ τ τ τ
τ τ τ
τ τ τ
α β β β
β β β
β β β
− − −
− − −
− −
= + +
+ +
+ + 1
4 , 1 5 , 1 6 , 1 7 , 1
8 , 1
_
)
ir t ir t ir t ir t
pir t r i t p irt
EMP REGION ENGINEER INPUT OUTPUT
X τ τ
β β β β
β δ γ ϕ λ ε
−
− − − −
−
+ + + +
+ + + + + +
Since technology adopters in similar industries have the greatest effect, I will
focus on the effects of prior adopters in similar industries here. The first three estimates
in column 3 exhibits a clear pattern that spillover effects decay with the technological
distance. A 1% increase in the number of prior adopters of technology 2 increases the
probability that other plants in similar industries in the same region adopt that technology
2 by .015%. The effect of adopters of other technologies in the same technology group is
positive, but smaller in magnitude with an elasticity of .0005. The effect of adopters of
different group of technologies is very small and negative with an elasticity of -.00003.
The spillover effects are stronger with the technological proximity. The closer are the
technology adopted by prior adopters and technology to be adopted by potential adopters,
the greater the spillover effects. This result establishes the point that, along with the
similarity in the pattern of input purchases as discussed in the previous section, the
technological proximity is an important factor identifying the channel of knowledge
spillovers.
In addition, the significantly smaller effects from prior adopters adopting other
technologies confirms the earlier finding that the strong positive effect of adopters of the
same technology in similar industries is not driven by factors common to industry-region,
but driven by factors that work at technology-industry-region-time level.
6.5. The Effect of Industrial Structure on Learning in a Region
26
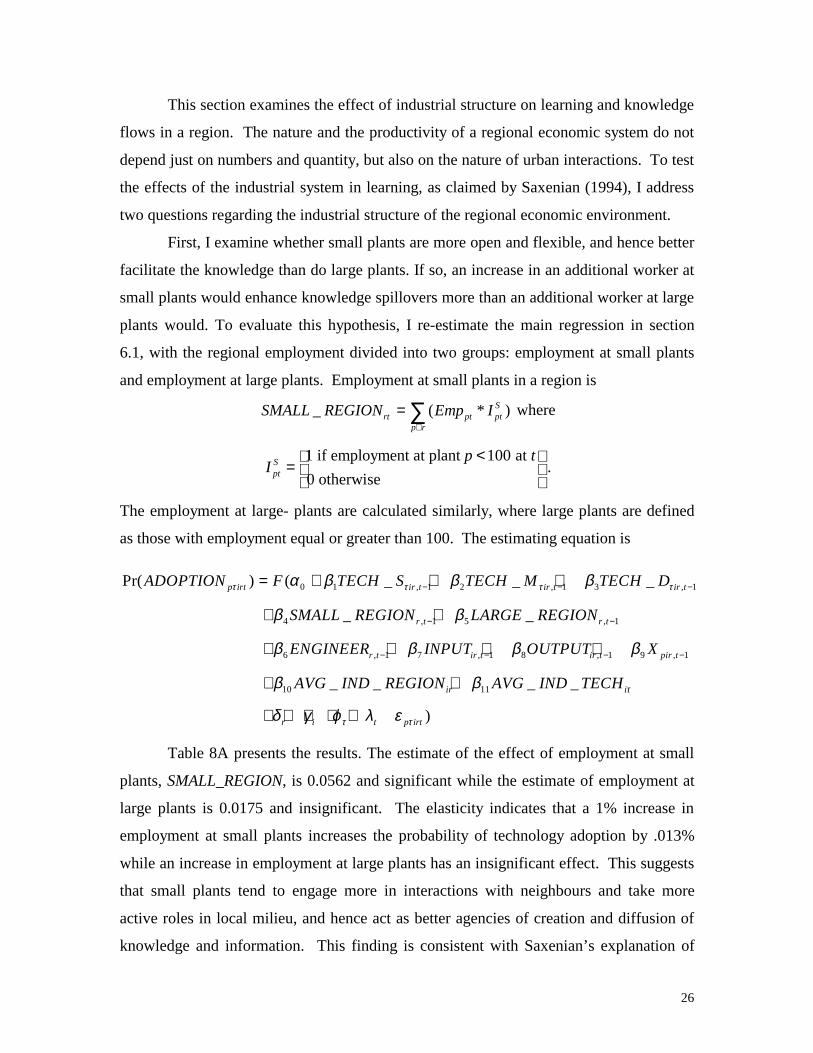
This section examines the effect of industrial structure on learning and knowledge
flows in a region. The nature and the productivity of a regional economic system do not
depend just on numbers and quantity, but also on the nature of urban interactions. To test
the effects of the industrial system in learning, as claimed by Saxenian (1994), I address
two questions regarding the industrial structure of the regional economic environment.
First, I examine whether small plants are more open and flexible, and hence better
facilitate the knowledge than do large plants. If so, an increase in an additional worker at
small plants would enhance knowledge spillovers more than an additional worker at large
plants would. To evaluate this hypothesis, I re-estimate the main regression in section
6.1, with the regional employment divided into two groups: employment at small plants
and employment at large plants. Employment at small plants in a region is
_ ( * )Srt pt pt
p r
SMALL REGION Emp I∈
= ∑ where
1 if employment at plant 100 at
0 otherwiseSpt
p tI
< =
.
The employment at large- plants are calculated similarly, where large plants are defined
as those with employment equal or greater than 100. The estimating equation is
0 1 , 1 2 , 1 3 , 1
4 , 1 5 , 1
6 , 1 7 , 1 8 , 1 9 , 1
10 11
Pr( ) ( _ _ _
_ _
_ _ _ _
p irt ir t ir t ir t
r t r t
r t ir t ir t pir t
ir
ADOPTION F TECH S TECH M TECH D
SMALL REGION LARGE REGION
ENGINEER INPUT OUTPUT X
AVG IND REGION AVG IND TE
τ τ τ τα β β β
β β
β β β β
β β
− − −
− −
− − − −
= + + +
+ +
+ + + +
+ +
)
i
r i t p irt
CH τ
τ τδ γ ϕ λ ε+ + + + +
Table 8A presents the results. The estimate of the effect of employment at small
plants, SMALL_REGION, is 0.0562 and significant while the estimate of employment at
large plants is 0.0175 and insignificant. The elasticity indicates that a 1% increase in
employment at small plants increases the probability of technology adoption by .013%
while an increase in employment at large plants has an insignificant effect. This suggests
that small plants tend to engage more in interactions with neighbours and take more
active roles in local milieu, and hence act as better agencies of creation and diffusion of
knowledge and information. This finding is consistent with Saxenian’s explanation of
27
the ascendance of Silicon Valley over Route 128. This is the first to document that the
effects of industrial structure on learning of technical knowledge in a region is evident in
a broader pattern of data, and not unique to the case of Silicon Valley and Route 128.33
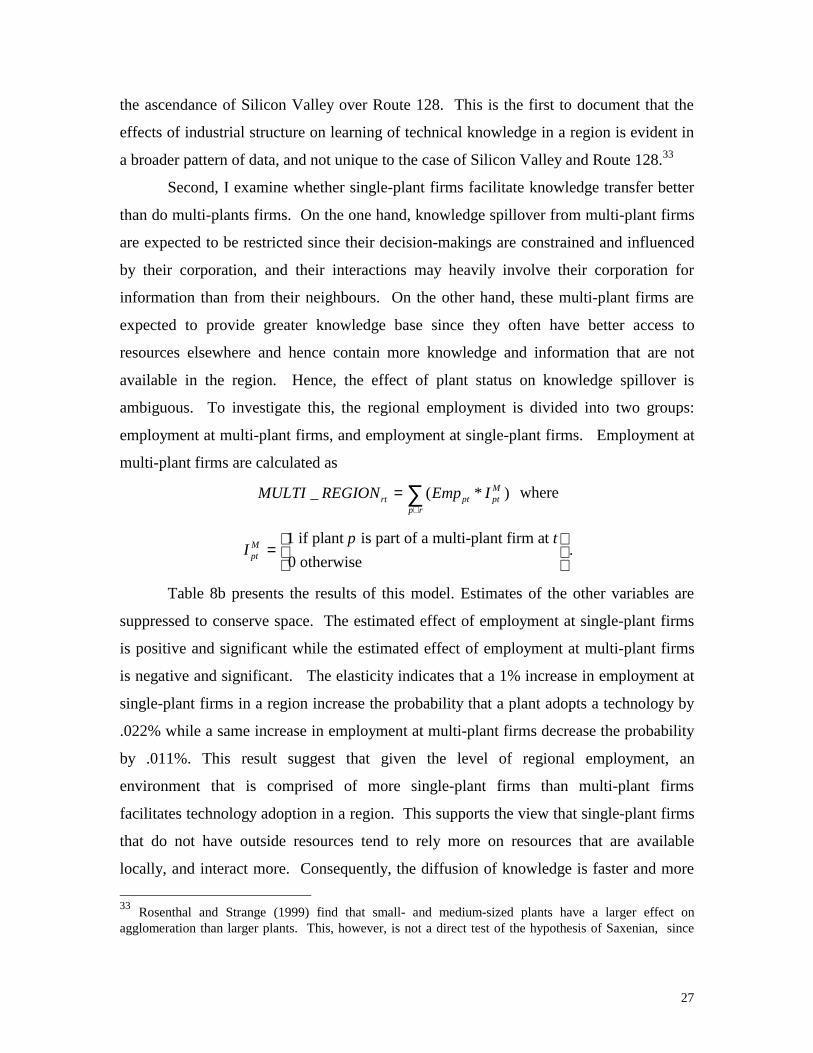
Second, I examine whether single-plant firms facilitate knowledge transfer better
than do multi-plants firms. On the one hand, knowledge spillover from multi-plant firms
are expected to be restricted since their decision-makings are constrained and influenced
by their corporation, and their interactions may heavily involve their corporation for
information than from their neighbours. On the other hand, these multi-plant firms are
expected to provide greater knowledge base since they often have better access to
resources elsewhere and hence contain more knowledge and information that are not
available in the region. Hence, the effect of plant status on knowledge spillover is
ambiguous. To investigate this, the regional employment is divided into two groups:
employment at multi-plant firms, and employment at single-plant firms. Employment at
multi-plant firms are calculated as
_ ( * )Mrt pt pt
p r
MULTI REGION Emp I∈
= ∑ where
1 if plant is part of a multi-plant firm at
0 otherwiseMpt
p tI
=
.
Table 8b presents the results of this model. Estimates of the other variables are
suppressed to conserve space. The estimated effect of employment at single-plant firms
is positive and significant while the estimated effect of employment at multi-plant firms
is negative and significant. The elasticity indicates that a 1% increase in employment at
single-plant firms in a region increase the probability that a plant adopts a technology by
.022% while a same increase in employment at multi-plant firms decrease the probability
by .011%. This result suggest that given the level of regional employment, an
environment that is comprised of more single-plant firms than multi-plant firms
facilitates technology adoption in a region. This supports the view that single-plant firms
that do not have outside resources tend to rely more on resources that are available
locally, and interact more. Consequently, the diffusion of knowledge is faster and more
33 Rosenthal and Strange (1999) find that small- and medium-sized plants have a larger effect on agglomeration than larger plants. This, however, is not a direct test of the hypothesis of Saxenian, since

28
likely in regions characterized by single-plant firms. This finding also supports
Saxenian’s claim.34 These two results found in this section provide strong evidence that
what are observed in Silicon Valley and Route 128 are also applicable in more general
setting.
7. Organizational Characteristics
A complementary body of theory on the differential capacity of firms to absorb
and make good use of new technical information emphasizes differences in internal
expertise, access to financial resources, and organizational routines. These affect each
firm’s expected profitability – that is, the incremental returns to investing in the new
technology – which in turn gives rise to the observed uneven pattern of adoption (Cohen
and Levinthal 1990; Dosi 1988; Malerba 1992; Nelson and Winter 1982). As Nelson
(1995) points out, some new technologies will never be taken by certain firms, they will
not “learn”. Many of those that do not learn will fall back or exit the industry altogether,
as new young firms enter with their production and work organizations built around the
new technological paradigm from the very beginning.
Plant learning – and ability to act on that information – will also vary by the level
of organizational resources, scale of the production process, appropriateness of the few
technology to that plants’ core production process, and sources of information, that may
have nothing to do with geography per se. For example, local plants may learn as much
from their non-local parent firms and from their networks as from proximate institutions
(Badaracco 1991; Caves 1989; Dunning 1994; Harrison 1994; Mowery 1988; Powell
1990; Scherer et al. 1975).
In sum, whether the underlying processes by which innovative behaviour of
individual firms are enhanced mainly by virtue of agglomeration within a sector or as a
consequence of the diverse institutional character of the region, the capacity of an
organization to learn from external sources is a function of many structural factors, of
she emphasizes the role of industrial structure on technical learning, rather than its role on industry agglomeration of a region. 34 Rosenthal and Strange (1999) did not find any evidence that multi-plant and single-plant firms significantly differ in terms of promoting regional agglomeration.
29
which locational context is only one. Indeed, for certain types of organizations, such as
the branches of multi-locational corporation or members of a production network, the
characteristics of the local business environment may be of minor importance to the
external learning process. Only by comparing the probabilities of adoption of a new
technology among businesses having the same capabilities and resources, but which are
situated within different locational contexts, I can obtain unbiased estimates of the
relative importance of location per se. All the estimation presented in the previous
section include plant characteristics, although only local attributes are discussed. In this
section, I present the organizational characteristics of plants that are more likely to adopt
technologies, and that are more likely benefit from locational context.
7.1 Theories of Firm Capabilities
I first discuss the organizational characteristics of organizations that are more
likely to adopt technologies, and explain the variables used.
Capabilities and Resources
The willingness and the ability of an organization to adopt new technology
depends in part on its capabilities and resources to adapt existing organizational routines
and to engage in a learning by doing process (Kelley and Helper 1997). Heterogeneity in
the size of enterprises and the scale of operations to which the technology applies affects
the expected profitability of the innovation among firms, explaining why some firms will
adopt new technologies while others fail to do so (Dosi, 1988). Size affects the expected
profitability of an innovation in a number of ways. Romeo (1975) and Globerman (1975)
observe that large firms are more likely to be early users of numerically controlled
technology. To measure the capabilities and resources of a plant, I use a plant’s
employment, SIZE.
Even when there are no technical constraints on the scale at which a new
technology is deployed, liquidity constraints may increase the costs of making the
investment for firms with small revenue streams. A large, relatively resource-rich
organization can afford to embark on a number of experiments with process innovations,
30
without risking its survival even if only some of these experiments are successful (Cohen
and Levin 1989; March 1981). Moreover, the costs of employing specialists to increase
the probability of successful implementation of a new technology is lower for larger
firms who can spread fixed costs over greater output. For these reasons, larger
enterprises are expected to be more likely to adopt a new process technology. To capture
the additional disadvantages faced by small plants, I include a dummy variable, SMALL,
for small plants that have employment less than 20.
Scope
Economies of scope (joint production or distribution) are those resulting from the
use of processes within a single operating unit to produce or distribute more than one
product (Chandler 1990). With economies of scope, the cost of adopting technology is
shared across products. Also, the usefulness of technologies in the production of each
commodity may vary. Hence, with more product lines, it is more likely that some
technologies will be adopted. Furthermore, adoption of advanced manufacturing
technologies allows more flexibility in the production of many commodities. For these
reasons, I expect plants with a greater scope to be more likely to adopt technologies. I
measure the scope by the number of commodities produced in a plant, COMMODITY.
Diversity of Information Channels
An important source of heterogeneity in firms’ capabilities to learn about a new
technology developed outside the firm stems from the diversity and salience of
management’s linkages to external sources of information about a new technology.
Hence, organizations with a more diverse set of connections in its learning network are
more likely to find out about the benefits of a new technology in the first place, and to
have better information about costly problems of implementation and the methods and
techniques prior adopters have used to avoid or minimize these costs (Kelley and Helper
1997).
Similarly, for an organization that is exposed to diverse sets of industries, there
are a larger number of available sources of information, and opportunities to learn about
31
potential knowledge. To proxy for the diversity of an organization’s information
channel, I use the number of 4-digit industries in which a plant operates, SEGMENT.
Ownership
Many studies find that foreign controlled plants are more productive than
domestic plants, and other studies suggest that the lagged productivity of Canadian plants
are due to lower technology uptakes (Baldwin and Diverty 1995). In addition, foreign
ownership means that an organization has an internal access to the parent firm elsewhere,
which implies an access to certain resources and information that are not available to
domestic owned plants. To account for the effects of foreign ownership, a dummy
variable for foreign controlled plant, FOREIGN, is used.
Plant-Status
Being a part of a multi-plant firm often allows better access to resources, knowledge and
information that are not available in the region. To control for plant status, a dummy
variable for single-plant firms, SINGLE, is used.
Size- and Status-related Difference in Plant’s Susceptibility to Agglomeration Economies
I expect smaller plants to be more susceptible to outside influences from their
network and geographic location. The reasons are two-fold. First, a plant belonging to a
larger firm is more likely to serve a national market, so regional demand fluctuations will
have less effect on its output (Kelley and Helper 1997). For large firms, investment
decisions may depend on factors that may have little to do with that business unit’s
locales or local management’s connections to sources of information external to the firm.
Second, the smaller the firm, the more I would expect it to be susceptible to external
influences. That is what sociologists term “mimetic isomorphism”, the tendency of
organizations to adopt practices and technologies in imitation of other enterprises like
themselves (DiMaggio and Powell, 1983).
I also expect single-plant firms to be more susceptible to the regional economic
environment they locate in. A multi-plant firm’s investment decisions are more likely to
be influenced by corporate strategy (Schere et al., 1975).
32
7.2. Results on Organizational Characteristics
Table 9 presents the estimates for plant characteristics. The baseline regression
includes plants characteristics, local technology adopters, regional employment, other
agglomeration effects, and regional-, technology- and industry- fixed effects. As before,
other variables and fixed effects are suppressed to conserve the space. The first column
presents the estimates for the baseline regression, and the second column presents the
elasticity.
The employment size of a plant is positively correlated with technology adoption.
A 1% increase in plant employment increases the probability of adopting technology by
0.22%. This is consistent with the theory that organizational capabilities and resources
are one of the most important factors in the adoption of technology. The number of
commodities produced at plant, which captures the scope of a plant, has a negative effect
on technology adoption, after controlling for plant size. A diversity in information
channels has a positive effect. This suggests that knowledge and information play an
important role in technology adoption decision. Furthermore, the single-plant firm
dummy variable has a negative and significant coefficient, indicating that single-plant
firms are less likely to adopt technologies than multi-plant type of plants even after
controlling for plant size. The benefit of being part of multi-plant firm not only come
from the size, but also from the information and resources available from elsewhere.
Also, the probability of adopting technology is higher among foreign owned plants. This
confirms previous findings that foreign owned plants have higher technology uptake
rates.
I then examine whether the benefit of locational attributes and knowledge
spillovers condition on the plant size. Particularly, do small firms benefit more from
knowledge spillovers, from experience of prior adopters or from the regional
agglomeration? If so, then it is more important for small plants to locate in regions that
are more likely to facilitate inter-firm learning. The third column reports the results on
this hypothesis. I test for size-related differences in the effects of knowledge spillovers
by interacting plant size dummy, SMALL, with TECH_S. The positive coefficient on the
interaction between these two variable, SMALL*TECH_S suggest that the learning
33
advantages from local prior adopters are greater for the small plants. Similarly, the
positive coefficient on the interaction between SMALL and EMP_REGION suggest that
small plants benefit more from locating in regions with large manufacturing employment.
With respect to agglomeration economies and knowledge spillovers, I find size-related
differences, that small plants are more susceptible to the external environment they face.
Further, I examine whether there are plant status-related differences with respect
to the regional agglomeration. Similar to the case with size-related difference, I ask
whether single-plant firms benefit more from the experience of prior adopters and the
regional agglomeration. I test this hypothesis by interacting plant status dummy, Single,
with other locational variables. The positive coefficient on SINGLE*TECH_S suggests
that the effect of knowledge spillovers on technology adoption are greater for single-
plant firms. Similarly, SINGLE*EMP_REGION has a positive coefficient. This implies
that the advantage from locating in a region with a high level of manufacturing activity is
greater for single-plant firms.
To examine whether this size-related difference with respect to agglomeration
economies are capturing the effect of status-related difference, and vice versa (since
small plants tend to be single-plant firm, and single-plant frims tend to be small), I
include both sets of variables. The results are reported in the last column in table 9.
Three of four interaction terms are significant. When both the size- and status-related
difference are accounted for, the size-related advantage on knowledge spillovers and
regional agglomeration, and status-related advantage on the regional agglomeration
remain to be important.
8. Conclusion
The nature and utility of knowledge are at the heart of the economics of R&D,
innovation and technological change. How knowledge is created and diffused, and how
learning takes place are still inside the black box. By examining the various aspects of
regional economies, this paper attempts to explore the role of agglomeration in
technology adoption. Specifically, this paper separates the effects of knowledge
34
spillovers from other agglomeration externalities and local amenities, and identifies a
very narrow channel through which knowledge is diffused.
The key finding of this paper is that a plant’s decision to adopt a specific
technology is facilitated by the presence of other plants in similar industries and in the
same region that have already adopted the same technology. This paper finds that
knowledge spillovers from prior technology adopters are bounded along the three
dimensions: geographical proximity, production process proximity, and technological
proximity. This implies a very narrow channel for knowledge spillovers which has not
been previously identified.
Another key finding of this paper is that the industrial structure of a region plays
an important role in the speed of learning in a region. I find that, after controlling for
regional employment, environments that are characterized by smaller plants as opposed
to larger plants, and single-plant firms as opposed to multi-plant firms, are more likely to
facilitate the diffusion of knowledge and learning, and hence technology adoption is more
likely in such places. This suggests that small and single-plant firms are better agencies
in the creation and the diffusion of new ideas and information than their larger or multi-
plant counterparts. This paper is the first to show that this is a broader pattern observed
in the data, not just an unique comparative experience of Silicon Valley and Route 128.
Finally, I find that there are size- and status-related differences with respect to the
regional agglomeration. The learning advantages from the experience of local prior
adopters and the regional agglomeration are greater for the small and single-plant firms.

35
References The Annual Survey of Manufactures 1983-1993. Statistics Canada. Audretsch, D. and M. Feldman. 1996. “R&D Spillovers and the Geography of Innovation and Production,” The American Economic Review 86: 630-640. Baldwin, J. and B. Diverty. 1995. “Advanced Technology Use in Canadian Manufacturing Establishments,” Statistics Canada Analytical Studies Branch Research Working Paper Series no. 85. Badaracco, J.L. 1991. The Knowledge Link: How Firms Compete Through Strategic Alliances, Boston: Harvard Business School Press. Bresnahan, T. and M. Trajtenberg, 1995. “General Purpose Technologies: engines of Growth?” Journal of Econometrics 65:83-108. Carlsson, B. and S. Jacobsson. 1994. “Technological System and Economic Policy: The Diffusion of Factory Automation in Sweden,” Research Policy. Case, Anne. 1992. “Neighborhood Influence and Technological Change,” Regional Science and Urban Economics 22 (4): 491-508. Caves, R. 1989. Multinational Enterprise and Economic Analysis. Cambridge: Cambridge University Press. Chandler, A.D. 1990. The Scale and Scope: The Dynamics of Industrial Capitalism Cambridge: The Belknap Press of Harvard University Press. Chinitz, B.J. 1961. “Contrasts in Agglomeration: New York and Pittsburgh,” American Economic Review 51: 279-89. Cohen, W. and R.C. Levin. 1989. “Empirical Studies of Innovation and Market Structure,” In Handbook of Industrial Organization, vol. 2, edited by R. Schmalense and R.D. Willig. New York: Elsevier. Cohen, W.M. and D.A. Levinthal. 1990. “Absorptive Capacity: A New Perspective on Learning and Innovation,” Administrative Science Quarterly 35: 128-152. DiMaggio, P.J. and W.W. Powell. 1983. “the Iron Cage revisited: Institutional Isomorphism and Collective Rationality in Organizational Fields,” American Sociological Review 48 (2): 147-160. Dore, R. 1983. “Goodwill and the Spirit of Market Capitalism,” British Journal of Sociology 34: 459-82.

36
Dore, R. 1986. Flexible Rigidities. Stanford: Stanford University Press. Dosi, G. 1988. “Sources, Procedures, and Microeconomic Effects of Innovation,” Journal of Economic Literature 26: 1120-1171. Dumais, G., G. Ellison, and E.L. Glaeser. 1997. “Geographic Concentration as a Dynamic Process,” NBER working paper No. 6270. Dunning, J.H. 1994. “Globalization, Technological Change, and The Spatial Organization of Economic Activity,” Paper prepared for the Prince Bertil Symposium on The Dynamic Firm: The Role of Regions, Technology, Strategy and Organization, Stockholm School of Economics, June, available from School of business, Rutgers University, Newark, N.J. Ellison, G. and E.L. Glaeser. 1997. “Geographic Concentration in US Manufacturing Industries: A Dartboard Approach,” Journal of Political Economy 105: 889-927. Fujita, M., P. Krugman, A. Venables. 1999. The spatial Economy: Cities, Regions, and International Trade. Cambridge: MIT Press. Feldman, M.P. and D.B. Audretsch. 1999. “Innovation in Cities: Science-based Diversity, Specialization and Localized Competition,” European Economic Review 42: 409-429. Gertler, M.S. “Being there: Proximity, Organization, and Culture in the Development and Adoption of Advanced Manufacturing Technologies,” Economic Geography. Gertler, M.S. 2002. “Tacit Knowledge and the Economic Geography of Context,” Mimeo, University of Toronto. Glaeser, E.L., H.D. Kalal, J.A. Scheinkman, and A. Shleifer. 1992. “Growth in Cities,” Journal of Political Economy 100 (6):1126-52. Globerman, S. 1975. “Technological Diffusion in the Canadian Tool and Die Industry,” Review of Economics and Statistics 57: 428-434. Hanson, G.H. 2000. “Scale Economies and the Geographic Concentration of Industry,” NBER working paper No. 8013. Harrison, B. 1994. Lean and Mean: The Changing Landscape Of Corporate Power In the Age of Flexibility, New York: Basic Books. Harrison, B., M.R. Kelley, and J. Gant. 1996. “Innovative Firm Behavior and Local Milieu: Exploring the Intersection of Agglomeration, Firm Effects, and Technological Change,” Economic Geography 62: 233-258.

37
Harrison, B., M.R. Kelley, and J. Gant. May 1996. “Specialization Versus Diversity in Local economies: The Implications for Innovative Private-Sector Behavior,” Cityscape: A Journal of Policy Development and Research 2 (2): 61-92. Helpman, E. and M. Trajtenberg, 1998. “Diffusion of General Purpose Technologies,” General Purpose Technologies and Economic Growth, Helpman (ed.), MIT Press. Helper, S. 1995. “Supplier Relations and Adoption of New Technology: Results of Survey Research in the U.S. Auto Industry,” NBER working paper No. 5278. Henderson, J.V. 1999. “Marshall’s Scale Economies,” NBER working paper No. 7358. Holmes, T.J. 2002. “The Role of Cities: Evidence From the Placement of Sales Offices,” University of Minnesota and Federal Reserve Bank of Minneapolis, mimeo. Jacobs, J. 1969. The Economy of Cities, New York: Vintage. Jaffe, A., M. Trajtenberg, and R. Henderson. 1993. “Geographic Localization of Knowledge Spillovers as Evidenced by Patent Citation,” Quarterly Journal of Economics 108 (3): 577-598. Kelley, M.R. 1993. “Organizational Resources and the Industrial Environment: The Importance of Firm Size and Interfirm Linkages to the Adoption of Advanced Manufacturing Technology,” International Journal of Technology Management 8:33-68. Kelley, M.R. and S. Helper. February 1996. “Firm Size and Capabilities, Regional Agglomeration, and the Adoption of New Technology,” Working paper. Cambridge, MA: Massachusetts Institute of Technology, Industrial Performance Centre. Krugman, P. 1991a. “Increasing Returns and Economic Geography,” The Journal of Political Economy 99(3): 483-499. Krugman, P. 1991b. Geography and Trade. Cambridge: M.I.T. Press. Landes, D.S. 1990. The Wealth and poverty of nation: Why some are so rich and some are so poor? New York: W.W. Norton Company. Lane, S. 1991. “The Determinants of Investment in New Technology”, AEA Papers and Proceedings, 81: 262-265. Levin, R. Alvin Klevorick, Richard Nelson, and Sidney Winter 1987. "Appropriating the returns from industrial research and development", Brooking papers on Economic Activity(3): 783-820 March, J.G. 1981. “Footnotes to Organizational Change,” Administrative Science Quarterly 26:563-577.

38
Marshall, A. 1920. Principles of Economics. New York: Macmillan. Mowery, D., ed. 1988. International collaborative Ventures in U.S. Manufacturing. Cambridge, Mass.: Ballinger. Nelson, R.R., and Winter, S. 1982. An Evolutionary Theory Of Economic Change. Cambridge: Harvard University Press. Piore, M. and C. Sabel. 1984. The Second Industrial Divide. New York: Basic books. Porter, M. 1990. The Competitive Advantage of Nations. New York: The Free Press. Porter, M. 1998. On Competition. Harvard Business Review Book Series. Boston: Harvard Business School Press. Porter, M. 2000. “Location , Competition, and Global Development: Local Clusters in a Global Economy,” Economic Development Quarterly. 14 (1): 15-34. Powell, W.M. 1990. “Neither Market or Hierarchy: Network Forms of Organization,” Research In Organizational Behavior 12: 296-336. Powell, W.W., and Brantley, P. 1992. “Competitive Cooperation in Biotechnology: Learning Through Networks?” In networks and Organizations: Structure, Form, and Action, ed. N. Nohria and R. G. Eccles: 366-94. Boston: Harvard Business School Press. Romer, P. 1990. “Endogenous Technological Change,” Journal of Political Economy 98 (5): 71-102. Romeo, A. 1975. “Interindustry and interfirm Differences in the Rate of Diffusion of an Innovation,” Review of Economics and Statistics 57: 311-319. Rosenberg, N. 1982. Inside the Black Box: Technology and Economics. Cambridge: Cambridge University Press. Rosenthal, S.S. and W.C. Strange. 1999. “Geography, Industrial Organization, and Agglomeration,” Mimeo, University of British Columbia. Rosenthal, S.S. and W.C. Strange. 2001. “The Determinants of Agglomeration,” Journal of Urban Economics 50: 191-229. Saxenian, A. 1994, Regional Advantage: Culture and Competition in Silicon Valley and Route 128, Cambridge, MA: Harvard University.

39
Saxenian, A. May 1996. “Inside-Out: Regional Networks and Industrial Adaptation in Silicon Valley and Route 128,” Cityscape : A Journal of Policy Development and Research 2 (2): 41-60. Scherer, F.M., A. Beckenstein, E. Kaufer, and R.D. Murphy. 1975. The Economics of Multi-plant Operation. Cambridge, MA: Harvard University Press. 1993 Survey of Innovation and Advanced Technology 1993. Statistics Canada. Von Hippel, 1988. The Sources of Innovation. Oxford; Oxford University Press.
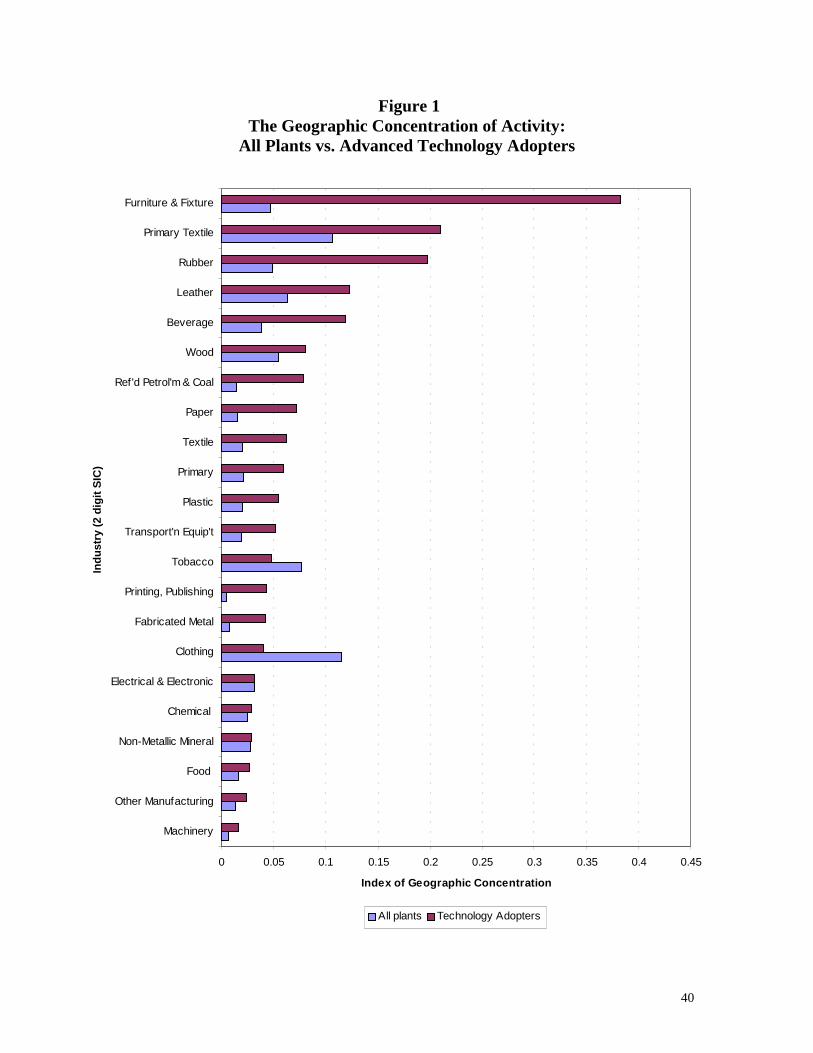
40
Figure 1 The Geographic Concentration of Activity:
All Plants vs. Advanced Technology Adopters
0 0.05 0.1 0.15 0.2 0.25 0.3 0.35 0.4 0.45
Machinery
Other Manufacturing
Food
Non-Metallic Mineral
Chemical
Electrical & Electronic
Clothing
Fabricated Metal
Printing, Publishing
Tobacco
Transport'n Equip't
Plastic
Primary
Textile
Paper
Ref'd Petrol'm & Coal
Wood
Beverage
Leather
Rubber
Primary Textile
Furniture & Fixture
Indu
stry
(2
digi
t SIC
)
Index of Geographic Concentration
All plants Technology Adopters
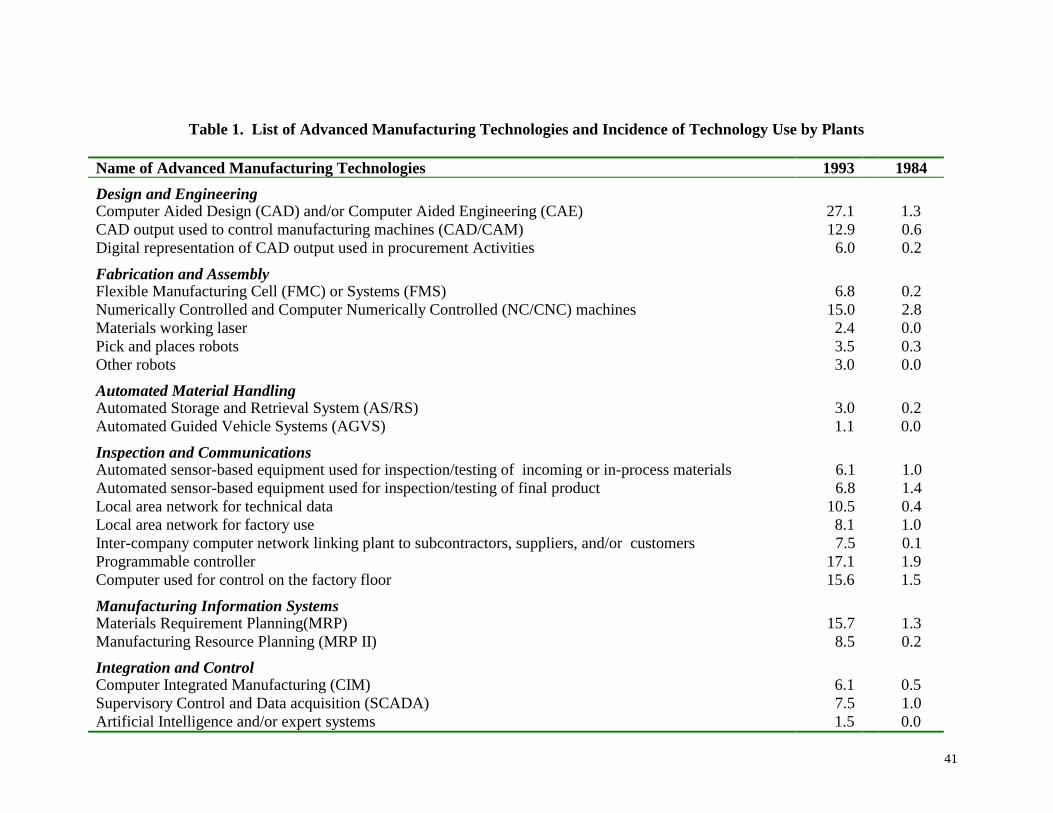
41
Table 1. List of Advanced Manufacturing Technologies and Incidence of Technology Use by Plants
Name of Advanced Manufacturing Technologies 1993 1984
Design and Engineering Computer Aided Design (CAD) and/or Computer Aided Engineering (CAE) 27.1 1.3 CAD output used to control manufacturing machines (CAD/CAM) 12.9 0.6 Digital representation of CAD output used in procurement Activities 6.0 0.2
Fabrication and Assembly Flexible Manufacturing Cell (FMC) or Systems (FMS) 6.8 0.2 Numerically Controlled and Computer Numerically Controlled (NC/CNC) machines 15.0 2.8 Materials working laser 2.4 0.0 Pick and places robots 3.5 0.3 Other robots 3.0 0.0
Automated Material Handling Automated Storage and Retrieval System (AS/RS) 3.0 0.2 Automated Guided Vehicle Systems (AGVS) 1.1 0.0
Inspection and Communications Automated sensor-based equipment used for inspection/testing of incoming or in-process materials 6.1 1.0 Automated sensor-based equipment used for inspection/testing of final product 6.8 1.4 Local area network for technical data 10.5 0.4 Local area network for factory use 8.1 1.0 Inter-company computer network linking plant to subcontractors, suppliers, and/or customers 7.5 0.1 Programmable controller 17.1 1.9 Computer used for control on the factory floor 15.6 1.5
Manufacturing Information Systems Materials Requirement Planning(MRP) 15.7 1.3 Manufacturing Resource Planning (MRP II) 8.5 0.2
Integration and Control Computer Integrated Manufacturing (CIM) 6.1 0.5 Supervisory Control and Data acquisition (SCADA) 7.5 1.0 Artificial Intelligence and/or expert systems 1.5 0.0
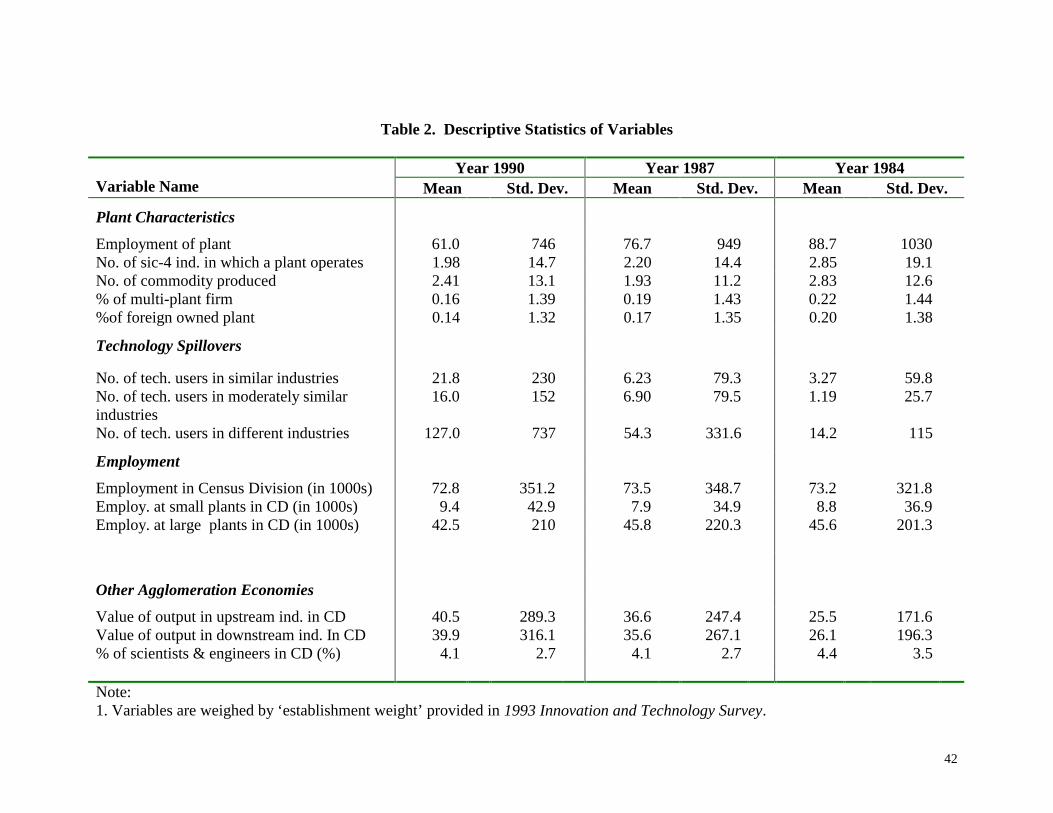
42
Table 2. Descriptive Statistics of Variables
Year 1990 Year 1987 Year 1984 Variable Name Mean Std. Dev. Mean Std. Dev. Mean Std. Dev.
Plant Characteristics
Employment of plant 61.0 746 76.7 949 88.7 1030 No. of sic-4 ind. in which a plant operates 1.98 14.7 2.20 14.4 2.85 19.1 No. of commodity produced 2.41 13.1 1.93 11.2 2.83 12.6 % of multi-plant firm 0.16 1.39 0.19 1.43 0.22 1.44 %of foreign owned plant 0.14 1.32 0.17 1.35 0.20 1.38
Technology Spillovers
No. of tech. users in similar industries 21.8 230 6.23 79.3 3.27 59.8 No. of tech. users in moderately similar industries
16.0 152 6.90 79.5 1.19 25.7
No. of tech. users in different industries 127.0 737 54.3 331.6 14.2 115
Employment
Employment in Census Division (in 1000s) 72.8 351.2 73.5 348.7 73.2 321.8 Employ. at small plants in CD (in 1000s) 9.4 42.9 7.9 34.9 8.8 36.9 Employ. at large plants in CD (in 1000s) 42.5 210 45.8 220.3 45.6 201.3
Other Agglomeration Economies
Value of output in upstream ind. in CD 40.5 289.3 36.6 247.4 25.5 171.6 Value of output in downstream ind. In CD 39.9 316.1 35.6 267.1 26.1 196.3 % of scientists & engineers in CD (%) 4.1 2.7 4.1 2.7 4.4 3.5
Note: 1. Variables are weighed by ‘establishment weight’ provided in 1993 Innovation and Technology Survey.
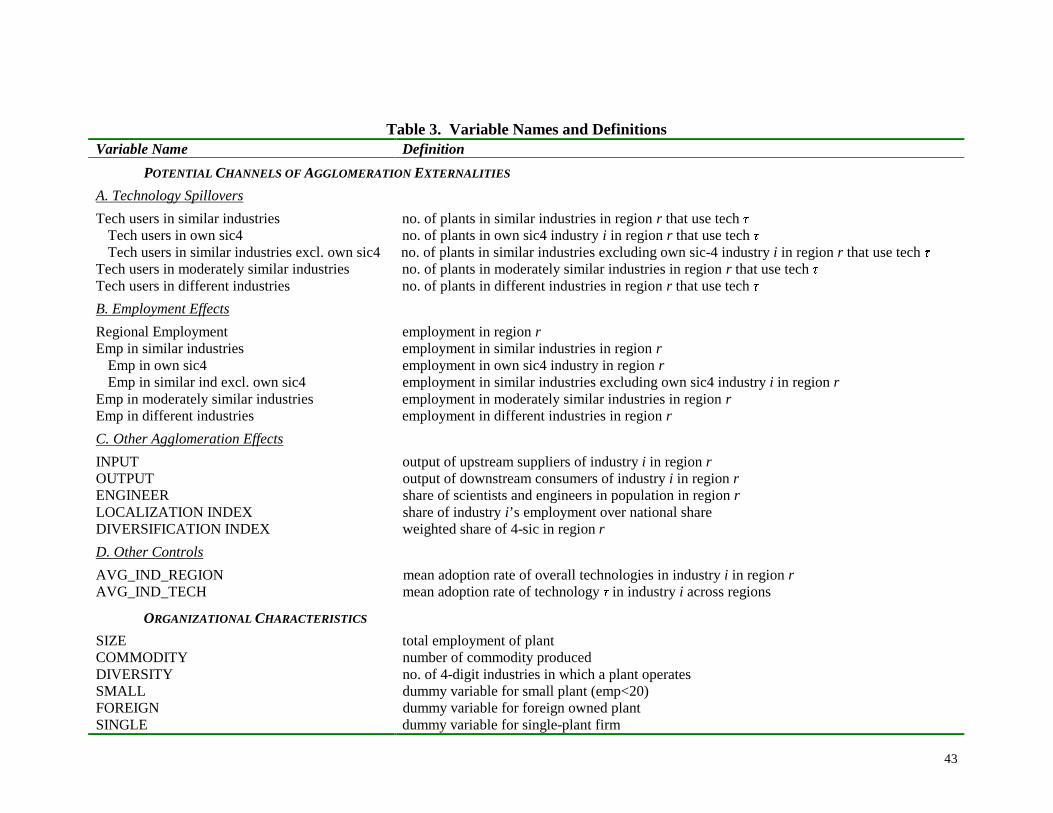
43
Table 3. Variable Names and Definitions Variable Name Definition
POTENTIAL CHANNELS OF AGGLOMERATION EXTERNALITIES
A. Technology Spillovers
Tech users in similar industries no. of plants in similar industries in region r that use tech 2 Tech users in own sic4 no. of plants in own sic4 industry i in region r that use tech 2 Tech users in similar industries excl. own sic4 no. of plants in similar industries excluding own sic-4 industry i in region r that use tech 2
Tech users in moderately similar industries no. of plants in moderately similar industries in region r that use tech 2 Tech users in different industries no. of plants in different industries in region r that use tech 2
B. Employment Effects
Regional Employment employment in region r Emp in similar industries employment in similar industries in region r
Emp in own sic4 employment in own sic4 industry in region r Emp in similar ind excl. own sic4 employment in similar industries excluding own sic4 industry i in region r
Emp in moderately similar industries employment in moderately similar industries in region r Emp in different industries employment in different industries in region r
C. Other Agglomeration Effects
INPUT output of upstream suppliers of industry i in region r OUTPUT output of downstream consumers of industry i in region r ENGINEER share of scientists and engineers in population in region r LOCALIZATION INDEX share of industry i’s employment over national share DIVERSIFICATION INDEX weighted share of 4-sic in region r
D. Other Controls
AVG_IND_REGION mean adoption rate of overall technologies in industry i in region r AVG_IND_TECH mean adoption rate of technology 2 in industry i across regions
ORGANIZATIONAL CHARACTERISTICS
SIZE total employment of plant COMMODITY number of commodity produced DIVERSITY no. of 4-digit industries in which a plant operates SMALL dummy variable for small plant (emp<20) FOREIGN dummy variable for foreign owned plant SINGLE dummy variable for single-plant firm

44
Table 4
Technology Spillovers and Agglomeration Effects on Technology Adoption
Dependent Variable: p irtADOPTION τ
Main Regression
Variable Name Coefficient Std. Error Elasticity Technology Spillovers (Tech users in similar ind)2LU�W-1 .0313* .0030 .008 (Tech users in moderately similar ind)2LU�W-1 .0243* .0030 .006 (Tech users in different ind)2LU�W-1 -.0167* .0043 -.004 Other Agglomeration Effects EMP_REGIONUï�W-1 .0530* .0086 .012 INPUTiUï�W-1 .0824* .0079 .014 OUTPUTiUï�W-1 -.1313* .0087 -.013 ENGINEERUï�W-1 4.3097* .9711 1.069 Observations 105,902 Log Likelihood 67,893 Notes:
1) Standard errors are in parentheses. 2) $
2 statistically significant at p < 0.05 3) Uï denotes Census Division in which plant p is located. 4) Also included are plant characteristics, fixed effects and control variables
(AVG_IND_REGION, AVG_IND_TECH).
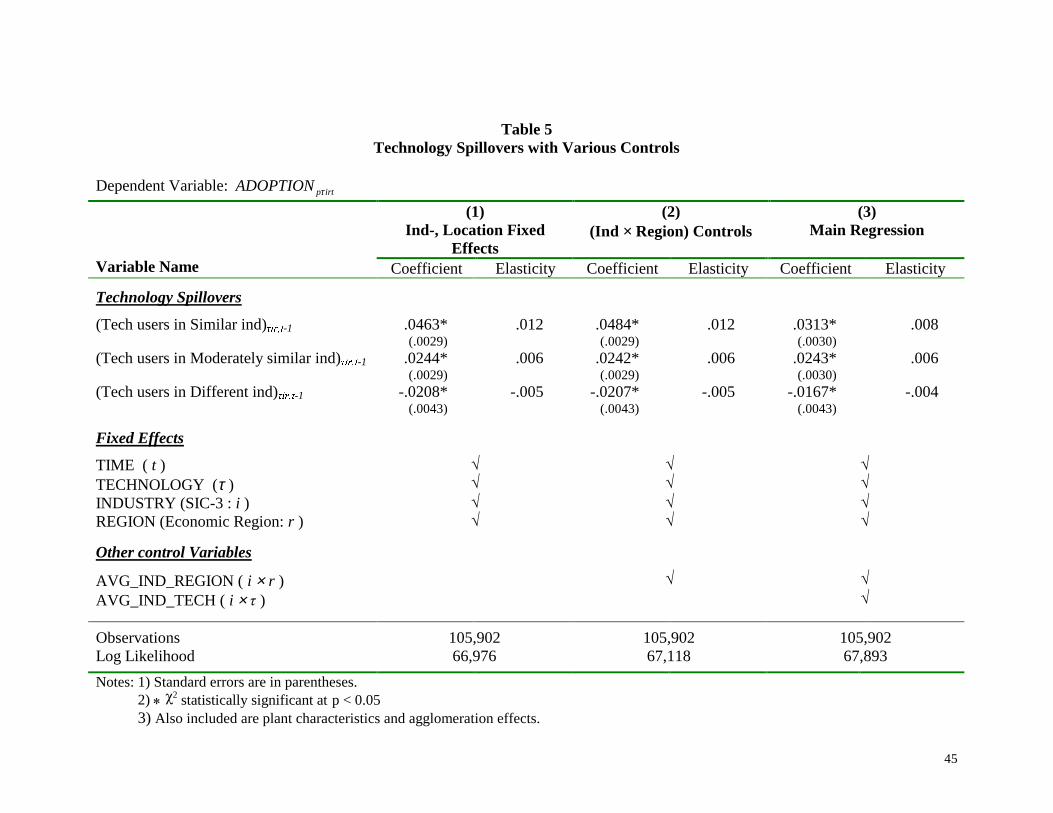
45
Table 5 Technology Spillovers with Various Controls
Dependent Variable: p irtADOPTION τ
(1) Ind-, Location Fixed
Effects
(2) (Ind × Region) Controls
(3) Main Regression
Variable Name Coefficient Elasticity Coefficient Elasticity Coefficient Elasticity
Technology Spillovers
(Tech users in Similar ind)2LU�W-1 .0463* (.0029)
.012 .0484* (.0029)
.012 .0313* (.0030)
.008
(Tech users in Moderately similar ind)2LU�W-1 .0244* (.0029)
.006 .0242* (.0029)
.006 .0243* (.0030)
.006
(Tech users in Different ind)2LU�W-1 -.0208* (.0043)
-.005 -.0207* (.0043)
-.005 -.0167* (.0043)
-.004
Fixed Effects
TIME ( t ) ¥ ¥ ¥ TECHNOLOGY (τ ) ¥ ¥ ¥ INDUSTRY (SIC-3 : i ) ¥ ¥ ¥ REGION (Economic Region: r ) ¥ ¥ ¥
Other control Variables
AVG_IND_REGION ( i × r ) ¥ ¥ AVG_IND_TECH ( i ×�2 ) ¥
Observations 105,902 105,902 105,902 Log Likelihood 66,976 67,118 67,893
Notes: 1) Standard errors are in parentheses. 2) �$2 statistically significant at p < 0.05
3) Also included are plant characteristics and agglomeration effects.
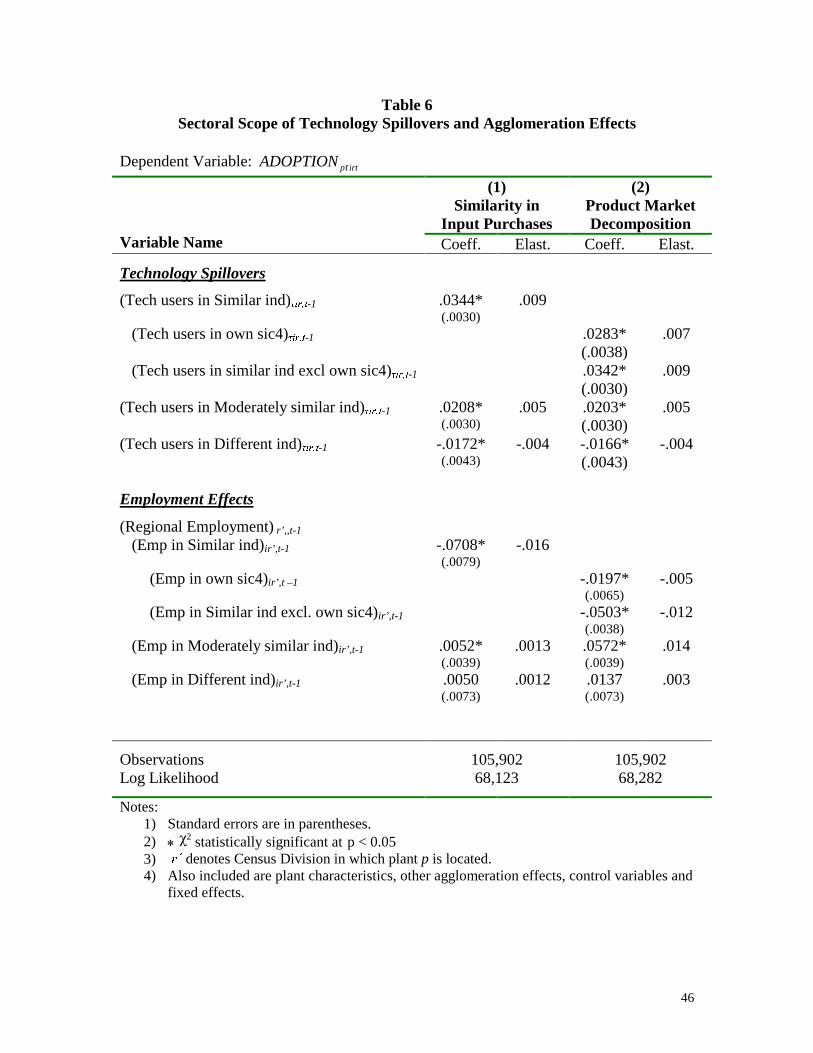
46
Table 6 Sectoral Scope of Technology Spillovers and Agglomeration Effects
Dependent Variable: p irtADOPTION τ
(1) Similarity in
Input Purchases
(2) Product Market Decomposition
Variable Name Coeff. Elast. Coeff. Elast.
Technology Spillovers
(Tech users in Similar ind)2LU�W-1 .0344* (.0030)
.009
(Tech users in own sic4)2LU�W-1 .0283* (.0038)
.007
(Tech users in similar ind excl own sic4)2LU�W-1 .0342* (.0030)
.009
(Tech users in Moderately similar ind)2LU�W-1 .0208* (.0030)
.005 .0203* (.0030)
.005
(Tech users in Different ind)2LU�W-1 -.0172* (.0043)
-.004 -.0166* (.0043)
-.004
Employment Effects
(Regional Employment) r’,,t-1 (Emp in Similar ind)ir’,t-1 -.0708*
(.0079) -.016
(Emp in own sic4)ir’,t –1 -.0197* (.0065)
-.005
(Emp in Similar ind excl. own sic4)ir’,t-1 -.0503* (.0038)
-.012
(Emp in Moderately similar ind)ir’,t-1 .0052* (.0039)
.0013 .0572* (.0039)
.014
(Emp in Different ind)ir’,t-1 .0050 (.0073)
.0012 .0137 (.0073)
.003
Observations 105,902 105,902 Log Likelihood 68,123 68,282
Notes: 1) Standard errors are in parentheses. 2) �$
2 statistically significant at p < 0.05 3) Uï denotes Census Division in which plant p is located. 4) Also included are plant characteristics, other agglomeration effects, control variables and
fixed effects.
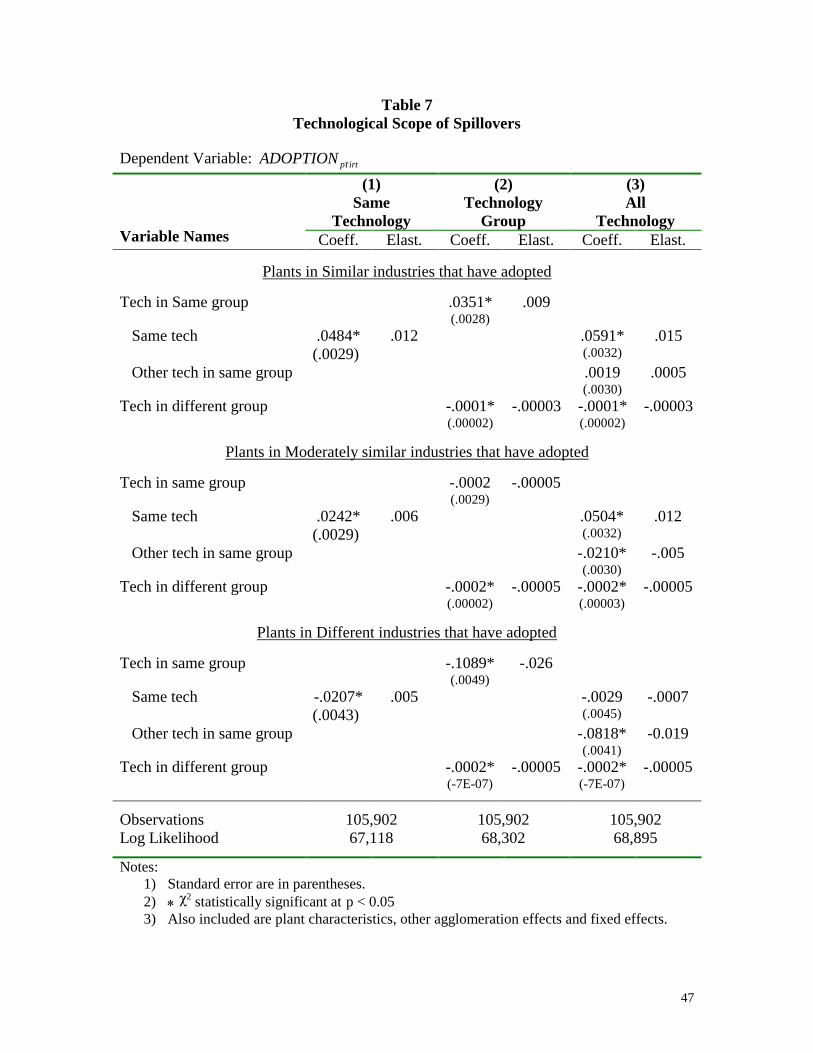
47
Table 7 Technological Scope of Spillovers
Dependent Variable: p irtADOPTION τ
(1) Same
Technology
(2) Technology
Group
(3) All
Technology
Variable Names Coeff. Elast. Coeff. Elast. Coeff. Elast.
Plants in Similar industries that have adopted
Tech in Same group .0351* (.0028)
.009
Same tech .0484* (.0029)
.012 .0591* (.0032)
.015
Other tech in same group .0019 (.0030)
.0005
Tech in different group -.0001* (.00002)
-.00003 -.0001* (.00002)
-.00003
Plants in Moderately similar industries that have adopted
Tech in same group -.0002 (.0029)
-.00005
Same tech .0242* (.0029)
.006 .0504* (.0032)
.012
Other tech in same group -.0210* (.0030)
-.005
Tech in different group -.0002* (.00002)
-.00005 -.0002* (.00003)
-.00005
Plants in Different industries that have adopted
Tech in same group -.1089* (.0049)
-.026
Same tech -.0207* (.0043)
.005 -.0029 (.0045)
-.0007
Other tech in same group -.0818* (.0041)
-0.019
Tech in different group -.0002* (-7E-07)
-.00005 -.0002* (-7E-07)
-.00005
Observations 105,902 105,902 105,902 Log Likelihood 67,118 68,302 68,895
Notes: 1) Standard error are in parentheses. 2) �$
2 statistically significant at p < 0.05 3) Also included are plant characteristics, other agglomeration effects and fixed effects.
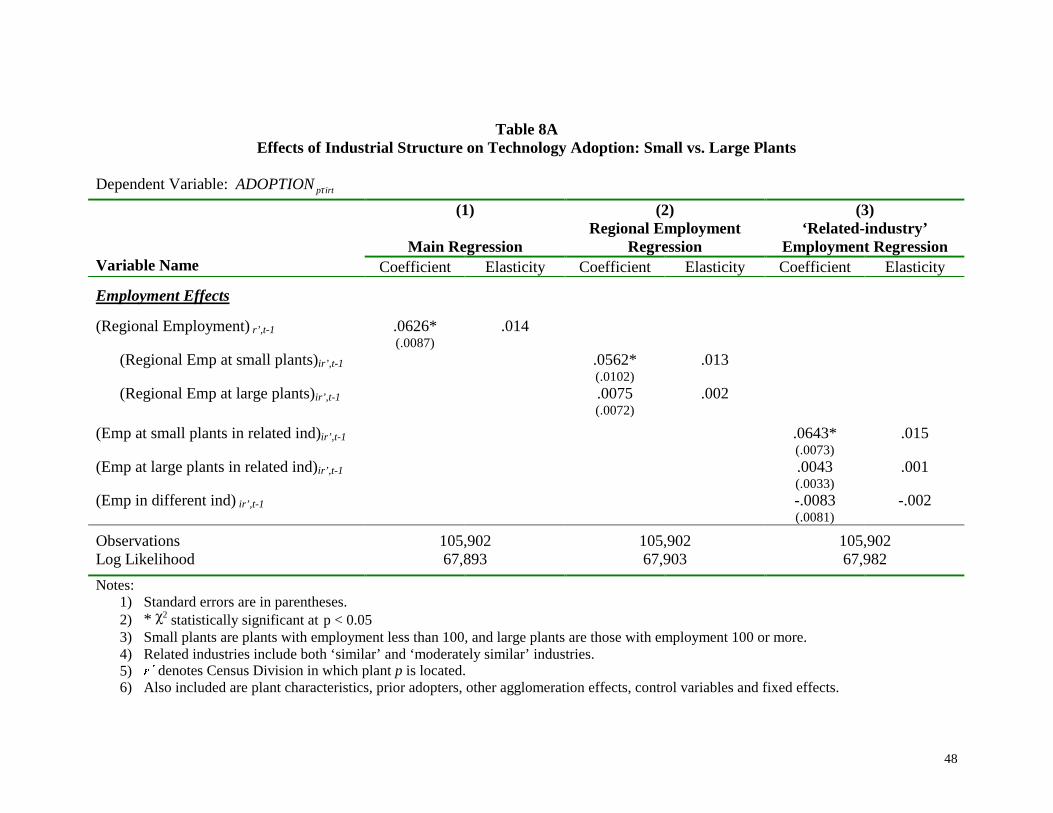
48
Table 8A Effects of Industrial Structure on Technology Adoption: Small vs. Large Plants
Dependent Variable: p irtADOPTION τ
(1)
Main Regression
(2) Regional Employment
Regression
(3) ‘Related-industry’
Employment Regression
Variable Name Coefficient Elasticity Coefficient Elasticity Coefficient Elasticity
Employment Effects
(Regional Employment) r’,t-1 .0626* (.0087)
.014
(Regional Emp at small plants)ir’,t-1 .0562* (.0102)
.013
(Regional Emp at large plants)ir’,t-1 .0075 (.0072)
.002
(Emp at small plants in related ind)ir’,t-1 .0643* (.0073)
.015
(Emp at large plants in related ind)ir’,t-1 .0043 (.0033)
.001
(Emp in different ind) ir’,t-1 -.0083 (.0081)
-.002
Observations 105,902 105,902 105,902 Log Likelihood 67,893 67,903 67,982
Notes: 1) Standard errors are in parentheses. 2) * $2 statistically significant at p < 0.05 3) Small plants are plants with employment less than 100, and large plants are those with employment 100 or more. 4) Related industries include both ‘similar’ and ‘moderately similar’ industries. 5) Uï denotes Census Division in which plant p is located. 6) Also included are plant characteristics, prior adopters, other agglomeration effects, control variables and fixed effects.
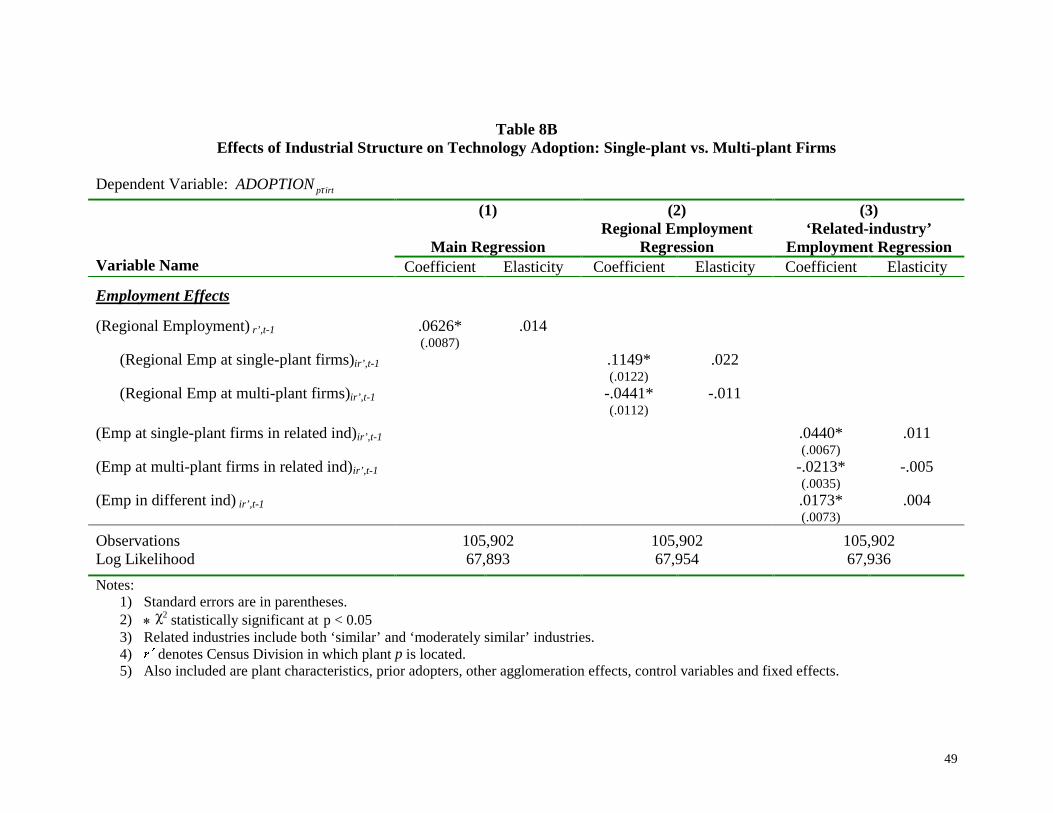
49
Table 8B Effects of Industrial Structure on Technology Adoption: Single-plant vs. Multi-plant Firms
Dependent Variable: p irtADOPTION τ
(1)
Main Regression
(2) Regional Employment
Regression
(3) ‘Related-industry’
Employment Regression
Variable Name Coefficient Elasticity Coefficient Elasticity Coefficient Elasticity
Employment Effects
(Regional Employment) r’,t-1 .0626* (.0087)
.014
(Regional Emp at single-plant firms)ir’,t-1 .1149* (.0122)
.022
(Regional Emp at multi-plant firms)ir’,t-1 -.0441* (.0112)
-.011
(Emp at single-plant firms in related ind)ir’,t-1 .0440* (.0067)
.011
(Emp at multi-plant firms in related ind)ir’,t-1 -.0213* (.0035)
-.005
(Emp in different ind) ir’,t-1 .0173* (.0073)
.004
Observations 105,902 105,902 105,902 Log Likelihood 67,893 67,954 67,936
Notes: 1) Standard errors are in parentheses. 2) �$
2 statistically significant at p < 0.05 3) Related industries include both ‘similar’ and ‘moderately similar’ industries. 4) Uï denotes Census Division in which plant p is located. 5) Also included are plant characteristics, prior adopters, other agglomeration effects, control variables and fixed effects.
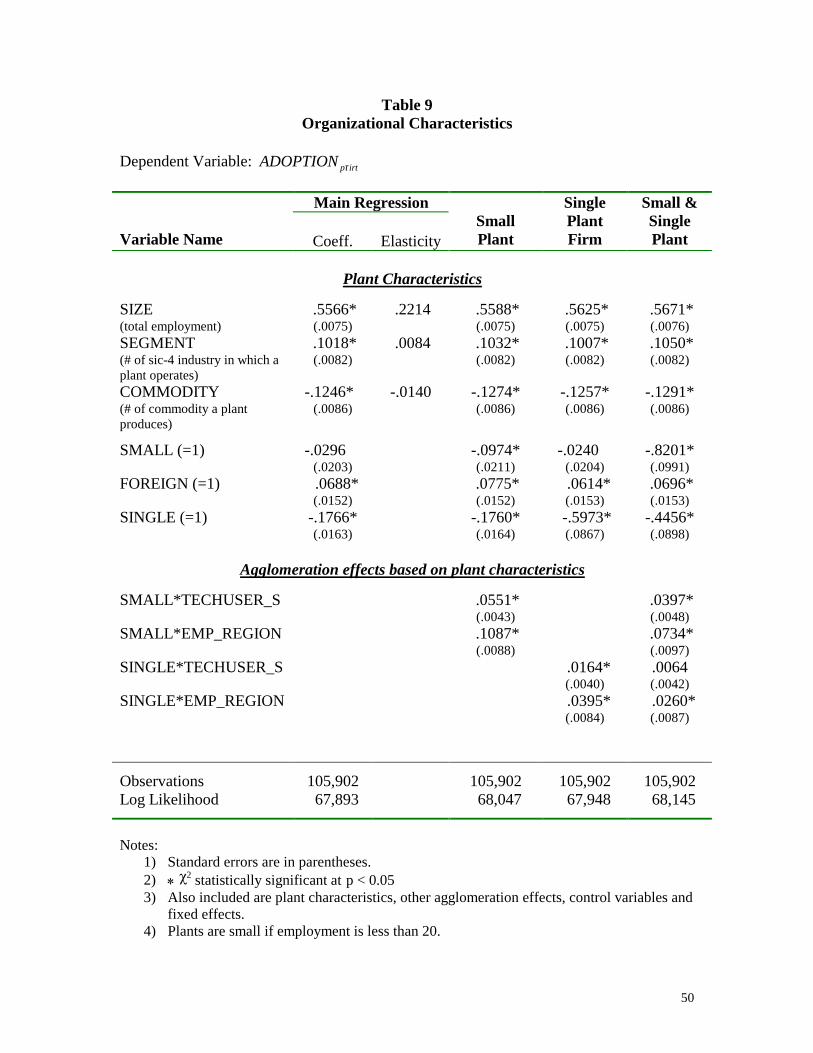
50
Table 9 Organizational Characteristics
Dependent Variable: p irtADOPTION τ
Main Regression
Variable Name
Coeff.
Elasticity
Small Plant
Single Plant Firm
Small & Single Plant
Plant Characteristics
SIZE (total employment)
.5566* (.0075)
.2214 .5588* (.0075)
.5625* (.0075)
.5671* (.0076)
SEGMENT (# of sic-4 industry in which a plant operates)
.1018* (.0082)
.0084 .1032* (.0082)
.1007* (.0082)
.1050* (.0082)
COMMODITY (# of commodity a plant produces)
-.1246* (.0086)
-.0140 -.1274* (.0086)
-.1257* (.0086)
-.1291* (.0086)
SMALL (=1) -.0296 (.0203)
-.0974* (.0211)
-.0240 (.0204)
-.8201* (.0991)
FOREIGN (=1) .0688* (.0152)
.0775* (.0152)
.0614* (.0153)
.0696* (.0153)
SINGLE (=1) -.1766* (.0163)
-.1760* (.0164)
-.5973* (.0867)
-.4456* (.0898)
Agglomeration effects based on plant characteristics
SMALL*TECHUSER_S
.0551* (.0043)
.0397* (.0048)
SMALL*EMP_REGION .1087* (.0088)
.0734* (.0097)
SINGLE*TECHUSER_S .0164* (.0040)
.0064 (.0042)
SINGLE*EMP_REGION .0395* (.0084)
.0260* (.0087)
Observations 105,902 105,902 105,902 105,902 Log Likelihood 67,893 68,047 67,948 68,145
Notes:
1) Standard errors are in parentheses. 2) �$
2 statistically significant at p < 0.05 3) Also included are plant characteristics, other agglomeration effects, control variables and
fixed effects. 4) Plants are small if employment is less than 20.
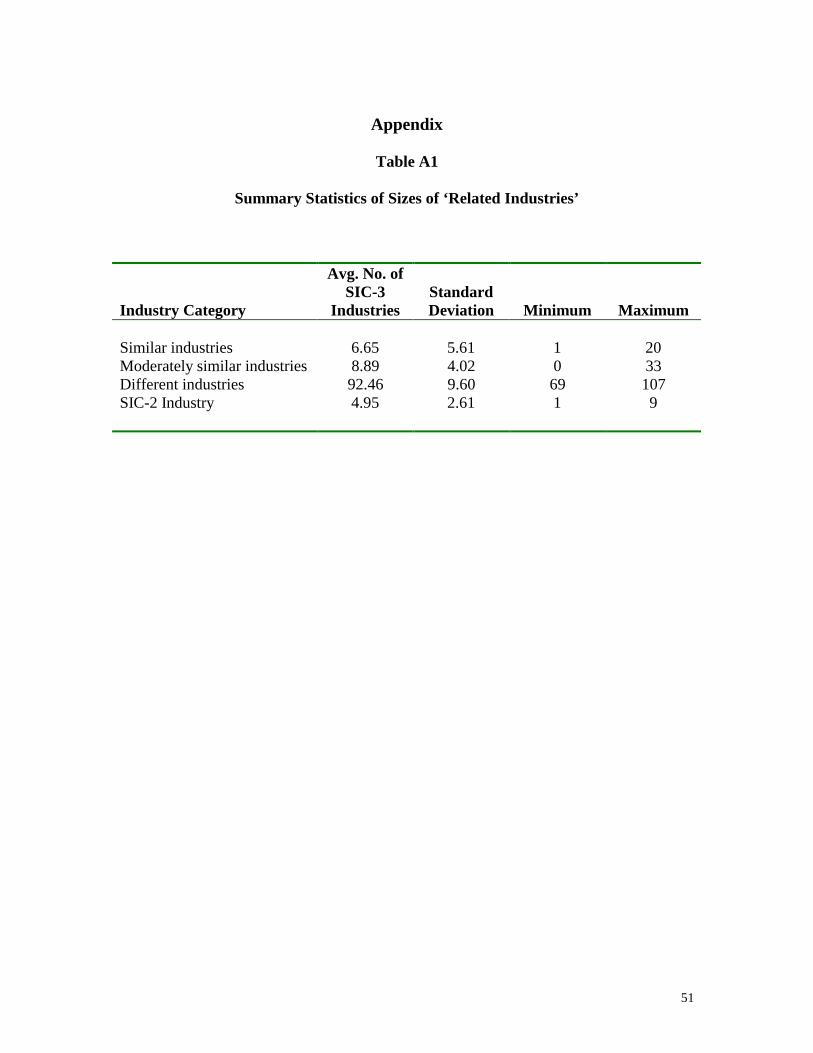
51
Appendix
Table A1
Summary Statistics of Sizes of ‘Related Industries’
Industry Category
Avg. No. of SIC-3
Industries
Standard Deviation
Minimum
Maximum Similar industries 6.65 5.61 1 20 Moderately similar industries 8.89 4.02 0 33 Different industries 92.46 9.60 69 107 SIC-2 Industry 4.95 2.61 1 9
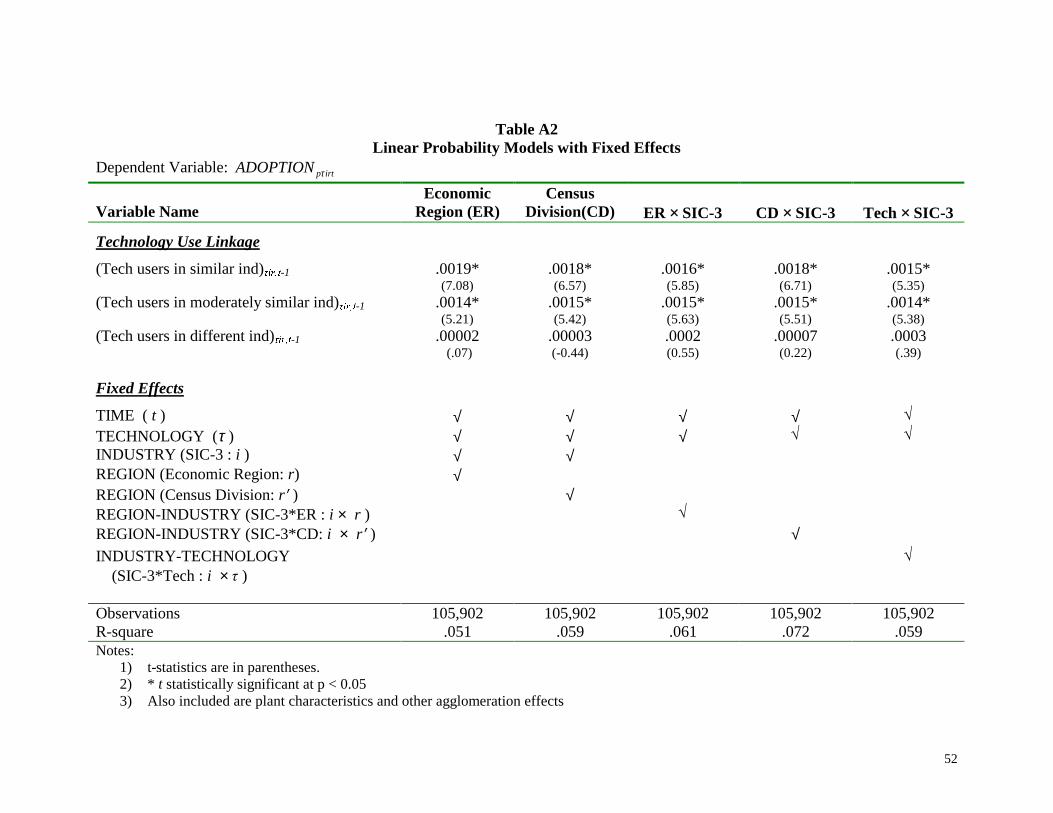
52
Table A2 Linear Probability Models with Fixed Effects
Dependent Variable: p irtADOPTION τ
Variable Name
Economic Region (ER)
Census Division(CD)
ER × SIC-3
CD × SIC-3
Tech × SIC-3
Technology Use Linkage
(Tech users in similar ind)2LU�W-1 .0019* (7.08)
.0018* (6.57)
.0016* (5.85)
.0018* (6.71)
.0015* (5.35)
(Tech users in moderately similar ind)2LU�W-1 .0014* (5.21)
.0015* (5.42)
.0015* (5.63)
.0015* (5.51)
.0014* (5.38)
(Tech users in different ind)2LU�W-1 .00002 (.07)
.00003 (-0.44)
.0002 (0.55)
.00007 (0.22)
.0003 (.39)
Fixed Effects
TIME ( t ) √ √ √ √ ¥ TECHNOLOGY (τ ) √ √ √ ¥ ¥ INDUSTRY (SIC-3 : i ) √ √ REGION (Economic Region: r) √ REGION (Census Division: r′ ) √ REGION-INDUSTRY (SIC-3*ER : i × r ) ¥ REGION-INDUSTRY (SIC-3*CD: i × r′ ) √
INDUSTRY-TECHNOLOGY (SIC-3*Tech : i × 2�)
¥
Observations 105,902 105,902 105,902 105,902 105,902 R-square .051 .059 .061 .072 .059 Notes:
1) t-statistics are in parentheses. 2) * t statistically significant at p < 0.05 3) Also included are plant characteristics and other agglomeration effects