Embed Size (px)
Citation preview

1
• The main agenda is available on University Medical Center of Southern Nevada’s website
http://www.umcsn.com, For copies of agenda items and supporting back-up materials, please contact Terra Lovelin, Board Secretary, at (702) 765-7949. The Strategic Planning Committee may combine two or more agenda items for consideration.
• Items on the agenda may be taken out of order. • The Strategic Planning Committee may remove an item from the agenda or delay discussion relating to an
item at any time. • Consent Agenda - All matters in this sub-category are considered by the Strategic Planning Committee to be
routine and may be acted upon in one motion. Most agenda items are phrased for a positive action. However, the Strategic Planning Committee may take other actions such as hold, table, amend, etc.
• Consent Agenda items are routine and can be taken in one motion unless a Strategic Planning Committee member requests that an item be taken separately. For all items left on the Consent Agenda, the action taken will be staff's recommendation as indicated on the item.
• Items taken separately from the Consent Agenda by Committee members at the meeting will be heard in order.
AGENDA
University Medical Center of Southern Nevada UMC GOVERNING BOARD STRATEGIC PLANNING COMMITTEE
December 6, 2018 9:00 a.m. 800 Hope Place, Las Vegas, Nevada
UMC Trauma Building, ProVidence Suite (5th Floor)
Notice is hereby given that a meeting of the UMC Governing Board Strategic Planning Committee has been called and will be held at the time and location indicated above, to consider the following matters:
SECTION 1. OPENING CEREMONIES
CALL TO ORDER
1. Public Comment
PUBLIC COMMENT. This is a period devoted to comments by the general public about items on this agenda. If you wish to speak to the Committee about items within its jurisdiction but not appearing on this agenda, you must wait until the “Comments by the General Public” period listed at the end of this agenda. Comments will be limited to three minutes. Please step up to the speaker's podium, clearly state your name and address and please spell your last name for the record. If any member of the Committee wishes to extend the length of a presentation, this will be done by the Chair, or the Committee by majority vote.
This meeting has been properly noticed and posted in the following locations: University Medical Center CC Government Center Third Street Building Regional Justice Ctr 1800 W. Charleston Blvd. 500 S. Grand Central Pkwy. 309 S. Third St. 200 Lewis Ave., 1st Fl Las Vegas, NV Las Vegas, NV Las Vegas, NV Las Vegas, NV (Principal Office) City of Las Vegas City of Henderson 400 Stewart Ave. 240 Water St. Las Vegas, NV Henderson, NV
Page 2 of 39

2
2. Approval of minutes of the regular meeting of the UMC Governing Board Strategic Planning Committee meeting on October 11, 2018. (For possible action)
3. Approval of Agenda. (For possible action) SECTION 2. BUSINESS ITEMS
4. Receive a report regarding UMC market share and service line performance; and direct staff accordingly (For possible action)
5. Identify Strategic Planning Committee members to attend Hospital’s service line committees; and direct staff accordingly (For possible action)
6. Receive an update on CEO Objectives for Fiscal Year 2019 as it relates to the Strategic
Planning Committee’s recommendation; and direct staff accordingly (For possible action)
7. Identify emerging issues to be addressed by staff or by the Strategic Planning Committee at future meetings, and direct staff accordingly. (For possible action)
COMMENTS BY THE GENERAL PUBLIC A period devoted to comments by the general public about matters relevant to the Committee’s jurisdiction will be held. No action may be taken on a matter not listed on the posted agenda. Comments will be limited to three minutes. Please step up to the speaker’s podium, clearly state your name and address and please spell your last name for the record.
All comments by speakers should be relevant to the Committee’s action and jurisdiction.
UMC ADMINISTRATION KEEPS THE OFFICIAL RECORD OF ALL PROCEEDINGS OF UMC GOVERNING BOARD STRATEGIC PLANNING COMMITTEE. IN ORDER TO MAINTAIN A COMPLETE AND ACCURATE RECORD OF ALL PROCEEDINGS, ANY PHOTOGRAPH, MAP, CHART, OR ANY OTHER DOCUMENT USED IN ANY PRESENTATION TO THE BOARD SHOULD BE SUBMITTED TO UMC ADMINISTRATION. IF MATERIALS ARE TO BE DISTRIBUTED TO THE COMMITTEE, PLEASE PROVIDE SUFFICIENT COPIES FOR DISTRIBUTION TO UMC ADMINISTRATION.
THE COMMITTEE MEETING ROOM IS ACCESSIBLE TO INDIVIDUALS WITH DISABILITIES. WITH TWENTY-FOUR (24) HOUR ADVANCE REQUEST, A SIGN LANGUAGE INTERPRETER MAY BE MADE AVAILABLE (PHONE: 765-7949).
Page 3 of 39

University Medical Center of Southern Nevada Governing Board Strategic Planning Committee October 11, 2018
______________________________________________________________________________ UMC ProVidence Suite Trauma Building, 5th Floor 800 Hope Place Las Vegas, Clark County, Nevada Thursday, October 11, 2018 9:00 a.m. The University Medical Center Governing Board Strategic Planning Committee met at the time and location listed above. The meeting was called to order at the hour of 9:03 a.m. Chair Hagerty and the following members were present, which constituted a quorum of the members thereof: CALL TO ORDER Board Members:
Present: Harry Hagerty, Chair Robyn Caspersen Renee Franklin Christian Haase Mary Lynn Palenik (Via phone) at 9:30am (left meeting at 10:30) Dr. Mackay Absent:
Also Present: Mason VanHouweling, Chief Executive Officer Tony Marinello, Chief Operating Officer Jennifer Wakem, Chief Financial Officer Danita Cohen, Chief Experience Officer Susan Pitz, General Counsel
Vick Gill, Associate Administrator Kayla Hillegas, Management Analyst Terra Lovelin, Board Secretary
SECTION 1. OPENING CEREMONIES ITEM NO. 1 PUBLIC COMMENT
Chair Hagerty asked if there were any persons present in the audience wishing to be heard on any item on this agenda.
Page 4 of 39

UMC Governing Strategic Planning Committee October 11, 2018 Page 2 of 6 ITEM NO. 2 Approval of minutes of the regular meeting of the UMC Governing Board
Strategic Planning Committee meeting on September 11, 2018. (For possible action)
FINAL ACTION: A motion was made by Member Caspersen approved the minutes be approved as recommended. Motion carried by unanimous vote.
ITEM NO. 3 Approval of Agenda (For possible action)
FINAL ACTION: A motion was made by Dr. Mackay that the agenda be approved as amended. Motion carried by unanimous vote.
SECTION 2. BUSINESS ITEMS
ITEM NO. 4 Receive a report regarding UMC market share and service lines; and direct staff accordingly. (For possible action)
DOCUMENT SUBMITTED: - Service Line Strategic Alignment
DISCUSSION: Mr. VanHouweling reported that Q2 data is out and he will discuss that data today.
With regard to the Inpatient Market Analysis, Chair Hagerty asked if the presentation can include inpatient and outpatient data. Mr. VanHouweling responded that generally one looks at inpatient data only, this includes our competitors. We could do a ratio of inpatient vs outpatient however. Most of UMC’s surgeries are inpatient. Member Caspersen asked if we could look at the layers of revenue and net revenue by service line. The overall market decreased by 1% since last quarter. UMC had the highest volume growth in the market. Sunrise and Summerlin had the largest market share for Q2. Commercial payers were up 3%, Medicare was up 3%, and 5% growth with Medicaid population. The senior population has been a focus for Danita Cohen’s team and this payor mix has increased. Deb Fox and her team have done a great job of improving throughput to accommodate the volumes. Member Haase asked how UMC reconciles the mission with being a safety net hospital with payor mix.
Page 5 of 39
UMC Governing Strategic Planning Committee October 11, 2018 Page 3 of 6
Mr. VanHouweling replied that we have tried to link the patients who use the emergency room as their primary care, with a primary care physician. We also try to reduce the readmissions coming in. UMC has one of the best readmission rates in the valley. Member Caspersen asked how much of the strategy and results are driven from the physician and how much from the patients putting pressure on the physicians to go to UMC? A discussion ensued about direct marketing and advertising to get patients to UMC. Service line focus is on cardiology, orthopedics, general surgery, pediatrics and ambulatory. Chair Hagerty asked if the committee was in agreement that these are the five to focus on moving forward. Dr. Mackay suggested that perhaps we replace pediatrics with cancer care. Mr. Gill replied that we can look into that as oncology is a large driver. Chair Hagerty suggested moving forward with these five and perhaps adding the sixth as oncology. He doesn’t want to drop pediatrics due to the community and County support. Member Caspersen and Member Haase commented that they don’t want to make a decision based on unknown profitability. Chair Hagerty commented that we are just looking at these five or six areas based on five plus years from now and what it takes to make a hospital profitable. We are not committing significant amounts of dollars to these areas until we know more. Service line committees were discussed in response to Chair Hagerty’s question about who is in charge of the overall plan in each of these 5 or 6 specialties. Chair Hagerty asked if it would be helpful if each committee member participated on each service line committee that was previously mentioned. He asked each member to email him their preference.
FINAL ACTION TAKEN: None taken
ITEM NO. 5 Receive an update on UMC and UNLV School of Medicine strategic alignment; and direct staff accordingly. (For possible action)
DOCUMENT SUBMITTED:
Page 6 of 39

UMC Governing Strategic Planning Committee October 11, 2018 Page 4 of 6
- UNLV Medicine Strategic Alignment DISCUSSION: Vick Gill, Associate Administrator presented the strategic alignment between UMC and UNLV. UMC is engaged with UNLV on their vision and mission. The organizational structure was discussed; led by Founding Dean Barbara Atkinson, followed by Vice Dean Ellen Cosgrove, Vice Dean Michael Gardner, and Vice Dean Parvesh Kumar. UNLV Stats: 143 Physicians 66 SOM administrative staff 369 UNLV Med employees 278 Residents 35 Fellows 58 Medical students 2nd year 60 Medical students 1st year Total: 1,009 UNLV’s finances including budget and revenue were highlighted, including $3.7 million in support from UMC. UNLV recently hired Department Chairs in Internal Medicine, OB/Gyn and Chief of Gastroenterology. Physicians in many specialties were also hired and are recruiting in the fields of Gastroenterology, Ob/Gyn, Neurology, Psychiatry, along with a few others. UMC and UNLV are working on developing formal Centers of Excellence. The operations side was discussed and a few services were listed as not being currently provided by UNLV including Cardiology, Gastroenterology, Orthopedics and Emergency Medicine. UMC hopes to have future hybrid locations with both UMC and UNLV physicians and dedicated UNLV surgical block time for better utilization and increased hospital efficiency. On the academic side, UMC approved the creation of two new programs in critical care Medicine and Pediatric Medicine. OB/Gyn was expanded last year as well as Psychiatry programs. There is a plan to renovate the 2040 building to dedicate to the GME program. There are 10 current UNLV research studies at UMC. UMC recently hired a CME coordinator to allow UNLV to distribute continuing medical education credits at educational events.
Work is continuing on the Master Affiliation Agreement with monthly leadership meetings, subcommittee meetings and help of Counsel on both sides.
Page 7 of 39

UMC Governing Strategic Planning Committee October 11, 2018 Page 5 of 6
FINAL ACTION: Keep reporting on this on a regular basis.
ITEM NO. 6 Provide a final set of objectives for the CEO for recommendation to the full Governing Board for approval for fiscal 2019, and direct staff accordingly. (For possible action)
DOCUMENT SUBMITTED: - CEO Goals Summary DISCUSSION: Chair Hagerty brought up the main topics he believes should be focused on. 1. He would hike to see a strategic plan 10 years out for each of the five or six
focused areas and all of them wrapped up as a whole. - He would like to see words and numbers, including profits, loss, capital, etc. so they have a financial road map to measure themselves.
2. Continuation of a final Master Affiliation Agreement
3. Position UMC as a strategic and active leader in the development of the LVMD.
4. Develop joint branding support between UMC and UNLV SOM. Member Franklin agreed with Chair Hagerty and added that when we evaluate the achievement of these objectives at the end of the year, we understand that Mason can achieve 100% of the goal without things being perfect.
General Counsel Susan Pitz suggested not adding percentages to each goal. Member Caspersen asked how we have this plan for five focus areas when we don’t have it for the hospital as a whole. Chair Hagerty suggested if we roll out the plan for the top 5 or 6 service lines and we like it, let’s then roll it out for the hospital. Member Franklin suggested looking at the framework for each one but she also doesn’t think we can do it for 6 goals as that would be a huge task.
FINAL ACTION: A motion was made by Member Caspersen to recommend the above discussed FY2019 Goals to the HR Committee for approval. Motion carried by unanimous vote.
A motion was made my Member Franklin to recommend that the percentage of goals be increased to 30% for the Strategic Planning Committee. Motion carried by unanimous vote.
Page 8 of 39

UMC Governing Strategic Planning Committee October 11, 2018 Page 6 of 6
ITEM NO. 7 Identify emerging issues to be addressed by staff or by the Strategic Planning Committee at future meetings, and direct staff accordingly. (For possible action)
None COMMENTS BY THE GENERAL PUBLIC:
At this time, Chair Hagerty asked if there were any persons present in the audience
wishing to be heard on any items not listed on the posted agenda. SPEAKER(S): None There being no further business to come before the Board at this time, at the hour of 11:10 a.m. Chair Hagerty adjourned the meeting.
APPROVED: MINUTES PREPARED BY: Terra Lovelin
Page 9 of 39

Strategic Planning Committee
December Meeting
10/6/2018Page 10 of 39

Population Projection by Age
GROWING PATIENT NEEDS IN COUNTY
Projected population growth drives demand for more beds:
• 10 Year: +166,434 people (+7.7%) need 662 more market beds
• 20 Year: +337,681 people (+15.7%) need 1,217 more market beds
Slide 2
570,000
575,000
580,000
585,000
590,000
595,000
600,000
605,000
PEDIATRICS
1,200,000
1,250,000
1,300,000
1,350,000
1,400,000
1,450,000
ADULTS
0
50,000
100,000
150,000
200,000
250,000
300,000
350,000
400,000
450,000
SENIORS10.6% Growth 59.9% Growth7.0% Growth
Page 11 of 39

Las Vegas Acute Care Hospitals Locations
PSA
UMC 123456
VALLEYNORTH VISTA
MOUNTAINVIEWSUNRISEDESERT SPRINGS
SPRING VALLEY
SSA
78910
11 SUMMERLINCENTENNIAL
HENDERSON
ST. ROSE-SAN MARTIN
SOUTHERN HILLS2
3
4
5
6
9
1011
7
8
9
10
12
12
11
13
13 ST. ROSE-SIENNA
14
14 ST. ROSE- DE LIMA
Page 12 of 39
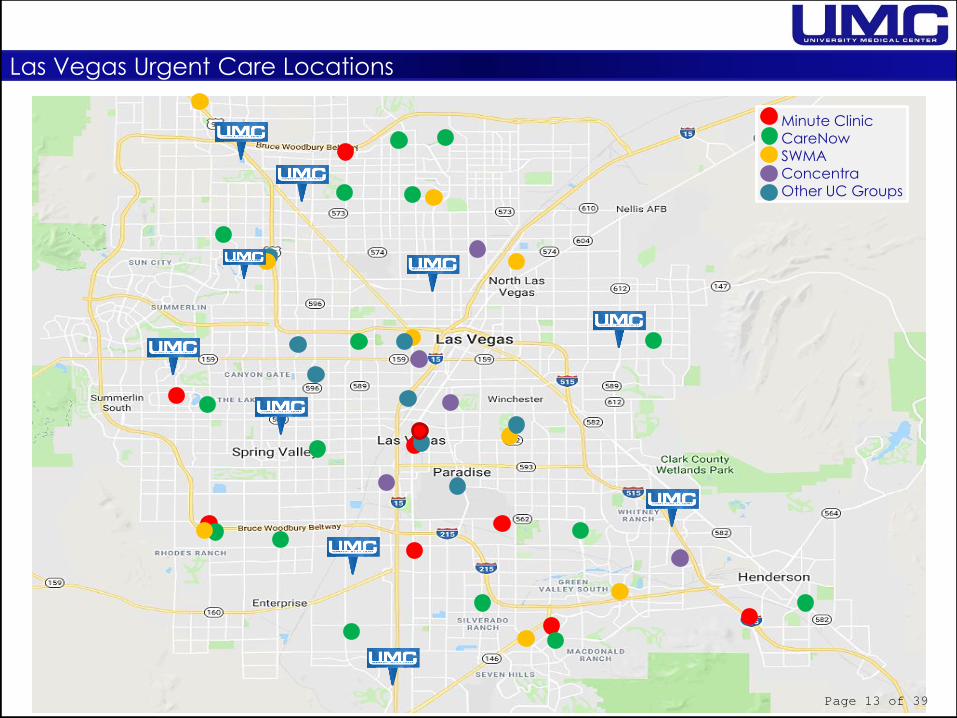
Las Vegas Urgent Care Locations
Minute ClinicCareNowSWMAConcentraOther UC Groups
Page 13 of 39
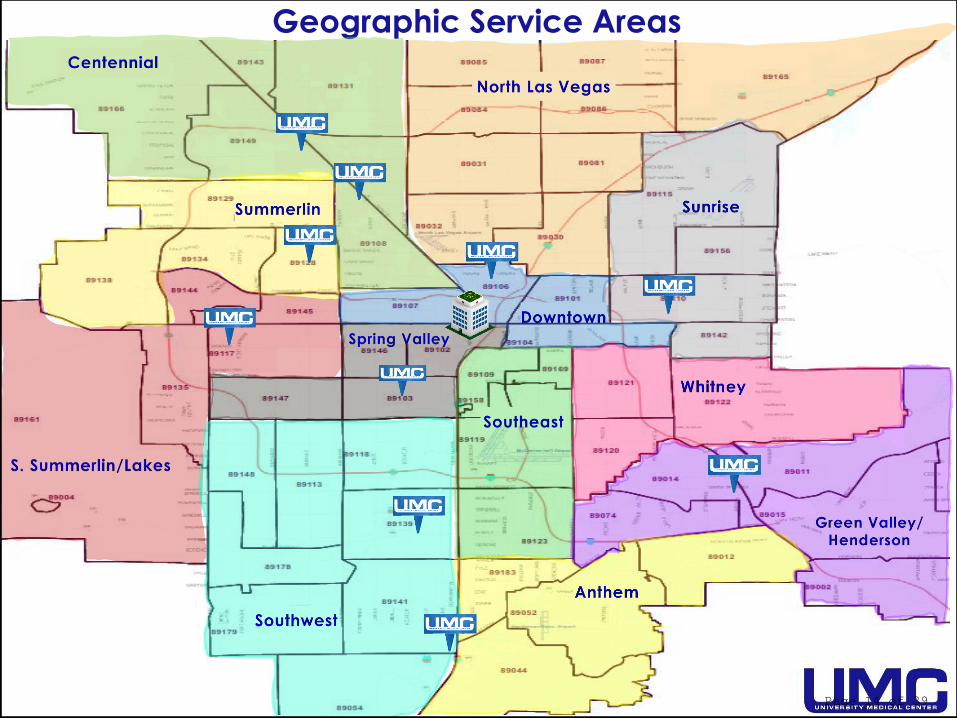
Geographic Service Areas
Page 14 of 39

CENTENNIAL
Age Distribution
2018%
Total2023
%
Total
%
Change
Age 0-19 64,326 27.6% 71,343 27.6% 11%
Age 20-59 127,845 54.8% 139,050 53.9% 9%
Age 60-85+ 41,125 17.6% 48,128 18.6% 17%
Total 233,296 100% 258,521 100% 10.8%
Gender Distribution
2018 2023%
Change
Male 115,066 127,253 10.6%
Female 118,230 131,268 11.0%
Female Child Bearing (15 – 44) 49,210 55,460 12.7%
Male Median Age 34.8 34.7 -0.3%
Female Median Age 37.0 35.1 -5.1%
Household Income
2018 % Total 2023 % Total%
Change
<$15,000 5,930 7.3% 5,109 5.7% -13.8%
$15,000 - $24,999 5,878 7.2% 5,336 6.0% -9.2%
$25,000 - $34,999 6,932 8.5% 6,657 7.4% -4.0%
$35,000 - $49,999 10,261 12.6% 10,018 11.2% -2.4%
$50,000 - $99,999 28,896 35.5% 31,754 35.4% 9.9%
Over $100,000 23,396 28.8% 30,767 34.3% 31.5%
Total 81,293 100.0% 89,641 100.0% 10.3%
Population
2018 2023
Total Population 233,296 258,521
Average Household Income $83,193 $95,265
Slide 6
Payor Mix
Medicare 33%
Medicaid 26%
Commercial 34%
Other 6%
Page 15 of 39

NORTH LAS VEGAS
Age Distribution
2018%
Total2023
%
Total
%
Change
Age 0-19 75,911 31.3% 83,194 31.7% 10%
Age 20-59 131,656 54.7% 141,906 54.3% 8%
Age 60-85+ 32,956 13.7% 36,737 14% 11.5%
Total 240,523 100% 261,837 100% 8.9%
Gender Distribution
2018 2023%
Change
Male 119,780 130,266 8.8%
Female 120,743 131,544 8.9%
Female Child Bearing (15 – 44) 53,831 59,793 11.1%
Male Median Age 31.7 29.4 -7.4%
Female Median Age 31.8 31.7 -0.3%
Household Income
2018 % Total 2023 % Total%
Change
<$15,000 6,494 9.0% 5,605 7.2% -13.7%
$15,000 - $24,999 6,077 8.4% 5,564 7.1% -8.4%
$25,000 - $34,999 7,562 10.5% 7,229 9.2% -4.4%
$35,000 - $49,999 10,390 14.4% 10,061 12.9% -3.2%
$50,000 - $99,999 25,947 36.0% 28,414 36.3% 9.5%
Over $100,000 15,675 21.7% 21,309 27.3% 35.9%
Total 72,145 100.0% 78,182 100.0% 8.4%Slide 7
Population
2018 2023
Total Population 240,523 261,810
Average Household Income $70,159 $81,153
Payor Mix
Medicare 31%
Medicaid 37%
Commercial 25%
Other 7%
Page 16 of 39

SUNRISE
Age Distribution
2018%
Total2023
%
Total
%
Change
Age 0-19 66,733 32.5% 70,528 32.1% 6%
Age 20-59 111,015 54.1% 117,042 53.3% 5%
Age 60-85+ 27,420 13.4% 32,110 14.5% 17.1%
Total 205,168 100% 219,680 100% 7.1%
Gender Distribution
2018 2023%
Change
Male 102,641 110,053 7.2%
Female 102,530 109,627 6.9%
Female Child Bearing (15 – 44) 45,406 48,359 6.5%
Male Median Age 30.7 32.1 4.6%
Female Median Age 32.2 33.6 4.2%
Household Income
2018 % Total 2023 % Total%
Change
<$15,000 6,485 10.8% 5,501 8.6% -15.2%
$15,000 - $24,999 7,375 12.2% 6,726 10.5% -8.8%
$25,000 - $34,999 8,128 13.5% 7,908 12.3% -2.7%
$35,000 - $49,999 10,405 17.3% 10,419 16.3% 0.1%
$50,000 - $99,999 18,864 31.3% 21,476 33.5% 13.8%
Over $100,000 8,960 14.9% 12,007 18.8% 34.0%
Total 60,217 100.0% 64,037 100.0% 6.3%
Population
2018 2023
Total Population 205,171 219,680
Average Household Income $59,256 $83,520
Slide 8
Payor Mix
Medicare 26%
Medicaid 44%
Commercial 23%
Other 7%Page 17 of 39

DOWNTOWN
Age Distribution
2018%
Total2023
%
Total
%
Change
Age 0-19 43,241 27% 45,052 27.1% 4%
Age 20-59 85,191 54% 87,762 52.6% 3%
Age 60-85+ 29,183 19% 33,665 20.2% 15.4%
Total 157,615 100% 166,479 100% 5.6%
Gender Distribution
2018 2023%
Change
Male 84,149 88,711 5.4%
Female 73,466 77,768 5.9%
Female Child Bearing (15 – 44) 29,840 31,428 5.3%
Male Median Age 34.5 35.3 2.3%
Female Median Age 35.2 34.0 -3.3%
Household Income
2018 % Total 2023 % Total%
Change
<$15,000 10,754 21.0% 9,672 17.9% -10.1%
$15,000 - $24,999 8,550 16.7% 8,302 15.4% -2.9%
$25,000 - $34,999 7,344 14.3% 7,487 13.9% 1.9%
$35,000 - $49,999 7,741 15.1% 8,086 15.0% 4.5%
$50,000 - $99,999 12,267 24.0% 14,325 26.5% 16.8%
Over $100,000 4,539 8.9% 6,167 11.4% 35.9%
Total 51,195 100.0% 54,039 100.0% 5.6%
Population
2018 2023
Total Population 157,615 166,479
Average Household Income $46,316 $53,489
Slide 9
Payor Mix
Medicare 34%
Medicaid 46%
Commercial 14%
Other 6%
Page 18 of 39

SUMMERLIN
Age Distribution
2018%
Total2023
%
Total
%
Change
Age 0-19 30,583 22.7% 31,958 22.2% 4%
Age 20-59 68,370 50.7% 71,373 49.6% 4%
Age 60-85+ 35,808 26.6% 40,961 28.3% 14.4%
Total 134,761 100% 219,680 100% 7.1%
Gender Distribution
2018 2023%
Change
Male 64,973 69,666 7.2%
Female 69,788 74,626 6.9%
Female Child Bearing (15 – 44) 24,902 26,729 7.3%
Male Median Age 37.5 37.7 0.4%
Female Median Age 40.2 40.6 1.0%
Household Income
2018 % Total 2023 % Total%
Change
<$15,000 3,764 7.1% 3,155 5.6% -16.2%
$15,000 - $24,999 4,204 7.9% 3,736 6.6% -11.1%
$25,000 - $34,999 5,107 9.6% 4,759 8.5% -6.8%
$35,000 - $49,999 6,364 12.0% 6,029 10.7% -5.3%
$50,000 - $99,999 17,065 32.2% 18,353 32.6% 7.5%
Over $100,000 16,457 31.1% 20,244 36.0% 23.0%
Total 52,961 100.0% 56,276 100.0% 6.3%
Population
2018 2023
Total Population 134,761 144,292
Average Household Income $89,008 $100,413
Slide 10
Payor Mix
Medicare 49%
Medicaid 17%
Commercial 29%
Other 5%
Page 19 of 39
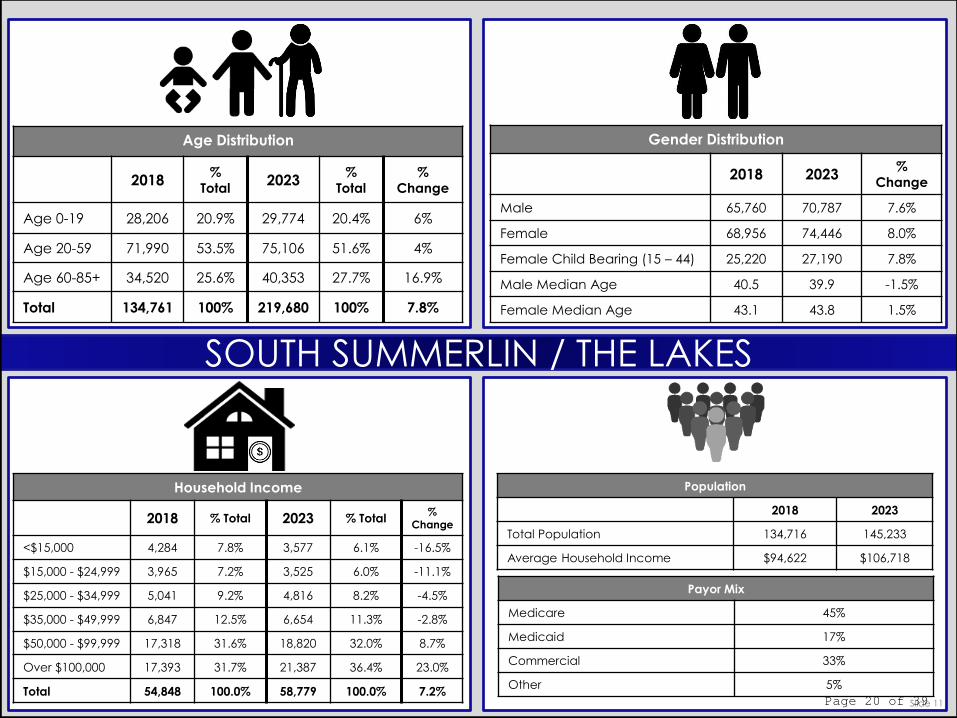
SOUTH SUMMERLIN / THE LAKES
Age Distribution
2018%
Total2023
%
Total
%
Change
Age 0-19 28,206 20.9% 29,774 20.4% 6%
Age 20-59 71,990 53.5% 75,106 51.6% 4%
Age 60-85+ 34,520 25.6% 40,353 27.7% 16.9%
Total 134,761 100% 219,680 100% 7.8%
Gender Distribution
2018 2023%
Change
Male 65,760 70,787 7.6%
Female 68,956 74,446 8.0%
Female Child Bearing (15 – 44) 25,220 27,190 7.8%
Male Median Age 40.5 39.9 -1.5%
Female Median Age 43.1 43.8 1.5%
Household Income
2018 % Total 2023 % Total%
Change
<$15,000 4,284 7.8% 3,577 6.1% -16.5%
$15,000 - $24,999 3,965 7.2% 3,525 6.0% -11.1%
$25,000 - $34,999 5,041 9.2% 4,816 8.2% -4.5%
$35,000 - $49,999 6,847 12.5% 6,654 11.3% -2.8%
$50,000 - $99,999 17,318 31.6% 18,820 32.0% 8.7%
Over $100,000 17,393 31.7% 21,387 36.4% 23.0%
Total 54,848 100.0% 58,779 100.0% 7.2%
Population
2018 2023
Total Population 134,716 145,233
Average Household Income $94,622 $106,718
Slide 11
Payor Mix
Medicare 45%
Medicaid 17%
Commercial 33%
Other 5%
Page 20 of 39

SPRING VALLEY
Age Distribution
2018%
Total2023
%
Total
%
Change
Age 0-19 36,022 22.1% 38,321 22% 6%
Age 20-59 89,615 55.1% 92,762 53.3% 4%
Age 60-85+ 37,074 22.8% 42,803 24.7% 15.5%
Total 162,711 100% 173,886 100% 6.9%
Gender Distribution
2018 2023%
Change
Male 82,542 87,833 6.4%
Female 80,169 86,053 7.3%
Female Child Bearing (15 – 44) 31,860 33,890 6.4%
Male Median Age 38.4 38.8 1.0%
Female Median Age 40.4 40.7 0.6%
Household Income
2018 % Total 2023 % Total%
Change
<$15,000 7,603 11.9% 6,528 9.6% -14.1%
$15,000 - $24,999 7,865 12.4% 7,278 10.7% -7.5%
$25,000 - $34,999 8,916 14.0% 8,745 12.9% -1.9%
$35,000 - $49,999 10,460 16.4% 10,621 15.7% 1.5%
$50,000 - $99,999 19,003 29.9% 21,731 32.1% 14.4%
Over $100,000 9,787 15.4% 12,860 19.0% 31.4%
Total 63,634 100.0% 67,763 100.0% 6.5%
Population
2018 2023
Total Population 162,711 173,886
Average Household Income $60,820 $69,921
Slide 12
Payor Mix
Medicare 36%
Medicaid 32%
Commercial 26%
Other 6%
Page 21 of 39

SOUTHWEST
Age Distribution
2018%
Total2023
%
Total
%
Change
Age 0-19 61,597 26.4% 74,575 27.5% 21%
Age 20-59 140,957 60.3% 160,856 59.4% 14%
Age 60-85+ 31,199 13.3% 35,363 12.9% 13.3%
Total 233,753 100% 270,794 100% 15.8%
Gender Distribution
2018 2023%
Change
Male 116,435 134,113 15.2%
Female 117,318 136,681 16.5%
Female Child Bearing (15 – 44) 55,963 66,191 18.3%
Male Median Age 34.5 35.6 3.2%
Female Median Age 34.7 34.1 -1.9%
Household Income
2018 % Total 2023 % Total%
Change
<$15,000 5,145 6.1% 4,593 4.7% -10.7%
$15,000 - $24,999 4,666 5.5% 4,303 4.4% -7.8%
$25,000 - $34,999 6,966 8.3% 6,708 6.9% -3.7%
$35,000 - $49,999 10,882 12.9% 10,670 11.0% -1.9%
$50,000 - $99,999 30,079 35.7% 33,854 35.0% 12.6%
Over $100,000 26,620 31.6% 36,677 37.9% 37.8%
Total 84,358 100.0% 96,805 100.0% 14.8%
Population
2018 2023
Total Population 233,753 270,794
Average Household Income $89,221 $102,948
Slide 13
Payor Mix
Medicare 23%
Medicaid 22%
Commercial 49%
Other 6%
Page 22 of 39

SOUTHEAST
Age Distribution
2018%
Total2023
%
Total
%
Change
Age 0-19 31,321 21.7% 33,120 12.6% 6%
Age 20-59 83,250 57.7% 85,915 56.3% 3%
Age 60-85+ 29,300 20.4% 34,026 22.2% 16.1%
Total 162,711 100% 173,886 100% 6.4%
Gender Distribution
2018 2023%
Change
Male 75,050 79,393 5.8%
Female 68,821 73,668 7.0%
Female Child Bearing (15 – 44) 29,593 31,504 6.5%
Male Median Age 38.1 38.7 1.6%
Female Median Age 34.9 37.8 8.3%
Household Income
2018 % Total 2023 % Total%
Change
<$15,000 8,354 11.9% 7,169 11.2% -14.2%
$15,000 - $24,999 7,419 12.3% 6,978 10.9% -5.9%
$25,000 - $34,999 7,868 13.1% 7,979 12.5% 1.4%
$35,000 - $49,999 9,189 15.3% 9,514 14.9% 3.5%
$50,000 - $99,999 18,020 30.0% 20,286 31.8% 12.6%
Over $100,000 9,265 15.4% 11,848 18.6% 27.9%
Total 60,115 100.0% 63,774 100.0% 6.1%
Population
2018 2023
Total Population 143,871 153,061
Average Household Income $60,513 $69,131
Slide 14
Payor Mix
Medicare 31%
Medicaid 37%
Commercial 25%
Other 7%
Page 23 of 39

WHITNEY
Age Distribution
2018%
Total2023
%
Total
%
Change
Age 0-19 33,380 23.2% 36,207 23.5% 8%
Age 20-59 74,882 51.8% 77,578 50.3% 4%
Age 60-85+ 35,401 24.6% 40,275 26.1% 13.8%
Total 143,663 100% 154,060 100% 7.2%
Gender Distribution
2018 2023%
Change
Male 71,298 76,433 7.2%
Female 72,365 77,627 7.3%
Female Child Bearing (15 – 44) 27,401 29,330 7.0%
Male Median Age 39.6 40.1 1.3%
Female Median Age 41.0 41.5 1.2%
Household Income
2018 % Total 2023 % Total%
Change
<$15,000 6,501 11.9% 5,613 9.6% -13.7%
$15,000 - $24,999 6,791 12.4% 6,270 10.8% -7.7%
$25,000 - $34,999 7,538 13.8% 7,471 12.8% -0.9%
$35,000 - $49,999 9,202 16.8% 9,301 16.0% 1.1%
$50,000 - $99,999 17,087 31.2% 19,413 33.4% 13.6%
Over $100,000 7,571 13.8% 10,100 17.4% 33.4%
Total 54,690 100.0% 58,168 100.0% 6.4%
Population
2018 2023
Total Population 143,663 154,060
Average Household Income $59,227 $68,204
Slide 15
Payor Mix
Medicare 38%
Medicaid 32%
Commercial 24%
Other 6%
Page 24 of 39

ANTHEM
Age Distribution
2018%
Total2023
%
Total
%
Change
Age 0-19 35,176 22.9% 39,059 22.7% 11%
Age 20-59 79,486 51.8% 87,610 50.9% 10%
Age 60-85+ 38,939 25.4% 45,873 26.5% 17.8%
Total 153,601 100% 172,542 100% 7.2%
Gender Distribution
2018 2023%
Change
Male 75,091 84,289 12.2%
Female 78,510 88,253 12.4%
Female Child Bearing (15 – 44) 29,720 33,516 12.8%
Male Median Age 42.5 42.4 -0.4%
Female Median Age 44.1 44.6 1.1%
Household Income
2018 % Total 2023 % Total%
Change
<$15,000 3,986 6.6% 3,437 5.1% -13.8%
$15,000 - $24,999 4,062 6.7% 3,738 5.6% -8.0%
$25,000 - $34,999 4,807 8.0% 4,508 6.7% -6.2%
$35,000 - $49,999 6,722 11.2% 6,527 9.7% -2.9%
$50,000 - $99,999 20,090 33.4% 22,280 33.2% 10.9%
Over $100,000 20,564 34.1% 26,531 39.6% 29.0%
Total 60,231 100.0% 67,021 100.0% 6.4%
Population
2018 2023
Total Population 153,601 172,542
Average Household Income $95,828 $108,249
Slide 16
Payor Mix
Medicare 32%
Medicaid 15%
Commercial 49%
Other 4%
Page 25 of 39

GREEN VALLEY
Age Distribution
2018%
Total2023
%
Total
%
Change
Age 0-19 47,385 23.9% 51,408 23.7% 8%
Age 20-59 109,016 54.8% 115,296 53.2% 6%
Age 60-85+ 42,385 21.3% 49,922 23.2% 17.8%
Total 198,786 100% 216,626 100% 9%
Gender Distribution
2018 2023%
Change
Male 98,131 106,948 9.0%
Female 100,655 109,678 9.0%
Female Child Bearing (15 – 44) 40,197 43,815 9.0%
Male Median Age 36.7 36.3 -1.1%
Female Median Age 37.6 37.9 0.8%
Household Income
2018 % Total 2023 % Total%
Change
<$15,000 6,282 8.5% 5,403 6.7% -14.0%
$15,000 - $24,999 5,695 7.7% 5,145 6.4% -9.7%
$25,000 - $34,999 6,688 9.0% 6,409 8.0% -4.2%
$35,000 - $49,999 10,198 13.7% 10,033 12.5% -1.6%
$50,000 - $99,999 26,017 35.0% 28,679 35.6% 10.2%
Over $100,000 19,386 26.1% 24,846 30.9% 28.2%
Total 74,266 100.0% 80,515 100.0% 8.4%
Population
2018 2023
Total Population 198,786 216,626
Average Household Income $80,474 $91,627
Slide 17
Payor Mix
Medicare 31%
Medicaid 20%
Commercial 44%
Other 5%
Page 26 of 39
Summary
Page 27 of 39

Q2 2018 MARKET ANALYSIS
Market Share
13%
13%
11%
11%10%
7%
6%
6%
5%
5%
5%
4%2%
Q2 2018 Inpatient & Outpatient
Market Share (Volume)
Sunrise
Summerlin
UMC
Mountain View
Saint Rose - Siena
Centennial Hills
Spring Valley
Valley
Desert Springs
Southern Hills
Saint Rose -San Martin
Henderson
North Vista
Saint Rose - De Lima
9.9% 10.2% 10.2%
11.8%
10.0%
12%
13%
9%
8%
11%
Q2 2017 Q3 2017 Q4 2017 Q1 2018 Q2 2018
Quarter Comparison
Inpatient Outpatient
Slide 19 Source: Intellimed Page 28 of 39

Trended Inpatient Volumes
General Surgery
144 144 137
144
162
153
170
184 177
141 133
Dec-17 Jan-18 Feb-18 Mar-18 Apr-18 May-18 Jun-18 Jul-18 Aug-18 Sep-18 Oct-18
Trending Inpatient Volumes by Month (Cases)
Source: EPIC Slide 20 Page 29 of 39

Trended Inpatient Volumes
Orthopedics
310 314
250
282 289
313 299
290
259
227
245
Dec-17 Jan-18 Feb-18 Mar-18 Apr-18 May-18 Jun-18 Jul-18 Aug-18 Sep-18 Oct-18
Trending Inpatient Volumes by Month (Cases)
Source: EPIC Slide 21 Page 30 of 39

Trended Inpatient Volumes
Cardiovascular Services
74
78
66
80
86 86
73
79
72
84
74
Dec-17 Jan-18 Feb-18 Mar-18 Apr-18 May-18 Jun-18 Jul-18 Aug-18 Sep-18 Oct-18
Trending Inpatient Volumes by Month (Cases)
Source: EPIC Slide 22 Page 31 of 39

2018 Trended Volumes
Pediatrics
430 400 415 371 395 358 402358 395 411 374 354
2,758
3,237
3,6153,519
3,383
2,999 3,019
2,338
2,094
2,525 2,523
2,829
Nov-17 Dec-17 Jan-18 Feb-18 Mar-18 Apr-18 May-18 Jun-18 Jul-18 Aug-18 Sep-18 Oct-18
Trending Volumes by Month
Inpatient Outpatient
Source: EPIC Slide 23 Page 32 of 39

Trended Volumes
Ambulatory
13,524
16,094
18,101
14,318
16,388
14,79714,014
12,514 12,127
13,30912,917
13,904
4,6873,810
4,720 4,574 4,9395,074 5,237 5,070
4,064
5,612
4,636
5,970
Nov-17 Dec-17 Jan-18 Feb-18 Mar-18 Apr-18 May-18 Jun-18 Jul-18 Aug-18 Sep-18 Oct-18
Trending Ambulatory Volumes by Month
Quick Care Primary Care
Source: EPIC Slide 24 Page 33 of 39

Service Line Committees
Slide 25
Cardiology Orthopedics
Pediatrics General Surgery
Ambulatory
Governing Board
Page 34 of 39
FY 19 CEO Performance
Objectives
10/6/2018Page 35 of 39

CEO Performance Objective #1
Slide 2
• 2017 Market Charges
• UMC total $448.5M
• Assumption of 18%
• UMC total $80.7M
Develop a 10-year Strategic Plan for UMC addressing short and long terms
goals in identified service lines (Cardiology, Orthopedics, General Surgery,
Pediatrics, Oncology and Ambulatory) including but not limited to addressing
strategic priorities, resources required (personnel and capital) and operational
and financial metrics and projections.
“Governance’s role in strategic planning is to assure that management
prepares and follows a strategic plan that the board understands, supports,
and will fund.”
Schedule a strategy board retreat to answer the following questions:
1. What business are we—and do we want to be in?
2. What should our balance sheet look like?
3. Who is our talent?
4. What reputation do we want?
5. What results do we want?
6. How much change do you really want?
FY 19 Strategic Planning Committee
Source: Becker's Hospital ReviewPage 36 of 39

FY 19 Strategic Planning Committee
CEO Performance Objective #2
Slide 3
• 2017 Market Charges
• UMC total $448.5M
• Assumption of 18%
• UMC total $80.7M
Position UMC as a strategic and active leader in the development of the
Las Vegas Medical District
• UMC is an active participant on several Medical District committees
• Las Vegas Medical District Planning Committee
• The Committee’s overall goal is to get input and consensus on common areas, pedestrian walkways, pocket parks, signage, street redesign, parking initiatives, etc., within the LVMD. Other issues, such as changes to zoning regulations, arise and are discussed as needed. This committee meets every other month, and while it is not a formal committee, members from Valley, UMC, UNLV SOM, and other businesses within the LVMD attend.
• Las Vegas Medical District Safety and Security Meeting• This committee meets quarterly and addresses public safety in the LVMD
• Las Vegas Medical District’s Public Relations & Marketing Committee• This committee meets quarterly and works collaboratively to develop advertising
campaigns, newsletters, events and media opportunities to promote the LVMD.• The committee recently developed a multiplatform advertising campaign that shares
patient success stories from organizations within the LVMD, including UMC. • In February, the LVMD will hosts its annual Town Hall event at City Hall, featuring speakers
from UMC, Valley Hospital and other organizations within the LVMD.
• Las Vegas Development Corporation• Recently the LVMD has put together a group consisting of UMC, Valley, UNLV and City representatives to work on the development of a formal organization, such as an LVMD Association for future development of the District. JABarrett Company has been engaged for a year to lead this effort. Meetings are to be held monthly. Page 37 of 39

CEO Performance Objective #3
Slide 4
• 2017 Market Charges
• UMC total $448.5M
Execute a Master Affiliation Agreement with the UNLV School of
Medicine by June 30, 2019
• Conducting regular leadership meetings to develop the Master Affiliation Agreement
• Entered into Third Amendment to the Preliminary Affiliation Agreement which set the
residency and academic mission support for academic year 2018-2019
• The term of the Preliminary Affiliation Agreement is the earlier of June 2026 or when
both parties execute a Master Affiliation Agreement
• Amended professional service agreements with UNLV Medicine to include appropriate
clinical services
• Continue expansion of GME program offerings including Pediatric Emergency Medicine,
Critical Care Fellowships, and other programs
• Continuing ongoing implementation of EPIC with UNLV Medicine clinics
• UMC Administration meets regularly with UNLV School of Medicine leadership
• UMC/UNLV SOM Leadership Committee, and a series of sub-committees including:
Research, EPIC, Marketing, Finance and Business Strategies, as well as regular
meetings to support development of Graduate Medical Education and facilities.
FY 19 Strategic Planning Committee
Page 38 of 39

CEO Performance Objective #4
Slide 5
• 2017 Market Charges
• UMC total $448.5M
Develop joint branding between UMC and UNLV School of Medicine and a plan
to promote the partnership to the community
• UMC has presented UNLV with two branding and marketing campaigns through B&P
Advertising for their consideration
• Mason will be meeting with the Dean regarding challenges in co-branding
expectations and planning
FY 19 Strategic Planning Committee
Page 39 of 39