Embed Size (px)
Citation preview
AGENDA for 01/07/14
• AGENDA:
1. 2.3.2: Diabetic Emergency!
• Blood Glucose Effects on Simulated Cellular Models
• Egg Demo – Day 2
• OBJECTIVES:
1. Design an experiment to
simulate osmosis in body
cells
2. Relate the movement of
water in model cells to the
symptoms that Anna
experienced
• HOMEWORK:
• Due Thurs, 01-09
1. 2.3.2 Activity Packet
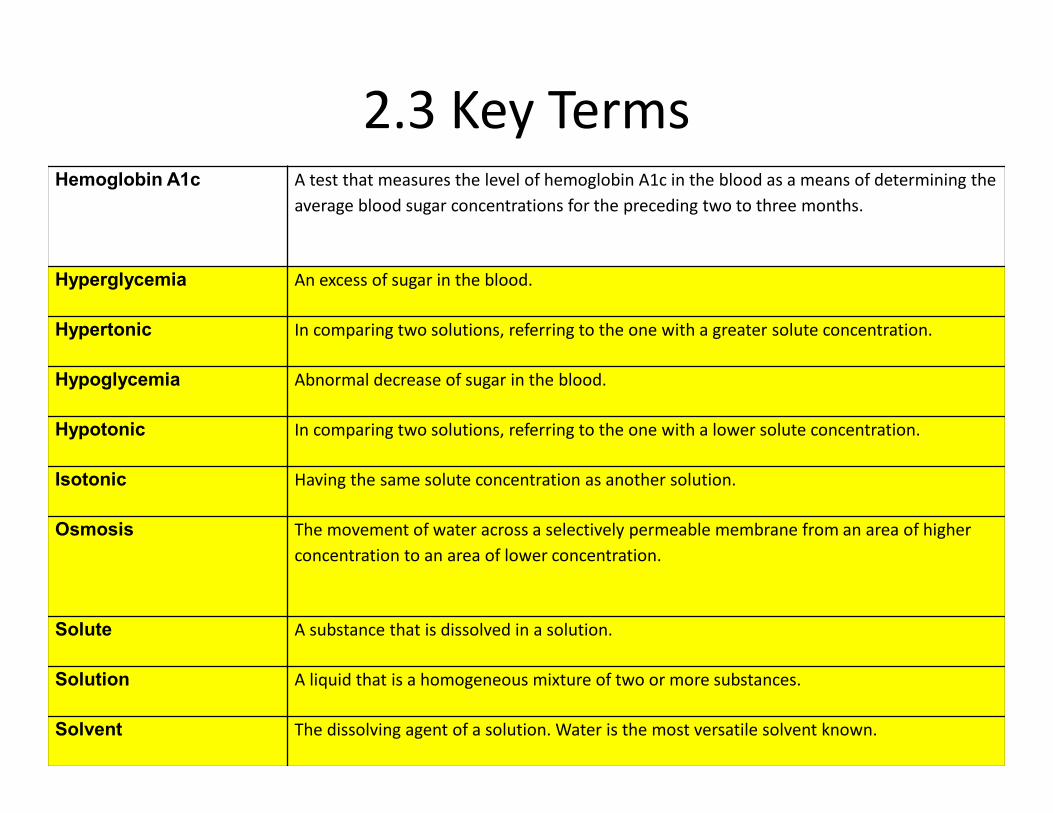
2.3 Key TermsHemoglobin A1c A test that measures the level of hemoglobin A1c in the blood as a means of determining the
average blood sugar concentrations for the preceding two to three months.
Hyperglycemia An excess of sugar in the blood.
Hypertonic In comparing two solutions, referring to the one with a greater solute concentration.
Hypoglycemia Abnormal decrease of sugar in the blood.
Hypotonic In comparing two solutions, referring to the one with a lower solute concentration.
Isotonic Having the same solute concentration as another solution.
Osmosis The movement of water across a selectively permeable membrane from an area of higher
concentration to an area of lower concentration.
Solute A substance that is dissolved in a solution.
Solution A liquid that is a homogeneous mixture of two or more substances.
Solvent The dissolving agent of a solution. Water is the most versatile solvent known.
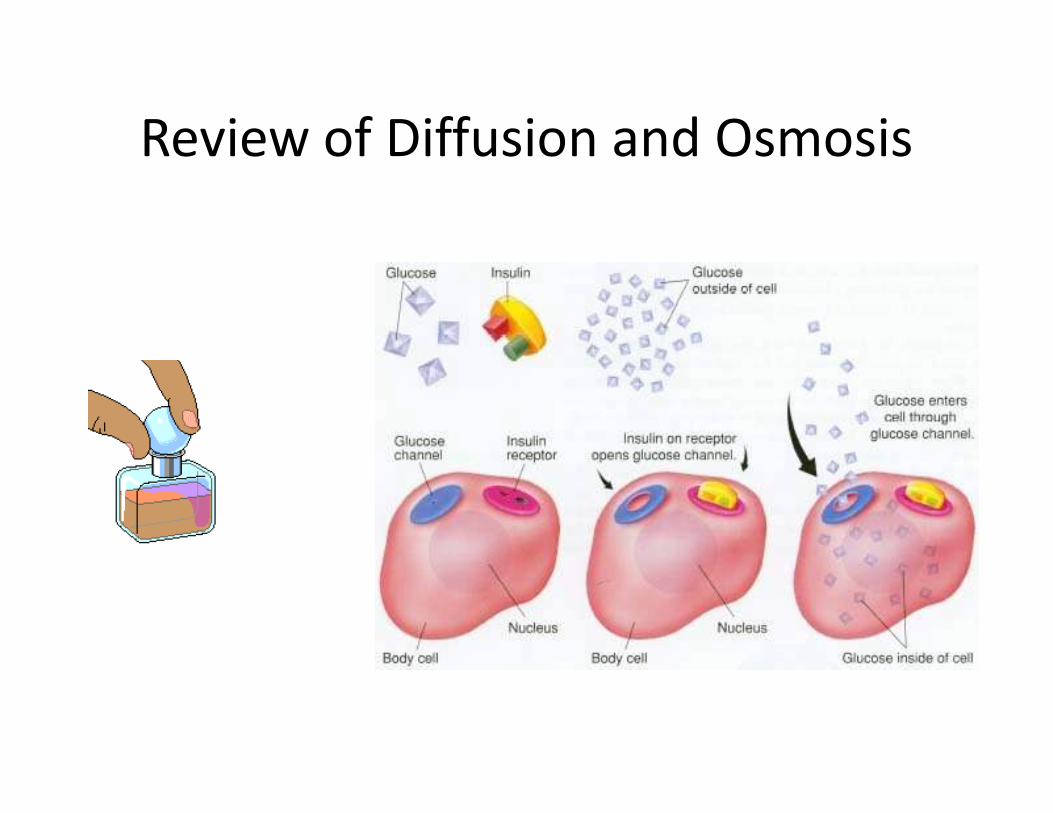
Review of Diffusion and Osmosis
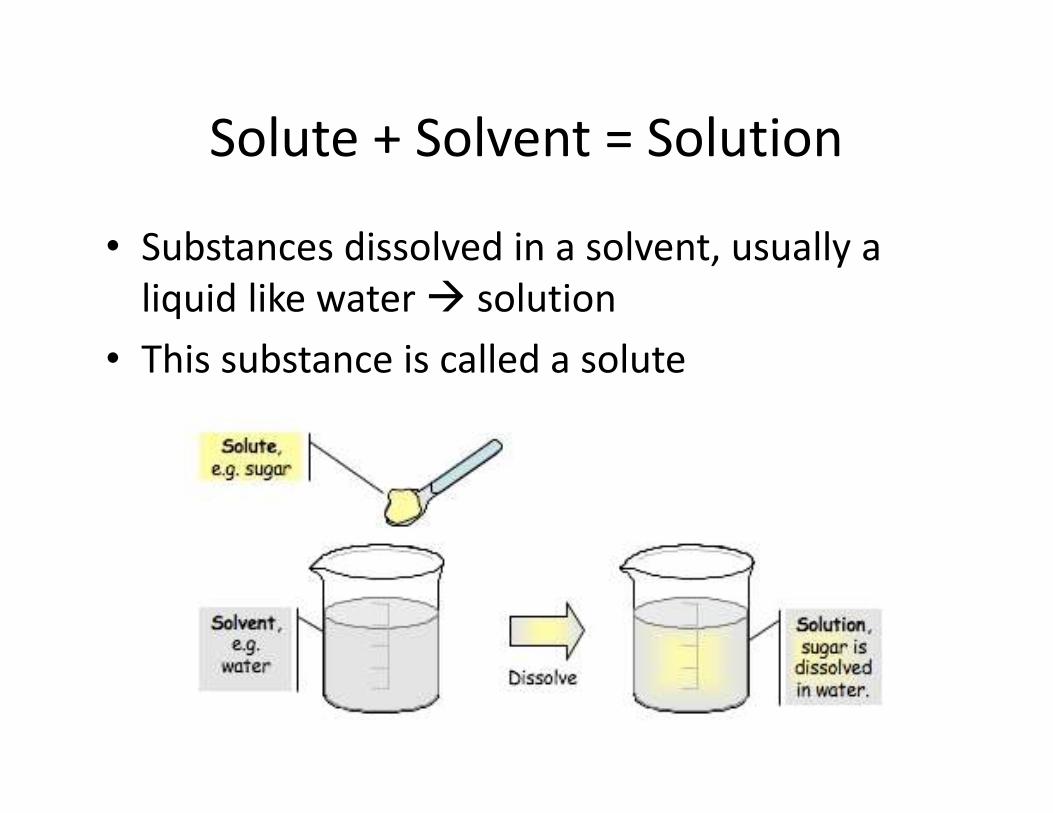
Solute + Solvent = Solution
• Substances dissolved in a solvent, usually a
liquid like water � solution
• This substance is called a solute
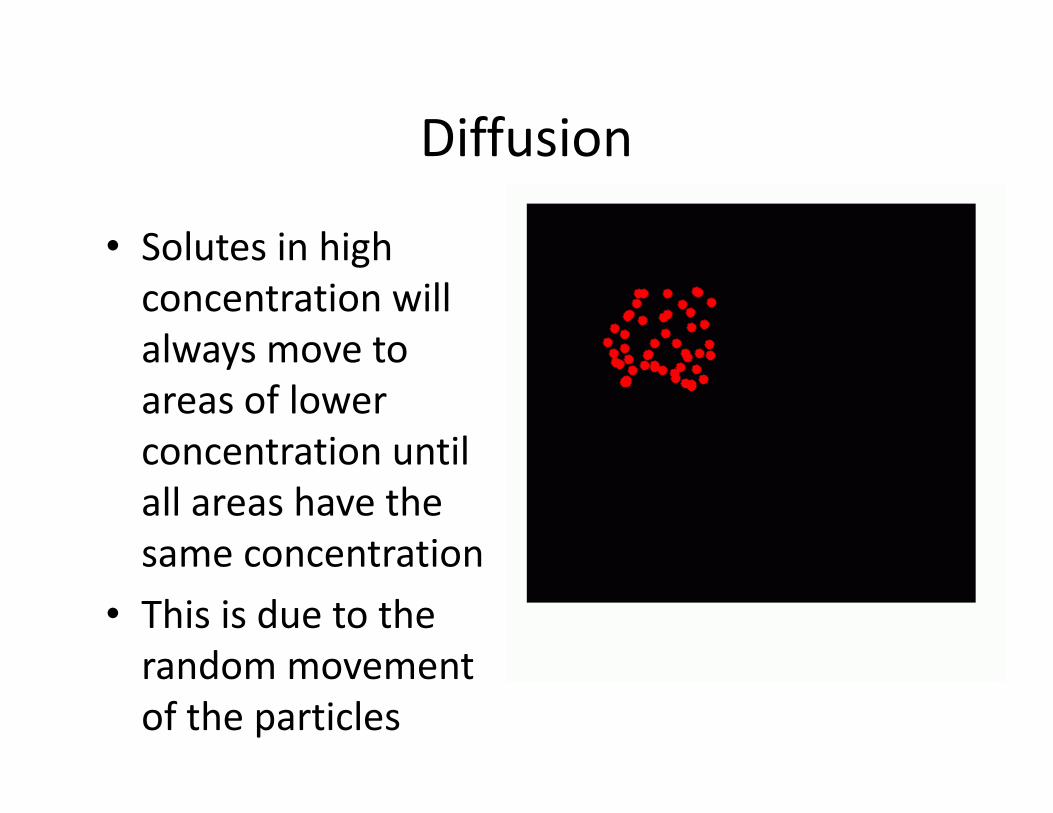
Diffusion
• Solutes in high
concentration will
always move to
areas of lower
concentration until
all areas have the
same concentration
• This is due to the
random movement
of the particles
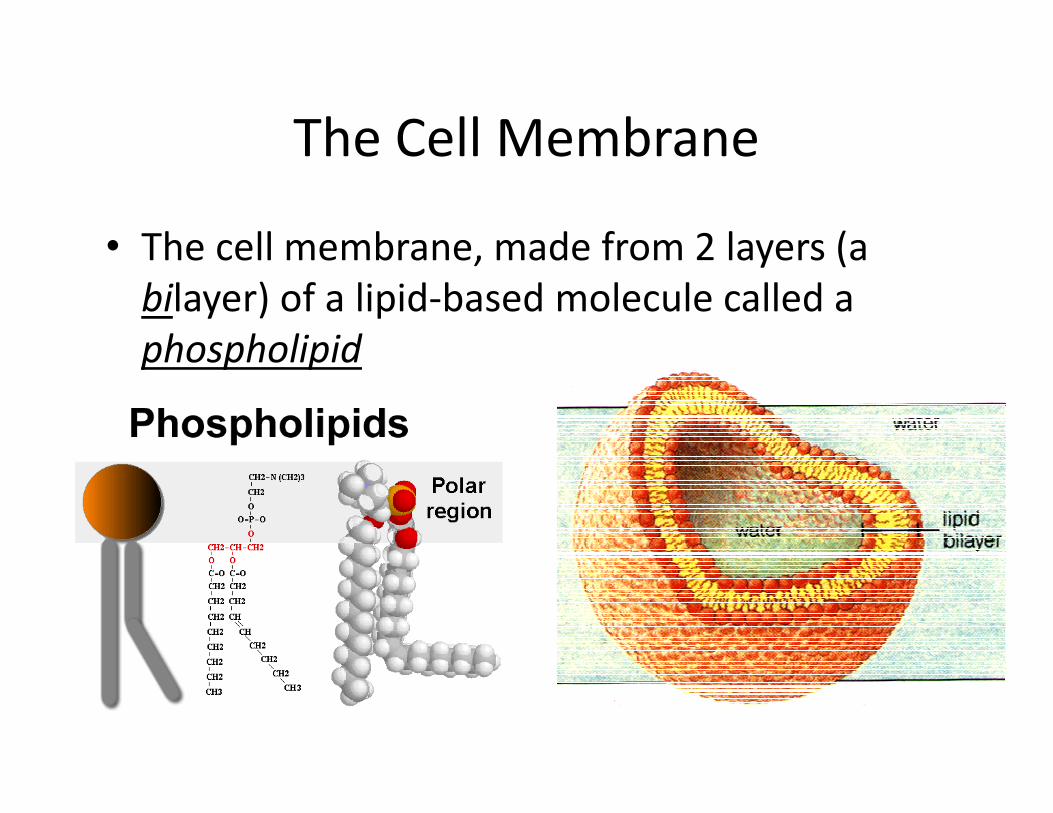
The Cell Membrane
• The cell membrane, made from 2 layers (a
bilayer) of a lipid-based molecule called a
phospholipid
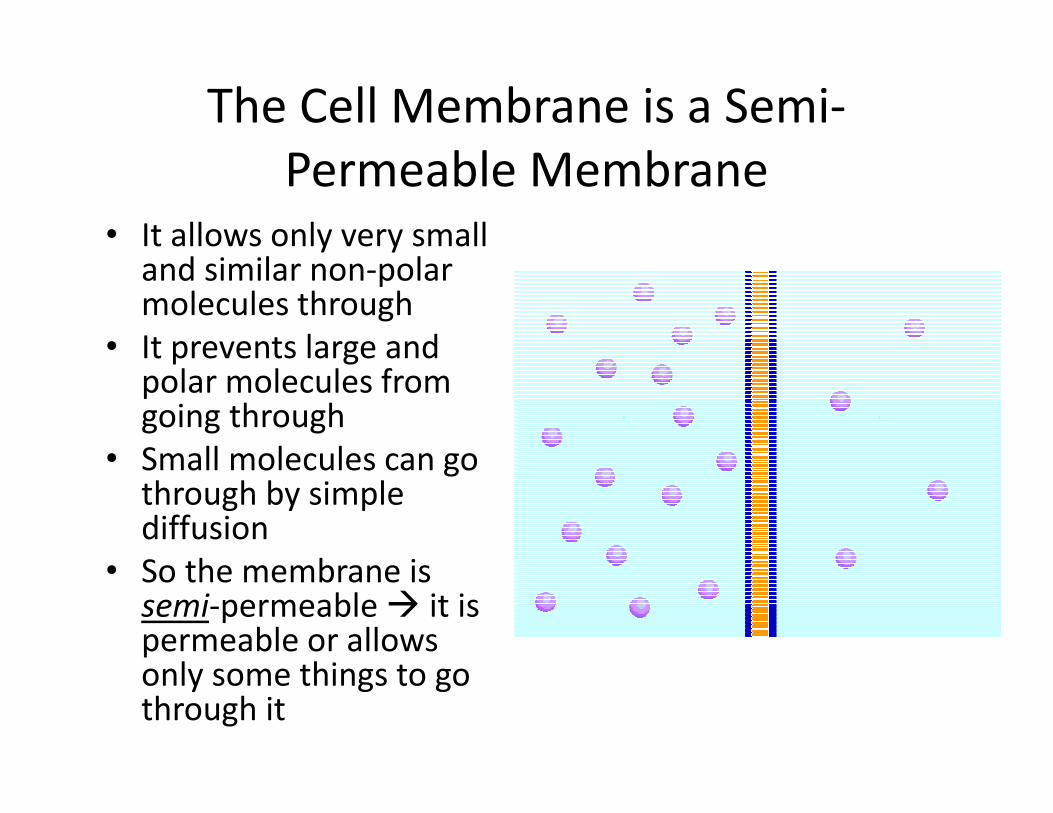
The Cell Membrane is a Semi-
Permeable Membrane
• It allows only very small and similar non-polar molecules through
• It prevents large and polar molecules from going through
• Small molecules can go through by simple diffusion
• So the membrane is semi-permeable � it is permeable or allows only some things to go through it
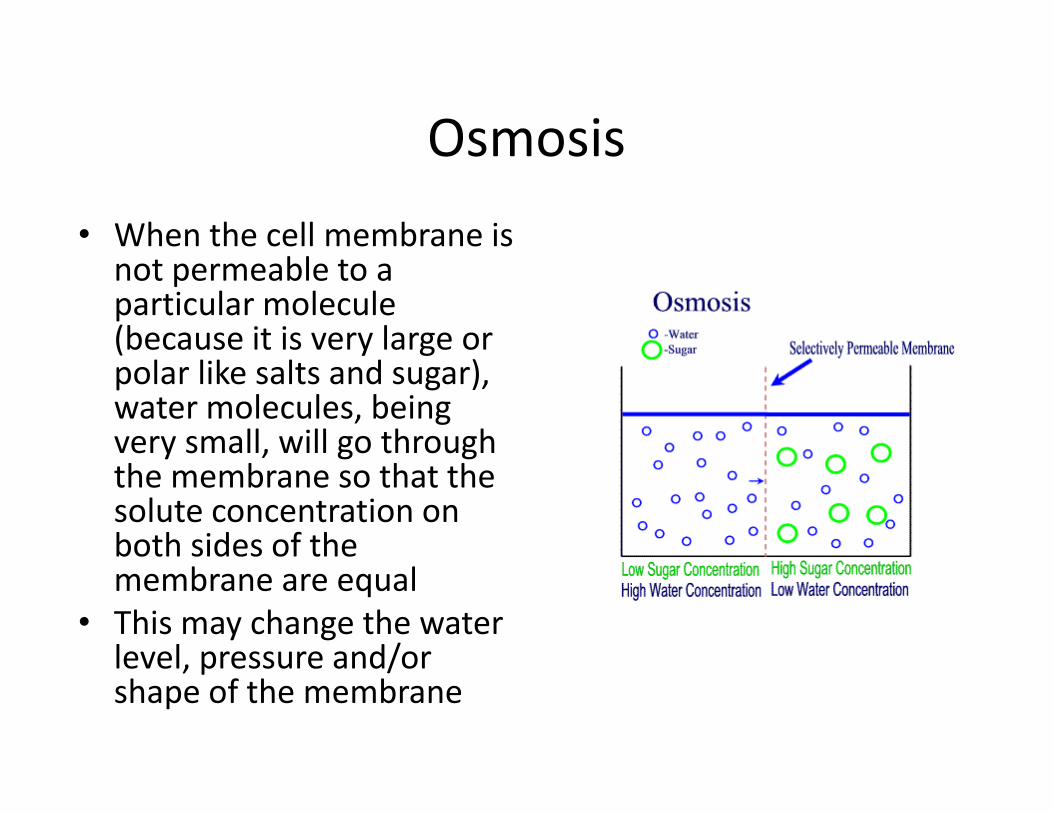
Osmosis
• When the cell membrane is not permeable to a particular molecule (because it is very large or polar like salts and sugar), water molecules, being very small, will go through the membrane so that the solute concentration on both sides of the membrane are equal
• This may change the water level, pressure and/or shape of the membrane
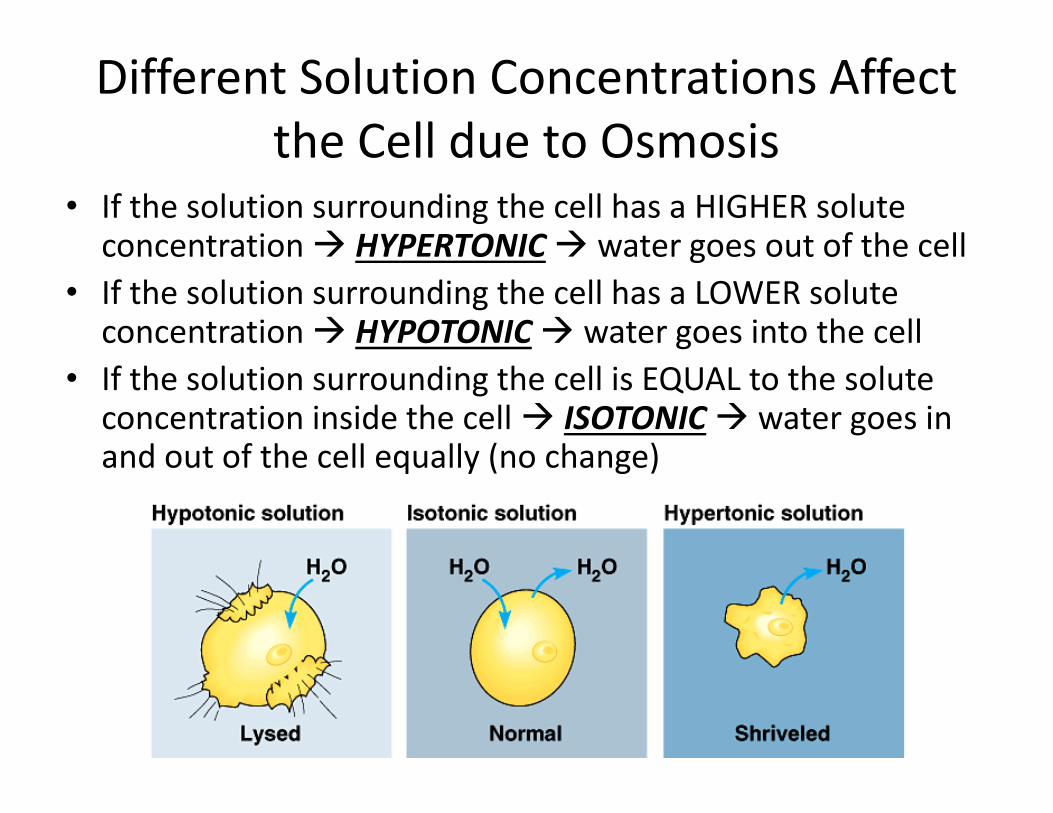
Different Solution Concentrations Affect
the Cell due to Osmosis
• If the solution surrounding the cell has a HIGHER solute concentration � HYPERTONIC� water goes out of the cell
• If the solution surrounding the cell has a LOWER solute concentration � HYPOTONIC� water goes into the cell
• If the solution surrounding the cell is EQUAL to the solute concentration inside the cell � ISOTONIC� water goes in and out of the cell equally (no change)
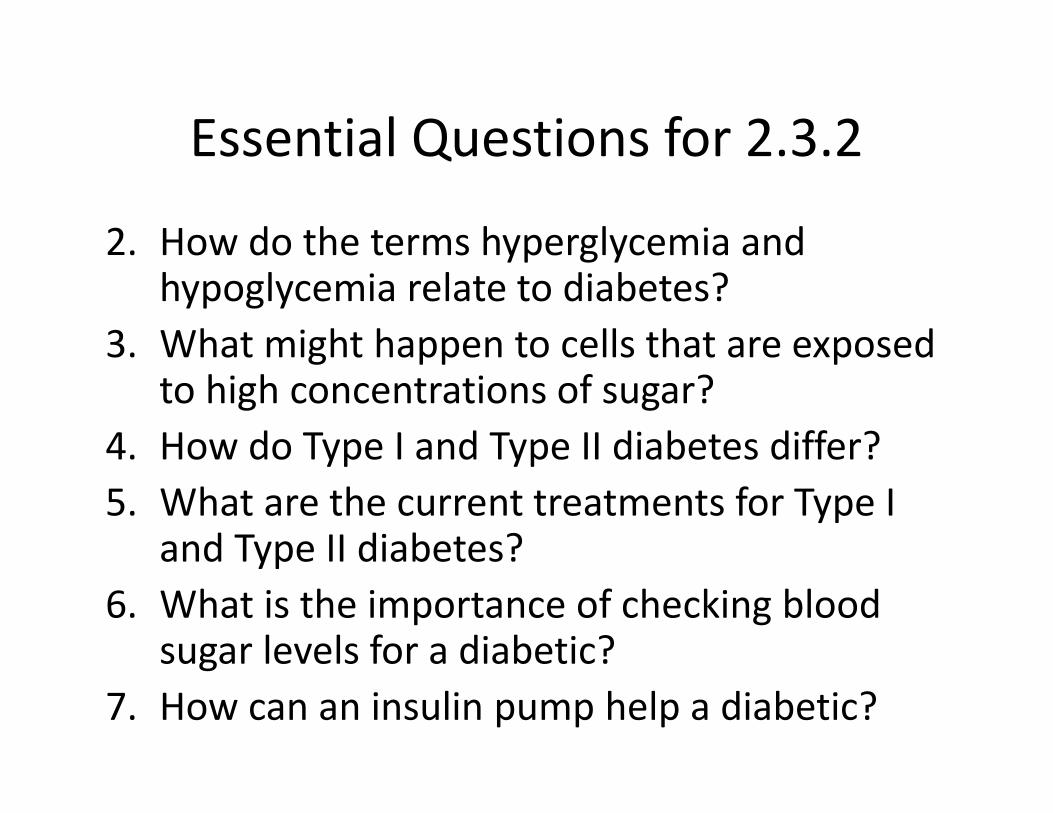
Essential Questions for 2.3.2
2. How do the terms hyperglycemia and hypoglycemia relate to diabetes?
3. What might happen to cells that are exposed to high concentrations of sugar?
4. How do Type I and Type II diabetes differ?
5. What are the current treatments for Type I and Type II diabetes?
6. What is the importance of checking blood sugar levels for a diabetic?
7. How can an insulin pump help a diabetic?
Activity Objectives – 2.3.2.
1. Use a model of a cell to simulate how the
body reacts to varying blood glucose
concentrations
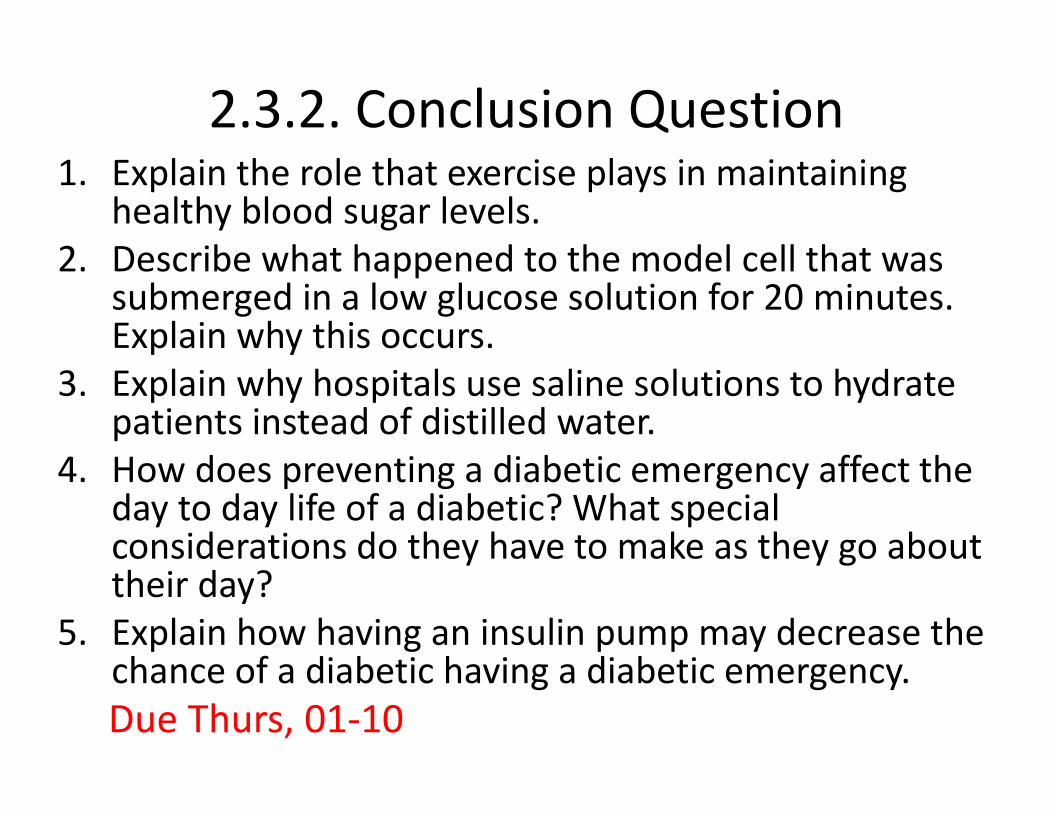
2.3.2. Conclusion Question1. Explain the role that exercise plays in maintaining
healthy blood sugar levels.
2. Describe what happened to the model cell that was submerged in a low glucose solution for 20 minutes. Explain why this occurs.
3. Explain why hospitals use saline solutions to hydrate patients instead of distilled water.
4. How does preventing a diabetic emergency affect the day to day life of a diabetic? What special considerations do they have to make as they go about their day?
5. Explain how having an insulin pump may decrease the chance of a diabetic having a diabetic emergency.
Due Thurs, 01-10
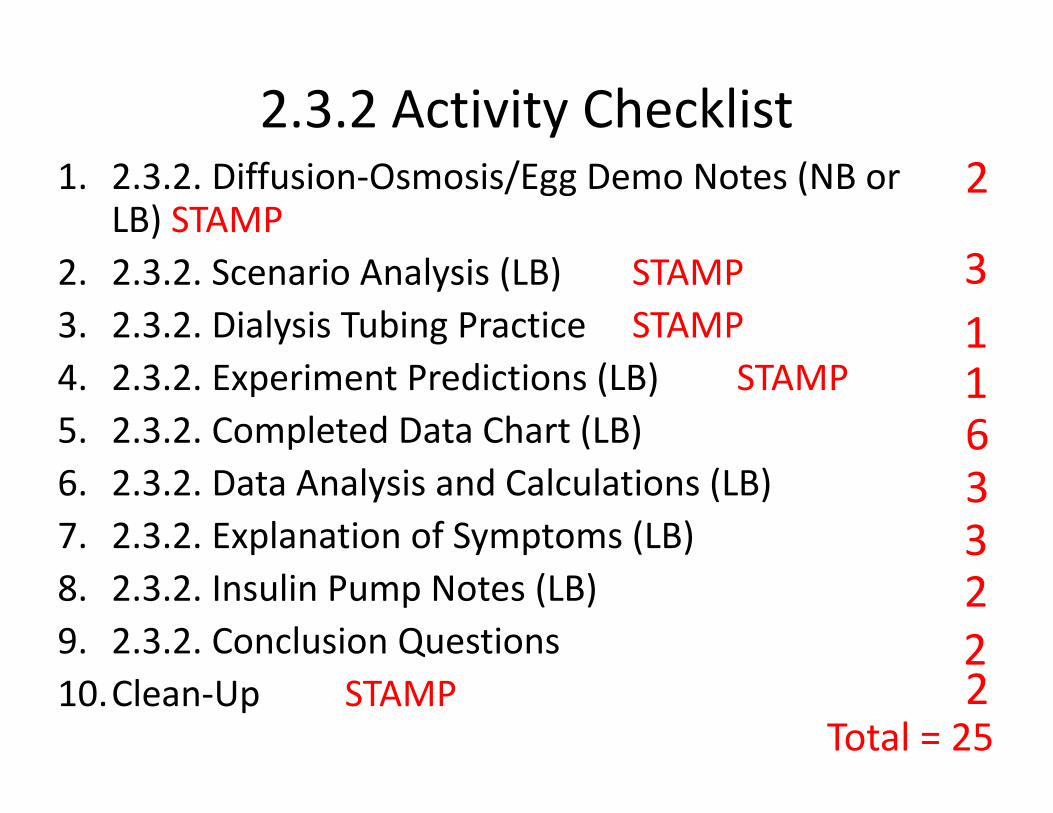
2.3.2 Activity Checklist1. 2.3.2. Diffusion-Osmosis/Egg Demo Notes (NB or
LB) STAMP
2. 2.3.2. Scenario Analysis (LB) STAMP
3. 2.3.2. Dialysis Tubing Practice STAMP
4. 2.3.2. Experiment Predictions (LB) STAMP
5. 2.3.2. Completed Data Chart (LB)
6. 2.3.2. Data Analysis and Calculations (LB)
7. 2.3.2. Explanation of Symptoms (LB)
8. 2.3.2. Insulin Pump Notes (LB)
9. 2.3.2. Conclusion Questions
10.Clean-Up STAMP
2
3
Total = 25
1
3
1
6
32
22
2.3.2. Activity Directions
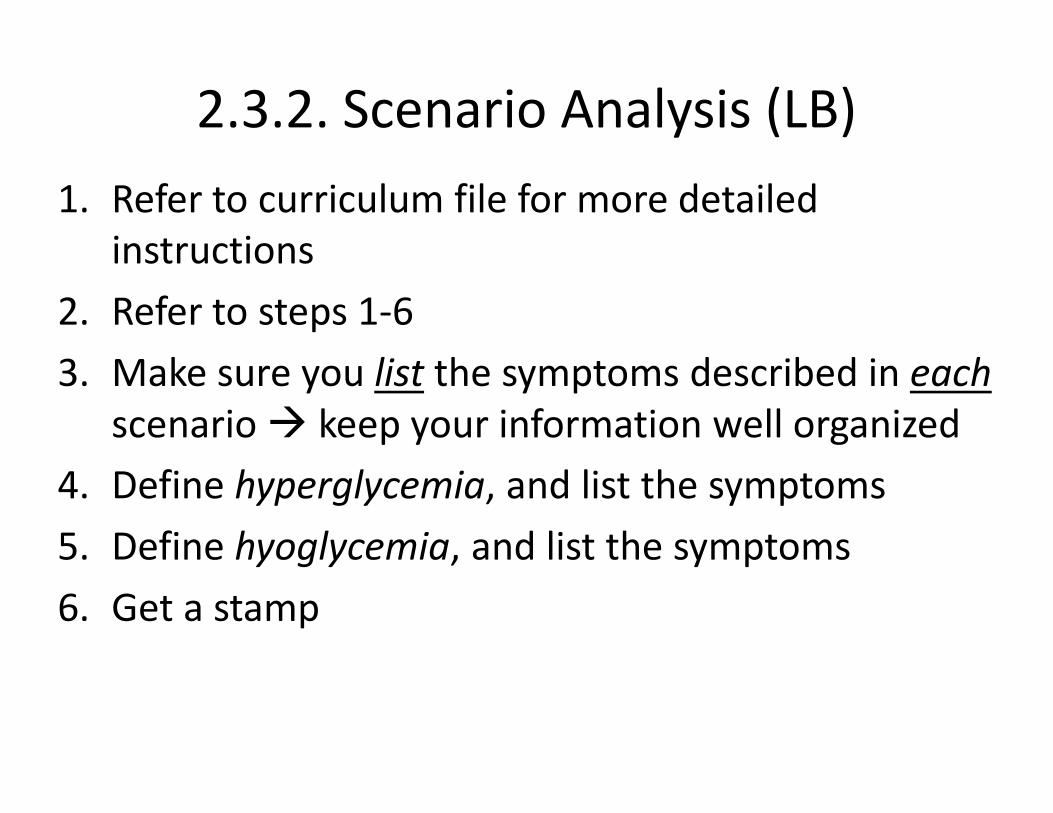
2.3.2. Scenario Analysis (LB)
1. Refer to curriculum file for more detailed
instructions
2. Refer to steps 1-6
3. Make sure you list the symptoms described in each
scenario � keep your information well organized
4. Define hyperglycemia, and list the symptoms
5. Define hyoglycemia, and list the symptoms
6. Get a stamp
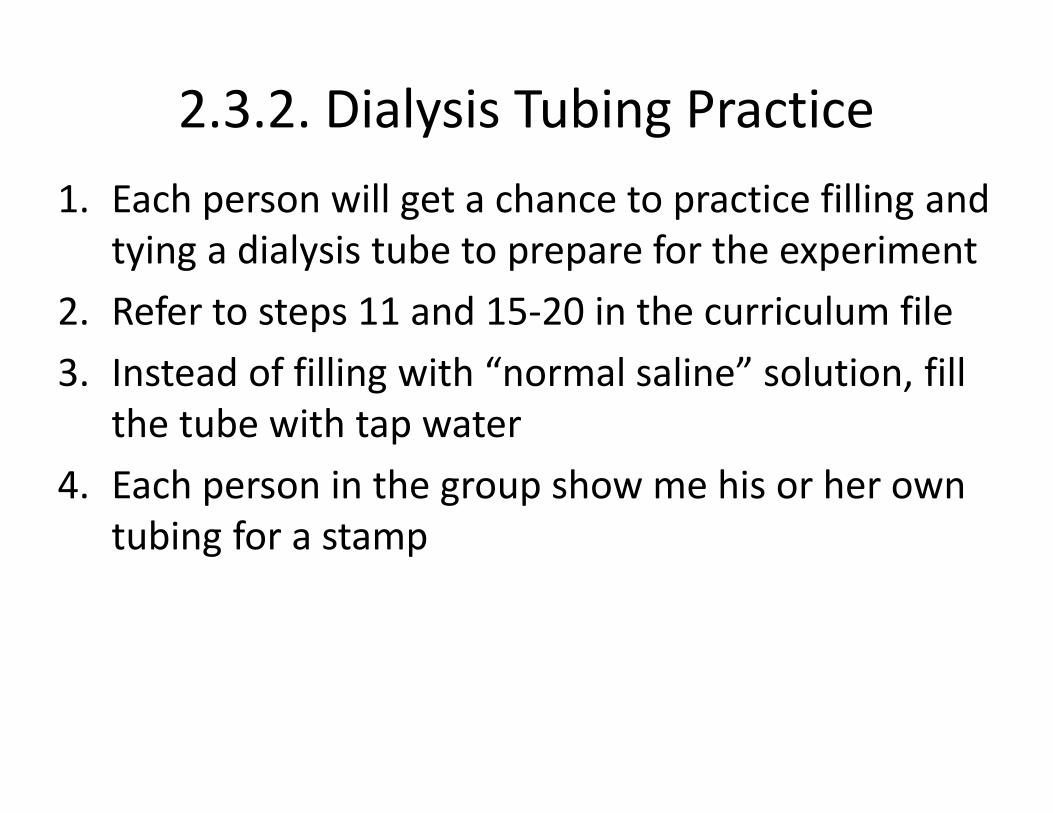
2.3.2. Dialysis Tubing Practice
1. Each person will get a chance to practice filling and
tying a dialysis tube to prepare for the experiment
2. Refer to steps 11 and 15-20 in the curriculum file
3. Instead of filling with “normal saline” solution, fill
the tube with tap water
4. Each person in the group show me his or her own
tubing for a stamp
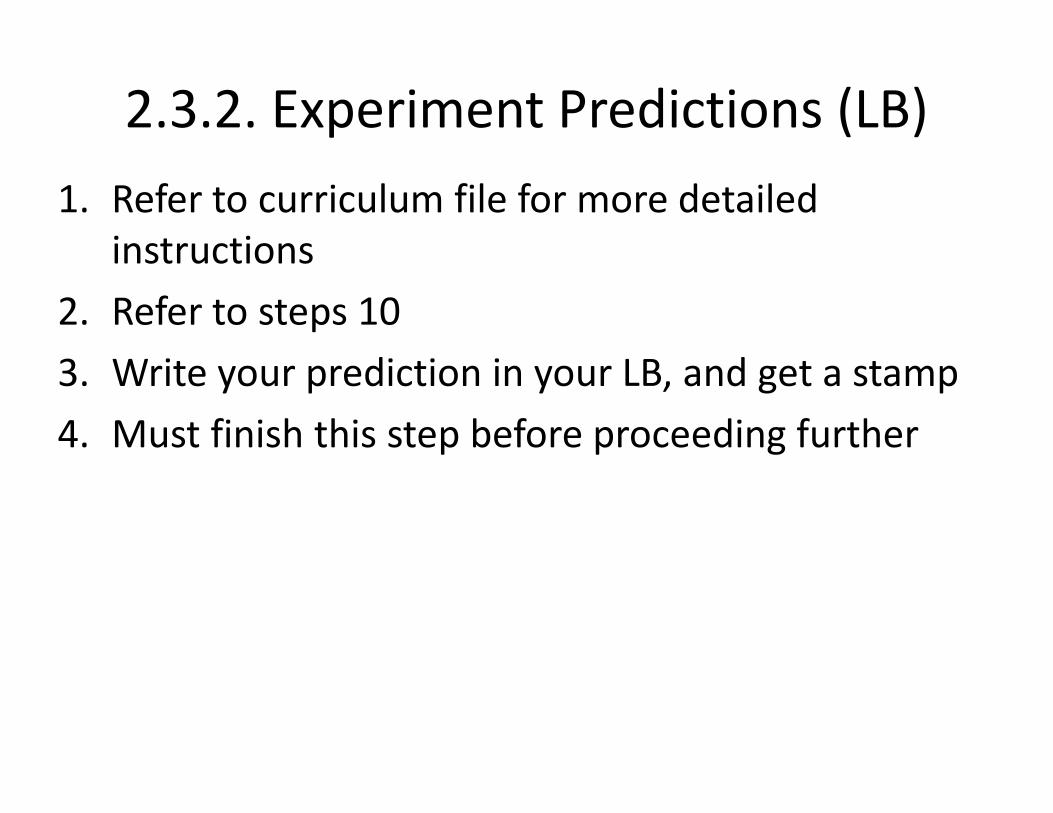
2.3.2. Experiment Predictions (LB)
1. Refer to curriculum file for more detailed
instructions
2. Refer to steps 10
3. Write your prediction in your LB, and get a stamp
4. Must finish this step before proceeding further
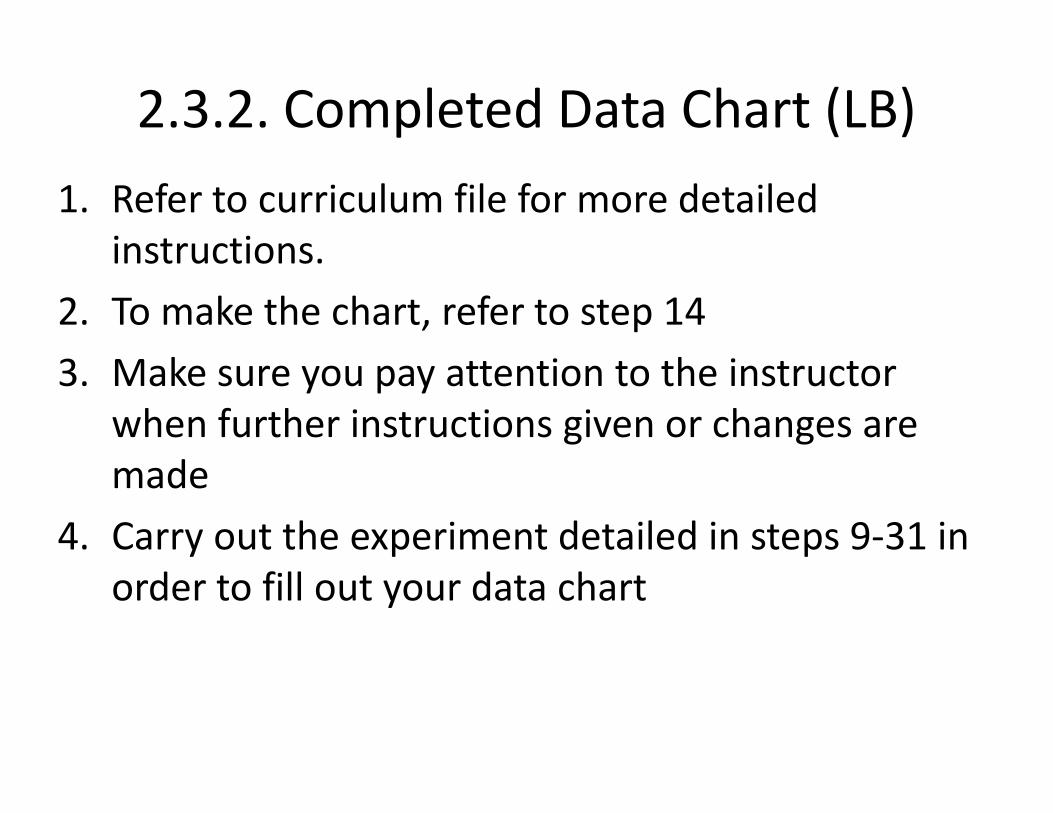
2.3.2. Completed Data Chart (LB)
1. Refer to curriculum file for more detailed
instructions.
2. To make the chart, refer to step 14
3. Make sure you pay attention to the instructor
when further instructions given or changes are
made
4. Carry out the experiment detailed in steps 9-31 in
order to fill out your data chart
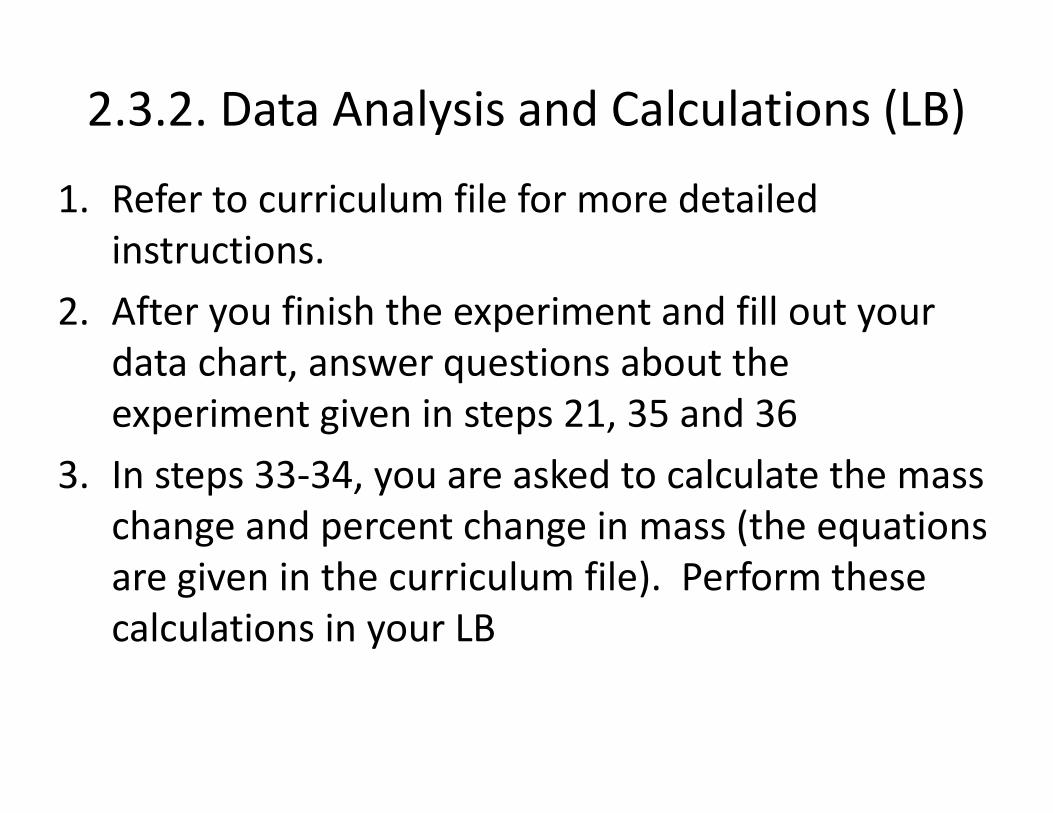
2.3.2. Data Analysis and Calculations (LB)
1. Refer to curriculum file for more detailed
instructions.
2. After you finish the experiment and fill out your
data chart, answer questions about the
experiment given in steps 21, 35 and 36
3. In steps 33-34, you are asked to calculate the mass
change and percent change in mass (the equations
are given in the curriculum file). Perform these
calculations in your LB
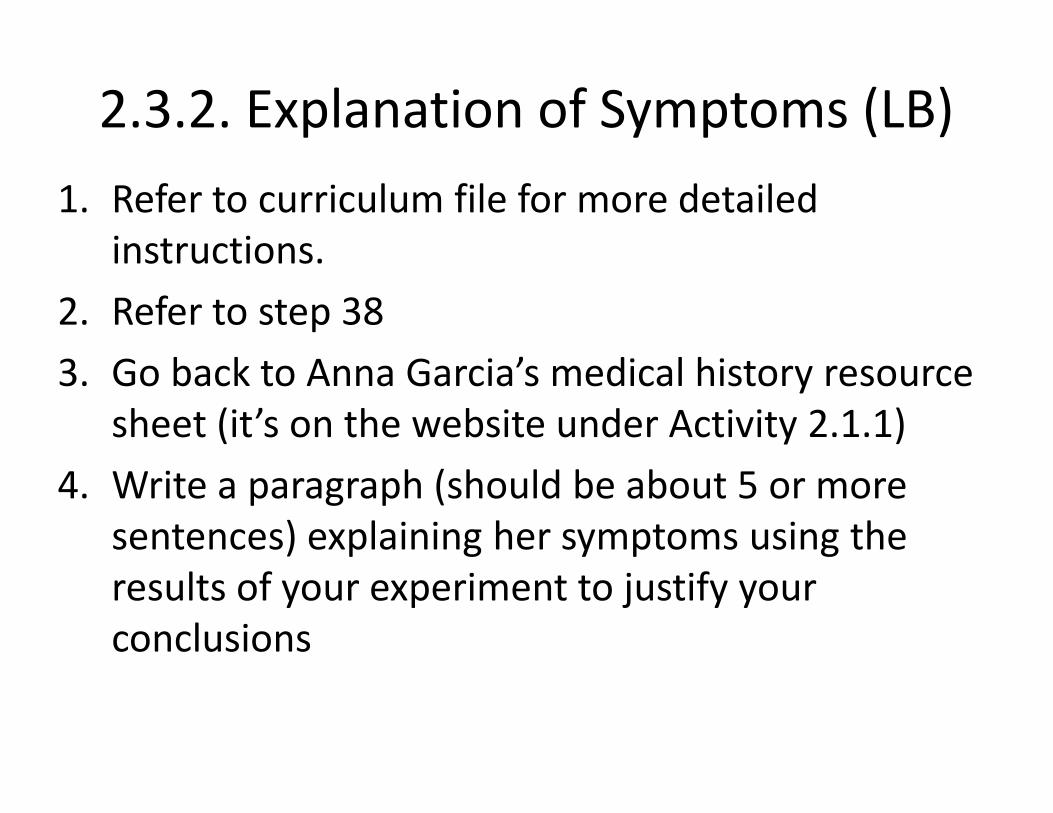
2.3.2. Explanation of Symptoms (LB)
1. Refer to curriculum file for more detailed
instructions.
2. Refer to step 38
3. Go back to Anna Garcia’s medical history resource
sheet (it’s on the website under Activity 2.1.1)
4. Write a paragraph (should be about 5 or more
sentences) explaining her symptoms using the
results of your experiment to justify your
conclusions
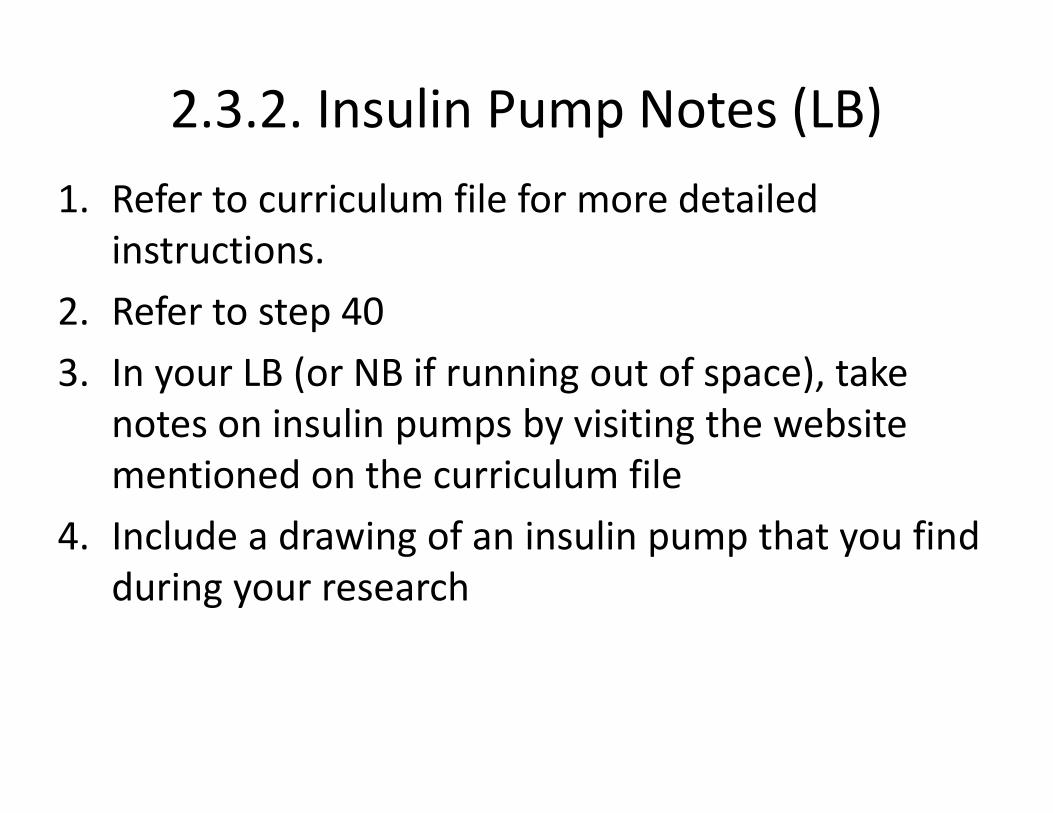
2.3.2. Insulin Pump Notes (LB)
1. Refer to curriculum file for more detailed
instructions.
2. Refer to step 40
3. In your LB (or NB if running out of space), take
notes on insulin pumps by visiting the website
mentioned on the curriculum file
4. Include a drawing of an insulin pump that you find
during your research
2.3.2. Clean-Up
1. Get a stamp when you clean-up after the dialysis
tubing experiment (day 2 of 2.3.2 activity)