Embed Size (px)
Citation preview
Agency and Internal Capital MarketInefficiency: Evidence from Banking
Organizations
Dmytro Holod∗
Using banking data, I provide evidence that agency problems are at the root of internal capitalmarket inefficiency. I find that publicly traded bank holding companies (BHCs) are less efficient intheir internal capital allocation than nonpublicly traded BHCs. This suggests that the divergenceof interests between the chief executive officer and the shareholders is an important source of theinternal capital misallocation. I also demonstrate that BHCs incorporating a tiered organizationalstructure are less efficient than nontiered BHCs, but only within a sample of BHCs that are publiclytraded. These findings imply that a greater degree of rent-seeking activity by division managerscontributes to internal capital market inefficiency only if the top manager is an agent. Thisis consistent with theoretical models that explain internal capital misallocations through themultiple layers of agency within an organization.
The purpose of this study is to empirically investigate the sources of internal capital marketinefficiencies. One of the main reasons for such inefficiencies, as suggested by the literature, is therent-seeking activity of the division managers of a conglomerate (Stein, 1997; Rajan, Servaes, andZingales, 2000; Scharfstein and Stein, 2000). However, for the division managers’ rent-seekingactivity to result in internal capital misallocation, it is important that the top manager, who makesdecisions about the allocation of funds among subsidiaries, is also an agent whose interests maydiverge from the owners’ goal of firm value maximization (Scharfstein and Stein, 2000).
If these two layers of agency are at the root of internal capital market inefficiencies, one wouldexpect the following. First, more internal capital market inefficiencies should be observed withinpublicly traded conglomerates. A chief executive officer (CEO) of a publicly traded company isan agent and is, therefore, more likely to have perverse incentives when compared to a CEO ofa nonpublicly traded company. In addition, the misallocation of funds within a publicly tradedconglomerate should be further exacerbated if the conglomerate has a tiered structure. The CEO,acting also as an agent, must deal with several layers of agency at the division levels.
In this study, I use banking data to compare the efficiency of internal fund allocation amongsubsidiaries of publicly traded bank holding companies (BHCs) with that of nonpublicly tradedBHCs. Furthermore, I distinguish between tiered and nontiered BHCs.1 The banking data providea unique opportunity to test the two main predictions of this study. Unlike the data sets for the
I thank Bill Christie (Editor), an anonymous referee, seminar participants at the Federal Reserve Board, the FederalReserve Bank of Cleveland, and participants of the 2011 Midwest Finance Association Annual Meetings, and the 2010Financial Management Association Meetings for valuable comments.
∗Dmytro Holod is an Assistant Professor at the College of Business at Stony Brook University, Stony Brook, NY, USA.
1 If for all of the subsidiaries of a BHC, the direct holder is also the highest holder, such a BHC is considered nontiered.Otherwise, it is considered tiered, in which case some subsidiaries have at least one additional layer of control above theirdirect holders. Section III provides more details on identification of tiered and nontiered BHCs.
Financial Management • Spring 2012 • pages 35 - 53
36 Financial Management � Spring 2012
nonfinancial firms, banking data contain information for both publicly traded and nonpubliclytraded banking organizations. This is because all types of banks have to file regulatory reports.As a result, it is possible to make the distinction between publicly traded and nonpublicly tradedbanking organizations. Furthermore, regulators require banking organizations to report on thelevel of the consolidated BHC and also on the individual bank subsidiary levels. This makes itpossible to track the organizational hierarchy of each BHC and make the distinction betweentiered and nontiered banking organizations.
I find that publicly traded BHCs are less efficient in their internal capital allocation whencompared to nonpublicly traded BHCs. This inefficiency is further exacerbated if a publiclytraded BHC is also tiered. However, tiered nonpublicly traded BHCs do not exhibit higher internalcapital market inefficiency. They allocate funds more efficiently among their subsidiaries thannontiered nonpublicly traded BHCs. These results provide strong evidence in favor of Scharfsteinand Stein’s (2000) model that suggests the rent-seeking activity of the division managers mayresult in the misallocation of internal resources within a conglomerate if the CEO is an agent whois not necessarily acting in the best interests of their shareholders. This study contributes to thefinance literature by shedding light on the sources of internal capital market inefficiency ratherthan just documenting its existence.
I. Background
In efficient financial markets, a firm that has a positive net present value investment opportunityshould be able to raise external funds to finance that investment. However, as Stiglitz and Weiss(1981), Myers and Majluf (1984), Greenwald, Stiglitz, and Weiss (1984), and others indicate,frictions in the financial markets that arise primarily from the information asymmetry between afirm and a lender can make external financing costly relative to internally generated funds andfinancially constrain firms. Such financing constraints can be mitigated if a firm is a subsidiaryof a conglomerate and, as such, has access to the internal capital market of the entire organization.
Whether or not internal capital markets operate efficiently (allocate resources to the subsidiarieswith the best investment opportunities) has become the focus of both theoretical and empiricalresearch. Alchian (1969), Weston (1970), Gertner, Scharfstein, and Stein (1994), Li and Li (1996),and Stein (1997) argue that internal capital markets can mitigate the asymmetric informationproblem and provide better fund allocation within the conglomerate, thereby enhancing investmentefficiency. However, empirical research has found conflicting evidence regarding the efficiencyof the internal capital markets. Most of the empirical studies, including Shin and Stulz (1998),Scharfstein (1998), Billett and Mauer (2003), Rajan et al. (2000), Campello (2002), and Gopalan,Nanda, and Seru (2007), find that conglomerates engage in “socialist” behavior by subsidizingdivisions with weak investment opportunities.
In order to explain inefficient cross-subsidization within conglomerates, Rajan et al. (2000)and Wulf (2009) develop theoretical models wherein the influence activities of division managersresult in inefficient capital allocation among the divisions of a conglomerate. In these models,the CEO of a conglomerate is a principal who acts in the interests of the shareholders, whilethe agency problems at the division manager level are directly related to internal capital marketinefficiencies. Scharfstein and Stein (2000) introduce an additional layer of agency by assumingthat not only division managers but also CEOs are agents who act in their own private interests. Asa result, the CEO prefers to compensate the rent-seeking division managers with more generouscapital allocation rather than with cash resulting in the inefficiency of the internal capital market

Holod � Agency and Internal Capital Market Inefficiency 37
of the conglomerate. As such, it is the existence of the two layers of agency that causes the internalcapital markets to operate inefficiently.
Recent empirical research regarding the efficiency of internal capital markets has focused onthe cross-sectional implications derived from the theoretical models. Instead of merely document-ing the efficiency or inefficiency of internal capital markets, several studies identify variables thatare correlated with the measure of internal capital market efficiency. In particular, Rajan et al.(2000) find that inefficient cross-subsidization is more likely to occur when there is a diversity ofinvestment opportunities among the subsidiaries of a conglomerate. Scharfstein (1998) demon-strates that the inefficiency of internal capital markets is more pronounced when top managershave a small equity stake, consistent with Scharfstein and Stein’s (2000) two-layer agency model.Palia (1999) finds more inefficiency in conglomerates with large boards of directors and whenthe compensation of division managers is less related to the overall performance of the conglom-erate. More recently, several studies indicate that subsidiaries with more powerful managers areallocated more funds from headquarters (Cremers, Huang, and Sauter, 2011; Duchin and Sosyura,2011; Glaser, Lopez-de-Silanes, and Saunter, 2011).
In this study, I continue to explore the cross-sectional implications of the theoretical modelsby focusing on two main predictions that stem from these models. First, one can expect moreinternal capital market inefficiency when the incentives of the top manager are not perfectlyaligned with the interests of the owners. In addition, more inefficiency is likely to be observedwhen the conglomerate has a complicated vertical organizational structure with several tiers and,as a result, several levels of division/plant manager rent-seeking activity.
To test these predictions, I focus on the banking industry. In order to explore whether or notagency problems at the CEO level affect internal capital market efficiency, I first distinguishbetween publicly traded and nonpublicly traded BHCs. Several studies provide evidence thatnonpublicly traded companies are more likely to be run by shareholders than publicly tradedcompanies.2 As a result, the CEO of a publicly traded BHC is more likely to be an agent and morelikely to pursue their own interests when making capital budgeting decisions. To test whether ornot organizational complexity is associated with internal capital market inefficiency, I make afurther distinction between tiered and nontiered BHCs.
This study attempts to explain why we observe inefficient cross-subsidization within con-glomerates rather than simply stating the existence of such inefficiency. Interestingly, I find thatdivision manager rent-seeking contributes to internal capital market inefficiency only if the topmanager is an agent. This is consistent with Scharfstein and Stein’s (2000) model that requirestwo layers of agency to result in inefficient cross-subsidization.
2 By studying a sample of firms that go public, Mikkelson, Partch, and Shah (1997) demonstrate that the medianownership stake of officers and directors in privately held companies is 68% compared to a median stake of 18% inpublicly traded companies. In a study that uses data from the Federal Reserve Board’s National Survey of Small BusinessFinances, Ang, Cole, and Lin (2000) find that 73% of small nonfinancial, nonpublicly traded firms in their sample aremanaged by shareholders rather than by outsiders. Unfortunately, I cannot thoroughly investigate the ownership structureof nonpublicly traded banking organizations in my sample as the ownership data for privately held banking companiesare generally unavailable. Therefore, I have to generalize the findings of the previous studies with the assumption thatthe ownership structure of nonpublicly traded BHCs in my sample is not fundamentally different from that of the firmsincluded in the samples of the above mentioned studies. To find some anecdotal evidence for the ownership structureof nonpublicly traded banking organizations, I searched the news and official websites of some nonpublicly tradedbanking organizations. Where available, the information pointed to the family ownership and control of those bankingorganizations. For example, Emigrant Savings Bank, one of the largest nonpublicly traded banks, is owned by the Milsteinsfamily with Howard Milstein serving as its CEO. The First American Bank, a nonpublicly traded bank with $2 billion inassets, emphasizes that it is 80% owned by officers, directors, and family members on its official website.
38 Financial Management � Spring 2012
II. Hypotheses and Specifications
Efficient internal capital markets hypothesis implies that investment of the subsidiaries with bet-ter investment opportunities will be less constrained by the subsidiary’s internally generated fundsthan the investment of subsidiaries with relatively worse opportunities. One of the strategies foundin the empirical literature is to use the investment cash flow sensitivity of a subsidiary (or segment)as a measure of its financial constraints and to investigate whether or not internal capital marketsalleviate those constraints (Shin and Stulz, 1998; Houston, James, and Marcus, 1997; Houston andJames, 1998). If internal capital markets allocate funds efficiently, subsidiaries that perform wellare expected to have lower investment cash flow sensitivity than poorly performing subsidiaries.
I follow a similar strategy recognizing two key differences between banks and nonfinancialfirms. First, due to the nature of the banking business, it is more reasonable to concentrate onbank lending rather than on investment activity. In addition, unlike nonfinancial firms, banks donot rely on internally generated cash as a significant source of financing for their lending activity.Instead, they use “core deposits” as their most reliable and cheapest source of financing. I definecore deposits as total deposits minus large time deposits and use them as a “bank version” measureof internally generated funds. Such deposits represent a very stable base for bank lending and,therefore, may be treated as internally generated funds.3
If BHCs allocate funds efficiently, one would expect the loan growth of better performingbank subsidiaries to be less dependent on the growth of their core deposits than the loan growthof poorly performing subsidiaries. Consequently, the difference in loan growth-core depositgrowth sensitivity between “good” and “bad” subsidiaries of a BHC can serve as a measure ofthe BHC’s internal capital market efficiency. The main hypothesis of this study is that fundswill be allocated less efficiently among the subsidiaries of publicly traded BHCs than amongsubsidiaries of nonpublicly traded BHCs. It is also expected that such inefficiencies will be furthercomplicated in tiered BHCs. Since the difference in loan growth-core deposit growth sensitivitybetween good and bad subsidiaries measures the internal capital market efficiency, I expectsuch a difference to be smaller for subsidiaries of publicly traded BHCs than for subsidiaries ofnonpublicly traded BHCs. I also expect this difference to be smaller for the subsidiaries of tieredbanking organizations.
To test the above hypotheses, I use the following specifications:
�Loansit = μi + νt + α1Capitalit−1 + α2LogAssetsit−1 +4∑
j=1
α3 j GStateEmplt− j
+ NPTit(α4�CoreDepit + α5DevROAit−1 + α6�CoreDepit∗DevROAit−1)
+ PTit(α7 + α8�CoreDepit + α9�CoreDepit−1
+α10 �CoreDepit∗DevROAit−1) + εit, (1)
�Loansit = φi + τt + β1Capitalit−1 + β2LogAssetsit−1 +4∑
j=1
β3 j GStateEmplt− j
+ Nontieredit(β4�CoreDepit + β5DevROAit−1
+β6�CoreDepit∗DevROAit−1) + Tieredit(β7 + β8�CoreDepit
+β9DevROAit−1 + β10�CoreDepit∗DevROAit−1) + ψi t . (2)
3 Jayarante and Morgan (2000) use a similar strategy to investigate deposit constraints faced by banks.
Holod � Agency and Internal Capital Market Inefficiency 39
Equation (1) distinguishes between the bank subsidiaries of publicly traded and nonpubliclytraded BHCs. Equation (2) differentiates between the subsidiaries of tiered and nontiered BHCs.Otherwise, the equations are identical. The dependent variable is the change in real dollar loansscaled by the end of the previous period real dollar assets (�Loansit). A bank’s lending is likelyto be constrained by the growth rate of its real dollar core deposits (�CoreDepit). However, inefficient internal capital markets, the lending of the better performing subsidiaries of a BHCshould be less constrained by their core deposits. To distinguish between good and bad banksubsidiaries, I use the end of the previous period deviation of the bank’s return on assets fromthe mean return on assets of all subsidiary banks affiliated with the same BHC (DevROAit–1).The larger such deviation, the better a bank’s performance is relative to other affiliates.4 I interactDevROAit–1 with �CoreDepit to measure the degree of internal capital market efficiency ofa BHC. The negative coefficient at the interaction term implies that the lending of a betterperforming (higher DevROAit–1) subsidiary is less dependent upon the growth rate of its coredeposits. However, in publicly traded and tiered BHCs, the internal capital market’s efficiencymay be reduced for the reasons discussed above. Therefore, the coefficients α10 and β10 shouldbe less negative than the coefficients α6 and β6, respectively.
The dummy variable PT takes a value of one if a bank is affiliated with a publicly traded BHC,while the dummy variable NPT takes a value of one if a bank is affiliated with a nonpubliclytraded BHC. Similarly, the dummy variable Tiered takes a value of one if a bank is affiliated witha tiered BHC, while the dummy variable Nontiered takes a value of one if a bank is affiliatedwith a nontiered BHC.5
Other variables included in the specifications represent standard controls commonly used inloan growth regressions. In particular, I include the lagged values of a bank’s capital-to-assetratio (Capitalit–1) and the logarithm of a bank’s real dollar assets (LogAssetsit–1) to control forthe effects of a bank’s capital adequacy and size on its loan growth. To control for the effectsof local economic conditions on bank loan growth, I include four lags of the state employmentgrowth rate (GStateEmpl). The equations also include time-fixed effects to control for changesin macroeconomic conditions.6 Finally, the specifications include bank-fixed effects to controlfor unobservable (time invariant) bank characteristics.
III. Data
For individual, bank-level data, I use the Consolidated Reports of Condition and Income (CallReports) that contain detailed balance sheet and income data for all Federal Deposit InsuranceCorporation (FDIC)-insured banks on a quarterly basis. The employment data are from the Bureauof Labor Statistics. The gross domestic product (GDP) data are from the Bureau of EconomicAnalysis.
The initial sample includes all FDIC-insured commercial banks for the period 1986:Q2–2008:Q2. Since this study focuses on the operation of internal capital markets, only banks that
4 The deviation from a BHC average return on equity (ROE) produced qualitatively similar results.5 A BHC is tiered if at least one bank subsidiary is part of an intermediate BHC (direct holder) that is, in turn, controlledby another BHC (higher holder). For example, Wells Fargo Bank, NA is a part of the Placer Sierra Bancshares (directholder), which, in turn, is controlled by Wells Fargo & Company (highest holder). In this case, Wells Fargo & Companyis a tiered banking organization and all of its subsidiaries are deemed to be affiliated with a tiered BHC (dummy variableTiered = 1).6 I experimented with some specific controls for macroeconomic conditions, such as the growth rate of real grossdomestic product (GDP). The results were qualitatively similar. Preference was given to the time fixed effects as theycapture macroeconomic conditions more broadly.
40 Financial Management � Spring 2012
Table I. Distribution of Observations across Different Bank Groups
The sample includes banks affiliated with a multi-bank holding company and covers the period from 1986:Q2to 2008:Q2.
Number of Obs.
Banks affiliated with a publicly traded, tiered BHC 46,034Banks affiliated with a publicly traded, nontiered BHC 44,568Banks affiliated with a nonpublicly traded, tiered BHC 36,550Banks affiliated with a nonpublicly traded, nontiered BHC 89,175Total 216,327
are affiliated with a multi-BHC, a banking organization that has at least two bank subsidiaries,are kept. I eliminate credit card banks and banks that are not active in the loan market.7 Inaddition, I exclude de novo bank observations by omitting the first eight quarters of a bank’s life.Foreign-owned banks, as well as banks located outside the continental United States, are alsoomitted. To avoid discrete jumps in the value of the dependent variables associated with bankmergers, I remove bank quarter observations where a merger occurs, as well as observations ofthe subsequent quarter of adjustment to the merger, from the sample. Finally, I eliminate obser-vations with extreme values (outliers). That is, observations with values for the dependent andindependent variables that deviate by more than four standard deviations from the variable’s meanvalue.
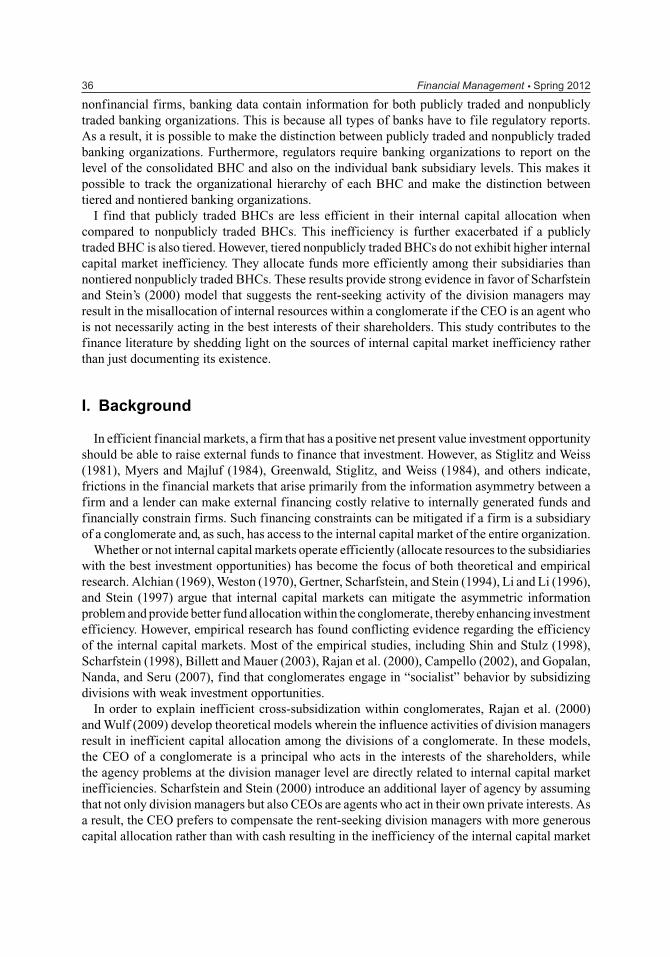
To distinguish between publicly traded and nonpublicly traded BHCs, I match Call Reports datawith the Center for Research in Security Prices (CRSP) database as in Holod and Peek (2007).To identify the organizational hierarchy of each BHC, I start at the bottom level of a bankingorganization and move up. If a direct holder of all bank subsidiaries of a BHC is also their highestholder (direct holder ID = highest holder ID), I consider such a BHC to be nontiered. If the directholder’s ID is different from the highest holder’s ID for at least one subsidiary (direct holder ID �=highest holder ID), there is at least one additional layer of control above the direct holder forthat subsidiary. Banking organizations that have at least one such subsidiary are considered tieredBHCs. Figure 1 illustrates some possible structures of tiered and nontiered banking organizations.
Table I presents the distribution of the observations across different bank subgroups. As onewould expect, banks affiliated with a publicly traded BHC are more likely to be affiliated with atiered BHC. It is important to note, however, that banks affiliated with a tiered BHC account for ameaningful share of the observations, even within a group of nonpublicly traded banks. Whetheror not a bank is in a publicly traded BHC is generally not indicative of whether a bank is in atiered BHC. Consequently, in the empirical analysis below, it is possible to isolate the effect ofa bank that is publicly traded from a bank in a tiered BHC. The summary statistics of the keyvariables for the resulting regression sample are presented in Table II.
IV. Results
The results from the estimation of Equation (1) can be found in Panel A of Table III . As we cansee from the table, most of the coefficients have expected signs and are statistically significant.
7 Credit card banks include those identified in the Call Reports as credit card banks, as well as any remaining bankswith a value of credit card loans with total loans exceeding 50%. Banks with a maximum (over the entire sample period)loans-to-assets ratio of less than 5% were not considered active in the loan market.
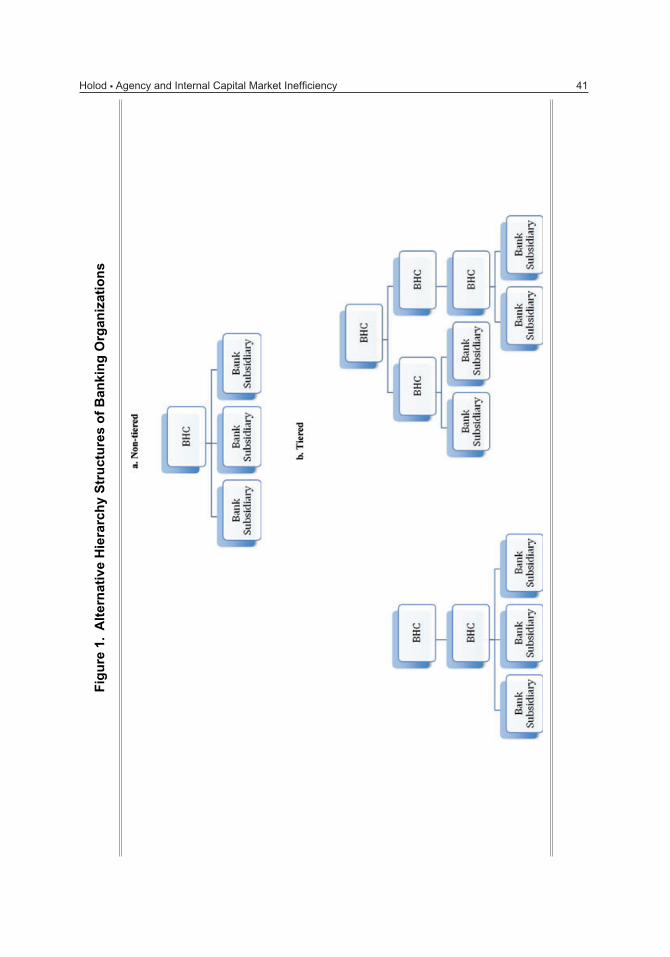
Holod � Agency and Internal Capital Market Inefficiency 41F
igu
re1.
Alt
ern
ativ
eH
iera
rch
yS
tru
ctu
res
of
Ban
kin
gO
rgan
izat
ion
s
42 Financial Management � Spring 2012
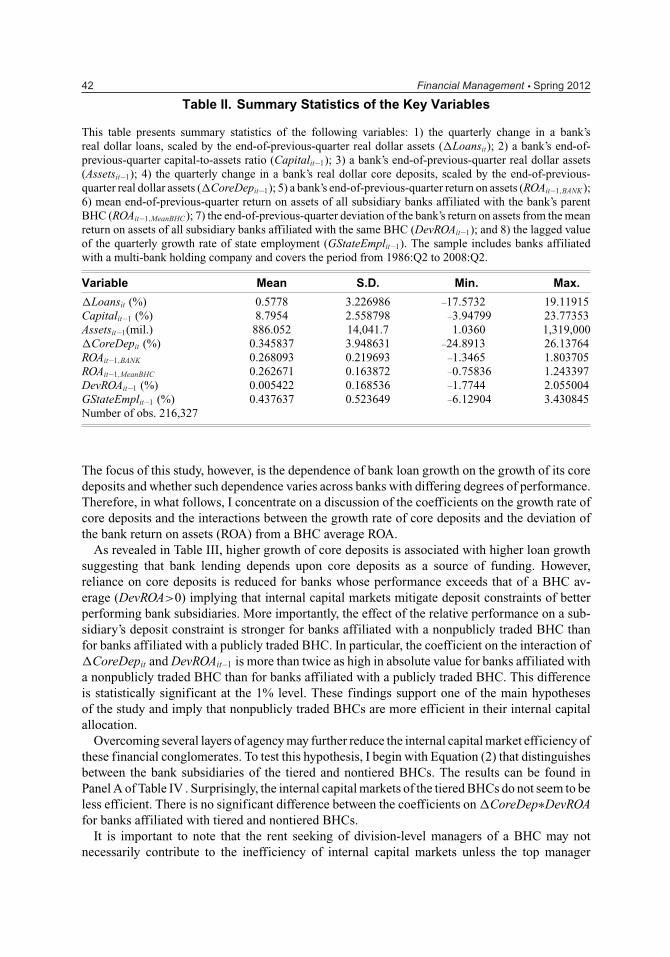
Table II. Summary Statistics of the Key Variables
This table presents summary statistics of the following variables: 1) the quarterly change in a bank’sreal dollar loans, scaled by the end-of-previous-quarter real dollar assets (�Loansit); 2) a bank’s end-of-previous-quarter capital-to-assets ratio (Capitalit–1); 3) a bank’s end-of-previous-quarter real dollar assets(Assetsit–1); 4) the quarterly change in a bank’s real dollar core deposits, scaled by the end-of-previous-quarter real dollar assets (�CoreDepit–1); 5) a bank’s end-of-previous-quarter return on assets (ROAit–1,BANK);6) mean end-of-previous-quarter return on assets of all subsidiary banks affiliated with the bank’s parentBHC (ROAit–1,MeanBHC); 7) the end-of-previous-quarter deviation of the bank’s return on assets from the meanreturn on assets of all subsidiary banks affiliated with the same BHC (DevROAit–1); and 8) the lagged valueof the quarterly growth rate of state employment (GStateEmplit–1). The sample includes banks affiliatedwith a multi-bank holding company and covers the period from 1986:Q2 to 2008:Q2.
Variable Mean S.D. Min. Max.
�Loansit (%) 0.5778 3.226986 –17.5732 19.11915Capitalit–1 (%) 8.7954 2.558798 –3.94799 23.77353Assetsit–1(mil.) 886.052 14,041.7 1.0360 1,319,000�CoreDepit (%) 0.345837 3.948631 –24.8913 26.13764ROAit–1,BANK 0.268093 0.219693 –1.3465 1.803705ROAit–1,MeanBHC 0.262671 0.163872 –0.75836 1.243397DevROAit–1 (%) 0.005422 0.168536 –1.7744 2.055004GStateEmplit–1 (%) 0.437637 0.523649 –6.12904 3.430845Number of obs. 216,327
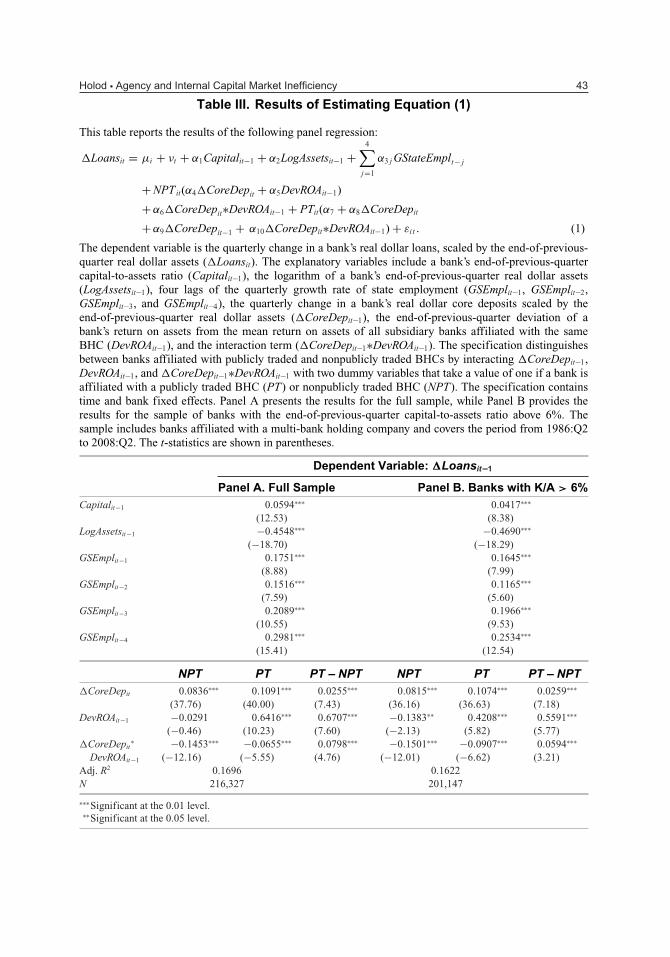
The focus of this study, however, is the dependence of bank loan growth on the growth of its coredeposits and whether such dependence varies across banks with differing degrees of performance.Therefore, in what follows, I concentrate on a discussion of the coefficients on the growth rate ofcore deposits and the interactions between the growth rate of core deposits and the deviation ofthe bank return on assets (ROA) from a BHC average ROA.
As revealed in Table III, higher growth of core deposits is associated with higher loan growthsuggesting that bank lending depends upon core deposits as a source of funding. However,reliance on core deposits is reduced for banks whose performance exceeds that of a BHC av-erage (DevROA>0) implying that internal capital markets mitigate deposit constraints of betterperforming bank subsidiaries. More importantly, the effect of the relative performance on a sub-sidiary’s deposit constraint is stronger for banks affiliated with a nonpublicly traded BHC thanfor banks affiliated with a publicly traded BHC. In particular, the coefficient on the interaction of�CoreDepit and DevROAit–1 is more than twice as high in absolute value for banks affiliated witha nonpublicly traded BHC than for banks affiliated with a publicly traded BHC. This differenceis statistically significant at the 1% level. These findings support one of the main hypothesesof the study and imply that nonpublicly traded BHCs are more efficient in their internal capitalallocation.
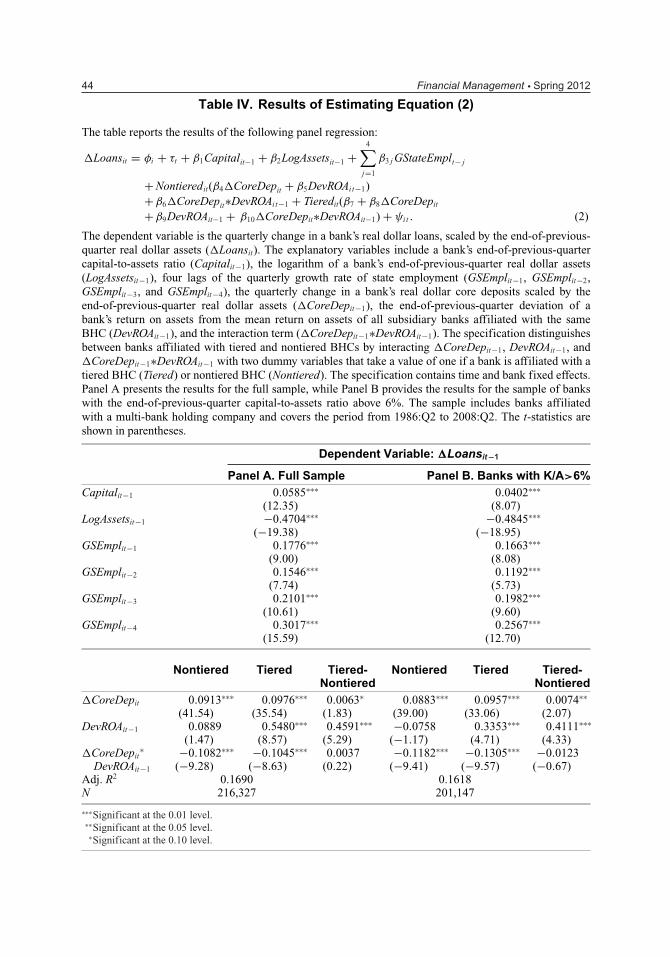
Overcoming several layers of agency may further reduce the internal capital market efficiency ofthese financial conglomerates. To test this hypothesis, I begin with Equation (2) that distinguishesbetween the bank subsidiaries of the tiered and nontiered BHCs. The results can be found inPanel A of Table IV . Surprisingly, the internal capital markets of the tiered BHCs do not seem to beless efficient. There is no significant difference between the coefficients on �CoreDep∗DevROAfor banks affiliated with tiered and nontiered BHCs.
It is important to note that the rent seeking of division-level managers of a BHC may notnecessarily contribute to the inefficiency of internal capital markets unless the top manager
Holod � Agency and Internal Capital Market Inefficiency 43
Table III. Results of Estimating Equation (1)
This table reports the results of the following panel regression:
�Loansit = μi + νt + α1Capitalit−1 + α2LogAssetsit−1 +4∑
j=1
α3 j GStateEmplt− j
+ NPTit(α4�CoreDepit + α5DevROAit−1)
+ α6�CoreDepit∗DevROAit−1 + PTit(α7 + α8�CoreDepit
+ α9�CoreDepit−1 + α10�CoreDepit∗DevROAit−1) + εi t . (1)
The dependent variable is the quarterly change in a bank’s real dollar loans, scaled by the end-of-previous-quarter real dollar assets (�Loansit). The explanatory variables include a bank’s end-of-previous-quartercapital-to-assets ratio (Capitalit–1), the logarithm of a bank’s end-of-previous-quarter real dollar assets(LogAssetsit–1), four lags of the quarterly growth rate of state employment (GSEmplit–1, GSEmplit–2,GSEmplit–3, and GSEmplit–4), the quarterly change in a bank’s real dollar core deposits scaled by theend-of-previous-quarter real dollar assets (�CoreDepit–1), the end-of-previous-quarter deviation of abank’s return on assets from the mean return on assets of all subsidiary banks affiliated with the sameBHC (DevROAit–1), and the interaction term (�CoreDepit–1∗DevROAit–1). The specification distinguishesbetween banks affiliated with publicly traded and nonpublicly traded BHCs by interacting �CoreDepit–1,DevROAit–1, and �CoreDepit–1∗DevROAit–1 with two dummy variables that take a value of one if a bank isaffiliated with a publicly traded BHC (PT) or nonpublicly traded BHC (NPT). The specification containstime and bank fixed effects. Panel A presents the results for the full sample, while Panel B provides theresults for the sample of banks with the end-of-previous-quarter capital-to-assets ratio above 6%. Thesample includes banks affiliated with a multi-bank holding company and covers the period from 1986:Q2to 2008:Q2. The t-statistics are shown in parentheses.
Dependent Variable: �Loansit–1
Panel A. Full Sample Panel B. Banks with K/A > 6%Capitalit−1 0.0594∗∗∗ 0.0417∗∗∗
(12.53) (8.38)LogAssetsit−1 −0.4548∗∗∗ −0.4690∗∗∗
(−18.70) (−18.29)GSEmplit−1 0.1751∗∗∗ 0.1645∗∗∗
(8.88) (7.99)GSEmplit−2 0.1516∗∗∗ 0.1165∗∗∗
(7.59) (5.60)GSEmplit−3 0.2089∗∗∗ 0.1966∗∗∗
(10.55) (9.53)GSEmplit−4 0.2981∗∗∗ 0.2534∗∗∗
(15.41) (12.54)
NPT PT PT – NPT NPT PT PT – NPT�CoreDepit 0.0836∗∗∗ 0.1091∗∗∗ 0.0255∗∗∗ 0.0815∗∗∗ 0.1074∗∗∗ 0.0259∗∗∗
(37.76) (40.00) (7.43) (36.16) (36.63) (7.18)DevROAit−1 −0.0291 0.6416∗∗∗ 0.6707∗∗∗ −0.1383∗∗ 0.4208∗∗∗ 0.5591∗∗∗
(−0.46) (10.23) (7.60) (−2.13) (5.82) (5.77)�CoreDepit
∗ −0.1453∗∗∗ −0.0655∗∗∗ 0.0798∗∗∗ −0.1501∗∗∗ −0.0907∗∗∗ 0.0594∗∗∗
DevROAit−1 (−12.16) (−5.55) (4.76) (−12.01) (−6.62) (3.21)Adj. R2 0.1696 0.1622N 216,327 201,147
∗∗∗Significant at the 0.01 level.∗∗Significant at the 0.05 level.
44 Financial Management � Spring 2012
Table IV. Results of Estimating Equation (2)
The table reports the results of the following panel regression:
�Loansit = φi + τt + β1Capitalit−1 + β2LogAssetsit−1 +4∑
j=1
β3 j GStateEmplt− j
+ Nontieredit(β4�CoreDepit + β5DevROAit−1)+ β6�CoreDepit∗DevROAit−1 + Tieredit(β7 + β8�CoreDepit
+β9DevROAit−1 + β10�CoreDepit∗DevROAit−1) + ψi t . (2)
The dependent variable is the quarterly change in a bank’s real dollar loans, scaled by the end-of-previous-quarter real dollar assets (�Loansit). The explanatory variables include a bank’s end-of-previous-quartercapital-to-assets ratio (Capitalit−1), the logarithm of a bank’s end-of-previous-quarter real dollar assets(LogAssetsit−1), four lags of the quarterly growth rate of state employment (GSEmplit−1, GSEmplit−2,GSEmplit−3, and GSEmplit−4), the quarterly change in a bank’s real dollar core deposits scaled by theend-of-previous-quarter real dollar assets (�CoreDepit−1), the end-of-previous-quarter deviation of abank’s return on assets from the mean return on assets of all subsidiary banks affiliated with the sameBHC (DevROAit−1), and the interaction term (�CoreDepit−1∗DevROAit−1). The specification distinguishesbetween banks affiliated with tiered and nontiered BHCs by interacting �CoreDepit−1, DevROAit−1, and�CoreDepit−1∗DevROAit−1 with two dummy variables that take a value of one if a bank is affiliated with atiered BHC (Tiered) or nontiered BHC (Nontiered). The specification contains time and bank fixed effects.Panel A presents the results for the full sample, while Panel B provides the results for the sample of bankswith the end-of-previous-quarter capital-to-assets ratio above 6%. The sample includes banks affiliatedwith a multi-bank holding company and covers the period from 1986:Q2 to 2008:Q2. The t-statistics areshown in parentheses.
Dependent Variable: �Loansit−1
Panel A. Full Sample Panel B. Banks with K/A>6%Capitalit−1 0.0585∗∗∗ 0.0402∗∗∗
(12.35) (8.07)LogAssetsit−1 −0.4704∗∗∗ −0.4845∗∗∗
(−19.38) (−18.95)GSEmplit−1 0.1776∗∗∗ 0.1663∗∗∗
(9.00) (8.08)GSEmplit−2 0.1546∗∗∗ 0.1192∗∗∗
(7.74) (5.73)GSEmplit−3 0.2101∗∗∗ 0.1982∗∗∗
(10.61) (9.60)GSEmplit−4 0.3017∗∗∗ 0.2567∗∗∗
(15.59) (12.70)
Nontiered Tiered Tiered- Nontiered Tiered Tiered-Nontiered Nontiered
�CoreDepit 0.0913∗∗∗ 0.0976∗∗∗ 0.0063∗ 0.0883∗∗∗ 0.0957∗∗∗ 0.0074∗∗
(41.54) (35.54) (1.83) (39.00) (33.06) (2.07)DevROAit−1 0.0889 0.5480∗∗∗ 0.4591∗∗∗ −0.0758 0.3353∗∗∗ 0.4111∗∗∗
(1.47) (8.57) (5.29) (−1.17) (4.71) (4.33)�CoreDepit
∗ −0.1082∗∗∗ −0.1045∗∗∗ 0.0037 −0.1182∗∗∗ −0.1305∗∗∗ −0.0123DevROAit−1 (−9.28) (−8.63) (0.22) (−9.41) (−9.57) (−0.67)
Adj. R2 0.1690 0.1618N 216,327 201,147
∗∗∗Significant at the 0.01 level.∗∗Significant at the 0.05 level.∗Significant at the 0.10 level.
Holod � Agency and Internal Capital Market Inefficiency 45
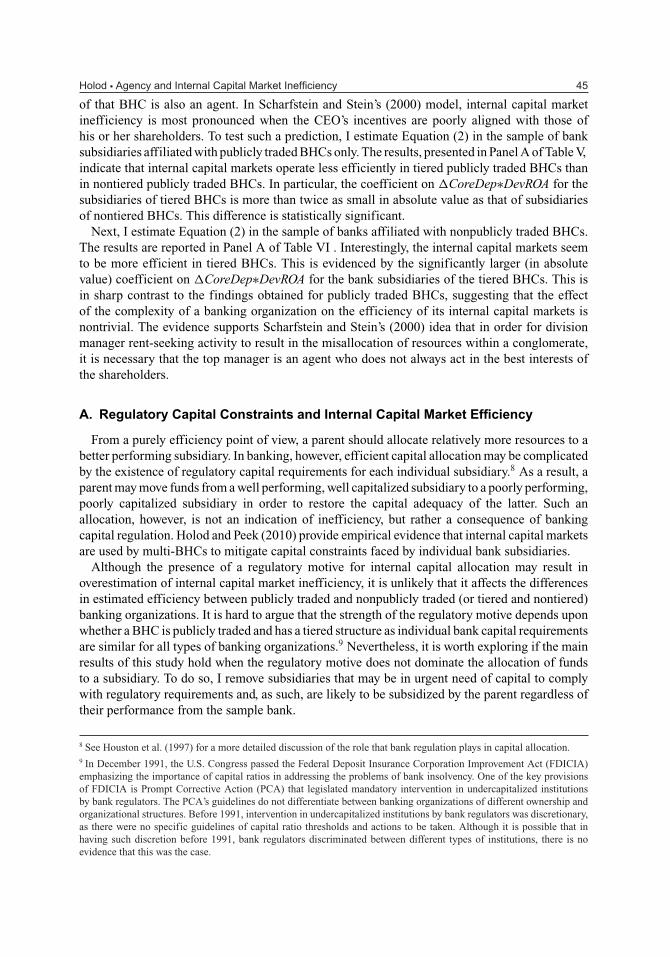
of that BHC is also an agent. In Scharfstein and Stein’s (2000) model, internal capital marketinefficiency is most pronounced when the CEO’s incentives are poorly aligned with those ofhis or her shareholders. To test such a prediction, I estimate Equation (2) in the sample of banksubsidiaries affiliated with publicly traded BHCs only. The results, presented in Panel A of Table V,indicate that internal capital markets operate less efficiently in tiered publicly traded BHCs thanin nontiered publicly traded BHCs. In particular, the coefficient on �CoreDep∗DevROA for thesubsidiaries of tiered BHCs is more than twice as small in absolute value as that of subsidiariesof nontiered BHCs. This difference is statistically significant.
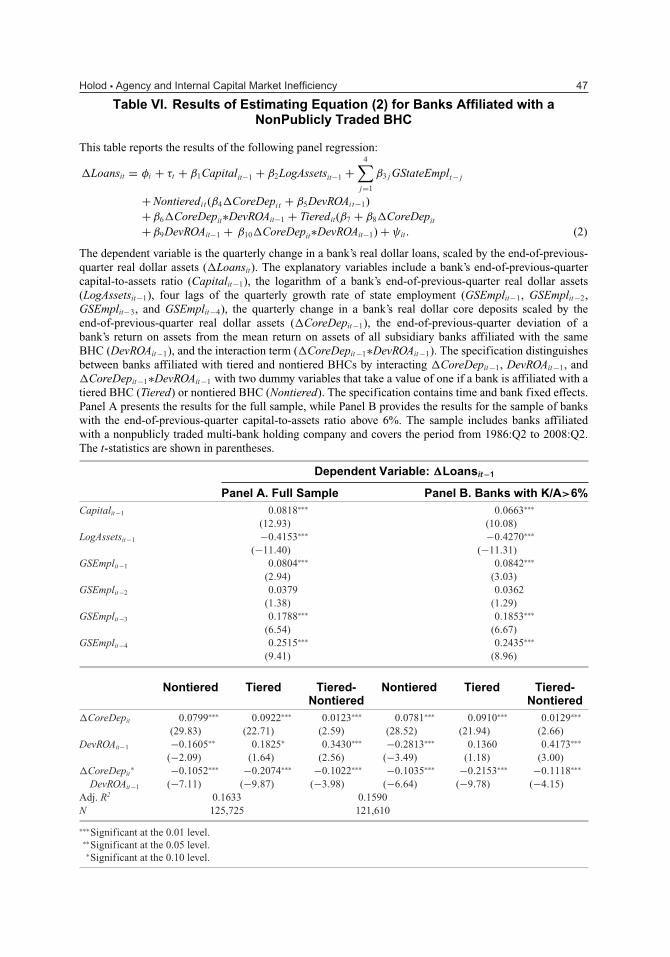
Next, I estimate Equation (2) in the sample of banks affiliated with nonpublicly traded BHCs.The results are reported in Panel A of Table VI . Interestingly, the internal capital markets seemto be more efficient in tiered BHCs. This is evidenced by the significantly larger (in absolutevalue) coefficient on �CoreDep∗DevROA for the bank subsidiaries of the tiered BHCs. This isin sharp contrast to the findings obtained for publicly traded BHCs, suggesting that the effectof the complexity of a banking organization on the efficiency of its internal capital markets isnontrivial. The evidence supports Scharfstein and Stein’s (2000) idea that in order for divisionmanager rent-seeking activity to result in the misallocation of resources within a conglomerate,it is necessary that the top manager is an agent who does not always act in the best interests ofthe shareholders.
A. Regulatory Capital Constraints and Internal Capital Market Efficiency
From a purely efficiency point of view, a parent should allocate relatively more resources to abetter performing subsidiary. In banking, however, efficient capital allocation may be complicatedby the existence of regulatory capital requirements for each individual subsidiary.8 As a result, aparent may move funds from a well performing, well capitalized subsidiary to a poorly performing,poorly capitalized subsidiary in order to restore the capital adequacy of the latter. Such anallocation, however, is not an indication of inefficiency, but rather a consequence of bankingcapital regulation. Holod and Peek (2010) provide empirical evidence that internal capital marketsare used by multi-BHCs to mitigate capital constraints faced by individual bank subsidiaries.
Although the presence of a regulatory motive for internal capital allocation may result inoverestimation of internal capital market inefficiency, it is unlikely that it affects the differencesin estimated efficiency between publicly traded and nonpublicly traded (or tiered and nontiered)banking organizations. It is hard to argue that the strength of the regulatory motive depends uponwhether a BHC is publicly traded and has a tiered structure as individual bank capital requirementsare similar for all types of banking organizations.9 Nevertheless, it is worth exploring if the mainresults of this study hold when the regulatory motive does not dominate the allocation of fundsto a subsidiary. To do so, I remove subsidiaries that may be in urgent need of capital to complywith regulatory requirements and, as such, are likely to be subsidized by the parent regardless oftheir performance from the sample bank.
8 See Houston et al. (1997) for a more detailed discussion of the role that bank regulation plays in capital allocation.9 In December 1991, the U.S. Congress passed the Federal Deposit Insurance Corporation Improvement Act (FDICIA)emphasizing the importance of capital ratios in addressing the problems of bank insolvency. One of the key provisionsof FDICIA is Prompt Corrective Action (PCA) that legislated mandatory intervention in undercapitalized institutionsby bank regulators. The PCA’s guidelines do not differentiate between banking organizations of different ownership andorganizational structures. Before 1991, intervention in undercapitalized institutions by bank regulators was discretionary,as there were no specific guidelines of capital ratio thresholds and actions to be taken. Although it is possible that inhaving such discretion before 1991, bank regulators discriminated between different types of institutions, there is noevidence that this was the case.

46 Financial Management � Spring 2012
Table V. Results of Estimating Equation (2) for Banks Affiliated with a PubliclyTraded BHC
This table reports the results of the following panel regression:
�Loansit = φi + τt + β1Capitalit−1 + β2LogAssetsit−1 +4∑
j=1
β3 j GStateEmplt− j
+ Nontieredit(β4�CoreDepit + β5DevROAit−1)
+β6�CoreDepit∗DevROAit−1 + Tieredit(β7 + β8�CoreDepit
+β9DevROAit−1 + β10�CoreDepit∗DevROAit−1) + ψi t . (2)
The dependent variable is the quarterly change in a bank’s real dollar loans, scaled by the end-of-previous-quarter real dollar assets (�Loansit). The explanatory variables include a bank’s end-of-previous-quartercapital-to-assets ratio (Capitalit−1), the logarithm of a bank’s end-of-previous-quarter real dollar assets(LogAssetsit−1), four lags of the quarterly growth rate of state employment (GSEmplit−1, GSEmplit−2,GSEmplit−3, and GSEmplit−4), the quarterly change in a bank’s real dollar core deposits scaled by theend-of-previous-quarter real dollar assets (�CoreDepit−1), the end-of-previous-quarter deviation of abank’s return on assets from the mean return on assets of all subsidiary banks affiliated with the sameBHC (DevROAit−1), and the interaction term (�CoreDepit−1∗DevROAit−1). The specification distinguishesbetween banks affiliated with tiered and nontiered BHCs by interacting �CoreDepit−1, DevROAit−1, and�CoreDepit−1∗DevROAit−1 with two dummy variables that take a value of one if a bank is affiliated with atiered BHC (Tiered) or nontiered BHC (Nontiered). The specification contains time and bank fixed effects.Panel A presents the results for the full sample, while Panel B provides the results for the sample of bankswith the end-of-previous-quarter capital-to-assets ratio above 6%. The sample includes banks affiliatedwith a publicly traded multi-bank holding company and covers the period from 1986:Q2 to 2008:Q2. Thet-statistics are shown in parentheses.
Dependent Variable: �Loansit−1
Panel A. Full Sample Panel B. Banks with K/A>6%Capitalit−1 0.0444∗∗∗ 0.0223∗∗∗
(5.73) (2.69)LogAssetsit−1 −0.4579∗∗∗ −0.4778∗∗∗
(−12.56) (−12.24)GSEmplit−1 0.2441∗∗∗ 0.2351∗∗∗
(8.53) (7.64)GSEmplit−2 0.2385∗∗∗ 0.1770∗∗∗
(8.21) (5.67)GSEmplit−3 0.1969∗∗∗ 0.1716∗∗∗
(6.85) (5.55)GSEmplit−4 0.3193∗∗∗ 0.2368∗∗∗
(11.34) (7.79)
Nontiered Tiered Tiered- Nontiered Tiered Tiered-Nontiered Nontiered
�CoreDepit 0.1097∗∗∗ 0.0947∗∗∗ −0.0150∗∗∗ 0.1068∗∗∗ 0.0923∗∗∗ −0.0145∗∗∗
(28.30) (25.58) (−2.89) (26.22) (23.02) (−2.61)DevROAit−1 0.4242∗∗∗ 0.7040∗∗∗ 0.2798∗∗ 0.2790∗∗∗ 0.4191∗∗∗ 0.1401
(4.28) (9.03) (2.26) (2.50) (4.67) (1.00)�CoreDepit
∗ −0.0903∗∗∗ −0.0423∗∗∗ 0.0480∗∗ −0.1179∗∗∗ −0.0602∗∗∗ 0.0577∗∗
DevROAit−1 (−4.77) (2.89) (2.01) (−5.54) (−3.52) (2.12)Adj. R2 0.1984 0.1904N 90,602 79,537
∗∗∗Significant at the 0.01 level.∗∗Significant at the 0.05 level.
Holod � Agency and Internal Capital Market Inefficiency 47
Table VI. Results of Estimating Equation (2) for Banks Affiliated with aNonPublicly Traded BHC
This table reports the results of the following panel regression:
�Loansit = φi + τt + β1Capitalit−1 + β2LogAssetsit−1 +4∑
j=1
β3 j GStateEmplt− j
+ Nontieredit (β4�CoreDepit + β5DevROAit−1)+β6�CoreDepit∗DevROAit−1 + Tieredit(β7 + β8�CoreDepit
+ β9DevROAit−1 + β10�CoreDepit∗DevROAit−1) + ψit. (2)
The dependent variable is the quarterly change in a bank’s real dollar loans, scaled by the end-of-previous-quarter real dollar assets (�Loansit). The explanatory variables include a bank’s end-of-previous-quartercapital-to-assets ratio (Capitalit−1), the logarithm of a bank’s end-of-previous-quarter real dollar assets(LogAssetsit−1), four lags of the quarterly growth rate of state employment (GSEmplit−1, GSEmplit−2,GSEmplit−3, and GSEmplit−4), the quarterly change in a bank’s real dollar core deposits scaled by theend-of-previous-quarter real dollar assets (�CoreDepit−1), the end-of-previous-quarter deviation of abank’s return on assets from the mean return on assets of all subsidiary banks affiliated with the sameBHC (DevROAit−1), and the interaction term (�CoreDepit−1∗DevROAit−1). The specification distinguishesbetween banks affiliated with tiered and nontiered BHCs by interacting �CoreDepit−1, DevROAit−1, and�CoreDepit−1∗DevROAit−1 with two dummy variables that take a value of one if a bank is affiliated with atiered BHC (Tiered) or nontiered BHC (Nontiered). The specification contains time and bank fixed effects.Panel A presents the results for the full sample, while Panel B provides the results for the sample of bankswith the end-of-previous-quarter capital-to-assets ratio above 6%. The sample includes banks affiliatedwith a nonpublicly traded multi-bank holding company and covers the period from 1986:Q2 to 2008:Q2.The t-statistics are shown in parentheses.
Dependent Variable: �Loansit−1
Panel A. Full Sample Panel B. Banks with K/A>6%Capitalit−1 0.0818∗∗∗ 0.0663∗∗∗
(12.93) (10.08)LogAssetsit−1 −0.4153∗∗∗ −0.4270∗∗∗
(−11.40) (−11.31)GSEmplit−1 0.0804∗∗∗ 0.0842∗∗∗
(2.94) (3.03)GSEmplit−2 0.0379 0.0362
(1.38) (1.29)GSEmplit−3 0.1788∗∗∗ 0.1853∗∗∗
(6.54) (6.67)GSEmplit−4 0.2515∗∗∗ 0.2435∗∗∗
(9.41) (8.96)
Nontiered Tiered Tiered- Nontiered Tiered Tiered-Nontiered Nontiered
�CoreDepit 0.0799∗∗∗ 0.0922∗∗∗ 0.0123∗∗∗ 0.0781∗∗∗ 0.0910∗∗∗ 0.0129∗∗∗
(29.83) (22.71) (2.59) (28.52) (21.94) (2.66)DevROAit−1 −0.1605∗∗ 0.1825∗ 0.3430∗∗∗ −0.2813∗∗∗ 0.1360 0.4173∗∗∗
(−2.09) (1.64) (2.56) (−3.49) (1.18) (3.00)�CoreDepit
∗ −0.1052∗∗∗ −0.2074∗∗∗ −0.1022∗∗∗ −0.1035∗∗∗ −0.2153∗∗∗ −0.1118∗∗∗
DevROAit−1 (−7.11) (−9.87) (−3.98) (−6.64) (−9.78) (−4.15)Adj. R2 0.1633 0.1590N 125,725 121,610
∗∗∗Significant at the 0.01 level.∗∗Significant at the 0.05 level.∗Significant at the 0.10 level.
48 Financial Management � Spring 2012
I deem any bank subsidiary with a capital-to-assets ratio below 6% as capital constrained.According to the Prompt Corrective Action (PCA) provisions, undercapitalized banks face regu-latory intervention that result in major restrictions on the bank’s activities. A bank is consideredundercapitalized if its total risk-based capital ratio is less than 8%, its Tier 1 risk-based capitalratio is less than 4%, or its leverage ratio (unweighted capital-to-assets ratio) is less than 4%.Several studies that investigate the causes of the 1990s credit crunch conclude that the leverageratio requirement is the most binding of the three capital measures (Furlong, 1992; Baer andMcElravey, 1993; Berger and Udell, 1994; Shrieves and Dahl, 1995). Although a 4% leverageratio is the minimum stated required ratio, the literature indicates that, at least during the 1990scredit crunch, the effective minimum capital requirements were higher. For example, Baer andMcElravey (1993) suggest that most banking organizations operate under the 5% leverage re-quirement. Analyzing actual regulatory formal actions signed by New England banks during the1990s credit crunch, Peek and Rosengren (1995) conclude that a 6% leverage ratio was the mostcommon capital target for regulators. I follow Peek and Rosengren (1995) and use a 6% leverageratio threshold to identify capital constrained banks.10
The estimation results for the sample that omits banks with capital-to-assets ratios below6% can be found in Panel B of Tables III, IV, V, and VI. The results are similar to thoseobtained in the full sample, both qualitatively and quantitatively, suggesting that the originalresults are not driven by the undercapitalized subsidiaries requiring assistance from the parent. Inparticular, publicly traded BHCs are less efficient in mitigating the deposit constraints of betterperforming subsidiaries (Panel B of Table III). Tiered banking organizations are less efficientthan nontiered ones in a subsample of publicly traded BHCs (Panel B of Table V), but therelationship reverses itself in a subsample of nonpublicly traded BHCs (Panel B of Table VI).Not surprisingly, no significant difference in the efficiency between tiered and nontiered BHCsis observed in a sample that combines publicly traded and nonpublicly traded BHCs (Panel B ofTable IV).
B. Insider Ownership and Internal Capital Market Efficiency
One of the main assumptions of this study is that the CEO of a publicly traded firm is morelikely to be an agent than a CEO of a nonpublicly traded firm. The key argument is that topexecutives at closely held, nonpublicly traded companies are more likely to be the owners of thosecompanies, while CEOs of publicly traded companies are more likely to be hired managers withsmall company ownership. Although it is expected that, on average, executives of nonpubliclytraded firms have a greater stake in their firm than managers of publicly traded firms, there maystill be a variation of insider ownership within the sample of publicly traded firms. As a result,the degree of separation of ownership and control within publicly traded companies may vary.For example, the CEO of a publicly traded company who owns 70% of the shares may not haveincentives that are any different from that of a CEO of a nonpublicly traded company. Therefore,it is important to be sure that any observed differences between publicly traded and nonpubliclytraded BHCs are indeed related to agency problems.
To further investigate whether internal capital market inefficiency in publicly traded BHCsemanates from agency problems, I use data from the Compact Disclosure CDs and construct thevariable InsiderOwnership, defined as the percentage of shares held by all officers and directorsof a publicly traded banking organization. Unfortunately, the Compact Disclosure database israther incomprehensive. The data are only available from 1988:Q1 to 2006:Q2. Furthermore,
10 Qualitatively similar results were obtained using a 4% capital-to-assets threshold.
Holod � Agency and Internal Capital Market Inefficiency 49
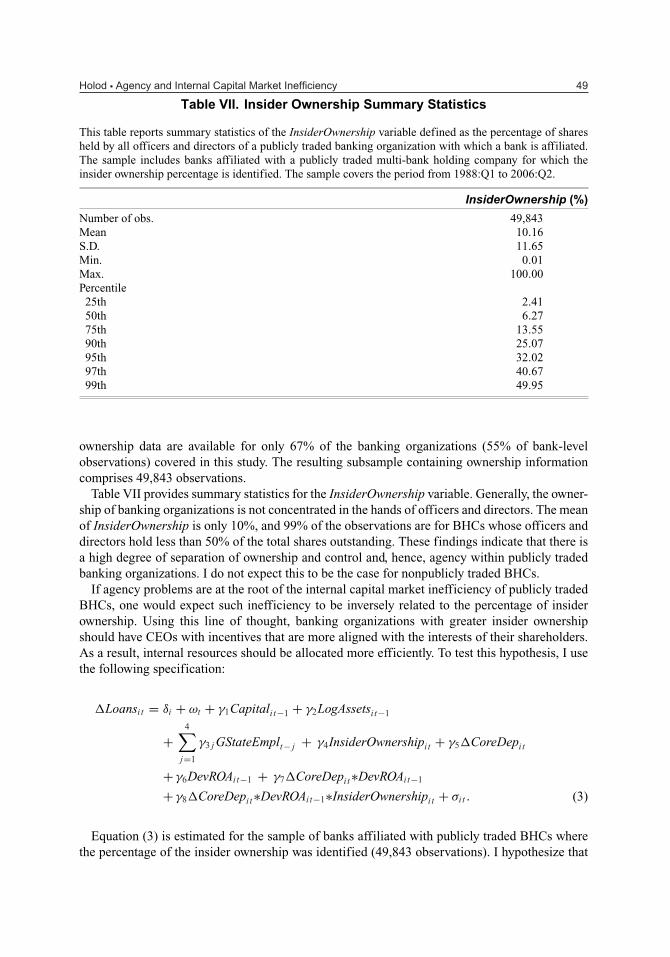
Table VII. Insider Ownership Summary Statistics
This table reports summary statistics of the InsiderOwnership variable defined as the percentage of sharesheld by all officers and directors of a publicly traded banking organization with which a bank is affiliated.The sample includes banks affiliated with a publicly traded multi-bank holding company for which theinsider ownership percentage is identified. The sample covers the period from 1988:Q1 to 2006:Q2.
InsiderOwnership (%)
Number of obs. 49,843Mean 10.16S.D. 11.65Min. 0.01Max. 100.00Percentile25th 2.4150th 6.2775th 13.5590th 25.0795th 32.0297th 40.6799th 49.95
ownership data are available for only 67% of the banking organizations (55% of bank-levelobservations) covered in this study. The resulting subsample containing ownership informationcomprises 49,843 observations.
Table VII provides summary statistics for the InsiderOwnership variable. Generally, the owner-ship of banking organizations is not concentrated in the hands of officers and directors. The meanof InsiderOwnership is only 10%, and 99% of the observations are for BHCs whose officers anddirectors hold less than 50% of the total shares outstanding. These findings indicate that there isa high degree of separation of ownership and control and, hence, agency within publicly tradedbanking organizations. I do not expect this to be the case for nonpublicly traded BHCs.
If agency problems are at the root of the internal capital market inefficiency of publicly tradedBHCs, one would expect such inefficiency to be inversely related to the percentage of insiderownership. Using this line of thought, banking organizations with greater insider ownershipshould have CEOs with incentives that are more aligned with the interests of their shareholders.As a result, internal resources should be allocated more efficiently. To test this hypothesis, I usethe following specification:
�Loansit = δi + ωt + γ1Capitalit−1 + γ2LogAssetsit−1
+4∑
j=1
γ3 j GStateEmplt− j + γ4InsiderOwnershipit + γ5�CoreDepit
+ γ6DevROAit−1 + γ7�CoreDepit∗DevROAit−1
+ γ8�CoreDepit∗DevROAit−1∗InsiderOwnershipit + σi t . (3)
Equation (3) is estimated for the sample of banks affiliated with publicly traded BHCs wherethe percentage of the insider ownership was identified (49,843 observations). I hypothesize that
50 Financial Management � Spring 2012
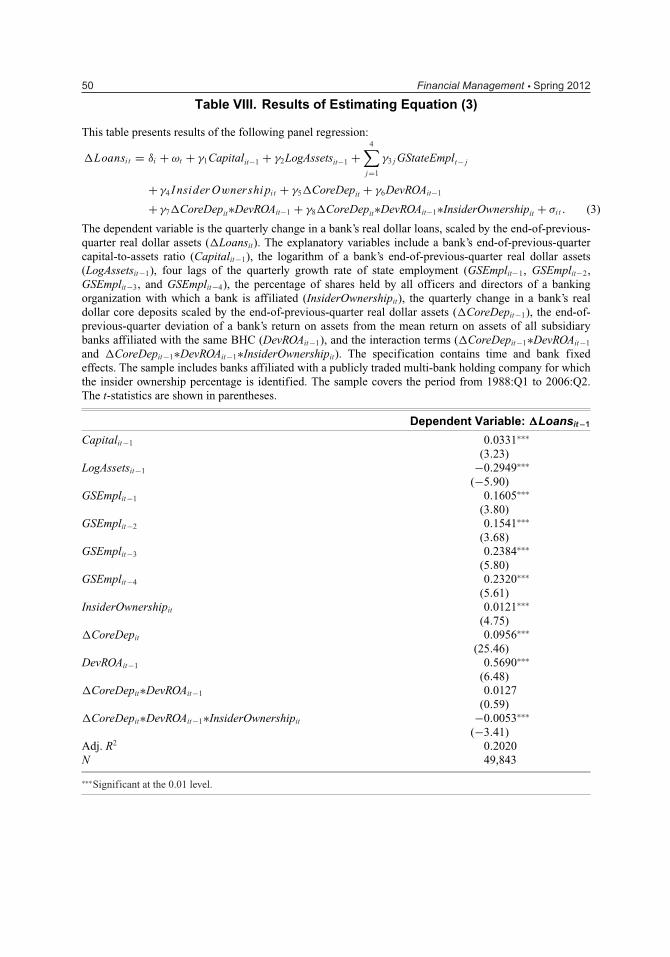
Table VIII. Results of Estimating Equation (3)
This table presents results of the following panel regression:
�Loansit = δi + ωt + γ1Capitalit−1 + γ2LogAssetsit−1 +4∑
j=1
γ3 j GStateEmplt− j
+ γ4 I nsider Ownershipit + γ5�CoreDepit + γ6DevROAit−1
+ γ7�CoreDepit∗DevROAit−1 + γ8�CoreDepit∗DevROAit−1∗InsiderOwnershipit + σi t . (3)
The dependent variable is the quarterly change in a bank’s real dollar loans, scaled by the end-of-previous-quarter real dollar assets (�Loansit). The explanatory variables include a bank’s end-of-previous-quartercapital-to-assets ratio (Capitalit−1), the logarithm of a bank’s end-of-previous-quarter real dollar assets(LogAssetsit−1), four lags of the quarterly growth rate of state employment (GSEmplit−1, GSEmplit−2,GSEmplit−3, and GSEmplit−4), the percentage of shares held by all officers and directors of a bankingorganization with which a bank is affiliated (InsiderOwnershipit), the quarterly change in a bank’s realdollar core deposits scaled by the end-of-previous-quarter real dollar assets (�CoreDepit−1), the end-of-previous-quarter deviation of a bank’s return on assets from the mean return on assets of all subsidiarybanks affiliated with the same BHC (DevROAit−1), and the interaction terms (�CoreDepit−1∗DevROAit−1
and �CoreDepit−1∗DevROAit−1∗InsiderOwnershipit). The specification contains time and bank fixedeffects. The sample includes banks affiliated with a publicly traded multi-bank holding company for whichthe insider ownership percentage is identified. The sample covers the period from 1988:Q1 to 2006:Q2.The t-statistics are shown in parentheses.
Dependent Variable: �Loansit−1
Capitalit−1 0.0331∗∗∗
(3.23)LogAssetsit−1 −0.2949∗∗∗
(−5.90)GSEmplit−1 0.1605∗∗∗
(3.80)GSEmplit−2 0.1541∗∗∗
(3.68)GSEmplit−3 0.2384∗∗∗
(5.80)GSEmplit−4 0.2320∗∗∗
(5.61)InsiderOwnershipit 0.0121∗∗∗
(4.75)�CoreDepit 0.0956∗∗∗
(25.46)DevROAit−1 0.5690∗∗∗
(6.48)�CoreDepit∗DevROAit−1 0.0127
(0.59)�CoreDepit∗DevROAit−1∗InsiderOwnershipit −0.0053∗∗∗
(−3.41)Adj. R2 0.2020N 49,843
∗∗∗Significant at the 0.01 level.
Holod � Agency and Internal Capital Market Inefficiency 51
BHCs with a greater percentage of insider ownership are better able to reduce loan growth-coredeposit growth sensitivity of their better performing subsidiaries (γ 8 < 0).
The results from the estimation of Equation (3) are provided in Table VIII. The coefficient γ 8
is negative and statistically significant, suggesting that higher insider ownership alleviates theinternal capital market inefficiency of publicly traded BHCs. For instance, if the officers anddirectors own 50% of the BHCs’ shares, the coefficient on the �CoreDep∗DevROA is equal to−0.25 (= 0.0127 – 0.0053 ∗ 50). As such, the loan growth of a better performing subsidiary ismuch less constrained by its core deposit growth than the loan growth of a poorly performingsubsidiary. Conversely, if insider ownership is 10% (corresponding to the mean insider ownershipin the sample), the coefficient on �CoreDep∗DevROA is only −0.04, indicating that better relativeperformance of a subsidiary does not substantially reduce its loan growth-core deposit growthsensitivity. This suggests that BHCs with low insider ownership are not channeling resources tobetter performing subsidiaries to the same degree as the BHCs with high insider ownership.
V. Conclusions
Using banking data, I investigate whether agency problems at different levels of an organiza-tional hierarchy contribute to internal capital market inefficiencies. I find that publicly tradedBHCs are less efficient in their internal capital allocation than nonpublicly traded BHCs, sug-gesting that the divergence of interests between the CEO and shareholders is an important sourceof internal capital market inefficiency. Moreover, I find that tiered BHCs are less efficient thannontiered BHCs, but only within a sample of publicly traded BHCs. This finding implies thatagency problems at the division level contribute to the inefficiency of the internal capital alloca-tion only if the top manager is an agent. The results are consistent with the model of Scharfsteinand Stein (2000), where the agency problems at both the top and division management levelsgenerate inefficient internal capital allocation. �
References
Alchian, A., 1969, “Corporate Management and Property Rights,” in H. Manne, Ed., Economic Policy andthe Regulation of Corporate Securities, Washington, DC, American Enterprise Institute, 337-360.
Ang, J., R. Cole, and J. Lin, 2000, “Agency Costs and Ownership Structure,” Journal of Finance 55, 81-106.
Baer, H. and J. McEiravey, 1993, “Risk-Based Capital and Bank Growth,” Proceedings of the 29th AnnualConference on Bank Structure and Competition.
Berger, A. and G. Udell, 1994, “Federal Credit Allocation: Theory, Evidence, and History,” Journal ofMoney, Credit and Banking 26, 585-628.
Billet, M. and D. Mauer, 2003, “Cross Subsidies, External Financing Constraints, and the Contribution ofthe Internal Capital Market to Firm Value,” Review of Financial Studies 16, 1167-1201.
Campello, M., 2002, “Internal Capital Markets in Financial Conglomerates: Evidence from Small BankResponses to Monetary Policy,” Journal of Finance 57, 2773-2805.
Cremers, M., R. Huang, and Z. Saunter, 2011, “Internal Capital Markets and Corporate Politics in a BankingGroup,” Review of Financial Studies 24, 358-401.
Duchin, R. and D. Sosyura, 2011, “Divisional Managers and Internal Capital Markets,” University ofMichigan Working paper.
52 Financial Management � Spring 2012
Furlong, F., 1992, “Capital Regulation and Bank Lending,” Federal Reserve Bank of San Francisco EconomicReview 3, 23-33.
Gertner, R., D. Scharfstein, and J. Stein, 1994, “Internal versus External Capital Markets,” Quarterly Journalof Economics 109, 1211-1230.
Glaser, M., F. Lopez de Silanes, and Z. Saunter, 2011, “Opening the Black Box: Internal Capital Marketsand Managerial Power,” University of Amsterdam Working paper.
Gopalan, R., V. Nanda, and A. Seru, 2007, “Affiliated Firms and Financial Support: Evidence from IndianBusiness Groups,” Journal of Financial Economics 86, 759-795.
Greenwald, B., J. Stiglitz, and A. Weiss, 1984, “Informational Imperfections in the Capital Market andMacroeconomic Fluctuations,” American Economic Review 74, 194-199.
Holod, D. and J. Peek, 2007, “Asymmetric Information and Liquidity Constraints: A New Test,” Journal ofBanking and Finance 31, 2415-2451.
Holod, D. and J. Peek, 2010, “Capital Constraints, Asymmetric Information, and Internal Capital Marketsin Banking: New Evidence,” Journal of Money, Credit and Banking 42, 879-906.
Houston, J. and C. James, 1998, “Do Bank Internal Capital Markets Promote Lending?” Journal of Bankingand Finance 22, 899-918.
Houston, J., C. James, and D. Marcus, 1997, “Capital Market Frictions and the Role of Internal CapitalMarkets in Banking,” Journal of Financial Economics 46, 135-146.
Jayarante, J. and D. Morgan, 2000, “Capital Market Frictions and Deposit Constraints at Banks,” Journal ofMoney, Credit, and Banking 32, 74-92.
Li, D. and S. Li, 1996, “A Theory of Corporate Scope and Financial Structure,” Journal of Finance 51,691-709.
Mikkelson, W., M. Partch, and K. Shah, 1997, “Ownership and Operating Performance of Companies thatGo Public,” Journal of Financial Economics 44, 279-307.
Myers, S. and N. Majluf, 1984, “Corporate Financing and Investment Decisions When Firms Have Infor-mation that Investors Do Not Have,” Journal of Financial Economics 13, 187-221.
Palia, D., 1999, “Corporate Governance and the Diversification Discount,” UCLA Working paper.
Peek, J. and E. Rosengren, 1995, “Bank Regulation and the Credit Crunch,” Journal of Banking and Finance19, 679-692.
Rajan, R., H. Servaes, and L. Zingales, 2000, “The Cost of Diversity: The Diversification Discount andInefficient Investment,” Journal of Finance 55, 35-80.
Scharfstein, D., 1998, “The Dark Side of Internal Capital Markets II: Evidence from Diversified Conglom-erates,” NBER Working paper #6352.
Scharfstein, D. and J. Stein, 2000, “The Dark Side of Internal Capital Markets: Divisional Rent-Seeking andInefficient Investment,” Journal of Finance 55, 2537-2564.
Shin, H. and R. Stulz, 1998, “Are Internal Capital Markets Efficient?” Quarterly Journal of Economics 113,531-552.
Shrieves, R. and D. Dahl, 1995, “Regulation, Recession, and Bank Lending Behavior: The 1990 CreditCrunch,” Journal of Financial Services Research 9, 5-30.
Stein, J., 1997, “Internal Capital Markets and the Competition for Corporate Resources,” Journal of Finance52, 111-133.

Holod � Agency and Internal Capital Market Inefficiency 53
Stiglitz, J. and A. Weiss, 1981, “Credit Rationing in Markets with Imperfect Information,” AmericanEconomic Review 71, 393-410.
Weston, J., 1970, “The Nature and Significance of Conglomerate Firms,” St. Johns Law Review 44, 66-80.
Wulf, J., 2009, “Influence and Inefficiency in the Internal Capital Market,” Journal of Economic Behaviorand Organization 72, 305-321.