Embed Size (px)
Citation preview
Ageing of Asphalt Mixtures: Micro-scale and mixture morphology investigation
Doctoral Thesis
Prabir Kumar Das
Doctoral Thesis in Civil and Architectural Engineering Stockholm, Sweden 2014
Doctoral dissertation to be defended in Q2, Osquldas väg 10, KTH Royal Institute of Technology, Stockholm, Sweden, on 23rd of May 2014, at 09:00.
Faculty opponent: Prof. Andreas Loizos Evaluation Committee members:
Prof. Magnus Wålinder Prof. Sven Knutsson Prof. Sandra Erkens © Prabir Kumar Das Doctoral Thesis Division of Highway and Railway Engineering Department of Civil and Architectural Engineering KTH, Royal Institute of Technology SE-100 44 Stockholm SWEDEN TRITA-TSC-PHD 14-002 ISBN 978-91-87353-37-6
Abstract ‖ i
Abstract There are many variables that affect the viscoelastic properties of asphalt mixtures with time, among which age hardening may be considered one of the important ones. Age hardening of asphalt mixtures is an irreversible process, which contributes to a reduction of the durability of pavements and eventually increases the maintenance cost. Beside the environmental effects, ageing in asphalt mixture depends on the physicochemical properties of bitumen and mixture morphology which is a combined effect of aggregate packing, porosity, air void distribution and their interconnectivity. Thus, a clear understanding on the physicochemical properties of bitumen and mixture morphology may help to predict the performance of asphalt mixtures, which will contribute to longer-lasting and better performing pavements.
When looking at the bitumen at micro-scale, one can see microstructures appearing under certain conditions which can be partially explained by the interaction of the individual phases. Since the thermo-rheological behavior of bitumen depends largely on its chemical structure and intermolecular microstructures, studying these can lead to understanding of the mechanism, speed and conditions under which this phase behavior occurs. Linking this to the changes in properties of bitumen can thus lead to better understanding of the causes of ageing, its dominant parameters and the resulting diminished mechanical response.
To investigate ageing in asphalt pavements, along with physicochemical properties of bitumen one needs to also focus on the influence of mixture morphology. It is known that asphalt mixtures with similar percentages of air-voids can have different morphologies and thus can age differently. Prediction of ageing behavior without considering the influence of mixture morphology may thus lead to erroneous conclusions and non-optimal mix design. Hence, it is important to understand the interplay between the mixture morphology and ageing susceptibility and relate this to the long term mixture performance.
The aim of this Thesis was to develop fundamental understanding on ageing in asphalt mixtures that can contribute to the asphalt community moving away from the currently used accelerated ageing laboratory tests and empirical models that can lead to erroneous conclusions.
ii ‖ Abstract
To reach this aim, experimental and numerical micro-scale analyses on bitumen and meso-scale investigations on mixture morphology have been performed which, collectively, allowed for the development of a method for the prediction of asphalt field ageing, incorporating both mixture morphology and micro-scale bitumen mechanisms. For this, first, the mechanisms of surface ageing and diffusion controlled oxidative ageing were identified. Secondly, the influence of mixture morphology on asphalt ageing susceptibility was investigated. Procedures to determine the controlling parameter were then developed and an empirical framework to quantify the long-term field ageing of asphalt mixtures was set-up. For this, a combination of experimental and numerical methods was employed.
An extensive experimental study was carried out to understand the fundamental mechanisms behind the micro-structural phase appearance and the speed or mobility at which they change. Atomic Force Microscopy (AFM) was utilized at different temperatures to investigate the phase separation behavior for four different types of bitumen and co-relate it with the Differential Scanning Calorimetry (DSC) measurements. Based on the experimental findings, it was concluded that the observed phase separation is mainly due to the wax/paraffin fraction presence in bitumen (Paper I). A hypothesis was developed of the appearance of a thin film at the specimen surface due to ageing which is creating a barrier, restricting thus the microstructures to float towards the surface. Furthermore, investigation showed that depending on the bitumen and exposure types this surface thin film is water soluble and thus the moisture damage becomes more severe with the ageing of asphalt pavement (Paper II and IV).
A new empirical relation to obtain the primary structure coating thickness was established utilizing mixture volumetric properties and gradation using a large set of data from different literature sources. It was found that the enhanced morphological framework can be used to optimize the long term performance of asphalt mixtures (Paper III). Thereafter, the effect of diffusion controlled oxidative ageing on different mixture morphologies based on oxidative ageing mechanism of bitumen and diffusion-reaction process was investigated using the Finite Element Method (FEM). From the FE analyses, the effect of air-void distribution and their interconnectivity combined with the aggregate packing was shown to have a significant effect on age hardening (Paper IV).
Abstract ‖ iii
It was shown that focusing only on the percentage of air-void as the main predictive ageing parameter may lead to an erroneous conclusion and non-optimal predictions of long-term behavior. To replace such approaches, a new way to predict the long-term ageing was proposed in this Thesis, utilizing the found influences of mixture morphology and fundamental mechanism. Though additional mechanisms and non-linear coupling between them may be still needed to reach the ‘ultimate’ ageing prediction model, the current model was found to be a significant improvement to the currently used methods and may lead the way towards further enhancing the fundamental knowledge towards asphalt mixture ageing (Paper V).
KEYWORDS: Ageing, Aggregate packing, Atomic force microscopy, Asphalt mixture, Bitumen, Diffusion, Finite element analysis, Gradation, Micro-structure, Mixture morphology, Oxidative ageing, Surface ageing

Preface ‖ v
Preface The work presented in this doctoral thesis has been carried out at the KTH Royal Institute of Technology, at the division of Highway and Railway Engineering.
The Swedish Transport Administration (Trafikverket) is greatly appreciated for financing this research.
I would like to express my sincere gratitude to my supervisor Prof. Björn Birgisson and co-supervisor Prof. Nicole Kringos for their guidance, valuable discussions, advice and encouragements during this process.
Constructive discussions and comments from Dr. Per Redelius, Mr. Måns Collin and Dr. Xiaohu Lu are acknowledged for bringing their insight, experience and ideas to the table. I would like to thank all of my colleagues at the division for providing a creative and friendly atmosphere.
Last but not the least, my gratitude goes to my wife Soma Ghosh for giving me a life beyond my profession and my family in Bangladesh that always believed in me.
Prabir Kumar Das Stockholm, May’14

Table of Content ‖ vii
Table of Content
1 Introduction -------------------------------------------------------------------------------------- 1
1.1 Motivation -------------------------------------------------------------------------------- 1
1.2 Research objectives and limitations ----------------------------------------------- 3
1.3 Content overview ---------------------------------------------------------------------- 6
2 Background --------------------------------------------------------------------------------------- 7
2.1 Mechanism of oxidative ageing ---------------------------------------------------- 7
2.2 Diffusion controlled oxidative ageing -------------------------------------------- 8
2.3 Mixture morphology framework -------------------------------------------------- 11
3 Review of Literature -------------------------------------------------------------------------- 15
3.1 The use of atomic force microscopy ---------------------------------------------- 15
3.2 Asphalt mixture morphology ------------------------------------------------------ 17
3.3 Diffusion-reaction process ---------------------------------------------------------- 19
3.4 Long term field ageing prediction ------------------------------------------------ 20
4 Materials, Methods and Experimental Plan-------------------------------------------- 23
4.1 Bitumen ---------------------------------------------------------------------------------- 23
4.2 Asphalt mixture ----------------------------------------------------------------------- 24
4.3 Differential scanning calorimetry analyses ------------------------------------- 26
4.4 Atomic force microscopy analyses ------------------------------------------------ 27
4.5 Experimental scheme ----------------------------------------------------------------- 29
5 Finite Element Analysis of Oxidative Ageing ----------------------------------------- 31
5.1 Geometry and mesh construction ------------------------------------------------- 31
5.2 FE analyses ------------------------------------------------------------------------------ 35
6 Results and Discussions --------------------------------------------------------------------- 37
6.1 Micromechanical investigation of phase separation in bitumen (Paper I) ----------------------------------------------------------------------------------- 37
6.1.1 Investigation of crystallization and melting effects by DSC ----- 37 6.1.2 Topography of bitumen surface ---------------------------------------- 38 6.1.3 Local stiffness at bitumen surface -------------------------------------- 42
viii ‖ Table of Content
6.1.4 Summary of findings ------------------------------------------------------ 44
6.2 Surface ageing of bitumen: micro-scale investigation (Paper II and IV) ------------------------------------------------------------------------ 45
6.2.1 Thin film surface ageing --------------------------------------------------- 45 6.2.2 Surface topography --------------------------------------------------------- 46 6.2.3 Micromechanical properties ---------------------------------------------- 49 6.2.4 Heat flow characteristics -------------------------------------------------- 53 6.2.5 Microstructure evolution due to ageing ------------------------------- 54 6.2.6 Summary of findings ------------------------------------------------------- 55
6.3 Investigation of mixture morphology on its ageing susceptibility (Paper III) --------------------------------------------------------------------------------- 56
6.3.1 Establishing a continuous relation between PS porosity and PS coating thickness ------------------------------------------------------------ 57
6.3.2 Influence of mixture morphology on ageing ------------------------ 58 6.3.3 Summary of findings ------------------------------------------------------ 64
6.4 Effect of diffusion controlled oxidative ageing on different mixture morphologies (Paper IV) ------------------------------------------------------------- 66
6.4.1 Finite elements analysis of the two asphalt mixtures ------------- 66 6.4.2 Summary of findings ------------------------------------------------------ 69
6.5 Asphalt mixture ageing model by incorporating morphology framework (Paper V) --------------------------------------------------------------------------------- 70
6.5.1 Ageing as a function of PS coating thickness ------------------------ 70 6.5.2 Ageing as a function of depth ------------------------------------------- 74 6.5.3 Ageing as a function of temperature ---------------------------------- 76 6.5.4 Morphology based ageing model -------------------------------------- 77 6.5.5 Summary of findings ------------------------------------------------------ 80
7 Conclusions and Recommendations ----------------------------------------------------- 81
7.1 Concluding discussions -------------------------------------------------------------- 81
7.2 Recommendations -------------------------------------------------------------------- 83
References --------------------------------------------------------------------------------------------- 85
Appendix ---------------------------------------------------------------------------------------------- 91
Publications ‖ ix
Publications Appended Papers
This doctoral thesis is based on the following appended publications: Paper I: Das, P.K., Kringos, N., Wallqvist, V., Birgisson, B. (2013),
Micromechanical investigation of phase separation in bitumen by combining AFM with DSC results. International Journal of Road Materials and Pavement Design, Vol. 14 (S1), pp. 25-37.
Paper II: Das, P.K., Kringos, N., Birgisson, B. (2014), Micro-scale investigation of
thin film surface ageing of bitumen. Journal of Microscopy, doi: 10.1111/jmi.12122.
Paper III: Das, P.K., Birgisson, B., Jelagin, D., Kringos, N. (2013), Investigation of
the asphalt mixture morphology influence on its ageing susceptibility. Materials and Structures, doi: 10.1617/s11527-013-0209-z.
Paper IV: Das, P.K., Balieu, R., Kringos, N., Birgisson, B. (2014), On the
Oxidative Ageing Mechanism and Its Effect on Asphalt Mixtures Morphology. Journal of Materials Science, submitted.
Paper V: Das, P.K., Kringos, N., Birgisson, B. (2014), Numerical Study on the
Effect of Mixture Morphology on Long Term Asphalt Mixture Ageing. International Journal of Pavement Engineering, submitted.
x ‖ Publications
Other Relevant Publications The author also contributed to the following publications which are related to the research project: Journal Paper: Das, P.K., Tasdemir, Y., Birgisson, B. (2012), Evaluation of Fracture and
Moisture Damage Performance of Wax Modified Asphalt Mixtures. International Journal of Road Materials and Pavement Design, Vol. 13 (1), pp. 142-155.
Das, P.K., Tasdemir, Y., Birgisson, B. (2012), Low Temperature Cracking
Performance of WMA with the Use of the Superpave Indirect Tensile Test. International Journal of Construction and Building Materials, Vol. 30, pp. 643-649.
Soenen, H., Besamusca, J., Fischer, H.R., Poulikakos, L.D., Planche, J-P., Das, P.K., Kringos, N., Grenfell, J.R.A., Lu, X., Chailleux, C. (2013), Laboratory investigation of bitumen based on round robin DSC and AFM tests. Materials and Structures, doi: 10.1617/s11527-013-0123-4
Das, P.K., Jelagin, D., Birgisson, B. (2013), Evaluation of the low temperature
cracking performance of asphalt mixtures utilizing HMA fracture mechanics. International Journal of Construction and Building Materials, Vol. 47, pp. 594-600.
Chapter in Book:
• Title of Book: Atomic Force Microscopy - Imaging, Measuring and Manipulating Surfaces at the Atomic Scale. ISBN 978-953-307-1386-5.
Das, P.K., Jelagin, D., Birgisson, B., Kringos, N. (2012), Chapter 10- Atomic Force Microscopy to Characterize the Healing Potential of Asphaltic Materials, pp. 209-230.
Conference Paper:
– Das, P.K., Jelagin, D., Birgisson, B. (2009), Warm mix asphalt mixtures for lowering energy consumption during construction of asphalt pavements. Transportforum, VTI, Linköping, Sweden.
Publications ‖ xi
– Tasdemir, Y., Das, P.K., Birgisson, B. (2010), Determination of Mixture
Fracture Performance with the Help of Fracture Mechanics. 9th International Congress on Advances in Civil Engineering. Trabzon, Turkey.
– Das, P.K., Tasdemir, Y., Birgisson, B. (2011), Low Temperature cracking Performance of Wax Modified Bitumen and Mixture. XXIVth World Road Congress. 27-30 Sep, Mexico.
– Das, P.K., Jelagin, D., Birgisson, B., Kringos, N. (2012), Micro-Mechanical
Investigation of Low Temperature Fatigue Cracking Behaviour of Bitumen. 7th RILEM International Conference on Cracking in Pavements, June 20-22, Delft, Netherland.
– Das, P.K., Kringos, N. and Birgisson, B. (2013), Towards a multi-scale
framework to optimize ageing resistance of asphaltic materials. RILEM Symposium on Multi Scale Modeling and Characterization of Infrastructure Materials, June 10-12, Stockholm, Sweden.
– Soenen, H., Besamusca, J., Poulikakos, L.D., Planche, J-P., Das, P.K., Kringos, N., Grenfell, J.R.A., Chailleux, E. (2013), Differential Scanning Calorimetry applied to bitumen: Results of the RILEM NBM TG1 Round Robin test. RILEM Symposium on Multi Scale Modeling and Characterization of Infrastructure Materials, June 10-12, Stockholm, Sweden.
– Fischer, H.R., Poulikakos, L.D., Planche, J-P., Das, P.K., Grenfell, J.R.A., (2013), Challenges While Performing AFM on Bitumen. RILEM Symposium on Multi Scale Modeling and Characterization of Infrastructure Materials, June 10-12, Stockholm, Sweden.
– Das, P.K., Kringos, N., Birgisson, B. (2014), Micro-scale investigation of oxygen diffusion on bitumen surface. 12th International Society for Asphalt Pavements (ISAP) Conference, June 1-5, Raleigh, North Carolina, USA. (accepted)
– Das, P.K., Jelagin, D., Birgisson, B. (2014), Importance of thermal contraction coefficient in low temperature cracking of asphalt concrete. 59th Canadian Technical Asphalt Association (CTAA) conference, November 16-19, Winnipeg, Manitoba, Canada. (accepted)

Introduction ‖ 1
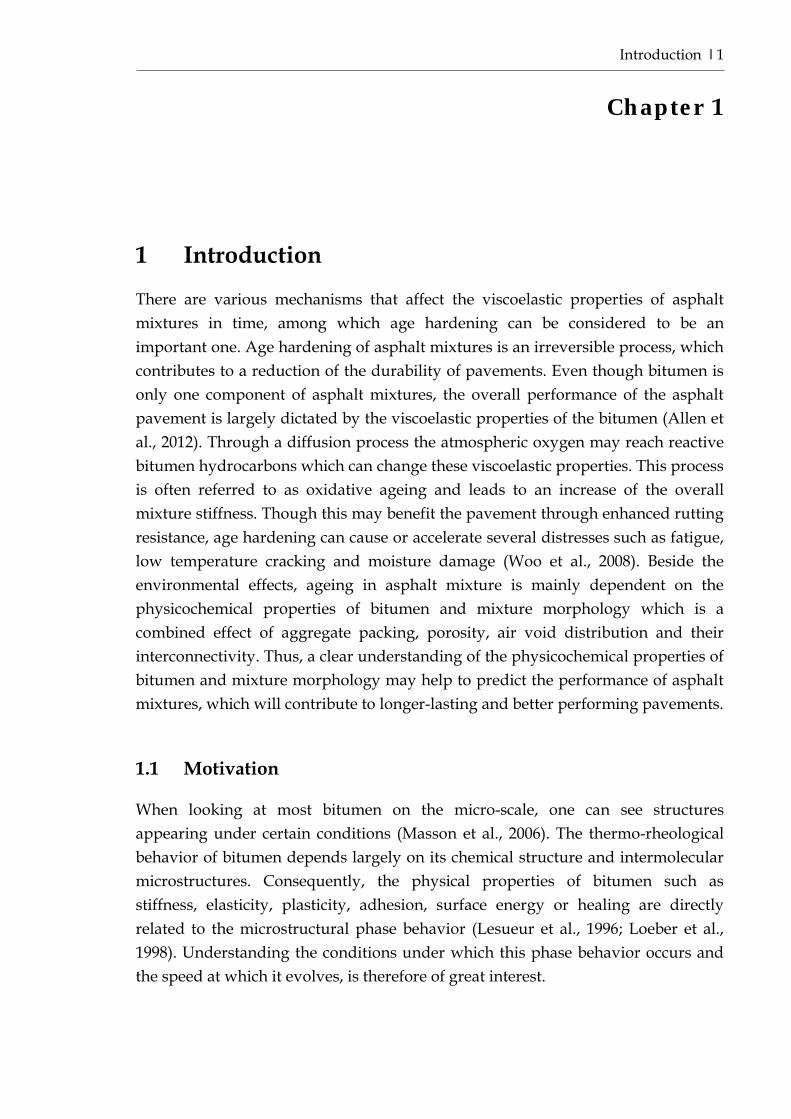
Chapter 1 1 Introduction There are various mechanisms that affect the viscoelastic properties of asphalt mixtures in time, among which age hardening can be considered to be an important one. Age hardening of asphalt mixtures is an irreversible process, which contributes to a reduction of the durability of pavements. Even though bitumen is only one component of asphalt mixtures, the overall performance of the asphalt pavement is largely dictated by the viscoelastic properties of the bitumen (Allen et al., 2012). Through a diffusion process the atmospheric oxygen may reach reactive bitumen hydrocarbons which can change these viscoelastic properties. This process is often referred to as oxidative ageing and leads to an increase of the overall mixture stiffness. Though this may benefit the pavement through enhanced rutting resistance, age hardening can cause or accelerate several distresses such as fatigue, low temperature cracking and moisture damage (Woo et al., 2008). Beside the environmental effects, ageing in asphalt mixture is mainly dependent on the physicochemical properties of bitumen and mixture morphology which is a combined effect of aggregate packing, porosity, air void distribution and their interconnectivity. Thus, a clear understanding of the physicochemical properties of bitumen and mixture morphology may help to predict the performance of asphalt mixtures, which will contribute to longer-lasting and better performing pavements.
1.1 Motivation
When looking at most bitumen on the micro-scale, one can see structures appearing under certain conditions (Masson et al., 2006). The thermo-rheological behavior of bitumen depends largely on its chemical structure and intermolecular microstructures. Consequently, the physical properties of bitumen such as stiffness, elasticity, plasticity, adhesion, surface energy or healing are directly related to the microstructural phase behavior (Lesueur et al., 1996; Loeber et al., 1998). Understanding the conditions under which this phase behavior occurs and the speed at which it evolves, is therefore of great interest.
2 ‖ Introduction
Long-term asphalt ageing simulation tests are meant to predict the chemical and physical property changes in the bitumen occurring after certain years in the asphalt pavement. To simulate long-term field aging in the laboratory, different types of test methods are currently available (Airey, 2003), focusing on accelerated ageing on bitumen, loose asphalt mixture or on compacted asphalt mixture specimens. Assuming time-temperature superposition principles, these accelerated ageing tests are generally conducted at artificially severe conditions, for example at temperatures higher than pavement service temperature and at pressures higher than ambient pressures. Moreover, the influence of sunlight on bitumen ageing is ignored in these laboratory simulations though bitumen is known to be a good light absorber – particularly for UV radiation (Durrieu et al., 2007; Lu et al., 2008; Dickinson et al., 1958). It has been found that ageing of bitumen at a higher temperature and pressure is fundamentally different from ageing at a lower temperature and pressure. The latter can be considered to be more representative of the actual physical process that occurs in the pavement (Branthaver et al., 1993; Lu et al., 2008; Al-Azri et al., 2006). So, an investigation on accelerated test residue bitumen might not give the true information of what happens due to ageing in the field and could lead to erroneous conclusions and subsequent choices. On the other hand, one cannot investigate the material for the actual time span, so some extrapolation is always needed. For this reason it is important to be as close as possible to the physical processes and develop a fundamental understanding of its mechanisms. Better understanding of how bitumen microstructures evolve during ageing and relate to the resulting mechanical response, opens a large potential for tailoring and enhancing the long term properties of asphaltic materials.
To investigate ageing in asphalt pavements, along with physicochemical properties of bitumen one needs to also focus on the influence of mixture morphological properties on its ageing propensity. In this, it is important to understand the interplay between the mix design parameters such as: coating around the aggregate, the average air void size, the porosity and relate these to the ageing susceptibility of the mixture. Assuming that the material properties are held constant and the influence of different bitumen sources is thus not an issue, at a constant air-void content, it can be argued that oxidative ageing can be largely explained by the access of air into the mixture. Depending on the availability of air in the mixture, the diffusion-reaction process controls its ageing propensity. Thus, it is important to understand the effect of the diffusion-reaction process of bitumen on mixtures with different morphologies. Since mixture morphology is controllable, having insight into how the various morphological parameters
Introduction ‖ 3
influence the mixture’s long-term behavior can be of great value to optimize its design, regardless of the individual material properties.
It is known that asphalt mixtures with similar percentages of air-voids can have different morphologies and thus can age differently. Prediction of ageing behavior without considering the influence of mixture morphology may thus lead to erroneous conclusions and non-optimal mix design. Hence, it is important to understand the interplay between the mixture morphology and ageing susceptibility and relate this to the long term mixture performance. For this reason, a more throughout approach is needed, in which, the effects of mixture morphology parameters on age hardening can be investigated. From such analyses, trends of how mixture morphology parameters influence age hardening can be identified that can assist in the development of predictive ageing models. This will give the pavement engineering community new tools and insights to move away from the currently used empirical methods.
1.2 Research objectives and limitations
The aim of this Thesis was to develop fundamental insight into ageing of asphalt mixtures by investigating bitumen at the micro-scale and mixture morphology at the meso-scale. Additionally, the Thesis aimed at developing a way to predict log-term field ageing by incorporating mixture morphology. To reach these aims, this research was divided in the following activities:
– Investigation of the fundamental mechanisms behind the microstructural phase appearance and the speed at which they change (Paper I).
– Micro-scale investigation of thin film surface ageing of bitumen, particularly the evolutions of microstructures on the bitumen surface due to both oxidation and UV radiation (Paper II).
– Enhancement of a mixture morphology framework to enable a continuous capturing of possible aggregate packing arrangements in asphalt mixtures (Paper III).
– Application of the mixture morphology framework to investigate the effect of the morphological parameters on ageing susceptibility of asphalt mixtures (Paper III).
4 ‖ Introduction
– Investigation of the effect of diffusion controlled oxidative ageing on
mixtures with different morphologies (Paper IV).
– Development of a method to predict long-term field ageing by incorporating mixture morphology, which can be utilized into performance based design tools for asphalt pavements (Paper V).
In the above mentioned activities, a combination of laboratory and numerical
methods has been utilized. Atomic Force Microscopy (AFM) was utilized as a tool at different temperatures to investigate the phase separation behavior for four different types of bitumen. Since AFM is limited to analysis of the surface, Differential Scanning Calorimetry (DSC) was employed for investigating the ageing effect on bulk crystalline molecule properties. DSC results were then correlated to AFM observations to study how the thermodynamic behavior is linked to the crystalline wax/paraffin fractions present in bitumen (Paper I).
After understanding the mechanism of microstructural phase separation at the bitumen surface, evolutions of the microstructures due to oxidation and UV radiation were investigated. A hypothesis on microstructure evolution due to thin film surface ageing was developed and validated utilizing the AFM and the DSC. In this, AFM was utilized to provide information of changes of the microstructures and the micromechanical properties at the surface due to oxidation and UV radiation. A comparison between aged and unaged specimens, based on the DSC results, was carried out to detect any changes in behavior and percentage of crystalline fractions in the bulk (Paper II).
By using a large data set, a morphology framework was further enhanced to enable a continuous capturing of possible aggregate packing arrangements in asphalt mixtures. This framework was then applied for the characterization of the ageing susceptibility due to the combined effect of aggregate packing, average air void size, porosity and level of compaction. This study also hypothesized about the mechanisms that lay behind the noted influences and on how mixture design improvements may be made. From all the investigated cases, it was found that the framework can be used to optimize the durability performance of asphalt mixtures (Paper III).
In Paper IV, an investigation of the effect of diffusion controlled oxidative ageing on mixtures with different morphologies was conducted. For this, the Finite Element Method (FEM) was used. In these FE analyses, one dense and one open
Introduction ‖ 5
graded asphalt concrete field core were selected. Additionally, a microscopic study was conducted where AFM was used as a tool to investigate the surface ageing of bitumen.
Furthermore, FE analyses simulating the diffusion-reaction process were conducted by implementing the ageing mechanism. Based on these, a parametric study was performed in which the effect of morphology on mixture ageing susceptibility was investigated. Based on this fundamental understanding and integrating the morphology, a model was proposed to predict viscosity change in asphalt mixtures. This model was then compared to an existing long-term ageing predictive model (Paper V).
It should be noted that the methods and assumptions used and developed in
this Thesis are only valid under certain boundary conditions. AFM has been for investigating the ageing mechanism in bitumen. Yet, a known disadvantage of AFM is that it is limited to surface images only and it needs a relatively smooth surface. Therefore, one should be aware that sample preparation will influence the surface measurement and surface properties might not always reflect bulk properties. The asphalt morphology framework is currently still based on the simplification that all aggregates are spherical particles and does therefore not take into account aggregate angularity and surface roughness. Furthermore, in the FE analyses the overall reaction rates has been approximated as the sum of fast and slow reactions. Given the fact that bitumen is a complex material that has molecules of various sizes, in reality a more continuous range of different oxygen reactant species can be assumed. It may therefore be more appropriate to assume that in reality the reaction rates may distributed differently from very small to very fast depending on types and sources of bitumen. These limitations will be further discussed in each chapter and recommendations towards further improvements are made at the end of this Thesis.
6 ‖ Introduction
1.3 Content overview
This Thesis consists of an extended summary of the above mentioned five papers (Paper I-V). The papers themselves can be found in the appendix at the end. The extended summary consists of seven chapters. Chapter 1 explains the research motivations, highlights the objectives of each study, the relation between these studies and corresponding limitations. Chapter 2 briefly gives an overview of oxidative ageing mechanisms, diffusion reaction processes and the mixture morphology framework which have been used as a basis in this Thesis. In Chapter 3, the literature review on the utilized methods for the investigation of the ageing susceptibility in bitumen and asphalt mixture is summarized.
The bitumen used in the micro-scale analyses and the asphalt mixtures used for the morphological investigation are introduced in Chapter 4. Also, the methods and experimental scheme under which these investigations were carried out are briefly described. In Chapter 5, the conducted FE analysis for the investigation of the influence of diffusion controlled oxidative ageing on different mixture morphologies is shown. Chapter 6 consists of a summary of the results and gives an extended discussion on the results from the five papers. Chapter 7 gives a summary of the conclusions from the research performed in this Thesis and detailed recommendations for the continuation of studying ageing mechanisms in asphaltic materials.
Background ‖ 7
Chapter 2 2 Background This thesis investigates the effect of diffusion controlled oxidative ageing on different mixture morphologies based on oxidative ageing mechanism and diffusion-reaction of bitumen. In this process, the mixture morphology framework has been utilized to investigate the effect of it on ageing in asphalt mixtures. To obtain the objectives of this research, it is important to have understanding on the oxidation product, interplay between oxygen diffusion process and age hardening of bitumen, and mixture morphology. The following describes the background information on oxidative ageing mechanism, diffusion reaction process and mixture morphology framework. 2.1 Mechanism of oxidative ageing Oxygen diffusion in asphalt mixture is a very complex process, which depends on the diffusion coefficients of bitumen, the air-void distribution (i.e. the oxygen availability), along with several environmental factors such as: temperature, pressure and humidity. In this section, oxidative ageing is further explored in order to develop a mechanism which can be coupled to the morphology and conditioning parameters, to enable the investigation of the combined effect.
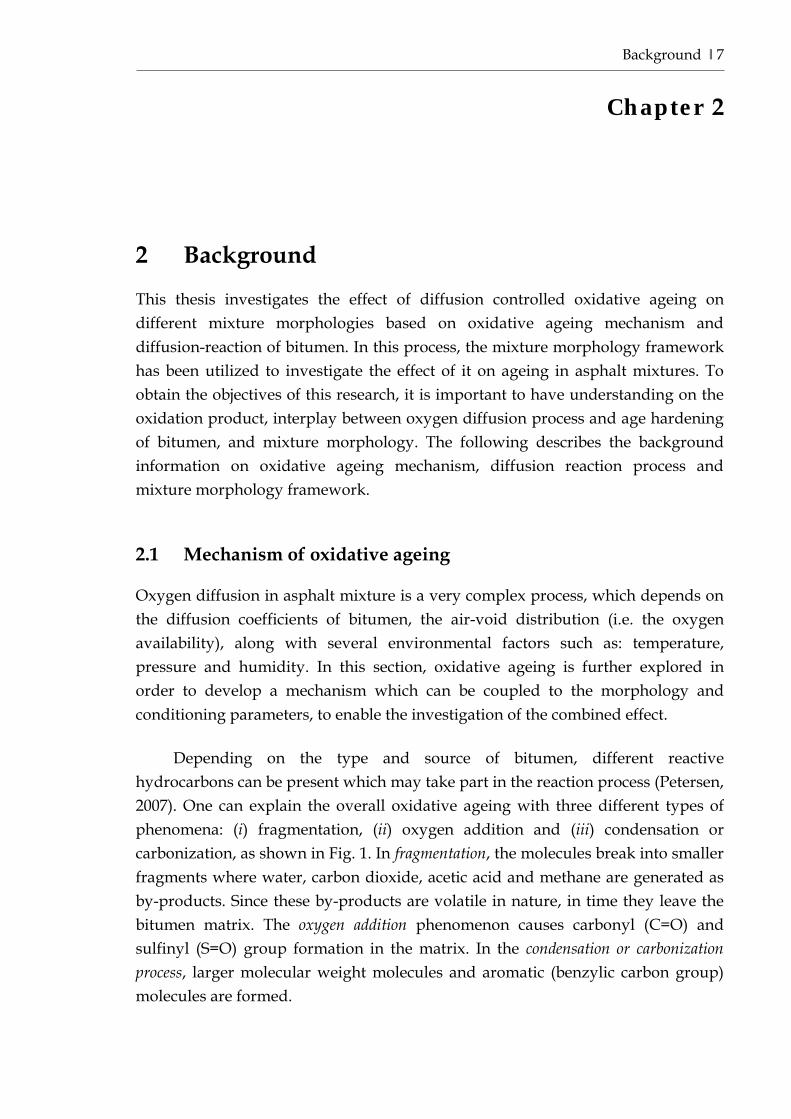
Depending on the type and source of bitumen, different reactive hydrocarbons can be present which may take part in the reaction process (Petersen, 2007). One can explain the overall oxidative ageing with three different types of phenomena: (i) fragmentation, (ii) oxygen addition and (iii) condensation or carbonization, as shown in Fig. 1. In fragmentation, the molecules break into smaller fragments where water, carbon dioxide, acetic acid and methane are generated as by-products. Since these by-products are volatile in nature, in time they leave the bitumen matrix. The oxygen addition phenomenon causes carbonyl (C=O) and sulfinyl (S=O) group formation in the matrix. In the condensation or carbonization process, larger molecular weight molecules and aromatic (benzylic carbon group) molecules are formed.
8 ‖ Background
Fig. 1. Possible mechanism of oxidative ageing
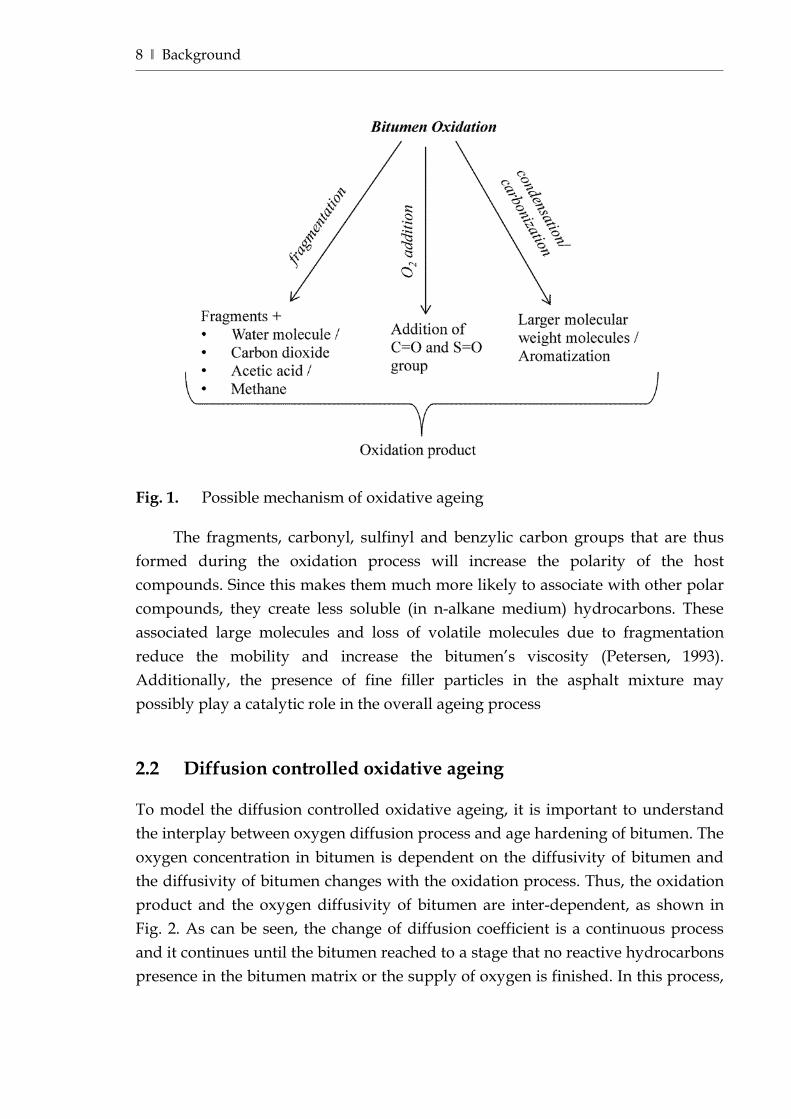
The fragments, carbonyl, sulfinyl and benzylic carbon groups that are thus formed during the oxidation process will increase the polarity of the host compounds. Since this makes them much more likely to associate with other polar compounds, they create less soluble (in n-alkane medium) hydrocarbons. These associated large molecules and loss of volatile molecules due to fragmentation reduce the mobility and increase the bitumen’s viscosity (Petersen, 1993). Additionally, the presence of fine filler particles in the asphalt mixture may possibly play a catalytic role in the overall ageing process 2.2 Diffusion controlled oxidative ageing To model the diffusion controlled oxidative ageing, it is important to understand the interplay between oxygen diffusion process and age hardening of bitumen. The oxygen concentration in bitumen is dependent on the diffusivity of bitumen and the diffusivity of bitumen changes with the oxidation process. Thus, the oxidation product and the oxygen diffusivity of bitumen are inter-dependent, as shown in Fig. 2. As can be seen, the change of diffusion coefficient is a continuous process and it continues until the bitumen reached to a stage that no reactive hydrocarbons presence in the bitumen matrix or the supply of oxygen is finished. In this process,
Background ‖ 9
viscosity of the bitumen increases with the increasing product concentration in bitumen matrix.
Fig. 2. Schematic of diffusion controlled oxidation process
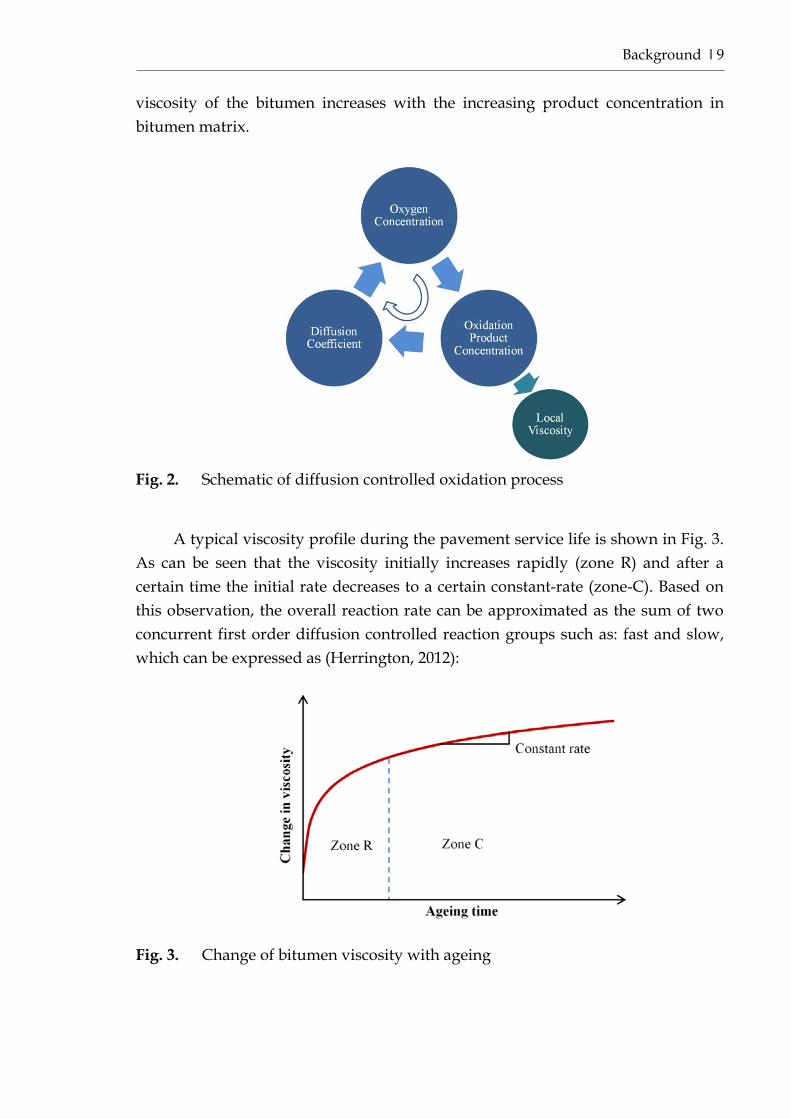
A typical viscosity profile during the pavement service life is shown in Fig. 3. As can be seen that the viscosity initially increases rapidly (zone R) and after a certain time the initial rate decreases to a certain constant-rate (zone-C). Based on this observation, the overall reaction rate can be approximated as the sum of two concurrent first order diffusion controlled reaction groups such as: fast and slow, which can be expressed as (Herrington, 2012):
Fig. 3. Change of bitumen viscosity with ageing
10 ‖ Background
ff f f f
dBB C P k B C
dt+ → − =
and ss s s s
dBB C P k B Cdt
+ → − =
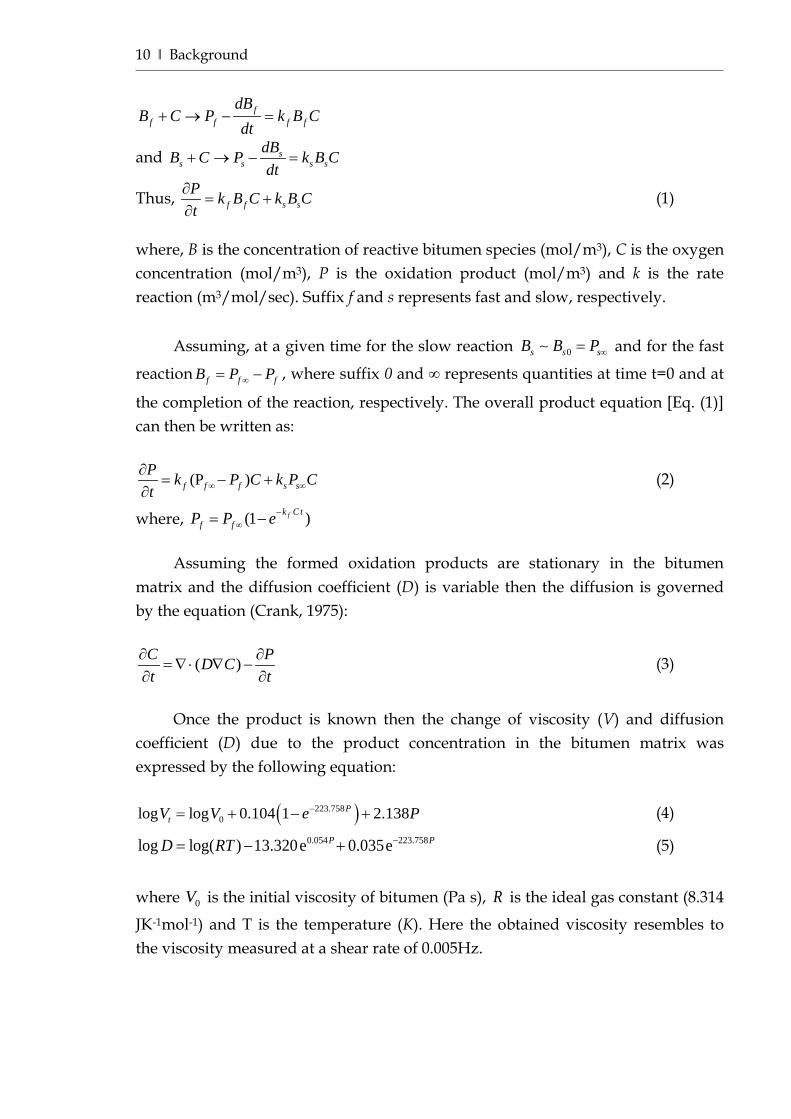
Thus, f f s sP k B C k B Ct
∂= +
∂ (1)
where, B is the concentration of reactive bitumen species (mol/m3), C is the oxygen concentration (mol/m3), P is the oxidation product (mol/m3) and k is the rate reaction (m3/mol/sec). Suffix f and s represents fast and slow, respectively.
Assuming, at a given time for the slow reaction 0s s sB B P∞= and for the fast
reaction f f fB P P∞= − , where suffix 0 and ∞ represents quantities at time t=0 and at
the completion of the reaction, respectively. The overall product equation [Eq. (1)] can then be written as:
(P )f f f s sP k P C k P Ct ∞ ∞
∂= − +
∂ (2)
where, (1 )fk C tf fP P e−
∞= −
Assuming the formed oxidation products are stationary in the bitumen matrix and the diffusion coefficient (D) is variable then the diffusion is governed by the equation (Crank, 1975):
( )C PD Ct t
∂ ∂= ∇ ⋅ ∇ −
∂ ∂ (3)
Once the product is known then the change of viscosity (V) and diffusion
coefficient (D) due to the product concentration in the bitumen matrix was expressed by the following equation:
( )223.7580log log 0.104 1 2.138P
tV V e P−= + − + (4) 0.054 223.758log log( ) 13.320e 0.035eP PD RT −= − + (5)
where 0V is the initial viscosity of bitumen (Pa s), R is the ideal gas constant (8.314
JK-1mol-1) and T is the temperature (K). Here the obtained viscosity resembles to the viscosity measured at a shear rate of 0.005Hz.
Background ‖ 11
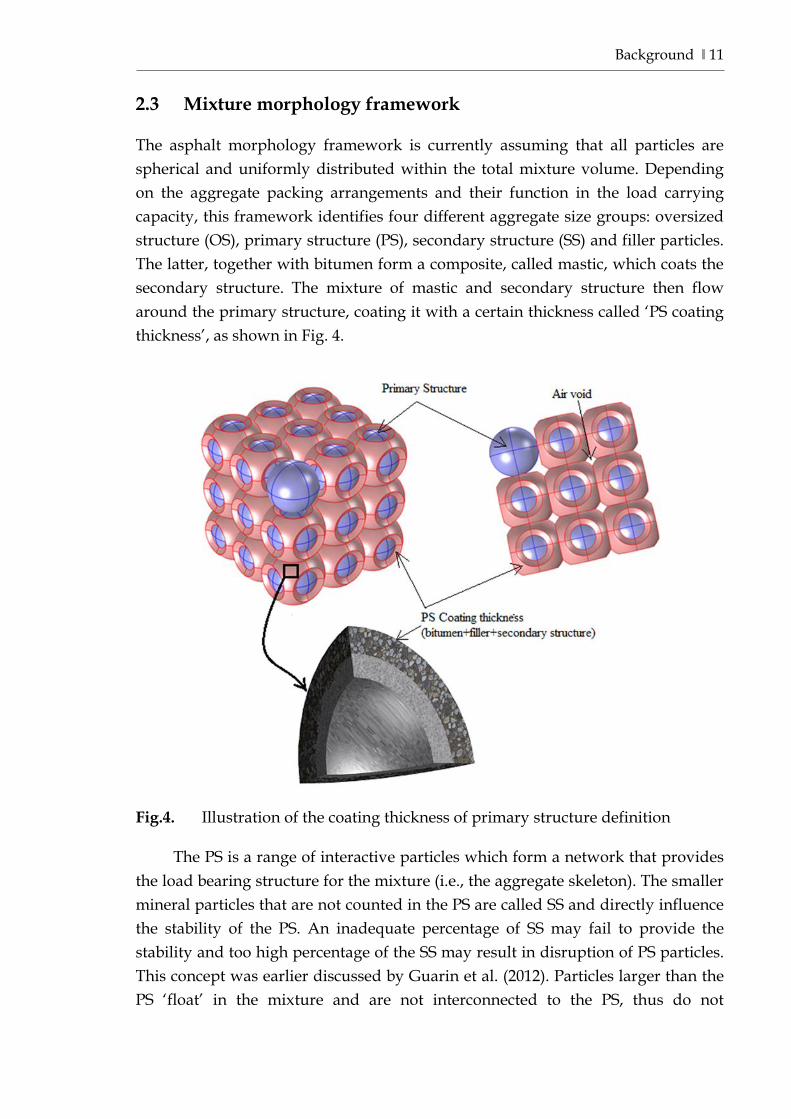
2.3 Mixture morphology framework The asphalt morphology framework is currently assuming that all particles are spherical and uniformly distributed within the total mixture volume. Depending on the aggregate packing arrangements and their function in the load carrying capacity, this framework identifies four different aggregate size groups: oversized structure (OS), primary structure (PS), secondary structure (SS) and filler particles. The latter, together with bitumen form a composite, called mastic, which coats the secondary structure. The mixture of mastic and secondary structure then flow around the primary structure, coating it with a certain thickness called ‘PS coating thickness’, as shown in Fig. 4.
Fig.4. Illustration of the coating thickness of primary structure definition
The PS is a range of interactive particles which form a network that provides the load bearing structure for the mixture (i.e., the aggregate skeleton). The smaller mineral particles that are not counted in the PS are called SS and directly influence the stability of the PS. An inadequate percentage of SS may fail to provide the stability and too high percentage of the SS may result in disruption of PS particles. This concept was earlier discussed by Guarin et al. (2012). Particles larger than the PS ‘float’ in the mixture and are not interconnected to the PS, thus do not
12 ‖ Background
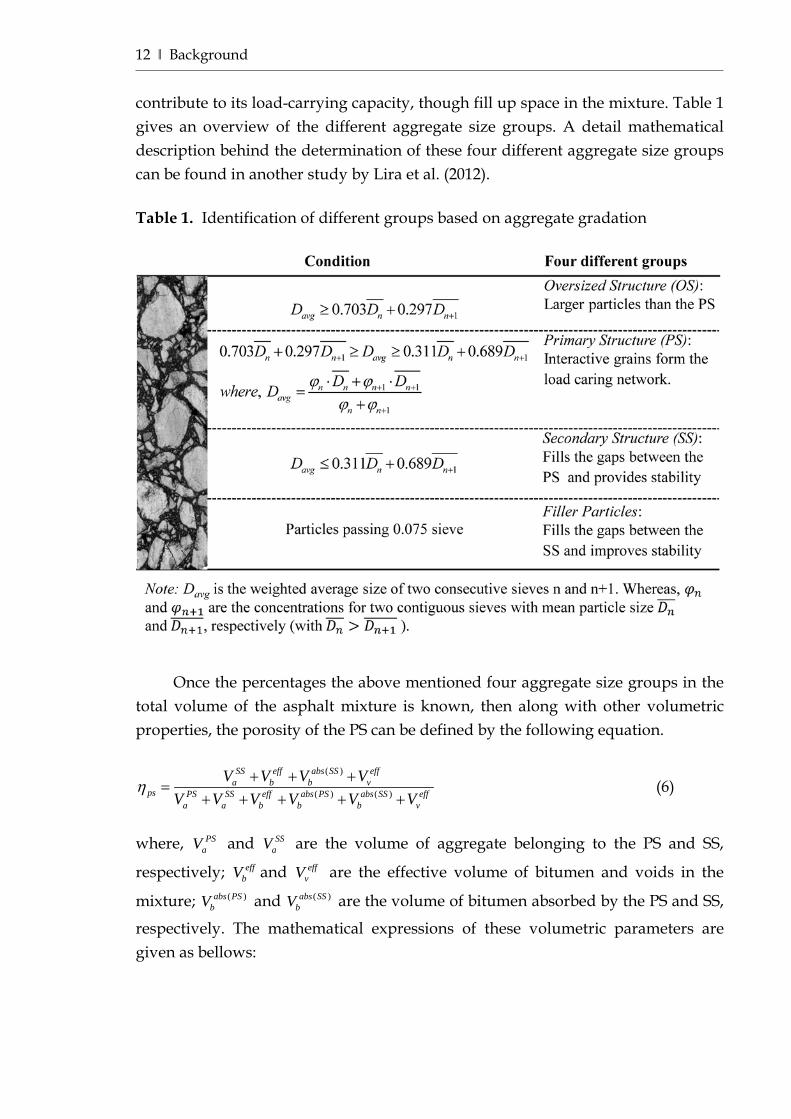
contribute to its load-carrying capacity, though fill up space in the mixture. Table 1 gives an overview of the different aggregate size groups. A detail mathematical description behind the determination of these four different aggregate size groups can be found in another study by Lira et al. (2012). Table 1. Identification of different groups based on aggregate gradation
Once the percentages the above mentioned four aggregate size groups in the
total volume of the asphalt mixture is known, then along with other volumetric properties, the porosity of the PS can be defined by the following equation.
( )
( ) ( )
SS eff abs SS effa b b v
ps PS SS eff abs PS abs SS effa a b b b v
V V V VV V V V V V
η + + +=
+ + + + + (6)
where, PS
aV and SSaV are the volume of aggregate belonging to the PS and SS,
respectively; effbV and eff
vV are the effective volume of bitumen and voids in the
mixture; ( )abs PSbV and ( )abs SS
bV are the volume of bitumen absorbed by the PS and SS,
respectively. The mathematical expressions of these volumetric parameters are given as bellows:
Background ‖ 13
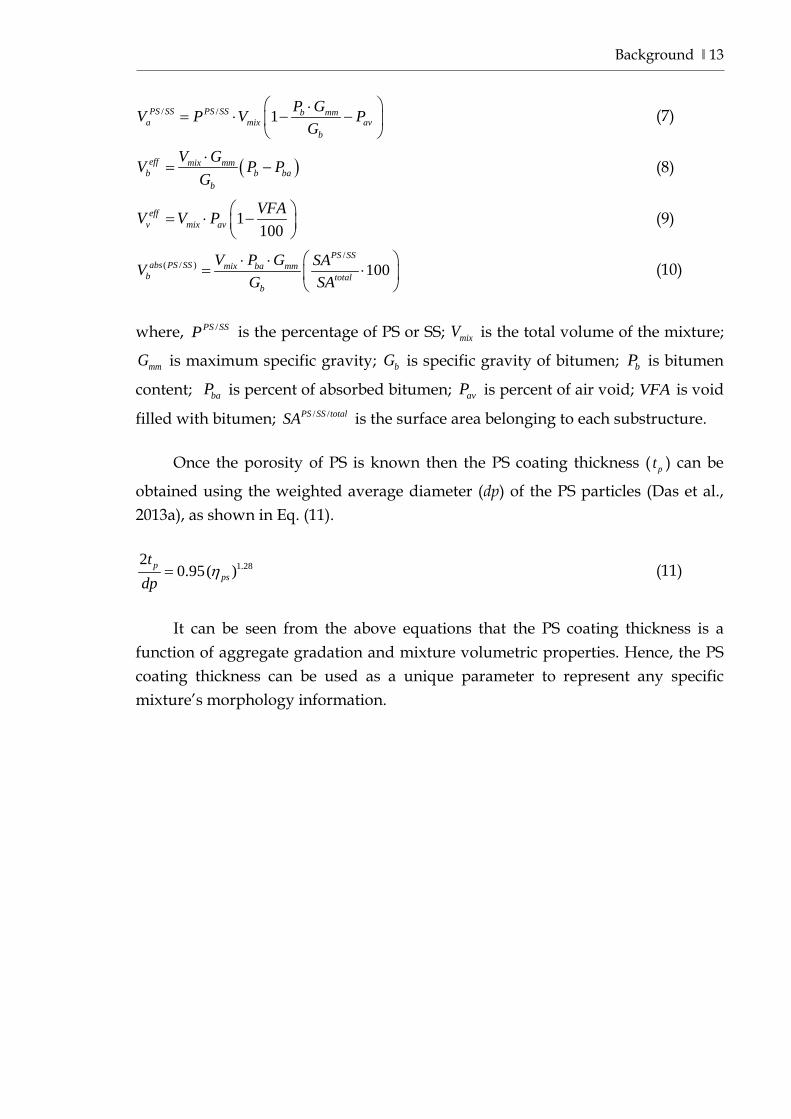
/ / 1PS SS PS SS b mma mix av
b
P GV P V PG
⋅= ⋅ − −
(7)
( )eff mix mmb b ba
b
V GV P PG⋅
= − (8)
1100
effv mix av
VFAV V P = ⋅ −
(9)
/( / ) 100
PS SSabs PS SS mix ba mm
b totalb
V P G SAVG SA
⋅ ⋅= ⋅
(10)
where, /PS SSP is the percentage of PS or SS; mixV is the total volume of the mixture;
mmG is maximum specific gravity; bG is specific gravity of bitumen; bP is bitumen
content; baP is percent of absorbed bitumen; avP is percent of air void; VFA is void
filled with bitumen; / /PS SS totalSA is the surface area belonging to each substructure.
Once the porosity of PS is known then the PS coating thickness ( pt ) can be
obtained using the weighted average diameter (dp) of the PS particles (Das et al., 2013a), as shown in Eq. (11).
1.2820.95( )p
ps
tdp
η= (11)
It can be seen from the above equations that the PS coating thickness is a
function of aggregate gradation and mixture volumetric properties. Hence, the PS coating thickness can be used as a unique parameter to represent any specific mixture’s morphology information.

Review of Literature ‖ 15
Chapter 3 3 Review of Literature In this Thesis, different methods have been utilized as tools to investigate the ageing susceptibility in bitumen and asphalt mixture. Atomic force microscopy (AFM) has been employed to understand the fundamental mechanisms that cause the microstructure appearance and evolution due to ageing which may responsible for the physical properties of bitumen (Lesueur et al., 1996; Loeber et al., 1998). Asphalt mixtures are currently designed based on a combination of material selection and volumetric design. Thus, to investigate the propensity for ageing in asphalt pavements, one needs to focus on both bitumen and mixture morphological properties. In addition, diffusion-reaction process has been studied for developing a clear understanding of diffusion controlled oxidative ageing mechanism and its effect on mixture morphology. A review of literature on these methods has been summarized in this chapter. 3.1 The use of atomic force microscopy In an effort to understand and characterize bitumen microstructure, optical microscopy techniques, and specially polarized light microscopy has been used in the asphalt field (Lu et al., 2005). These investigations reported the presence of wax induced microstructures in bitumen. However, because of the opacity and adhesive properties of bitumen, researchers have also used scanning probe microscopy such as the atomic force microscopy (AFM) to investigate the nano-behaviour of bitumen. AFM is capable of measuring almost any type of surfaces at atomic and molecular resolutions as compared to the resolution limit of optical microscopy of about 200nm. This has clearly opened the window for further investigations of the micromechanical behaviour of bitumen microstructures.
In the 1980s, the scanning tunnelling microscope was developed by Gerd Binnig and Heinrich Rohrer (Binnig et al., 1982). This invention, which led to the Nobel Prize in Physics in 1986, was a precursor to the Atomic Force Microscope, which was developed by Binnig et al. (1986). Classical AFM Imaging is obtained
16 ‖ Review of Literature
either in contact mode, where the tip is in contact with the sample at constant load while the surface is moving in the x-y direction or in tapping mode where the cantilever oscillating at its resonance frequency is gently tapped on the surface which is moving in the z-direction (height) to reach contact and then in the x-y directions when the tip is lifted away from contact. Topography data is obtained from both techniques, but contact mode also gives frictional data and tapping mode gives phase data which reflects the damping of the oscillation as the tip and the surface are in contact. The “phase” image can be seen as a material property map reflecting the elasticity of the sample. Classically, Force Measurements have been an AFM technique apart from imaging where only one interaction spot is chosen to obtain detailed force-distance curves for the specific interaction between the sample surface and either a tip or colloidal probe, mounted at the end of a cantilever.
In the asphalt research domain, Loeber et al. (1996, 1998) were the first research group who reported on a comprehensive study of bitumen surface using AFM as a tool. In their investigation they observed ripple microstructures with several micrometers in diameter and tens of nanometers in height (bee-shaped microstructures), which were attributed to the asphaltenes. To investigate the asphaltene aggregation, Pauli et al. (2001) were doping their bitumen samples with extra asphaltenes and reported seeing an increase in the density of bee-shaped microstructures on the bitumen surface. In 2004, Jäger and his co-workers investigated five different types of bitumen and, in agreement with Loeber and Pauli, they also concluded that asphaltenes might be involved in the observed structuring in their bitumen samples (Jäger et al., 2004).
A few years later, Masson et al. (2006) carried out an extensive AFM study on
12 different types of Strategic Highway Research Program (SHRP) bitumen to further investigate the structuring. They reported on finding four phases, which they named catanaphase (bee-shaped), periphase (around catanaphase), paraphrase (solvent regions) and salphase (high phase contrast spots). Interestingly, they found very poor correlation between the asphaltene aggregations and the bee-shaped structures that was discussed in the previous investigations. They concluded, however, that the mass percent of Vanadium and Nickel metals did correlate well with the observed structuring. Continuing their study to investigate bitumen stiffness at low temperatures, cryogenic AFM (Masson et al., 2007) was employed in intermittent-contact mode at temperatures -10°C, -20°C and -50°C and one of the key finding was that bitumen with multiple
Review of Literature ‖ 17
phases at room temperature are never entirely rigid, even when well below the glass transition temperature.
To also investigate the structuring phenomenon, de Moraes et al. (2010) and Schmets et al. (2010) studied the microstructure behavior as a function of temperature and mentioned the possibility that the bee-shaped structuring may be related to paraffin wax crystallization. Subsequently, Pauli et al. (2011) have scanned different fractions of bitumen and found bee-shaped structures even in the ‘pure’ maltene phase which contained no asphaltenes, while the de-waxed bitumen fractions did not show any microstructures. In agreement with Moraes and Schmets, they have hypothesized that the interaction between crystallizing paraffin waxes and the remaining asphalt fractions is responsible for much of the structuring. It was also concluded though that the measured wax fractions did not correlate well with the observed percentages of bees. Which made them refer to the bitumen behaviour as ‘wax-induced phase-separation’ and Kringos et al. (2009a, b) developed a computational model based on the Cahn-Hilliard equations that was able to approach the observed micro-structures rather well.
Even though different research groups concluded significantly different reasons for the structures to appear and disappear, the extensive AFM studies have proved that bitumen has the tendency to phase separate under certain kinetic conditions and is highly dependent on the temperature history. Depending on the mode of operation, AFM can be used to investigate surface topography, phase separation and also, mechanical properties such as adhesion and stiffness. 3.2 Asphalt mixture morphology Various components that describe the mixture morphology have been investigated over the years. At the beginning of twentieth century, Fuller and Thompson (1907) took an attempt on adjusting the aggregate gradation to improve the quality of the concrete mixtures by having a densest possible packed concrete. They concluded that aggregate should be graded in sizes where an excessive amount of fine and middle sizes are very harmful to strength and also they developed an ideal shape of the gradation curve. However, Wig et al. (1916) shown that the Fuller curve has some limitations and thus may not always give the maximum strength and neither the maximum density. Following the Fuller and Thompson’s concept, Talbot and Ricchart (1923) evaluated the size distribution to obtain the maximum density of concrete mixture by assuming all particles are spherical. This work has been incorporated in asphalt field by Nijboer (1948) where he started investigating the
18 ‖ Review of Literature
effect of particle size taking shape also into account. Later on, Goode and Lufsey (1962) showed the validation of Nijboer’s findings and described the numerical procedure for drawing the semi-power gradation chart, which is commonly referred as the ‘0.45 power’ chart (Meininger, 1992).
In the early 1980’s R. D. Baily developed a method of gradation analysis that takes into account the packing characteristics of individual aggregates which can be used to control workability, segregation and compatibility of asphalt mixture (Vavrik et al., 2001). The Asphalt Institute has introduced control points and restriction zones for gradation curves to control the air void content and provide better durability (Asphalt Institute, 2001). Birgisson and Ruth (2001) came with tentative guidelines for the selection of aggregate gradation for asphalt mixtures and have given very good rutting resistance under heavy traffic conditions. Later on, Roque et al. (2006) developed a conceptual and theoretical approach based on gradation to identify the load carrying interactive particle size which was referred to as the dominant aggregate size range (DASR). The porosity of DASR was used as a criterion to distinguish between good and bad mixtures and evaluated using an extensive range of materials from existing database. After this, Guarin et al. (2012) performed a study to enhance the understanding of how asphalt mixture performance gets affected by changes in gradation and volumetric properties based on the DASR model and established a parameter named ‘disruption factor’ which was found to correlate well with the rutting and cracking performance of asphalt mixtures.
Based on the understanding from the DASR principle, a new asphalt mixture morphology framework was developed at KTH Royal Institute of Technology in Sweden that allows for a continuous quantification of the morphological parameters in a fundamentally correct way. The system has recently been applied to both unbound granular materials (Yideti et al., 2013a,b) and asphalt mixtures (Lira et al., 2012) to demonstrate its ability to satisfactory distinguish between good and bad performance when related to permanent deformation and moisture damage. The framework quantifies all the morphological parameters that are related to the mixtures. Starting from the aggregate packing arrangements and the aggregate gradations, a number of parameters can be determined that control the ability for the mixture to transfer stresses. Since, in the case of asphalt mixture, smaller filler particles and bitumen fill part of the pore-space, these also have a distinct influence on the connectivity of the aggregates and the mixture performance. The coating around the aggregates is therefore also expressed in certain morphological parameters that also influence several mixture properties
Review of Literature ‖ 19
(e.g. the ability of water to flow through the mixture for moisture to reach the aggregates).
3.3 Diffusion-reaction process The diffusion-reaction process and its effect on bitumen viscoelastic properties has always been a research subject over the years. In the early 1950’s, Van Oort (1956) took the initial attempt to investigate oxygen absorption through a thin bitumen film in the absence of light. Dickinson (1984) developed a finite difference method for unsteady state of diffusion and rate reaction with which he was mathematically able to predict change of viscosity in a bitumen film. In 1990, a simplified diffusion model was developed by Tuffour and Ishai (1990) and validated with viscosity data obtained from a thin film oven test of bitumen at 135°C. Later, a unidirectional implicit-forward difference method was utilized by Dickinson (2000) and validated with viscosity of bitumen obtained from chip seal surfacing for periods up to 14 years. Numerical modeling of the diffusion-reaction process of oxygen in a bitumen film was further investigated by Herrington and Henderson (2004) and Herrington (2012). The predicted average viscosity was then validated with bitumen aged at 50°C for 126 days and the reported accuracy was around 20%. In the Western Research Institute (WRI), Glaser et al. (2013) have investigated the oxidation kinetics of 12 different types of unmodified bitumen from different sources and reported that a simple dual mechanism (Petersen, 2007) model can be used successfully to describe the oxidation process.
Recently, the oxygen diffusivity in bitumen and mastics has been investigated using laboratory oxidation of bitumen films of known reaction kinetics by Han et al. (2013). For unmodified bitumen, oxygen diffusivities was observed to be in the 10-10 to 10-11 m2/s range and the diffusivity of mastic decreased as the filler volume fraction increased. It can be noticed that the above mentioned research efforts were mainly focused on unidirectional diffusion of continuous oxygen flow through a bitumen film. These investigations resulted in documented insight into the fundamental understanding of the diffusion-reaction process in bitumen. However, the boundary conditions used in those were rather far away from the actual conditions present in asphalt mixtures such as: a combination of interconnected and trapped air-voids, presence of aggregates and filler particles and ageing gradients through an asphalt layer. For this reason, an approach is needed in which the effects of diffusion on asphalt mixtures can be investigated by considering the important 3D mixture morphology characteristics.
20 ‖ Review of Literature
3.4 Long term field ageing prediction Ageing occurs during mix production, lay-down operation and compaction is known as short-term ageing and in-situ ageing over the time during pavement’s service life is called long-term ageing. Since the short-term ageing is only subjected to heating and oxidation, it is rather practical to simulate in the lab, which correlates well with the field results. In practice, this is frequently done in accordance with RTFOT method (EN 12607-1) or AASHTO R30 method. The main challenge comes in simulating long-term ageing because it is an extremely complex phenomenon which is a slow ageing process and occurs at ambient temperature during a long period. To simulate long-term field aging in laboratory, different types of test methods are currently available (Airey, 2003).
Pressure ageing vessel (PAV) is the commonly used methods for simulating long-term ageing of bitumen. In this method bitumen get exposed to relatively high temperature (90-110°C) and pressure (2.1MPa), which is irrespective of environmental conditions and mix morphology. Another method of asphalt mix ageing is AASHTO R30, which recommends 5 days at 85°C to simulate ageing for a period of 5 to 7 years. These accelerated ageing tests, by assuming time-temperature superposition principle, are generally conducted at artificially severe conditions, for example at temperatures higher than pavement service temperature and at pressures higher than ambient pressure. It has been found that aging of bitumen at a higher temperature and pressure is fundamentally different from aging at a lower temperature and pressure (Branthaver et al., 1993; Houston et al., 2005; Lu et al., 2008). Moreover, these accelerated ageing tests do not provide a continuous relationship of the mix hardening as a function of time, which can be useful in predictive performance based model.
Due to the above mention reasons, there has been several research studies conducted in developing long-term ageing predictive model (Coons and Wright, 1968; Lee, 1973; Mirza and Witczak, 1995, Chen and Huang, 2000). Among these studies, the Global Ageing System (GAS) model developed by Mirza and Witczak (1995) is well known in asphalt pavement society and used in the Mechanical Empirical Pavement Design Guide (MEPDG, 2002). The GAS model was established based upon a large field and laboratory data sets containing of more than two thousand mix information. This model predicts aged-viscosity of bitumen in pavements by considering mean annual air temperature (MAAT), initial bitumen viscosity, pavement depth and percentage of air-void content. However, potential shortcomings of this model in predicting aged viscosity were reported in
Review of Literature ‖ 21
the literature (Al-Azri et al., 2006; Christensen and Bonaquist 2006; Farrar et al., 2006). Farrar et al. (2006) were conducted a study on four years old asphalt pavement in Arizona. The GAS model was used as a tool to predict aged viscosity of the used bitumen. It was reported that the GAS model significantly under-predicts change in mix stiffness with time and depth. In a similar study, Al- Azri et al. (2006) were calculated aged viscosity of pavement layers at 6.25mm and 12.5mm below surface using the GAS model. It was observed that the level of hardening reached in pavement binders significantly exceeds estimated values obtained from the GAS model, both at pavement surface and at a depth of 125mm below surface. From these conducted studies, one may conclude that the GAS model certainly has some limitations.
One of the key parameter might still missing in the GAS model is the influence of mixture morphology, which is a combined effect of aggregate packing, porosity, air-void distribution and their interconnectivity. If the material properties are held constant and the influence of different bitumen sources is thus not an issue, at constant air-void content, it can be argued that oxidative ageing can be largely explained by the access of air into the mixture. Based on this basic understanding, in a previous study by Das et al. (2013a) has showed that mixtures with same percentage of air-void can have different morphologies and thus can age differently. It was also observed that prediction of ageing behavior without considering the influence of mixture morphology may lead to erroneous conclusions and non-optimal mix design. The findings from the above mentioned study clearly indicate the drawback of considering only the air-void percentage in predictive ageing model without considering the mixture morphology, as it was done in GAS model.

Materials, Methods and Experimental Plan ‖ 23
Chapter 4 4 Materials, Methods and Experimental Plan In this chapter, the bitumen used for micro-scale investigation and the asphalt mixtures used for morphological investigation has been introduced. Also, the methods and experimental scheme to carry out these investigations are briefly described below. 4.1 Bitumen Five different types of bitumen used in this Thesis and denoted as B1, B2, B3, B4 and B5, where bitumen B1, B2, B4 and B5 are unmodified bitumen and B3 is prepared by adding 3% of sasobit wax by weight with bitumen B1. In this thesis, bitumen B1, B2, B3 and B4 have been used to study the phase separation in bitumen and bitumen B1, B2 and B5 have been used to investigate surface ageing of bitumen.
The crude oil sources are different for each of the bitumen. B1 and B4 are straight run bitumen from Venezuela and Kuwait export crude, respectively, whereas the source of bitumen B2 and B5 are unknown. The penetration, softening point, dynamic viscosity, kinetic viscosity and fraass breaking point were measured in accordance with the European standards EN 1426, EN 1427, EN 12596, EN 12595 and EN 12593, respectively and shown in Table 2. The addition of sasobit wax in bitumen B1 decreased penetration and viscosity whereas softening point increased, which indicates the stiffening effect of Bitumen B3.
From Table 2 can be seen that bitumen B1 contains almost no waxes and bitumen B2, B4 and B5 contain natural wax. Depending on the method, the measured wax content in bitumen can be quite variable. It is therefore important to note which method was used, when reporting the wax content. In this study the DSC method has been utilized to investigate the microcrystalline fractions in bitumen.
24 ‖ Materials, Methods and Experimental Plan
Table 2. Characterization of bitumen used in this study
Bitumen ID Pen Soft.
Point
Dyn. Viscosity@60°C
Kin. Viscosity@135°C
Fraass breaking point, °C
Wax content
DSC wax
TLC-FID wax
EN1426 EN1427 EN12596 EN12595 EN12593 EN12606 a* b* (dmm) (°C) (Pa s) (mm2/s) (°C) (%) (%) (%) B1 91 46.2 168 342 -15 0.3 0 0 B2 86 46.4 96 181 -16 1.7 6.2 1.9 B3 50 78 n.d 257 -14 n.d. 5.4 n.d. B4 82 45.8 163 399 -15 1 6.2 1.9 B5 72 50.8 94 124 -7 n.d. 5.4 n.d. n.d. - not determined a* - ASTM D 3418-12 b*- Lu & Redelius (2006)
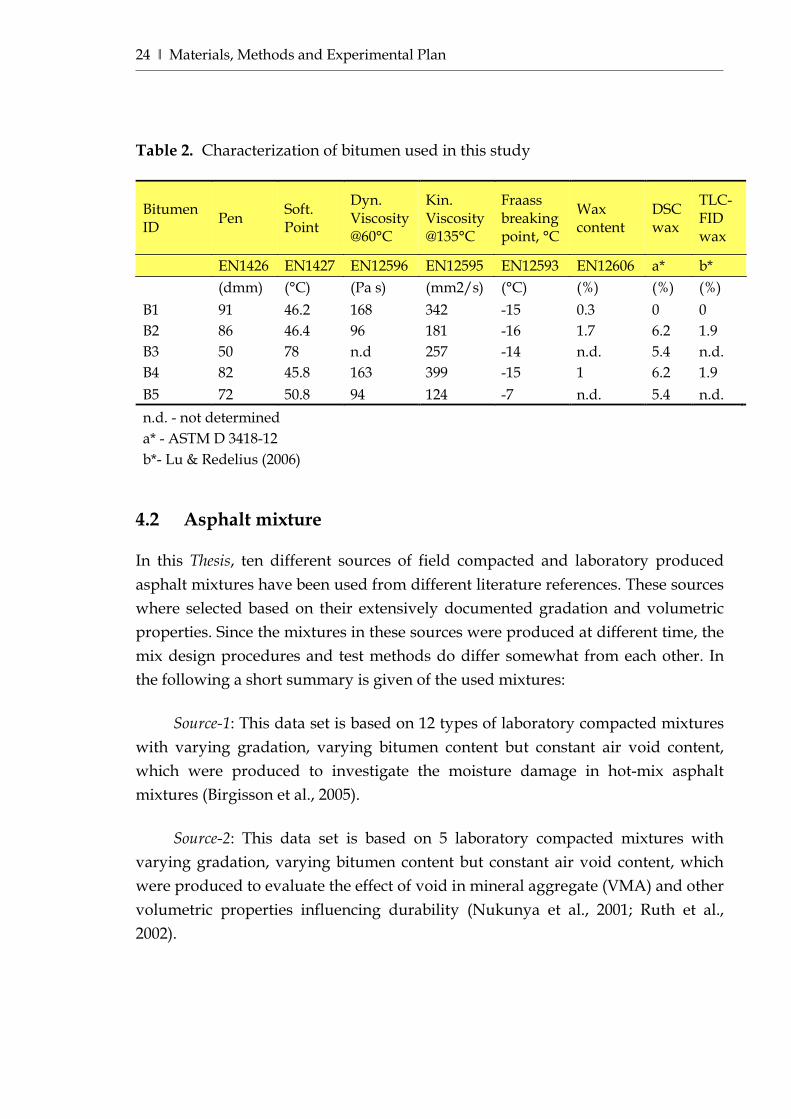
4.2 Asphalt mixture In this Thesis, ten different sources of field compacted and laboratory produced asphalt mixtures have been used from different literature references. These sources where selected based on their extensively documented gradation and volumetric properties. Since the mixtures in these sources were produced at different time, the mix design procedures and test methods do differ somewhat from each other. In the following a short summary is given of the used mixtures:
Source-1: This data set is based on 12 types of laboratory compacted mixtures with varying gradation, varying bitumen content but constant air void content, which were produced to investigate the moisture damage in hot-mix asphalt mixtures (Birgisson et al., 2005).
Source-2: This data set is based on 5 laboratory compacted mixtures with
varying gradation, varying bitumen content but constant air void content, which were produced to evaluate the effect of void in mineral aggregate (VMA) and other volumetric properties influencing durability (Nukunya et al., 2001; Ruth et al., 2002).
Materials, Methods and Experimental Plan ‖ 25
Source-3: Based on 26 different asphalt mixtures with different gradations, this data set was prepared to investigate the influence of aggregate gradation and packing characteristics on VMA (Vavrik et al., 2001).
Source-4: Using 8 different test sections (35-39, 54-56) from the WesTrack test
facility in Nevada (USA), this data set was created to develop performance-related specifications for hot-mix asphalt pavement construction (FHWA, 1998).
Source-5: This data set was based on 9 different sections from the Pavement
Test Track constructed by National Center for Asphalt Technology (NCAT), which were paved for research purpose specially focused on the performance prediction of pavements in the field (Powell, 2001).
Source-6: This data set was based on 6 different laboratory compacted asphalt
mixtures with a constant gradation, constant air void content but varying bitumen content, which were compacted to investigate the effect of bitumen film thickness on short and long term ageing (Kandhal and Chakraborty, 1996).
Source-7: Based on 4 different cores (17, 18, 20 and 22), this data set is taken
from the MnROAD test sections or ‘cells’, which was constructed at the beginning of 1990 by the Minnesota Department of Transportation to study different pavement designs, constructions and mixture durability (Pellinen, 2001).
Source-8: This data set is based on six field sections from three locations in
southwest Florida, USA (Jajliardo, 2003; Roque et al., 2010). These sections were chosen in pairs of good and poor performance with similar structure, loading and age, but with different mix design. A number of cores had been extracted from these sections to measure the volumetric properties and evaluate the performance. These samples were then placed in an bitumen extraction device to separate the binder from the aggregate. Viscosity tests were performed on the extracted bitumen at 60°C using the Brookfield Thermosel Apparatus in accordance with ASTM D 4402-87 specification.
Source-9: This data set contains ten different field sections and the age of these
sections ranged from 9 years to 14 years. In order to find the volumetric properties and aged viscosity of the bitumen three cores from each section were selected. Once aggregates were separated from the binder, sieve analysis was performed to find out the gradation. Also viscosity of the extracted bitumen was measured at 60°C. This data set was prepared to investigate loading effects on surface cracking of asphalt pavements (Garcia, 2002).
26 ‖ Materials, Methods and Experimental Plan
Source-10: A comprehensive data base with regard to design, construction and field performance of twelve Superpave project field sections has been documented in Superpave monitoring project report by Roque et al., 2011. The viscosity of the extracted bitumen was measured at both 25°C and 60°C. The current study is mainly focused on asphalt pavement constructed with unmodified bitumen. Thus only five among these twelve sections were selected which were constructed using unmodified bitumen.
The detailed gradation and volumetric properties of source 1-10 can be found
in Appendix. The above described seven sources (1-7) have been used to find a new correlation between porosity and coating thickness around the aggregates. Since only in three sources (Source-2, 6 and 7) the researchers studied the durability performance under varying ageing conditions, the effect of aggregate packing on ageing of asphalt mixtures has been investigated based on these three sources only. Furthermore, mixtures in source 8-10 have been used as input parameters in the morphology framework. The effect of mixture morphology on asphalt mixture ageing behavior has been analyzed based on the above mentioned data base. 4.3 Differential scanning calorimetry analyses One of the well accepted methods to determine the presence of wax in bitumen using the energy change is differential scanning calorimetry (DSC). To investigate the heat flow characteristics of bitumen and correlate it to the AFM work, the DSC analyses were conducted. The crystallization or melting of waxes in bitumen causes an energy change. Both heating and cooling cycle can be used to investigate the presence of wax fraction in bitumen. The exothermic and endothermic effect during the cooling and heating scan generally represents the wax crystallization and wax melting, respectively. The tests were performed using a METTLER instrument (model METTLER TOLEDO DSC 1) equipped with a refrigerated cooling system.
Approximately 15 mg of bitumen was poured into the DSC sample pans, which were sealed with lids with a small hole to prevent pressure build up and possible deformation of the cups during the tests. The sample pan was then placed horizontally on a hot plate at 80°C for 5 to 10 minutes to let the bitumen touch the pan bottom and also level out the surface. Afterwards, the sample pan was placed in DSC furnace and cooled to -80°C (Paper I) or -70°C (Paper II) and kept at this temperature for 5 minutes. Data was recorded during heating from -80°C to +90°C
Materials, Methods and Experimental Plan ‖ 27
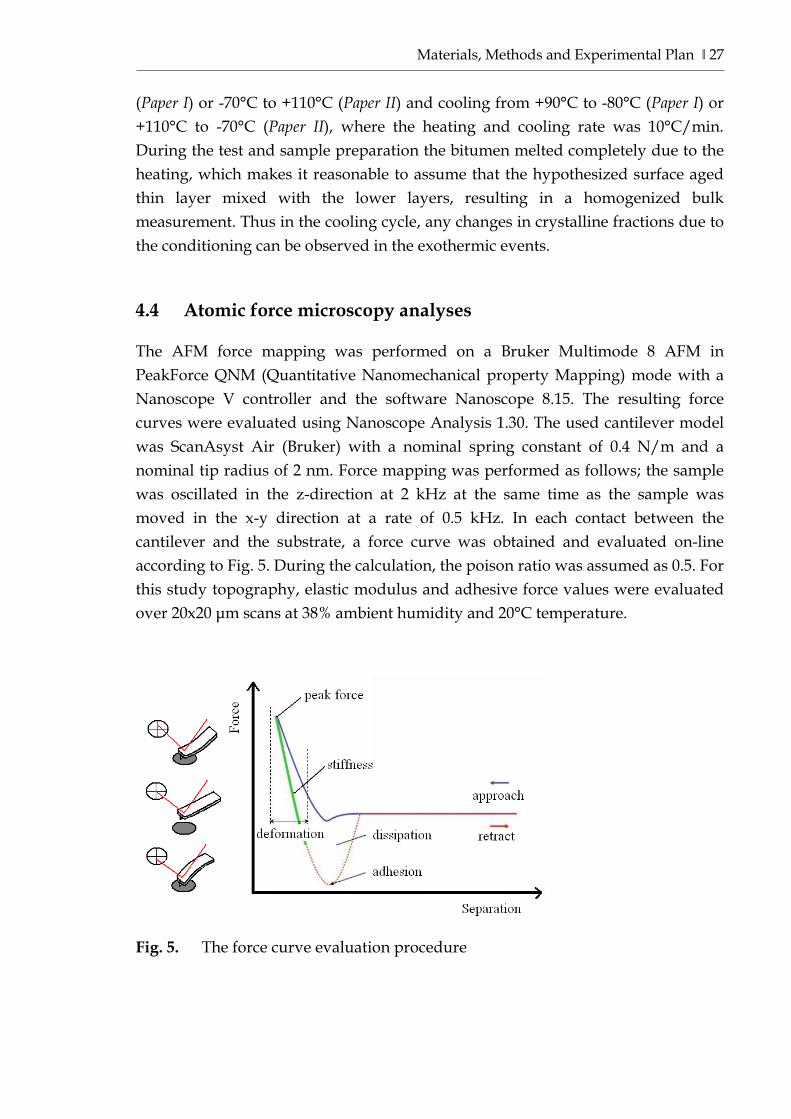
(Paper I) or -70°C to +110°C (Paper II) and cooling from +90°C to -80°C (Paper I) or +110°C to -70°C (Paper II), where the heating and cooling rate was 10°C/min. During the test and sample preparation the bitumen melted completely due to the heating, which makes it reasonable to assume that the hypothesized surface aged thin layer mixed with the lower layers, resulting in a homogenized bulk measurement. Thus in the cooling cycle, any changes in crystalline fractions due to the conditioning can be observed in the exothermic events. 4.4 Atomic force microscopy analyses The AFM force mapping was performed on a Bruker Multimode 8 AFM in PeakForce QNM (Quantitative Nanomechanical property Mapping) mode with a Nanoscope V controller and the software Nanoscope 8.15. The resulting force curves were evaluated using Nanoscope Analysis 1.30. The used cantilever model was ScanAsyst Air (Bruker) with a nominal spring constant of 0.4 N/m and a nominal tip radius of 2 nm. Force mapping was performed as follows; the sample was oscillated in the z-direction at 2 kHz at the same time as the sample was moved in the x-y direction at a rate of 0.5 kHz. In each contact between the cantilever and the substrate, a force curve was obtained and evaluated on-line according to Fig. 5. During the calculation, the poison ratio was assumed as 0.5. For this study topography, elastic modulus and adhesive force values were evaluated over 20x20 μm scans at 38% ambient humidity and 20°C temperature.
Fig. 5. The force curve evaluation procedure
28 ‖ Materials, Methods and Experimental Plan
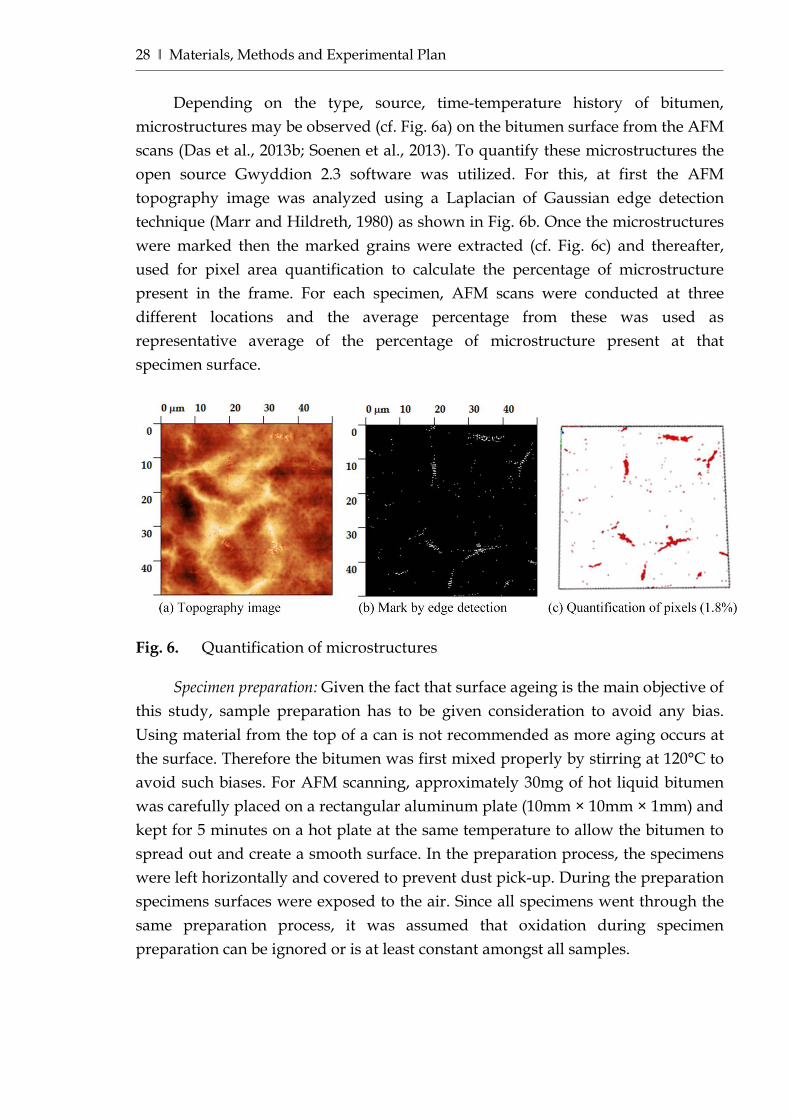
Depending on the type, source, time-temperature history of bitumen, microstructures may be observed (cf. Fig. 6a) on the bitumen surface from the AFM scans (Das et al., 2013b; Soenen et al., 2013). To quantify these microstructures the open source Gwyddion 2.3 software was utilized. For this, at first the AFM topography image was analyzed using a Laplacian of Gaussian edge detection technique (Marr and Hildreth, 1980) as shown in Fig. 6b. Once the microstructures were marked then the marked grains were extracted (cf. Fig. 6c) and thereafter, used for pixel area quantification to calculate the percentage of microstructure present in the frame. For each specimen, AFM scans were conducted at three different locations and the average percentage from these was used as representative average of the percentage of microstructure present at that specimen surface.
Fig. 6. Quantification of microstructures
Specimen preparation: Given the fact that surface ageing is the main objective of this study, sample preparation has to be given consideration to avoid any bias. Using material from the top of a can is not recommended as more aging occurs at the surface. Therefore the bitumen was first mixed properly by stirring at 120°C to avoid such biases. For AFM scanning, approximately 30mg of hot liquid bitumen was carefully placed on a rectangular aluminum plate (10mm × 10mm × 1mm) and kept for 5 minutes on a hot plate at the same temperature to allow the bitumen to spread out and create a smooth surface. In the preparation process, the specimens were left horizontally and covered to prevent dust pick-up. During the preparation specimens surfaces were exposed to the air. Since all specimens went through the same preparation process, it was assumed that oxidation during specimen preparation can be ignored or is at least constant amongst all samples.
Materials, Methods and Experimental Plan ‖ 29
4.5 Experimental scheme Microstructures may appear in some of the bitumen under certain conditions under the AFM. It is of great importance to understand the fundamental mechanisms that drive the bitumen behavior and that cause the microstructure appearance we see under the AFM. To do so in Paper I and II, bitumen was investigated using AFM in contact mode that both topography and relative surface stiffness can be obtained simultaneously. The imaging was done by 10°C temperature sweeping from 30°C to 60°C for each types of bitumen, where the heating rate was 1°C/min and rest period was 10min before starting scanning at each temperature. Then the same procedure was repeated by a cooling cycle from 60°C to 30°C. The same bitumen types were then also investigated using DSC, to investigate how the thermodynamic behavior would correlate to the observed behavior under the temperature controlled AFM.
Furthermore in Paper II, AFM was utilized to provide information of changes of the microstructures and the micromechanical properties at the surface due to oxidation and/or ultra violet (UV) radiation. Right after the specimen preparation, specimens were exposed to the following four different levels of conditions: both UV and air, only UV but no air, only air but no UV and neither UV nor air, for 15 and 30 days, in a temperature (20°C) controlled environment. One specimen from each type of bitumen was kept unconditioned to give a reference measure.
Oxidative ageing conditioning: Since argon is one of the noble gas and heavier than the ambient air, it was used to create an oxygen free (no air) environment. To create oxygen free environments, specimens were placed in glass containers in which argon gas was introduced via an inlet. In this process, argon gas was allowed to spread in the container until the air was pushed out completely leaving for an airtight environment.
UV conditioning: The UV spectrum that reaches the earth mainly contains UV-A type radiation since the other ranges of the spectrum almost entirely get absorbed by the ozone layer and the atmosphere. In this study, commercial UV light has been used to resemble the UV-A radiation. For the non-UV conditioning, specimens were placed inside containers, carefully wrapped in multiple layers of aluminum foil and kept in a dark place.
30 ‖ Materials, Methods and Experimental Plan
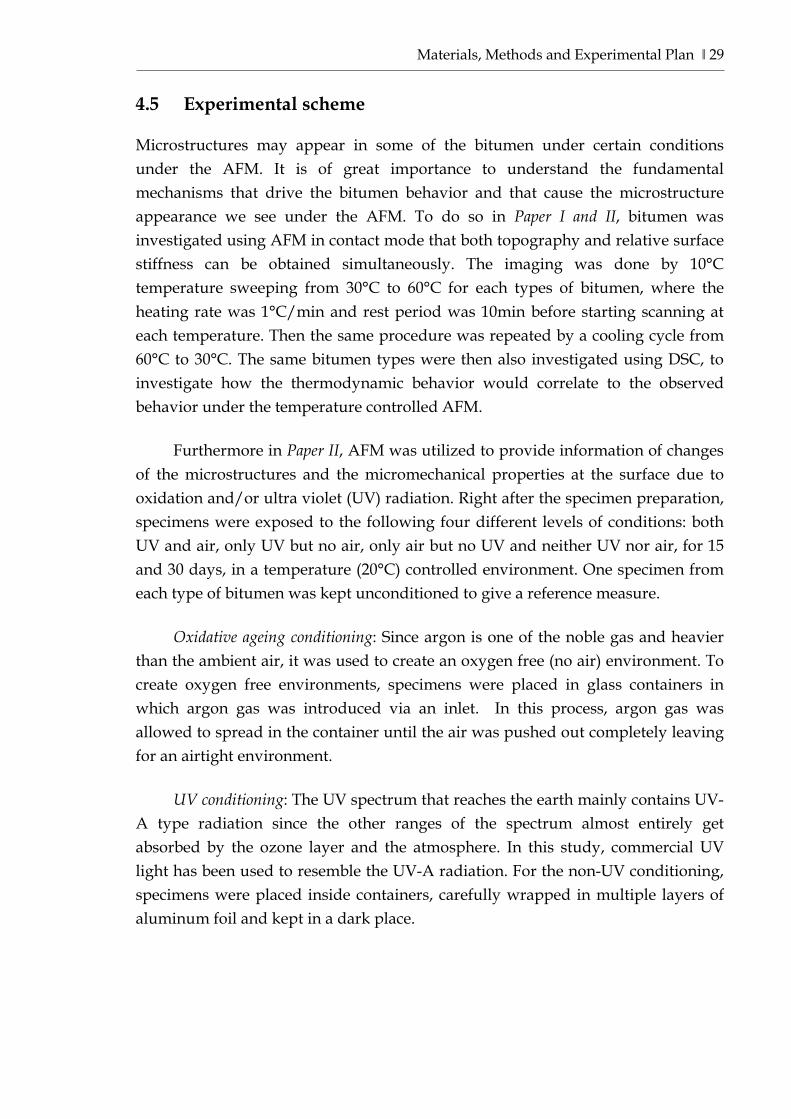
After 24 hours, the unconditioned bitumen specimens were scanned with the AFM to investigate the topography feature and micromechanical properties. The 15 and 30 days conditioned specimens were investigated by using AFM and the percentage of observed microstructures at the surface compared to investigate the ageing propensity. Thereafter, the 30 days conditioned specimens were investigated further, utilizing DSC and compared to study any change of the crystalline fractions due to the conditioning. The schematic of the experimental plan is shown in Fig. 7.
Fig. 7. Experimental scheme
If bitumen is exposed to air or sunlight, the combination of oxidation and UV radiation may create a thin film of less soluble (in n-alkane medium) hydrocarbon molecules upon the exposed surface. Since these ageing products are mainly polar compound, the thin film might be soluble in water. Based on this understanding, the water solubility of the thin film caused by the surface ageing has been investigated furthermore in Paper IV. The air and UV exposed (30 days) bitumen B5 specimen surfaces were carefully washed with distilled water for five minutes so that any presence of water soluble particles can get washed away. After that the surface washed specimens were kept 24 hours at 20°C so that the surfaces get dry before scanning by AFM. The bitumen surface was scanned before and after ageing, and after washing with distilled water so that one may observe the changes in microstructure at the surface during these steps.
Finite Element Analysis of Oxidative Ageing ‖ 31
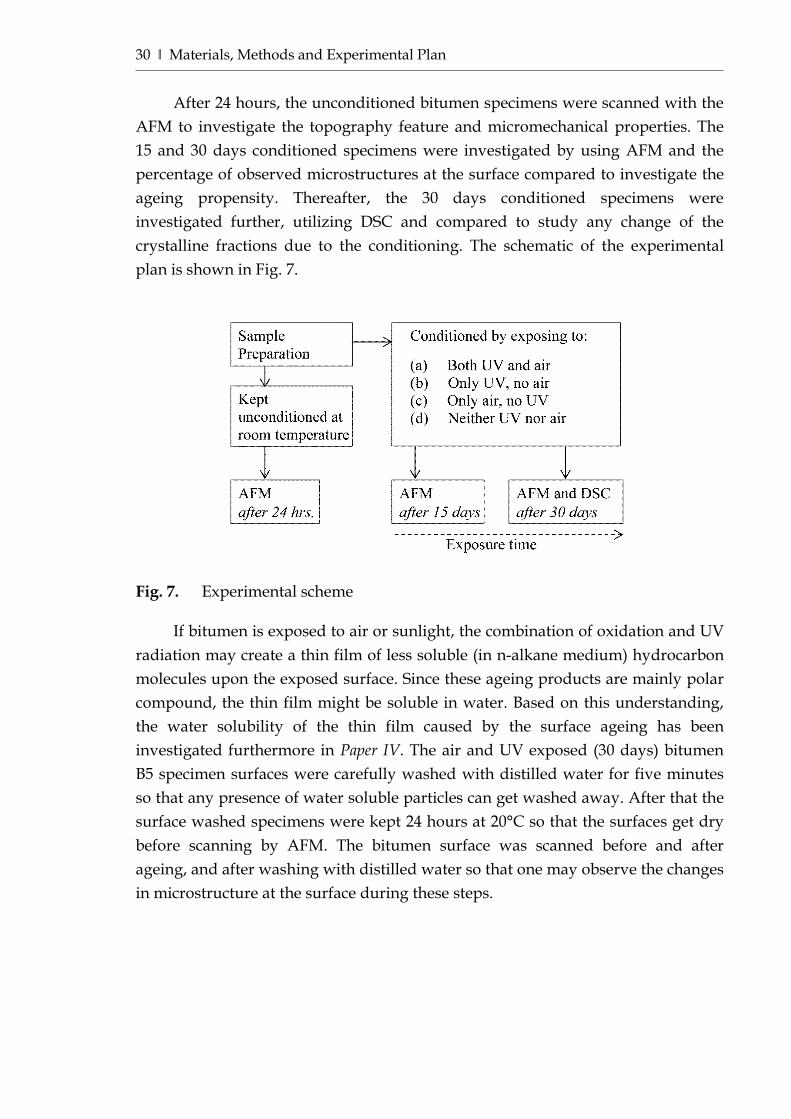
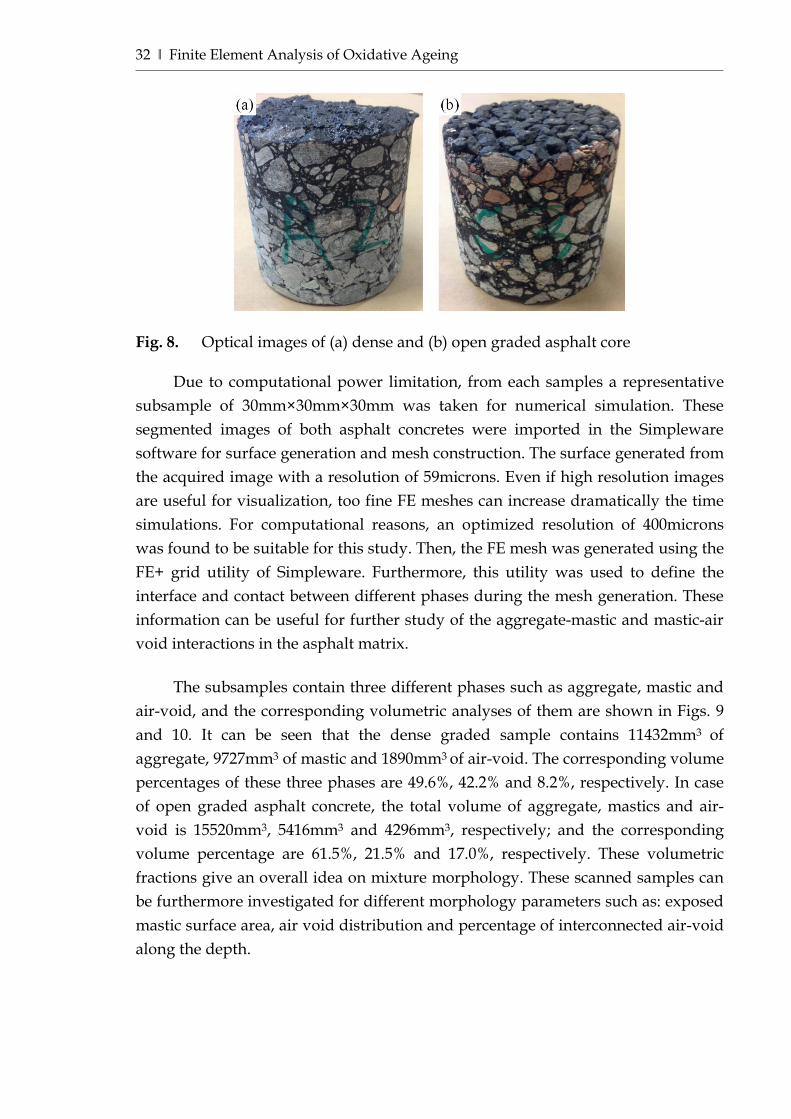
Chapter 5 5 Finite Element Analysis of Oxidative Ageing A finite element (FE) analysis has been conducted to investigate the influence of diffusion controlled oxidative ageing on different mixture morphologies. Two field asphalt mixture cores were selected to investigate different mixture morphologies. These cores were scanned to acquire the complete 3D morphology information to be transferred to the mesh geometry in FE analyses. Then, the abovementioned implemented diffusion model was applied using these realistic mixture geometries. More details on the geometry, the mesh construction and the FE analyses are given in the following. 5.1 Geometry and mesh construction In this Thesis, diffusion controlled oxidative ageing of one dense graded and one open graded field asphalt concrete core have been investigated. The KTH X5000 CT X-ray scanner is used to obtain the detailed microscopic structure of the cores sample for further visualization, characterization and analysis. The asphalt concrete core samples with a diameter of 100mm and a height of 80mm as shown in Fig. 8 are scanned. The sample is scanned at an energy intensity of 225kV without beam filtration. The scanning resolution is 1949 × 1799 with a slice thickness of 59microns and a total of 1932 slices. The x-ray scanning process includes sample preparation, warming-up the scanner, pre-scan settings, scanning, detector calibration and CT calibration. Detail information of the scanning process and digital image processing can be found in Onifade et al. (2013).
32 ‖ Finite Element Analysis of Oxidative Ageing
Fig. 8. Optical images of (a) dense and (b) open graded asphalt core
Due to computational power limitation, from each samples a representative subsample of 30mm×30mm×30mm was taken for numerical simulation. These segmented images of both asphalt concretes were imported in the Simpleware software for surface generation and mesh construction. The surface generated from the acquired image with a resolution of 59microns. Even if high resolution images are useful for visualization, too fine FE meshes can increase dramatically the time simulations. For computational reasons, an optimized resolution of 400microns was found to be suitable for this study. Then, the FE mesh was generated using the FE+ grid utility of Simpleware. Furthermore, this utility was used to define the interface and contact between different phases during the mesh generation. These information can be useful for further study of the aggregate-mastic and mastic-air void interactions in the asphalt matrix.
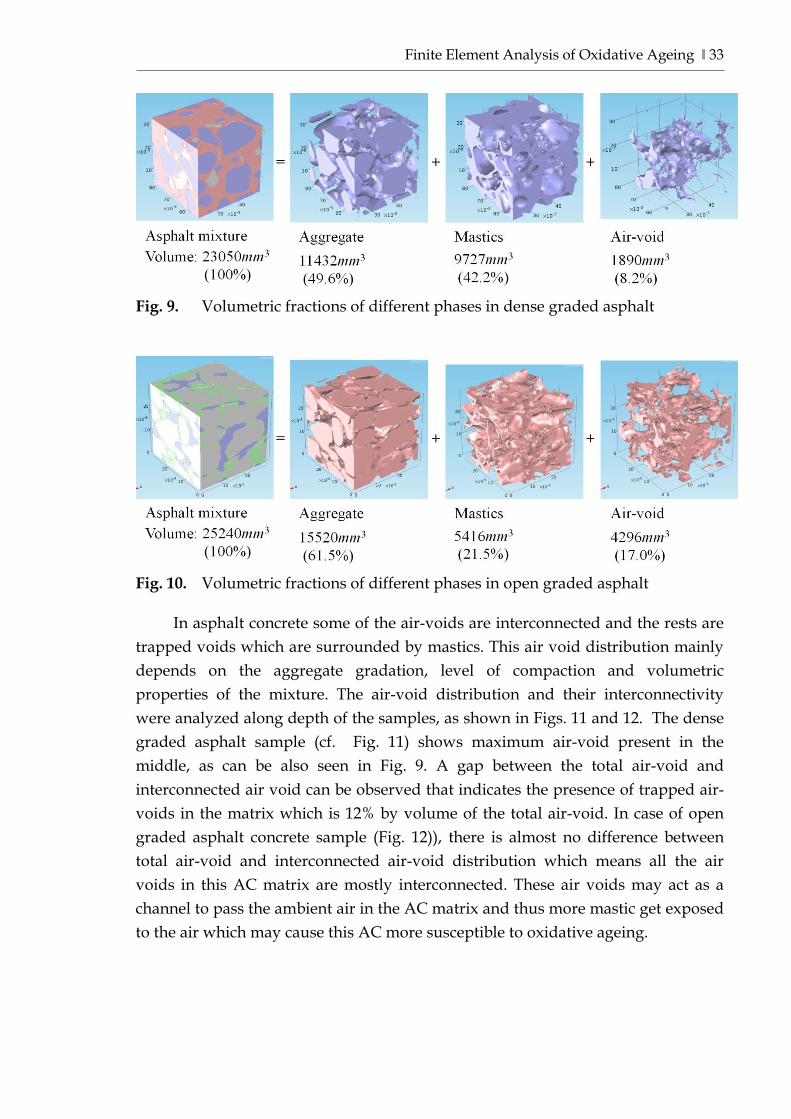
The subsamples contain three different phases such as aggregate, mastic and air-void, and the corresponding volumetric analyses of them are shown in Figs. 9 and 10. It can be seen that the dense graded sample contains 11432mm3 of aggregate, 9727mm3 of mastic and 1890mm3 of air-void. The corresponding volume percentages of these three phases are 49.6%, 42.2% and 8.2%, respectively. In case of open graded asphalt concrete, the total volume of aggregate, mastics and air-void is 15520mm3, 5416mm3 and 4296mm3, respectively; and the corresponding volume percentage are 61.5%, 21.5% and 17.0%, respectively. These volumetric fractions give an overall idea on mixture morphology. These scanned samples can be furthermore investigated for different morphology parameters such as: exposed mastic surface area, air void distribution and percentage of interconnected air-void along the depth.
Finite Element Analysis of Oxidative Ageing ‖ 33
Fig. 9. Volumetric fractions of different phases in dense graded asphalt
Fig. 10. Volumetric fractions of different phases in open graded asphalt
In asphalt concrete some of the air-voids are interconnected and the rests are trapped voids which are surrounded by mastics. This air void distribution mainly depends on the aggregate gradation, level of compaction and volumetric properties of the mixture. The air-void distribution and their interconnectivity were analyzed along depth of the samples, as shown in Figs. 11 and 12. The dense graded asphalt sample (cf. Fig. 11) shows maximum air-void present in the middle, as can be also seen in Fig. 9. A gap between the total air-void and interconnected air void can be observed that indicates the presence of trapped air-voids in the matrix which is 12% by volume of the total air-void. In case of open graded asphalt concrete sample (Fig. 12)), there is almost no difference between total air-void and interconnected air-void distribution which means all the air voids in this AC matrix are mostly interconnected. These air voids may act as a channel to pass the ambient air in the AC matrix and thus more mastic get exposed to the air which may cause this AC more susceptible to oxidative ageing.
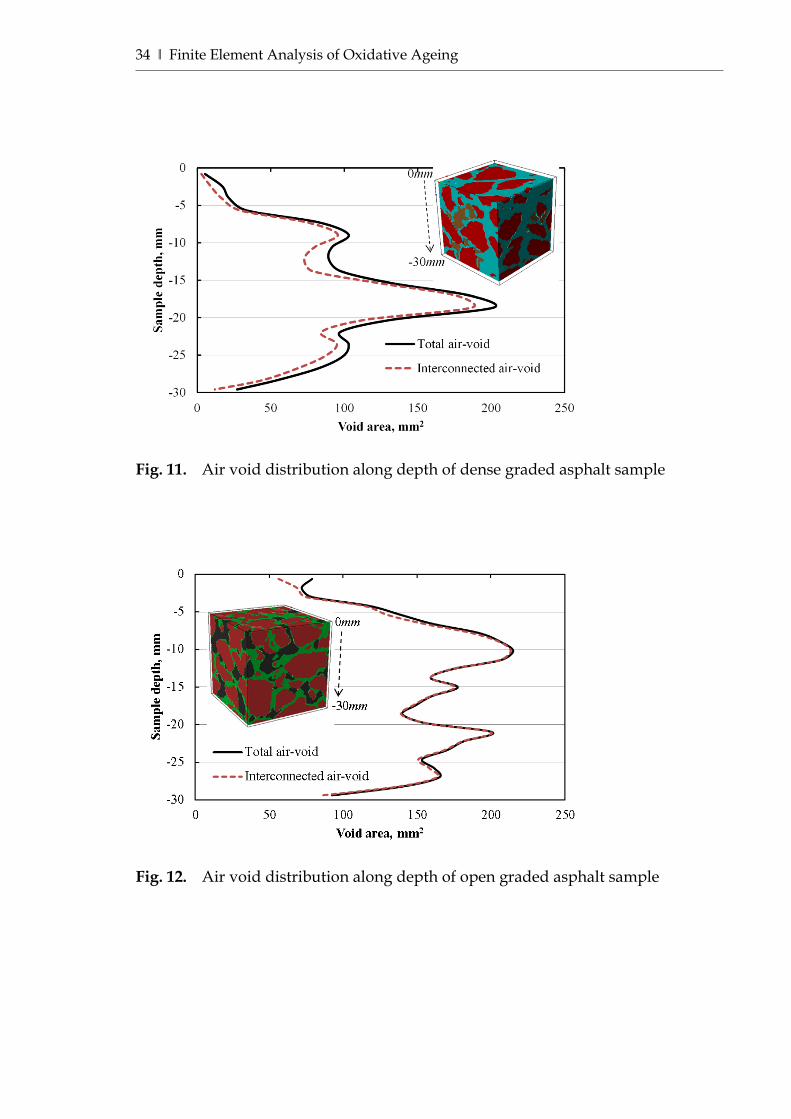
34 ‖ Finite Element Analysis of Oxidative Ageing
Fig. 11. Air void distribution along depth of dense graded asphalt sample
Fig. 12. Air void distribution along depth of open graded asphalt sample
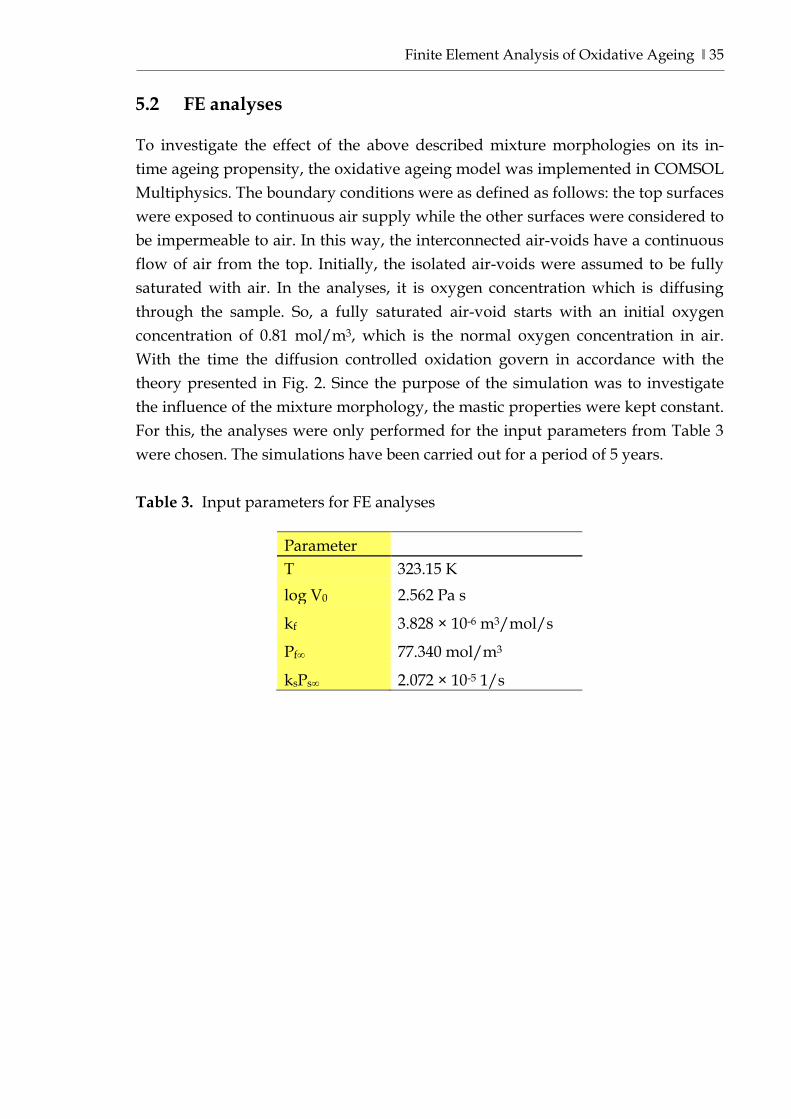
Finite Element Analysis of Oxidative Ageing ‖ 35
5.2 FE analyses To investigate the effect of the above described mixture morphologies on its in-time ageing propensity, the oxidative ageing model was implemented in COMSOL Multiphysics. The boundary conditions were as defined as follows: the top surfaces were exposed to continuous air supply while the other surfaces were considered to be impermeable to air. In this way, the interconnected air-voids have a continuous flow of air from the top. Initially, the isolated air-voids were assumed to be fully saturated with air. In the analyses, it is oxygen concentration which is diffusing through the sample. So, a fully saturated air-void starts with an initial oxygen concentration of 0.81 mol/m3, which is the normal oxygen concentration in air. With the time the diffusion controlled oxidation govern in accordance with the theory presented in Fig. 2. Since the purpose of the simulation was to investigate the influence of the mixture morphology, the mastic properties were kept constant. For this, the analyses were only performed for the input parameters from Table 3 were chosen. The simulations have been carried out for a period of 5 years. Table 3. Input parameters for FE analyses
Parameter T 323.15 K log V0 2.562 Pa s
kf 3.828 × 10⁻⁶ m3/mol/s
Pf∞ 77.340 mol/m3
ksPs∞ 2.072 × 10⁻⁵ 1/s

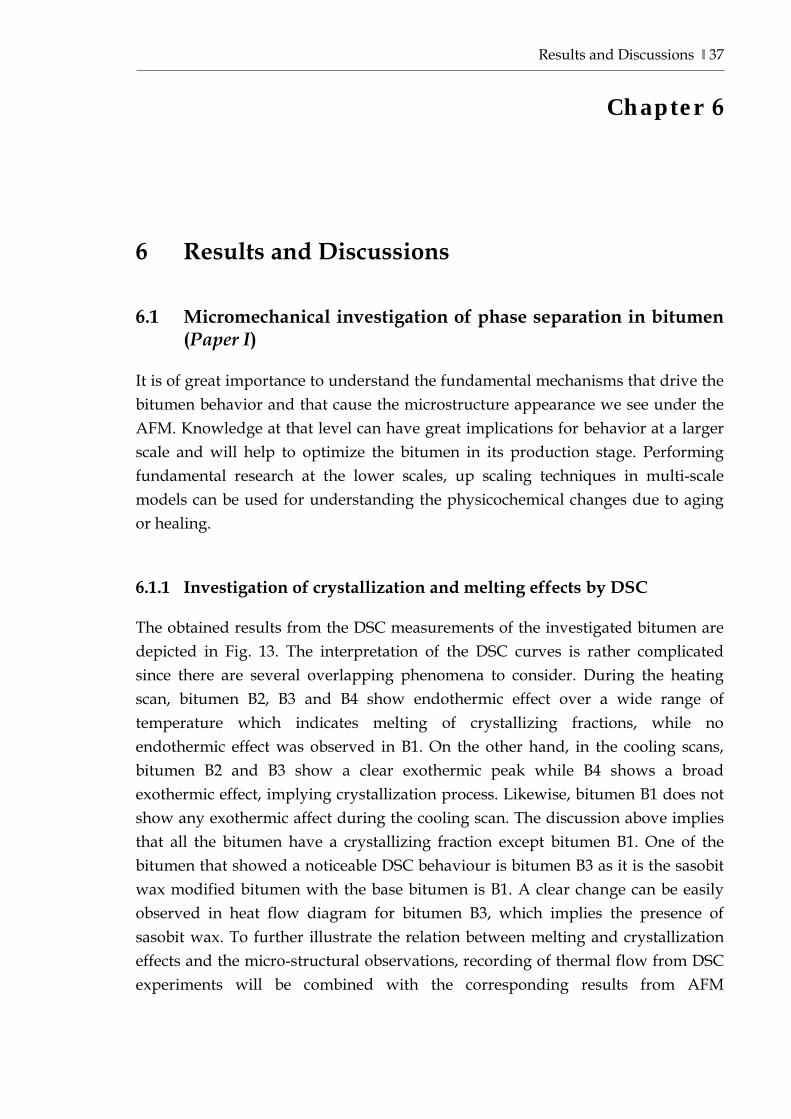
Results and Discussions ‖ 37
Chapter 6 6 Results and Discussions 6.1 Micromechanical investigation of phase separation in bitumen
(Paper I) It is of great importance to understand the fundamental mechanisms that drive the bitumen behavior and that cause the microstructure appearance we see under the AFM. Knowledge at that level can have great implications for behavior at a larger scale and will help to optimize the bitumen in its production stage. Performing fundamental research at the lower scales, up scaling techniques in multi-scale models can be used for understanding the physicochemical changes due to aging or healing. 6.1.1 Investigation of crystallization and melting effects by DSC The obtained results from the DSC measurements of the investigated bitumen are depicted in Fig. 13. The interpretation of the DSC curves is rather complicated since there are several overlapping phenomena to consider. During the heating scan, bitumen B2, B3 and B4 show endothermic effect over a wide range of temperature which indicates melting of crystallizing fractions, while no endothermic effect was observed in B1. On the other hand, in the cooling scans, bitumen B2 and B3 show a clear exothermic peak while B4 shows a broad exothermic effect, implying crystallization process. Likewise, bitumen B1 does not show any exothermic affect during the cooling scan. The discussion above implies that all the bitumen have a crystallizing fraction except bitumen B1. One of the bitumen that showed a noticeable DSC behaviour is bitumen B3 as it is the sasobit wax modified bitumen with the base bitumen is B1. A clear change can be easily observed in heat flow diagram for bitumen B3, which implies the presence of sasobit wax. To further illustrate the relation between melting and crystallization effects and the micro-structural observations, recording of thermal flow from DSC experiments will be combined with the corresponding results from AFM
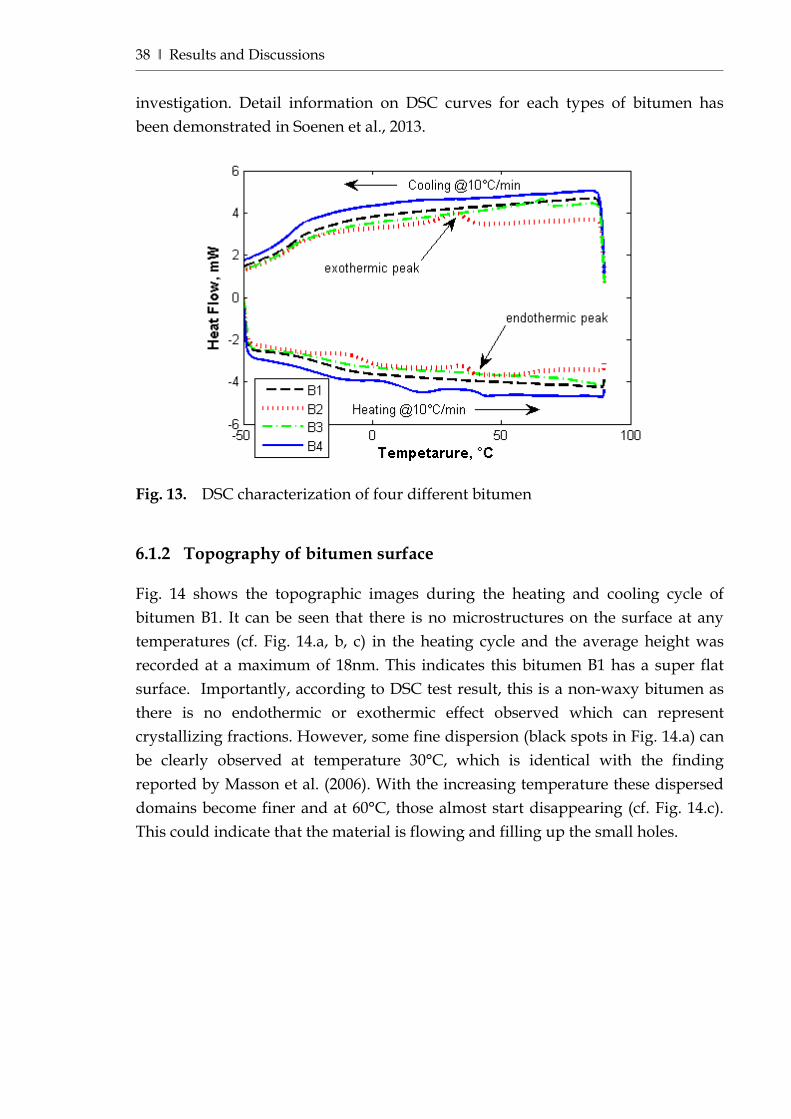
38 ‖ Results and Discussions
investigation. Detail information on DSC curves for each types of bitumen has been demonstrated in Soenen et al., 2013.
Fig. 13. DSC characterization of four different bitumen 6.1.2 Topography of bitumen surface Fig. 14 shows the topographic images during the heating and cooling cycle of bitumen B1. It can be seen that there is no microstructures on the surface at any temperatures (cf. Fig. 14.a, b, c) in the heating cycle and the average height was recorded at a maximum of 18nm. This indicates this bitumen B1 has a super flat surface. Importantly, according to DSC test result, this is a non-waxy bitumen as there is no endothermic or exothermic effect observed which can represent crystallizing fractions. However, some fine dispersion (black spots in Fig. 14.a) can be clearly observed at temperature 30°C, which is identical with the finding reported by Masson et al. (2006). With the increasing temperature these dispersed domains become finer and at 60°C, those almost start disappearing (cf. Fig. 14.c). This could indicate that the material is flowing and filling up the small holes.
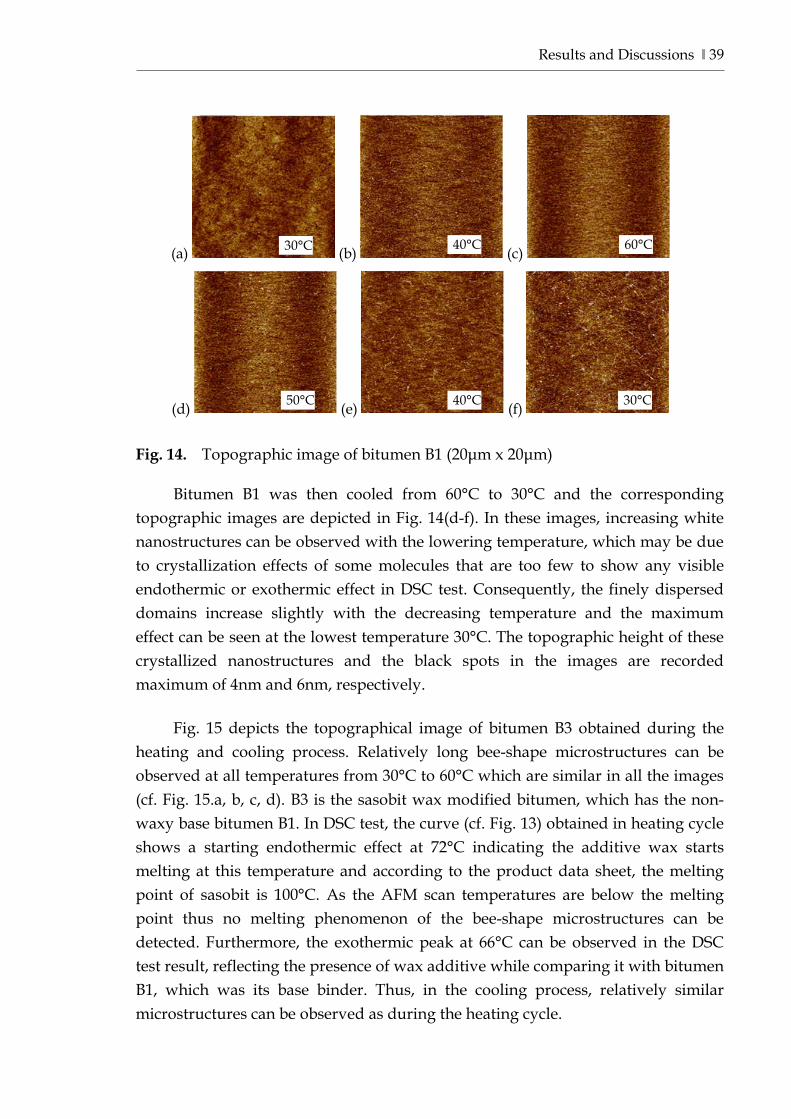
Results and Discussions ‖ 39
Fig. 14. Topographic image of bitumen B1 (20μm x 20μm)
Bitumen B1 was then cooled from 60°C to 30°C and the corresponding topographic images are depicted in Fig. 14(d-f). In these images, increasing white nanostructures can be observed with the lowering temperature, which may be due to crystallization effects of some molecules that are too few to show any visible endothermic or exothermic effect in DSC test. Consequently, the finely dispersed domains increase slightly with the decreasing temperature and the maximum effect can be seen at the lowest temperature 30°C. The topographic height of these crystallized nanostructures and the black spots in the images are recorded maximum of 4nm and 6nm, respectively.
Fig. 15 depicts the topographical image of bitumen B3 obtained during the
heating and cooling process. Relatively long bee-shape microstructures can be observed at all temperatures from 30°C to 60°C which are similar in all the images (cf. Fig. 15.a, b, c, d). B3 is the sasobit wax modified bitumen, which has the non-waxy base bitumen B1. In DSC test, the curve (cf. Fig. 13) obtained in heating cycle shows a starting endothermic effect at 72°C indicating the additive wax starts melting at this temperature and according to the product data sheet, the melting point of sasobit is 100°C. As the AFM scan temperatures are below the melting point thus no melting phenomenon of the bee-shape microstructures can be detected. Furthermore, the exothermic peak at 66°C can be observed in the DSC test result, reflecting the presence of wax additive while comparing it with bitumen B1, which was its base binder. Thus, in the cooling process, relatively similar microstructures can be observed as during the heating cycle.
(a) (b) (c)
(d) (e) (f)
30°C 40°C 60°C
50°C 40°C 30°C
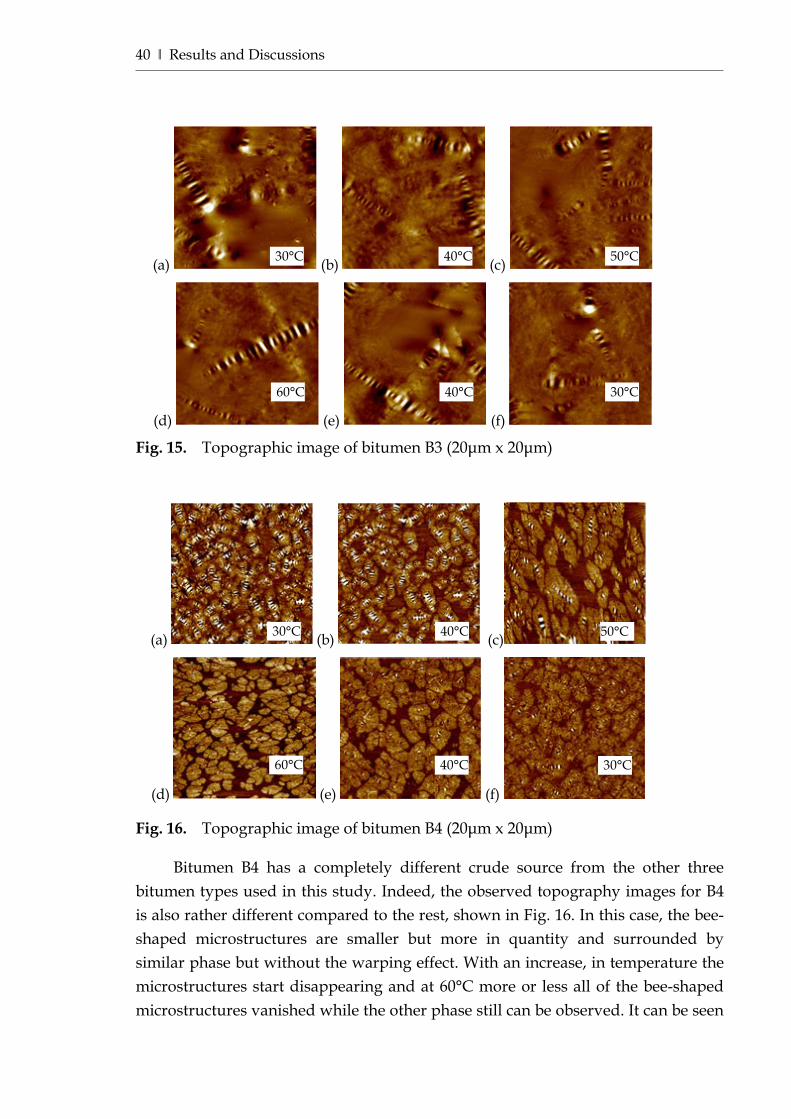
40 ‖ Results and Discussions
Fig. 15. Topographic image of bitumen B3 (20μm x 20μm)
Fig. 16. Topographic image of bitumen B4 (20μm x 20μm)
Bitumen B4 has a completely different crude source from the other three bitumen types used in this study. Indeed, the observed topography images for B4 is also rather different compared to the rest, shown in Fig. 16. In this case, the bee-shaped microstructures are smaller but more in quantity and surrounded by similar phase but without the warping effect. With an increase, in temperature the microstructures start disappearing and at 60°C more or less all of the bee-shaped microstructures vanished while the other phase still can be observed. It can be seen
(a) (b) (c)
(d) (e) (f)
(a) (b) (c)
(d) (e) (f)
30°C 40°C 60°C
50°C 40°C 30°C
30°C 40°C 50°C
60°C 40°C 30°C
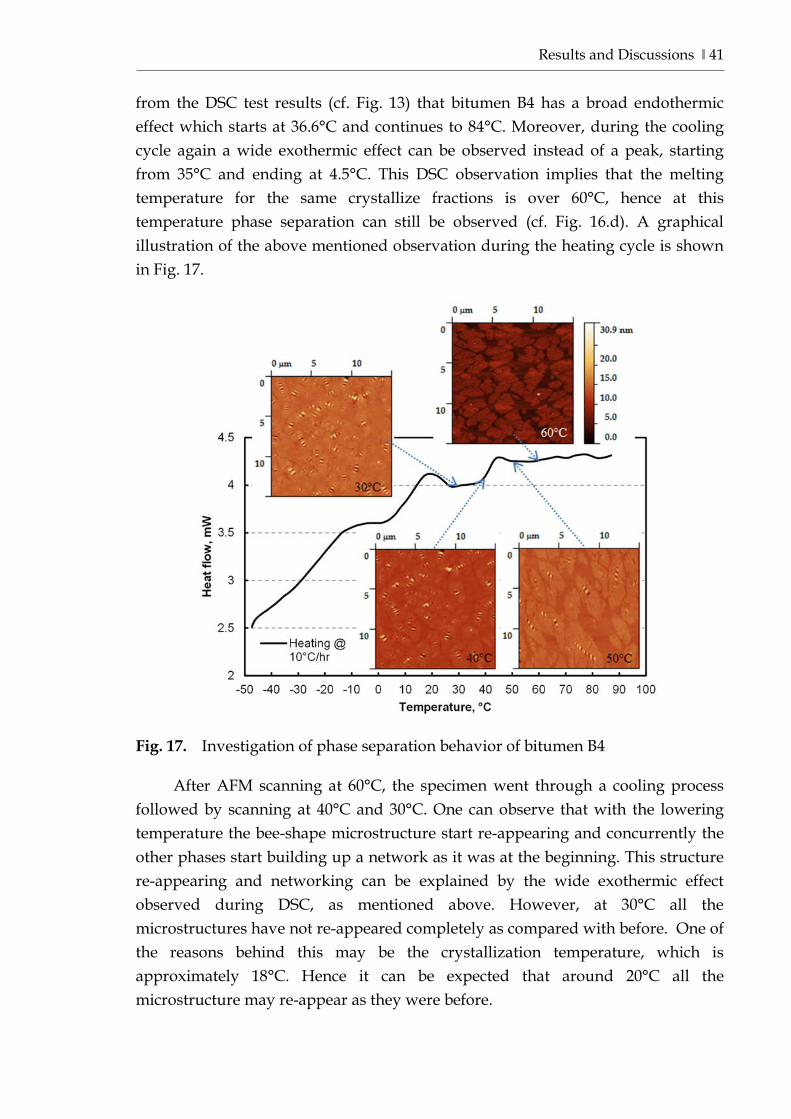
Results and Discussions ‖ 41
from the DSC test results (cf. Fig. 13) that bitumen B4 has a broad endothermic effect which starts at 36.6°C and continues to 84°C. Moreover, during the cooling cycle again a wide exothermic effect can be observed instead of a peak, starting from 35°C and ending at 4.5°C. This DSC observation implies that the melting temperature for the same crystallize fractions is over 60°C, hence at this temperature phase separation can still be observed (cf. Fig. 16.d). A graphical illustration of the above mentioned observation during the heating cycle is shown in Fig. 17.
Fig. 17. Investigation of phase separation behavior of bitumen B4
After AFM scanning at 60°C, the specimen went through a cooling process followed by scanning at 40°C and 30°C. One can observe that with the lowering temperature the bee-shape microstructure start re-appearing and concurrently the other phases start building up a network as it was at the beginning. This structure re-appearing and networking can be explained by the wide exothermic effect observed during DSC, as mentioned above. However, at 30°C all the microstructures have not re-appeared completely as compared with before. One of the reasons behind this may be the crystallization temperature, which is approximately 18°C. Hence it can be expected that around 20°C all the microstructure may re-appear as they were before.
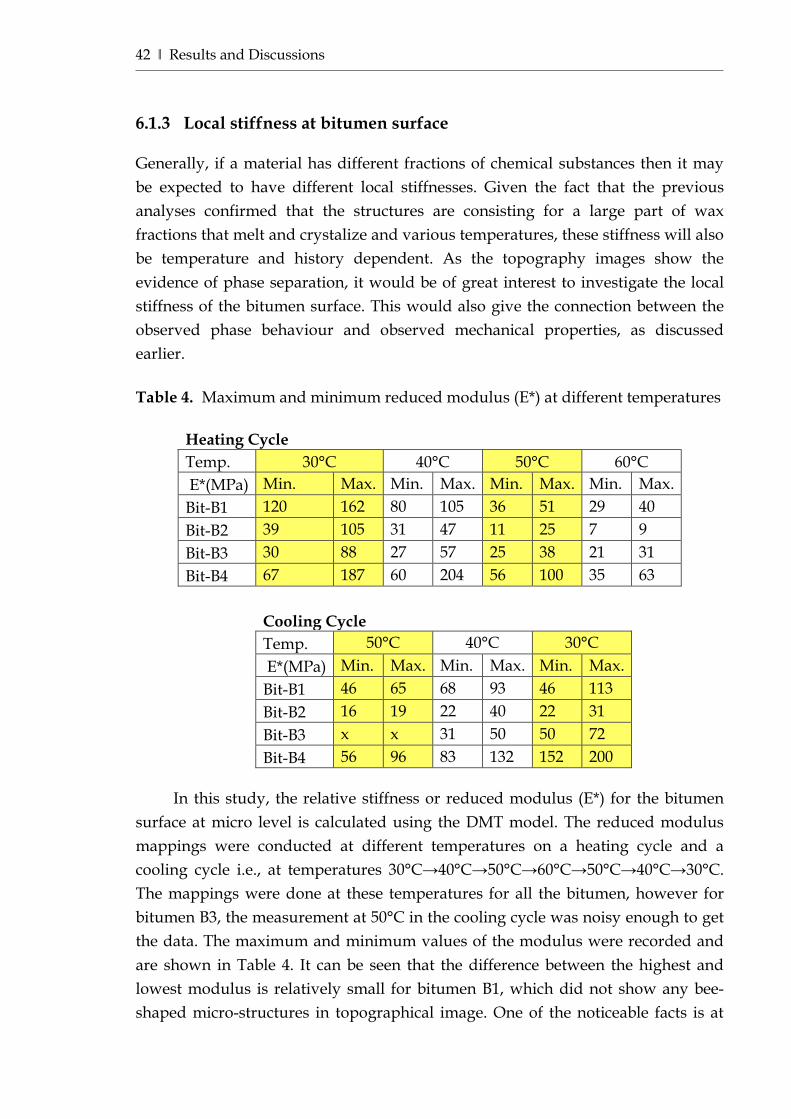
42 ‖ Results and Discussions
6.1.3 Local stiffness at bitumen surface Generally, if a material has different fractions of chemical substances then it may be expected to have different local stiffnesses. Given the fact that the previous analyses confirmed that the structures are consisting for a large part of wax fractions that melt and crystalize and various temperatures, these stiffness will also be temperature and history dependent. As the topography images show the evidence of phase separation, it would be of great interest to investigate the local stiffness of the bitumen surface. This would also give the connection between the observed phase behaviour and observed mechanical properties, as discussed earlier. Table 4. Maximum and minimum reduced modulus (E*) at different temperatures
Heating Cycle Temp. 30°C 40°C 50°C 60°C E*(MPa) Min. Max. Min. Max. Min. Max. Min. Max. Bit-B1 120 162 80 105 36 51 29 40 Bit-B2 39 105 31 47 11 25 7 9 Bit-B3 30 88 27 57 25 38 21 31 Bit-B4 67 187 60 204 56 100 35 63
Cooling Cycle
Temp. 50°C 40°C 30°C
E*(MPa) Min. Max. Min. Max. Min. Max.
Bit-B1 46 65 68 93 46 113
Bit-B2 16 19 22 40 22 31
Bit-B3 x x 31 50 50 72
Bit-B4 56 96 83 132 152 200
In this study, the relative stiffness or reduced modulus (E*) for the bitumen surface at micro level is calculated using the DMT model. The reduced modulus mappings were conducted at different temperatures on a heating cycle and a cooling cycle i.e., at temperatures 30°C→40°C→50°C→60°C→50°C→40°C→30°C. The mappings were done at these temperatures for all the bitumen, however for bitumen B3, the measurement at 50°C in the cooling cycle was noisy enough to get the data. The maximum and minimum values of the modulus were recorded and are shown in Table 4. It can be seen that the difference between the highest and lowest modulus is relatively small for bitumen B1, which did not show any bee-shaped micro-structures in topographical image. One of the noticeable facts is at
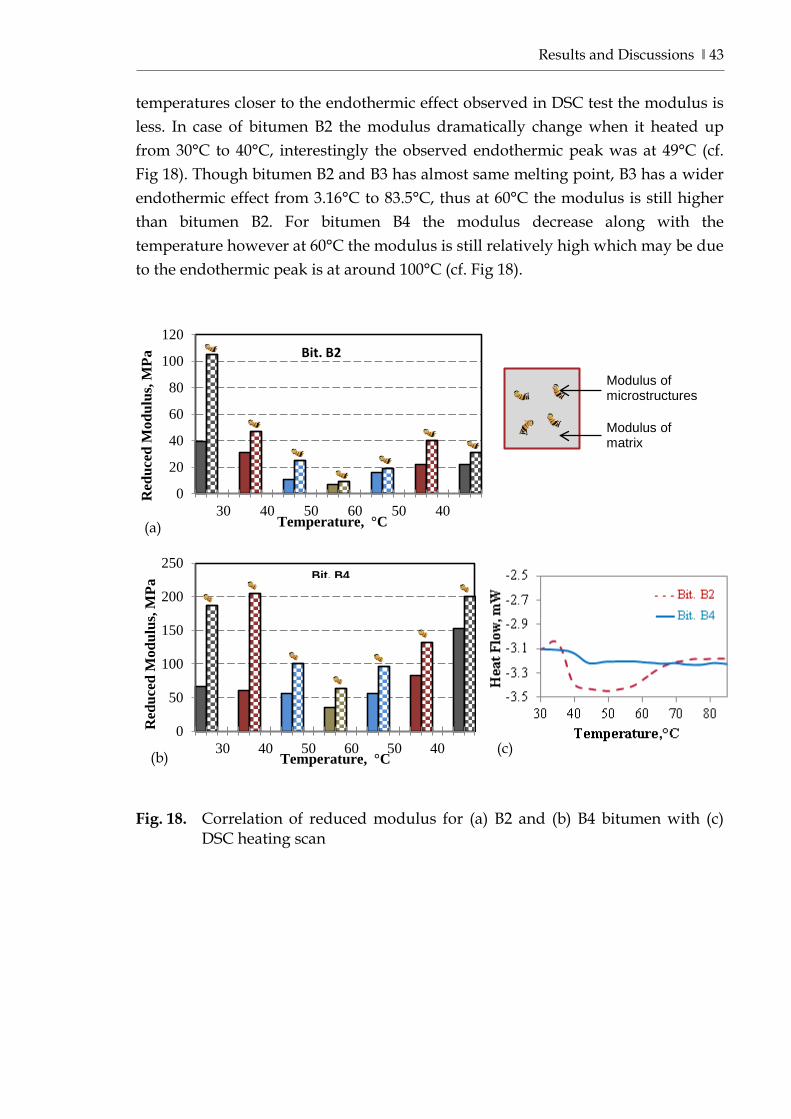
Results and Discussions ‖ 43
temperatures closer to the endothermic effect observed in DSC test the modulus is less. In case of bitumen B2 the modulus dramatically change when it heated up from 30°C to 40°C, interestingly the observed endothermic peak was at 49°C (cf. Fig 18). Though bitumen B2 and B3 has almost same melting point, B3 has a wider endothermic effect from 3.16°C to 83.5°C, thus at 60°C the modulus is still higher than bitumen B2. For bitumen B4 the modulus decrease along with the temperature however at 60°C the modulus is still relatively high which may be due to the endothermic peak is at around 100°C (cf. Fig 18).
Fig. 18. Correlation of reduced modulus for (a) B2 and (b) B4 bitumen with (c)
DSC heating scan
0
20
40
60
80
100
120
30 40 50 60 50 40
Red
uced
Mod
ulus
, MPa
Temperature, °C
Bit. B2
Modulus of microstructures
Modulus of matrix
0
50
100
150
200
250
30 40 50 60 50 40
Red
uced
Mod
ulus
, MPa
Temperature, °C
Bit. B4
(a)
(b) (c)
44 ‖ Results and Discussions
6.1.4 Summary of findings From the experiments it became clear that the change of the micro-structures in the bitumen surfaces, observed under the AFM due to a temperature increase, correlated directly with the DSC test results: the appearance of micro-structures is always in the crystallization temperature range of that specific bitumen and the dissolution of these micro-structures is directly related with the melting temperature range. Since AFM scanning was conducted in contact mode, the reduced modulus was also measured simultaneously with the topographic image. This modulus reflects the relative stiffness of the bitumen surface. Irrespective to the bitumen source and type, furthermore it was found that the modulus values were directly correlated with the endothermic and exothermic events. Thus based on the above analyses of results, it could be concluded that the behavior and appearance of the microstructure is very much related to the wax behavior. Therefore, this research confirms that the so called ‘‘Bee’’ structures are indeed wax induced.
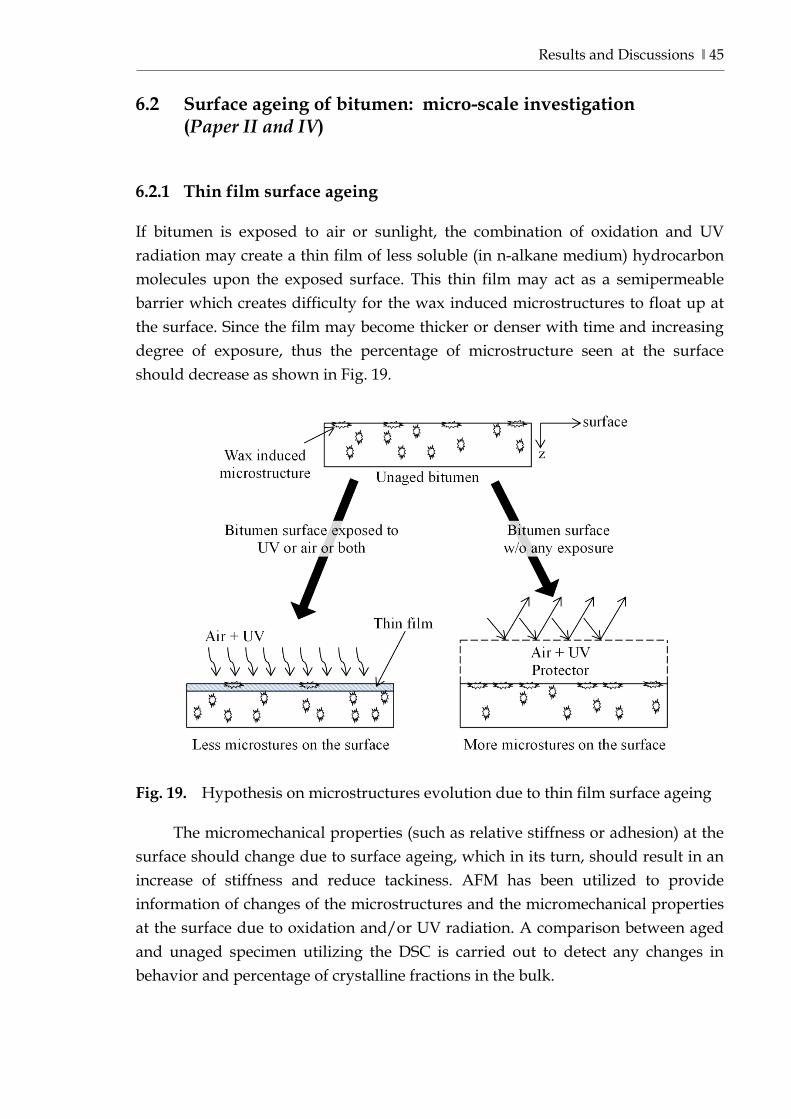
Results and Discussions ‖ 45
6.2 Surface ageing of bitumen: micro-scale investigation (Paper II and IV)
6.2.1 Thin film surface ageing If bitumen is exposed to air or sunlight, the combination of oxidation and UV radiation may create a thin film of less soluble (in n-alkane medium) hydrocarbon molecules upon the exposed surface. This thin film may act as a semipermeable barrier which creates difficulty for the wax induced microstructures to float up at the surface. Since the film may become thicker or denser with time and increasing degree of exposure, thus the percentage of microstructure seen at the surface should decrease as shown in Fig. 19.
Fig. 19. Hypothesis on microstructures evolution due to thin film surface ageing
The micromechanical properties (such as relative stiffness or adhesion) at the surface should change due to surface ageing, which in its turn, should result in an increase of stiffness and reduce tackiness. AFM has been utilized to provide information of changes of the microstructures and the micromechanical properties at the surface due to oxidation and/or UV radiation. A comparison between aged and unaged specimen utilizing the DSC is carried out to detect any changes in behavior and percentage of crystalline fractions in the bulk.
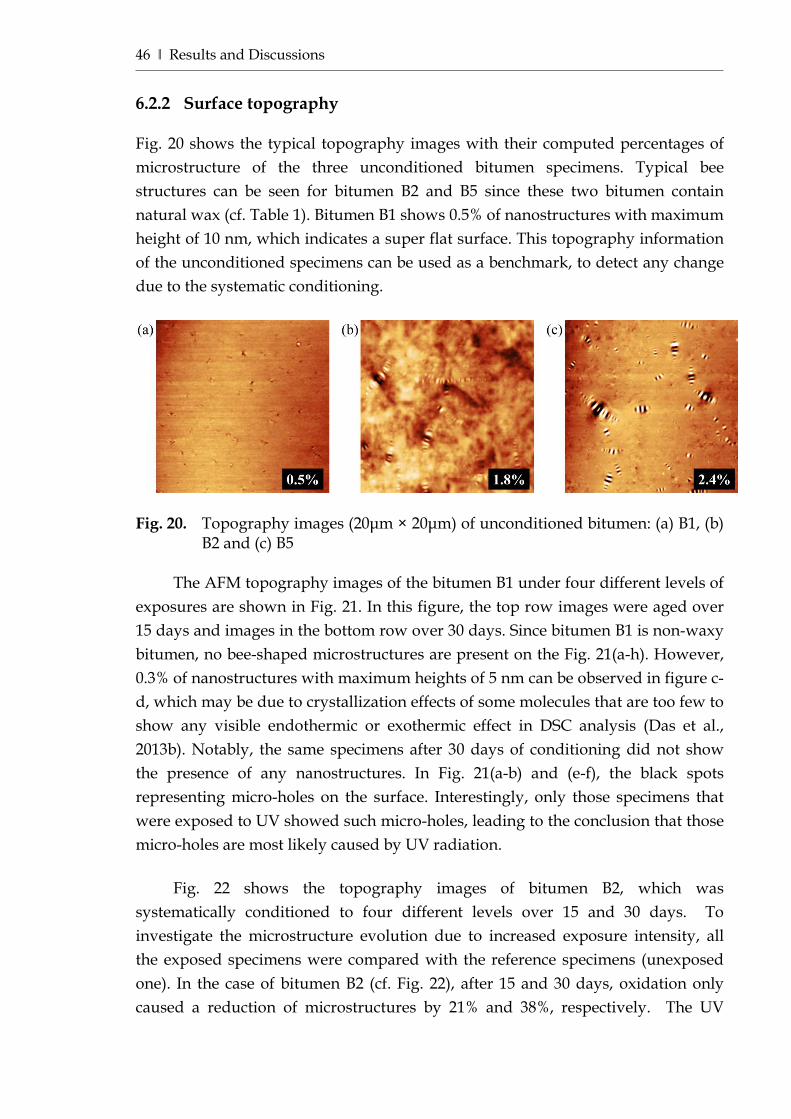
46 ‖ Results and Discussions
6.2.2 Surface topography Fig. 20 shows the typical topography images with their computed percentages of microstructure of the three unconditioned bitumen specimens. Typical bee structures can be seen for bitumen B2 and B5 since these two bitumen contain natural wax (cf. Table 1). Bitumen B1 shows 0.5% of nanostructures with maximum height of 10 nm, which indicates a super flat surface. This topography information of the unconditioned specimens can be used as a benchmark, to detect any change due to the systematic conditioning.
Fig. 20. Topography images (20μm × 20μm) of unconditioned bitumen: (a) B1, (b)
B2 and (c) B5
The AFM topography images of the bitumen B1 under four different levels of exposures are shown in Fig. 21. In this figure, the top row images were aged over 15 days and images in the bottom row over 30 days. Since bitumen B1 is non-waxy bitumen, no bee-shaped microstructures are present on the Fig. 21(a-h). However, 0.3% of nanostructures with maximum heights of 5 nm can be observed in figure c-d, which may be due to crystallization effects of some molecules that are too few to show any visible endothermic or exothermic effect in DSC analysis (Das et al., 2013b). Notably, the same specimens after 30 days of conditioning did not show the presence of any nanostructures. In Fig. 21(a-b) and (e-f), the black spots representing micro-holes on the surface. Interestingly, only those specimens that were exposed to UV showed such micro-holes, leading to the conclusion that those micro-holes are most likely caused by UV radiation.
Fig. 22 shows the topography images of bitumen B2, which was systematically conditioned to four different levels over 15 and 30 days. To investigate the microstructure evolution due to increased exposure intensity, all the exposed specimens were compared with the reference specimens (unexposed one). In the case of bitumen B2 (cf. Fig. 22), after 15 and 30 days, oxidation only caused a reduction of microstructures by 21% and 38%, respectively. The UV
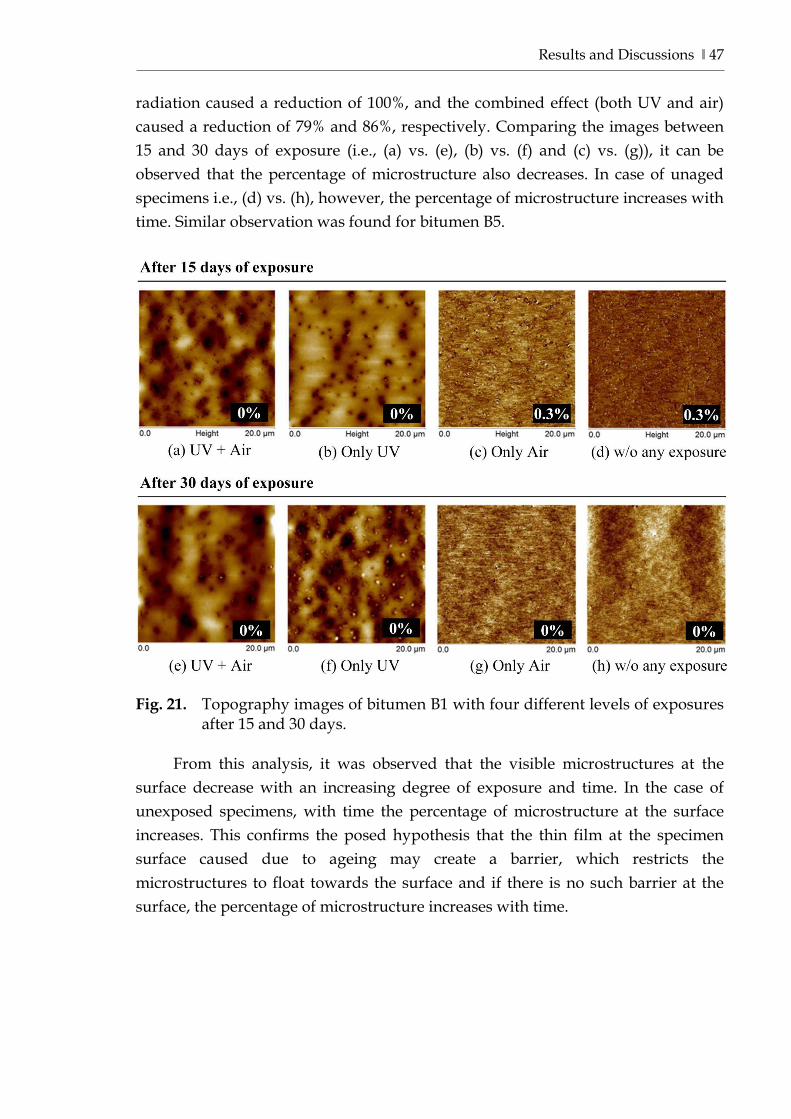
Results and Discussions ‖ 47
radiation caused a reduction of 100%, and the combined effect (both UV and air) caused a reduction of 79% and 86%, respectively. Comparing the images between 15 and 30 days of exposure (i.e., (a) vs. (e), (b) vs. (f) and (c) vs. (g)), it can be observed that the percentage of microstructure also decreases. In case of unaged specimens i.e., (d) vs. (h), however, the percentage of microstructure increases with time. Similar observation was found for bitumen B5.
Fig. 21. Topography images of bitumen B1 with four different levels of exposures
after 15 and 30 days.
From this analysis, it was observed that the visible microstructures at the surface decrease with an increasing degree of exposure and time. In the case of unexposed specimens, with time the percentage of microstructure at the surface increases. This confirms the posed hypothesis that the thin film at the specimen surface caused due to ageing may create a barrier, which restricts the microstructures to float towards the surface and if there is no such barrier at the surface, the percentage of microstructure increases with time.
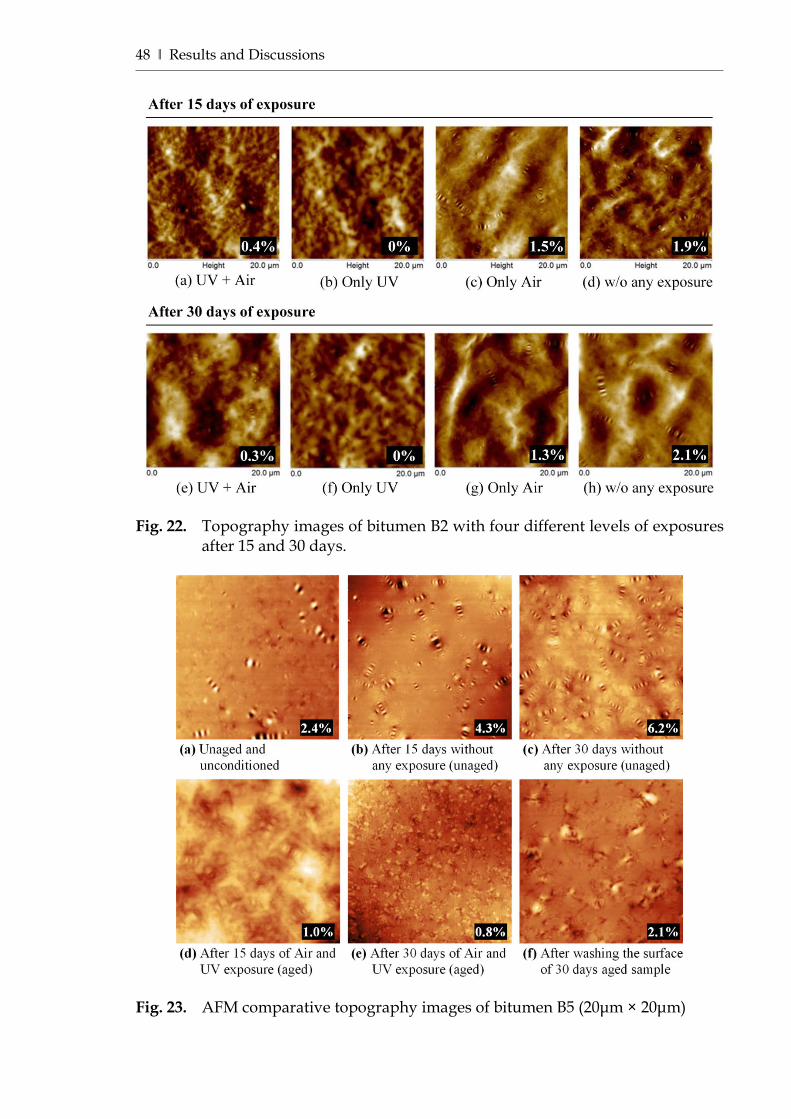
48 ‖ Results and Discussions
Fig. 22. Topography images of bitumen B2 with four different levels of exposures
after 15 and 30 days.
Fig. 23. AFM comparative topography images of bitumen B5 (20μm × 20μm)
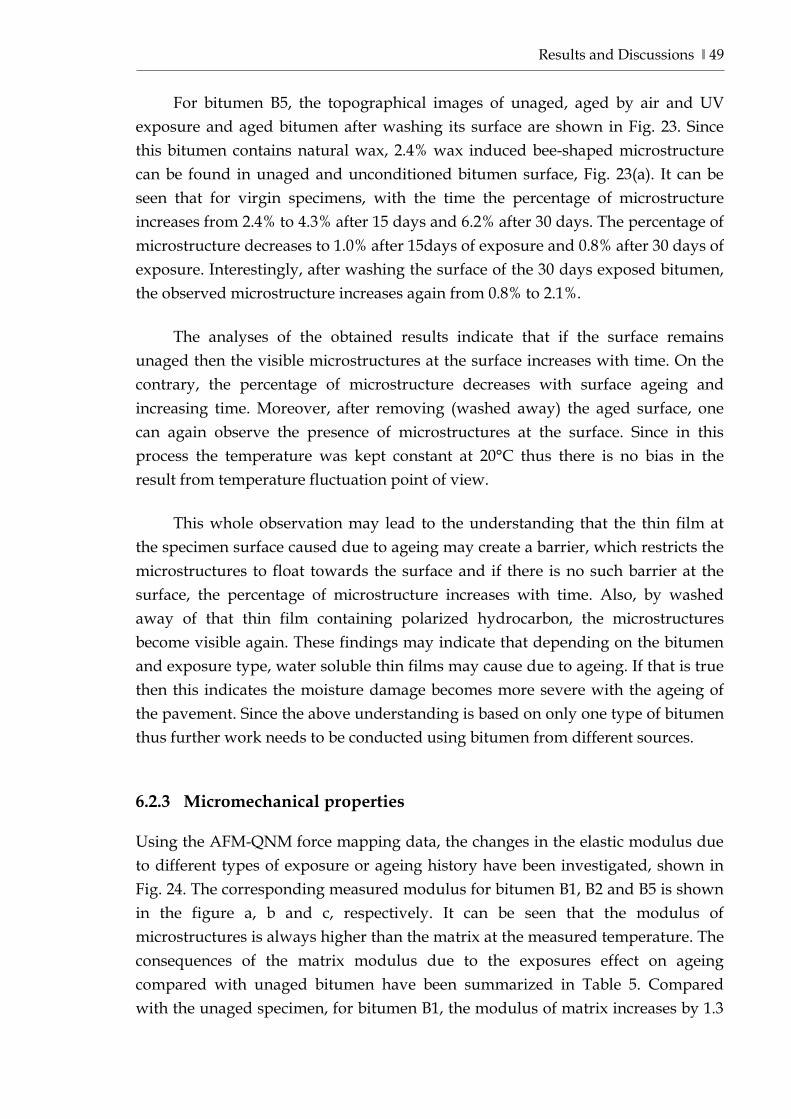
Results and Discussions ‖ 49
For bitumen B5, the topographical images of unaged, aged by air and UV exposure and aged bitumen after washing its surface are shown in Fig. 23. Since this bitumen contains natural wax, 2.4% wax induced bee-shaped microstructure can be found in unaged and unconditioned bitumen surface, Fig. 23(a). It can be seen that for virgin specimens, with the time the percentage of microstructure increases from 2.4% to 4.3% after 15 days and 6.2% after 30 days. The percentage of microstructure decreases to 1.0% after 15days of exposure and 0.8% after 30 days of exposure. Interestingly, after washing the surface of the 30 days exposed bitumen, the observed microstructure increases again from 0.8% to 2.1%.
The analyses of the obtained results indicate that if the surface remains unaged then the visible microstructures at the surface increases with time. On the contrary, the percentage of microstructure decreases with surface ageing and increasing time. Moreover, after removing (washed away) the aged surface, one can again observe the presence of microstructures at the surface. Since in this process the temperature was kept constant at 20°C thus there is no bias in the result from temperature fluctuation point of view.
This whole observation may lead to the understanding that the thin film at the specimen surface caused due to ageing may create a barrier, which restricts the microstructures to float towards the surface and if there is no such barrier at the surface, the percentage of microstructure increases with time. Also, by washed away of that thin film containing polarized hydrocarbon, the microstructures become visible again. These findings may indicate that depending on the bitumen and exposure type, water soluble thin films may cause due to ageing. If that is true then this indicates the moisture damage becomes more severe with the ageing of the pavement. Since the above understanding is based on only one type of bitumen thus further work needs to be conducted using bitumen from different sources. 6.2.3 Micromechanical properties Using the AFM-QNM force mapping data, the changes in the elastic modulus due to different types of exposure or ageing history have been investigated, shown in Fig. 24. The corresponding measured modulus for bitumen B1, B2 and B5 is shown in the figure a, b and c, respectively. It can be seen that the modulus of microstructures is always higher than the matrix at the measured temperature. The consequences of the matrix modulus due to the exposures effect on ageing compared with unaged bitumen have been summarized in Table 5. Compared with the unaged specimen, for bitumen B1, the modulus of matrix increases by 1.3
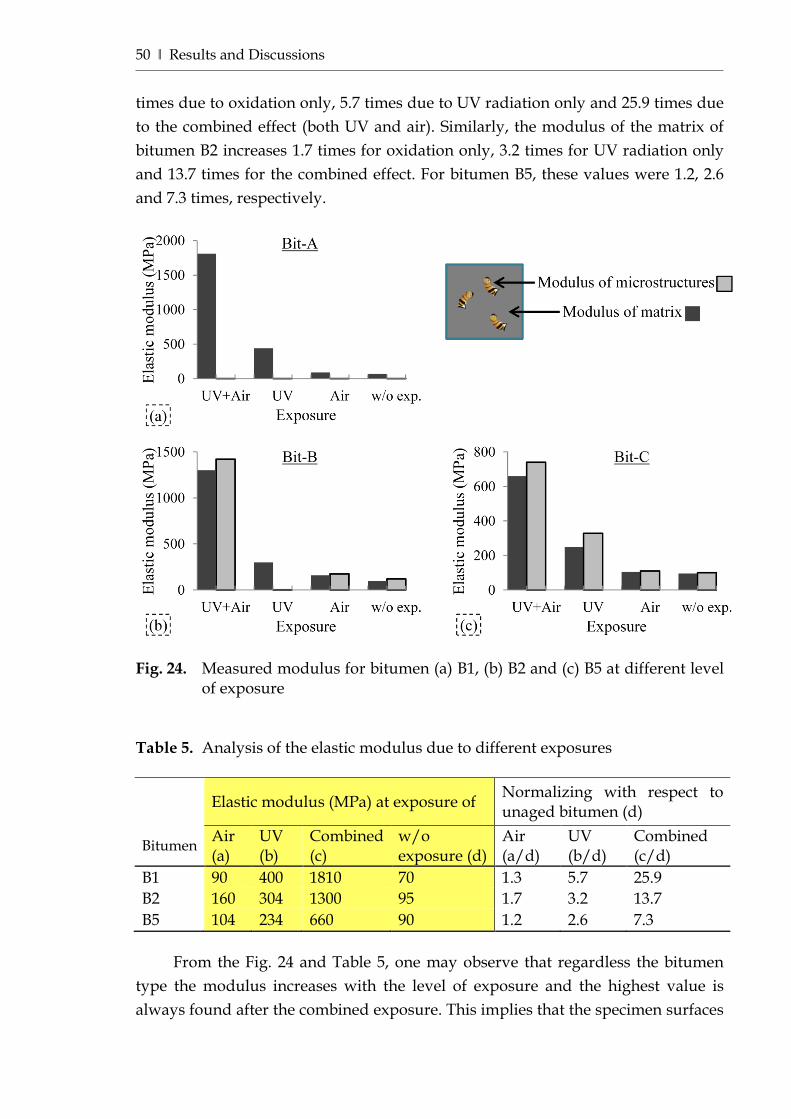
50 ‖ Results and Discussions
times due to oxidation only, 5.7 times due to UV radiation only and 25.9 times due to the combined effect (both UV and air). Similarly, the modulus of the matrix of bitumen B2 increases 1.7 times for oxidation only, 3.2 times for UV radiation only and 13.7 times for the combined effect. For bitumen B5, these values were 1.2, 2.6 and 7.3 times, respectively.
Fig. 24. Measured modulus for bitumen (a) B1, (b) B2 and (c) B5 at different level
of exposure Table 5. Analysis of the elastic modulus due to different exposures
Elastic modulus (MPa) at exposure of Normalizing with respect to unaged bitumen (d)
Bitumen Air (a)
UV (b)
Combined (c)
w/o exposure (d)
Air (a/d)
UV (b/d)
Combined (c/d)
B1 90 400 1810 70 1.3 5.7 25.9 B2 160 304 1300 95 1.7 3.2 13.7 B5 104 234 660 90 1.2 2.6 7.3
From the Fig. 24 and Table 5, one may observe that regardless the bitumen
type the modulus increases with the level of exposure and the highest value is always found after the combined exposure. This implies that the specimen surfaces
Results and Discussions ‖ 51
get stiffer with ageing, which is fully expected behavior. More interestingly though, it should be noted that the specimens exposed to air always showed a lower modulus increase than the UV exposed one, which indicates that UV radiation hardens the bitumen surface more than oxidation. This is a very important observation, especially given that currently used standardized laboratory ageing tests ignore the effect of UV radiation entirely. Another interesting observation is to note that the combined effect is not simply a summation or multiplication of the individual effects.
Fig. 25. Measured adhesive force for bitumen (a) B1, (b) B2 and (c) B5 at different
level of exposure Table 6. Analysis of the adhesive force due to different exposures
Adhesive force (nN) at exposure of Normalizing with respect to unaged bitumen (d)
Bitumen Air (a)
UV (b)
Combined (c)
w/o exposure (d)
Air (a/d)
UV (b/d)
Combined (c/d)
B1 13.50 5.60 8.70 15.10 0.89 0.37 0.58 B2 13.00 4.50 6.70 15.50 0.84 0.29 0.43 B5 12.70 7.00 3.10 16.30 0.78 0.43 0.19
52 ‖ Results and Discussions
For the three types of bitumen, the evolution of adhesive force or tackiness due to different types of exposure or ageing history are also investigated as depicted in Fig. 25. The corresponding measured adhesive force for bitumen B1, B2 and B5 is shown in the figure a, b and c, respectively. The consequences of the matrix modulus due to the exposures effect on ageing compared with unaged bitumen have been summarized in Table 6. It can be observed for bitumen B1, oxidation only reduces the adhesive force of the matrix by 11%, UV radiation only caused a reduction of 63%, and the combined effect caused a reduction of 42%. For bitumen B2, oxidation only reduces the adhesive force of the matrix by 16%, 71% due to UV radiation only, and 57% due to the combined effect. In case of bitumen B5, these values were 22%, 57% and 81%, respectively. This analysis shows that, with the ageing, the adhesion of the bitumen specimens reduced. This finding supports the traditional ageing concept that the tackiness reduces with ageing of bitumen which may cause adhesive failure of the bond between bitumen and aggregates. In agreement with the previous result (cf. Fig. 24), irrespective to bitumen type, the adhesive force of the microstructures is found to be lower than the matrix. Again, one may observe that the combined effect on adhesive force is not simply a summation or multiplication of the individual effects, as found in case of elastic modulus.
Based on the obtained data (cf. Table 5 and Table 6), in the following a discussion is given on how the total ageing effect could be based on the individual effects. Assuming that the unaged bitumen generic property E0 is affected by a total ageing factor ( , , , )f UV air T tχ = , which is a function of the individual ageing processes as described in this paper, temperature and exposure time. It should be possible to define a unique function for χ based on its materials properties, for example:
0E Eχ χ= (12) where, Eχ is the generic property of aged bitumen and ( , , , )air UVf T tα βχ χ χ= .
Assuming, for purpose of demonstration, a simplified function as:
air UVα βχ χ χ= + (13)
in which α and β should be dependent on the material properties, time and temperature; and should be highly related to the fundamental mechanism which controls the ageing process. Based on a regression analyses, a best fit could be found for the tested bitumen. Nevertheless given the fact that this would not relate
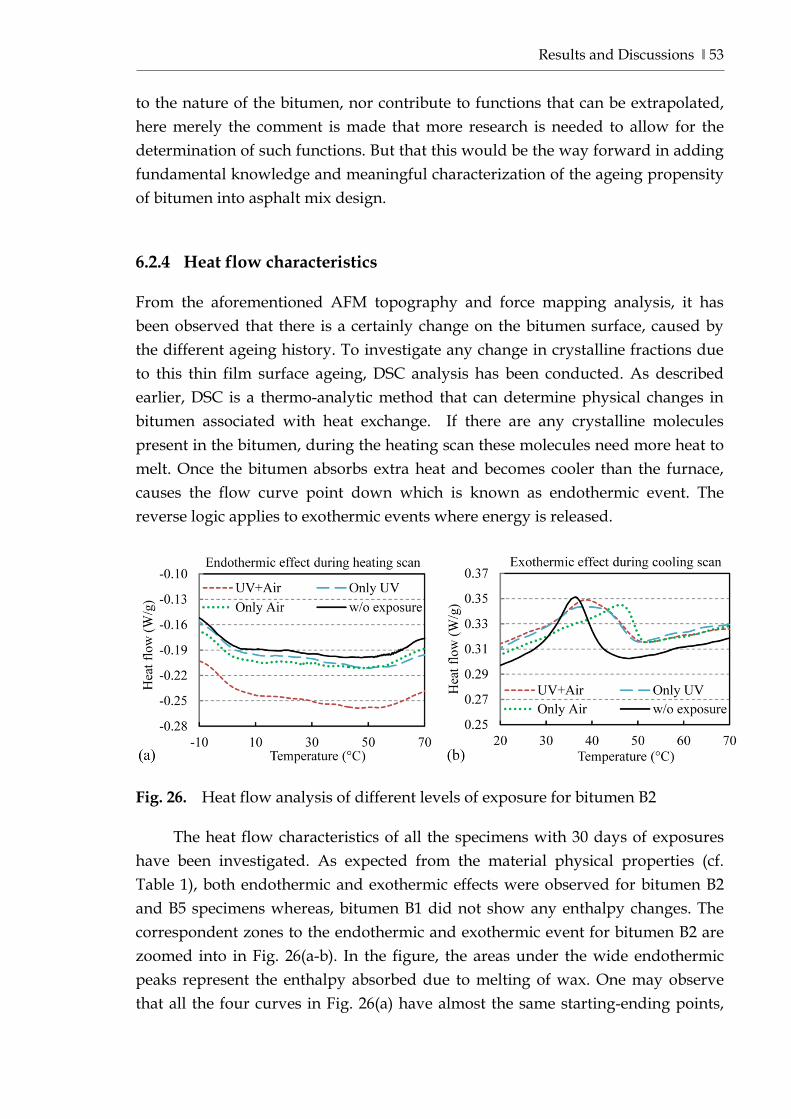
Results and Discussions ‖ 53
to the nature of the bitumen, nor contribute to functions that can be extrapolated, here merely the comment is made that more research is needed to allow for the determination of such functions. But that this would be the way forward in adding fundamental knowledge and meaningful characterization of the ageing propensity of bitumen into asphalt mix design. 6.2.4 Heat flow characteristics From the aforementioned AFM topography and force mapping analysis, it has been observed that there is a certainly change on the bitumen surface, caused by the different ageing history. To investigate any change in crystalline fractions due to this thin film surface ageing, DSC analysis has been conducted. As described earlier, DSC is a thermo-analytic method that can determine physical changes in bitumen associated with heat exchange. If there are any crystalline molecules present in the bitumen, during the heating scan these molecules need more heat to melt. Once the bitumen absorbs extra heat and becomes cooler than the furnace, causes the flow curve point down which is known as endothermic event. The reverse logic applies to exothermic events where energy is released.
Fig. 26. Heat flow analysis of different levels of exposure for bitumen B2
The heat flow characteristics of all the specimens with 30 days of exposures have been investigated. As expected from the material physical properties (cf. Table 1), both endothermic and exothermic effects were observed for bitumen B2 and B5 specimens whereas, bitumen B1 did not show any enthalpy changes. The correspondent zones to the endothermic and exothermic event for bitumen B2 are zoomed into in Fig. 26(a-b). In the figure, the areas under the wide endothermic peaks represent the enthalpy absorbed due to melting of wax. One may observe that all the four curves in Fig. 26(a) have almost the same starting-ending points,
54 ‖ Results and Discussions
and can be superimposed into one curve. This indicates that there is no change in enthalpy due to the different exposures, which means the percentage of wax in the bitumen remained constant after 30 days of exposure.
Since the percentage of wax remains constant, then the total area under the exothermic peaks in Fig. 26(b) should also have a constant value. It can be observed, however, that during the cooling the shape and the starting-ending point of the exothermic peak somehow differ from each other. The starting point of exothermic event represents the starting of crystallization process. It can be observed that the crystallization starts earlier for aged (i.e., only UV, only air and both exposed) specimens than the unaged one. In the crystallization process, any presence of impurities may act as a promoter which may accelerate the process. The less soluble hydrocarbons produced from the chemical reaction due to the exposures, may introduced such impurities in the bitumen matrix so that the crystallization process starts earlier than the without exposed one. Identical phenomenon was also observed in case of bitumen B5 specimens. Since bitumen B1 specimens did not show any exothermic and endothermic effect, no such phenomenon can be observed. 6.2.5 Microstructure evolution due to ageing From the aforementioned results and discussions it should be noted that with ageing the percentage of bee-shaped microstructures reduce on the surface, yet the total amount of wax in the specimens remains constant. From previous AFM studies (Huang and Pauli, 2008; Wu et al., 2009; Zhang et al., 2012) on PAV aged bitumen, however, an increase of bee-shaped microstructure compared with unaged bitumen was reported. This has lead some researchers to conclude that ageing increases the amount of bees in bitumen, which was in line with the earlier belief that the crystalline fraction increases as bitumen ages.
The hydrocarbons in bitumen react with atmospheric oxygen, where the reaction type and rate depends on the surrounding temperature and pressure. Thus, the type of chemical reactions may vary with the change of pressure and temperature. In the accelerated ageing simulations, especially the PAV test, bitumen gets exposed to extremely high pressure and elevated temperatures for a short time. There is the possibility that the product after the accelerated aging test may differ significantly from the slow but long ageing process with different temperature and pressure history (field ageing). Thus, ‘ageing’ from a PAV test is indeed a completely different process from ageing in the field.
Results and Discussions ‖ 55
6.2.6 Summary of findings The mechanism of bitumen surface ageing has been investigated and validated utilizing the atomic force microscopy (AFM) and the differential scanning calorimetry (DSC). To validate the surface ageing, three different types of bitumen with different natural wax content were conditioned in four different modes: both UV and air, only UV, only air and without any exposure, for 15 and 30 days. From the AFM investigation after 15 and 30 days of conditioning period, it was found that regardless the bitumen type, the percentage of microstructure on the surface reduced with the degree of exposure and time. Furthermore, the microstructural investigation showed strong indications that, depending on the bitumen and its conditioning, water soluble thin films are formed due to ageing. This means that ageing and moisture damage are strongly interlinked and this should thus be considered in the design of the materials and the prediction of its long term performance.
Comparing all the four different exposures, it was observed that UV radiation
caused more surface ageing than the oxidation. It was also found that the combined effect was not simply a summation or multiplication of the individual effects. The DSC investigation showed that the amount of crystalline fractions in bitumen remain constant even after the systematic conditioning. Interestingly, during the cooling cycle, crystallization of wax molecules started earlier for the exposed specimens than the without exposed one. The analyses of the obtained results indicated that the ageing created a thin film upon the exposed surface, which acts as a barrier and creates difficulty for the wax induced microstructures to float up at the surface. From the DSC analyses, it can be concluded that the ageing product induced impurities in the bitumen matrix, which acts as a promoter in the crystallization process.
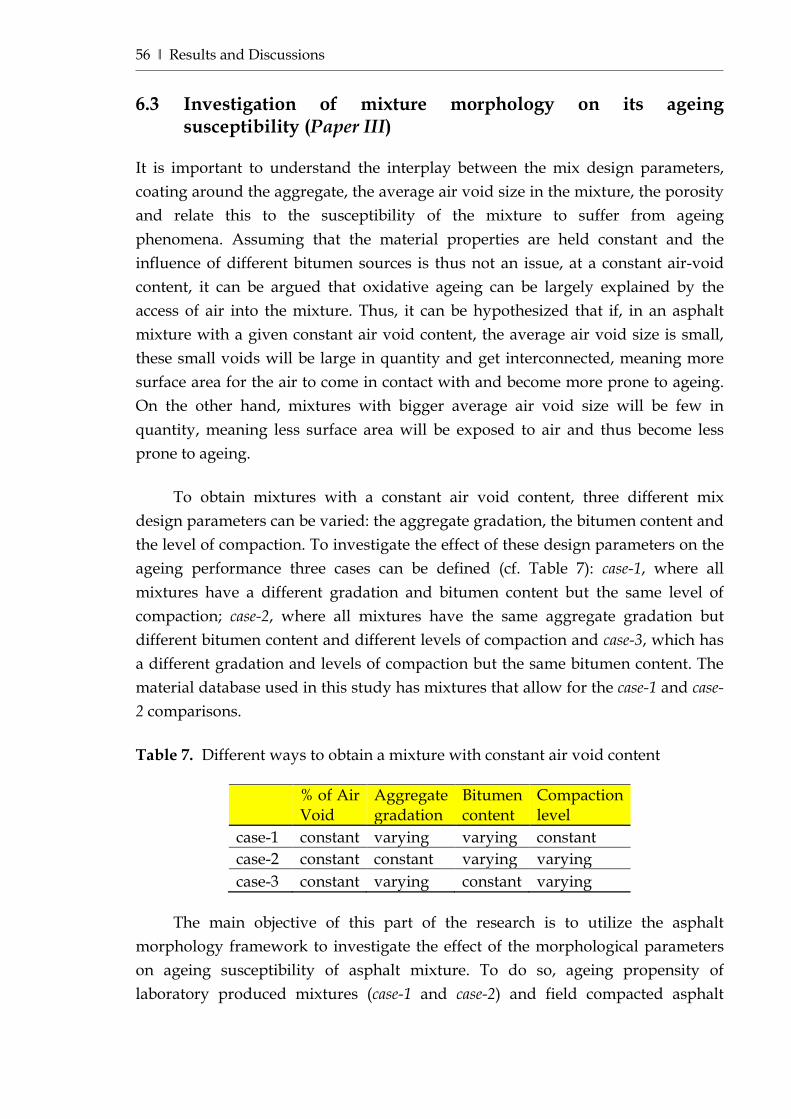
56 ‖ Results and Discussions
6.3 Investigation of mixture morphology on its ageing susceptibility (Paper III)
It is important to understand the interplay between the mix design parameters, coating around the aggregate, the average air void size in the mixture, the porosity and relate this to the susceptibility of the mixture to suffer from ageing phenomena. Assuming that the material properties are held constant and the influence of different bitumen sources is thus not an issue, at a constant air-void content, it can be argued that oxidative ageing can be largely explained by the access of air into the mixture. Thus, it can be hypothesized that if, in an asphalt mixture with a given constant air void content, the average air void size is small, these small voids will be large in quantity and get interconnected, meaning more surface area for the air to come in contact with and become more prone to ageing. On the other hand, mixtures with bigger average air void size will be few in quantity, meaning less surface area will be exposed to air and thus become less prone to ageing.
To obtain mixtures with a constant air void content, three different mix design parameters can be varied: the aggregate gradation, the bitumen content and the level of compaction. To investigate the effect of these design parameters on the ageing performance three cases can be defined (cf. Table 7): case-1, where all mixtures have a different gradation and bitumen content but the same level of compaction; case-2, where all mixtures have the same aggregate gradation but different bitumen content and different levels of compaction and case-3, which has a different gradation and levels of compaction but the same bitumen content. The material database used in this study has mixtures that allow for the case-1 and case-2 comparisons. Table 7. Different ways to obtain a mixture with constant air void content
% of Air Void
Aggregate gradation
Bitumen content
Compaction level
case-1 constant varying varying constant case-2 constant constant varying varying case-3 constant varying constant varying
The main objective of this part of the research is to utilize the asphalt
morphology framework to investigate the effect of the morphological parameters on ageing susceptibility of asphalt mixture. To do so, ageing propensity of laboratory produced mixtures (case-1 and case-2) and field compacted asphalt
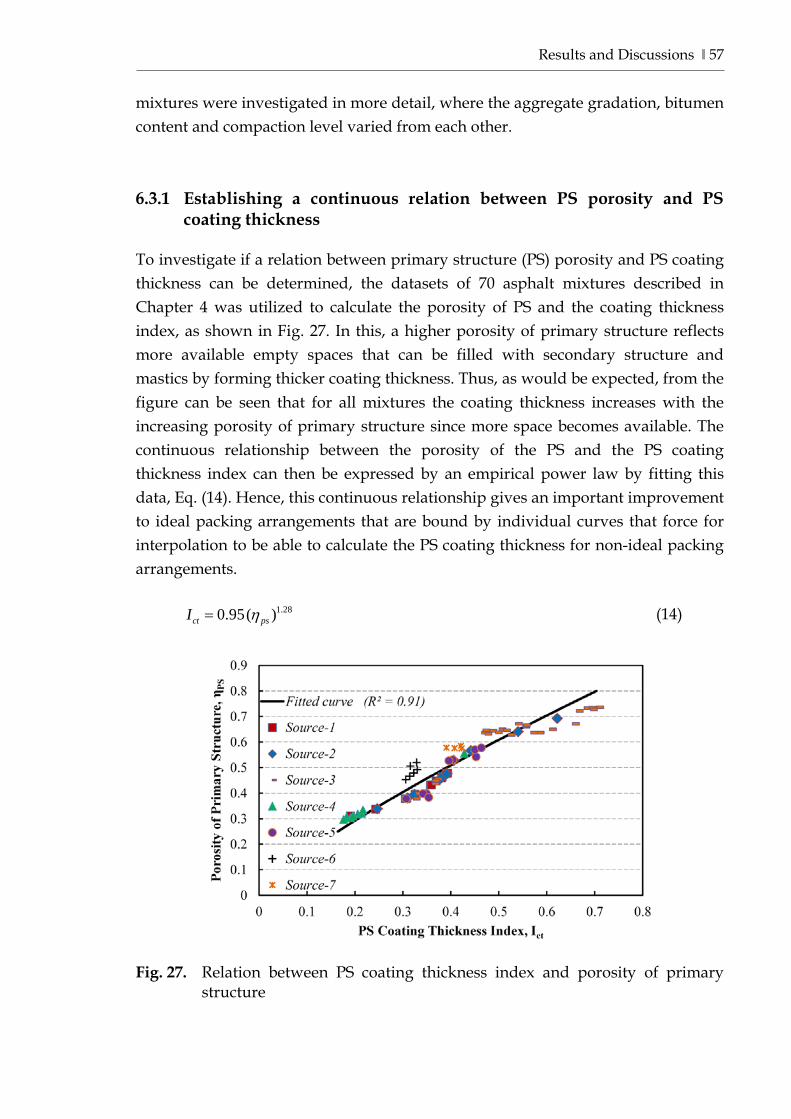
Results and Discussions ‖ 57
mixtures were investigated in more detail, where the aggregate gradation, bitumen content and compaction level varied from each other.
6.3.1 Establishing a continuous relation between PS porosity and PS coating thickness
To investigate if a relation between primary structure (PS) porosity and PS coating thickness can be determined, the datasets of 70 asphalt mixtures described in Chapter 4 was utilized to calculate the porosity of PS and the coating thickness index, as shown in Fig. 27. In this, a higher porosity of primary structure reflects more available empty spaces that can be filled with secondary structure and mastics by forming thicker coating thickness. Thus, as would be expected, from the figure can be seen that for all mixtures the coating thickness increases with the increasing porosity of primary structure since more space becomes available. The continuous relationship between the porosity of the PS and the PS coating thickness index can then be expressed by an empirical power law by fitting this data, Eq. (14). Hence, this continuous relationship gives an important improvement to ideal packing arrangements that are bound by individual curves that force for interpolation to be able to calculate the PS coating thickness for non-ideal packing arrangements.
1.280.95( )ct psI η= (14)
Fig. 27. Relation between PS coating thickness index and porosity of primary
structure
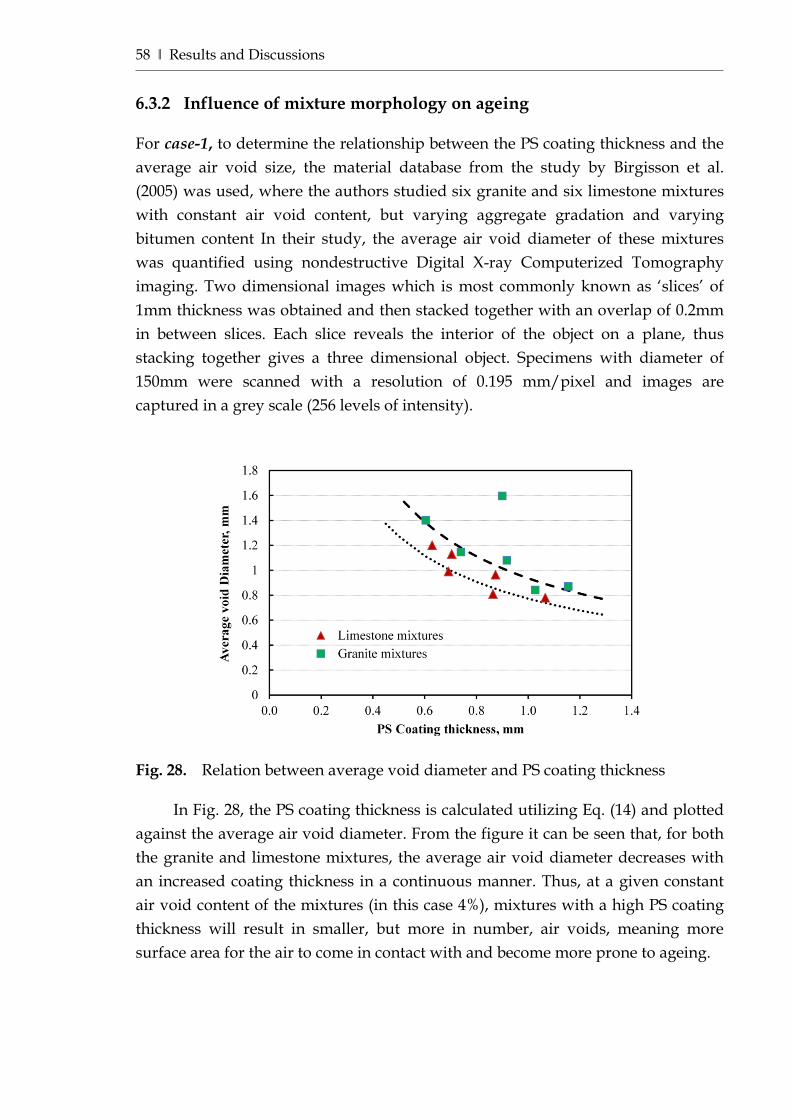
58 ‖ Results and Discussions
6.3.2 Influence of mixture morphology on ageing For case-1, to determine the relationship between the PS coating thickness and the average air void size, the material database from the study by Birgisson et al. (2005) was used, where the authors studied six granite and six limestone mixtures with constant air void content, but varying aggregate gradation and varying bitumen content In their study, the average air void diameter of these mixtures was quantified using nondestructive Digital X-ray Computerized Tomography imaging. Two dimensional images which is most commonly known as ‘slices’ of 1mm thickness was obtained and then stacked together with an overlap of 0.2mm in between slices. Each slice reveals the interior of the object on a plane, thus stacking together gives a three dimensional object. Specimens with diameter of 150mm were scanned with a resolution of 0.195 mm/pixel and images are captured in a grey scale (256 levels of intensity).
Fig. 28. Relation between average void diameter and PS coating thickness
In Fig. 28, the PS coating thickness is calculated utilizing Eq. (14) and plotted against the average air void diameter. From the figure it can be seen that, for both the granite and limestone mixtures, the average air void diameter decreases with an increased coating thickness in a continuous manner. Thus, at a given constant air void content of the mixtures (in this case 4%), mixtures with a high PS coating thickness will result in smaller, but more in number, air voids, meaning more surface area for the air to come in contact with and become more prone to ageing.

Results and Discussions ‖ 59
For the ageing susceptibility analysis of case-1, the five mixtures from Source-2 were utilized and denoted as C1 through C5, and where all mixtures had a different gradation and bitumen content but the same level of compaction. The mixtures were produced according to the Superpave mix design method with 7 (±0.5) % air voids (SHRP-A-407). All loose mixtures were first aged with short term oven ageing (STOA) for 2 hours at 135°C and half of the specimens produced were then subjected to long term oven ageing (LTOA) for 120 hours at 85°C, both followed the AASHTO PP2-94 procedure. Physically the STOA procedure is intended to resemble the ageing that happens when the mixture is heated initially, to create enough workability for compaction of the mixture in the field. The LTOA is then intended to represent the long-term ageing that would happen over time during the pavement’s service life. The Superpave indirect tension test (IDT) was then used to measure at 10°C the resilient modulus according to the ASTM D4123, static creep and tensile strength according to the AASHTO TP9 specification. After LTOA, viscosity was measures at 60°C on the recovered bitumen from the lab aged mixtures.
The PS coating thickness has been calculated utilizing Eq. (14). for the mixtures and plotted against the resilient modulus, creep rate after 100 seconds, fracture energy, creep compliance and bitumen viscosity after LTOA age hardening, Fig. 29. It can be seen that the effect of age hardening increases with an increasing PS coating thickness, where resilient modulus and bitumen viscosity increases whereas creep rate, creep compliance and fracture energy decreases due to stiffening effect. Though this result seems counterintuitive, using the hypothesis as stated earlier, it can be explained since with an increasing coating thickness (and a given air void content) air void sizes get smaller but more in quantity. As a result with the thicker coating thickness, the mixture get more expose to air and become more prone to oxidative ageing.
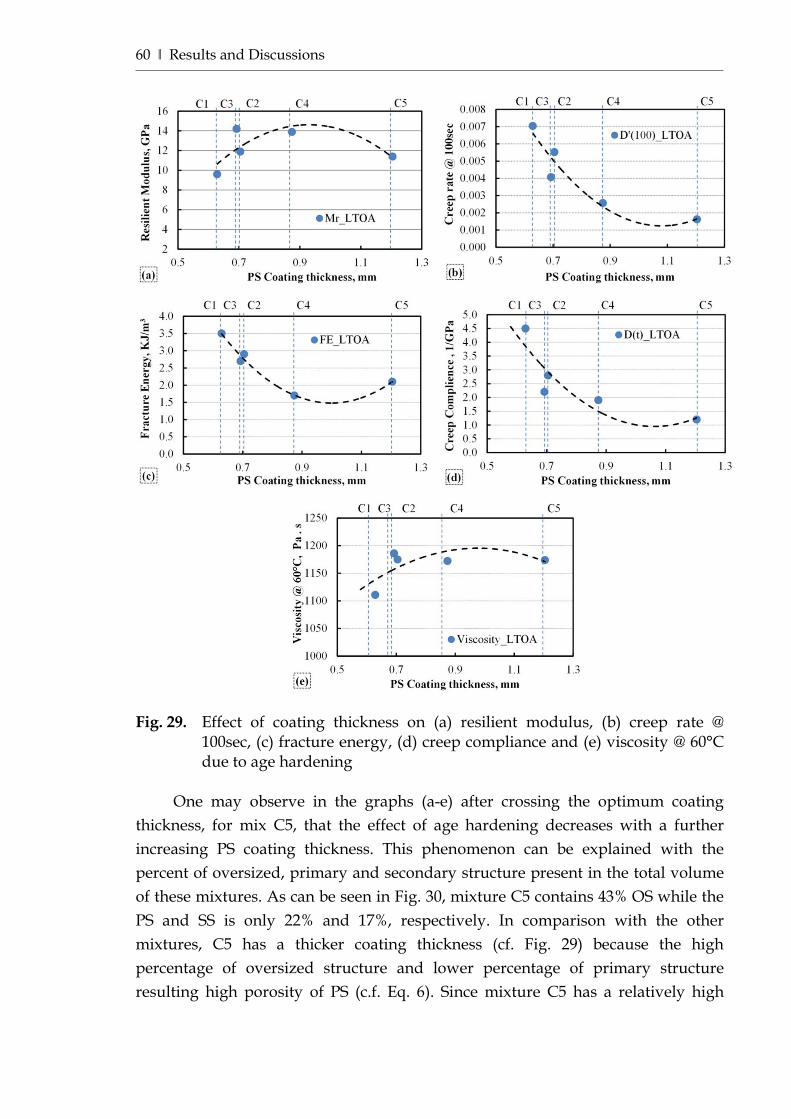
60 ‖ Results and Discussions
Fig. 29. Effect of coating thickness on (a) resilient modulus, (b) creep rate @
100sec, (c) fracture energy, (d) creep compliance and (e) viscosity @ 60°C due to age hardening
One may observe in the graphs (a-e) after crossing the optimum coating
thickness, for mix C5, that the effect of age hardening decreases with a further increasing PS coating thickness. This phenomenon can be explained with the percent of oversized, primary and secondary structure present in the total volume of these mixtures. As can be seen in Fig. 30, mixture C5 contains 43% OS while the PS and SS is only 22% and 17%, respectively. In comparison with the other mixtures, C5 has a thicker coating thickness (cf. Fig. 29) because the high percentage of oversized structure and lower percentage of primary structure resulting high porosity of PS (c.f. Eq. 6). Since mixture C5 has a relatively high
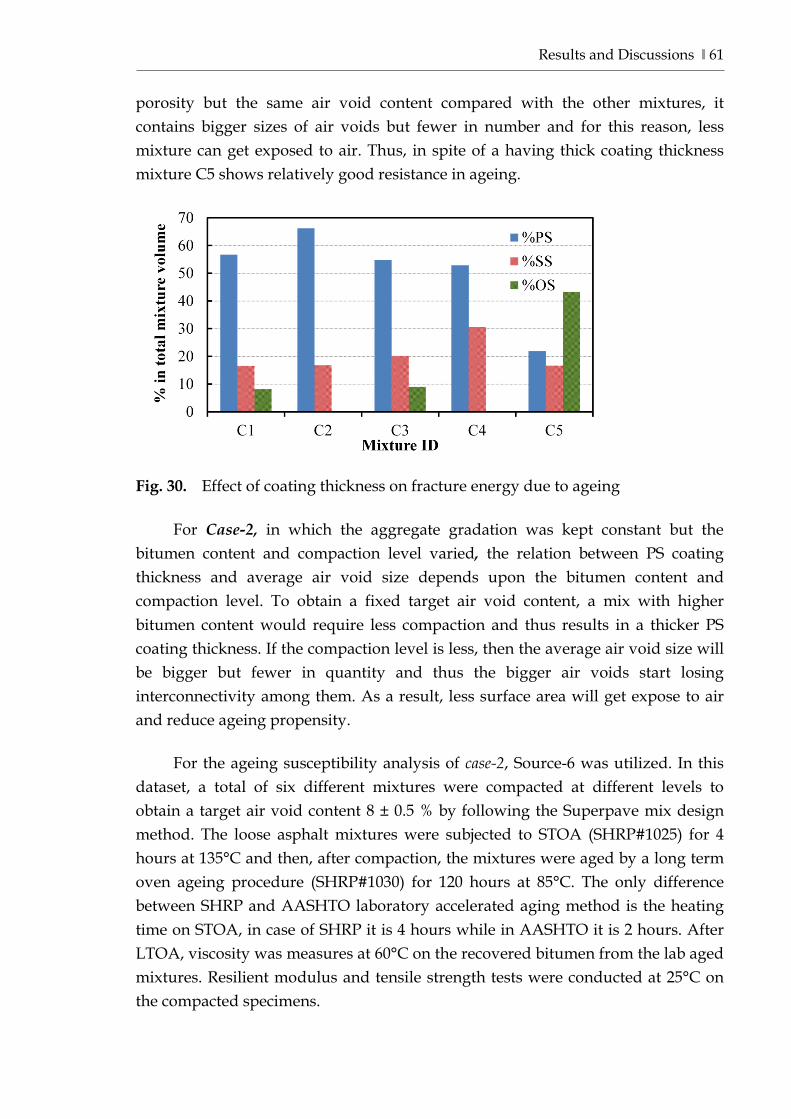
Results and Discussions ‖ 61
porosity but the same air void content compared with the other mixtures, it contains bigger sizes of air voids but fewer in number and for this reason, less mixture can get exposed to air. Thus, in spite of a having thick coating thickness mixture C5 shows relatively good resistance in ageing.
Fig. 30. Effect of coating thickness on fracture energy due to ageing
For Case-2, in which the aggregate gradation was kept constant but the
bitumen content and compaction level varied, the relation between PS coating thickness and average air void size depends upon the bitumen content and compaction level. To obtain a fixed target air void content, a mix with higher bitumen content would require less compaction and thus results in a thicker PS coating thickness. If the compaction level is less, then the average air void size will be bigger but fewer in quantity and thus the bigger air voids start losing interconnectivity among them. As a result, less surface area will get expose to air and reduce ageing propensity.
For the ageing susceptibility analysis of case-2, Source-6 was utilized. In this dataset, a total of six different mixtures were compacted at different levels to obtain a target air void content 8 ± 0.5 % by following the Superpave mix design method. The loose asphalt mixtures were subjected to STOA (SHRP#1025) for 4 hours at 135°C and then, after compaction, the mixtures were aged by a long term oven ageing procedure (SHRP#1030) for 120 hours at 85°C. The only difference between SHRP and AASHTO laboratory accelerated aging method is the heating time on STOA, in case of SHRP it is 4 hours while in AASHTO it is 2 hours. After LTOA, viscosity was measures at 60°C on the recovered bitumen from the lab aged mixtures. Resilient modulus and tensile strength tests were conducted at 25°C on the compacted specimens.
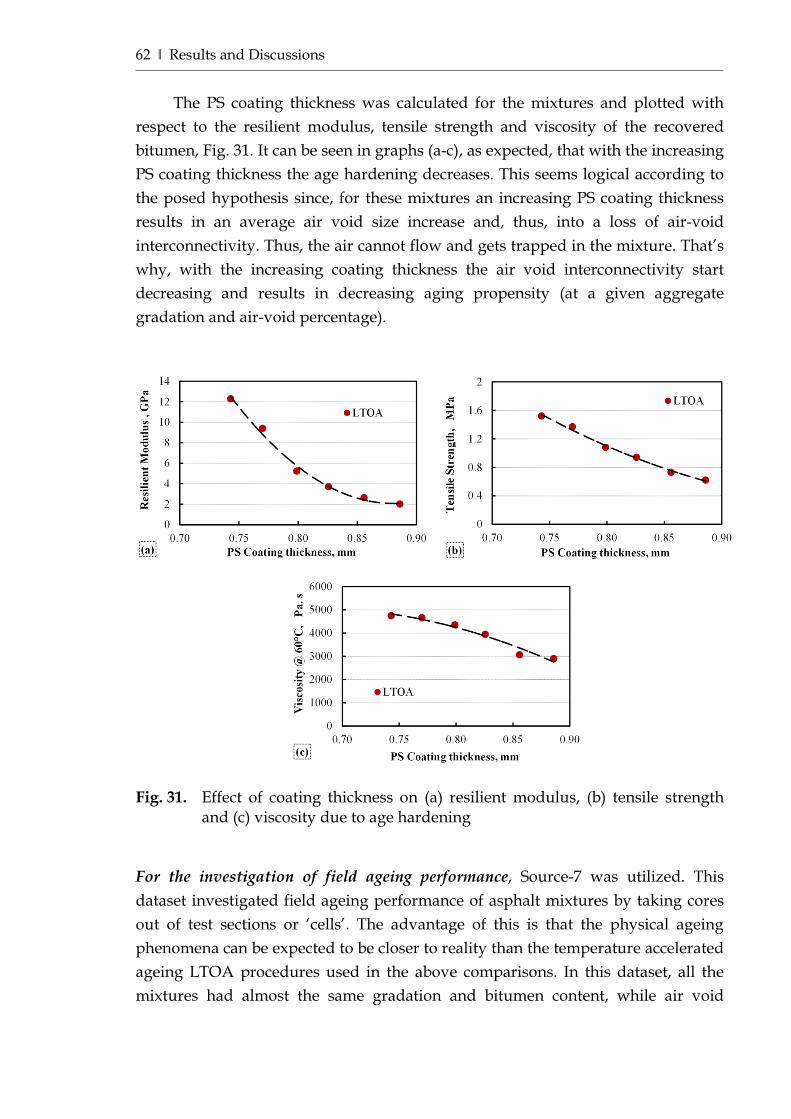
62 ‖ Results and Discussions
The PS coating thickness was calculated for the mixtures and plotted with respect to the resilient modulus, tensile strength and viscosity of the recovered bitumen, Fig. 31. It can be seen in graphs (a-c), as expected, that with the increasing PS coating thickness the age hardening decreases. This seems logical according to the posed hypothesis since, for these mixtures an increasing PS coating thickness results in an average air void size increase and, thus, into a loss of air-void interconnectivity. Thus, the air cannot flow and gets trapped in the mixture. That’s why, with the increasing coating thickness the air void interconnectivity start decreasing and results in decreasing aging propensity (at a given aggregate gradation and air-void percentage).
Fig. 31. Effect of coating thickness on (a) resilient modulus, (b) tensile strength
and (c) viscosity due to age hardening For the investigation of field ageing performance, Source-7 was utilized. This dataset investigated field ageing performance of asphalt mixtures by taking cores out of test sections or ‘cells’. The advantage of this is that the physical ageing phenomena can be expected to be closer to reality than the temperature accelerated ageing LTOA procedures used in the above comparisons. In this dataset, all the mixtures had almost the same gradation and bitumen content, while air void
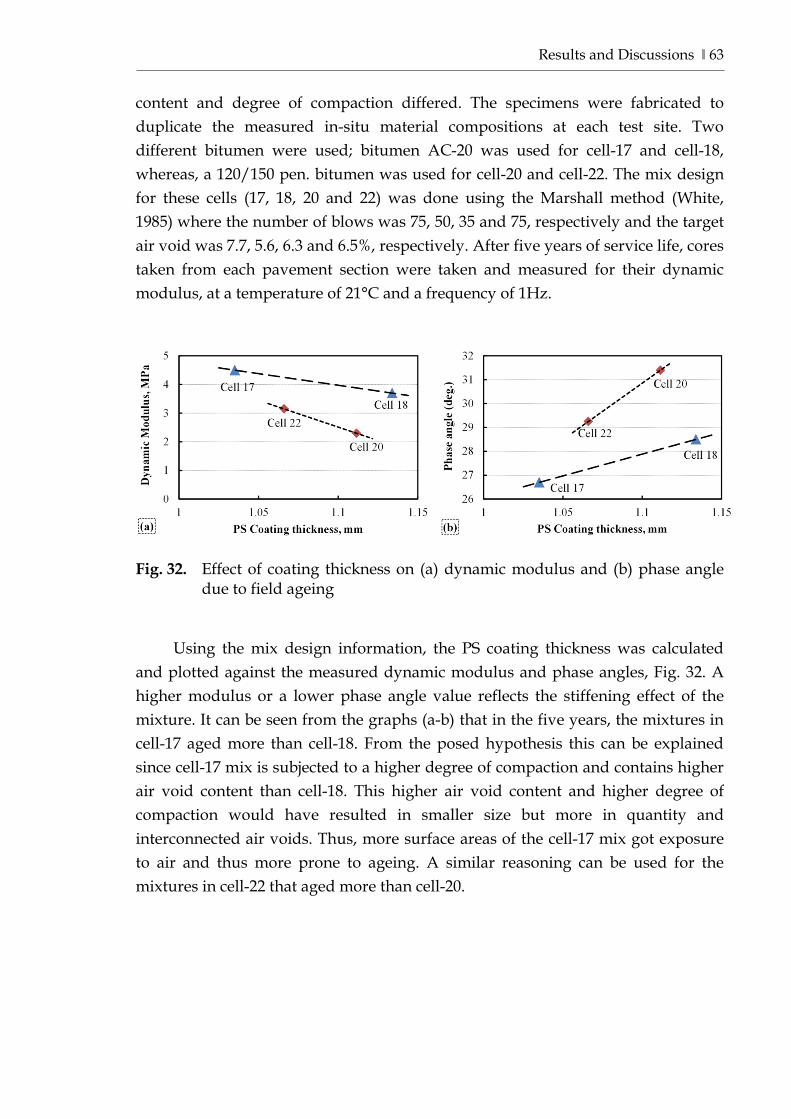
Results and Discussions ‖ 63
content and degree of compaction differed. The specimens were fabricated to duplicate the measured in-situ material compositions at each test site. Two different bitumen were used; bitumen AC-20 was used for cell-17 and cell-18, whereas, a 120/150 pen. bitumen was used for cell-20 and cell-22. The mix design for these cells (17, 18, 20 and 22) was done using the Marshall method (White, 1985) where the number of blows was 75, 50, 35 and 75, respectively and the target air void was 7.7, 5.6, 6.3 and 6.5%, respectively. After five years of service life, cores taken from each pavement section were taken and measured for their dynamic modulus, at a temperature of 21°C and a frequency of 1Hz.
Fig. 32. Effect of coating thickness on (a) dynamic modulus and (b) phase angle
due to field ageing
Using the mix design information, the PS coating thickness was calculated and plotted against the measured dynamic modulus and phase angles, Fig. 32. A higher modulus or a lower phase angle value reflects the stiffening effect of the mixture. It can be seen from the graphs (a-b) that in the five years, the mixtures in cell-17 aged more than cell-18. From the posed hypothesis this can be explained since cell-17 mix is subjected to a higher degree of compaction and contains higher air void content than cell-18. This higher air void content and higher degree of compaction would have resulted in smaller size but more in quantity and interconnected air voids. Thus, more surface areas of the cell-17 mix got exposure to air and thus more prone to ageing. A similar reasoning can be used for the mixtures in cell-22 that aged more than cell-20.
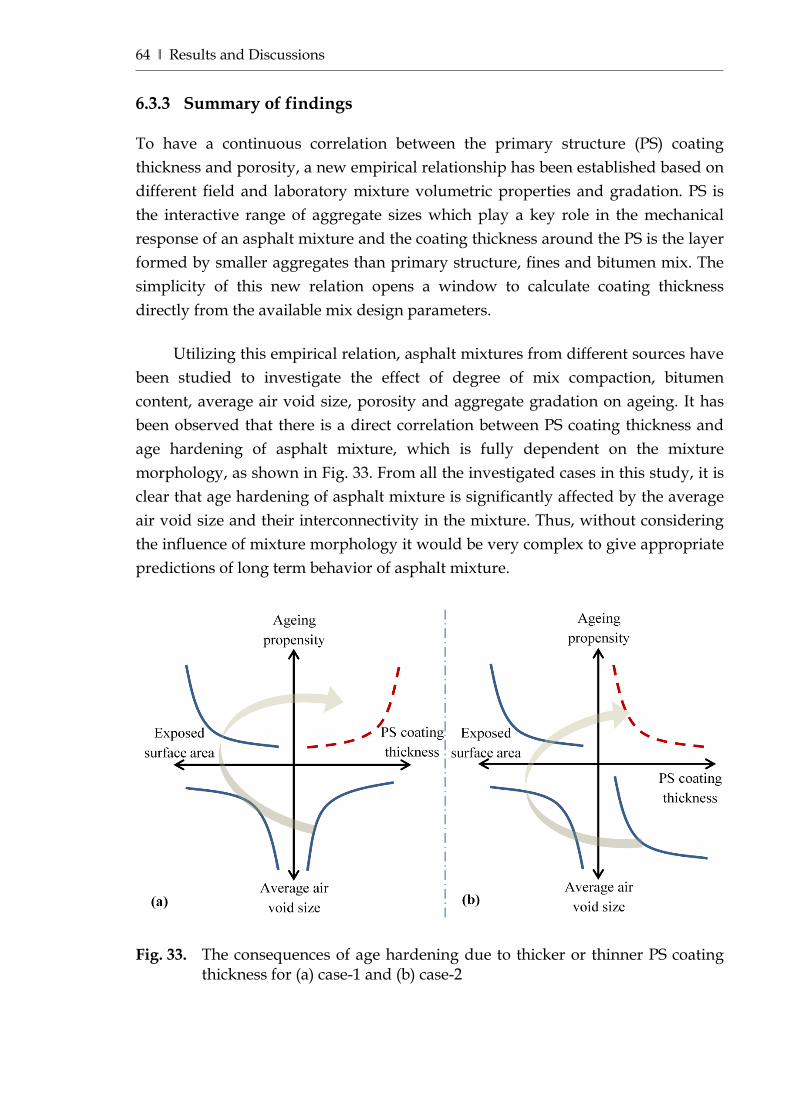
64 ‖ Results and Discussions
6.3.3 Summary of findings To have a continuous correlation between the primary structure (PS) coating thickness and porosity, a new empirical relationship has been established based on different field and laboratory mixture volumetric properties and gradation. PS is the interactive range of aggregate sizes which play a key role in the mechanical response of an asphalt mixture and the coating thickness around the PS is the layer formed by smaller aggregates than primary structure, fines and bitumen mix. The simplicity of this new relation opens a window to calculate coating thickness directly from the available mix design parameters.
Utilizing this empirical relation, asphalt mixtures from different sources have been studied to investigate the effect of degree of mix compaction, bitumen content, average air void size, porosity and aggregate gradation on ageing. It has been observed that there is a direct correlation between PS coating thickness and age hardening of asphalt mixture, which is fully dependent on the mixture morphology, as shown in Fig. 33. From all the investigated cases in this study, it is clear that age hardening of asphalt mixture is significantly affected by the average air void size and their interconnectivity in the mixture. Thus, without considering the influence of mixture morphology it would be very complex to give appropriate predictions of long term behavior of asphalt mixture.
Fig. 33. The consequences of age hardening due to thicker or thinner PS coating
thickness for (a) case-1 and (b) case-2
Results and Discussions ‖ 65
It is obvious that the source, types and rheological properties of the bitumen used in asphalt mixture plays a vital role in ageing performance. In this study, the evolution of bitumen itself due to ageing was not considered separately rather than the performance of the mixtures was investigated. Moreover, the asphalt morphology framework is based on spherical particles and does not take into account aggregate angularity and surface roughness yet. Despite these current limitations, by considering the combined effect of air void distribution, aggregate packing arrangement, bitumen content, PS coating thickness and degree of compaction, this framework has shown to be able to identify the effect of various morphological parameters on ageing performance of the mixture.
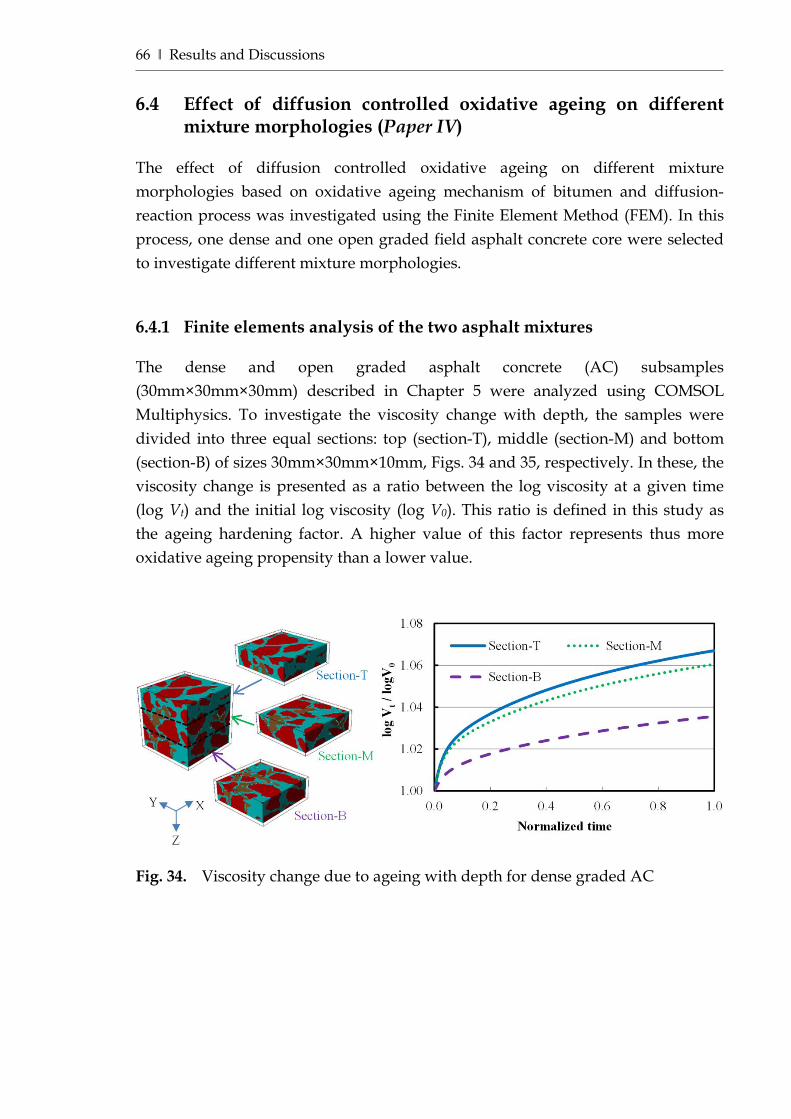
66 ‖ Results and Discussions
6.4 Effect of diffusion controlled oxidative ageing on different mixture morphologies (Paper IV)
The effect of diffusion controlled oxidative ageing on different mixture morphologies based on oxidative ageing mechanism of bitumen and diffusion-reaction process was investigated using the Finite Element Method (FEM). In this process, one dense and one open graded field asphalt concrete core were selected to investigate different mixture morphologies. 6.4.1 Finite elements analysis of the two asphalt mixtures The dense and open graded asphalt concrete (AC) subsamples (30mm×30mm×30mm) described in Chapter 5 were analyzed using COMSOL Multiphysics. To investigate the viscosity change with depth, the samples were divided into three equal sections: top (section-T), middle (section-M) and bottom (section-B) of sizes 30mm×30mm×10mm, Figs. 34 and 35, respectively. In these, the viscosity change is presented as a ratio between the log viscosity at a given time (log Vt) and the initial log viscosity (log V0). This ratio is defined in this study as the ageing hardening factor. A higher value of this factor represents thus more oxidative ageing propensity than a lower value.
Fig. 34. Viscosity change due to ageing with depth for dense graded AC
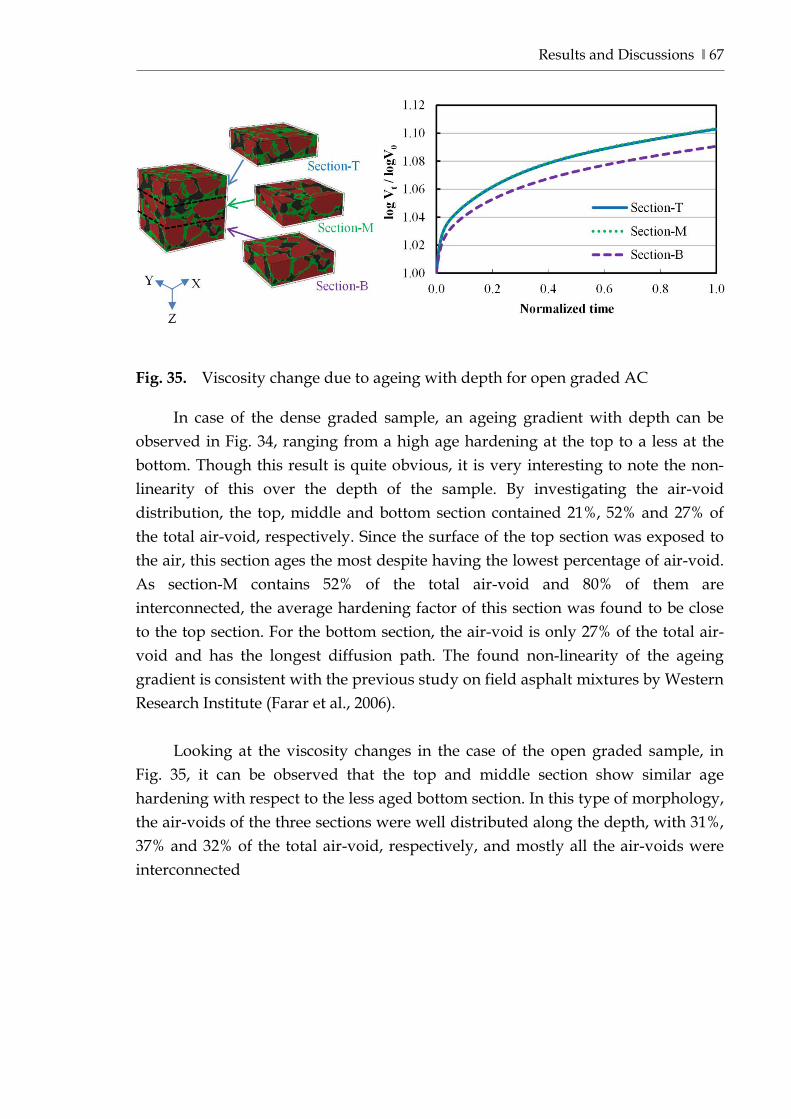
Results and Discussions ‖ 67
Fig. 35. Viscosity change due to ageing with depth for open graded AC
In case of the dense graded sample, an ageing gradient with depth can be observed in Fig. 34, ranging from a high age hardening at the top to a less at the bottom. Though this result is quite obvious, it is very interesting to note the non-linearity of this over the depth of the sample. By investigating the air-void distribution, the top, middle and bottom section contained 21%, 52% and 27% of the total air-void, respectively. Since the surface of the top section was exposed to the air, this section ages the most despite having the lowest percentage of air-void. As section-M contains 52% of the total air-void and 80% of them are interconnected, the average hardening factor of this section was found to be close to the top section. For the bottom section, the air-void is only 27% of the total air-void and has the longest diffusion path. The found non-linearity of the ageing gradient is consistent with the previous study on field asphalt mixtures by Western Research Institute (Farar et al., 2006).
Looking at the viscosity changes in the case of the open graded sample, in
Fig. 35, it can be observed that the top and middle section show similar age hardening with respect to the less aged bottom section. In this type of morphology, the air-voids of the three sections were well distributed along the depth, with 31%, 37% and 32% of the total air-void, respectively, and mostly all the air-voids were interconnected
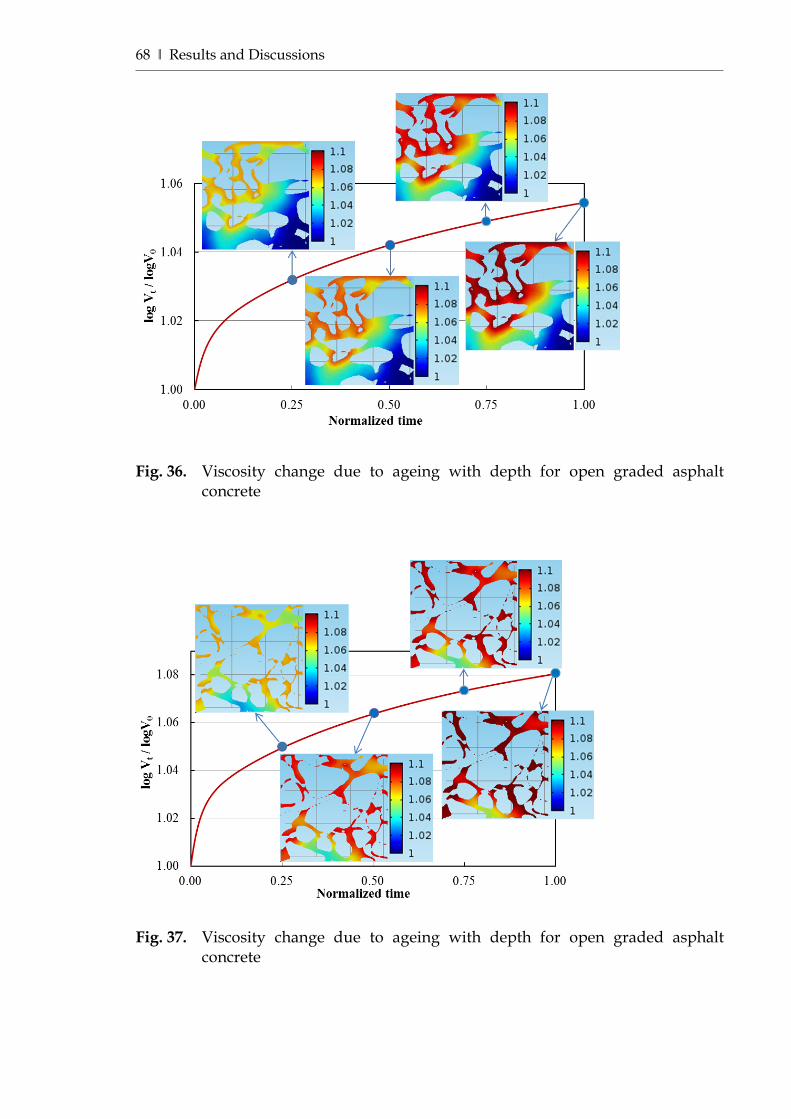
68 ‖ Results and Discussions
Fig. 36. Viscosity change due to ageing with depth for open graded asphalt
concrete
Fig. 37. Viscosity change due to ageing with depth for open graded asphalt
concrete
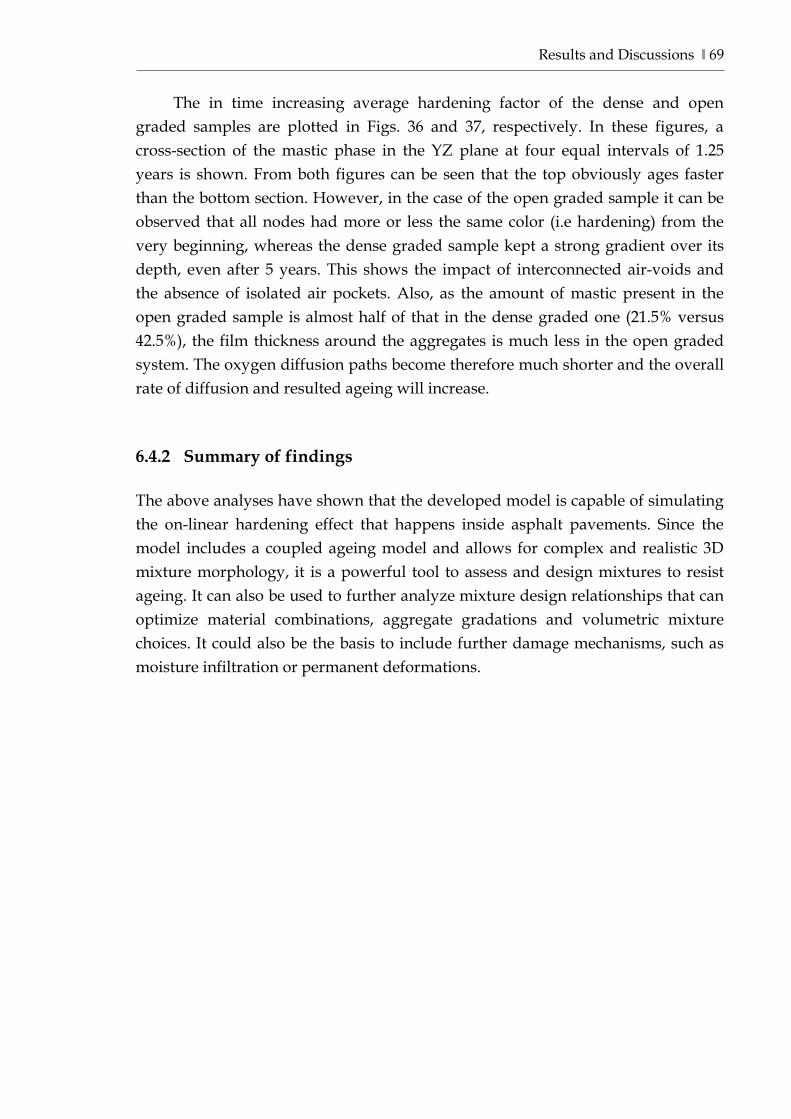
Results and Discussions ‖ 69
The in time increasing average hardening factor of the dense and open graded samples are plotted in Figs. 36 and 37, respectively. In these figures, a cross-section of the mastic phase in the YZ plane at four equal intervals of 1.25 years is shown. From both figures can be seen that the top obviously ages faster than the bottom section. However, in the case of the open graded sample it can be observed that all nodes had more or less the same color (i.e hardening) from the very beginning, whereas the dense graded sample kept a strong gradient over its depth, even after 5 years. This shows the impact of interconnected air-voids and the absence of isolated air pockets. Also, as the amount of mastic present in the open graded sample is almost half of that in the dense graded one (21.5% versus 42.5%), the film thickness around the aggregates is much less in the open graded system. The oxygen diffusion paths become therefore much shorter and the overall rate of diffusion and resulted ageing will increase.
6.4.2 Summary of findings The above analyses have shown that the developed model is capable of simulating the on-linear hardening effect that happens inside asphalt pavements. Since the model includes a coupled ageing model and allows for complex and realistic 3D mixture morphology, it is a powerful tool to assess and design mixtures to resist ageing. It can also be used to further analyze mixture design relationships that can optimize material combinations, aggregate gradations and volumetric mixture choices. It could also be the basis to include further damage mechanisms, such as moisture infiltration or permanent deformations.
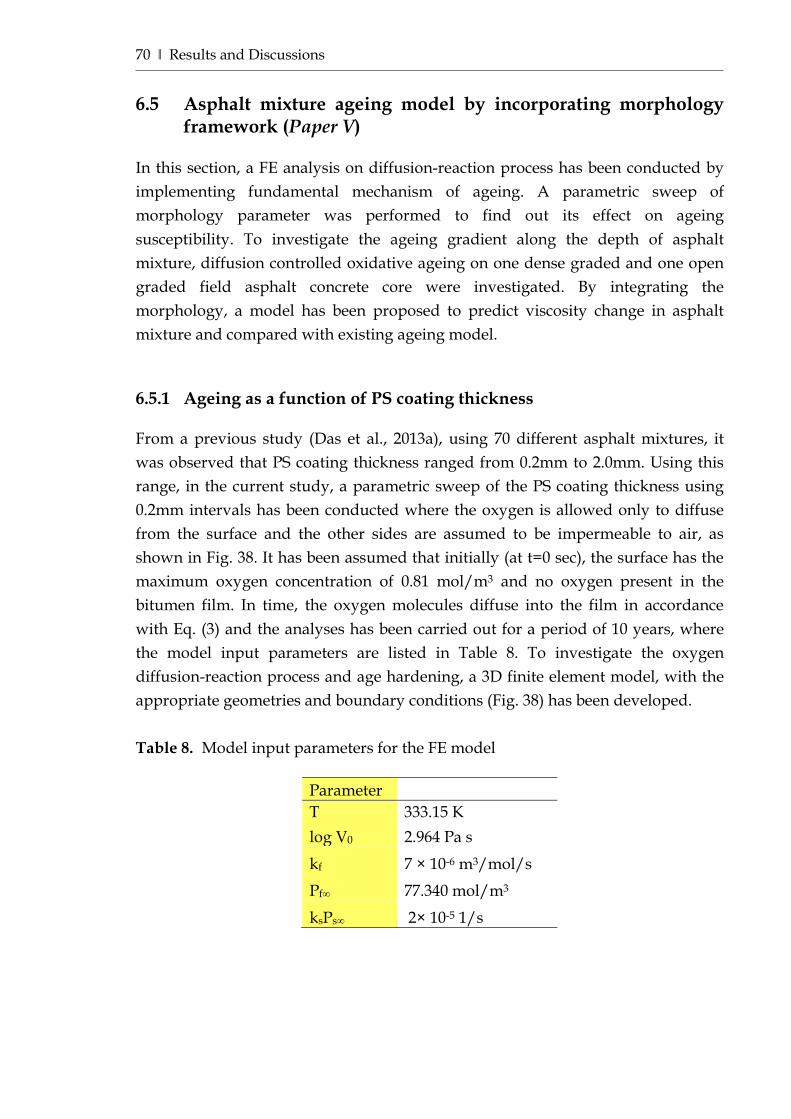
70 ‖ Results and Discussions
6.5 Asphalt mixture ageing model by incorporating morphology framework (Paper V)
In this section, a FE analysis on diffusion-reaction process has been conducted by implementing fundamental mechanism of ageing. A parametric sweep of morphology parameter was performed to find out its effect on ageing susceptibility. To investigate the ageing gradient along the depth of asphalt mixture, diffusion controlled oxidative ageing on one dense graded and one open graded field asphalt concrete core were investigated. By integrating the morphology, a model has been proposed to predict viscosity change in asphalt mixture and compared with existing ageing model. 6.5.1 Ageing as a function of PS coating thickness From a previous study (Das et al., 2013a), using 70 different asphalt mixtures, it was observed that PS coating thickness ranged from 0.2mm to 2.0mm. Using this range, in the current study, a parametric sweep of the PS coating thickness using 0.2mm intervals has been conducted where the oxygen is allowed only to diffuse from the surface and the other sides are assumed to be impermeable to air, as shown in Fig. 38. It has been assumed that initially (at t=0 sec), the surface has the maximum oxygen concentration of 0.81 mol/m3 and no oxygen present in the bitumen film. In time, the oxygen molecules diffuse into the film in accordance with Eq. (3) and the analyses has been carried out for a period of 10 years, where the model input parameters are listed in Table 8. To investigate the oxygen diffusion-reaction process and age hardening, a 3D finite element model, with the appropriate geometries and boundary conditions (Fig. 38) has been developed. Table 8. Model input parameters for the FE model
Parameter T 333.15 K log V0 2.964 Pa s
kf 7 × 10⁻⁶ m3/mol/s Pf∞ 77.340 mol/m3
ksPs∞ 2× 10⁻⁵ 1/s
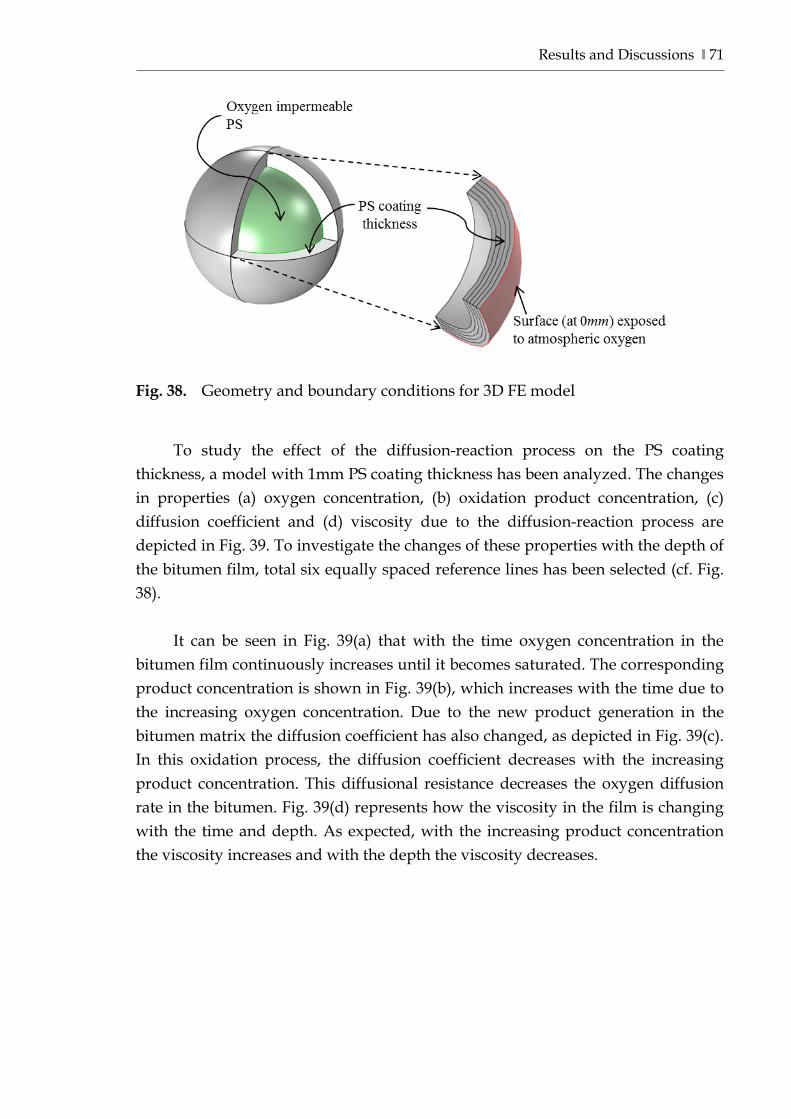
Results and Discussions ‖ 71
Fig. 38. Geometry and boundary conditions for 3D FE model
To study the effect of the diffusion-reaction process on the PS coating thickness, a model with 1mm PS coating thickness has been analyzed. The changes in properties (a) oxygen concentration, (b) oxidation product concentration, (c) diffusion coefficient and (d) viscosity due to the diffusion-reaction process are depicted in Fig. 39. To investigate the changes of these properties with the depth of the bitumen film, total six equally spaced reference lines has been selected (cf. Fig. 38).
It can be seen in Fig. 39(a) that with the time oxygen concentration in the
bitumen film continuously increases until it becomes saturated. The corresponding product concentration is shown in Fig. 39(b), which increases with the time due to the increasing oxygen concentration. Due to the new product generation in the bitumen matrix the diffusion coefficient has also changed, as depicted in Fig. 39(c). In this oxidation process, the diffusion coefficient decreases with the increasing product concentration. This diffusional resistance decreases the oxygen diffusion rate in the bitumen. Fig. 39(d) represents how the viscosity in the film is changing with the time and depth. As expected, with the increasing product concentration the viscosity increases and with the depth the viscosity decreases.
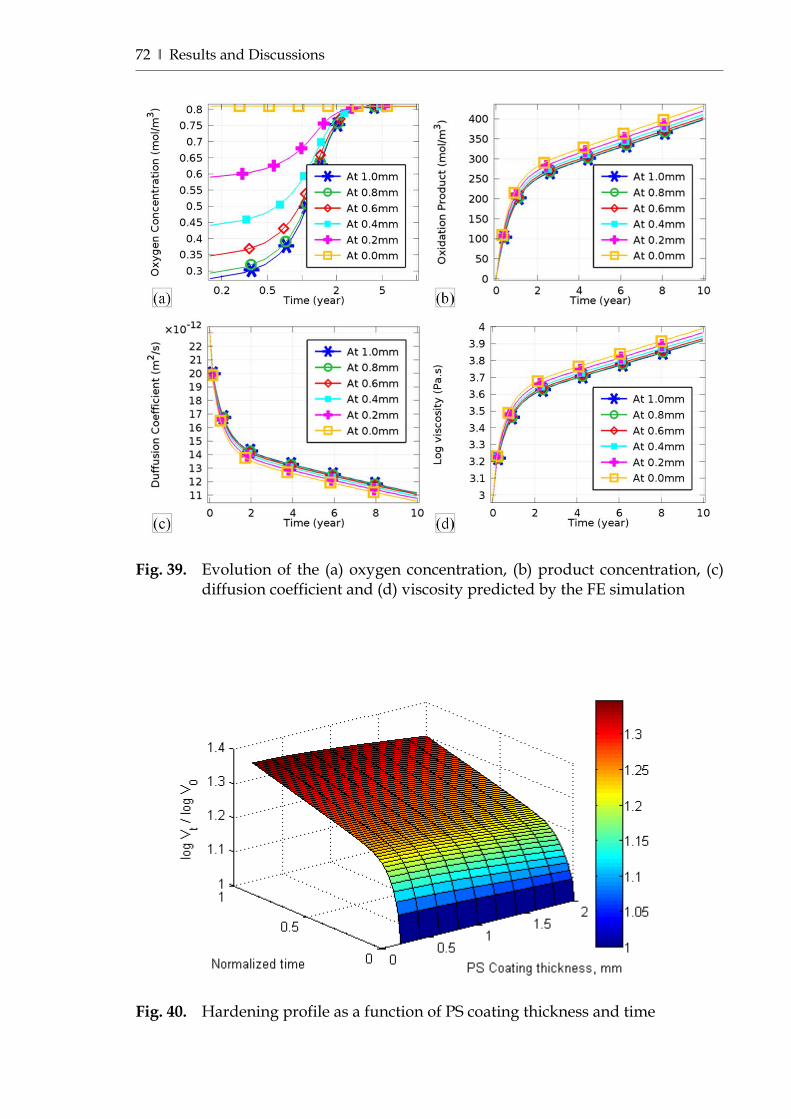
72 ‖ Results and Discussions
Fig. 39. Evolution of the (a) oxygen concentration, (b) product concentration, (c)
diffusion coefficient and (d) viscosity predicted by the FE simulation
Fig. 40. Hardening profile as a function of PS coating thickness and time
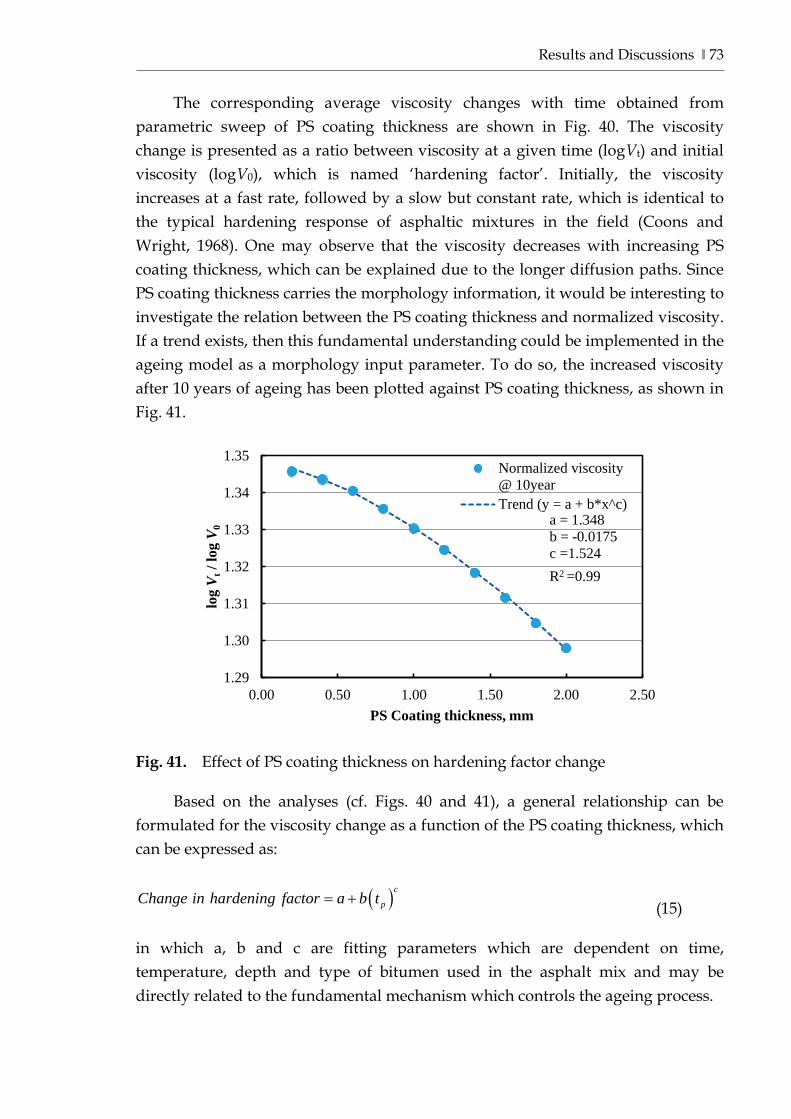
Results and Discussions ‖ 73
The corresponding average viscosity changes with time obtained from parametric sweep of PS coating thickness are shown in Fig. 40. The viscosity change is presented as a ratio between viscosity at a given time (logVt) and initial viscosity (logV0), which is named ‘hardening factor’. Initially, the viscosity increases at a fast rate, followed by a slow but constant rate, which is identical to the typical hardening response of asphaltic mixtures in the field (Coons and Wright, 1968). One may observe that the viscosity decreases with increasing PS coating thickness, which can be explained due to the longer diffusion paths. Since PS coating thickness carries the morphology information, it would be interesting to investigate the relation between the PS coating thickness and normalized viscosity. If a trend exists, then this fundamental understanding could be implemented in the ageing model as a morphology input parameter. To do so, the increased viscosity after 10 years of ageing has been plotted against PS coating thickness, as shown in Fig. 41.
Fig. 41. Effect of PS coating thickness on hardening factor change
Based on the analyses (cf. Figs. 40 and 41), a general relationship can be formulated for the viscosity change as a function of the PS coating thickness, which can be expressed as:
( )c
pChange in hardening factor a b t= + (15) in which a, b and c are fitting parameters which are dependent on time, temperature, depth and type of bitumen used in the asphalt mix and may be directly related to the fundamental mechanism which controls the ageing process.
1.29
1.30
1.31
1.32
1.33
1.34
1.35
0.00 0.50 1.00 1.50 2.00 2.50
log
V t /
log
V 0
PS Coating thickness, mm
Normalized viscosity@ 10yearTrend (y = a + b*x^c)
a = 1.348 b = -0.0175 c =1.524
R2 =0.99
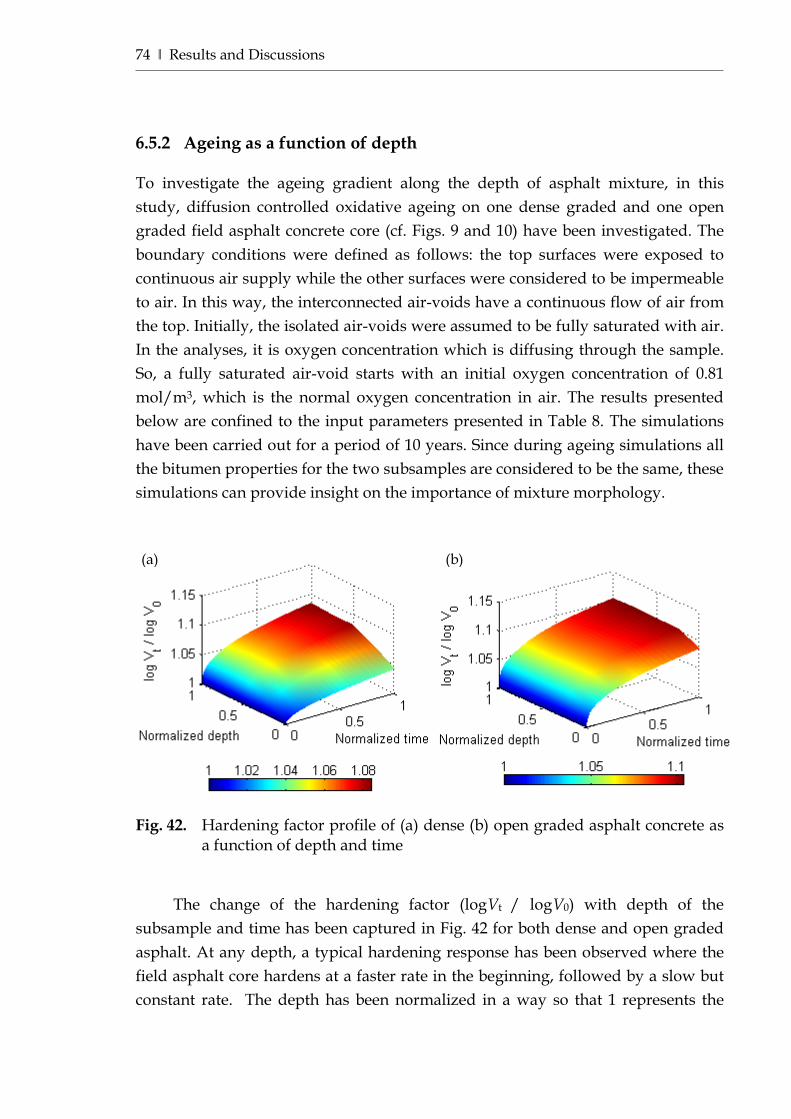
74 ‖ Results and Discussions
6.5.2 Ageing as a function of depth To investigate the ageing gradient along the depth of asphalt mixture, in this study, diffusion controlled oxidative ageing on one dense graded and one open graded field asphalt concrete core (cf. Figs. 9 and 10) have been investigated. The boundary conditions were defined as follows: the top surfaces were exposed to continuous air supply while the other surfaces were considered to be impermeable to air. In this way, the interconnected air-voids have a continuous flow of air from the top. Initially, the isolated air-voids were assumed to be fully saturated with air. In the analyses, it is oxygen concentration which is diffusing through the sample. So, a fully saturated air-void starts with an initial oxygen concentration of 0.81 mol/m3, which is the normal oxygen concentration in air. The results presented below are confined to the input parameters presented in Table 8. The simulations have been carried out for a period of 10 years. Since during ageing simulations all the bitumen properties for the two subsamples are considered to be the same, these simulations can provide insight on the importance of mixture morphology.
Fig. 42. Hardening factor profile of (a) dense (b) open graded asphalt concrete as
a function of depth and time
The change of the hardening factor (logVt / logV0) with depth of the subsample and time has been captured in Fig. 42 for both dense and open graded asphalt. At any depth, a typical hardening response has been observed where the field asphalt core hardens at a faster rate in the beginning, followed by a slow but constant rate. The depth has been normalized in a way so that 1 represents the
(a) (b)
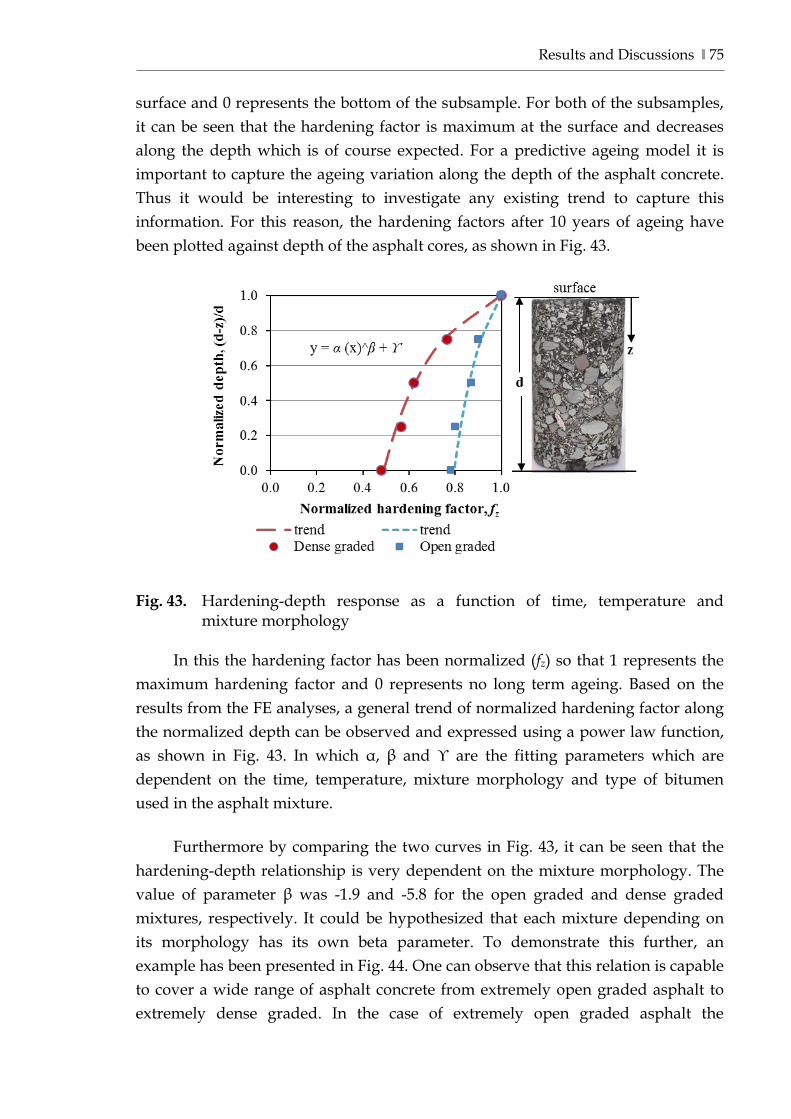
Results and Discussions ‖ 75
surface and 0 represents the bottom of the subsample. For both of the subsamples, it can be seen that the hardening factor is maximum at the surface and decreases along the depth which is of course expected. For a predictive ageing model it is important to capture the ageing variation along the depth of the asphalt concrete. Thus it would be interesting to investigate any existing trend to capture this information. For this reason, the hardening factors after 10 years of ageing have been plotted against depth of the asphalt cores, as shown in Fig. 43.
Fig. 43. Hardening-depth response as a function of time, temperature and mixture morphology
In this the hardening factor has been normalized (fz) so that 1 represents the
maximum hardening factor and 0 represents no long term ageing. Based on the results from the FE analyses, a general trend of normalized hardening factor along the normalized depth can be observed and expressed using a power law function, as shown in Fig. 43. In which α, β and ϒ are the fitting parameters which are dependent on the time, temperature, mixture morphology and type of bitumen used in the asphalt mixture.
Furthermore by comparing the two curves in Fig. 43, it can be seen that the hardening-depth relationship is very dependent on the mixture morphology. The value of parameter β was -1.9 and -5.8 for the open graded and dense graded mixtures, respectively. It could be hypothesized that each mixture depending on its morphology has its own beta parameter. To demonstrate this further, an example has been presented in Fig. 44. One can observe that this relation is capable to cover a wide range of asphalt concrete from extremely open graded asphalt to extremely dense graded. In the case of extremely open graded asphalt the
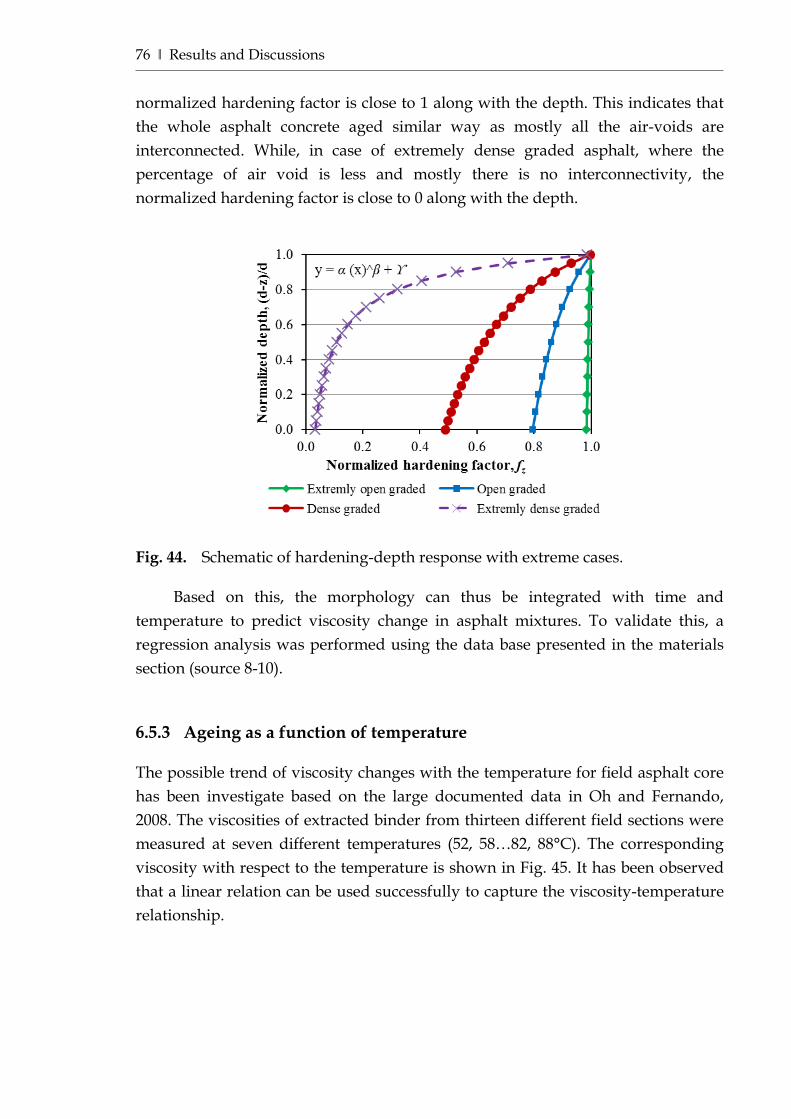
76 ‖ Results and Discussions
normalized hardening factor is close to 1 along with the depth. This indicates that the whole asphalt concrete aged similar way as mostly all the air-voids are interconnected. While, in case of extremely dense graded asphalt, where the percentage of air void is less and mostly there is no interconnectivity, the normalized hardening factor is close to 0 along with the depth.
Fig. 44. Schematic of hardening-depth response with extreme cases.
Based on this, the morphology can thus be integrated with time and temperature to predict viscosity change in asphalt mixtures. To validate this, a regression analysis was performed using the data base presented in the materials section (source 8-10). 6.5.3 Ageing as a function of temperature The possible trend of viscosity changes with the temperature for field asphalt core has been investigate based on the large documented data in Oh and Fernando, 2008. The viscosities of extracted binder from thirteen different field sections were measured at seven different temperatures (52, 58…82, 88°C). The corresponding viscosity with respect to the temperature is shown in Fig. 45. It has been observed that a linear relation can be used successfully to capture the viscosity-temperature relationship.
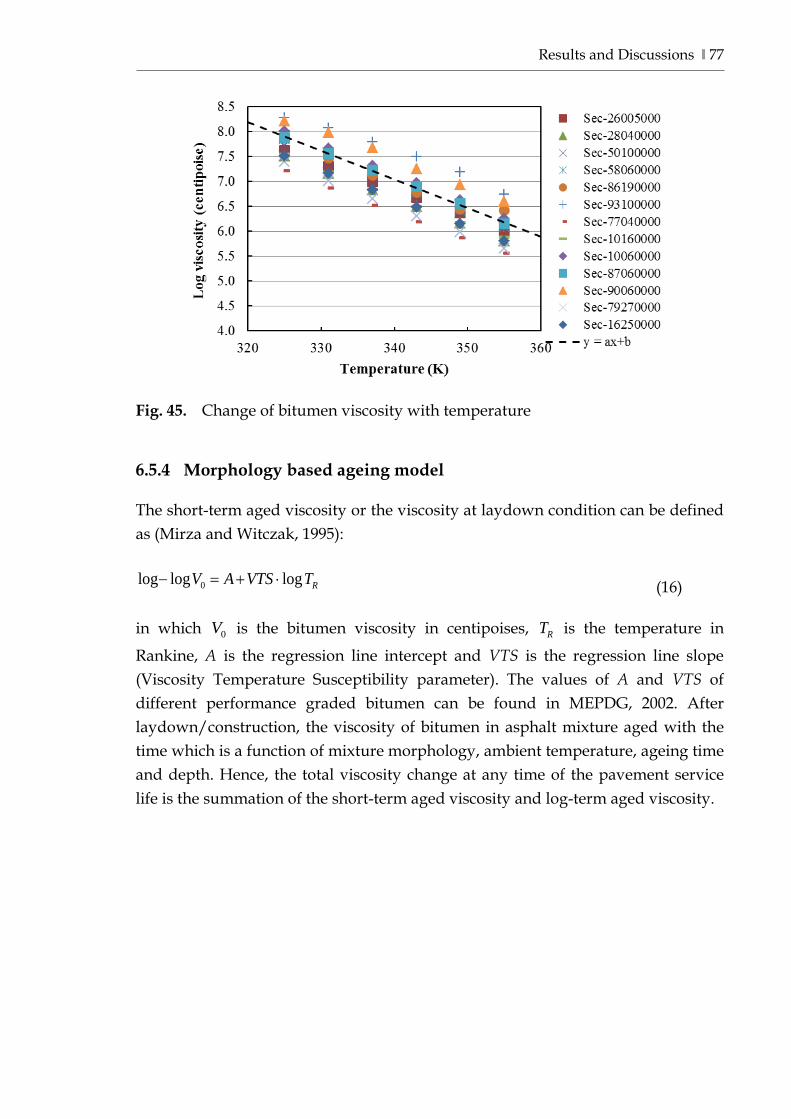
Results and Discussions ‖ 77
Fig. 45. Change of bitumen viscosity with temperature 6.5.4 Morphology based ageing model The short-term aged viscosity or the viscosity at laydown condition can be defined as (Mirza and Witczak, 1995):
0log log log RV A VTS T− = + ⋅ (16) in which 0V is the bitumen viscosity in centipoises, RT is the temperature in
Rankine, A is the regression line intercept and VTS is the regression line slope (Viscosity Temperature Susceptibility parameter). The values of A and VTS of different performance graded bitumen can be found in MEPDG, 2002. After laydown/construction, the viscosity of bitumen in asphalt mixture aged with the time which is a function of mixture morphology, ambient temperature, ageing time and depth. Hence, the total viscosity change at any time of the pavement service life is the summation of the short-term aged viscosity and log-term aged viscosity.
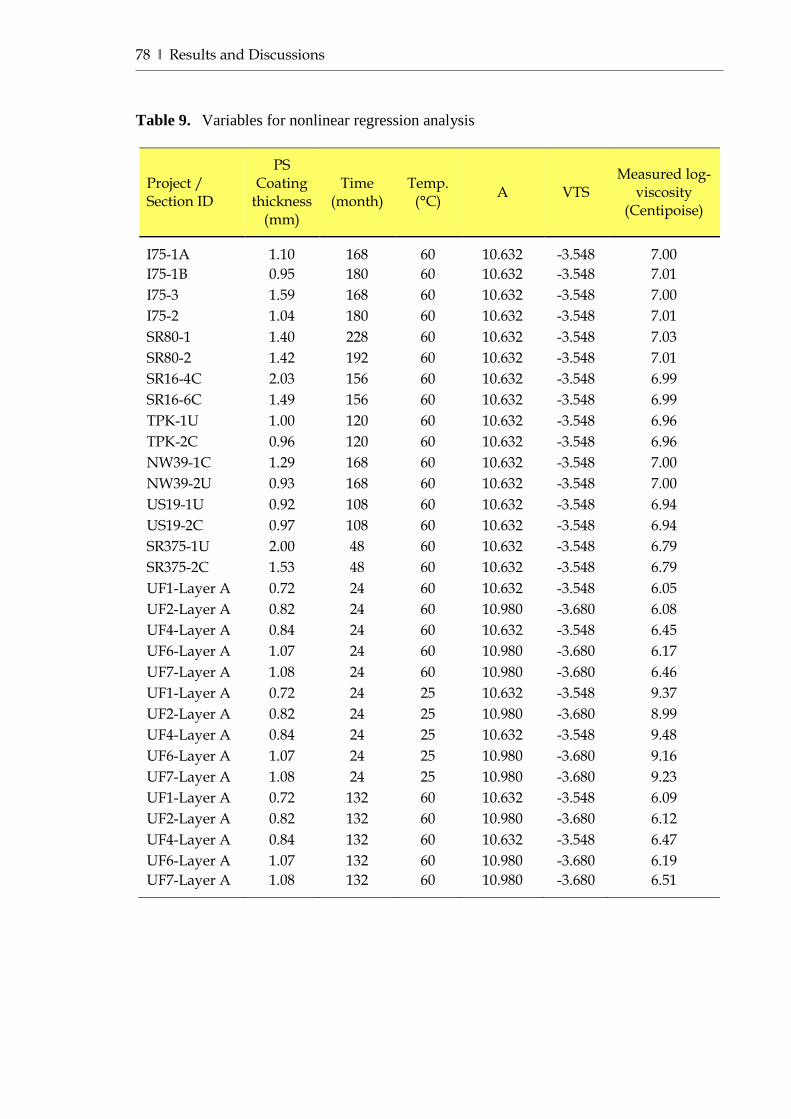
78 ‖ Results and Discussions
Table 9. Variables for nonlinear regression analysis
Project / Section ID
PS Coating
thickness (mm)
Time (month)
Temp. (°C) A VTS
Measured log-viscosity
(Centipoise)
I75-1A 1.10 168 60 10.632 -3.548 7.00 I75-1B 0.95 180 60 10.632 -3.548 7.01 I75-3 1.59 168 60 10.632 -3.548 7.00 I75-2 1.04 180 60 10.632 -3.548 7.01 SR80-1 1.40 228 60 10.632 -3.548 7.03 SR80-2 1.42 192 60 10.632 -3.548 7.01 SR16-4C 2.03 156 60 10.632 -3.548 6.99 SR16-6C 1.49 156 60 10.632 -3.548 6.99 TPK-1U 1.00 120 60 10.632 -3.548 6.96 TPK-2C 0.96 120 60 10.632 -3.548 6.96 NW39-1C 1.29 168 60 10.632 -3.548 7.00 NW39-2U 0.93 168 60 10.632 -3.548 7.00 US19-1U 0.92 108 60 10.632 -3.548 6.94 US19-2C 0.97 108 60 10.632 -3.548 6.94 SR375-1U 2.00 48 60 10.632 -3.548 6.79 SR375-2C 1.53 48 60 10.632 -3.548 6.79 UF1-Layer A 0.72 24 60 10.632 -3.548 6.05 UF2-Layer A 0.82 24 60 10.980 -3.680 6.08 UF4-Layer A 0.84 24 60 10.632 -3.548 6.45 UF6-Layer A 1.07 24 60 10.980 -3.680 6.17 UF7-Layer A 1.08 24 60 10.980 -3.680 6.46 UF1-Layer A 0.72 24 25 10.632 -3.548 9.37 UF2-Layer A 0.82 24 25 10.980 -3.680 8.99 UF4-Layer A 0.84 24 25 10.632 -3.548 9.48 UF6-Layer A 1.07 24 25 10.980 -3.680 9.16 UF7-Layer A 1.08 24 25 10.980 -3.680 9.23 UF1-Layer A 0.72 132 60 10.632 -3.548 6.09 UF2-Layer A 0.82 132 60 10.980 -3.680 6.12 UF4-Layer A 0.84 132 60 10.632 -3.548 6.47 UF6-Layer A 1.07 132 60 10.980 -3.680 6.19 UF7-Layer A 1.08 132 60 10.980 -3.680 6.51
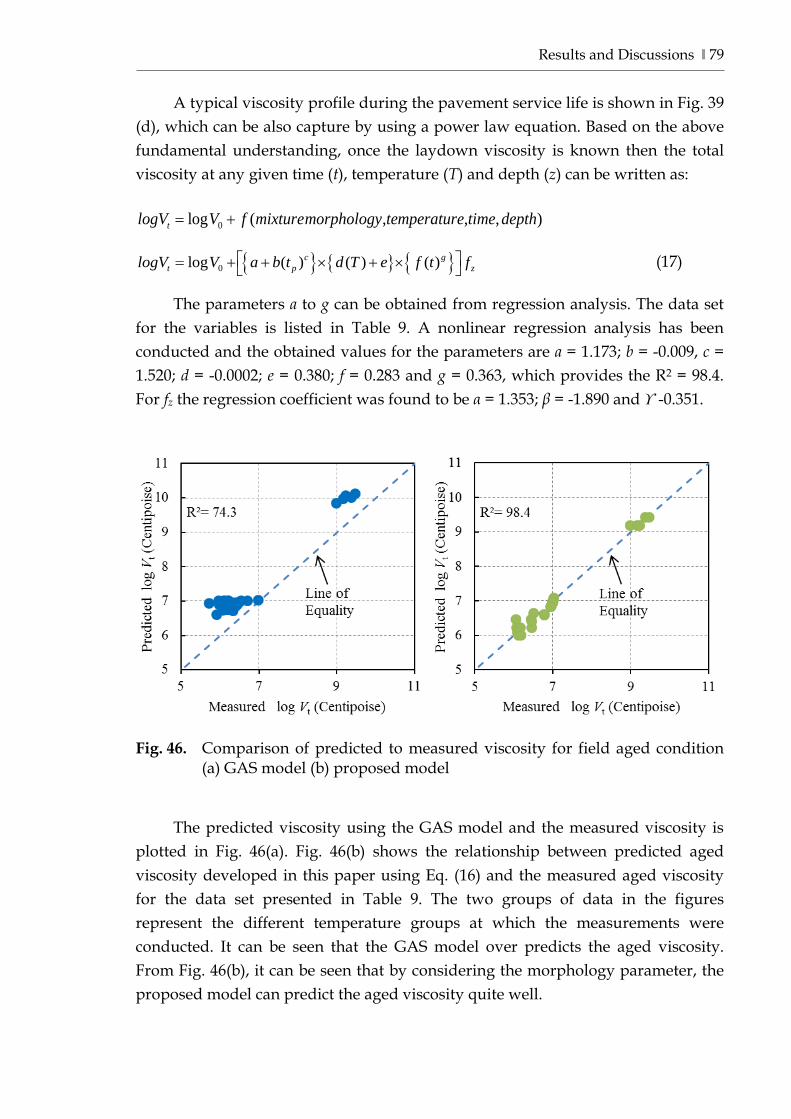
Results and Discussions ‖ 79
A typical viscosity profile during the pavement service life is shown in Fig. 39 (d), which can be also capture by using a power law equation. Based on the above fundamental understanding, once the laydown viscosity is known then the total viscosity at any given time (t), temperature (T) and depth (z) can be written as:
0log ( , , , )tlogV V f mixturemorphology temperature time depth= +
{ } { } { }0log ( ) ( ) ( )c gt p zlogV V a b t d T e f t f = + + × + × (17)
The parameters a to g can be obtained from regression analysis. The data set
for the variables is listed in Table 9. A nonlinear regression analysis has been conducted and the obtained values for the parameters are a = 1.173; b = -0.009, c = 1.520; d = -0.0002; e = 0.380; f = 0.283 and g = 0.363, which provides the R2 = 98.4. For fz the regression coefficient was found to be α = 1.353; β = -1.890 and ϒ -0.351.
Fig. 46. Comparison of predicted to measured viscosity for field aged condition
(a) GAS model (b) proposed model
The predicted viscosity using the GAS model and the measured viscosity is plotted in Fig. 46(a). Fig. 46(b) shows the relationship between predicted aged viscosity developed in this paper using Eq. (16) and the measured aged viscosity for the data set presented in Table 9. The two groups of data in the figures represent the different temperature groups at which the measurements were conducted. It can be seen that the GAS model over predicts the aged viscosity. From Fig. 46(b), it can be seen that by considering the morphology parameter, the proposed model can predict the aged viscosity quite well.
80 ‖ Results and Discussions
6.5.5 Summary of findings It was found that focusing only on the percentage of air-void as the main predictive ageing parameter may lead to an erroneous conclusion and non-optimal predictions of long-term behavior. To replace such approaches, a new way to predict the long-term ageing is proposed in this chapter, utilizing the determined relationships of mixture morphology and the posed ageing mechanism. Though additional mechanisms and non-linear coupling between them may be still needed to reach the ‘ultimate’ ageing prediction model, the developed model was shown to be a significant improvement to the currently used methods and may show the way forward for enhancing the fundamental knowledge towards asphalt mixture ageing.
Conclusions and Recommendations ‖ 81
Chapter 7 7 Conclusions and Recommendations The aim of this Thesis was to develop fundamental understanding on ageing in asphalt mixtures that can contribute to the asphalt community moving away from the currently used accelerated ageing laboratory tests and empirical models that can lead to erroneous conclusions.
To reach this aim, experimental and numerical micro-scale analyses on bitumen and meso-scale investigations on mixture morphology have been performed which, collectively, allowed for the development of a method for the prediction of asphalt field ageing, incorporating both mixture morphology and micro-scale bitumen mechanisms. For this, first, the mechanisms of surface ageing and diffusion controlled oxidative ageing were identified. Secondly, the influence of mixture morphology on asphalt ageing susceptibility was investigated. Procedures to determine the controlling parameter were then developed and a framework to quantify the long-term field ageing of asphalt mixtures was set-up. Basis on these, in the following, conclusions are presented and recommendations are made towards a possible continuation of this research. 7.1 Concluding discussions The change of micro-structures on the bitumen surfaces due to temperature increase or decrease has correlated exactly with the DSC test results. It has been found that the appearance of micro-structures is always in the crystallization temperature range of that specific bitumen whereas the dissolving of these micro-structures is related to the melting temperature range. Thus based on the analyses of the obtained results it could be concluded that the behavior and appearance of microstructures is very much related to the wax behavior. Therefore, this research confirms that the so called ‘Bee’ structures are indeed wax induced.
82 ‖ Conclusions and Recommendations
In previous studies on PAV aged bitumen, an increase of bee-shaped microstructures compared with unaged bitumen was reported. However, in this study it has been found that the percentage of microstructures on the surface reduced with the ageing which is irrespective to the bitumen type. For the extreme exposure (both UV and air), the quantity was lowest and with time it became even lower. Since the microstructures are related to the wax content, one would expect that, with ageing, the wax content may also change. From the DSC results, however, it has proven that this is not the case, as the wax content stayed in fact the same. This observation let to the hypothesis that a thin film forms at the specimen surface due to ageing, thus creating a barrier, which restricts the microstructures to float towards the surface. Furthermore, the microstructural investigation has showed strong indications that, depending on the bitumen and its conditioning, water soluble thin films are formed due to ageing.
A new empirical relation to obtain PS coating thickness is established utilizing mixture volumetric properties and gradation. This gives an important improvement to ideal packing arrangements that are limited to individual curves that force for interpolation to be able to calculate the PS coating thickness for non-ideal packing arrangements.
This enhanced framework can be successfully used to identify the effect of various morphological parameters on ageing performance of the mixture. Since mixture morphology is controllable, having insight into how the various morphological parameters influence the mixture’s durability behavior can be of great value to optimize its design, regardless of the individual material properties.
Utilizing the developed oxidative ageing model, the thin film FE parametric study has showed that the observed initial viscosity increase is controlled by the fast reaction rates, whereas the slow reaction rates are controlling the long term age hardening.
From the 3D asphalt mixture ageing analyses, it has been found that the developed model is capable of simulating the non-linear hardening effect that happens inside asphalt pavements. As such, the coupled ageing model will allow for complex and realistic asphalt mixture ageing analyses that can optimize material combinations, aggregate gradations and volumetric mixture choices. The computational analysis has showed that the effect of the air-void distribution, their interconnectivity and the aggregate packing has a significant effect on the resulting age hardening of the overall mixture.
Conclusions and Recommendations ‖ 83
It has been found that only considering the percentage of air-void as an input
parameter in the predictive ageing model, may lead to erroneous conclusions and non-optimal design. The model proposed in this Thesis is based on the mixture morphology information and able to predict the aged viscosity better than the existing model. Though additional mechanisms and non-linear coupling between them may be still needed to reach the ‘ultimate’ ageing prediction model, the developed model has been found to be a significant improvement to the currently used methods and may show the way forward to enhance the fundamental knowledge towards asphalt mixture ageing.
7.2 Recommendations From the research done in this Thesis, some remaining questions have been identified which can be further investigated in future research efforts. Firstly, even though the research showed that the phase separation was clearly related to the wax phase, the percentages of phases do not exactly correlate to the low number of wax, present in the bitumen. The measured stiffness of the bees and the matrix phase and the implication of their evolution is an interesting matter, which should also be further investigated.
Secondly, in this Thesis, an oxidative ageing mechanism was hypothesized based on which numerical model was implemented. The posed mechanism, however, could be further validated through chemical testing. From this, a further identification of the fundamental ageing mechanisms and its relation to the mechanical material properties can be done.
Thirdly, a hypothesis was made about deformation of a protective film and its relation to microstructure formation at the surface and its relationship to moisture damage. This hypothesis was based on only one conditioning cycle. To further confirm this hypothesis, it is recommended to repeat this experiment for multiple conditioning cycles and more types of bitumen.
Lastly, the connection between the developed knowledge on the micro-scales and behavior on the meso-and macro scale can be further developed. Considering it’s the same material merely analyzed at the different scale fundamental relationships, must exist. The identification, quantification and validation of such interconnectivity relationships could be of paramount importance for material
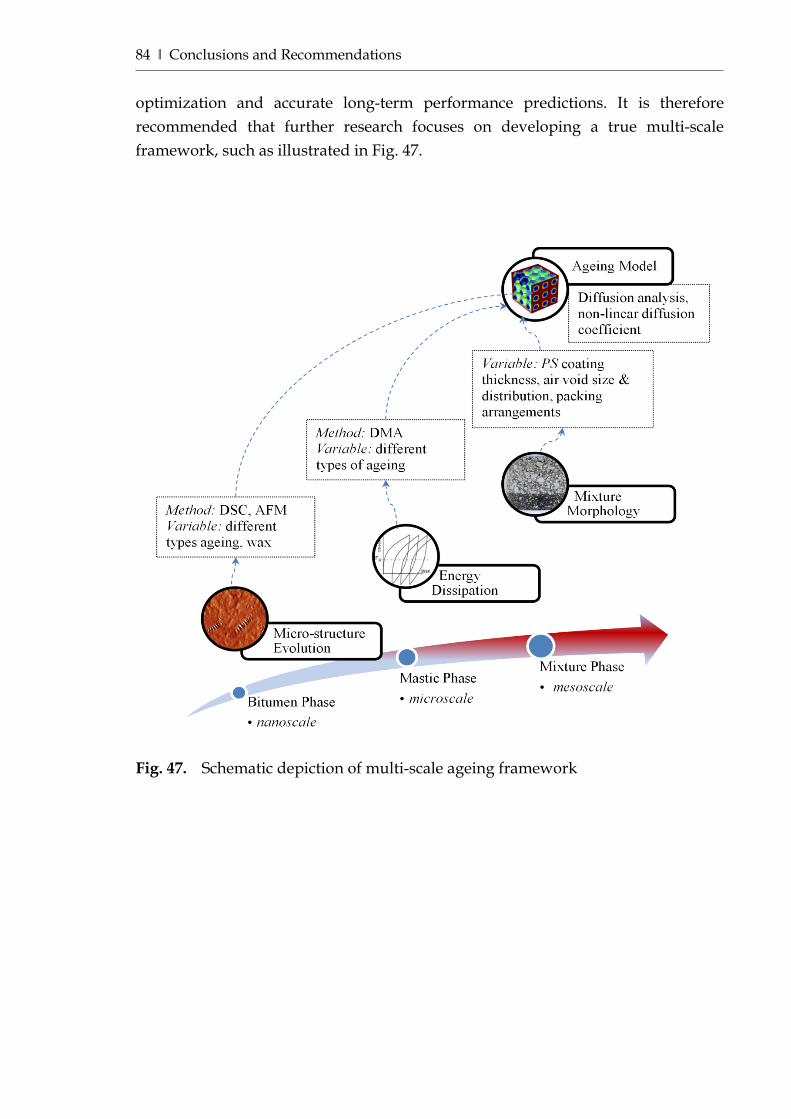
84 ‖ Conclusions and Recommendations
optimization and accurate long-term performance predictions. It is therefore recommended that further research focuses on developing a true multi-scale framework, such as illustrated in Fig. 47.
Fig. 47. Schematic depiction of multi-scale ageing framework
References ‖ 85
References Airey GD (2003) State of the Art Report on Ageing Test Methods for Bituminous
Pavement Materials, Int J Pavem Eng 4(3): 165-76
Al-Azri N, Bullin J, Richard R, Ferry A, Glover CJ, Jung S et al (2006) Binder oxidative aging in Texas pavements: hardening rates, hardening susceptibilities, and impact of pavement depth, Transp Res Rec 1962 (1): 12-20.
Allen RG, Little DN, Bhasin A (2012) Structural Characterization of Micromechanical Properties in Asphalt Using Atomic Force Microscopy, J Mater Civil Eng 24(10): 1317-27.
Asphalt Institute (2001) Superpave mix design. Lexington
ASTM D 3418-12. Standard Test Method for Transition Temperatures and Enthalpies of Fusion and Crystallization of Polymers by Differential Scanning Calorimetry.
Binnig G, Rohrer H, Gerber C, Weibel E (1982). Tunneling through a controllable vacuum gap. Applied Physics Letters, 40, 178–180.
Binnig G, Quate CF, Gerber C (1986). Atomic Force Microscopy. Physical Review Letters, 56, 930–933.
Birgisson B, Ruth BE (2001) Development of tentative guidelines for the selection of aggregate gradations for hot mix asphalt. In: White TD, Johnson SR, Yzenas JJ (eds) Aggregate contribution to hot mix asphalt (HMA) performance, ASTM STP 1412. American Society for Testing and Materials, West Conshohocken
Birgisson B, Roque R, Tia M, Masad, EA (2005) Development and evaluation of test methods to evaluate water damage and effectiveness of antistripping agents. Florida Department of Transportation, Final Report, UF Project no. 4910-4504-722-12
Branthaver JF, Petersen JC, Robertson RE, Duvall JJ, Kim SS, Harnsberger PM et al (1993) Binder characterization and evaluation - Vol. 2: Chemistry. SHRP-A-368.
Chen JS, Huang LS (2000) Developing an aging model to evaluate engineering properties of asphalt paving binders. Materials and Structures, vol. 33, pp. 559-565.
Christensen DW, Bonaquist RF (2006) Volumetric Requirements for Superpave Mix Design NCHRP 567.
86 ‖ References
Coons RF, Wright PH (1968) An investigation of the hardening of asphalt recovered from pavement of various ages. Journal of Association of Asphalt Paving Technologists, Vol. 37, pp. 510–522.
Crank J. (1975) The mathematics of diffusion. 2nd ed. Oxford: Oxford University Press.
Das PK, Birgisson B, Jelagin D, Kringos N (2013a). Investigation of the asphalt mixture morphology influence on its ageing susceptibility. Materials and Structures.
Das PK, Kringos N, Wallqvist V, Birgisson B (2013b) Micromechanical investigation of phase separation in bitumen by combining AFM with DSC results, Road Mater Pavement Des 14(S1):25-37.
de Moraes MB, Pereira RB, Simao RA, Leite LFM (2010) High temperature AFM study of CAP 30/45 pen grade bitumen. Journal of Microscopy, 239(1), 46–53.
Dickinson EJ, Nicholas JH, Boas-Traube S (1958) Physical factors affecting the absorption of oxygen by the films of bituminous road binders, J App Chem 8: 673-87.
Dickinson E J (1984) The diffusion controlled reaction of oxygen with films of bituminous binders, Australian Road Research, 14: 121-132
Dickinson EJ (2000) Prediction of the hardening of the bitumen in pavement surfacings by reaction with atmospheric oxygen. Int J Road Mater Pavement Des, 1(3):255–80.
Durrieu F, Farcas F, Mouillet V (2007) The influence of UV aging of a tyrene/butadiene/styrene modified bitumen: comparison between laboratory and on site aging, Fuel 86:1446-51.
Farrar MJ, Harnsberger PM, Thomas KP, Wiser W (2006) Evaluation of Oxidation in Asphalt Pavement Test Sections After Four Years of Service. Proceedings of the International Conference on Perpetual Pavement, Columbus, Ohio.
FHWA (1998) Performance of Coarse-graded mixes at WesTrack–Premature Rutting. Final Report, USA
Fuller WB, Thompson SE (1907) The laws of proportioning concrete. Trans Am Soc Civil Eng 59:67
Garcia OF (2002) Asphalt mixture and loading effects on surface-cracking of pavements. Thesis (Masters), University of Florida.
Glaser RR, Schabron JF, Turner TF, Planche J-P, Salmans SL, Loveridge JL (2013) Low-Temperature Oxidation Kinetics of Asphalt Binders. Transportation Research Record: Journal of the Transportation Research Board, 2370: 63-68.
Goode JF, Lufsey LA (1962) A new graphical chart for evaluating aggregate gradations. Proc Assoc Asph Paving Technol 31:176–207
References ‖ 87
Guarin A, Roque R, Kim S, Sirin O (2012) Disruption factor of asphalt mixtures. International Journal of Pavement Engineering, DOI:10.1080/10298436.2012.727992
Han R, Jin X, Glover CJ (2013) Oxygen Diffusivity in Asphalts and Mastics, Petroleum Science and Technology, 31:15, 1563-1573
Herrington PR, Henderson R (2004) Bitumen film thicknesses and confinement ratios in chip seal surfacings. Intl J Road Mater Pavement Des; 5(2): 251–64.
Herrington PR (2012) Diffusion and reaction of oxygen in bitumen films. Fuel, 94: 86-92.
Huang SC, Pauli AT (2008) Particle Size Effect of Crumb Rubber on Rheology and Morphology of Asphalt Binders with Long-term Aging, Road Mater Pavement Des 9 (1): 73-95.
Houston WN, Mirza MW, Zapata CE, Raghavendra S (2005) Environmental Effects in Pavement Mix and Structural Design Systems. National Cooperative Highway Research Program: Web Only Document 113: Part 1 of Final Report for NCHRP Project 9-23.
Jäger A, Lackner R, Eisenmenger-Sittner Ch, Blab R (2004) Identification of four material phases in bitumen by atomic force microscopy. Road Materials and Pavement Design, 5, 9–24.
Jajliardo AP (2003) Development of specification criteria to mitigate top-down cracking. Thesis (Masters), University of Florida.
Kandhal P, Chakraborty S (1996) Effect of asphalt film thickness on short- and long-term aging of asphalt paving mixtures. Transportation Research Record: Journal of the Transportation Research Board, 1535 (1), pp. 83–90
Kringos N, Schmets A, Pauli T, Scarpas T (2009a) A Finite Element Based Chemo-Mechanics Model to Simulate Healing of Bituminous Materials, Proceedings of the international workshop on chemo-mechanics of bituminous materials, Delf, The Netherlands, 69–75.
Kringos N, Scarpas A, Pauli T, Robertson R (2009b) A thermodynamic approach to healing in bitumen. In: Advanced testing and characterization of bituminous materials, 123–128.
Lee DY (1973) Asphalt durability correction in Iowa. Highway research board, No. 468, pp. 43-59.
Lesueur D, Gerard JF, Claudy P, Létoffé JM, Planche JP, Martin D (1996) A structure-related model to describe asphalt linear viscoelasticity, J Rheol 40(5): 813-36.
Lira B, Jelagin D, Birgisson B (2012) Gradation-based framework for asphalt mixture. Materials and Structures, DOI 10.1617/s11527-012-9982-3
88 ‖ References
Loeber L, Sutton O, Morel J, Valleton J-M, Muller G (1996) New direct observations of asphalts and asphalt binders by scanning electron microscopy and atomic force microscopy. Journal of Microscopy, 182(1), 32–39.
Loeber L, Muller G, Morel J, Sutton O (1998) Bitumen in colloidal science: a chemical, structural and rheological approach. Fuel, 77(13), 1443–1450.
Lu X, Langton M, Olofsson P, Redelius P (2005) Wax morphology in bitumen. Journal of Materials Science, 40, 1893–1900.
Lu X, Redelius P (2006) Compositional and structural characterization of waxes isolated from bitumens, Energy Fuels 20: 653-60.
Lu X, Talon Y, Redelius P (2008) Ageing of bituminous binders - laboratory tests and field data, Proceedings of the 4th Eurasphalt and Eurobitume congress; Copenhagen, Denmark: European Asphalt Pavement Association (EAPA)
Marr D, Hildreth E (1980) Theory of edge detection, Proceedings of the Royal Society; London: B Biological Science 207: 187-217.
Masson J-F, Leblond V, Margeson J, Bundalo-Perc S (2006) Bitumen morphologies by phase-detection atomic force microscopy. Journal of Microscopy, 221, 17–29.
Masson J-F, Leblond V, Margeson J, Bundalo-Perc S (2007) Low temperature bitumen stiffness and viscous paraffinic nano and micro size domains by cryogenic AFM and PDM. Journal of Microscopy, 227, 191–202.
MEPDG (2002) Mechanistic–Empirical Pavement Design Guide of New and Rehabilitated Pavement Structures. Final NCHRP Report 1-37A, Chapter 2, Material Characterization.
Meininger RC (1992) Effects of aggregates and mineral fillers on asphalt mixture performance. ASTM STP 1147
Mirza MW, Witczak, MW (1995) Development of a Global Aging System for Short and Long Term Aging of Asphalt Cements. Journal of Association of Asphalt Paving Technologists, Vol. 64, pp. 393-431.
Nijboer LW (1948) Plasticity as a factor in the design of dense bituminous road carpets. Elsevier, New York
Nukunya B, Roque R, Tia M, Birgisson B (2001) Evaluation of VMA and other volumetric properties as criteria for the design and acceptance of superpave mixtures. Journal of the Association of Asphalt Paving Technologists, 70, pp. 38–69
Onifade I, Jelagin D, Guarin A, Birgisson B, Kringos N (2013) Asphalt Internal Structure Characterization with X-Ray Computed Tomography and Digital Image Processing. Multi-Scale Modeling and Characterization of Infrastructure Materials, Chapter: 11, Publisher: Springer Netherlands, Editors: Niki Kringos, Björn Birgisson, David Frost, Linbing Wang, pp.139-158
Pauli AT, Branthaver JF, Robertson RE, Grimes W, Eggleston CM (2001) Atomic force microscopy investigation of SHRP asphalts. ACS division of fuel chemistry preprints, 46(2), 104–110.
References ‖ 89
Pauli AT, Grimes RW, Beemer AG, Turner TF, Branthaver JF (2011) Morphology of asphalts, asphalt fractions and model wax-doped asphalts studied by atomic force microscopy. International Journal of Pavement Engineering, 12(4), 291–309
Pellinen TK (2001) Investigation of the Use of Dynamic Modulus as an Indicator of Hot-Mix Asphalt Performance. Ph.D. thesis, Arizona State University, USA
Petersen JC (1993) Asphalt oxidation – an overview including a new model for oxidation proposing that physicochemical factors dominate the oxidation kinematics, Fuel Sci Techn Int 11: 57-87.
Petersen JC (2007) A Dual, Sequential Mechanism for the Oxidation of Petroleum Asphalts. Petroleum Science and Technology, Vol. 16, Nos. 9-10, pp. 1023-1059.
Powell RB (2001) As-Built Properties of Experimental Sections on the 2000 NCAT Pavement Test Track. NCAT Report
Roque R, Birgisson B, Kim S, Guarin A (2006) Development of mix design guidelines for improved performance of asphalt mixtures. Florida Department of Transportation, Final Report, UF Project no. 4910-4554-032-12
Roque R, Zou J, Kim YR, Baek C, Thirunavukkarasu S, Underwood BS, Guddati MN (2010) Top-Down Cracking of Hot-Mix Asphalt Layers: Models for Initiation and Propagation, NCHRP Project 1-42A Report, TRB, Washington, D.C.
Roque R, Chun S, Zou J, Lopp G, Villiers C (2011) Continuation of Superpave Projects monitoring. Gainesville, FL: Final Report of Florida Department of Transportation, University of Florida.
Ruth BE, Roque R, Nukunya B (2002) Aggregate gradation characterization factors and their relationship to fracture energy and failure strain on asphalt mixtures. Journal of the Association of Asphalt Paving Technologists, 71, pp. 310–344
Schmets A, Kringos N, Pauli T, Redelius P, Scarpas T (2010) Wax Induced Phase Separation in Bitumen. Int. J. of Pavement Engineering, 11(6), 555-563.
Soenen H, Besamusca J, Fischer HR, Poulikakos LD, Planche JP, Das PK et al (2013) Laboratory investigation of bitumen based on round robin DSC and AFM tests, Materilas and Structures. doi: 10.1617/s11527-013-0123-4
Talbot AN, Richart FE (1923) The strength of concrete and its relation to the cement, aggregate and water. Bulletin, Univeristy of Illinois Engineering Experiment Station, vol 137, pp 1–118
Tuffour YA, Ishai I (1990) The diffusion model and asphalt age-hardening. Proc AAPT, 59:73–92.
Van Oort WP (1956) Durability of asphalt-It’s aging in the dark. Industrial and Engineering Chemistry, 48 (7): 1196-1201
90 ‖ References
Vavrik WR, Pine WJ, Huber G, Carpenter SH, Bailey R (2001) The bailey method of gradation evaluation: the influence of aggregate gradation and packing characteristics on voids in the mineral aggregate. Journal of the Association of Asphalt Paving Technologists, 70, pp. 132–175
White TD (1985) Marshall Procedures for Design and Quality Control of Asphalt Mixtures. Journal of the Association of Asphalt Paving Technologists, 54, pp. 265–284
Wig, Williams, Gates (1916) Strength and other properties of concrete as affected by materials and methods of preparation. Technical Papers of the Bureau of Standards (58)
Woo WJ, Chowdhury A, Glover CJ (2008) Field Aging of Unmodified Asphalt Binder in Three Texas Long-Term Performance Pavements. Journal of Transportation Research Board, No. 2051, Washington, D.C., pp. 15-22.
Wu S, Pang L, Mo L, Chen Y, Zhu G (2009) Influence of aging on the evolution of structure, morphology and rheology of base and SBS modified bitumen, Construction and Building Materials 23(2): 1005-10.
Yideti TF, Birgisson B, Jelagin D, Guarin A (2013a) Packing theory-based framework to evaluate permanent deformation of unbound granular materials. International Journal of Pavement Engineering, 14 (3), pp. 309-320
Yideti TF, Birgisson B, Jelagin D, Guarin A (2013b) Packing theory-based framework for evaluating the resilient modulus of unbound granular materials. International Journal of Pavement Engineering, 15 (8), pp. 689-697
Zhang HL, Yu JY, Feng ZG, Xue LH (2012) Effect of aging on the morphology of bitumen by atomic force microscopy. Journal of Microscopy, 246(1): 11-9.
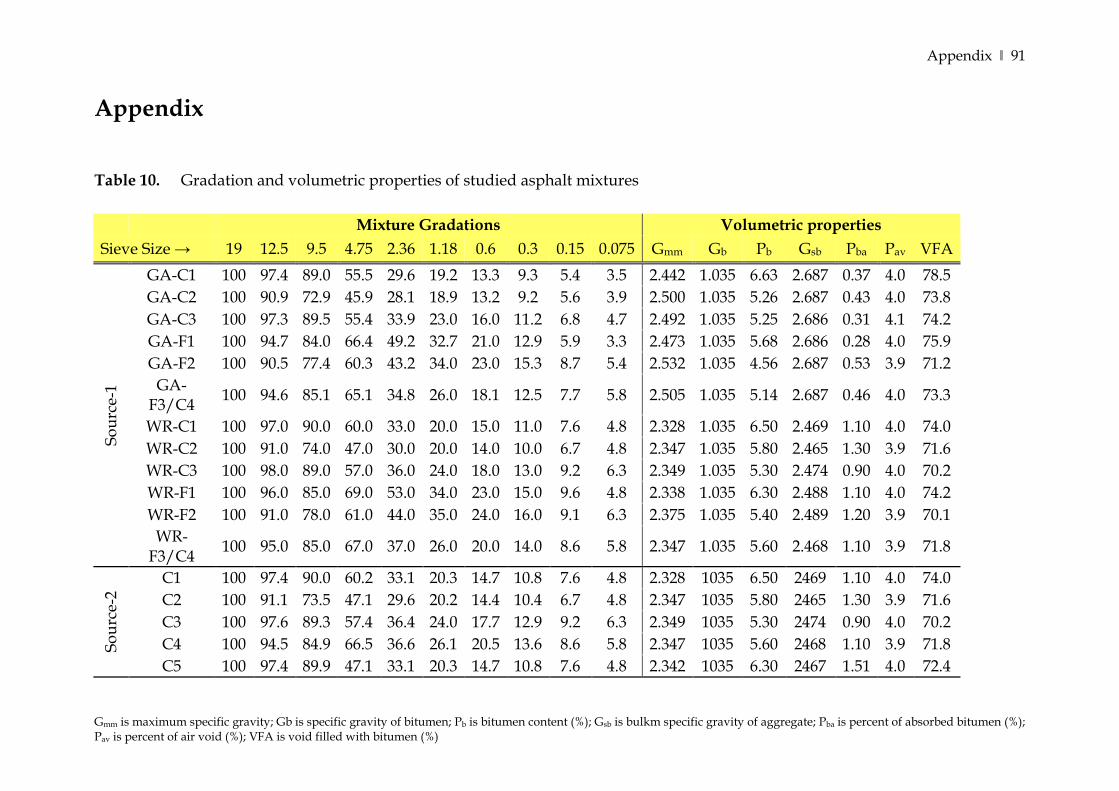
Appendix ‖ 91
Gmm is maximum specific gravity; Gb is specific gravity of bitumen; Pb is bitumen content (%); Gsb is bulkm specific gravity of aggregate; Pba is percent of absorbed bitumen (%); Pav is percent of air void (%); VFA is void filled with bitumen (%)
Appendix Table 10. Gradation and volumetric properties of studied asphalt mixtures
Mixture Gradations Volumetric properties Sieve Size → 19 12.5 9.5 4.75 2.36 1.18 0.6 0.3 0.15 0.075 Gmm Gb Pb Gsb Pba Pav VFA
Sour
ce-1
GA-C1 100 97.4 89.0 55.5 29.6 19.2 13.3 9.3 5.4 3.5 2.442 1.035 6.63 2.687 0.37 4.0 78.5 GA-C2 100 90.9 72.9 45.9 28.1 18.9 13.2 9.2 5.6 3.9 2.500 1.035 5.26 2.687 0.43 4.0 73.8 GA-C3 100 97.3 89.5 55.4 33.9 23.0 16.0 11.2 6.8 4.7 2.492 1.035 5.25 2.686 0.31 4.1 74.2 GA-F1 100 94.7 84.0 66.4 49.2 32.7 21.0 12.9 5.9 3.3 2.473 1.035 5.68 2.686 0.28 4.0 75.9 GA-F2 100 90.5 77.4 60.3 43.2 34.0 23.0 15.3 8.7 5.4 2.532 1.035 4.56 2.687 0.53 3.9 71.2
GA-F3/C4 100 94.6 85.1 65.1 34.8 26.0 18.1 12.5 7.7 5.8 2.505 1.035 5.14 2.687 0.46 4.0 73.3
WR-C1 100 97.0 90.0 60.0 33.0 20.0 15.0 11.0 7.6 4.8 2.328 1.035 6.50 2.469 1.10 4.0 74.0 WR-C2 100 91.0 74.0 47.0 30.0 20.0 14.0 10.0 6.7 4.8 2.347 1.035 5.80 2.465 1.30 3.9 71.6 WR-C3 100 98.0 89.0 57.0 36.0 24.0 18.0 13.0 9.2 6.3 2.349 1.035 5.30 2.474 0.90 4.0 70.2 WR-F1 100 96.0 85.0 69.0 53.0 34.0 23.0 15.0 9.6 4.8 2.338 1.035 6.30 2.488 1.10 4.0 74.2 WR-F2 100 91.0 78.0 61.0 44.0 35.0 24.0 16.0 9.1 6.3 2.375 1.035 5.40 2.489 1.20 3.9 70.1
WR-F3/C4 100 95.0 85.0 67.0 37.0 26.0 20.0 14.0 8.6 5.8 2.347 1.035 5.60 2.468 1.10 3.9 71.8
Sour
ce-2
C1 100 97.4 90.0 60.2 33.1 20.3 14.7 10.8 7.6 4.8 2.328 1035 6.50 2469 1.10 4.0 74.0 C2 100 91.1 73.5 47.1 29.6 20.2 14.4 10.4 6.7 4.8 2.347 1035 5.80 2465 1.30 3.9 71.6 C3 100 97.6 89.3 57.4 36.4 24.0 17.7 12.9 9.2 6.3 2.349 1035 5.30 2474 0.90 4.0 70.2 C4 100 94.5 84.9 66.5 36.6 26.1 20.5 13.6 8.6 5.8 2.347 1035 5.60 2468 1.10 3.9 71.8 C5 100 97.4 89.9 47.1 33.1 20.3 14.7 10.8 7.6 4.8 2.342 1035 6.30 2467 1.51 4.0 72.4
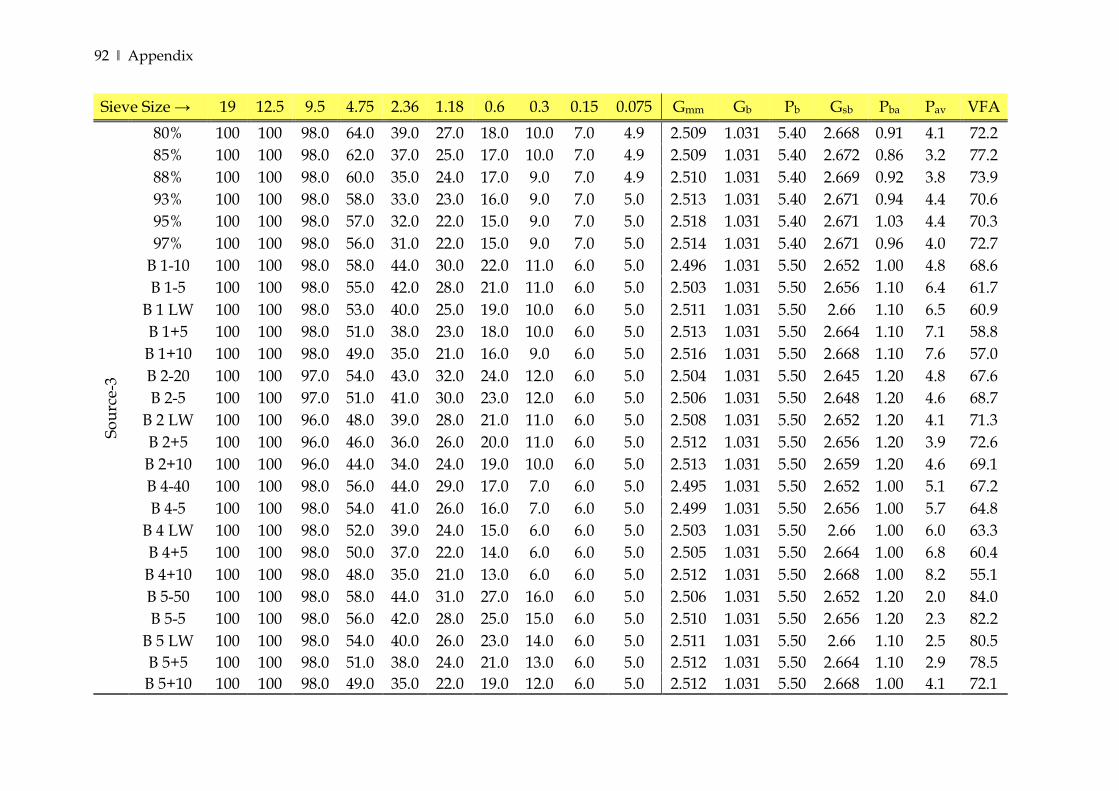
92 ‖ Appendix
Sieve Size → 19 12.5 9.5 4.75 2.36 1.18 0.6 0.3 0.15 0.075 Gmm Gb Pb Gsb Pba Pav VFA So
urce
-3
80% 100 100 98.0 64.0 39.0 27.0 18.0 10.0 7.0 4.9 2.509 1.031 5.40 2.668 0.91 4.1 72.2 85% 100 100 98.0 62.0 37.0 25.0 17.0 10.0 7.0 4.9 2.509 1.031 5.40 2.672 0.86 3.2 77.2 88% 100 100 98.0 60.0 35.0 24.0 17.0 9.0 7.0 4.9 2.510 1.031 5.40 2.669 0.92 3.8 73.9 93% 100 100 98.0 58.0 33.0 23.0 16.0 9.0 7.0 5.0 2.513 1.031 5.40 2.671 0.94 4.4 70.6 95% 100 100 98.0 57.0 32.0 22.0 15.0 9.0 7.0 5.0 2.518 1.031 5.40 2.671 1.03 4.4 70.3 97% 100 100 98.0 56.0 31.0 22.0 15.0 9.0 7.0 5.0 2.514 1.031 5.40 2.671 0.96 4.0 72.7
B 1-10 100 100 98.0 58.0 44.0 30.0 22.0 11.0 6.0 5.0 2.496 1.031 5.50 2.652 1.00 4.8 68.6 B 1-5 100 100 98.0 55.0 42.0 28.0 21.0 11.0 6.0 5.0 2.503 1.031 5.50 2.656 1.10 6.4 61.7
B 1 LW 100 100 98.0 53.0 40.0 25.0 19.0 10.0 6.0 5.0 2.511 1.031 5.50 2.66 1.10 6.5 60.9 B 1+5 100 100 98.0 51.0 38.0 23.0 18.0 10.0 6.0 5.0 2.513 1.031 5.50 2.664 1.10 7.1 58.8 B 1+10 100 100 98.0 49.0 35.0 21.0 16.0 9.0 6.0 5.0 2.516 1.031 5.50 2.668 1.10 7.6 57.0 B 2-20 100 100 97.0 54.0 43.0 32.0 24.0 12.0 6.0 5.0 2.504 1.031 5.50 2.645 1.20 4.8 67.6 B 2-5 100 100 97.0 51.0 41.0 30.0 23.0 12.0 6.0 5.0 2.506 1.031 5.50 2.648 1.20 4.6 68.7
B 2 LW 100 100 96.0 48.0 39.0 28.0 21.0 11.0 6.0 5.0 2.508 1.031 5.50 2.652 1.20 4.1 71.3 B 2+5 100 100 96.0 46.0 36.0 26.0 20.0 11.0 6.0 5.0 2.512 1.031 5.50 2.656 1.20 3.9 72.6 B 2+10 100 100 96.0 44.0 34.0 24.0 19.0 10.0 6.0 5.0 2.513 1.031 5.50 2.659 1.20 4.6 69.1 B 4-40 100 100 98.0 56.0 44.0 29.0 17.0 7.0 6.0 5.0 2.495 1.031 5.50 2.652 1.00 5.1 67.2 B 4-5 100 100 98.0 54.0 41.0 26.0 16.0 7.0 6.0 5.0 2.499 1.031 5.50 2.656 1.00 5.7 64.8
B 4 LW 100 100 98.0 52.0 39.0 24.0 15.0 6.0 6.0 5.0 2.503 1.031 5.50 2.66 1.00 6.0 63.3 B 4+5 100 100 98.0 50.0 37.0 22.0 14.0 6.0 6.0 5.0 2.505 1.031 5.50 2.664 1.00 6.8 60.4 B 4+10 100 100 98.0 48.0 35.0 21.0 13.0 6.0 6.0 5.0 2.512 1.031 5.50 2.668 1.00 8.2 55.1 B 5-50 100 100 98.0 58.0 44.0 31.0 27.0 16.0 6.0 5.0 2.506 1.031 5.50 2.652 1.20 2.0 84.0 B 5-5 100 100 98.0 56.0 42.0 28.0 25.0 15.0 6.0 5.0 2.510 1.031 5.50 2.656 1.20 2.3 82.2
B 5 LW 100 100 98.0 54.0 40.0 26.0 23.0 14.0 6.0 5.0 2.511 1.031 5.50 2.66 1.10 2.5 80.5 B 5+5 100 100 98.0 51.0 38.0 24.0 21.0 13.0 6.0 5.0 2.512 1.031 5.50 2.664 1.10 2.9 78.5 B 5+10 100 100 98.0 49.0 35.0 22.0 19.0 12.0 6.0 5.0 2.512 1.031 5.50 2.668 1.00 4.1 72.1
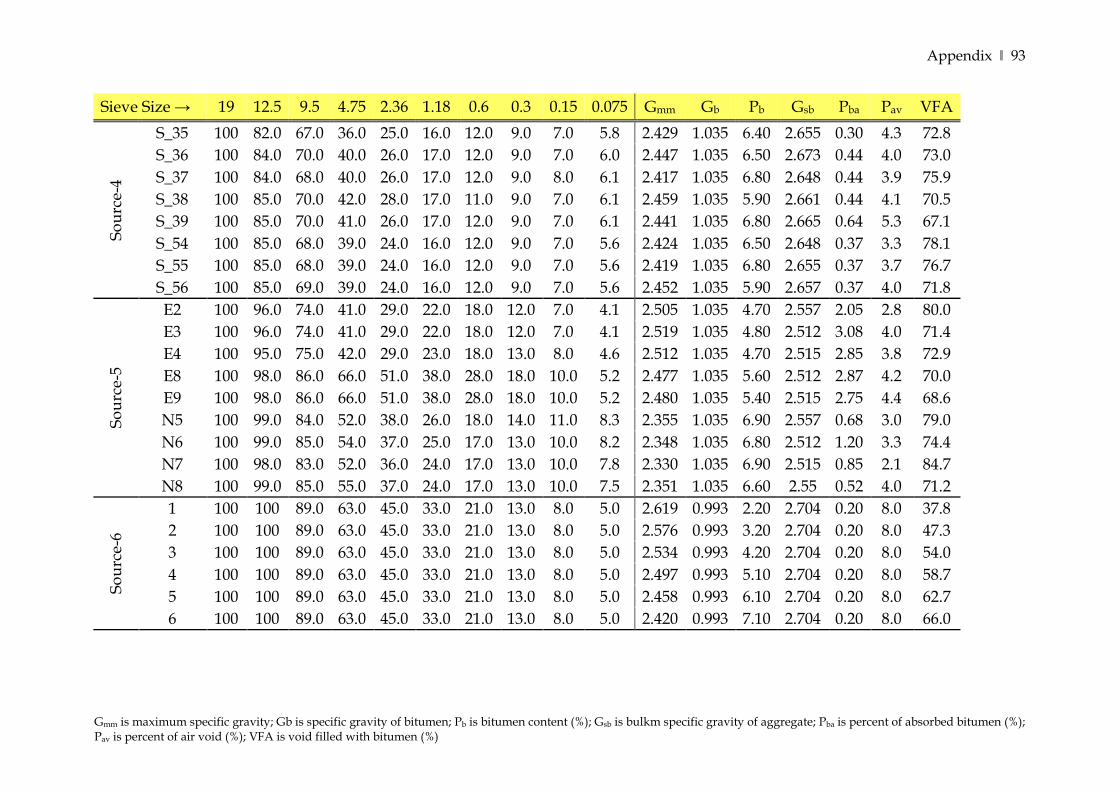
Appendix ‖ 93
Gmm is maximum specific gravity; Gb is specific gravity of bitumen; Pb is bitumen content (%); Gsb is bulkm specific gravity of aggregate; Pba is percent of absorbed bitumen (%); Pav is percent of air void (%); VFA is void filled with bitumen (%)
Sieve Size → 19 12.5 9.5 4.75 2.36 1.18 0.6 0.3 0.15 0.075 Gmm Gb Pb Gsb Pba Pav VFA So
urce
-4
S_35 100 82.0 67.0 36.0 25.0 16.0 12.0 9.0 7.0 5.8 2.429 1.035 6.40 2.655 0.30 4.3 72.8 S_36 100 84.0 70.0 40.0 26.0 17.0 12.0 9.0 7.0 6.0 2.447 1.035 6.50 2.673 0.44 4.0 73.0 S_37 100 84.0 68.0 40.0 26.0 17.0 12.0 9.0 8.0 6.1 2.417 1.035 6.80 2.648 0.44 3.9 75.9 S_38 100 85.0 70.0 42.0 28.0 17.0 11.0 9.0 7.0 6.1 2.459 1.035 5.90 2.661 0.44 4.1 70.5 S_39 100 85.0 70.0 41.0 26.0 17.0 12.0 9.0 7.0 6.1 2.441 1.035 6.80 2.665 0.64 5.3 67.1 S_54 100 85.0 68.0 39.0 24.0 16.0 12.0 9.0 7.0 5.6 2.424 1.035 6.50 2.648 0.37 3.3 78.1 S_55 100 85.0 68.0 39.0 24.0 16.0 12.0 9.0 7.0 5.6 2.419 1.035 6.80 2.655 0.37 3.7 76.7 S_56 100 85.0 69.0 39.0 24.0 16.0 12.0 9.0 7.0 5.6 2.452 1.035 5.90 2.657 0.37 4.0 71.8
Sour
ce-5
E2 100 96.0 74.0 41.0 29.0 22.0 18.0 12.0 7.0 4.1 2.505 1.035 4.70 2.557 2.05 2.8 80.0 E3 100 96.0 74.0 41.0 29.0 22.0 18.0 12.0 7.0 4.1 2.519 1.035 4.80 2.512 3.08 4.0 71.4 E4 100 95.0 75.0 42.0 29.0 23.0 18.0 13.0 8.0 4.6 2.512 1.035 4.70 2.515 2.85 3.8 72.9 E8 100 98.0 86.0 66.0 51.0 38.0 28.0 18.0 10.0 5.2 2.477 1.035 5.60 2.512 2.87 4.2 70.0 E9 100 98.0 86.0 66.0 51.0 38.0 28.0 18.0 10.0 5.2 2.480 1.035 5.40 2.515 2.75 4.4 68.6 N5 100 99.0 84.0 52.0 38.0 26.0 18.0 14.0 11.0 8.3 2.355 1.035 6.90 2.557 0.68 3.0 79.0 N6 100 99.0 85.0 54.0 37.0 25.0 17.0 13.0 10.0 8.2 2.348 1.035 6.80 2.512 1.20 3.3 74.4 N7 100 98.0 83.0 52.0 36.0 24.0 17.0 13.0 10.0 7.8 2.330 1.035 6.90 2.515 0.85 2.1 84.7 N8 100 99.0 85.0 55.0 37.0 24.0 17.0 13.0 10.0 7.5 2.351 1.035 6.60 2.55 0.52 4.0 71.2
Sour
ce-6
1 100 100 89.0 63.0 45.0 33.0 21.0 13.0 8.0 5.0 2.619 0.993 2.20 2.704 0.20 8.0 37.8 2 100 100 89.0 63.0 45.0 33.0 21.0 13.0 8.0 5.0 2.576 0.993 3.20 2.704 0.20 8.0 47.3 3 100 100 89.0 63.0 45.0 33.0 21.0 13.0 8.0 5.0 2.534 0.993 4.20 2.704 0.20 8.0 54.0 4 100 100 89.0 63.0 45.0 33.0 21.0 13.0 8.0 5.0 2.497 0.993 5.10 2.704 0.20 8.0 58.7 5 100 100 89.0 63.0 45.0 33.0 21.0 13.0 8.0 5.0 2.458 0.993 6.10 2.704 0.20 8.0 62.7 6 100 100 89.0 63.0 45.0 33.0 21.0 13.0 8.0 5.0 2.420 0.993 7.10 2.704 0.20 8.0 66.0
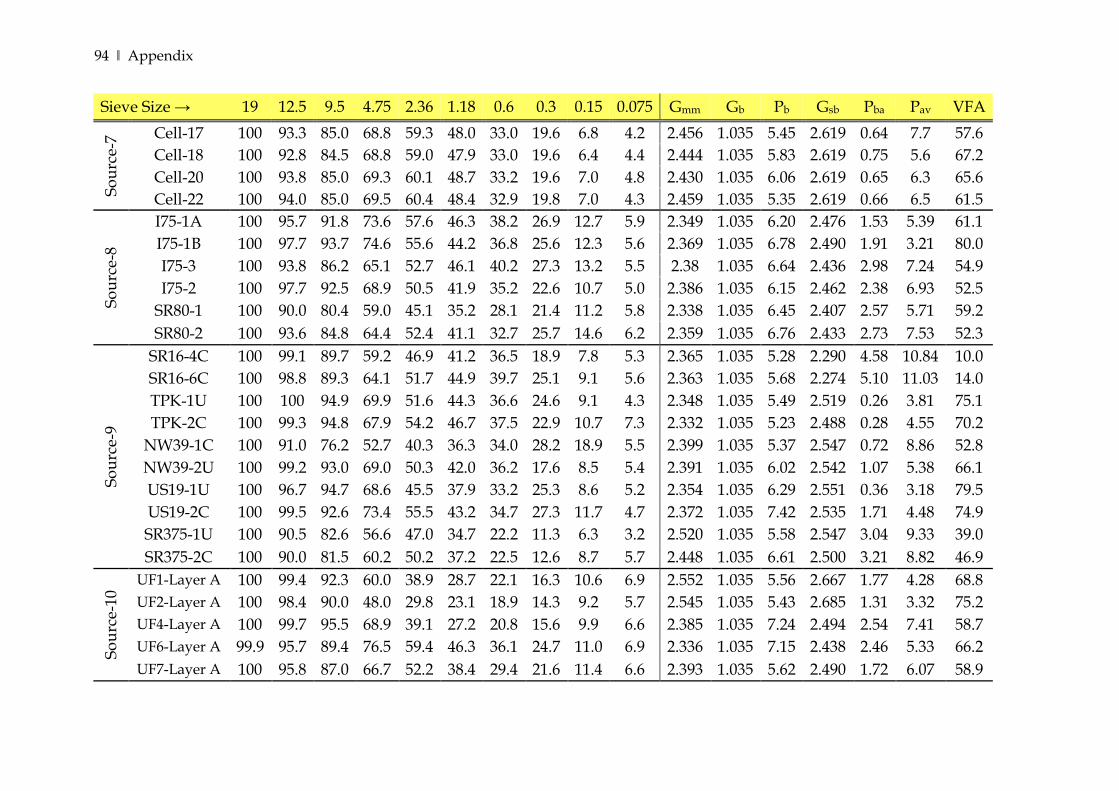
94 ‖ Appendix
Sieve Size → 19 12.5 9.5 4.75 2.36 1.18 0.6 0.3 0.15 0.075 Gmm Gb Pb Gsb Pba Pav VFA So
urce
-7 Cell-17 100 93.3 85.0 68.8 59.3 48.0 33.0 19.6 6.8 4.2 2.456 1.035 5.45 2.619 0.64 7.7 57.6
Cell-18 100 92.8 84.5 68.8 59.0 47.9 33.0 19.6 6.4 4.4 2.444 1.035 5.83 2.619 0.75 5.6 67.2 Cell-20 100 93.8 85.0 69.3 60.1 48.7 33.2 19.6 7.0 4.8 2.430 1.035 6.06 2.619 0.65 6.3 65.6 Cell-22 100 94.0 85.0 69.5 60.4 48.4 32.9 19.8 7.0 4.3 2.459 1.035 5.35 2.619 0.66 6.5 61.5
Sour
ce-8
I75-1A 100 95.7 91.8 73.6 57.6 46.3 38.2 26.9 12.7 5.9 2.349 1.035 6.20 2.476 1.53 5.39 61.1 I75-1B 100 97.7 93.7 74.6 55.6 44.2 36.8 25.6 12.3 5.6 2.369 1.035 6.78 2.490 1.91 3.21 80.0 I75-3 100 93.8 86.2 65.1 52.7 46.1 40.2 27.3 13.2 5.5 2.38 1.035 6.64 2.436 2.98 7.24 54.9 I75-2 100 97.7 92.5 68.9 50.5 41.9 35.2 22.6 10.7 5.0 2.386 1.035 6.15 2.462 2.38 6.93 52.5
SR80-1 100 90.0 80.4 59.0 45.1 35.2 28.1 21.4 11.2 5.8 2.338 1.035 6.45 2.407 2.57 5.71 59.2 SR80-2 100 93.6 84.8 64.4 52.4 41.1 32.7 25.7 14.6 6.2 2.359 1.035 6.76 2.433 2.73 7.53 52.3
Sour
ce-9
SR16-4C 100 99.1 89.7 59.2 46.9 41.2 36.5 18.9 7.8 5.3 2.365 1.035 5.28 2.290 4.58 10.84 10.0 SR16-6C 100 98.8 89.3 64.1 51.7 44.9 39.7 25.1 9.1 5.6 2.363 1.035 5.68 2.274 5.10 11.03 14.0 TPK-1U 100 100 94.9 69.9 51.6 44.3 36.6 24.6 9.1 4.3 2.348 1.035 5.49 2.519 0.26 3.81 75.1 TPK-2C 100 99.3 94.8 67.9 54.2 46.7 37.5 22.9 10.7 7.3 2.332 1.035 5.23 2.488 0.28 4.55 70.2
NW39-1C 100 91.0 76.2 52.7 40.3 36.3 34.0 28.2 18.9 5.5 2.399 1.035 5.37 2.547 0.72 8.86 52.8 NW39-2U 100 99.2 93.0 69.0 50.3 42.0 36.2 17.6 8.5 5.4 2.391 1.035 6.02 2.542 1.07 5.38 66.1 US19-1U 100 96.7 94.7 68.6 45.5 37.9 33.2 25.3 8.6 5.2 2.354 1.035 6.29 2.551 0.36 3.18 79.5 US19-2C 100 99.5 92.6 73.4 55.5 43.2 34.7 27.3 11.7 4.7 2.372 1.035 7.42 2.535 1.71 4.48 74.9 SR375-1U 100 90.5 82.6 56.6 47.0 34.7 22.2 11.3 6.3 3.2 2.520 1.035 5.58 2.547 3.04 9.33 39.0 SR375-2C 100 90.0 81.5 60.2 50.2 37.2 22.5 12.6 8.7 5.7 2.448 1.035 6.61 2.500 3.21 8.82 46.9
Sour
ce-1
0
UF1-Layer A 100 99.4 92.3 60.0 38.9 28.7 22.1 16.3 10.6 6.9 2.552 1.035 5.56 2.667 1.77 4.28 68.8 UF2-Layer A 100 98.4 90.0 48.0 29.8 23.1 18.9 14.3 9.2 5.7 2.545 1.035 5.43 2.685 1.31 3.32 75.2 UF4-Layer A 100 99.7 95.5 68.9 39.1 27.2 20.8 15.6 9.9 6.6 2.385 1.035 7.24 2.494 2.54 7.41 58.7 UF6-Layer A 99.9 95.7 89.4 76.5 59.4 46.3 36.1 24.7 11.0 6.9 2.336 1.035 7.15 2.438 2.46 5.33 66.2 UF7-Layer A 100 95.8 87.0 66.7 52.2 38.4 29.4 21.6 11.4 6.6 2.393 1.035 5.62 2.490 1.72 6.07 58.9