Embed Size (px)
DESCRIPTION
Ageing and the Tax Implied in Public Pension Schemes: Simulations for Selected OECD Countries*. Robert Fenge / Martin Werding Ifo Institute for Economic Research & CESifo. * Generous support by the Economic and Social Research Institute (ESRI) - PowerPoint PPT Presentation
Citation preview

Ageing and the Tax Implied in Public Pension Schemes:
Simulations for Selected OECD Countries*
Robert Fenge / Martin Werding
Ifo Institute for Economic Research & CESifo
* Generous support by the Economic and Social Research Institute (ESRI)of the Japanese Government is gratefully acknowledged.

The Impact of Ageing on Public Pensions
Concepts of measurement:
• Net pension liabilities
• General government fiscal balances
• Generational accounting
• “Implicit taxes”

Implicit taxes: definition #1
• Implicit tax falling on “generation t”: ITt = NPV (contributionst) – NPV (benefitst+1)
• Implicit tax rate: t = ITt / wt = [twt – pt+1 / (1+rt +1)] / wt =
)(1
111
1
)1)(1(1
t
tt
t
tt r
ng
• Extension to an N-period setting ...

Implicit taxes: definition #2
• straightforward from the simple algebra of pensions
• well-founded in pension theory (Sinn 2000): 0 < 0; N00 = –ID0; ID0 = Ntt, t = 1
• easy to apply to an empirical context (Thum / Weizsaecker 2000; Fenge / Werding 2001)
• suited to analyse welfare effects at an individual level

Implicit taxes: applicationto real-world pension schemes
• Financial projections for public pension schemes in selected OECD countries(CESifo Pension Model)
• Stylised biographies for representative individuals (covering disability pensions, old-age pensions, and survivor pensions)
• The rôle of assumptions ...
• Impact of policy responses
40%
45%
50%
55%
60%
65%
70%
75%
80%
1960 1965 1970 1975 1980 1985 1990 1995 2000 2005 2010 2015 2020 2025 2030 2035 2040 2045 2050
Year
Re
pla
ce
me
nt
rate
(%
of
ne
t e
arn
ing
s)
Pension reform act 1992
Govt. reform proposal 2000
Pension reform act 2002
The anatomy of our results: Germany #1

10%
12%
14%
16%
18%
20%
22%
24%
26%
28%
30%
1960 1965 1970 1975 1980 1985 1990 1995 2000 2005 2010 2015 2020 2025 2030 2035 2040 2045 2050
Year
Co
ntr
ibu
tio
n r
ate
(%
of
gro
ss
ea
rnin
gs
)
Pension reform act 1992
Govt. reform proposal 2000
Pension reform act 2002
The anatomy of our results: Germany #2

Incremental reforms: Germany
6%
8%
10%
12%
14%
16%
18%
20%
22%
1940 1945 1950 1955 1960 1965 1970 1975 1980 1985 1990 1995 2000
Age cohorts (by year of birth)
Imp
licit
ta
x r
ate
(%
of
life
tim
e e
arn
ing
s)
Pension reform act 1992
Govt. reform proposal 2000 (benefit level –15%)
Pension reform act 2002 (benefit level –10%)

Fixing contribution rates: Austria
6%
8%
10%
12%
14%
16%
18%
20%
22%
24%
1940 1945 1950 1955 1960 1965 1970 1975 1980 1985 1990 1995 2000
Age cohorts (by year of birth)
Imp
licit
ta
x r
ate
(%
of
life
tim
e e
arn
ing
s)
Fixed contribution rate
Fixed level of benefits

CPI indexation (p. after award): France
2%
4%
6%
8%
10%
12%
14%
16%
18%
20%
22%
24%
1940 1945 1950 1955 1960 1965 1970 1975 1980 1985 1990 1995 2000
Age cohorts (by year of birth)
Imp
licit
ta
x r
ate
(%
of
life
tim
e e
arn
ing
s)
Current law
Pre-1993 law
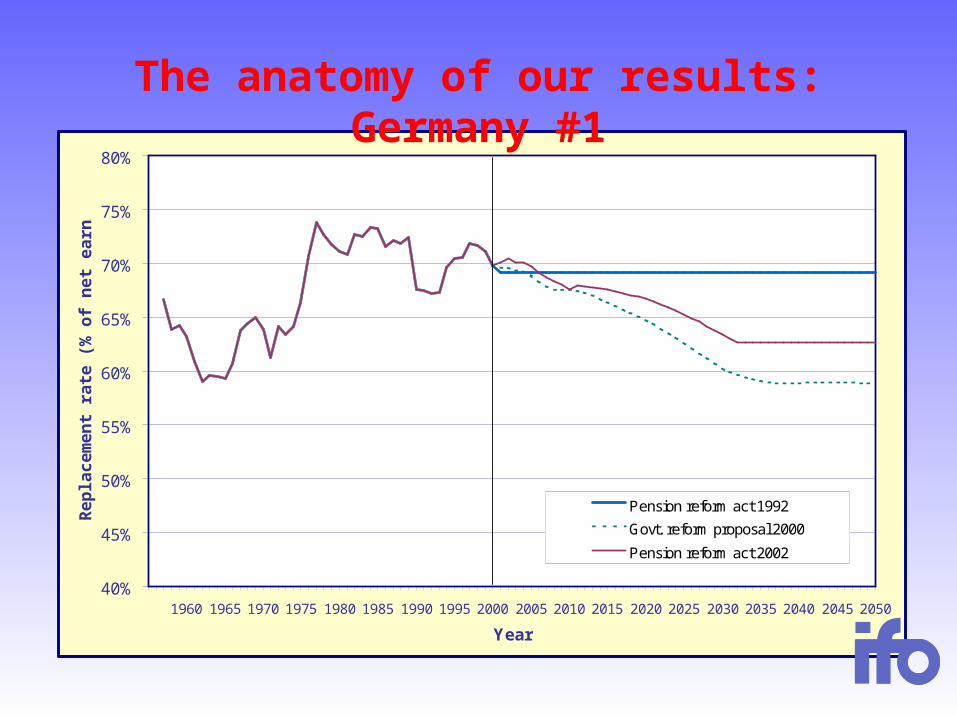
CPI indexation (p. at award): UK
-4%
-2%
0%
2%
4%
6%
8%
10%
12%
14%
16%
18%
20%
1940 1945 1950 1955 1960 1965 1970 1975 1980 1985 1990 1995 2000
Age cohorts (by year of birth)
Imp
licit
ta
x r
ate
(%
of
life
tim
e e
arn
ing
s)
High Earnings
Average Earnings
Low Earnings

Partial pre-funding: USA
-2%
0%
2%
4%
6%
8%
10%
12%
14%
16%
1940 1945 1950 1955 1960 1965 1970 1975 1980 1985 1990 1995 2000
Age cohorts (by year of birth)
Imp
licit
ta
x r
ate
(%
of
life
tim
e e
arn
ing
s) Trust fund
Pure PAYG

A “funded” system: Japan
-8%
-6%
-4%
-2%
0%
2%
4%
6%
8%
10%
12%
14%
16%
18%
20%
1940 1945 1950 1955 1960 1965 1970 1975 1980 1985 1990 1995 2000
Age cohorts (by year of birth)
Imp
licit
ta
x r
ate
(%
of
life
tim
e e
arn
ing
s)
Status quo 1999: constant level of benefits
Reform 2000: level of benefits -15%

Concluding remarks
• Not surprisingly, ageing causes a general upward trend in implicit tax rates
• Levels and curvatures of tax profiles are highly country-specific
• Effectiveness of different policy measures can be illustrated
• Is tax smoothing useful?

Annex

The standardised agent’s biography*
* Basic assumptions for the case of Germany. Probability of disablement andconditional life expectancies adapted to national averages.

UK: The impact of wage indexation
-4%
-2%
0%
2%
4%
6%
8%
10%
12%
14%
16%
18%
20%
1940 1945 1950 1955 1960 1965 1970 1975 1980 1985 1990 1995 2000
Age cohorts (by year of birth)
Imp
licit
ta
x r
ate
(%
of
life
tim
e e
arn
ing
s)
High Earnings
Average Earnings
Low Earnings

UK: The effects of contracting-out
-4%
-2%
0%
2%
4%
6%
8%
10%
12%
14%
16%
18%
20%
1940 1945 1950 1955 1960 1965 1970 1975 1980 1985 1990 1995 2000
Age cohorts (by year of birth)
Imp
licit
ta
x r
ate
(%
of
life
tim
e e
arn
ing
s)
Average Earnings (Contracted in)
Average Earnings (Contracted out)Earnings uprating
Price Uprating