Embed Size (px)
Citation preview

AGEC/FNR 406 LECTURE 5
Collecting fragments of coal in a rail yard in China

Demand
Demand arises as the combination of two forces:
1. an individual’s desire to acquire something2. the purchasing power to acquire it
Patterns of demand are used by economists to infer the value of goods by individuals and society
(e.g. cars, national parks, clean water).
Demand is the desire for a good or service plus the willingness and ability to acquire it.
Demand CurveDecreasing marginal utility combined with substitution between goods leads to a demand curve that slopes downward.
Q
P
As price falls, quantity demanded increases.
Conversely, as price rises, demand falls.
D

Demand Curve
A demand curve measures marginal values based on an individual’s willingness to pay for additional units of a good.
Each point on the curve represents the PRIVATE value of a unit to a consumer.
Q
P
D
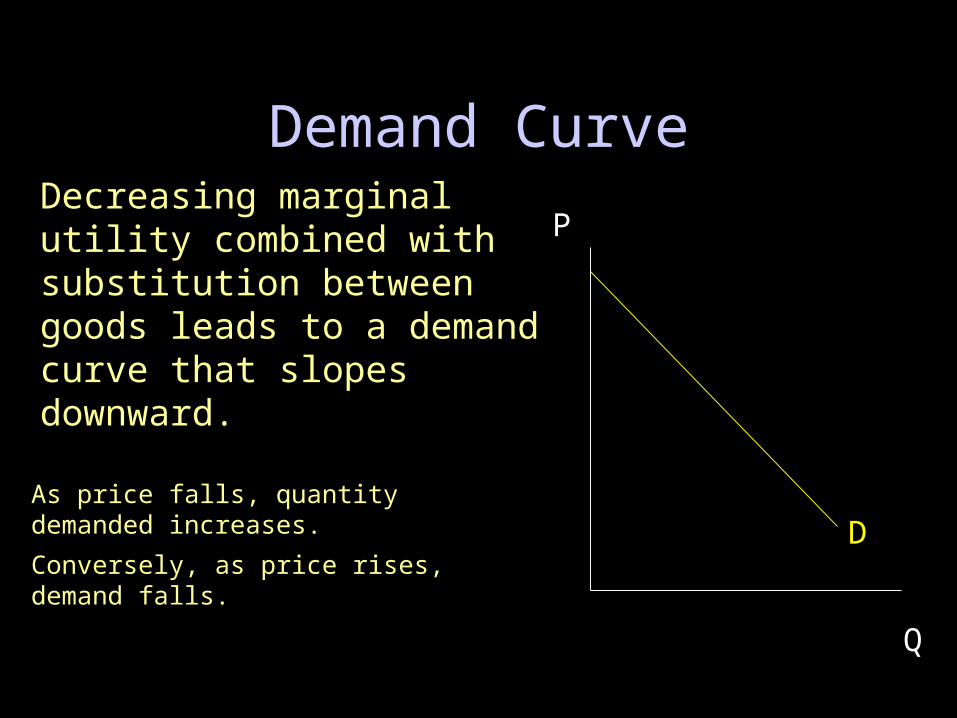
Features of demand curves
Q
P1. Downward sloping.
D
2. A function of price, income, and tastes.
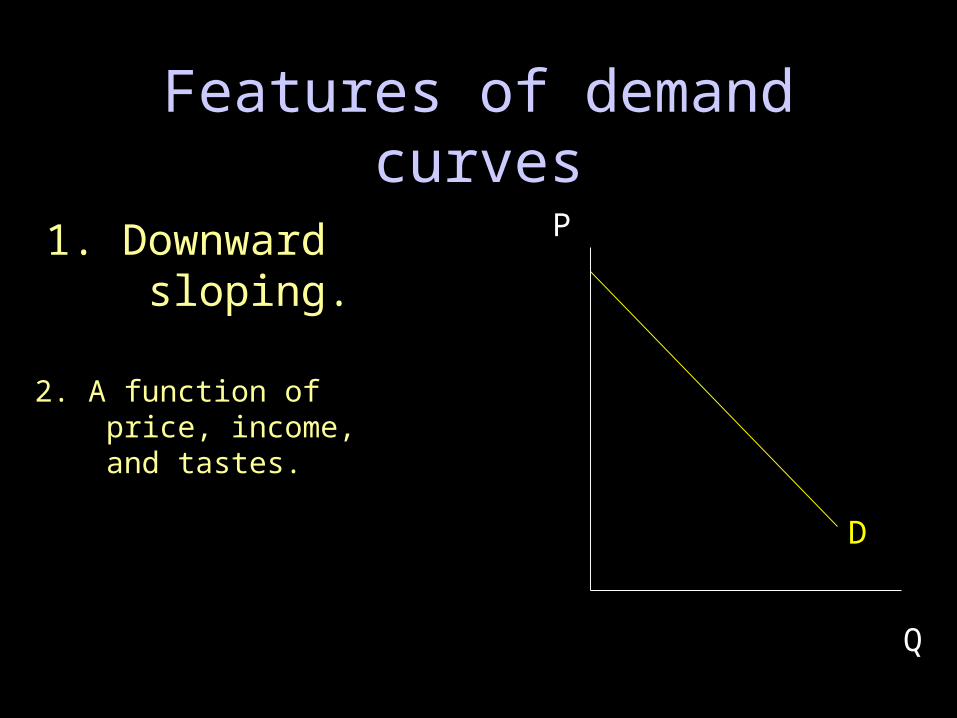
Changes in demand
Q
P1. A price change induces a movement along the demand curve
D
•••••••••••••
Changes in demand, continued
Q
P
D
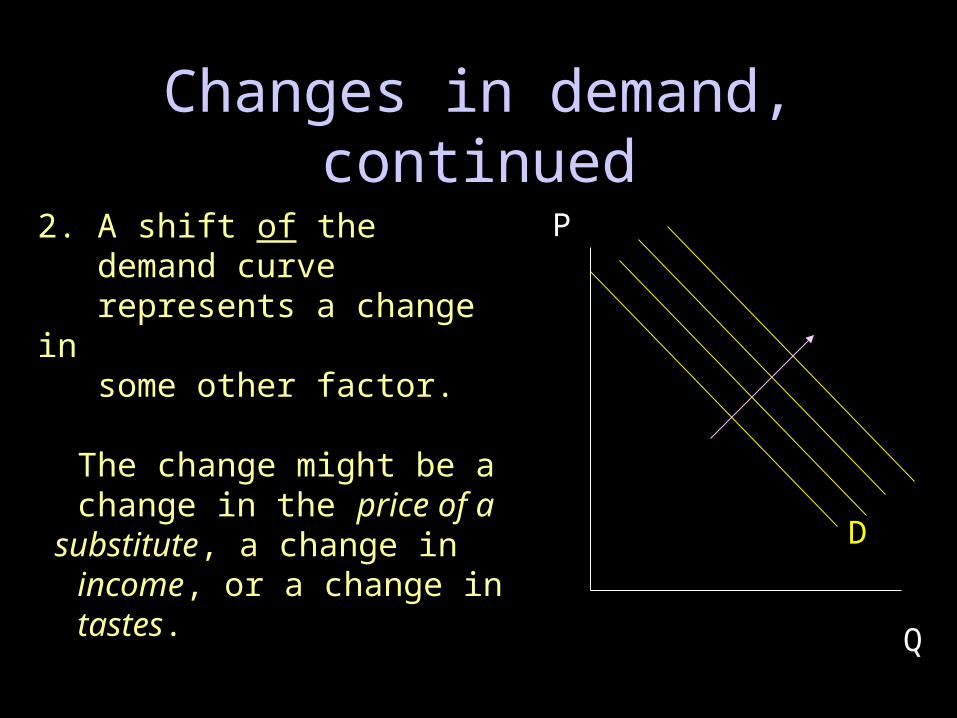
2. A shift of the demand curve represents a change in some other factor.
The change might be a change in the price of a substitute, a change in income, or a change in tastes.

Example: sunscreen
Q
P Q: Suppose the price of sunscreen falls from P1
to P2. What happens?
D
•
•
P1
P2
Q1 Q2
A: The price reduction leads to greater demand, so the quantity goes up from Q1 to Q2.

Example: sunscreen
Q
P Q: Now suppose it is reported that a hole in the ozone has appeared over West Lafayette. What happens?
D
• •P1
Q1 Q2
A: The news leads to a shift in the demand curve. More sunscreen is demanded at the old price.

Market demand curveA market demand curve is a horizontal summation
of individual demand curves:
Q
P
D
Individual 1
D D
1 2 3
Individual 2 Market
(1 unit) (2 units) (3 units)
Indirect measurement of demand
It is often the case that one cannot easily place a $ value on the environment.
However, it may be possible to value the environment, or environmental services, by examining the market for closely related goods, i.e. substitutes or complements.
For example, the value of a clean stream might be estimated by annual expenditures by fly fishermen.
Key points regarding demand
1. The demand curve represents a marginal value function (i.e. values of additional units)
2. The demand curve can be thought of as measuring the “willingness to pay”.
3. The demand curve represents only the BUYER’s side of the market (“private”).
4. The negative relationship between price and quantity reflects diminishing marginal utility.