Embed Size (px)
Citation preview

AGEC 640Agricultural Development and Policy
Introduction to Agricultural PolicySeptember 2, 2014
Today:– Farm and food problems:
the development paradox and structural transformation
Thursday:– Population growth and demographic transition

Readings for this week
• Norton, Alwang & Masters, “Economic Transformation and Growth”, ch. 6 in Economics of Agricultural Development.
• Tomich, Kilby and Johnston, "Poverty and the Rural Economy" and "Structural Transformation", in Transforming Agrarian Economies.
• Montgomery, “Notes on the Demographic Transition.”

Introduction to Agricultural Policy:Farm problems and food problems
• First, some brainstorming:– What kinds of problems are addressed by ag. policy?
– What kinds of solutions are offered by policymakers?

Source: World Bank data, reprinted from UNEP/GRID-Arendal Maps and Graphics Library (http://maps.grida.no/go/graphic/world-bank-country-income-groups).
Where do we see what types of policy?

When do we see what types of policy?
Source: K. Anderson (2006), “Reducing Distortions to Agricultural Incentives: Progress, Pitfalls and Prospects.” <www.worldbank.org/agdistortions>. Data shown are an index of export prices in US dollars for all major traded agricultural products, deflated by the MUV index which is the unit value of manufactures exported from France, Germany, Japan, UK and US, with weights based on those countries’ exports to developing countries.
Index of real international food prices, 1900 to 2005 (1977-79 =100)

…and within the U.S., for an even longer historical period
Source: Unpublished file data from Prof. R.E. Evenson (2004).
Ratio of U.S. farm prices to prices of all goods and services in the U.S.

This is the usual pattern: the “development paradox”
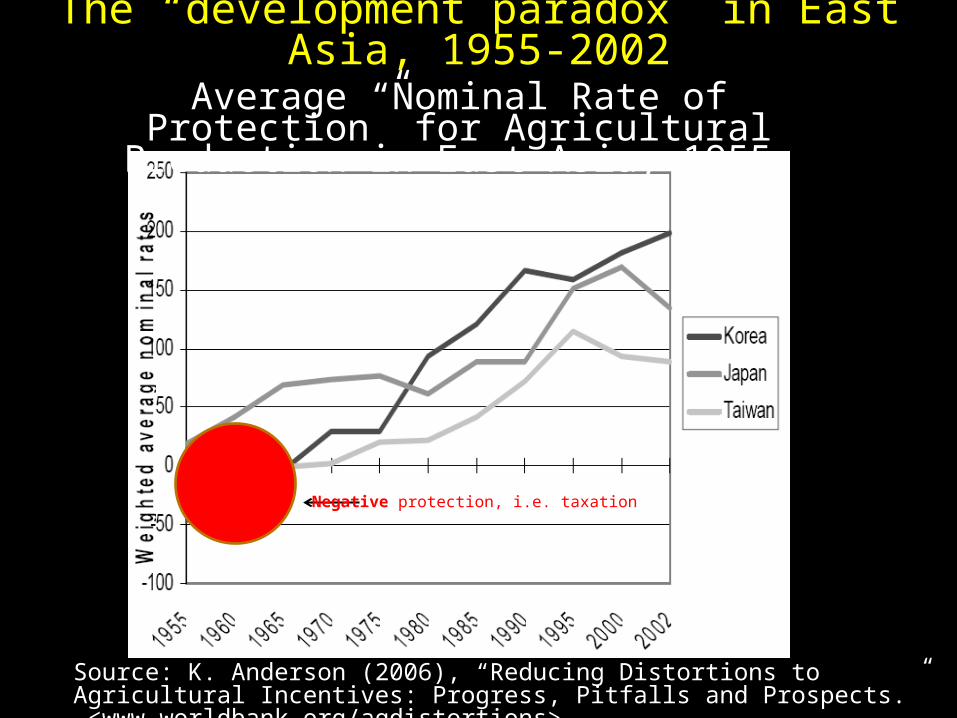
Average “Nominal Rate of Protection” for Agricultural Production in East Asia, 1955-2002
Source: K. Anderson (2006), “Reducing Distortions to Agricultural Incentives: Progress, Pitfalls and Prospects.” <www.worldbank.org/agdistortions>
The “development paradox” in East Asia, 1955-2002
Negative protection, i.e. taxation
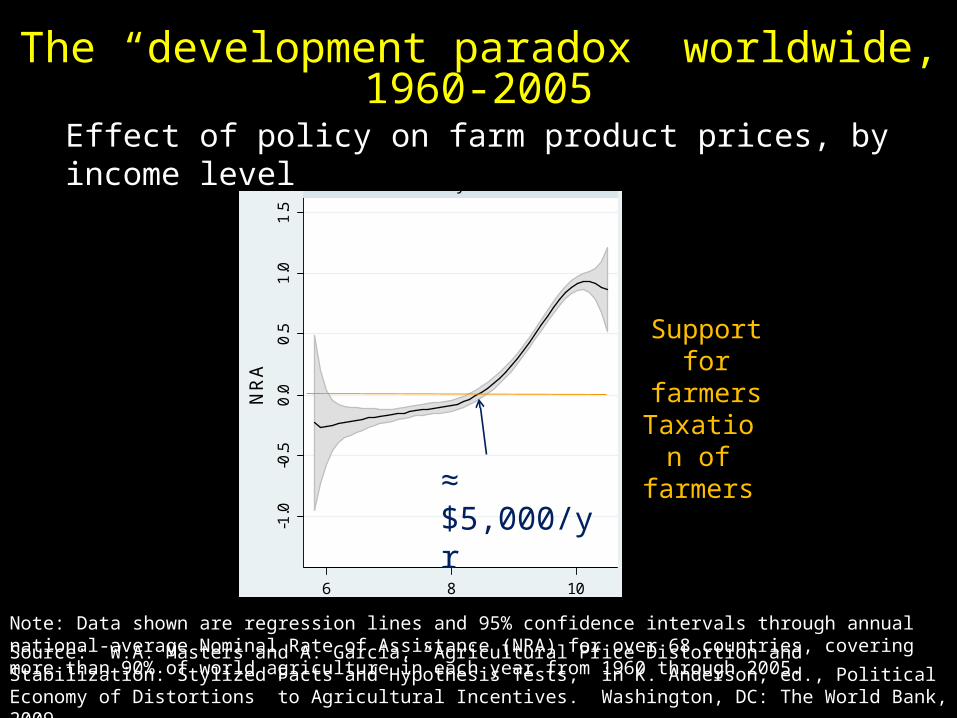
The “development paradox” worldwide, 1960-2005
-1.0
-0.5
0.0
0.5
1.0
1.5
6 8 10 6 8 10
All Primary Products Tradables
All Primary Products Exportables Importables
NR
A
Income per capita (log)
Effect of policy on farm product prices, by income level
Note: Data shown are regression lines and 95% confidence intervals through annual national-average Nominal Rate of Assistance (NRA) for over 68 countries, covering more than 90% of world agriculture in each year from 1960 through 2005.
Source: W.A. Masters and A. Garcia, “Agricultural Price Distortion and Stabilization: Stylized Facts and Hypothesis Tests,” in K. Anderson, ed., Political Economy of Distortions to Agricultural Incentives. Washington, DC: The World Bank, 2009.
Taxation of farmers
Support for farmers
≈ $5,000/yr

Why is this pattern paradoxical?

The development paradox: employment and earnings
Source: Reprinted from World Bank, World Development Report 2008. Washington, DC: The World Bank (www.worldbank.org/wdr2008)

Source: Reprinted from T.P. Tomich. P. Kilby and B.F. Johnston, 1995. Transforming Traditional Agriculture. Ithaca, NY: Cornell University Press.
Share of output from agriculture and mining in eight high-income countries, 1860-1960
From the Tomich, Kilby and Johnston reading…
What happens next?Does the share fall to zero?

Source: Reprinted from T.P. Tomich. P. Kilby and B.F. Johnston, 1995. Transforming Traditional Agriculture. Ithaca, NY: Cornell University Press.
Share of output from industry in eight high-income countries, 1860-1960
The structural transformation is from agriculture to industry…
…but what happens
next to industry’s
share?

…over the full span of development, employment shifts to services…
Source: U.S. Economic Report of the President 2007 (www.gpoaccess.gov/eop)
Percent of workforce by sector in the United States, 1800-2005
in 1800, employment was 90% farming
today, about 80% of US jobs are in services
in 1930s-70s, industry
reached about
40%
agricultural employment has stabilized

Another example of structural transformation over the long run…
Percent of GDP by sector in Australia, 1901-2000
Source: Government of Australia (2001), Economic Roundup – Centenary Edition, Department of the Treasury, Canberra.

Agricultural Employment as a Share of Civilian Employment and Real Farm Output as a Share of Real GDP
SOURCE: U.S. Department of Commerce and the Federal Reserve Bank of St. Louis. Reprinted from K.L. Kliesen and W. Poole, 2000. "Agriculture Outcomes and Monetary Policy Actions: Kissin' Cousins?" Federal Reserve Bank of Sf. Louis Review 82 (3): 1-12.
As agriculture’s share of the economy declines, does farm income also fall?
Until the 1930s, employment and output fell together
…then employment fell much faster than output
and then both stopped falling

The US farm-nonfarm earnings gap, 1910-2000
Source: BL Gardner, 2000. “Economic Growth and Low Incomes in Agriculture.” AJAE 82(5): 1059-1074.
Th
ou
san
ds o
f 1
99
2 d
ollars
per
farm
Perc
en
t of
non
-farm
in
com
e
Farm income fell…
then caught up

Structural transformation: the story so far…
(1) Farming declines as a fraction of the economy, as industry and services grow
(2) Farmers’ incomes decline relative to other workers, but then catch up –in the U.S., • farmers’ incomes began to catch up in 1933• farmers’ incomes passed non-farmers in 1990s
(3) What happens within agriculture?

Does total world agricultural output decline?
Source: Reprinted from FAO, State of Food and Agriculture 2007. Rome: FAO (www.fao.org)

The structural transformation in world trade:Agriculture’s share fell while its value rose
Source: Reprinted from FAO, State of Food and Agriculture 2007. Rome: FAO (www.fao.org)

US GDP from Farm and Nonfarm Businesses, 1929-2004(Billions of 2000 US dollars)
0
10
20
30
40
50
60
70
80
90
100
1930
1935
1940
1945
1950
1955
1960
1965
1970
1975
1980
1985
1990
1995
2000
0
1,000
2,000
3,000
4,000
5,000
6,000
7,000
8,000
9,000
10,000
Farm value added (left scale)
Non-farm businesses value added (right scale)
Source: U.S. Bureau of Economic Analysis, Table 1.3.6 <www.bea.doc.gov>.
Far
m v
alue
add
ed (20
00 U
S$
b.)
Non
-far
m b
usin
ess
(200
0 U
S$
b.)
Does U.S. agricultural output decline?

Farm output and agricultural exports in the United States, 1945-2006
120
140
160
180
200
220
240
260
280
1945 1950 1955 1960 1965 1970 1975 1980 1985 1990 1995 2000 2005
0
20
40
60
80
100
120
140
160
Farm market receipts (2000 US$ b.) [left scale]
Agric. exports (2000 US$ b.) [right scale]
Source: Farm receipts are from US Economic Report of the President 2007 (w w w .gpoaccess.gov/eop), Table B-97; exports are from USDA, Foreign Agricultural Trade of the United States (w w w .ers.usda.gov/Data/FATUS). Both converted to constant dollars using GDP deflator.
Source: Farm receipts are from US Economic Report of the President 2007 (www.gpoaccess.gov/eop), Table B-97; exports are from USDA, Economic Research Service (www.ers.usda.gov/Data/FATUS). Both are converted to constant dollars using GDP deflator from Bureau of Economic Analysis (www.bea.gov).
What happens to increases in U.S. output?
≈12-25% exported
≈25-30% exported

The bulk commodity business fluctuates, while value-added exports grow
Fig. 1.3 U.S. Agricultural Exports by Category, 1970-2004(billions of U.S. dollars)
0
5
10
15
20
25
30
35 Bulk
Intermediate
Consumer-Oriented
Source: USDA, Economic Research Service, Foreign Agricultural Trade of the United States (www.ers.usda.gov/Data/FATUS).

Within agriculture, the structural transformationbrings specialization for inputs and marketing
Source: Reprinted from World Bank, World Development Report 2008. Washington, DC: The World Bank (www.worldbank.org/wdr2008)

The stylized facts of structural transformation
(1) Farming declines as a fraction of the economy, as industry and services grow
(2) Farmers’ incomes decline relative to other workers, but then catch up
(3) Within agriculture, row-crop production fluctuates while agroprocessing and agribusiness grows
… but what drives this change? what explains it?

Explaining Structural Transformation
Can consumers’ income growth explain the shift?– Engel’s law
• As income grows, demand increases less for food and ag. products than for other things
– The income-consumption curve for food is relatively flat– Income elasticity of demand for food < 1
– Bennett’s law • As income grows, demand increases least for basic staples and
rises for higher value foods– The income-consumption curve for staples is very flat– Income elasticity of demand for staples ≈ 0
– Evidence for “increasing demand for variety”

Engel’s Law for (Global) Food
Source: “Food Shares in Consumption: New Evidence Using Engel Curves for the Developing World”Rafael De Hoyos and Rebecca Lessem (2008) https://mywebspace.wisc.edu/rlessem/web/engel.pdf

Engel’s Law for food in Vietnam
Source: Le, Canh Quang (2008) “An Empirical Study of Food Demand in Vietnam” ASEAN Economic Bulletin 25(3): 283-292.
For the poorest group (Q1), meat is a luxury; For the richest (Q5) it is a normal goodFor all income groups in Vietnam, rice appears to be a normal good.

Explaining Structural Transformation
Can new technology explain the shift?– New farm technology: “Cochrane’s Treadmill”
• New farm technologies that increase output might lower prices and “push” farmers out
• The demand curve for food is relatively steep– Food demand is price-inelastic: – Price elasticity for food < 1 in absolute value
– Non-farm technology: bright lights, big city• New nonfarm technologies that create opportunities might
“pull” farmers into nonfarm work– Are we living in a “Harris-Todaro” world?
• The demand curve for non-food is not as flat as for food– Non-food demand is price-elastic– Price elasticity for non-food >1 in abs. value

Engel’s Law for manufactured goods in Malaysia
Source: Siddique, M. A. B. (1997) “Demand for machinery and manufactured goods in Malaysia” Mathematics and Computers in Simulation 43(3-6): 481-486.

Limited land area may matter most of all:– Because total land area is fixed,
• farmers’ savings and investment eventually runs out of uses on the farm, and is applied to other uses
• farmers’ earnings are linked to the number of farmers, acres per farmer and earnings per acre
– As # farmers grows…– Acres per farmer declines…– earnings per acre falls and earnings per farmer falls
» Until ???
Explaining Structural Transformation
Conclusions and the road ahead
• Ag policies vary widely but show some regularities over time & across countries
• A key regularity is the “development paradox”:– In poor countries, policies often try to reduce food prices– In richer countries, usually switch to raise farm incomes
• This is closely linked to “structural transformation”,– from farm to non-farm employment and earnings– which in turn is closely linked to…
• Thursday’s topic: the “demographic transition”– from high to low rates of deaths and births