Embed Size (px)
Citation preview

Scholars' Mine Scholars' Mine
Masters Theses Student Theses and Dissertations
Spring 2007
Age strengthening of gray cast iron: alloying effects and kinetics Age strengthening of gray cast iron: alloying effects and kinetics
study study
Thottathil Viswanathan Anish
Follow this and additional works at: https://scholarsmine.mst.edu/masters_theses
Part of the Metallurgy Commons
Department: Department:
Recommended Citation Recommended Citation Anish, Thottathil Viswanathan, "Age strengthening of gray cast iron: alloying effects and kinetics study" (2007). Masters Theses. 4554. https://scholarsmine.mst.edu/masters_theses/4554
This thesis is brought to you by Scholars' Mine, a service of the Missouri S&T Library and Learning Resources. This work is protected by U. S. Copyright Law. Unauthorized use including reproduction for redistribution requires the permission of the copyright holder. For more information, please contact [email protected].


AGE STRENGTHENING OF GRAY CAST IRON: ALLOYING EFFECTS AND KINETICS STUDY
by
THOTTATHIL VISWANATHAN ANISH
A THESIS
Presented to the Faculty of the Graduate School of the
UNIVERSITY OF MISSOURI-ROLLA
In Partial Fulfillment of the Requirements for the Degree
MASTER OF SCIENCE IN METALLURGICAL ENGINEERING
2007
Approved by
_______________________________ _______________________________ Dr. Von L Richards Dr. Kent Peaslee
_______________________________ Dr. Susan Murray

iii
ABSTRACT
Age strengthening of gray cast iron has become a critical issue with metal casters trying
to optimize their process for the closest conformance to properties. This necessitated
more robust and precise methods to predict age strengthening. Most foundries use age
strengthening behavior to cast at higher carbon equivalents to facilitate smaller gating
systems. Also, it is well known in the casting industry that the tool life improves with
aging. Hence these foundries require a model to predict aging behavior and accelerate the
mechanism from days to hours. This research focuses on the methods of composition
adjustments to control aging properties, creating a model to predict the aging behavior at
different temperatures and understanding the mechanism of aging.
Effect of nitride formers Ti, Al and B on aging behavior was evaluated. The results
indicated the strong effect of Ti and Al to suppress aging. The role of Ti was analyzed
further to understand the thermodynamics of aging process. The results from this study
showed a direct correlation of iron nitride formation and aging.
The kinetics of aging was studied by evaluating aging behavior at room and elevated
temperatures (100°C, 182°C and 285°C). Tensile strength-temperature-time curves were
described using Arrhenius and Avrami-Johnson-Mehl kinetics and an attempt was made
to create a predictive model for age strengthening in gray iron and to explain the
mechanism behind it. The activation energy for diffusion of nitrogen in gray cast iron at
temperatures below 150oC was found to be 60kJ/mol and at temperatures more than
200oC was found to be 34kJ/mol.

iv
ACKNOWLEDGMENTS
First and foremost, I would like to thank Dr. Von Richards for his guidance and support
throughout my curriculum at the University of Missouri – Rolla. Not only has he given
me the opportunity to excel in a graduate program, but he also gave me the opportunity to
write papers, attend conferences, and meet with professionals of the industry.
I would like to thank my committee members, Dr. Kent Peaslee and Dr. Susan Murray,
for their assistance in my master’s program. I would like to express my sincere gratitude
to Dr. David Van Aken and Dr. Scott Miller for their valuable time and expertise to help
me. Also, my thanks go to Dr. Simon Lekakh for the sincere support throughout my
research. Not only has he helped me on my research papers, but also when I was unable
to find enough hands to pour iron. I wish to thank all the staff members at the University
of Missouri – Rolla, but mostly Denise Eddings, Joyce Erkiletan and Paula Cochran who
gave me terrific help in a lot of administrative and logistic aspects.
My sincere thanks go to the people who worked with me in the foundry over the last two
years: Brandon Kruse, Darryl Webber, Siddharth Gupta, Hank Rawlins, Mangesh
Vibhandik, Jared Teague and Ed Druschitz. Thanks to all the undergraduate research
assistants who provided great cooperation during my research. I want to thank all of my
friends here in Rolla.
This thesis is dedicated to my parents. Without them, I would not have been able to
reach this achievement.

v
TABLE OF CONTENTS
Page
ABSTRACT....................................................................................................................... iii
ACKNOWLEDGMENTS ................................................................................................. iv
LIST OF ILLUSTRATIONS............................................................................................ vii
LIST OF TABLES............................................................................................................. ix
1. INTRODUCTION...................................................................................................... 1
1.1. BACKGROUND ................................................................................................ 1
1.2. LITERATURE REVIEW ................................................................................... 4
1.2.1 Aging process ............................................................................................ 4
1.2.2. Iron nitride precipitation........................................................................... 6
1.2.3. Nitride formers. ........................................................................................ 7
1.2.4. Solubility of nitrogen in cast irons. .......................................................... 8
2. EXPERIMENTAL PROCEDURE........................................................................... 10
2.1. EXPERIMENTAL DESIGN ............................................................................ 10
2.1.1. Alloying effects study ............................................................................ 10
2.1.2. Kinetics study. ........................................................................................ 12
2.2. MELTING PROCEDURE AND SAMPLE PREPARATION......................... 15
2.2.1. Alloying effects study ............................................................................ 15
2.2.2. Kinetics study. ........................................................................................ 17
2.2.2.1. Artificial aging. ......................................................................... 18
2.3. TESTING.......................................................................................................... 18
3. RESULTS................................................................................................................. 20
3.1. EFFECT OF ALLOYS ..................................................................................... 20
3.2. KINETICS STUDY.......................................................................................... 23
4. DISCUSSION OF RESULTS.................................................................................. 26
4.1. EFFECT OF NITRIDE FORMING ALLOYS ON AGING BEHAVIOUR.... 26
4.1.1. The effect of electropositive elements on nitrogen. ............................... 27
4.1.2. Thermodynamics of age strengthening. ................................................. 34
4.1.3 SEM analysis........................................................................................... 40

vi
4.2. KINETICS OF AGE STRENGTHENING....................................................... 43
4.3. MECHANISM OF AGE STRENGTHENING ................................................ 47
5. CONCLUSIONS ...................................................................................................... 50
APPENDICES .................................................................................................................. 51
A. COMPOSITION EFFECTS ON AGE STRENGTHENING OF GRAY IRON .. 52
B. AGE STRENGTHENING OF GRAY IRON – KINETICS STUDY................... 64
BIBLIOGRAPHY............................................................................................................. 82
VITA……………………………………………………………………………………..84
vii
LIST OF ILLUSTRATIONS
Figure Page
Figure 1.1. Effect of aging on machinability5.................................................................... 3
Figure 1.2. Differential scanning calorimetry results showing a difference curve
generated by running a high nitrogen specimen in the reference cell and a non-aging
specimen in the sample cell7 ........................................................................................ 4
Figure 1.3. Fe-N system (Karin Frisk, 1987)...................................................................... 6
Figure 2.1. Forecast of aging kinetics by using Avrami-Johnson-Mehl equation ........... 14
Figure 3.1. Change in tensile strength with titanium variations at two levels of nitrogen 22
Figure 3.2. Tensile strength of iron during aging. (a) at room temperature (b) at 100°C (c)
at 182°C and (d) at 285°C .......................................................................................... 24
Figure 3.3. Brinell hardness of iron during aging. (a) at room temperature (b) at 100°C (c)
at 182°C and (d) at 285°C .......................................................................................... 25
Figure 4.1. The effect of nitrogen on age strengthening: (Note that the vertical axis is the
difference between the tensile strength within the first day and the tensile strength
after 20 days natural aging.)....................................................................................... 28
Figure 4.2. The effect of titanium on age strengthening: this is the strongest variable in
terms of correlation coefficient and agrees with previous work using foundry irons 29
Figure 4.3. The effect of aluminum in this data set is to suppress age strengthening ...... 29
Figure 4.4. Estimate of free nitrogen in high titanium alloys as a controlling variable for
age-strengthening ....................................................................................................... 31
Figure 4.5. Estimate of free nitrogen in low titanium heats as a controlling variable for
age-strengthening ....................................................................................................... 31
Figure 4.6. Effect of estimated free nitrogen on aging ..................................................... 34
Figure 4.7. Interactions of titanium in iron melt with different initial concentrations of
nitrogen ...................................................................................................................... 36
Figure 4.8. Equilibrium of iron and titanium nitrides in solid irons with different initial
nitrogen levels (a - 0.004%N and b - 0.009%N) as a function of temperature and
titanium concentration................................................................................................ 38
viii
Figure 4.9. Combined influence of temperature and titanium of potential percentage of
iron nitride formation during natural aging................................................................ 39
Figure 4.10. Comparison of experimentally measured age strengthening effect with
predicted formation of iron nitride............................................................................. 40
Figure 4.11. EDS map of sample from Heat 6 from Table 3.1......................................... 41
Figure 4.12. TiN inclusion in Heat 6 of Table 6 and EDS spectra of the same................ 42
Figure 4.13. Age hardening data graphed assuming standard Avrami kinetics................ 45
Figure 4.14. Arrhenius plot of iron aging kinetics........................................................... 46
ix
LIST OF TABLES
Table Page
Table 2.1. Design matrix for 16 heats (ALAP= As Low As Possible)............................. 10
Table 2.2. Base composition to achieve a nominally class 30 gray cast iron, weight %.. 11
Table 2.3. Design matrix for 8 heats to establish titanium-nitrogen effect....................... 12
Table 2.4. Heat treatment time and temperature parameters ............................................ 15
Table 2.5. Concentration of elements (weight %) in high purity iron bars ...................... 16
Table 3.1. Results summary – 16 heats (compositions - weight %) ................................. 20
Table 3.2. Results summary – 8 heats (compositions - weight %) ................................... 21
Table 4.1. Multiple variable regression model ................................................................. 26
Table 4.2. Multiple variable regression model of the statistical effects of titanium and
nitrogen ...................................................................................................................... 33
Table 4.3. Comparison of iron chemistry and aging time at room temperature ............... 44

1. INTRODUCTION
1.1. BACKGROUND
The age strengthening of gray cast iron was first reported by Ebner in 19631. Later,
Nicola and Richards (1999) demonstrated statistically that significant age strengthening
occurs in most gray cast iron alloys2. The increase in tensile strength ranged from 3.3%
to 13.5% in this work. The rate of increase follows an Avrami-Johnson-Mehl curve, so
that much of the change occurs in the first few days. Also, during this phase of research
the nitrogen in excess of the stoichometric amount to combine with Ti as titanium nitrides
was found to be an important factor affecting the level of age strengthening. Nicola and
Richards proposed that age strengthening was related to the interaction of nitrogen with
dislocations. The diffusivity of nitrogen in iron is significant at room temperature to
facilitate these mechanisms3.
In Phase II of this study, Richards et al (2000) verified the effect of nitrogen as a strength
enhancer and that the presence of a strong nitride former (such as Ti) can reduce the
strengthening effect in iron, but did not fully eliminate the aging4. The possibilities of
precipitation of nitrides in the solid state and nitrogen in interstitial interaction with
dislocations have been mentioned by Leslie (1981). Leslie (1981) also noted the
development of substitutional-interstitial defect clusters, similar to those formed in steel.
The main substitutional atoms considered were Mn, Cr, Si, and Mo, although V, Ti and
Al can form similar clusters. These clusters interact with dislocations producing
strengthening, the magnitude of which is less compared to age strengthening due to
precipitation processes. Nicola et al (2000) indicated the presence of iron nitride and/or
carbo-nitride were critical for aging. The presence of titanium did not appear to enhance
or retard the age strengthening provided that nitrogen is in excess of that required for a
stoichometric titanium nitride compound.
2
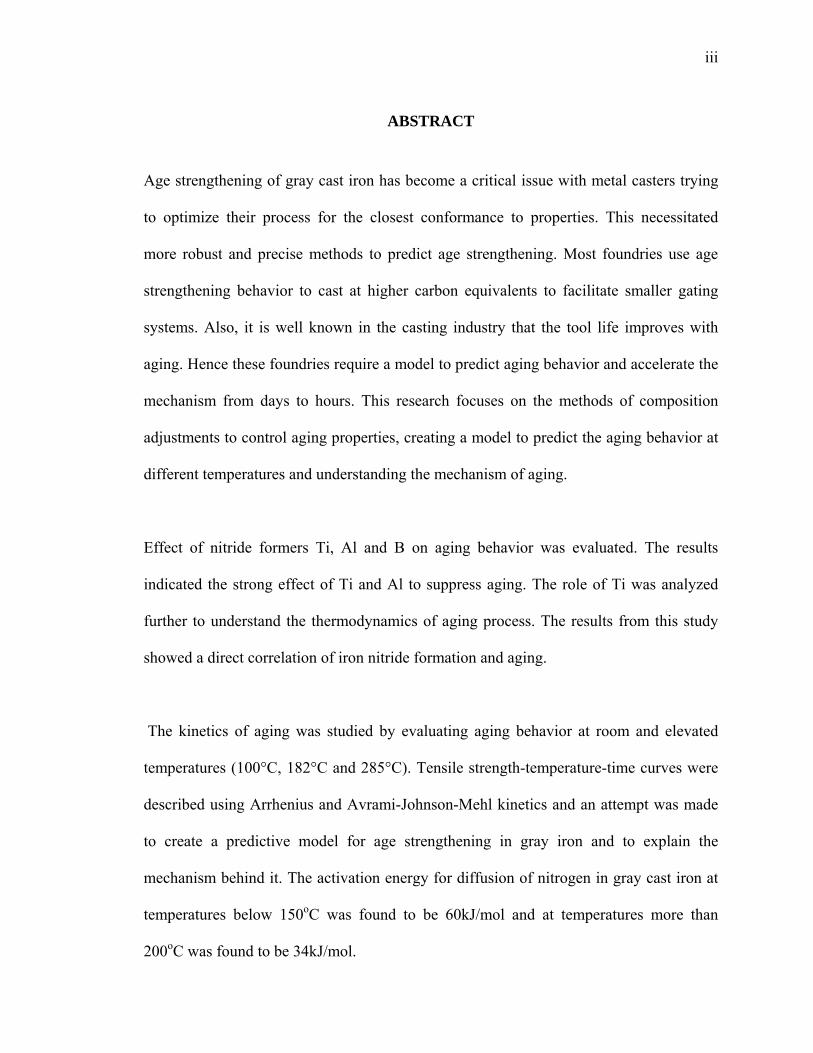
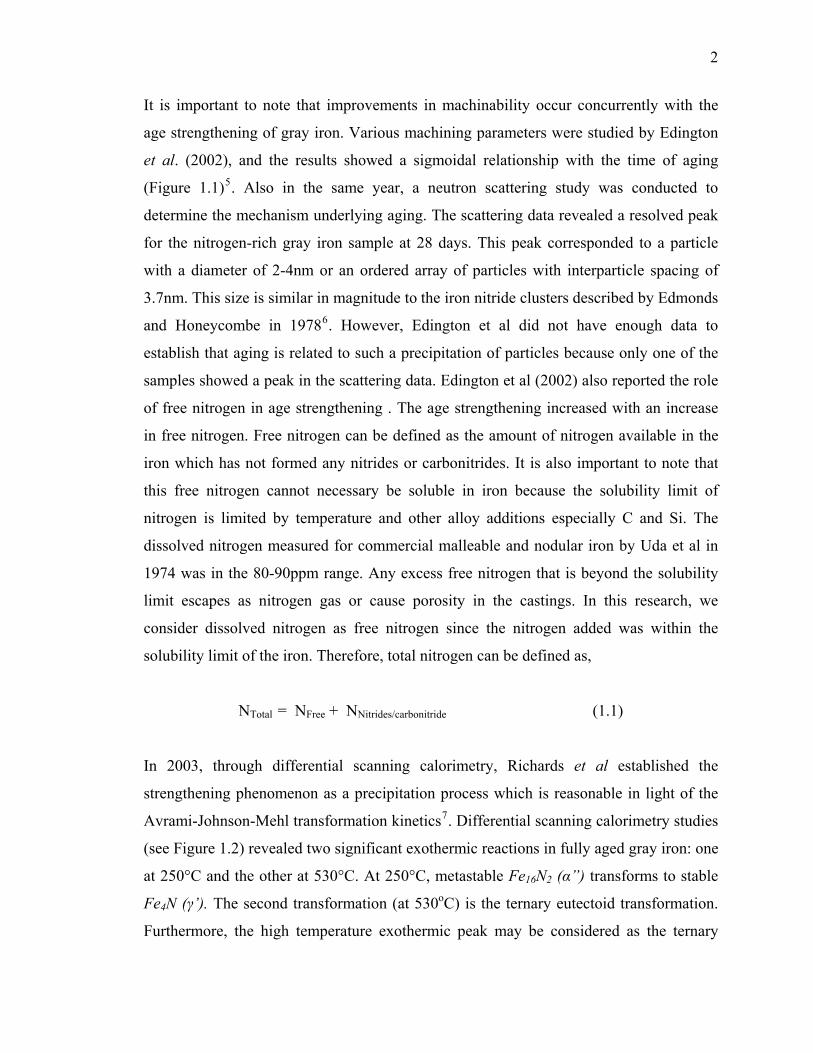
It is important to note that improvements in machinability occur concurrently with the
age strengthening of gray iron. Various machining parameters were studied by Edington
et al. (2002), and the results showed a sigmoidal relationship with the time of aging
(Figure 1.1)5. Also in the same year, a neutron scattering study was conducted to
determine the mechanism underlying aging. The scattering data revealed a resolved peak
for the nitrogen-rich gray iron sample at 28 days. This peak corresponded to a particle
with a diameter of 2-4nm or an ordered array of particles with interparticle spacing of
3.7nm. This size is similar in magnitude to the iron nitride clusters described by Edmonds
and Honeycombe in 19786. However, Edington et al did not have enough data to
establish that aging is related to such a precipitation of particles because only one of the
samples showed a peak in the scattering data. Edington et al (2002) also reported the role
of free nitrogen in age strengthening . The age strengthening increased with an increase
in free nitrogen. Free nitrogen can be defined as the amount of nitrogen available in the
iron which has not formed any nitrides or carbonitrides. It is also important to note that
this free nitrogen cannot necessary be soluble in iron because the solubility limit of
nitrogen is limited by temperature and other alloy additions especially C and Si. The
dissolved nitrogen measured for commercial malleable and nodular iron by Uda et al in
1974 was in the 80-90ppm range. Any excess free nitrogen that is beyond the solubility
limit escapes as nitrogen gas or cause porosity in the castings. In this research, we
consider dissolved nitrogen as free nitrogen since the nitrogen added was within the
solubility limit of the iron. Therefore, total nitrogen can be defined as,
NTotal = NFree + NNitrides/carbonitride (1.1)
In 2003, through differential scanning calorimetry, Richards et al established the
strengthening phenomenon as a precipitation process which is reasonable in light of the
Avrami-Johnson-Mehl transformation kinetics7. Differential scanning calorimetry studies
(see Figure 1.2) revealed two significant exothermic reactions in fully aged gray iron: one
at 250°C and the other at 530°C. At 250°C, metastable Fe16N2 (α”) transforms to stable
Fe4N (γ’). The second transformation (at 530oC) is the ternary eutectoid transformation.
Furthermore, the high temperature exothermic peak may be considered as the ternary
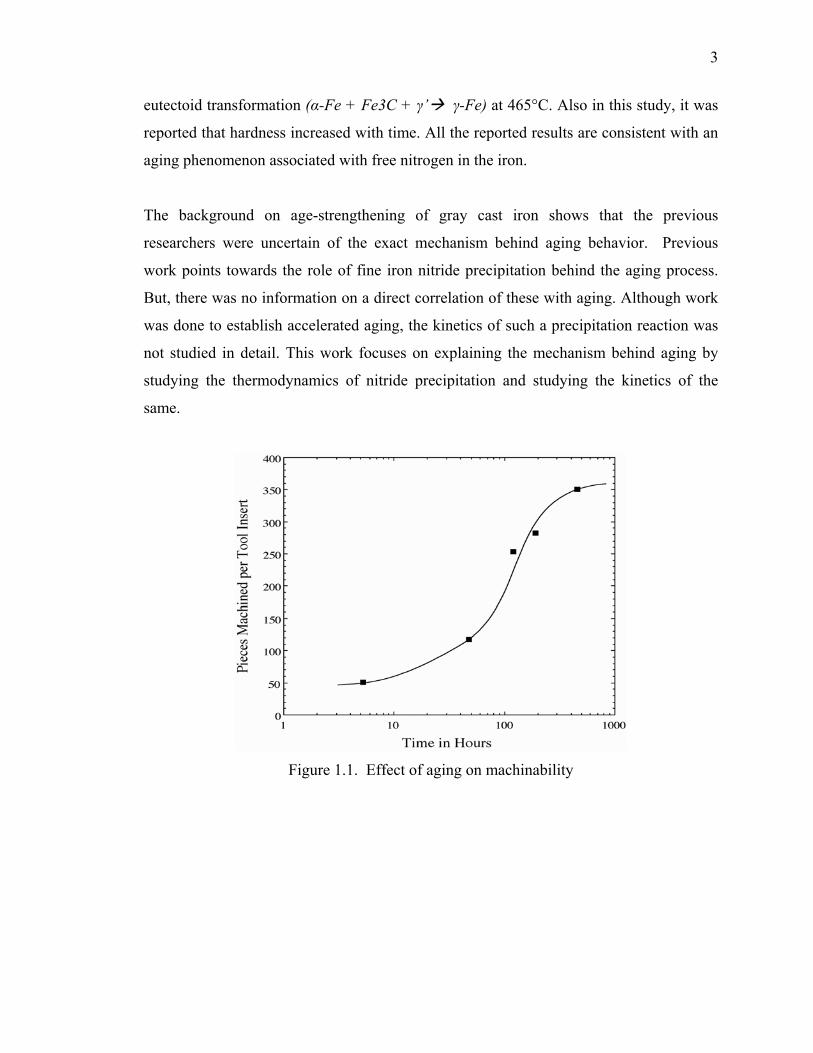
3
eutectoid transformation (α-Fe + Fe3C + γ’ γ-Fe) at 465°C. Also in this study, it was
reported that hardness increased with time. All the reported results are consistent with an
aging phenomenon associated with free nitrogen in the iron.
The background on age-strengthening of gray cast iron shows that the previous
researchers were uncertain of the exact mechanism behind aging behavior. Previous
work points towards the role of fine iron nitride precipitation behind the aging process.
But, there was no information on a direct correlation of these with aging. Although work
was done to establish accelerated aging, the kinetics of such a precipitation reaction was
not studied in detail. This work focuses on explaining the mechanism behind aging by
studying the thermodynamics of nitride precipitation and studying the kinetics of the
same.
Figure 1.1. Effect of aging on machinability
4
Figure 1.2. Differential scanning calorimetry results showing a difference curve
generated by running a high nitrogen specimen in the reference cell and a non-aging
specimen in the sample cell7
1.2. LITERATURE REVIEW
Although, there is limited work on age strengthening in the cast iron field, the research in
certain aluminum alloys, copper alloys and steels is more exhaustive. Hence, to explain
the age strengthening behavior in cast irons, it is necessary to understand the aging
process described in these alloys.
1.2.1 Aging process. S. H. Avner has described aging behavior in non-ferrous alloys in
detail8. According to Avner, an alloy, which is in a quenched state is a super saturated
solid solution and is unstable. The excess solute tends to come out of the solution.
Precipitation is accelerated by an increase in temperature and refrigeration retards this
process. At temperatures below -50oF, the process is delayed for extended periods. In the
early theory of aging process, it was thought that the excess phase comes out of the
solution as fine submicroscopic particles which interfere with the movement along slip
planes, increasing strength. Later studies indicate that aging is not due merely to the
5
presence of precipitate. It is due to both the uniform distribution of finely dispersed sub-
microscopic precipitates and the distortion of lattice structure by those particles before
they coarsen. It is not clear to the researchers on how the precipitates harden the matrix or
solvent lattice. The most important theory of such strengthening is the coherent lattice
theory. After quenching of an alloy, it is in a super saturated condition, with the solute
atoms distributed at random lattice structures. During an incubation period, the excess
solute atoms tend to migrate to certain crystallographic planes, forming clusters. During
aging, these clusters form an intermediate crystal structure, maintaining coherency with
the lattice structure of the matrix. The excess phase will have different lattice parameters
from those of the solvent, and as a result of coherency, there will be considerable
distortion of matrix. It is this distortion that interferes with the movement of the
dislocations, resulting in an increase in strength. Eventually the equilibrium phase is
formed with its own lattice structure, leading to a loss in coherency with the matrix and
lower distortions. The strength decreases and the alloy is “over aged”. This kind of aging
behavior is noted in Aluminum 2014 and certain Cu-Be alloys.
Aging behavior in steels is reported by Leslie. Fe-0.02%N quenched from 500oC showed
age strengthening at 25, 60 and 100oC. At 100oC, the magnitude of strength increase was
less due to larger precipitates and greater inter-particle spacing. It was reported that at all
three temperatures the precipitates formed were Fe16N2.
Leslie also reports the interactions between substitutional solute atoms and interstitials.
The main substitutional atoms considered are Mn, Cr, Si, Mo, V, Ti and Al. These
elements were known to hold C and N in close associations, as indicated by internal
friction. The resulting substitutional interstitial dipoles can interact strongly with
dislocations over a greatly expanded temperature range as compared to interstitials acting
alone. These strengthening effects were referred as interaction solid solution
strengthening by J. D. Baird et al (1972)9.
Edmonds and Honeycombe (1978) provided a review of quench aging studies in Fe-N
alloys that indicates a three-stage precipitation process beginning with the formation of

6
interstitial-atom clusters, followed by nucleation of metastable α”- Fe16N2, and ending
with equilibrium γ’-Fe4N. Precipitation of α”- Fe16N2 can be nucleated homogeneously
at low temperatures and high nitrogen supersaturations or heterogeneously on
dislocations at higher temperatures and low nitrogen supersaturations. At temperatures
above 200°C, the metastable α”- Fe16N2 is replaced by the ordered γ’-Fe4N.
1.2.2. Iron nitride precipitation. Malinov et al in 2001 showed that the equilibrium
phases of Fe-N below 860K are α (super saturated ferrite), γ’(Fe4N) and ε–Fe2N10. The
same authors also established that the interpretation for the formation of α” (Fe16N2) at
lower temperature are that the α” phase develops as a precursor for α not only from ferrite
and martensite, but also upon transformation of ε and γ’ or the α” phase develops as an
equilibrium phase below 440K. Figure 1.3 shows the Fe-N system.
Figure 1.3. Fe-N system (Karin Frisk, 1987)11
Burgess (1968) also speculated the precipitation process as the reason for age hardening
in ferritic malleable iron12. His conclusion was that aging occurs by the precipitation of
carbides and/or nitrides from solid solution. He further adds that the effect of aging on
mechanical properties depends primarily on the tangling of dislocations around

7
precipitated particles which acts as stress raisers. The distribution of precipitates played
an important role. This distribution is in turn dependant on temperature. At high
temperature it is present in the grain boundaries while at lower temperatures it occurs in
the matrix also.
1.2.3. Nitride formers. Wada and Pehlke (1973) studied the effect of alloying elements
on the graphitization in malleable and nodular cast irons13. Nitride forming elements such
as aluminum, boron, titanium and zirconium accelerate graphitization in certain cases and
retard graphitization in other cases. This is due to the characteristic behavior of nitrogen
in iron with nitrogen getters. Nitrogen retards graphitization. When nitrogen is present
with a nitrogen getter, they combine to form a stable nitride and precipitate from the
matrix. Hence they have very less effect on graphitization. Most nitrogen getters have a
retarding effect on graphitization. Hence the optimum would be the correct amount of
nitrogen getters to nullify the nitrogen. If the concentration of nitrogen getters is higher, it
leads to lesser graphitization. Also, they have pointed out that the nitride precipitates
enhance the kinetics of graphitization by acting as nuclei. These authors consolidated
solubility products of various nitrides (in gamma iron) from previous research papers:
Al + N AlN
Log (%Al)(%N) = - T184.7 + 1.786
At 954oC, (%Al)(%N) = 8.5 x 10⁻⁵
B + N BN
Log (%B)(%N) = - T
13970 + 5.24
At 954oC, (%B)(%N) = 7.2 x 10⁻⁷
Ti + N TiN
Log (%Ti)(%N) = - T
14400 + 4.94
For malleable iron at 954oC (%Ti)(%N) = 2.1 x 10⁻⁴
8
For nodular iron at 954 Deg C (%Ti)(%N) = 1.5 x 10⁻⁴
These values are higher than that in Gamma Iron at 954 Deg C.
The total nitrogen content in Ti-bearing iron alloys increase mainly due to the formation
of titanium nitride or carbonitride. These authors could identify TiN and TiC using x-ray
diffraction analysis but were unable to identify Ti(CN). These authors studied the
stabilities of TiN and TiC and reported that thermodynamically TiN is more stable than
TiC.
Robert J. Glodowski (1981) reported on the various nitride formers used to eliminate
nitrogen in wire drawn steels14. Nitride formers considered in this paper were Al, Nb, Ti,
V and B. Of these, only V and Ti effectively reduce N. Nb is relatively ineffective
because of its affinity towards carbon. AlN formation was found to be very sluggish as
reported by F. G. Wilson and T. Gladman (1988)15. Nitrogen reduction by B was not
confirmed in this paper.
R. W. Fountain and J. Chipman in 1962 studied the four phase equilibrium between
austenite, BN, Fe2B and gas16. They reported that the activity coefficient of nitrogen (in
austenite) is decreased by boron. For a steel containing 0.004 wt% N, an available B
content of 0.003 wt % above that combined as B2O3 should be sufficient to reduce the
nitrogen below 0.001 wt %.
Evans, E. R., (1969) studied the interaction between nitrogen and aluminum in gray cast
iron17. It was concluded that as the aluminum content in the iron is increased the effect of
nitrogen is decreased. If the aluminum content is more than twice that of nitrogen in iron
there will not be a significant increase in strength caused by nitrogen. Another noticeable
finding is that iron of lower nitrogen and aluminum showed lesser strength that those
with higher nitrogen contents and were neutralized by aluminum.
1.2.4. Solubility of nitrogen in cast irons. Uda et al. (1974) did a study to determine the
solubility of nitrogen in cast iron18. They determined the solubility of nitrogen in a series

9
of Fe-C-Si alloys and commercial iron alloys over a temperature range 1287-1760oC.
Their studies show that C and Si reduce the solubility of nitrogen. They reported that
there was a very small increase in solubility of nitrogen with increase of temperature. For
Fe -2.82%C-1.94%Si, the temperature dependency of nitrogen solubility can be written
as,
Log (wt % N)1 atm pressure = - T
1355 - 1.096
The variation in solubility due to C and Si was mainly due to the effect of interaction
parameters on the activity coefficient of nitrogen.
10
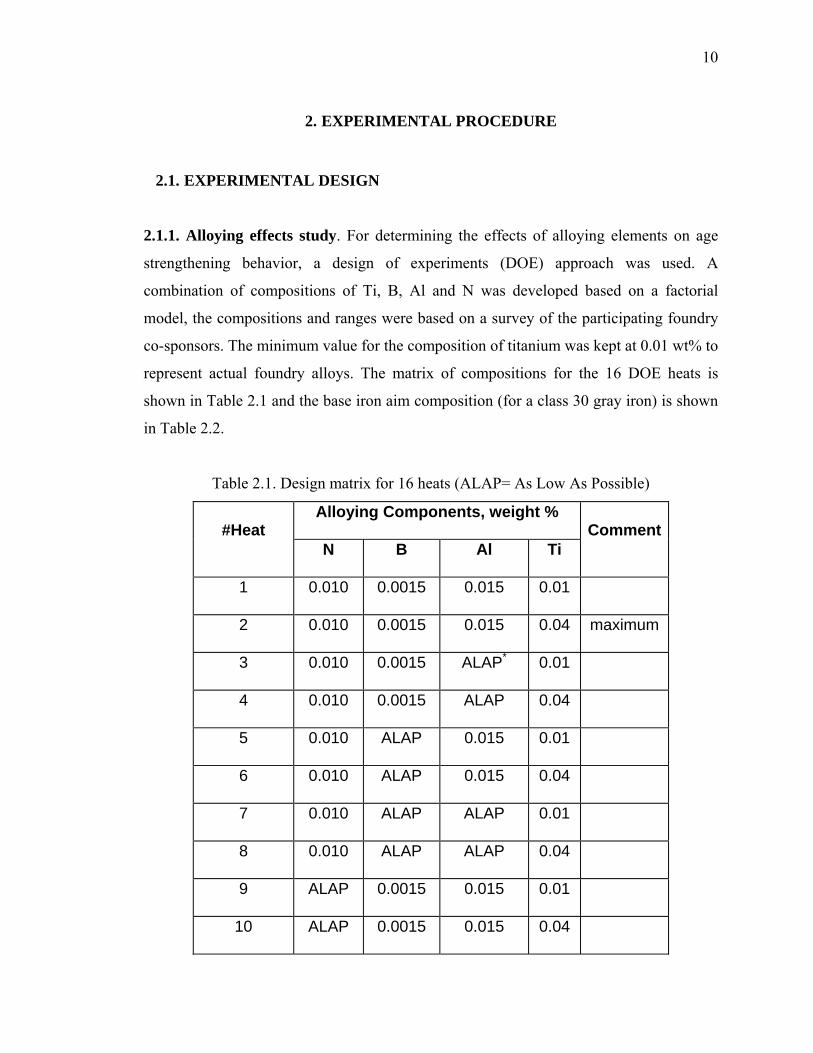
2. EXPERIMENTAL PROCEDURE
2.1. EXPERIMENTAL DESIGN
2.1.1. Alloying effects study. For determining the effects of alloying elements on age
strengthening behavior, a design of experiments (DOE) approach was used. A
combination of compositions of Ti, B, Al and N was developed based on a factorial
model, the compositions and ranges were based on a survey of the participating foundry
co-sponsors. The minimum value for the composition of titanium was kept at 0.01 wt% to
represent actual foundry alloys. The matrix of compositions for the 16 DOE heats is
shown in Table 2.1 and the base iron aim composition (for a class 30 gray iron) is shown
in Table 2.2.
Table 2.1. Design matrix for 16 heats (ALAP= As Low As Possible)
Alloying Components, weight % #Heat
N B Al Ti Comment
1 0.010 0.0015 0.015 0.01
2 0.010 0.0015 0.015 0.04 maximum
3 0.010 0.0015 ALAP* 0.01
4 0.010 0.0015 ALAP 0.04
5 0.010 ALAP 0.015 0.01
6 0.010 ALAP 0.015 0.04
7 0.010 ALAP ALAP 0.01
8 0.010 ALAP ALAP 0.04
9 ALAP 0.0015 0.015 0.01
10 ALAP 0.0015 0.015 0.04

11
11 ALAP 0.0015 ALAP 0.01
12 ALAP 0.0015 ALAP 0.04
13 ALAP ALAP 0.015 0.01
14 ALAP ALAP 0.015 0.04
15 ALAP ALAP ALAP 0.01 minimum
16 ALAP ALAP ALAP 0.04
Table 2.2. Base composition to achieve a nominally class 30 gray cast iron, weight %
Element Wt%
C 3.4
S 0.06
Si 2.1
Mn 0.45
P 0.03
Cu 0.35
Cr 0.08
Based on the results from this matrix (Table 2.1), another set of experiments was
designed to evaluate the role of titanium in thermodynamics of age strengthening in gray
cast iron. The combination of titanium and nitrogen compositions was based on a
monotonic model in which titanium was varied at four different compositions for two
levels of nitrogen (Table 2.3), using the target base iron composition as shown in Table
2.2.

12
Table 2.3. Design matrix for eight heats to establish titanium-nitrogen effect
Alloying Components, weight %
#Heat N Ti
1 nominal 0.000
2 nominal 0.015
3 nominal 0.030
4 nominal 0.050
5 elevated 0.000
6 elevated 0.015
7 elevated 0.030
8 elevated 0.050
2.1.2. Kinetics study. The experimental conditions were designed based on published
experimental data (Richards and Nicola, 2001) and the kinetics based on Johnson Mehl-
Avrami kinetics. A generalized form of the Johnson-Mehl equation is shown as eq. (2.1)
Vf =1− exp −π3
JrGst r+s⎛ ⎝ ⎜
⎞ ⎠ ⎟ (2.1)
where Vf is the fraction transformed, J is the nucleation rate, G is the growth rate, t is the
transformation time and r and s are exponents related to nucleation and growth
respectively. The Avrami equation (2.2) has also been used to describe phase
transformations. Here the equation is written in a fashion such that the reaction rate
constant k will always have units of reciprocal time.

13
Vf =1 − exp − kt( )n( ) (2.2)
The rate constant k is defined by the following relationship:
k = k0 exp−QRT
⎛ ⎝
⎞ ⎠ (2.3)
where R is the gas constant, T is the absolute temperature, k0 is an attempt frequency and
Q is the activation energy. If k0, Q and the time exponent n, are constant over a range of
temperatures, then the reaction is said to be isokinetic in that temperature range.
The previously published results by Nicola et al (2001) and Edington et al (2002) showed
that the age-strengthening effect was at a maximum after 15 days at room temperature
aging, after 10 hours at 182°C and after 3 hours at 285°C19,5. A time exponent of 4 was
chosen for the solid state precipitation transformation as mentioned in Cahn and Haasen
(1983), which assumes a constant nucleation rate (r=1) and a 3-D growth of the
precipitate (s=3)20. A value of JG3 was determined for each temperature and the time (t)
required to complete a particular fraction (Vf(t)) of the reaction was calculated. Figure
2.1 shows the calculated aging curves for room temperature, 182°C, and 285°C and these
results were used to plan the age-hardening time interval for the cast iron used in this
study. In addition, one set of bars was aged for longer periods of time to determine if the
iron could be over-aged with a subsequent loss of strength. The extended time was 11
hours at 285°C, 28 hours at 182°C, 37 hours at 100°C and 48 days at room temperature.
The test parameters are shown in Table 2.4. The procedure of randomizing the samples
will be described below.

14
Figure 2.1. Forecast of aging kinetics by using Avrami-Johnson-Mehl equation

15
Table 2.4. Heat treatment time and temperature parametersTemperature,
°C Aging time
(hr) Sample #Temperature,
°C Aging time
(hr) Sample #Temperature,
°C Aging time
(hr) Sample #1 A 8 A 44 B
23 A 6 A 49 A
5 B 17 A 35 A
26 A 48 B 43 A
13 A 52 A 11 A
16 A 46 B 21 B
37 B 42 A 46 A
12 B 9 B 2 B
50 B 38 B 26 B
16 B 29 B 25 B18 B 39 A 29 A28 A 48 A 5 A50 A 41 A 2 A22 B 34 B 28 B20 A 9 A 1 B45 B 18 A 14 B
6 B 51 B 19 A4 B 14 A 52 B
27 B 36 A 41 B31 B 7 A 4 A38 A 10 B 20 B47 A 47 B 7 B19 B 17 B 11 B15 A 24 B 22 A40 B 24 A 32 B21 A 35 B44 A 3 A45 A 39 B33 B 23 B13 B 33 A
8 B 42 B25 A 15 B43 B 3 B34 A 31 A30 B 10 A49 B 27 A32 A 30 A36 B 40 A37 A 12 A
51 A
285 11
Room T 46 day 182 28
285 0.75
285 1.5
285 2.5
285 5
182 12
182 18
182 4
182 8
100 18.5
100 37
100 27
6 dayRoom T
19 dayRoom T
25 dayRoom T
9 dayRoom T
15 dayRoom T
4 dayRoom T
Base 0
0Base
2.2. MELTING PROCEDURE AND SAMPLE PREPARATION
2.2.1. Alloying effects study. 24 heats (16 heats from Table 2.1 and 8 heats from Table
2.3) of nominal class 30 gray iron (composition given in Table 2.2) with different levels
of alloying elements have been poured. Each heat consisted of six molds having two
vertically oriented test bars. The casting process is designed as per ASTM A48 standards
with the exception that a filtered (ceramic foam) mold is used which is a typical industrial
practice.

16
The composition of the base cast iron was achieved by melting pure induction iron bars
(Table 2.5) in a 100-pound capacity induction furnace under an argon protective
atmosphere by adding carbon raiser (99.97%C, 0.016%S, 9.75 ppm hydrogen, 36.3 ppm
nitrogen and 59.3 ppm oxygen), Fe75Si, copper, FeCr, FeP and FeMn as solid charge to
achieve the base composition in Table 2.2.
Table 2.5. Concentration of elements (weight %) in high purity iron bars
C 0.004
Si 0.01
Cu 0.01
N 0.004
Mn 0.07
Ni 0.02
Al 0.005
Ti 0.005
P 0.006
Cr 0.01
Sn 0.01
S 0.007
Mo 0.01
O 0.025
Fe 99.8
Ti was added as Fe - 75%Ti alloy wrapped in steel foil and plunged into the melt at a
temperature of 1520oC. In heats having low nitrogen, manganese was added as low
carbon Fe - 82%Mn and plunged into the melt before tapping. The nitrogen in heats with
elevated concentrations was added by using Fe-75%Mn-5%N. Tapping temperature was
1520+10oC and inoculant (Superseed®- 75%Si, 0.76%Sr, 0.17%Al, 0.03%Ca) was added
to the preheated pouring ladle at the base of the tap stream. The pouring was done from
the preheated ladle at a temperature of 1450oC. The test bars were mold cooled for 15
17
minutes after which the bars were shaken out, allowed to cool in air for 40 minutes,
cooled in water (from about 200oC), and then placed on dry ice.
The test bars produced were machined at room temperature under coolant flow in
conformance to ASTM A48 and SAE J431 using a CNC lathe. The time consumed for
machining a bar was approximately seven minutes. Each mold has two vertically
separated cast bars. Of the two sets of bars from each mold, one lot was stored in dry ice
between each processing step until tested. That set of bars was machined and tested
within a day while the other set from the same pour was allowed to age completely for 30
days at room temperature. The total room temperature exposure for the first set of bars
(day 0) was typically 1.5 hours.
The heat labeled as “2” in Table 2.1 was attempted twice – once producing nitrogen
content that was too low (less that 0.007) and once producing titanium content that was
too low (less that 0.002). Therefore those heats with their actual analysis in the database
as heats H02 and H002 were included and proceeded to analyze the data by regression
correlations.
For chemical analysis, two chill samples were poured, one before and one after pouring
the molds. The samples were analyzed in an arc spectrometer for Si, Cr, Mn, Ti, Al, P,
and Cu. The results were then verified with another arc spectrometer. Nitrogen was
analyzed using a LECO inert gas fusion analyzer. Carbon and sulfur were analyzed using
a LECO carbon-sulfur combustion analyzer.
2.2.2. Kinetics study. Test bars were poured in one of the participating foundries. The
casting process and melt recipe of the participating foundry was followed with the
exception that the nitrogen level in the iron was raised from 60ppm to 70-81ppm by ladle
addition of ferromanganese with nitrogen (Fe75%Mn5%N) to enhance age strengthening.
Two chill samples were poured, one before and one after pouring the molds. The samples
were analyzed in an arc spectrometer for Si, Cr, Mn, Ti, Al, P, and Cu. The results were
verified with two other arc spectrometers. Nitrogen was analyzed using a LECO TC500

18
inert gas fusion analyzer. Carbon and sulfur were analyzed using a Leco carbon-sulfur
combustion analyzer. Fifty molds having pressed ceramic filter and two vertically
oriented test bars were poured. The temperature of the melt in the ladle at the beginning
of pour was 1468°C and at the end of pouring was 1366°C. The castings were cooled for
20 minutes in the mold before shake out, air-cooled for 25 minutes to a temperature less
than 120°C, and quenched in water for 5 minutes. The castings were numbered
chronologically, and the two bars from each mold were designated as A and B and placed
in dry ice. Sets with five bars each were grouped using a statistically randomized
distribution. The test bars produced were machined at room temperature under coolant
flow in conformance to ASTM A48 and SAE J431 using a CNC lathe. The time
consumed for machining a bar was approximately 7 minutes. After machining, the test
bars were immediately placed in dry ice again.
2.2.2.1. Artificial aging. A convection oven with an internal air recirculating fan was
used for the artificial aging heat treatments. In addition to the oven temperature
controller, the temperature of the samples was verified using a dummy test bar with an
axial hole drilled to the center of the gage length. With this test arrangement, the aging
time was recorded from the time the temperature inside the bar reached ± 5°C of the
required aging temperature. The variation of temperature during the holding time was ±
1°C.
2.3. TESTING
Prior to mechanical testing, each bar was stabilized to room temperature in a water bath.
Tensile tests were performed using an MTS Model 312.31 test frame with a 100 kN
servohydraulic actuator and equipped with an Instron 8800 digital control and data
acquisition system. Button-ended test specimens were held on the tapered shoulders in
fully articulated box grips. Brinell hardness indentations were measured using an optical
microscope equipped with a digital camera and a computer using a Scion Image

19
Analyzer. The calculated uncertainties in the reported measurements were based upon
one sample standard deviation.
20
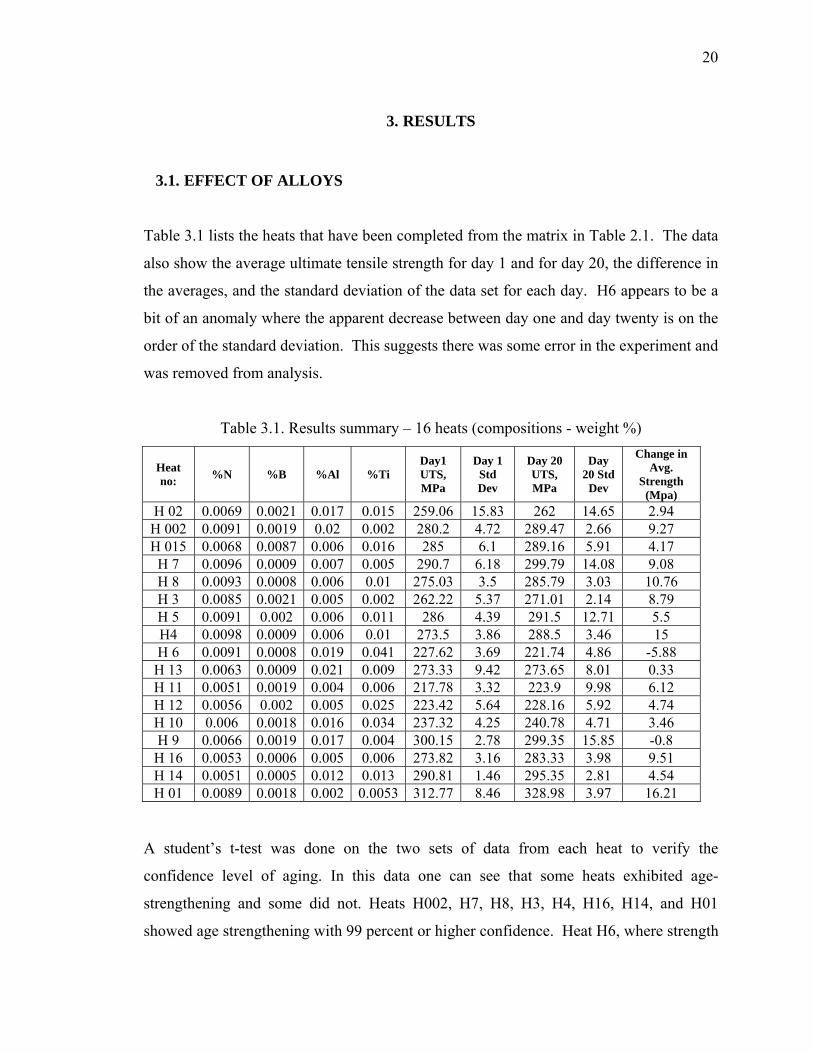
3. RESULTS
3.1. EFFECT OF ALLOYS
Table 3.1 lists the heats that have been completed from the matrix in Table 2.1. The data
also show the average ultimate tensile strength for day 1 and for day 20, the difference in
the averages, and the standard deviation of the data set for each day. H6 appears to be a
bit of an anomaly where the apparent decrease between day one and day twenty is on the
order of the standard deviation. This suggests there was some error in the experiment and
was removed from analysis.
Table 3.1. Results summary – 16 heats (compositions - weight %)
Heat no: %N %B %Al %Ti
Day1 UTS, MPa
Day 1 Std Dev
Day 20 UTS, MPa
Day 20 Std
Dev
Change in Avg.
Strength (Mpa)
H 02 0.0069 0.0021 0.017 0.015 259.06 15.83 262 14.65 2.94 H 002 0.0091 0.0019 0.02 0.002 280.2 4.72 289.47 2.66 9.27 H 015 0.0068 0.0087 0.006 0.016 285 6.1 289.16 5.91 4.17
H 7 0.0096 0.0009 0.007 0.005 290.7 6.18 299.79 14.08 9.08 H 8 0.0093 0.0008 0.006 0.01 275.03 3.5 285.79 3.03 10.76 H 3 0.0085 0.0021 0.005 0.002 262.22 5.37 271.01 2.14 8.79 H 5 0.0091 0.002 0.006 0.011 286 4.39 291.5 12.71 5.5 H4 0.0098 0.0009 0.006 0.01 273.5 3.86 288.5 3.46 15 H 6 0.0091 0.0008 0.019 0.041 227.62 3.69 221.74 4.86 -5.88
H 13 0.0063 0.0009 0.021 0.009 273.33 9.42 273.65 8.01 0.33 H 11 0.0051 0.0019 0.004 0.006 217.78 3.32 223.9 9.98 6.12 H 12 0.0056 0.002 0.005 0.025 223.42 5.64 228.16 5.92 4.74 H 10 0.006 0.0018 0.016 0.034 237.32 4.25 240.78 4.71 3.46 H 9 0.0066 0.0019 0.017 0.004 300.15 2.78 299.35 15.85 -0.8
H 16 0.0053 0.0006 0.005 0.006 273.82 3.16 283.33 3.98 9.51 H 14 0.0051 0.0005 0.012 0.013 290.81 1.46 295.35 2.81 4.54 H 01 0.0089 0.0018 0.002 0.0053 312.77 8.46 328.98 3.97 16.21
A student’s t-test was done on the two sets of data from each heat to verify the
confidence level of aging. In this data one can see that some heats exhibited age-
strengthening and some did not. Heats H002, H7, H8, H3, H4, H16, H14, and H01
showed age strengthening with 99 percent or higher confidence. Heat H6, where strength

21
decreased by 6MPa during aging, was clearly not age strengthening and we can say with
greater than ninety percent confidence that H9 and H13 were not age strengthening and
with 61 percent confidence that H02 was not age strengthening. Therefore the
experiment has been successful in suppressing age strengthening and inducing age
strengthening by varying the content of nitrogen, boron, aluminum and titanium in the
same base alloy. Detailed composition data are shown in Appendix A.
Table 3.2 lists the heats that have been completed for evaluating the effect of titanium
and nitrogen (Matrix given in Table 2.3). The data also show the N, Ti, average ultimate
tensile strength for day 1 and for day 30 and the difference in the averages. HM-2
appears to be a bit of an anomaly as a result of low carbon equivalent. This data set was
removed from analysis.
Table 3.2. Results summary – 8 heats (compositions - weight %)
Heat
No: N (%) Ti (%)
UTS
(Mpa)
day 0
UTS
(Mpa)
day 30
Change in
strength
(Mpa)
HM-1 0.006 0.033 214.70 215.41 0.71
HM-2 0.005 0.019 325.22 321.82 -3.4
HM-3 0.006 0.034 246.30 247.83 1.83
HM-4 0.006 0.049 226.74 226.30 -0.44
HM-5 0.007 0.004 307.09 311.63 4.54
HM-6 0.008 0.026 278.66 282.14 3.49
HM-7 0.009 0.041 227.24 230.02 2.78
HM-8 0.009 0.063 214.90 215.27 0.10

22
The result of the influence of titanium at two levels of nitrogen (nominal and elevated) is
shown in Figure 3.1. It can be interpreted from the figure that with increasing amount of
titanium the age strengthening is reduced. The figure also shows that the absolute value
of age strengthening is higher at elevated nitrogen experiments. At this nitrogen level,
age strengthening was suppressed by a titanium content of 0.06-0.07%. It can also be
noted that at the regular nitrogen level the age strengthening is suppressed with a titanium
content of 0.03-0.04%
-1
0
1
2
3
4
5
0 0.01 0.02 0.03 0.04 0.05 0.06 0.07
Ti (w eight %)
Tens
ile s
tren
gth
chan
ge (M
Pa)
Elevated nitrogenRegular nitrogen
UTS
30
–U
TS 0
(Mpa
)
Figure 3.1. Change in tensile strength with titanium variations at two levels of nitrogen
23
3.2. KINETICS STUDY
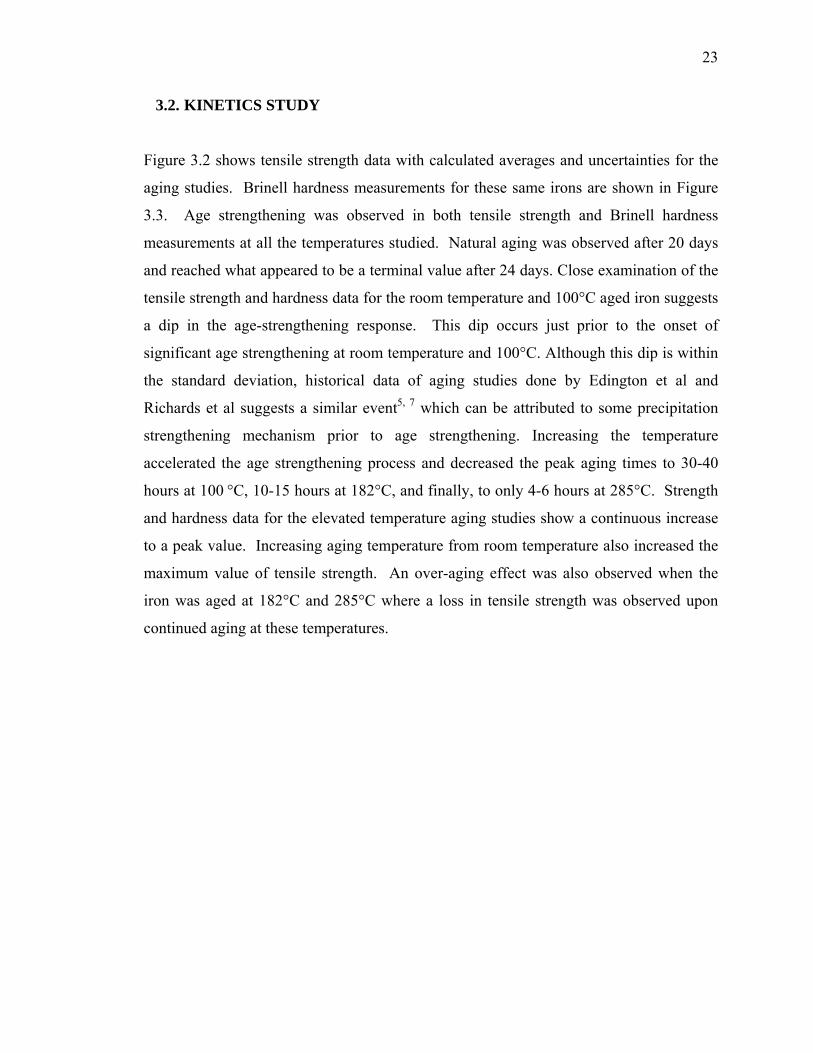
Figure 3.2 shows tensile strength data with calculated averages and uncertainties for the
aging studies. Brinell hardness measurements for these same irons are shown in Figure
3.3. Age strengthening was observed in both tensile strength and Brinell hardness
measurements at all the temperatures studied. Natural aging was observed after 20 days
and reached what appeared to be a terminal value after 24 days. Close examination of the
tensile strength and hardness data for the room temperature and 100°C aged iron suggests
a dip in the age-strengthening response. This dip occurs just prior to the onset of
significant age strengthening at room temperature and 100°C. Although this dip is within
the standard deviation, historical data of aging studies done by Edington et al and
Richards et al suggests a similar event5, 7 which can be attributed to some precipitation
strengthening mechanism prior to age strengthening. Increasing the temperature
accelerated the age strengthening process and decreased the peak aging times to 30-40
hours at 100 °C, 10-15 hours at 182°C, and finally, to only 4-6 hours at 285°C. Strength
and hardness data for the elevated temperature aging studies show a continuous increase
to a peak value. Increasing aging temperature from room temperature also increased the
maximum value of tensile strength. An over-aging effect was also observed when the
iron was aged at 182°C and 285°C where a loss in tensile strength was observed upon
continued aging at these temperatures.
24
(a) (b)
(c) (d)
Figure 3.2. Tensile strength of iron during aging. (a) at room temperature (b) at 100°C (c) at 182°C and (d) at 285°C

25
(a) (b)
(c) (d)
Figure 3.3. Brinell hardness of iron during aging. (a) at room temperature (b) at 100°C (c) at 182°C and (d) at 285°C

26
4. DISCUSSION OF RESULTS
4.1. EFFECT OF NITRIDE FORMING ALLOYS ON AGING BEHAVIOUR
In the first matrix of experiments (Table 2.1), the nitride formers Ti, Al and B were
varied for two levels of nitrogen. Because the chemical variables used presented some
difficulty in reproducible alloy recovery, the traditional ANOVA approach presented a
problem. The ANOVA approach assumes only two values of each independent variable
rather than in ranges as experienced in this study
Multiple variable regression correlation was used to assess the relative importance of
variables in Table 2.1. It is important to note, as shown in Table 4.1, that the only
compositional effect that increases age strengthening in this variable set appears to be
nitrogen. Earlier work by Edington et al (2002) supports this, by indicating the
importance of titanium to nitrogen ratio in production iron.
The multiple variable regression correlation approach was used to obtain an idea of the
direction of influence and significance of the composition variables. The multiple
variable regression results are shown in Table 4.1.
Table 4.1. Multiple variable regression model
Variable Coefficient P-Value
Nitrogen +788 0.24
Aluminum -324 0.07
Titanium -173 0.09
Boron -390 0.24
Constant 6.07 0.28
27
The overall equation suggested by the correlations is:
UTS20-UTS0 = 6.07+788*%N-324*%Al-173*%Ti-390*%B
Where “UTS20-UTS0“ is the change in ultimate tensile strength in units of MPa for the
initial aging of 20 days.
4.1.1. The effect of electropositive elements on nitrogen. The elements Ti, Al and B
were selected for their tendency to react with nitrogen forming nitrides. The composition
of each of these elements and their effect on the strength change was plotted and the
correlation was studied.
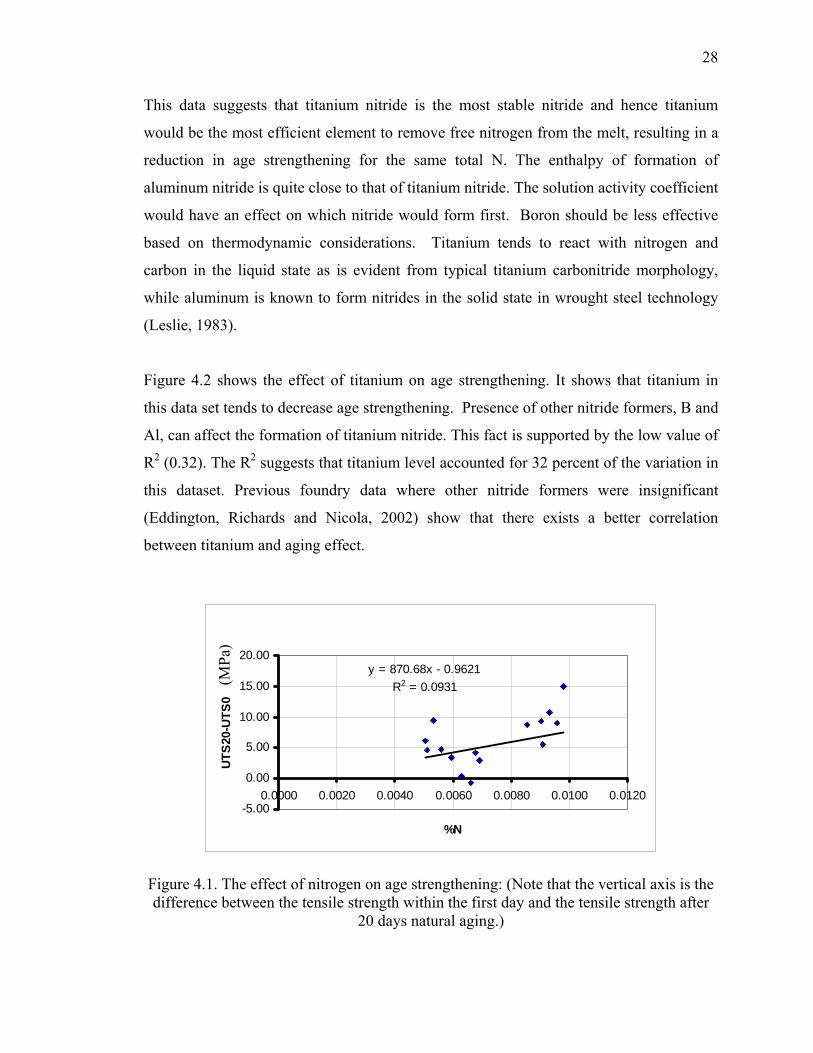
The influence of nitrogen on age strengthening in this data set is shown in Figure 4.1. The
presence of nitride formers, Ti, and Al reduced the amount of free nitrogen in the melt.
The effect of B is not clear since the quantity involved is very small (0.0015 wt %) and
the recovery was not consistent. Since the free nitrogen in the melt was significantly
affected by these elements, the effect of total nitrogen in increasing age strengthening
was weakened. This is supported by a very low R2 of only 0.09. (R2 is a statistical
measure of how well a regression line approximates real data points. R2 is a descriptive
measure between zero and one, one being a perfect fit). Earlier work by Edington et al
(2002) showed a better correlation between free nitrogen (N-0.33*Ti) and age
strengthening, with an iron alloy in which aluminum and boron were controlled in a
narrow range.
The enthalpy of formation of the nitrides of titanium, aluminum and boron in the
temperature range from 1000oK-1700oK, the Fact-Sage database (Bale, et al, 2003) are:
Boron Nitride : -250KJ/mole
Aluminum Nitride : -329 KJ/mole
Titanium Nitride: -336+2KJ/mole
28
This data suggests that titanium nitride is the most stable nitride and hence titanium
would be the most efficient element to remove free nitrogen from the melt, resulting in a
reduction in age strengthening for the same total N. The enthalpy of formation of
aluminum nitride is quite close to that of titanium nitride. The solution activity coefficient
would have an effect on which nitride would form first. Boron should be less effective
based on thermodynamic considerations. Titanium tends to react with nitrogen and
carbon in the liquid state as is evident from typical titanium carbonitride morphology,
while aluminum is known to form nitrides in the solid state in wrought steel technology
(Leslie, 1983).
Figure 4.2 shows the effect of titanium on age strengthening. It shows that titanium in
this data set tends to decrease age strengthening. Presence of other nitride formers, B and
Al, can affect the formation of titanium nitride. This fact is supported by the low value of
R2 (0.32). The R2 suggests that titanium level accounted for 32 percent of the variation in
this dataset. Previous foundry data where other nitride formers were insignificant
(Eddington, Richards and Nicola, 2002) show that there exists a better correlation
between titanium and aging effect.
Total Nitrogen Effect on Aging
y = 870.68x - 0.9621R2 = 0.0931
-5.00
0.00
5.00
10.00
15.00
20.00
0.0000 0.0020 0.0040 0.0060 0.0080 0.0100 0.0120
%N
UTS
20-U
TS0
(MPa
)
Figure 4.1. The effect of nitrogen on age strengthening: (Note that the vertical axis is the difference between the tensile strength within the first day and the tensile strength after
20 days natural aging.)

29
Titanium Effect on Aging
y = -245.54x + 8.5547R2 = 0.3202
-5.00
0.00
5.00
10.00
15.00
20.00
0.0000 0.0100 0.0200 0.0300 0.0400 0.0500
% Ti
UTS
20-U
TS0
(MPa
)
Figure 4.2. The effect of titanium on age strengthening: this is the strongest variable in terms of correlation coefficient and agrees with previous work using foundry irons
Aluminum Effect on Aging
y = -247.76x + 8.3504R2 = 0.1069
-5.00
0.00
5.00
10.00
15.00
20.00
0.0000 0.0050 0.0100 0.0150 0.0200 0.0250
% Al
UTS
20-U
TS0
(MPa
)
Figure 4.3. The effect of aluminum in this data set is to suppress age strengthening
The trend of aluminum on suppressing age strengthening, as indicated in Figure 4.3, is in
agreement with anecdotal observations by some of the authors on production foundry
irons that did not seem to exhibit age strengthening. Again the scatter in the data is
considerably high (R2 value of 0.11 indicates a low correlation) showing that other nitride
30
forming elements have affected the correlation between aluminum and aging properties.
The titanium at high levels may override the aluminum effect.
A similar analysis using a linear statistical model for boron indicates a weakly
suppressing effect for age strengthening. The effect of B could not be determined with
any statistical significance because of the difficulty in recovering the very small alloying
quantity and measuring boron level.
In terms of physical metallurgy, aluminum and titanium are relatively effective at
removing interstitials from ferrite (carbon and nitrogen). Wada and Pehlke examined the
Gibbs free energy of Ti-N and Ti-C phase and determined that Ti-N was more stable than
Ti-C. Titanium carbo-nitrides are observable in gray iron microstructures with planar
interfaces that reflect their crystal structure and suggest formation in contact with the
liquid. If the coefficients in the multiple regression models (Table 4.1) are corrected for
the atomic weight ratio between the titanium and nitrogen and aluminum and nitrogen, it
is found that the corrected coefficients are more similar in magnitude, -623 for aluminum
(in place of -324) and -524 for titanium (in place of -173) However, the boron coefficient
becomes significantly smaller.
To study the effect of free nitrogen, the stability of nitrides needs to be considered. Since
titanium nitride is more stable than aluminum nitride, in alloys that contain more of
titanium than Al, the chances of formation of aluminum nitride is very small. Hence, for
heats having Ti>0.01wt% in Table 3.1, the free nitrogen can be calculated based on
atomic mass and 1:1 stoichoiometry as,
% Free N = %Total N – 0.33%Ti (4.1)
The effect of free nitrogen in high titanium heats on age strengthening is shown in Figure
4.4.
For heats having Ti<0.01wt% in Table 3.1, Free nitrogen can be calculated as

31
% Free N = %Total N – 0.33%Ti – 0.52%Al (4.2)
The effect of free nitrogen in low titanium heats on age strengthening is shown in Figure
4.5.
y = 1143.5x + 4.2009R2 = 0.6331
0
2
4
6
8
10
12
14
16
-0.006 -0.004 -0.002 0 0.002 0.004 0.006 0.008
%N-0.33%Ti
UTS
20-U
TS0
Mpa
Figure 4.4. Estimate of free nitrogen in high titanium alloys as a controlling variable for
age-strengthening
y = 944.71x + 6.8047R2 = 0.6691
-2
0
2
4
6
8
10
12
14
16
18
-0.01 -0.008 -0.006 -0.004 -0.002 0 0.002 0.004 0.006 0.008
%N-0.33%Ti-.52%Al
UTS
20-U
TS0
Mpa
Figure 4.5. Estimate of free nitrogen in low titanium heats as a controlling variable for age-strengthening

32
Figures 4.4 and 4.5 indicate that free nitrogen improves age strengthening behavior. The
R2 values indicate that the correlation is strong. This result also supports earlier findings
by Edington et al (2002).
A proposed age strengthening mechanism is that nitrogen and carbon in super saturated
ferrite react with iron to form a precipitate. Titanium removes nitrogen from the iron
during solidification and lowers the available nitrogen for solution in the ferrite.
Aluminum may also remove some nitrogen during solidification and as the casting cools
through the austenite temperature range forming aluminum nitride or carbo-nitrides. The
net effect of titanium and aluminum reacting with nitrogen is to reduce the solubility of
nitrogen in the ferrite and possibly the carbon solubility in ferrite. This leaves less
nitrogen to react with iron in the aging process. From these 16 heats it was clear that both
titanium and aluminum strongly reduce age strengthening.
But a serious limitation in this 16 heat matrix study was the co-existence of different
nitride formers. Their interactions affected the correlation of a particular element with
age strengthening behavior making it difficult to explain age strengthening based on a
thermodynamic model. The second matrix of 8 heats (Table 2.3) concentrates on studying
the effect of only titanium at two levels of N.
The multiple variable regression correlation approach was used to obtain an idea of the
direction of influence and significance of the composition variables given in Table 2.3.
The multiple variable regression results are shown in Table 4.2.
33
Table 4.2. Multiple variable regression model of the statistical effects of titanium and
nitrogen
Variable Coefficient P-Value Confidence
Nitrogen 704.4 0.0103 >95%
Titanium -99.1 0.001 >99%
Constant 0.27 0.8182 18%
The overall equation suggested by this correlation is
Change in UTS = 0.267 + 704.4*N - 99.1*Ti
(R-squared = 95.15%)
As expected, nitrogen has strong positive influence on age strengthening and titanium
suppresses age strengthening which is in confirmation with earlier studies by Nicola et al
(1999, 2000)2,4.
Free nitrogen was calculated based on Equation (4.1). Figure 4.6 shows the relation
between estimated free nitrogen and the change in strength upon aging. Aging effect
increases with free nitrogen. The R2 value of 0.87 shows that the result is in good
agreement with earlier work by Edington et al (2002) and supports the result from the
initial 16-Heat matrix.

34
y = 324.6x + 2.9708R2 = 0.8737
-1.00
0.00
1.00
2.00
3.00
4.00
5.00
6.00
-0.012 -0.01 -0.008 -0.006 -0.004 -0.002 0 0.002 0.004 0.006 0.008
Free N = N - 0.33 * Ti
UTS
chan
geU
TS 3
0 –
UTS
0 (M
pa)
Figure 4.6. Effect of estimated free nitrogen on aging
4.1.2. Thermodynamics of age strengthening. Thermodynamic calculations were
performed for understanding the interactions of controlled impurities of nitrogen and
titanium in the iron melt as well as during solid phase transformation. Thermodynamic
data also could be useful for evaluation of driving forces of iron aging which could also
influence real process kinetics. The calculations were performed with FACTSAGE,
software description of which could be found elsewhere (Bale, et al, 2003)21,22. Briefly,
the computational method based on the Gibbs energy minimization of system contains
the initial levels of base components (Fe-3.5%C-2%Si) with controlled impurities of
nitrogen and titanium. The program identifies the most probable reactions and products
which have the most negative Gibbs energy:
( ) ( )iiisolutions
i
phasescondensedpure
iiii
gasideal
i RTXRTgngnPRTgnG γlnlnln 000 +++++= ∑∑∑
Where:
ni - moles;
Pi - gas partial pressure;
35
Xi - mole fractions;
νi - activity coefficient;
gi - standard molar Gibbs energy.
The FACTSAGE data base includes the thermodynamic properties of liquid iron solution,
austenite, ferrite as well as special phases: iron and titanium nitrides and carbides (Fe4N,
TiN, Ti2N, TiC, Ti(CN)). The influence of other components typically present in iron (C,
Si) was evaluated using activity coefficients.
Results of the calculations are presented below as a function of titanium additions into
iron (Fe-3.5%C-2%Si) with two levels of nitrogen (Figure 4.7). The low level had
0.004% nitrogen and the high level had 0.009% nitrogen that reflected the possible
maximum and minimum concentrations in experimental conditions. The possible
interactions in liquid iron near the solidification temperature of 1200°C are depicted in
Figure 4.7. Pure iron dissolves free (not chemically bonded) nitrogen in solution. When
the concentration of titanium is between 0.015% and 0.04%, the iron melt had some
residual dissolved nitrogen and also chemically bonded nitrogen with titanium as a nitride
phase. Above 0.04-0.05% Ti, practically all titanium has chemically bonded with
nitrogen and the excess titanium formed carbides and carbonitrides. A point to note is
that theoretical predictions showed no thermodynamic conditions for the formation of
iron nitrides directly in the melt.

36
0
0.002
0.004
0.006
0.008
0.01
0 0.01 0.02 0.03 0.04 0.05 0.06 0.07 0.08
Ti (weight %)
N in
sol
utio
n (w
eigh
t %)
0
0.01
0.02
0.03
0.04
0.05
0.06
TiN
+ T
iC (w
eigh
t %)
Free N (initial 0.004%N)Free N (initial 0.009%N)TiN +TiC (initial 0.004%N)TiN +TiC (initial 0.009%N)
TiN Ti(CN)
Figure 4.7. Interactions of titanium in iron melt with different initial concentrations of nitrogen
Iron solidification significantly change the thermodynamic conditions of nitrogen in solid
iron solution and nitrogen activity depend on temperature and existing stable iron phases
(γ- iron or α-iron). In pure iron alloys without any nitride formers, practically all nitrogen
is in true solid solution in austenite as well as in ferrite at high temperatures. While the
temperature decreases from approximately 400°C to room temperature, ferrite becomes
supersaturated and nitrogen can precipitate as iron nitride (Figure 4.8). This is the main
thermodynamic condition for natural iron aging. The real mechanism, which is explained
later in this section, could include several intermediate stages. This is typical for solid
phase transformations which require larger activation energy when compared to liquid
melt conditions where atomic mobility is high. The age-strengthening effect could be in
proportion to a degree of ferrite super-saturation and a volume of iron nitride according to
the thermodynamic equilibrium with ferrite.
The volume of equilibrium iron nitride significantly depends on the nitrogen content in
iron as well as the concentration of nitride-forming elements, in particular titanium,

37
which has a large affinity towards nitrogen. When the iron alloy contains titanium and
nitrogen simultaneously, these elements react to form titanium nitride resulting in a lower
amount of “free” nitrogen in the solid solution. This limits the formation of iron nitride at
room temperature and consequently suppresses iron aging effect. The particular
percentage of equilibrium iron nitride is important from practical point of view because
this allows predicting age-strengthening effect. The thermodynamic conditions of
titanium nitride formation from solid austenite solution become stronger with decreasing
temperature. This is a well known fact which is often used for decreasing austenite grain
size in specially heat treated low alloyed steels3. When austenite is transformed to ferrite,
the dissolution of titanium and nitrogen continues to decrease, which thermodynamically
promotet titanium nitride formation. The temperature range of super-saturation of ferrite
lies from room temperature to 300°C and beyond this range the possibility of aging is
limited according to thermodynamics. The experimental data confirmed these
thermodynamical predictions.

38
Low nitrogen (0.004%)
0.00
0.01
0.02
0.03
0.04
0.05
0.06
0.07
0.08
0 200 400 600 800 1000 1200
Temperature (0C)
Conc
entr
atio
n (w
eigh
t %)
Fe4N in 0.0001%TiFe4N in 0.001%TiFe4N in 0.01%TiFe4N in 0.02%TiFe4N in 0.04%TiTi2N in 0.0001%TiTi2N in 0.001%TiTi2n in 0,01%TiTi2N in 0.02%TiTi2N in 0.04%Ti
Ferrite Melt Austenite
a)
High nitrogen (0.009%)
0.00
0.02
0.04
0.06
0.08
0.10
0.12
0.14
0.16
0.18
0.20
0 200 400 600 800 1000 1200
Temperature (0C)
Con
cent
ratio
n (w
eigh
t %)
Fe4N in 0.0001%TiFe4N in 0.001%TiFe4N in 0.01%TiFe4N in 0.02%TiFe4N in 0.04%TiTi2N in 0.0001%TiTi2N in 0.001%TiTi2n in 0,01%TiTi2N in 0.02%TiTi2N in 0.04%Ti
Ferrite Melt Austenite
b)
Figure 4.8. Equilibrium of iron and titanium nitrides in solid irons with different initial nitrogen levels (a - 0.004%N and b - 0.009%N) as a function of temperature and titanium
concentration
39
Three dimensional diagrams (Figure 4.9) shows the combined temperature and titanium
content effect on “free” nitrogen in supersaturated ferrite and the possible percentage of
iron nitride formation during the natural aging of gray iron. The figure 4.8 shows the
combined effect at low and high nitrogen respectively. High nitrogen iron alloys have
higher value of iron nitride and requires a higher concentration of titanium to suppress
age strengthening.
400300
200100
20
0.00
010.
001
0.01
0.02
0.04
0.00
0.01
0.02
0.03
0.04
0.05
0.06
0.07
Fe4N
(wei
ght %
)
Temperature ( 0C)Ti (w
eight %)
Low nitrogen (0.004%)
400300
200100
20
0.00
01
0.00
1
0.01
0.02
0.04
0.00
0.02
0.04
0.06
0.08
0.10
0.12
0.14
0.16
Fe4N
(wei
ght %
)
Temperature ( 0C)Ti (w
eight %)
High nitrogen (0.009%)
Figure 4.9. Combined influence of temperature and titanium of potential percentage of iron nitride formation during natural aging
The computed thermodynamical data of iron nitride formation in cast iron based on the
compositions from Table 3.2 were compared to the experimentally measured age
strengthening (Figure 4.10). The strengthening effect correlates to the computed
percentage of potential iron nitride in iron. The suppressing of natural aging took place
when the concentration of titanium exceeded 0.02% in heats with regular nitrogen levels,
while in heats with elevated nitrogen, it occurred when titanium was higher than 0.06%.
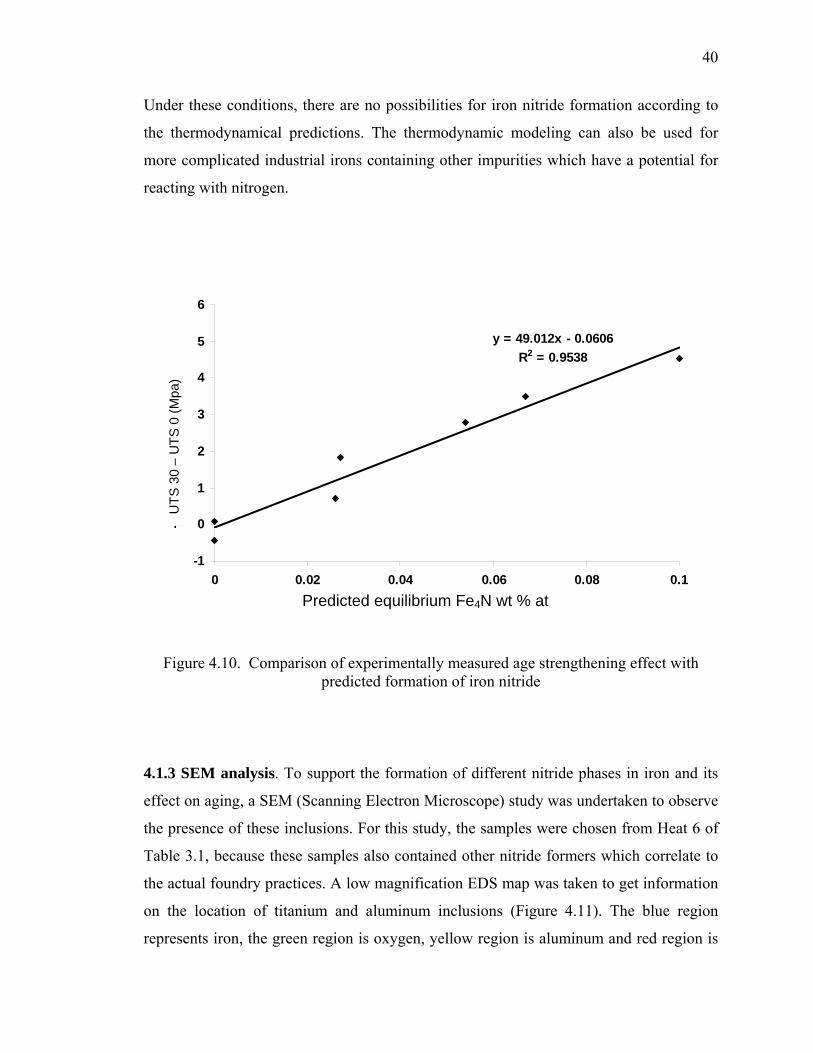
40
Under these conditions, there are no possibilities for iron nitride formation according to
the thermodynamical predictions. The thermodynamic modeling can also be used for
more complicated industrial irons containing other impurities which have a potential for
reacting with nitrogen.
y = 49.012x - 0.0606R2 = 0.9538
-1
0
1
2
3
4
5
6
0 0.02 0.04 0.06 0.08 0.1
Fe4N (weight %) at 200C
Tens
ile s
treng
th c
hand
e (M
Pa)
UTS
30
–U
TS 0
(Mpa
)
Predicted e u at q ilibrium Fe4N wt %
Figure 4.10. Comparison of experimentally measured age strengthening effect with predicted formation of iron nitride
4.1.3 SEM analysis. To support the formation of different nitride phases in iron and its
effect on aging, a SEM (Scanning Electron Microscope) study was undertaken to observe
the presence of these inclusions. For this study, the samples were chosen from Heat 6 of
Table 3.1, because these samples also contained other nitride formers which correlate to
the actual foundry practices. A low magnification EDS map was taken to get information
on the location of titanium and aluminum inclusions (Figure 4.11). The blue region
represents iron, the green region is oxygen, yellow region is aluminum and red region is
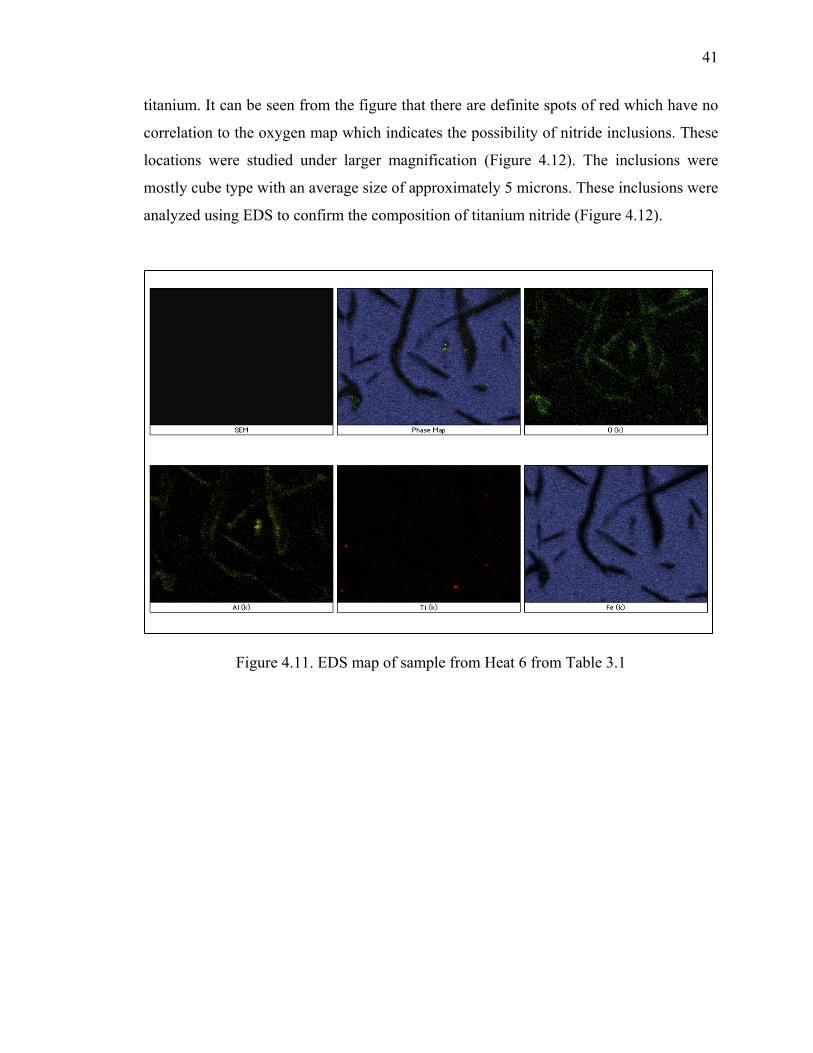
41
titanium. It can be seen from the figure that there are definite spots of red which have no
correlation to the oxygen map which indicates the possibility of nitride inclusions. These
locations were studied under larger magnification (Figure 4.12). The inclusions were
mostly cube type with an average size of approximately 5 microns. These inclusions were
analyzed using EDS to confirm the composition of titanium nitride (Figure 4.12).
Figure 4.11. EDS map of sample from Heat 6 from Table 3.1

42
Figure 4.12. TiN inclusion in Heat 6 of Table 6 and EDS spectra of the same

43
4.2. KINETICS OF AGE STRENGTHENING
Results in section 3.2 for elevated temperature aging (Figure 3.2.) shows that full natural
aging was completed in 25 days, which is significantly longer than the 15 days observed
in previous studies (Nicola et al 2001). The difference in aging kinetics could be
explained by chemistry variations (see Table 4.3). The iron, which showed faster aging,
had a higher concentration of free nitrogen and a lower manganese content. Manganese
can significantly retard the nucleation of iron nitrides in steel (Enrietto et al. 1962) by
forming a substitutional and interstitial complex in the α-Fe23. Thus, a combination of
lower free nitrogen and higher manganese may have contributed to a slower room
temperature age-hardening response in the current study. The Mn-N complexes are also
known to interact with dislocations and produce strengthening. Thus, the loss in strength
and hardness just prior to the onset of age strengthening may be related to the depletion
of nitrogen from these Mn-N-dislocation complexes.

44
Table 4.3. Comparison of iron chemistry and aging time at room temperature
Parameters
Previous test
(Richards, et al.,
2001)
Current study
Manganese, wt.% 0.51 0.80-0.83
Nitrogen, wt.% 0.0094 0.007-0.008
Aluminum, wt.% 0.003 0.005
Titanium, wt.% 0.012 0.014
Boron, wt.% 0.002 0.008
Soluble interstitial, wt.%
(N – 0.33Ti)
0.0054
.0028
Natural aging time, days 15 28
Measured strength data were converted to a fraction precipitated, Vf, using the following
relationship between the peak strength, Smax, the initial strength at t = 0, Smin, and the
strength measured during aging, S(t):
1−Vf =Smax − S(t)Smax − Smin
(4.3)
45
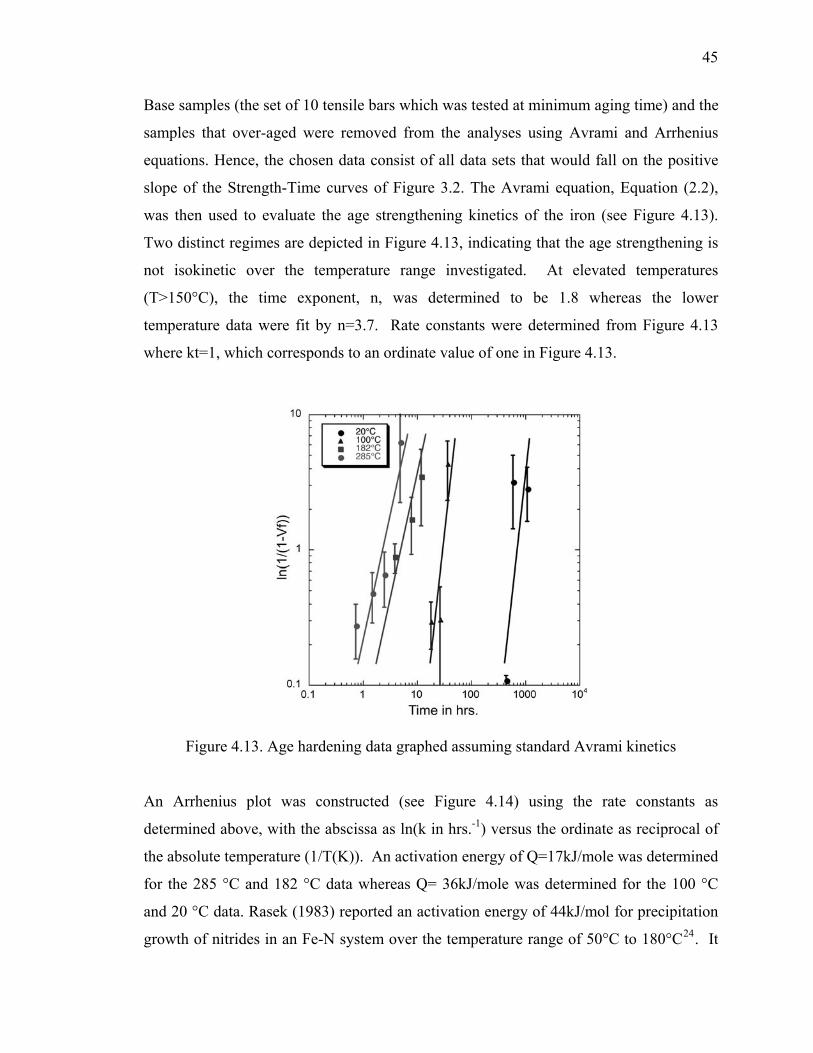
Base samples (the set of 10 tensile bars which was tested at minimum aging time) and the
samples that over-aged were removed from the analyses using Avrami and Arrhenius
equations. Hence, the chosen data consist of all data sets that would fall on the positive
slope of the Strength-Time curves of Figure 3.2. The Avrami equation, Equation (2.2),
was then used to evaluate the age strengthening kinetics of the iron (see Figure 4.13).
Two distinct regimes are depicted in Figure 4.13, indicating that the age strengthening is
not isokinetic over the temperature range investigated. At elevated temperatures
(T>150°C), the time exponent, n, was determined to be 1.8 whereas the lower
temperature data were fit by n=3.7. Rate constants were determined from Figure 4.13
where kt=1, which corresponds to an ordinate value of one in Figure 4.13.
Figure 4.13. Age hardening data graphed assuming standard Avrami kinetics
An Arrhenius plot was constructed (see Figure 4.14) using the rate constants as
determined above, with the abscissa as ln(k in hrs.-1) versus the ordinate as reciprocal of
the absolute temperature (1/T(K)). An activation energy of Q=17kJ/mole was determined
for the 285 °C and 182 °C data whereas Q= 36kJ/mole was determined for the 100 °C
and 20 °C data. Rasek (1983) reported an activation energy of 44kJ/mol for precipitation
growth of nitrides in an Fe-N system over the temperature range of 50°C to 180°C24. It
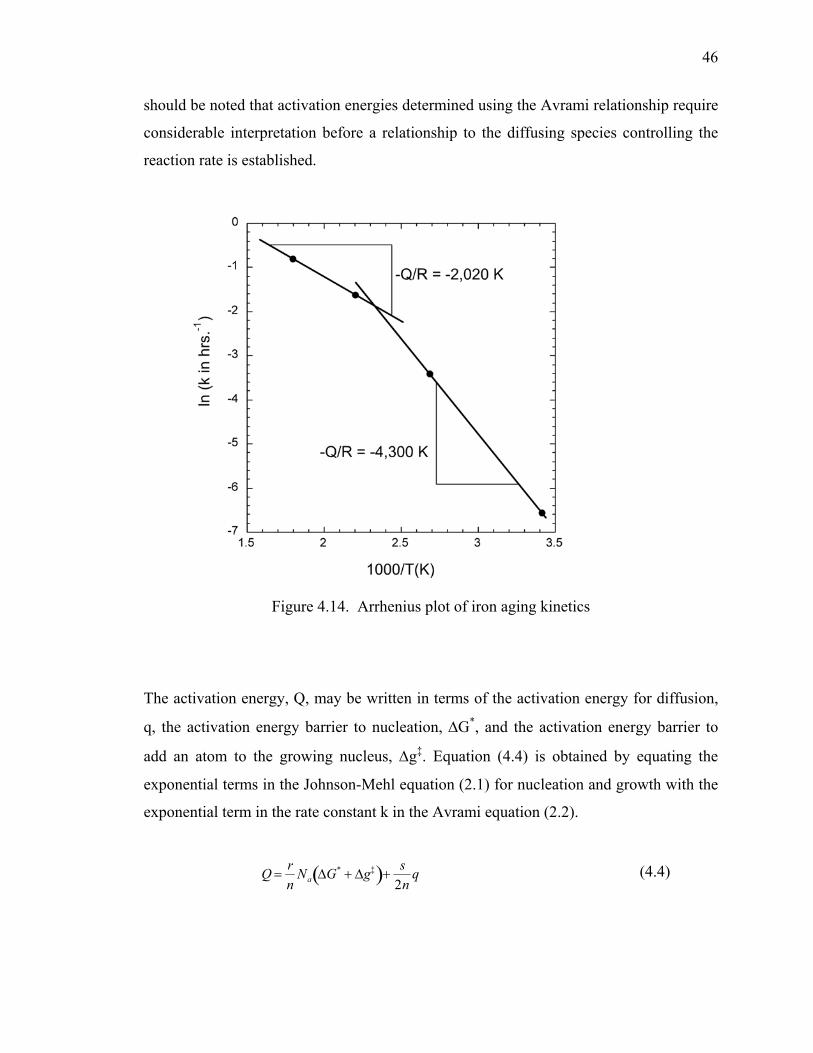
46
should be noted that activation energies determined using the Avrami relationship require
considerable interpretation before a relationship to the diffusing species controlling the
reaction rate is established.
Figure 4.14. Arrhenius plot of iron aging kinetics
The activation energy, Q, may be written in terms of the activation energy for diffusion,
q, the activation energy barrier to nucleation, ΔG*, and the activation energy barrier to
add an atom to the growing nucleus, Δg‡. Equation (4.4) is obtained by equating the
exponential terms in the Johnson-Mehl equation (2.1) for nucleation and growth with the
exponential term in the rate constant k in the Avrami equation (2.2).
Q =rn
Na ΔG* + Δg‡( )+s
2nq (4.4)

47
The expression above is for a transformation where a single new phase grows according
to the parabolic growth law, where the growth velocity, G, is proportional to the
diffusivity to the power 1/2 (D1/2). In evaluating the various activation energies of this
study, the transformation was assumed to be well below the solvus temperature of the
precipitate. Thus, ΔG* will be on the order of 10-19 J/ nucleus. For interstitials, Δg‡ was
assumed to be zero, because interstitials do not occupy a lattice position in the parent
phase and may be transported along the core of dislocations at the interface. Activation
energies for diffusion (q) were then calculated for the different regimes and time
exponents. For temperatures below 150°C, the time exponent was measured as 3.7,
indicating a decreasing nucleation rate (r = 0.7) and spherical growth (s = 3) of the
nucleus. An activation energy of 60kJ/mole was calculated for volume diffusion using
Equation (6). The accepted value for nitrogen diffusion in α-Fe as measured by Wert
(1950) is 76.1 kJ/mole25.
At temperatures above 200°C, iron nitrides are known to precipitate on dislocations and
grow as discs with habit planes of {100}α-Fe for α”- Fe16N2 or {210} α-Fe for γ’-Fe4N
Edmonds and Honeycombe (1978). Thus, the nucleation could be considered as site
saturated (r = 0) where all of the nuclei exist at the beginning of the transformation. If
n=2 is assumed for the time exponent, which corresponds to the growth of a disc-shaped
particle (s = 2), then a value of 34kJ/mole is calculated for the pipe diffusion of nitrogen
along the dislocation core, which is approximately half the activation energy for lattice
diffusion.
4.3. MECHANISM OF AGE STRENGTHENING
Edmonds and Honeycombe (1978) provided a review of quench aging studies in Fe-N
alloys that indicates a three-stage precipitation process beginning with the formation of
interstitial-atom clusters, followed by nucleation of α”- Fe16N2 , and ending with
equilibrium γ’-Fe4N. Precipitation of α”- Fe16N2 can be nucleated homogeneously at low
temperatures and high nitrogen supersaturations or heterogeneously on dislocations at
higher temperatures and low nitrogen supersaturations. At temperatures above 200°C,

48
the metastable α”- Fe16N2 is replaced by the ordered γ’-Fe4N. This paper proposes that
the same sequence occurs during the age strengthening of gray irons. In this regard, the
neutron scattering studies reported by Edington et al. (2002) support evidence of
interstitial atom clusters in the order of 2-4nm that are spherical in shape, and the low
temperature kinetic results (activation energy of 60kJ/mole for iron nitride precipitation)
reported in the previous section support that conclusion where the time exponent (n=3.7)
suggests an equiax-shaped precipitate. The rate of cluster formation also appears to be
affected by manganese concentration where high manganese concentrations may retard
cluster formation. Furthermore, the apparent dip in strength and hardness data prior to
the onset of age strengthening may be a result of dissociation of nitrogen from N-Mn-
dislocation complexes and the initial stages of nitrogen cluster formation. The strength of
these clusters would be proportional to the cluster radius and the cluster volume fraction
to the power of ½ (r1/2Pf1/2), which assumes that the cluster is sheared by a moving
dislocation. At longer aging times, α”- Fe16N2 precipitates on dislocations and depletes
the clusters via pipe diffusion along dislocation cores. It should be anticipated that α”-
Fe16N2 precipitation may be more homogeneous in irons with higher nitrogen
supersaturations than in those studied here. Aging temperatures of 182°C and 285°C are
most likely above the solvus temperature of α”- Fe16N2 for the irons studied here, and
heterogeneous precipitation of γ’-Fe4N on dislocation would be anticipated. This
conclusion is supported by the low value of activation energy and a time exponent that
roughly agrees with the growth of a disk-shaped particle as expected for γ’-Fe4N.
Furthermore, the strength aging curves at 182°C and 285°C suggest a single precipitation
event.
Modeling the low-temperature age-strengthening response in gray irons is complicated by
the manganese effect; however, the results from this study suggest that irons can be
formulated with low manganese and high nitrogen to obtain a quicker aging response.
Heat treatment may also be an option and possibly less dependent upon the manganese
content. The following relationship is based upon the 182°C and 285 °C aging kinetics
observed in this study, where the time to peak age, tpeak, is calculated in hours and
temperature, and T is the absolute temperature in Kelvin.

49
tpeak = 0.171exp 2020T
(4.4)
Peak aging times of 14.5 hours and 6.4 hours are predicted for the aging temperatures of
182°C and 285°C, respectively, using Equation (4.4). Complete understanding of age
strengthening in gray irons will require further study and it should be cautioned that
Equation (4.4) does not account for alloy chemistry, e.g., nitrogen and manganese, which
may affect both the precipitate sequence and aging kinetics.
50
5. CONCLUSIONS
It can be concluded from the alloying effects experiment is that titanium and aluminum
suppress age strengthening. The effect of free nitrogen was also verified. The
thermodynamics of nitride precipitation reactions occurring during age strengthened
explained the effect of titanium and nitrogen on aging. The experimentally measured
values of age strengthening correlate to the potential equilibrium quantities of iron nitride
at room temperature estimated by FACTSAGE.
The kinetics study revealed that the age-strengthening phenomenon in gray iron is not
limited to a single mechanism at all temperatures and that over-aging is possible. Full
strength can be achieved in as little as 4-6 hours at 285°C. Approximate activation
energy values have been obtained that show the aging process is most likely associated
with nitrogen clusters at low temperatures and nitride precipitation at elevated
temperatures. Activation energy for diffusion of nitrogen in gray iron was found to be
34kJ/mole at temperatures below 150oC and 60kJ/mole for temperatures above 200oC. A
predictive model for the time to peak age was formulated based upon the elevated
temperature aging study and may be useful in planning accelerated aging processes at
temperatures between 150°C and 300°C.

51
APPENDICES
52
APPENDIX A.
A. COMPOSITION EFFECTS ON AGE STRENGTHENING OF GRAY IRON

53
Composition Effects on Age Strengthening of Gray Iron
Von L. Richards, Thottathil V. Anish, Simon Lekakh, and David C. Van Aken
University of Missouri – Rolla, Rolla, MO
Wayne Nicola,
Consultant, Warsaw, IN
Copyright 2006 American Foundry Society
ABSTRACT Due to the apparent influence of nitrogen solubility in ferrite on the age strengthening behavior of gray iron, a study
was undertaken of the effects of nitrogen and elements that should interact strongly with it on the basis of
thermodynamics. Those elements that were considered in addition to nitrogen were aluminum, titanium, and boron.
This study used a designed experiment approach to study the effects of these elements in gray cast iron alloys that were
synthesized from pure materials. Aging behavior was measured in terms of the change in strength for a fixed time
interval at various combinations of the composition. Data suggests that for the range of compositions usually
encountered, nitrogen has a strong influence on increasing the age-strengthening, aluminum and titanium have a strong
influence on decreasing age-strengthening and the effect of boron was not as statistically significant in this study as
titanium and aluminum. Titanium and aluminum were found to be the most effective at suppressing age-strengthening
behavior.
Previous work on this subject by Nicola and Richards (1999) has demonstrated statistically that there is significant age
strengthening in most gray cast iron alloys. The increase is in the range of 3.3 to a high of 13.5%. The same authors
have demonstrated the machinability improvements with aging. The Temperature dependence and kinetics were also
studied and established. Evidence of precipitate formation has been shown using neutron scattering methods.
Differential thermal analysis studies have revealed two significant exothermic reactions in fully aged gray iron: one at
250o C and the other at 530o C. At 250o C, transformation of metastable Fe-N to stable Fe-N happens and the second
transformation is the ternary eutectoid transformation.
INTRODUCTION This work is the result of AFS related research. The research is the continuation of previous work done by Nicola and
Richards. They have proved statistically the existence of aging and the effects of nitrogen (1999, 2000). The strength
increase kinetics follow an Avrami-Johnson-Mehl curve, so that much of the change occurs in the initial few days. In
the early work (Phase II in 2000 – Richards, Van Aken and Nicola) from foundry A and B, where some castings aged

54
and others did not, nitrogen content in excess of that which could be taken out of solution by titanium was found to be
the important factor. Their studies have indicated the presence of iron nitride and/or carbo-nitride forming as the
mechanism for aging. The presence of titanium does not appear to enhance or retard the age strengthening provided
nitrogen is in excess to that required for stoichiometric titanium nitride compound. Age strengthening is not observed
when there is a large excess of titanium. Also, there is strong evidence that the gray iron aging process is a precipitation
process. In Phase III (2001 Nicola and Richards) it was found that the aging process may be accelerated by elevating
the temperatures to 180o C. Improvements in machinability occur concurrently with the strengthening of gray Iron.
Various machining parameters were studied by Richards, Nicola and Van Aken (2002) and the results show a similar
Avrami-Johnson-Mehl relationship with the time of aging. Later, Richards, Nicola and Van Aken (2003) established
the strengthening phenomenon as a precipitation process through differential thermal analysis and neutron scattering
measurements, which is reasonable in light of the Avrami-Johnson-Mehl transformation kinetics.
The objective of this study was to evaluate the effects the minor alloying elements Al, B, N & Ti on the age
strengthening process. The electropositive elements were chosen such that they are strong nitride formers in ferrous
metallurgy.
EXPERIMENTAL PROCEDURE
DESIGN OF THE EXPERIMENT A combination of compositions of Ti, B, Al and N to be added with the base iron was developed based on a factorial
model. The compositions and ranges were determined based on input from the participating foundry co-sponsors. The
matrix of compositions for the sixteen heats is given below in Table 1, and the base iron aim composition is shown in
Table 2.
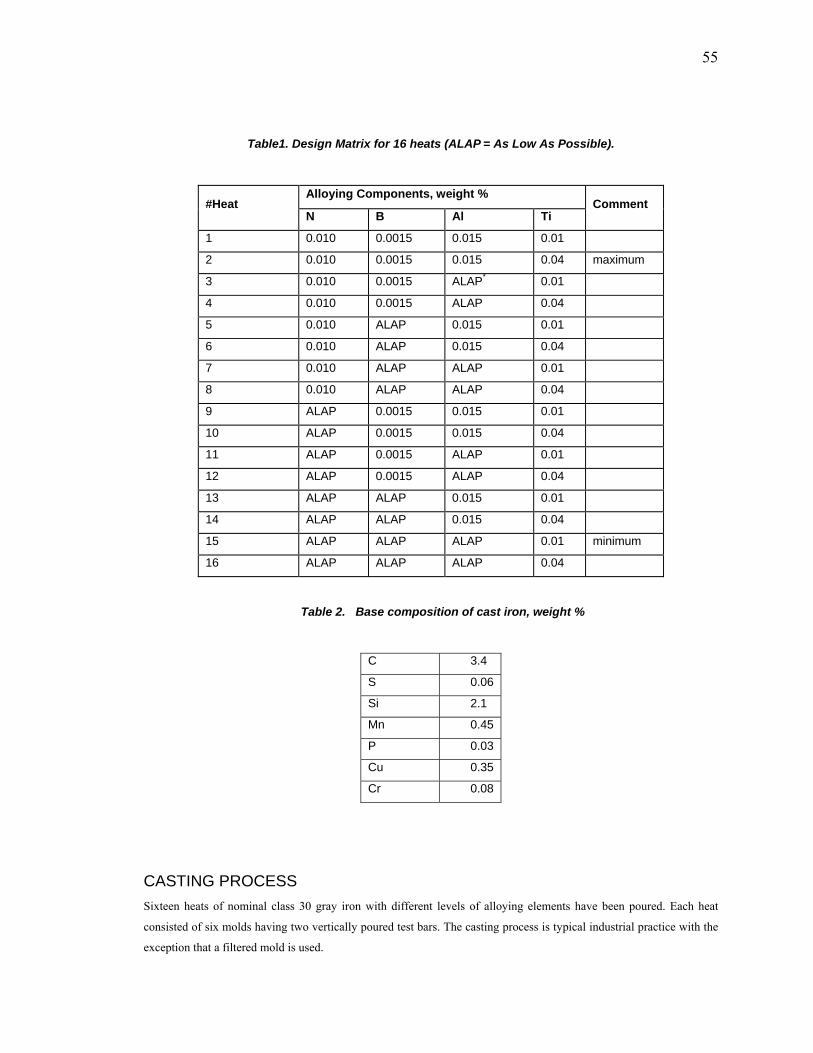
55
Table1. Design Matrix for 16 heats (ALAPP
= As Low As Possible).
Alloying Components, weight %
#Heat N B Al Ti
Comment
1 0.010 0.0015 0.015 0.01
2 0.010 0.0015 0.015 0.04 maximum
3 0.010 0.0015 ALAP* 0.01
4 0.010 0.0015 ALAP 0.04
5 0.010 ALAP 0.015 0.01
6 0.010 ALAP 0.015 0.04
7 0.010 ALAP ALAP 0.01
8 0.010 ALAP ALAP 0.04
9 ALAP 0.0015 0.015 0.01
10 ALAP 0.0015 0.015 0.04
11 ALAP 0.0015 ALAP 0.01
12 ALAP 0.0015 ALAP 0.04
13 ALAP ALAP 0.015 0.01
14 ALAP ALAP 0.015 0.04
15 ALAP ALAP ALAP 0.01 minimum
16 ALAP ALAP ALAP 0.04
Table 2. Base composition of cast iron, weight %
C 3.4
S 0.06
Si 2.1
Mn 0.45
P 0.03
Cu 0.35
Cr 0.08
CASTING PROCESS Sixteen heats of nominal class 30 gray iron with different levels of alloying elements have been poured. Each heat
consisted of six molds having two vertically poured test bars. The casting process is typical industrial practice with the
exception that a filtered mold is used.
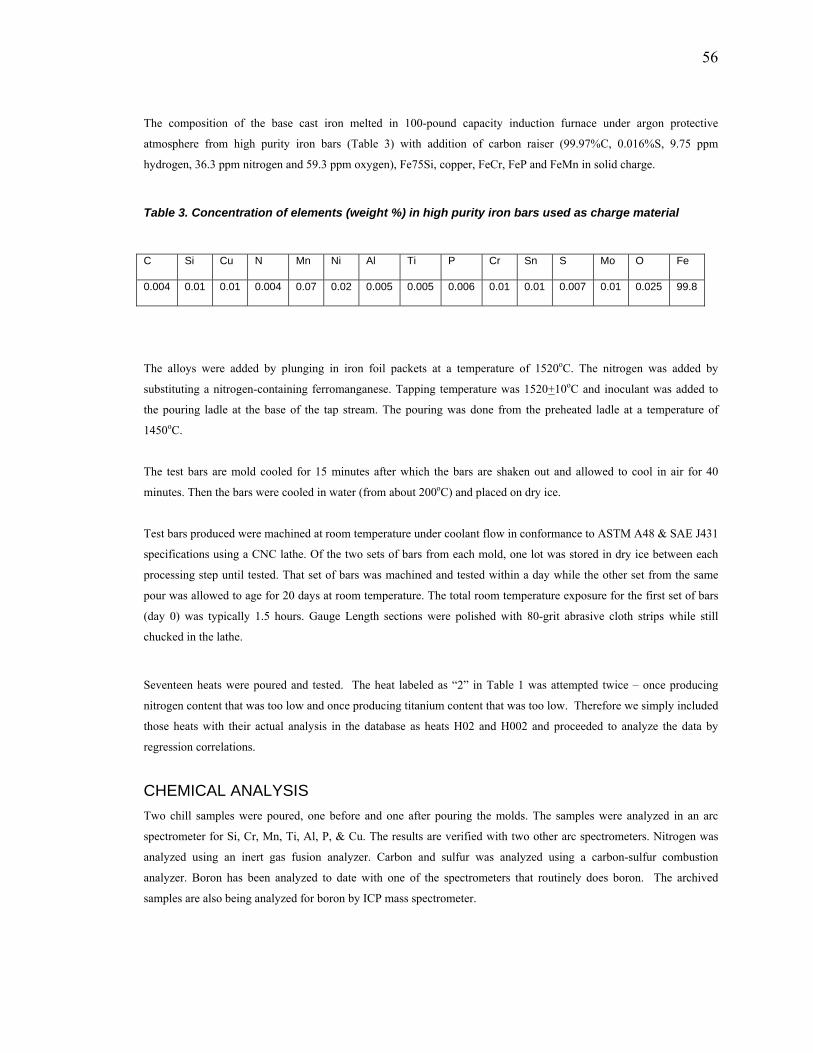
56
The composition of the base cast iron melted in 100-pound capacity induction furnace under argon protective
atmosphere from high purity iron bars (Table 3) with addition of carbon raiser (99.97%C, 0.016%S, 9.75 ppm
hydrogen, 36.3 ppm nitrogen and 59.3 ppm oxygen), Fe75Si, copper, FeCr, FeP and FeMn in solid charge.
Table 3. Concentration of elements (weight %) in high purity iron bars used as charge material
C Si Cu N Mn Ni Al Ti P Cr Sn S Mo O Fe
0.004 0.01 0.01 0.004 0.07 0.02 0.005 0.005 0.006 0.01 0.01 0.007 0.01 0.025 99.8
The alloys were added by plunging in iron foil packets at a temperature of 1520oC. The nitrogen was added by
substituting a nitrogen-containing ferromanganese. Tapping temperature was 1520+10oC and inoculant was added to
the pouring ladle at the base of the tap stream. The pouring was done from the preheated ladle at a temperature of
1450oC.
The test bars are mold cooled for 15 minutes after which the bars are shaken out and allowed to cool in air for 40
minutes. Then the bars were cooled in water (from about 200oC) and placed on dry ice.
Test bars produced were machined at room temperature under coolant flow in conformance to ASTM A48 & SAE J431
specifications using a CNC lathe. Of the two sets of bars from each mold, one lot was stored in dry ice between each
processing step until tested. That set of bars was machined and tested within a day while the other set from the same
pour was allowed to age for 20 days at room temperature. The total room temperature exposure for the first set of bars
(day 0) was typically 1.5 hours. Gauge Length sections were polished with 80-grit abrasive cloth strips while still
chucked in the lathe.
Seventeen heats were poured and tested. The heat labeled as “2” in Table 1 was attempted twice – once producing
nitrogen content that was too low and once producing titanium content that was too low. Therefore we simply included
those heats with their actual analysis in the database as heats H02 and H002 and proceeded to analyze the data by
regression correlations.
CHEMICAL ANALYSIS Two chill samples were poured, one before and one after pouring the molds. The samples were analyzed in an arc
spectrometer for Si, Cr, Mn, Ti, Al, P, & Cu. The results are verified with two other arc spectrometers. Nitrogen was
analyzed using an inert gas fusion analyzer. Carbon and sulfur was analyzed using a carbon-sulfur combustion
analyzer. Boron has been analyzed to date with one of the spectrometers that routinely does boron. The archived
samples are also being analyzed for boron by ICP mass spectrometer.
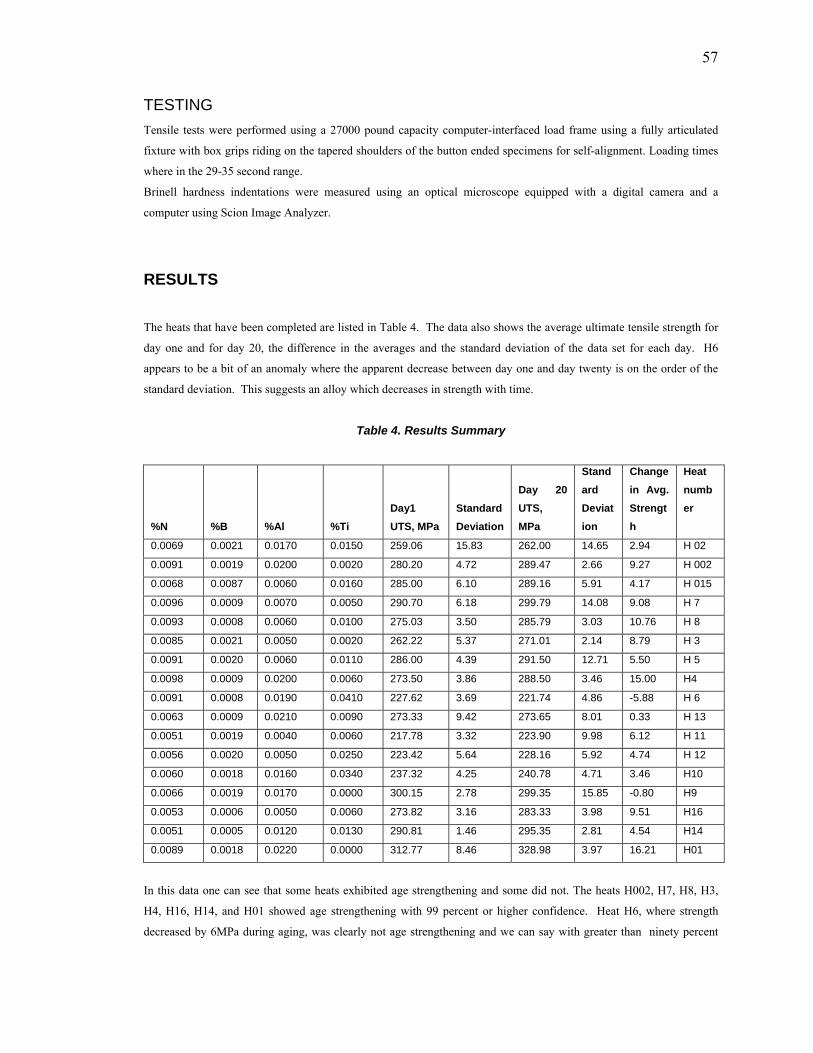
57
TESTING Tensile tests were performed using a 27000 pound capacity computer-interfaced load frame using a fully articulated
fixture with box grips riding on the tapered shoulders of the button ended specimens for self-alignment. Loading times
where in the 29-35 second range.
Brinell hardness indentations were measured using an optical microscope equipped with a digital camera and a
computer using Scion Image Analyzer.
RESULTS The heats that have been completed are listed in Table 4. The data also shows the average ultimate tensile strength for
day one and for day 20, the difference in the averages and the standard deviation of the data set for each day. H6
appears to be a bit of an anomaly where the apparent decrease between day one and day twenty is on the order of the
standard deviation. This suggests an alloy which decreases in strength with time.
Table 4. Results Summary
%N %B %Al %Ti Day1 UTS, MPa
Standard Deviation
Day 20 UTS, MPa
Standard Deviation
Change in Avg. Strength
Heat number
0.0069 0.0021 0.0170 0.0150 259.06 15.83 262.00 14.65 2.94 H 02
0.0091 0.0019 0.0200 0.0020 280.20 4.72 289.47 2.66 9.27 H 002
0.0068 0.0087 0.0060 0.0160 285.00 6.10 289.16 5.91 4.17 H 015
0.0096 0.0009 0.0070 0.0050 290.70 6.18 299.79 14.08 9.08 H 7
0.0093 0.0008 0.0060 0.0100 275.03 3.50 285.79 3.03 10.76 H 8
0.0085 0.0021 0.0050 0.0020 262.22 5.37 271.01 2.14 8.79 H 3
0.0091 0.0020 0.0060 0.0110 286.00 4.39 291.50 12.71 5.50 H 5
0.0098 0.0009 0.0200 0.0060 273.50 3.86 288.50 3.46 15.00 H4
0.0091 0.0008 0.0190 0.0410 227.62 3.69 221.74 4.86 -5.88 H 6
0.0063 0.0009 0.0210 0.0090 273.33 9.42 273.65 8.01 0.33 H 13
0.0051 0.0019 0.0040 0.0060 217.78 3.32 223.90 9.98 6.12 H 11
0.0056 0.0020 0.0050 0.0250 223.42 5.64 228.16 5.92 4.74 H 12
0.0060 0.0018 0.0160 0.0340 237.32 4.25 240.78 4.71 3.46 H10
0.0066 0.0019 0.0170 0.0000 300.15 2.78 299.35 15.85 -0.80 H9
0.0053 0.0006 0.0050 0.0060 273.82 3.16 283.33 3.98 9.51 H16
0.0051 0.0005 0.0120 0.0130 290.81 1.46 295.35 2.81 4.54 H14
0.0089 0.0018 0.0220 0.0000 312.77 8.46 328.98 3.97 16.21 H01
In this data one can see that some heats exhibited age strengthening and some did not. The heats H002, H7, H8, H3,
H4, H16, H14, and H01 showed age strengthening with 99 percent or higher confidence. Heat H6, where strength
decreased by 6MPa during aging, was clearly not age strengthening and we can say with greater than ninety percent

58
confidence that H9 and H13 were not age strengthening and with 61 percent confidence that H02 was not age
strengthening. Therefore the experiment has been successful in suppressing age strengthening and inducing age
strengthening by varying the content of nitrogen, boron, aluminum and titanium in the same basis alloy. Detailed
composition data is shown in Appendix 1.
DISCUSSION OF RESULTS Since the chemical variables used presented some difficulty in reproducible alloy recovery, the traditional ANOVA
approach presented a problem. The ANOVA approach assumes that we have only two values of each independent
variable. However the alloying elements were in ranges. Near the latter portion of the matrix the researchers were able
to improve the technique by inserting the envelopes under the melt quickly enough to avoid loss to slag layer
entrapment.
Multiple variable regression correlation was used to get an initial picture of the relative importance of variables. It is
important to note, as shown in Table 5, that the only compositional effect that increases age strengthening in this
variable set appears to be nitrogen, although the confidence level is low at only 76 percent. Earlier work (Edington,
Nicola, and Richards, 2002) indicated the importance of the nitrogen in limited sets of production iron. Iron heats from
certain families of foundries where the nitrogen/titanium ratio was significantly different between heats showed some
heats that exhibited age strengthening and others that did not. Also, the same authors found that the differential thermal
analysis comparing irons that did not age strengthen to those that did showed evidence of the iron-nitrogen-carbon
ternary eutectoid in the irons that showed age strengthening.
The multiple variable regression correlation approach was used to obtain an idea of the direction of influence and
significance of the composition variables. The multiple variable regression results are shown in Table 6.
Table 5. Multiple Variable Regression Model of Statistical Effects of Variables
Variable Coefficient P-Value Confidence
Nitrogen +788 0.24 76%
Aluminum -324 0.07 93%
Titanium -173 0.09 91%
Boron -390 0.24 76%
Constant 6.07 0.28 72%
The overall equation suggested by the correlations is:
UTS20-UTS0 = 6.07+788*%N-324*%Al-173*%Ti+390*%B
Where “UTS20-UTS0“ is the change in ultimate tensile strength in units of MPa for aging 20 days.
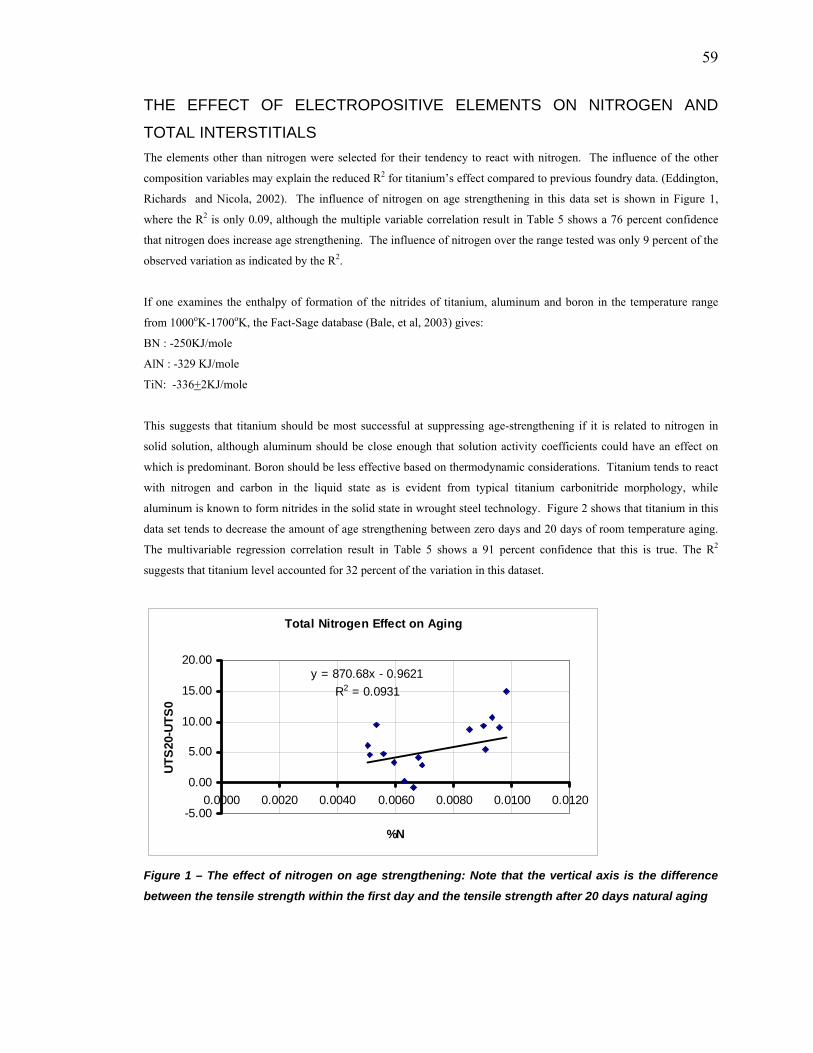
59
THE EFFECT OF ELECTROPOSITIVE ELEMENTS ON NITROGEN AND
TOTAL INTERSTITIALS The elements other than nitrogen were selected for their tendency to react with nitrogen. The influence of the other
composition variables may explain the reduced R2 for titanium’s effect compared to previous foundry data. (Eddington,
Richards and Nicola, 2002). The influence of nitrogen on age strengthening in this data set is shown in Figure 1,
where the R2 is only 0.09, although the multiple variable correlation result in Table 5 shows a 76 percent confidence
that nitrogen does increase age strengthening. The influence of nitrogen over the range tested was only 9 percent of the
observed variation as indicated by the R2.
If one examines the enthalpy of formation of the nitrides of titanium, aluminum and boron in the temperature range
from 1000oK-1700oK, the Fact-Sage database (Bale, et al, 2003) gives:
BN : -250KJ/mole
AlN : -329 KJ/mole
TiN: -336+2KJ/mole
This suggests that titanium should be most successful at suppressing age-strengthening if it is related to nitrogen in
solid solution, although aluminum should be close enough that solution activity coefficients could have an effect on
which is predominant. Boron should be less effective based on thermodynamic considerations. Titanium tends to react
with nitrogen and carbon in the liquid state as is evident from typical titanium carbonitride morphology, while
aluminum is known to form nitrides in the solid state in wrought steel technology. Figure 2 shows that titanium in this
data set tends to decrease the amount of age strengthening between zero days and 20 days of room temperature aging.
The multivariable regression correlation result in Table 5 shows a 91 percent confidence that this is true. The R2
suggests that titanium level accounted for 32 percent of the variation in this dataset.
Total Nitrogen Effect on Aging
y = 870.68x - 0.9621R2 = 0.0931
-5.00
0.00
5.00
10.00
15.00
20.00
0.0000 0.0020 0.0040 0.0060 0.0080 0.0100 0.0120
%N
UTS
20-U
TS0
Figure 1 – The effect of nitrogen on age strengthening: Note that the vertical axis is the difference
between the tensile strength within the first day and the tensile strength after 20 days natural aging

60
Titanium Effect on Aging
y = -245.54x + 8.5547R2 = 0.3202
-5.00
0.00
5.00
10.00
15.00
20.00
0.0000 0.0100 0.0200 0.0300 0.0400 0.0500
% Ti
UTS
20-U
TS0
Figure 2 – The effect of titanium on age strengthening: this is the strongest variable in terms of
correlation coefficient and agrees with previous work using foundry irons
Aluminum Effect on Aging
y = -247.76x + 8.3504R2 = 0.1069
-5.00
0.00
5.00
10.00
15.00
20.00
0.0000 0.0050 0.0100 0.0150 0.0200 0.0250
% Al
UTS
20-U
TS0
Figure 3 – The effect of aluminum in this data set is to suppress age strengthening
The trend of aluminum on suppressing age strengthening as indicated in Figure 3 is in agreement with anecdotal
observations by some of the authors on production foundry irons that did not seem to exhibit age strengthening. The
multiple variable correlation result suggests a 93 percent confidence level that this is true.
A similar analysis using a linear statistical model for boron indicates a weakly suppressing effect for age strengthening
and that boron content only accounts for one percent of the effects on age strengthening in this data set. The multiple
regression result did suggest a 76 percent confidence level that boron had suppressive influence on age strengthening.
This result may be further refined with better boron analysis of the archived samples.

61
In terms of physical metallurgy, aluminum and titanium are relatively effective at removing interstitials from ferrite
(carbon and nitrogen). Titanium carbo-nitrides are observable in gray iron microstructures with planar interfaces that
reflect their crystal structure and suggest formation in contact with the liquid. If we correct the coefficients in the
multiple regression model for the atomic weight ratio between the titanium and nitrogen and aluminum and nitrogen,
we find that the corrected coefficients are closer, 623 for aluminum and 524 for titanium. However, the boron
coefficient becomes significantly smaller.
Figure 4 shows an approximate relationship between the soluble nitrogen estimate used in earlier work and the change
in strength upon aging. Based on atomic mass and 1:1 stoichiometry, the soluble nitrogen estimate is the nitrogen
content minus one-third of the titanium content. The trend line shows an R2 of 0.26 which is not as good as the data
from the earlier work used by Eddington, Nicola, and Richards (2002). This is probably due to the variation of
aluminum in the current dataset while in the cited paper the two foundries analyzed were both targeting a very limited
range of aluminum values. Another confounding factor is that titanium also reacts with carbon and the reaction product
is a mixed carbide-nitride solid solution.
Estimated Free Nitrogen
y = 568.07x + 3.1923R2 = 0.2606
-5.00
0.00
5.00
10.00
15.00
20.00
-0.01 -0.005 0 0.005 0.01
N-.33Ti
UTS
20-U
TS0
Figure 4 – Estimate of soluble nitrogen as a controlling variable for age-strengthening
A qualitative model of how these factors work together would assume that nitrogen and carbon in the ferrite are
reacting to form a precipitate during the age-strengthening process. The titanium removes nitrogen from the iron
during solidification and lowers the available nitrogen for solution in the ferrite. Aluminum may also remove some
nitrogen during solidification and it may remove some as the casting cools through the austenite temperature range
forming aluminum nitride or carbo-nitrides. The net effect of titanium and aluminum is to reduce the solubility of
nitrogen in the ferrite and possibly the carbon solubility in ferrite. This leaves less reactant for the low temperature
aging process.

62
CONCLUSION
The conclusions that one can draw immediately are:
1. Titanium and aluminum both strongly reduce age strengthening behavior.
2. Nitrogen tends to increase age strengthening.
Recommendations for further work would include:
1. Machinability effects of suppressing age strengthening behavior using aluminum.
2. Hot-Stage transmission electron microscopy studies of alloys that highly age strengthen.
3. Transmission electron microscopy of reaction product species involved in suppressing age strengthening.
4. Review boron effect after analysis of boron by ICP mass spectrometer.
Another area that may be of interest would be to examine alloying elements that have an influence on the kinetics – for
example affecting the diffusivities of nitrogen and carbon. The objective would be chemically increasing the rate of
aging to shorten aging times.
ACKNOWLEDGEMENT
The authors wish to acknowledge the support and guidance of the cosponsoring foundries and the guidance of
the AFS 5H and 5I committees. The authors wish to recognize the contributions of undergraduate assistants who have
worked on this project: Justin Novotny, Marilyn Emanuel, Sarah Taylor, William Cason, Ryan Spoering, and Allison
Finch.
This paper is based on work supported by the U.S. Department of Energy under award number DE-FC36-
04GO/4230 as subcontracted through Advanced Technology Institute. Any findings, opinions and conclusions or
recommendations in this report are those of the authors and do not necessarily reflect the views of the Department of
Energy.
REFERENCES
Bale, C. W., Pelton, A.D., Thompson, W.T., Eriksson, G., Hack, K., Chartrand, P., Degterov, S., Melancon, J., and
Peterson S., Factsage 5.2, CRCT, Ecole Polytechnique, Montreal 2003
Edington, J, Nicola, W. M. and Richards, V., “Age Strengthening of Gray Cast Iron, Nitrogen Effects and
Machinability”, AFS Transactions, Volume 110, No: 2, pp 983-993 (2002) Nicola, W. M. and Richards, V., “Age strengthening of Gray Cast Iron, Phase I: Statistical Verification”, AFS
Transactions, Volume 107, pp 749-756 (1999)
Nicola, W. M., and Richards, V., “Age Strengthening of Gray Cast Iron, Phase II: Nitrogen and Melting method
effects”, AFS Transactions, Volume 108, pp 233-237 (2000)
Nicola, W. M. and Richards, V., “Age Strengthening of Gray Cast Iron, Phase III: Effect of Aging temperature”,
AFS Transactions, Volume 109, pp 1085-1095 (2001)
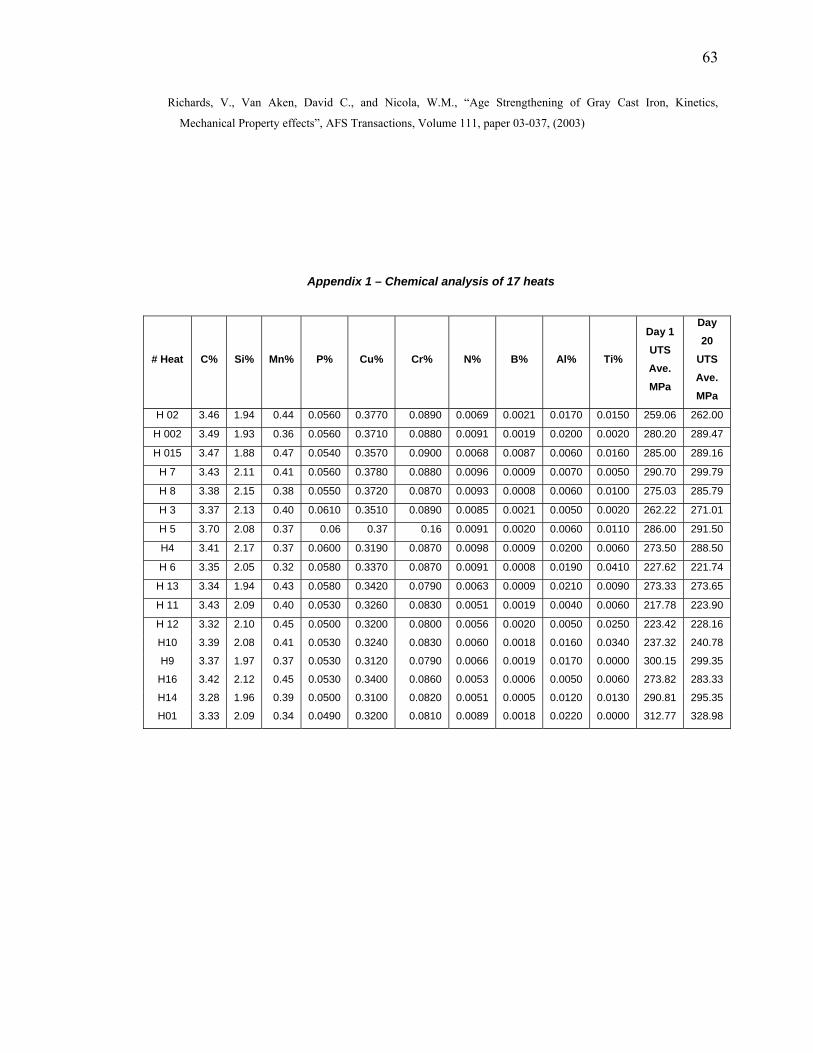
63
Richards, V., Van Aken, David C., and Nicola, W.M., “Age Strengthening of Gray Cast Iron, Kinetics,
Mechanical Property effects”, AFS Transactions, Volume 111, paper 03-037, (2003)
Appendix 1 – Chemical analysis of 17 heats
# Heat C% Si% Mn% P% Cu% Cr% N% B% Al% Ti%
Day 1 UTS Ave. MPa
Day 20
UTS Ave. MPa
H 02 3.46 1.94 0.44 0.0560 0.3770 0.0890 0.0069 0.0021 0.0170 0.0150 259.06 262.00
H 002 3.49 1.93 0.36 0.0560 0.3710 0.0880 0.0091 0.0019 0.0200 0.0020 280.20 289.47
H 015 3.47 1.88 0.47 0.0540 0.3570 0.0900 0.0068 0.0087 0.0060 0.0160 285.00 289.16
H 7 3.43 2.11 0.41 0.0560 0.3780 0.0880 0.0096 0.0009 0.0070 0.0050 290.70 299.79
H 8 3.38 2.15 0.38 0.0550 0.3720 0.0870 0.0093 0.0008 0.0060 0.0100 275.03 285.79
H 3 3.37 2.13 0.40 0.0610 0.3510 0.0890 0.0085 0.0021 0.0050 0.0020 262.22 271.01
H 5 3.70 2.08 0.37 0.06 0.37 0.16 0.0091 0.0020 0.0060 0.0110 286.00 291.50
H4 3.41 2.17 0.37 0.0600 0.3190 0.0870 0.0098 0.0009 0.0200 0.0060 273.50 288.50
H 6 3.35 2.05 0.32 0.0580 0.3370 0.0870 0.0091 0.0008 0.0190 0.0410 227.62 221.74
H 13 3.34 1.94 0.43 0.0580 0.3420 0.0790 0.0063 0.0009 0.0210 0.0090 273.33 273.65
H 11 3.43 2.09 0.40 0.0530 0.3260 0.0830 0.0051 0.0019 0.0040 0.0060 217.78 223.90
H 12 3.32 2.10 0.45 0.0500 0.3200 0.0800 0.0056 0.0020 0.0050 0.0250 223.42 228.16
H10 3.39 2.08 0.41 0.0530 0.3240 0.0830 0.0060 0.0018 0.0160 0.0340 237.32 240.78
H9 3.37 1.97 0.37 0.0530 0.3120 0.0790 0.0066 0.0019 0.0170 0.0000 300.15 299.35
H16 3.42 2.12 0.45 0.0530 0.3400 0.0860 0.0053 0.0006 0.0050 0.0060 273.82 283.33
H14 3.28 1.96 0.39 0.0500 0.3100 0.0820 0.0051 0.0005 0.0120 0.0130 290.81 295.35
H01 3.33 2.09 0.34 0.0490 0.3200 0.0810 0.0089 0.0018 0.0220 0.0000 312.77 328.98

64
APPENDIX B
B. AGE STRENGTHENING OF GRAY IRON – KINETICS STUDY

65
Age Strengthening of Gray Iron – Kinetics Study
Von L. Richards, Thottathil V. Anish, Simon Lekakh, and David C. Van Aken
University of Missouri – Rolla
Wayne Nicola, Consultant, Warsaw, IN
Copyright 2007 American Foundry Society
ABSTRACT Kinetics of gray cast iron strengthening at room and elevated temperature (100°C, 182°C and 285°C) were studied
using 100 specimens cast from one industrial heat of gray iron. Tensile strength and Brinell hardness was measured
during age strengthening. Peak aging was observed at shorter times for higher temperatures and over-aging was
observed at 182°C and 285°C. Statistically significant data was used for evaluating aging kinetics and the
determination of activation energies for precipitation. Tensile strength-temperature-time curves were described using
Arrhenius and Avrami-Johnson-Mehl kinetics and an attempt was made to create a predictive model for age
strengthening in gray iron. Earlier literature and a current study with another foundry indicate improvement of
machinability with aging. The proposed model will help in optimizing the process for maximum tool life.
INTRODUCTION This work is the result of AFS-CMC related research. The research is the continuation of previous work done by Nicola
and Richards. Nicola and Richards (1999) demonstrated statistically that there is significant age strengthening in most
gray cast iron alloys. The increase in tensile strength range from 3.3% to a high of 13.5%. The rate of increase follows
an Avrami-Johnson-Mehl curve, so that much of the change occurs in the initial few days. Also, during this phase the
excess nitrogen (the nitrogen in excess of the stoichometric amount to combine with Ti as TiN) was found to be an
important factor. Nicola and Richards proposed that age strengthening was related to the interaction of nitrogen with
dislocations. The diffusivity of nitrogen is significant at room temperature and could facilitate this mechanism. In
Phase II of this study, Richards, Van Aken and Nicola (2000) verified that the presence of a strong nitride former (like
Ti) can reduce the strengthening effect in iron, but did not fully eliminate the aging. The effect of nitrogen as a strength
enhancer was confirmed in this research. The possibilities of precipitation of nitrides in the solid state and nitrogen in
interstitial interaction with dislocations have been mentioned ( Leslie , 1981). Another possibility that they noted is the
development of titanium-nitrogen substitutional interstitial defect clusters, similar to that formed in steel (Leslie, 1981).
These results in the hardening of iron based alloys containing nitrogen and titanium well in excess of the stoichometric
amounts for the nitrogen. Richards et al (2000) indicated the presence of iron nitride and/or carbo-nitride forming as
66
the mechanism for aging. The presence of titanium does not appear to enhance or retard the age strengthening provided
nitrogen is in excess to that required for stoichometric titanium nitride compound. Age strengthening is not observed
when there is a large excess of titanium (Richards et al., 2006) It is important to note that improvements in machinability occur concurrently with the strengthening of gray iron.
Various machining parameters were studied by Edington et al. (2002) and the results showed a sigmoidal relationship
with the time of ageing (Figure 1). Also in the same year a neutron scattering study was conducted to determine the
mechanism underlying aging. The scattering data revealed a resolved peak for the nitrogen rich gray iron sample at 28
days. This peak corresponded to a particle with a diameter 2-4nm or an ordered array of particles with interparticle
spacing of 3.7nm. This size is similar in magnitude to the iron nitride clusters described by Edmonds and Honeycombe
in 1978. But they did not have enough data to establish this fact since only one of the samples showed this behavior. In
this described study, the role of free nitrogen in age strengthening was established by plotting the changes in UTS with
log time. The age strengthening increased with increase in free nitrogen. Later, through differential scanning calorimetry Richards et al., (2003) established the strengthening phenomenon as a
precipitation process which is reasonable in light of the Avrami-Johnson-Mehl transformation kinetics. Differential
scanning calorimetry studies revealed two significant exothermic reactions in fully aged gray iron: one at 250°C and
the other at 530°C. At 250°C transformation of metastable Fe-N to stable Fe-N happens and the second transformation
is the ternary eutectoid transformation (Figure 2). Low temperature exothermic peak corresponds to the transformation
of the metastable Fe16N2 (α”) to the stable Fe4N (γ’). Furthermore the high temperature exothermic peak may be
considered as the ternary eutectoid transformation (α-Fe + Fe3C + γ’ γ-Fe) at 565°C. Also in this study, it was
reported that hardness increased with time. All of the reported results are consistent with a quench aging phenomenon
associated with free nitrogen in the iron.
Richards et al. (2006) showed the effect of various nitrogen getters on age strengthening. They concluded that Ti had a
strong influence on arresting the age strengthening behavior. An estimate of interstitials could be predicted. Figure 3
illustrates the effect of increasing total interstitials in ferrite on the age strengthening in gray iron. In this work, the
soluble nitrogen was estimated according equation (1)
% soluble nitrogen = %N-0.33%Ti (1)
The goal of this study was evaluation of kinetics of iron strengthening at room and elevated temperatures for predicting
and process design as well as shedding some light on the mechanism of age strengthening in gray irons.
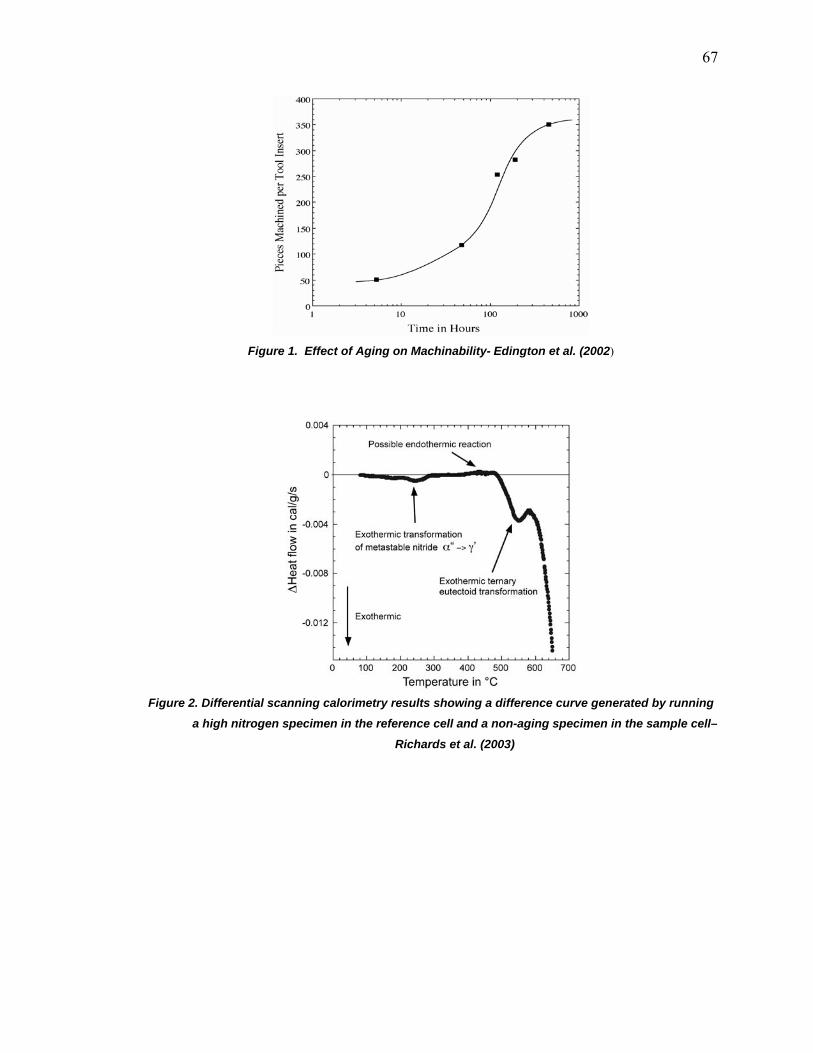
67
Figure 1. Effect of Aging on Machinability- Edington et al. (2002)
Figure 2. Differential scanning calorimetry results showing a difference curve generated by running
a high nitrogen specimen in the reference cell and a non-aging specimen in the sample cell–
Richards et al. (2003)

68
Figure 3. Estimate of soluble nitrogen as a controlling variable for age-strengthening - Richards et
al. (2006)
EXPERIMENTAL PROCEDURE
DESIGN OF THE EXPERIMENT
The experimental conditions were designed based on published experimental data (Richards and Nicola, 2001) and
kinetics based upon Johnson Mehl-Avrami kinetics. A generalized form of the Johnson-Mehl equation is shown as eq.
(2)
Vf =1− exp −π3
JrGst r+s⎛ ⎝ ⎜
⎞ ⎠ ⎟ (2)
where Vf is the fraction transformed, J is the nucleation rate, G is the growth rate, t is the transformation time and r and
s are exponents related to nucleation and growth. The Avrami equation, has also been used to describe phase
transformations. Here the equation is written in a fashion such that the reaction rate constant k will always have units
of reciprocal time.
Vf =1 − exp − kt( )n( ) (3)
The rate constant k is defined by the following relationship
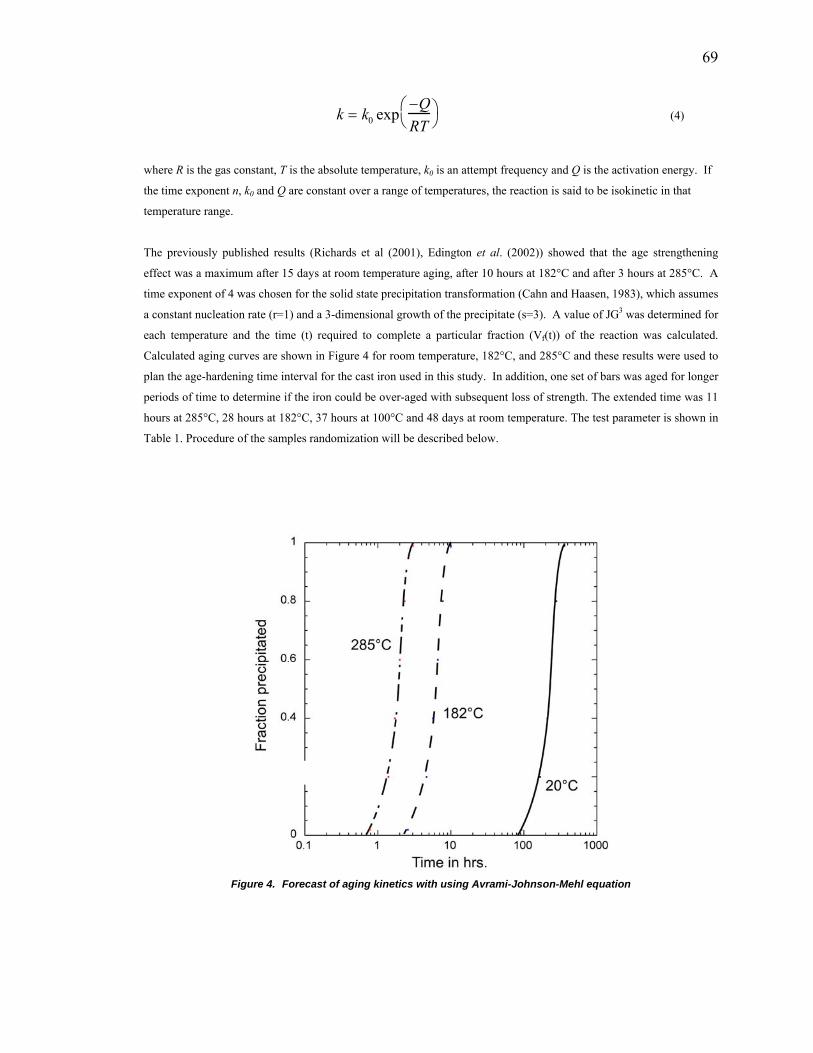
69
k = k0 exp−QRT
⎛ ⎝
⎞ ⎠ (4)
where R is the gas constant, T is the absolute temperature, k0 is an attempt frequency and Q is the activation energy. If
the time exponent n, k0 and Q are constant over a range of temperatures, the reaction is said to be isokinetic in that
temperature range.
The previously published results (Richards et al (2001), Edington et al. (2002)) showed that the age strengthening
effect was a maximum after 15 days at room temperature aging, after 10 hours at 182°C and after 3 hours at 285°C. A
time exponent of 4 was chosen for the solid state precipitation transformation (Cahn and Haasen, 1983), which assumes
a constant nucleation rate (r=1) and a 3-dimensional growth of the precipitate (s=3). A value of JG3 was determined for
each temperature and the time (t) required to complete a particular fraction (Vf(t)) of the reaction was calculated.
Calculated aging curves are shown in Figure 4 for room temperature, 182°C, and 285°C and these results were used to
plan the age-hardening time interval for the cast iron used in this study. In addition, one set of bars was aged for longer
periods of time to determine if the iron could be over-aged with subsequent loss of strength. The extended time was 11
hours at 285°C, 28 hours at 182°C, 37 hours at 100°C and 48 days at room temperature. The test parameter is shown in
Table 1. Procedure of the samples randomization will be described below.
Figure 4. Forecast of aging kinetics with using Avrami-Johnson-Mehl equation
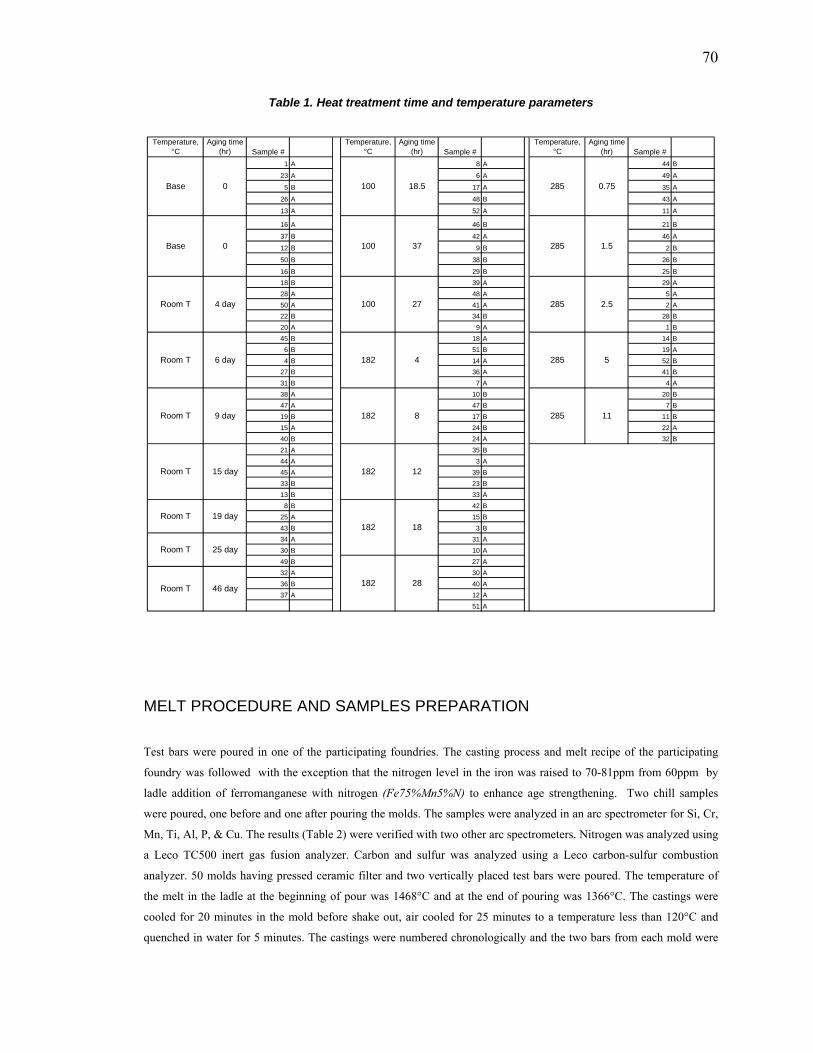
70
Table 1. Heat treatment time and temperature parameters
Temperature,
°C Aging time
(hr) Sample #Temperature,
°C Aging time
(hr) Sample #Temperature,
°C Aging time
(hr) Sample #1 A 8 A 44 B
23 A 6 A 49 A
5 B 17 A 35 A
26 A 48 B 43 A
13 A 52 A 11 A
16 A 46 B 21 B
37 B 42 A 46 A
12 B 9 B 2 B
50 B 38 B 26 B
16 B 29 B 25 B18 B 39 A 29 A28 A 48 A 5 A50 A 41 A 2 A22 B 34 B 28 B20 A 9 A 1 B45 B 18 A 14 B
6 B 51 B 19 A4 B 14 A 52 B
27 B 36 A 41 B31 B 7 A 4 A38 A 10 B 20 B47 A 47 B 7 B19 B 17 B 11 B15 A 24 B 22 A40 B 24 A 32 B21 A 35 B44 A 3 A45 A 39 B33 B 23 B13 B 33 A
8 B 42 B25 A 15 B43 B 3 B34 A 31 A30 B 10 A49 B 27 A32 A 30 A36 B 40 A37 A 12 A
51 A
285 11
Room T 46 day 182 28
285 0.75
285 1.5
285 2.5
285 5
182 12
182 18
182 4
182 8
100 18.5
100 37
100 27
6 dayRoom T
19 dayRoom T
25 dayRoom T
9 dayRoom T
15 dayRoom T
4 dayRoom T
Base 0
0Base
MELT PROCEDURE AND SAMPLES PREPARATION
Test bars were poured in one of the participating foundries. The casting process and melt recipe of the participating
foundry was followed with the exception that the nitrogen level in the iron was raised to 70-81ppm from 60ppm by
ladle addition of ferromanganese with nitrogen (Fe75%Mn5%N) to enhance age strengthening. Two chill samples
were poured, one before and one after pouring the molds. The samples were analyzed in an arc spectrometer for Si, Cr,
Mn, Ti, Al, P, & Cu. The results (Table 2) were verified with two other arc spectrometers. Nitrogen was analyzed using
a Leco TC500 inert gas fusion analyzer. Carbon and sulfur was analyzed using a Leco carbon-sulfur combustion
analyzer. 50 molds having pressed ceramic filter and two vertically placed test bars were poured. The temperature of
the melt in the ladle at the beginning of pour was 1468°C and at the end of pouring was 1366°C. The castings were
cooled for 20 minutes in the mold before shake out, air cooled for 25 minutes to a temperature less than 120°C and
quenched in water for 5 minutes. The castings were numbered chronologically and the two bars from each mold were
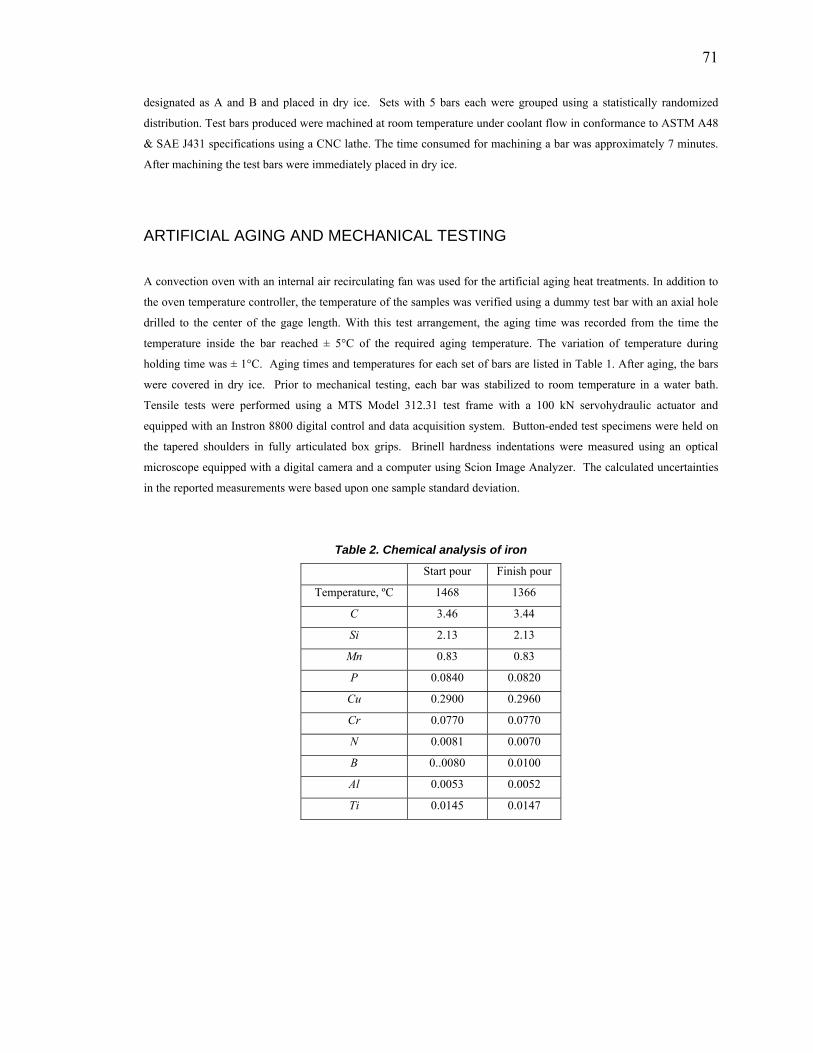
71
designated as A and B and placed in dry ice. Sets with 5 bars each were grouped using a statistically randomized
distribution. Test bars produced were machined at room temperature under coolant flow in conformance to ASTM A48
& SAE J431 specifications using a CNC lathe. The time consumed for machining a bar was approximately 7 minutes.
After machining the test bars were immediately placed in dry ice.
ARTIFICIAL AGING AND MECHANICAL TESTING
A convection oven with an internal air recirculating fan was used for the artificial aging heat treatments. In addition to
the oven temperature controller, the temperature of the samples was verified using a dummy test bar with an axial hole
drilled to the center of the gage length. With this test arrangement, the aging time was recorded from the time the
temperature inside the bar reached ± 5°C of the required aging temperature. The variation of temperature during
holding time was ± 1°C. Aging times and temperatures for each set of bars are listed in Table 1. After aging, the bars
were covered in dry ice. Prior to mechanical testing, each bar was stabilized to room temperature in a water bath.
Tensile tests were performed using a MTS Model 312.31 test frame with a 100 kN servohydraulic actuator and
equipped with an Instron 8800 digital control and data acquisition system. Button-ended test specimens were held on
the tapered shoulders in fully articulated box grips. Brinell hardness indentations were measured using an optical
microscope equipped with a digital camera and a computer using Scion Image Analyzer. The calculated uncertainties
in the reported measurements were based upon one sample standard deviation.
Table 2. Chemical analysis of iron
Start pour Finish pour
Temperature, ºC 1468 1366
C 3.46 3.44
Si 2.13 2.13
Mn 0.83 0.83
P 0.0840 0.0820
Cu 0.2900 0.2960
Cr 0.0770 0.0770
N 0.0081 0.0070
B 0..0080 0.0100
Al 0.0053 0.0052
Ti 0.0145 0.0147
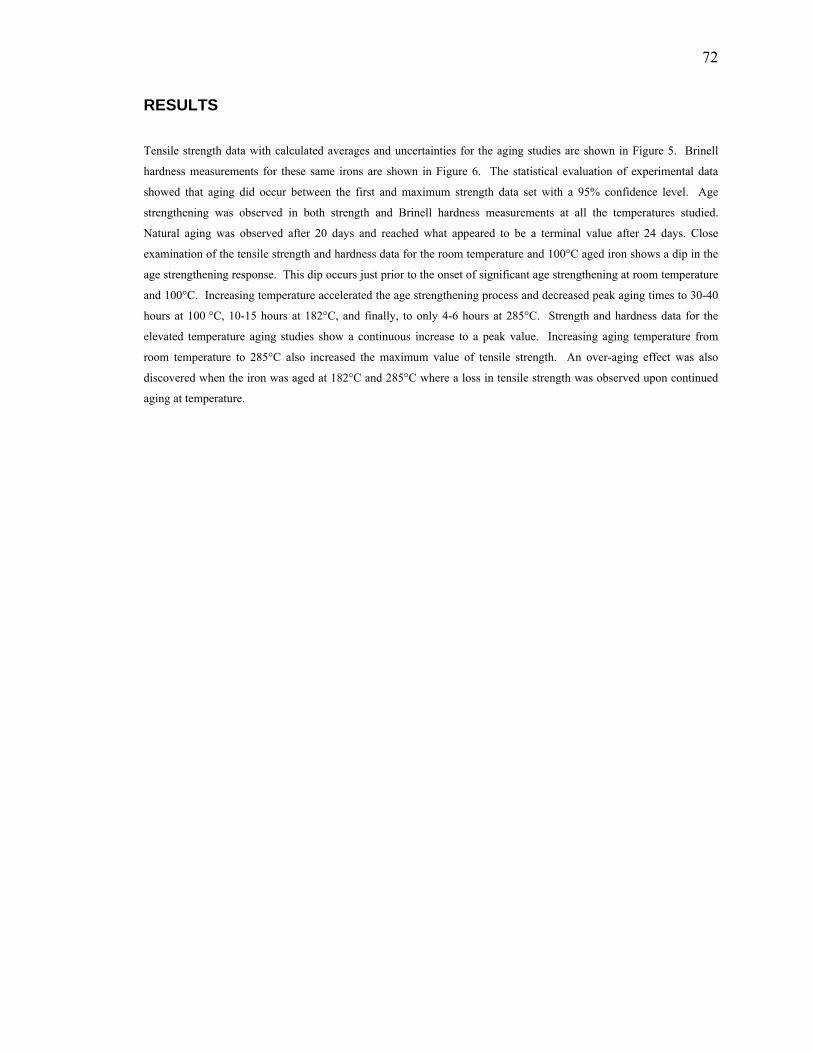
72
RESULTS
Tensile strength data with calculated averages and uncertainties for the aging studies are shown in Figure 5. Brinell
hardness measurements for these same irons are shown in Figure 6. The statistical evaluation of experimental data
showed that aging did occur between the first and maximum strength data set with a 95% confidence level. Age
strengthening was observed in both strength and Brinell hardness measurements at all the temperatures studied.
Natural aging was observed after 20 days and reached what appeared to be a terminal value after 24 days. Close
examination of the tensile strength and hardness data for the room temperature and 100°C aged iron shows a dip in the
age strengthening response. This dip occurs just prior to the onset of significant age strengthening at room temperature
and 100°C. Increasing temperature accelerated the age strengthening process and decreased peak aging times to 30-40
hours at 100 °C, 10-15 hours at 182°C, and finally, to only 4-6 hours at 285°C. Strength and hardness data for the
elevated temperature aging studies show a continuous increase to a peak value. Increasing aging temperature from
room temperature to 285°C also increased the maximum value of tensile strength. An over-aging effect was also
discovered when the iron was aged at 182°C and 285°C where a loss in tensile strength was observed upon continued
aging at temperature.
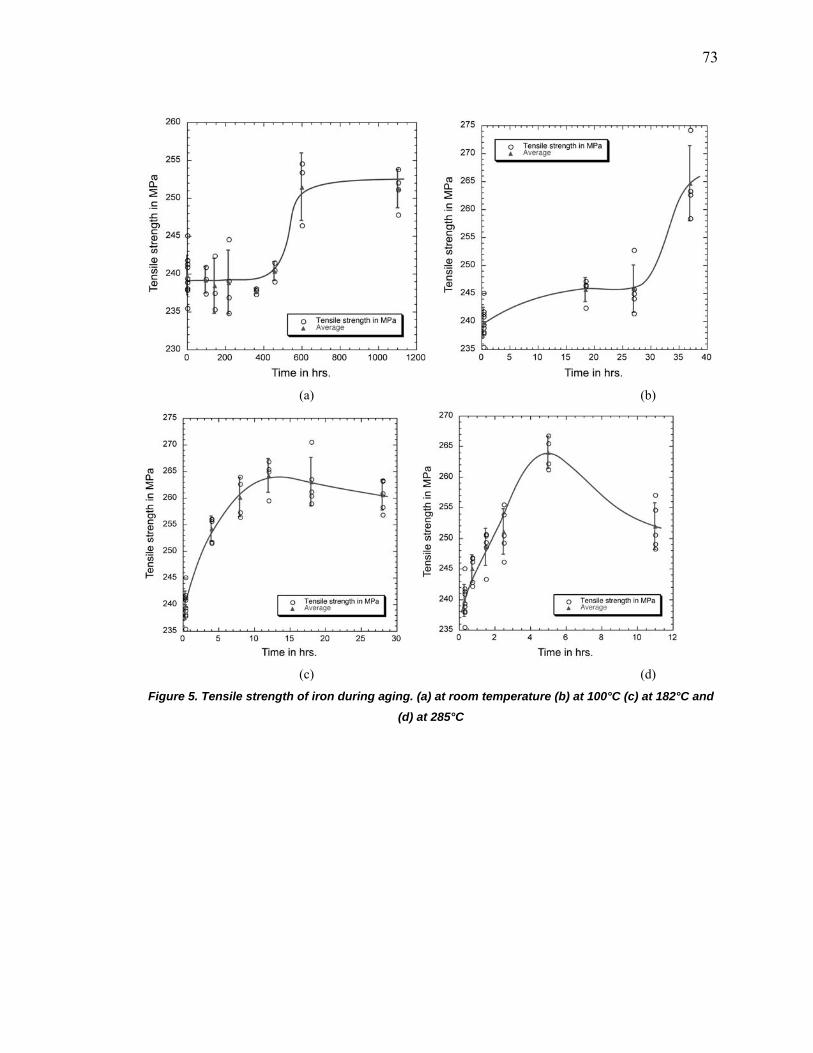
73
(a) (b)
(c) (d)
Figure 5. Tensile strength of iron during aging. (a) at room temperature (b) at 100°C (c) at 182°C and (d) at 285°C
74
(a) (b)
(c) (d)
Figure 6. Brinell hardness of iron during aging. (a) at room temperature (b) at 100°C (c) at 182°C and
(d) at 285°C
DISCUSSION OF RESULTS KINETICS OF IRON AGING
Full natural aging was completed in 25 days which is significantly longer than the 15 days observed in previous studies
(Richards et al 2001). The difference in aging kinetics could be explained by chemistry variations (see Table 3). The
iron, which showed faster aging, had a higher concentration of soluble nitrogen, defined as a difference between total
nitrogen content minus 0.33Ti and a lower manganese content. Manganese can significantly retard the nucleation of
75
nitrides in steel (Enrietto et al. 1962) by forming a substitutional and interstitial complex in the α-Fe. Thus, a
combination of lower free nitrogen and higher manganese may have contributed to a slower room temperature age-
hardening response in the current study. The Mn-N complexes are also known to interact with dislocations and
produce strengthening. Thus, the loss in strength and hardness just prior to the onset of age strengthening may be
related to the depletion of nitrogen from these Mn-N-dislocation complexes.

76
Table 3. Comparison of iron chemistry and aging time at room temperature
Parameters
Previous test
(Richards, et al 2001)
Current study
Manganese, wt.% 0.51 0.80-0.83
Nitrogen, wt.% 0.0094 0.007-0.008
Aluminum, wt.% 0.003 0.005
Titanium, wt.% 0.012 0.014
Boron, wt.% 0.002 0.008
Soluble interstitial, wt.%
(N – 0.33Ti)
0.0054
.0028
Natural aging time, days 15 28
Measured strength data was converted to a fraction precipitated, Vf, using the following relationship between the peak
strength, Smax, the initial strength at t = 0, Smin, and the strength measured during aging, S(t).
1−Vf =Smax − S(t)Smax − Smin
(5)
Base samples and samples that over aged were removed from the analyses. The Avrami equation, eq. (3), was then
used to evaluate the age strengthening kinetics of the iron (see Figure 7). Two distinct regimes are depicted in Figure 7
indicating that the age strengthening is not isokinetic over the temperature range investigated. At elevated temperatures
(T>150°C) the time exponent, n, was determined to be 1.8 whereas the lower temperature data was fit by n=3.7. Rate
constants were determined from Figure 7 where kt=1, which corresponds to an ordinate value of one in Figure 7.

77
Figure 7. Age hardening data graphed assuming standard Avrami kinetics
An Arrhenius plot was constructed (see Figure 8) using the rate constants as determined above using coordinates of
ln(k in hrs.-1) versus the reciprocal of the absolute temperature (1/T(K)). An Activation energy, Q=16.8kJ/mole was
determined for the 285 °C and 182 °C whereas Q= 35.7kJ/mole for the 100 °C and 20 °C data. Rasek(1983) reports an
activation energy of 44kJ/mol for precipitation growth of nitrides in Fe-N system over the temperature range 50 to
180°C. It should be noted that activation energies determined using the Avrami relationship require considerable
interpretation before a relationship to the diffusing species controlling the reaction rate is established.
Figure 8. Arrhenius plot of iron aging kinetics
78
The activation energy Q may be written in terms of the activation energy for diffusion, q, the activation energy barrier
to nucleation, ΔG*, and the activation energy barrier to add an atom to the growing nucleus, Δg‡. Equation (6) is
obtained by equating the exponential terms in the Johnson-Mehl equation for nucleation and growth with the
exponential term in the rate constant k in the Avrami equation.
Q =rn
Na ΔG* + Δg‡( )+s
2nq (6)
The expression above is for a transformation where a single new phase grows according to the parabolic growth law,
where the growth velocity, G, is proportional to the diffusivity to the power 1/2 (D1/2). In evaluating the various
activation energies of this study, the transformation was assumed to be well below the solvus temperature of the
precipitate. Thus, ΔG* will be on the order of 10-19 J/ nucleus. For interstitials, Δg‡ was assumed to be zero, since
interstitials do not occupy a lattice position in the parent phase and may be transported along the core of dislocations at
the interface. Activation energies for diffusion (q) were then calculated for the different regimes and time exponents.
For temperatures below 150°C, the time exponent was measured as 3.7 indicating a decreasing nucleation rate (r = 0.7)
and spherical growth (s = 3) of the nucleus. An activation energy of 59.9kJ/mole was calculated for volume diffusion
using eq. (6). The accepted value for nitrogen diffusion in α-Fe as measured by Wert (1950) is 76.1 kJ/mole.
At temperatures above 200°C, the nitrides are known to precipitate on dislocations and grow as disks with habit planes
of {100}α-Fe for α”- Fe16N2 or {210} α-Fe for γ’-Fe4N. Thus, the nucleation could be considered as site saturated (r = 0)
where all of the nuclei exist at the beginning of the transformation. If we assume n=2 for the time exponent, which
corresponds to growth of a disk-shaped particle (s = 2), a value of 33.6 kJ/mole is calculated for pipe diffusion of
nitrogen along the dislocation core, which is approximately ½ the activation energy for lattice diffusion.
MECHANISM OF IRON AGING
Edmonds and Honeycombe (1978) provide a review of quench aging studies in Fe-N alloys that indicates a three stage
precipitation process beginning with the formation of interstitial-atom clusters, followed by nucleation of α”- Fe16N2
and ending with equilibrium γ’-Fe4N. Precipitation of α”- Fe16N2 can be nucleated homogeneously at low temperatures
and high nitrogen supersaturations or heterogeneously on dislocations at higher temperatures and low nitrogen
supersaturations. At temperatures above 200°C, the metastable α”- Fe16N2 is replaced by the ordered γ’-Fe4N. It is
proposed here that the same sequence occurs during age strengthening of gray irons. In this regard the neutron
scattering studies reported by Edington et al. (2002) support evidence of interstitial atom clusters that are spherical in
shape and the low temperature kinetic results reported in this paper support that conclusion where the time exponent
suggest an equiax-shaped precipitate. The rate of cluster formation also appears to be affected by manganese
concentration where high manganese concentrations may retard cluster formation. Furthermore, the apparent dip in
strength and hardness data prior to the onset of age strengthening may be a result of dissociation of nitrogen from N-
Mn-dislocation complexes and the initial stages of nitrogen cluster formation. Strength of these clusters would be
proportional to the cluster radius and the cluster volume fraction to the power of ½ (r1/2Pf1/2), which assumes the cluster

79
is sheared by a moving dislocation. At longer aging times, α”- Fe16N2 precipitates on dislocations and depletes the
clusters via pipe diffusion along dislocation cores. It should be anticipated that α”- Fe16N2 precipitation may be more
homogeneous in irons with higher nitrogen supersaturations than that studied here. Aging temperatures of 182 °C and
285°C are most likely above the solvus temperature of α”- Fe16N2 for the irons studied here and heterogeneous
precipitation of γ’-Fe4N on dislocation would be anticipated. This conclusion is supported by the low value of
activation energy and a time exponent that roughly agrees with the growth of a disk-shaped particle as expected for γ’-
Fe4N. Furthermore, the strength aging curves at 182°C and 285°C suggest a single precipitation event.
Modeling the low temperature age strengthening response in gray irons is complicated by the manganese effect;
however, the results from this study suggests that irons can be formulated with low manganese and high nitrogen to
obtain a quicker aging response. Heat treatment may also be an option and possibly less dependent upon manganese
content. The following relationship is based upon the 182 °C and 285 °C aging kinetics observed in this study where
the time to peak age, tpeak, is calculated in hours and temperature, T is the absolute temperature in Kelvin.
tpeak = 0.171exp 2020T
(7)
Peak aging times of 14.5 hours and 6.4 hours are predicted for the aging temperatures of 182°C and 285°C using eq.
(7). Complete understanding of age strengthening in gray irons will require further study and it should be cautioned that
eq. (7) does not account for alloy chemistry, e.g. nitrogen and manganese, which may affect both the precipitate
sequence and aging kinetics.
PRACTICAL SIGNIFICANCE
Referring to the paper by Edington et al. (2002) and Figure 1 it is clearly evident that machinability improves with
aging. The kinetics study done in this paper shows that aging can be accelerated and equation 7 helps in calculating the
time for maximum aging, tpeak , for a particular absolute temperature, T. It was found during this study that maximum
strength can be attained significantly faster at a higher temperature as compared to normal room temperature aging.
From the equation 7, we can predict that at 285°C, the maximum strength is attained in just 6.4hr compared to the room
temperature time of 24-25days. Traditional method of storing the castings for several days before machining can be cut
down to just few hours at a higher temperature resulting in savings in floor space and inventory costs.
CONCLUSION The current study revealed that the age strengthening phenomenon in gray iron is not limited to a single mechanism at
all temperatures and that over aging is possible. Full strength can be achieved in as little as 4-6 hours at 285°C.
Approximate activation energy values have been obtained that show the aging process is most likely associated with
nitrogen clusters at low temperatures and nitride precipitation at elevated temperature. A predictive model for the time
80
to peak age was formulated based upon the elevated temperature aging study and may be useful in planning accelerated
aging processes at temperatures between 150°C and 300°C.
Future work should focus on alloy chemistry and the effect of manganese content on age strengthening. This study also
indicates that difficulty in observing microstructural changes via transmission electron microscopy may be related to
the cluster nature of the precipitates and future work will examine the 182°C and 285°C aged specimens from this
study.
ACKNOWLEDGEMENT The authors wish to acknowledge the support and guidance of the cosponsoring foundries and the guidance of the AFS
5H and 5I committees. The authors wish to recognize the contributions of undergraduate assistant who has worked on
this project: Megan McGrath.
This paper is based on work supported by the U.S. Department of Energy under award number DE-FC36-04GO/4230
as subcontracted through Advanced Technology Institute. Any findings, opinions and conclusions or recommendations
in this report are those of the authors and do not necessarily reflect the views of the Department of Energy.
REFERENCES
Bale, C. W., Pelton, A.D., Thompson, W.T., Eriksson, G., Hack, K., Chartrand, P., Degterov, S., Melancon, J., and
Peterson S., Factsage 5.2, CRCT, Ecole Polytechnique, Montreal 2003
Cahn R.W. and Haasen P., Physical Metallurgy, Part 2, p.988, Elsevier Science Publisher, 1983
Edington, J, Nicola, W. M. and Richards, V., “Age Strengthening of Gray Cast Iron, Nitrogen Effects and
Machinability”, AFS Transactions, Volume 110, No: 2, pp 983-993 (2002)
Edmonds, D.V., and Honeycombe, R.W.K., “Precipitation in Iron-base Alloys,” in Precipitation Processes in
Solids, eds. K.C. Russell and H.I. Aaronson, The Metallurgical Society of AIME (1978)
Enrietto, J.F., Wells, M.G.H., and Morgan, E.R., “Quench aging in Fe-Mn-C-N Alloys” in Precipitation from Iron-
base Alloys, Metallurgical Society Conf. Vol. 28, eds. G.R. Speich and J.B. Clark, Gordon and Breach Science
Publishers (1965) Leslie, W. C., The physical metallurgy of steels, Tech book publications, pp. 32-55 (1981)
Nicola, W M and Richards, V, “Age strengthening of Gray Cast Iron, Phase I: Statistical Verification”, AFS
Transactions, Volume 107, pp. 749-756 (1999)
Nicola, W. M., and Richards, V., “Age Strengthening of Gray Cast Iron, Phase II: Nitrogen and Melting method
effects”, AFS Transactions, Volume 108, pp. 233-237 (2000)
Nicola, W. M., and Richards, V., “Age Strengthening of Gray Cast Iron, Phase III: Effect of Aging temperature”,
AFS Transactions, Volume 109, pp 1085-1095 (2001)
Rasek, Jozef. Activation energies of nitrogen diffusion, nitrides precipitation and resolution in alpha -iron-
nitrogen. Diffusion and Defect Monograph Series, 7, pp 442-5. (1983)

81
Richards, V., Van Aken, David C., and Nicola, W.M., “Age Strengthening of Gray Cast Iron, Kinetics,
Mechanical Property effects”, AFS Transactions, Volume 111, paper 03-037, (2003) Richards, V., Thottathil, V. Anish, Lekakh, S. and Van Aken, David C, “Composition Effects on Age
Strengthening of Gray Iron” AFS Transactions, Volume 114, paper 06-047, (2006)
Wert, C. J., “Measurements on the Diffusion of Interstitial Atoms in bcc Lattices,” Appl. Phys., Volume 21,
p.1196 (1950)

82
BIBLIOGRAPHY
1 Ebner, R, Giesserei 50, Nr 22, pp 689-691(1963) 2 Nicola, W M and Richards, V, “Age strengthening of Gray Cast Iron, Phase I: Statistical Verification”,
AFS Transactions, Volume 107, pp. 749-756 (1999) 3 Leslie W C The physical metallurgy of steels, Mc graw hill, , pp 89-91,(1981) 4 Nicola, W. M., and Richards, V., “Age Strengthening of Gray Cast Iron, Phase II: Nitrogen and Melting
method effects”, AFS Transactions, Volume 108, pp. 233-237 (2000) 5 Edington, J, Nicola, W. M. and Richards, V., “Age Strengthening of Gray Cast Iron, Nitrogen Effects and
Machinability”, AFS Transactions, Volume 110, No: 2, pp 983-993 (2002) 6 Edmonds, D.V., and Honeycombe, R.W.K., “Precipitation in Iron-base Alloys,” in Precipitation Processes
in Solids, eds. K.C. Russell and H.I. Aaronson, The Metallurgical Society of AIME (1978) 7 Richards, V., Van Aken, David C., and Nicola, W.M., “Age Strengthening of Gray Cast Iron, Kinetics,
Mechanical Property effects”, AFS Transactions, Volume 111, paper 03-037, (2003) 8 Avner, S H, Introduction to Physical Metallurgy, Tata McGraw Hill Edition, pp 190-94, (1997) 9 Baird, J D and Jamieson A, “High-temperature tensile properties of some synthesized iron alloys
containing molybdenum and chromium”. Journal of the Iron and Steel Institute, 210, 841-6, (1972) 10 Malinov, S, Bottger, A J, Mittemeijer, E J, Pekelharing, M I, and Somers M A J, “Phase transformations
and Phase equilibria in the Fe-N system at temperatures below 573K”, Metallurgical and Materials
transactions, Volume 32A, Jan – pp 59-73, (2001) 11 Karin Frisk, “A New Assessment of the Fe-N Phase Diagram”, CALPHAD, Vol 11, No. 2, pp 127-134,
(1987) 12 Burgess, P B, “Age hardening Ferritic Malleable Iron”, AFS transactions, pp172-179, (1968) 13 Wada, H, and Pehlke, R D , “Nitride formation in Solid cast irons” AFS transactions, Vol 73-69, pp 482-
492, (1973) 14 Glodowski, R.J, “Nitrogen Strain Aging in Ferritic Steels”, Wire journal international, Vol. 38, pp 72-5,
(2005) 15 Wilson, F. G. and Gladman, T, “Aluminum nitride in Steel”, International Materials Review, Vol. 33,
No. 5, pp. 221-285, (1988) 16 Fountain, R W and Chipman, John “Solubility and Precipitation of boron nitride in Iron-Boron alloys”,
Transactions of the Metallurgical society of AIME, Vol 224, pp 599-605 (1962) 17 Evans, E R, “Nitrogen in Cast Iron – and its neutralization by Aluminum”, BCIRA journal, Vol 17, pp
62-71 (1969) 18 Uda M and Pehlke R D, “Solubility of nitrogen in liquid Fe-C-Si Alloys” , Cast Metals Research Journal,
10(1), pp 30-8, (1974)
83
19 Nicola, W. M., and Richards, V., “Age Strengthening of Gray Cast Iron, Phase III: Effect of Aging
temperature”, AFS Transactions, Volume 109, pp 1085-1095 (2001) 20 Cahn R.W. and Haasen P., Physical Metallurgy, Part 2, p.988, Elsevier Science Publisher, (1983) 21 Bale, C. W., Pelton, A.D., Thompson, W.T., Eriksson, G., Hack, K., Chartrand, P., Degterov, S.,
Melancon, J., and Peterson S., Factsage 5.2, CRCT, Ecole Polytechnique, Montreal 2003 22 FACTSage, CRCT, Ecole Polytechnique, Montreal, Canada 23 Enrietto, J.F., Wells, M.G.H., and Morgan, E.R., “Quench aging in Fe-Mn-C-N Alloys” in Precipitation
from Iron-base Alloys, Metallurgical Society Conf. Vol. 28, eds. G.R. Speich and J.B. Clark, Gordon and
Breach Science Publishers (1965) 24 Rasek, Jozef. Activation energies of nitrogen diffusion, nitrides precipitation and resolution in alpha -
iron-nitrogen. Diffusion and Defect Monograph Series, 7, pp 442-5. (1983) 25 Wert, C. J., “Measurements on the Diffusion of Interstitial Atoms in bcc Lattices,” Appl. Phys., Volume 21, p.1196
(1950)

84
VITA
Thottathil Viswanathan Anish was born in Kerala, India on January 22, 1980. He
received his primary education at Don Bosco High school in Kerala, India. In May 2001,
he received his Bachelor of Engineering in Metallurgical Engineering from VNIT,
Nagpur, India. After which he worked for almost four years in Tata Motors India Ltd,
Pune, India as senior projects engineer. He received his Master of Science in
Metallurgical Engineering at the University of Missouri-Rolla in May 2007. He has been
a Graduate Research Assistant in the Department of Metallurgical Engineering,
University of Missouri-Rolla from May 2005 until May 2007. He was a Graduate
Teaching Assistant in the Department of Metallurgical Engineering, University of
Missouri-Rolla from August 2005 until May 2005. He is also a student member of the
American Foundry Society.
![Li Alloying Nanomaterials - greenlionproject.eu · where M represents a group IV alloying element.[5] This equation implies a 3.75:1 lithium to alloying element atomic ratio at full](https://img.pdfslide.us/doc/110x75/5f7894293cf36b12a9415e0d/li-alloying-nanomaterials-where-m-represents-a-group-iv-alloying-element5-this.jpg)