Embed Size (px)
Citation preview

AGE-RELATED CHANGES IN
SKELETAL MUSCLE:
Strength Development Through
the Lifespan
Teet Seene
University of Tartu
FISA World Rowing Coaches Conferenc, 7-10th November 2013, Tallinn

AIM
• Skeletal Muscle Development: structure and function
• Changes During Lifespan
• Strength Development Phases
• Physiological Limiting Factors
• Aging Muscle: sarcopenia,dynapenia
• Rehabilitation:oxidative capacity, myofibrillar apparatus

Human being born vulnarable and leave from this world frail;
Neonates and aged have muscle weakness;
Why?
INTRODUCTION

Muscle Development
First muscular activity was recorded in 8 week old embrio

Recognizable muscle contractions was registrered in
16-18 fetal week

During 16-18 fetal week develops:
- Nerve muscle contact
- Neurotransmission apparatus (Ach/AChE)

• 29-33 week of gestation amount of endomysial
connective tissue decreases
• Increase in number of smaller muscle fibers starts after
34th week of gestation

One month after birth : ~ 40% small size( type I) fibers;
within 2 postnatal years: ~ 60% type I fibers ;
CSA of type II fibers increase 30-fold before age 20;

At birth all limb muscles have same contraction
velocity;
Differentiation into Fast to Slow starts after birth;

Growth of skeletal muscle:
• The rate of growth is higher during neonatal
period than any other stage of postnatal
development:
– Protein synthesis rate is higher than protein
degradation rate
• Factors that play role in it: insulin, growth hormone,
glucagon, IGF-I, leucine

Skeletal Muscle Structure

9.6
4.5
4.2
IIA IIX
I

Muscle fibre:
CSA
• Type I 5000 m²
• Type IIA 7000 m²
• Type IIX 8400 m²
Myonuclear Density
• Type I 40 per nl spl
• Type IIA 40 per nl spl
• Type IIX 20 per nl spl

Oxidative capacity of muscle fibers

Skeletal Muscle Ultrastructure

Molecular structure
tropomüosiin aktiin
troponiin
C T
sile ala müosiinimolekuli pead

Myosin isoforms:
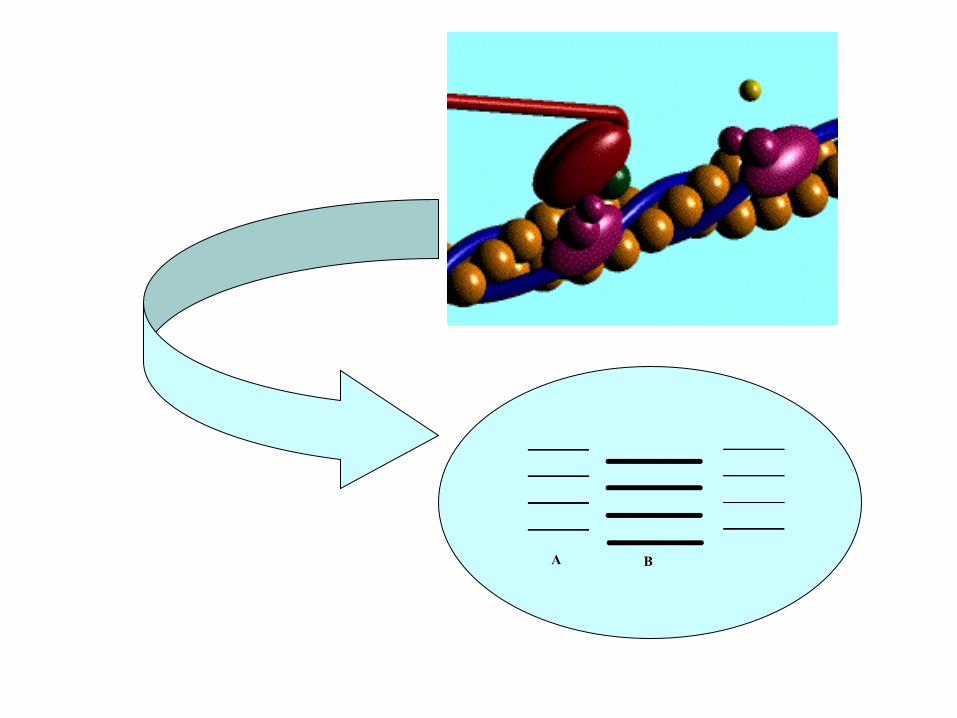

Actin filament sliding velocity
0
0,5
1
1,5
2
2,5
3
1 1-2A 2A 2A - 2X 2X
Vo
(L
/s)
*
*
*

T-system
DHPR
SR
RyR
Ca 2+
SERCA 1,2
mitochondria

Muscle fiber type/size paradox
N N
Sc
Sc Prolif Differ Fusion
Myotube
Muscle fiber
Protein synthesis rate Oxydative capacity MyoND size Protein degradation
IGF- 1
FGF
VGF
Myostatin

Human organism is ready for strength development
from late puberty

Strength capacity changes through the life-span:
During first 5 months > ~ 300%
15-20 y > ~ 180% (25-35%/y)
20-30 y > ~ 15% (1.5-2.5%/y)
30-40 y < ~ 7% (0.3-0.8%/y)
50-70 y < ~ 30% (1.0-1.8%/y)
70-80 y < ~30% (2.5-3.5%/y)

Neonates Strength Development

Changes in the force moment of neck muscles
during first five months:
1st month 0.64 N x m
4th month 1.73 N x m
5th month 1.89 N x m

During the first year
• Busy developing coordination
• Muscle strength

Age related changes in muscle strength:
0
20
40
60
80
100
120
140
160
180
0 10 20 30 40 50 60 70 80 90
kg
age

Changes in skeletal muscle at age 30 years (% per decade)
VO2max Muscle mass strength
3-8% 5-8% 3-8%

Aging Tends to Reduce:
• Strength
• Endurance
• Agility
• Flexibility
• Balance

Aging related functional /social limitations:
• Difficulties in walking;
• Climbing stairs;
• Lifting heavy objects;
• 60% of 65+ (w+m) cannot lift 5 kg;
• 5% weight loss cause 2x increase in risk of disability;
• Loss of independency;

Age-related decline in muscle mass results from type II
fiber atrophy and loss of number of these fibers
9.6
4.5
IIB IIX
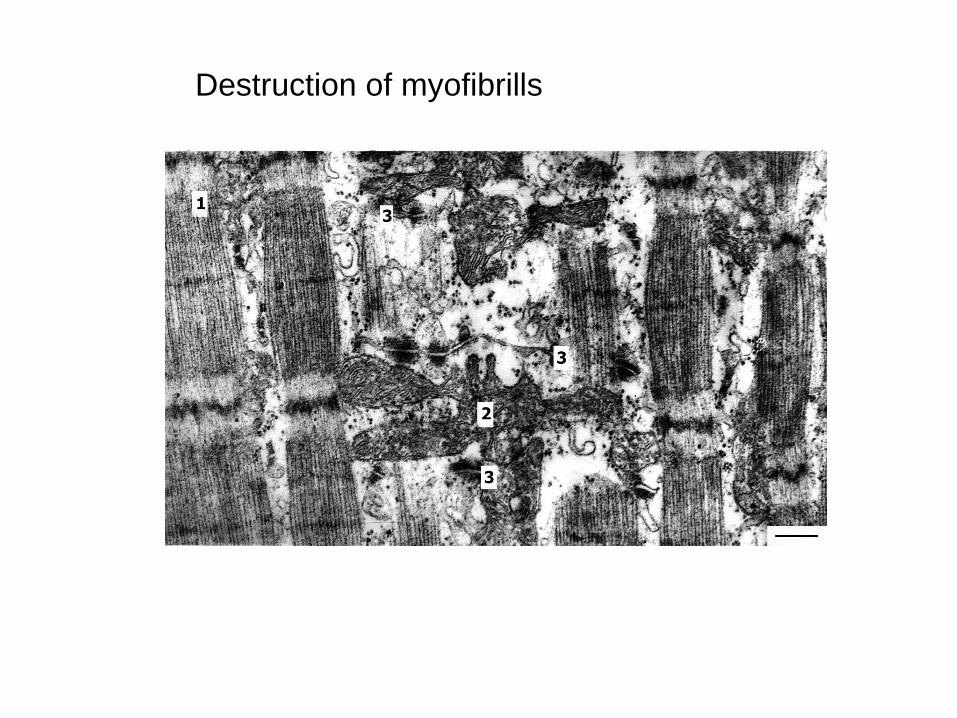
Destruction of myofibrills

Destruction of neuromuscular junction

Age- related decrease of muscle mass:
• Increases the risk of developing glucose intolerance and diabetes
• Muscle tissue is the primary site of glucose disposal

Sarcopenia:
• Changes in hormonal ansemble;
• Anabolic/catabolic processis in muscle;
• Alterations in immune function;
• Redduction in total motor unit number;
• Structural changes in muscle fibres;
• Chronic inflammation;
• Decrease in physical activity.

Precentage of sarcopenic person
among: aging Age (yrs) Men Women
<70 14% 25%
70-74 20% 33%
75-80 27% 33%
>80 53% 43%

Dynapenia:
• Impairment of neural activation;
• Exitation-contraction uncoupling;
• Fibre type transformation;
• Infiltration of adipocytes into muscle fibres;
• Deterioration of capillary blood supply;
• Reduction in muscle contractile quality;
• Reduction in functional reserve;
• Decrease in vital capacity.

-50
-40
-30
-20
-10
0
10
20
LV
brain
kidney
liver
bone
spleen
Predicted organ mass change from 20 to 80 yrs of age
(adapted by Manini, 2009)

Muscle weakness is the main factor in the dysfunction of motor activity and balance during life

Physical risk factors for falls of children and aging persons:
• Muscle weakness;
• Reduced walking speed;
• Inability to maintain balance.

Successful Aging – is it real?
‘’Exercise is low–cost and low–tech, accessible to nearly
everyone, and thus highly suited for potentially widespread
participation’’
(Kramer & Erickson, 2007)
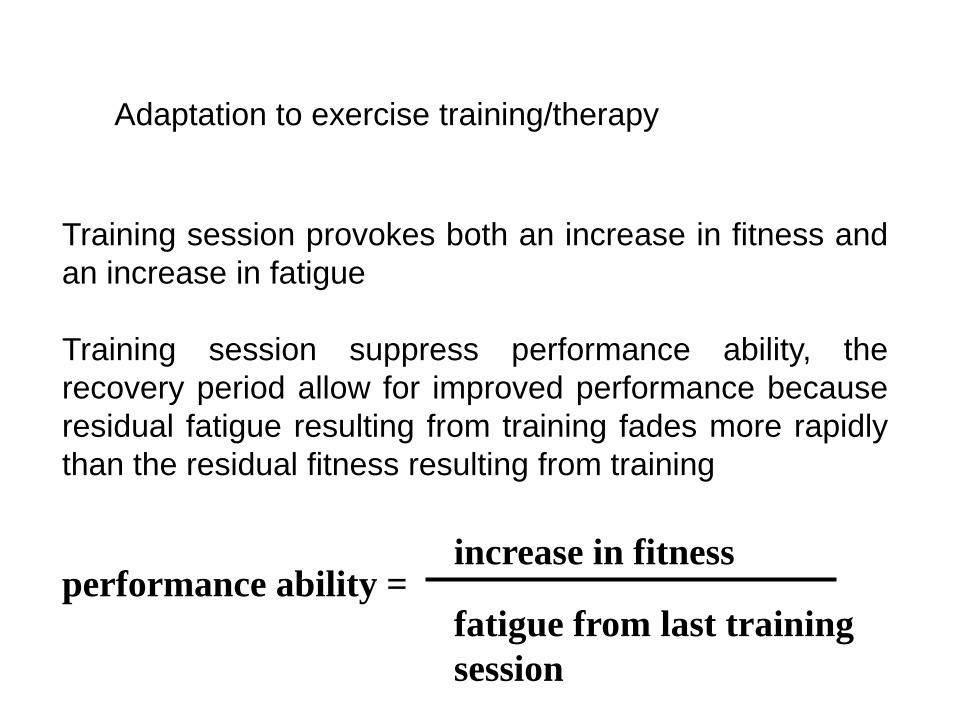
performance ability = increase in fitness
fatigue from last training
session
Training session provokes both an increase in fitness and
an increase in fatigue
Training session suppress performance ability, the
recovery period allow for improved performance because
residual fatigue resulting from training fades more rapidly
than the residual fitness resulting from training
Adaptation to exercise training/therapy

Resistance Training:
• Increase muscle strength;
• Hypertrophy of FT fibres;
• Anabolic and anticatabolic effect on muscle;
• Structural rearrangement in FT fibres;
• Increase in the turnover rate of myofibrillar proteins;
• Improvement in neuromuscular junctions;
• Qualitative remodelling of skeletal muscle.

Resistance training respose is quick:
• 4 h after training FSR of
muscle proteins increases;
• In type II fibers hypertrophy is
faster than in type I

Increase of postsynaptic folds

• Relative intensity (% of maximal strength - % 1 RM)
• Too low relative intensity (< 40% 1RM)
– IIX fibers do not recruit
– IIX fibers stay in “reserve”
– IIA fibers are recruited
– no transformation occures from IIX IIA fibers

Endurance – the ability to maintain or repeat a given force or power output

Endurance training results in increased mitochondrial density, capillary supply, changes in key
metabolic enzymes and increased maximal oxygen uptake
Rowing is an endurance event, but not the classical one
~70% of muscle mass is recruited during the 2000 m race
~65-90% 1 RM (during each stroke)

Age related changes in rowers’ pull up capacity (reps/30”)
25,6 26,3
18,6
12,2
5,4
2,2 0
20
40
60
80
100
120
20 y 30 y 40 y 50 y 60 y 70 y

Age related changes in rowers two footed jump capacity (m/30”)
56,1 57,2
45,4
37,4
31
23,2
0
20
40
60
80
100
120
20 y 30 y 40 y 50 y 60 y 70 y

Resistance and Endurance Training
- are leading to the deceleration of muscle weakness
- the effect of concurrent endurance and strength training among
aging persons???

Activates signaling to
modulate protein
synthesis rate and
muscle growth
Strength training
Activates
signaling involved
in metabolic
homeostasis
Endurance training

Strength training
PI3 - K
PK B
mTOR
4E – BP1 S6 K1
eIF4E Protein synthesis
Endurance training
TSC ½ AMPK Ca2+
eEF2k
eEF2
Ca2+CaM

Exercise caused muscle hypertrophy

Muscle hypertrophy as a reult of myostatin (GDF-8) gene mutation

Sc
N (myonuclear domain size do not change)
MyHC IIx (qualitative remodeling)
The sequence of endurance and strength training is necessary in daily training (anticatabolic effect of resistance
training)
CONCLUSION