Embed Size (px)
Citation preview
Copyright q American Museum of Natural History 2005 ISSN 0003-0082
P U B L I S H E D B Y T H E A M E R I C A N M U S E U M O F N AT U R A L H I S T O RY
CENTRAL PARK WEST AT 79TH STREET, NEW YORK, NY 10024
Number 3474, 26 pp., 12 figures, 2 tables May 11, 2005
Age and Correlation of Fossiliferous LatePaleocene–Early Eocene Strata of theErlian Basin, Inner Mongolia, China
GABRIEL J. BOWEN,1 PAUL L. KOCH,2 JIN MENG,3 JIE YE,4 ANDSUYIN TING5
ABSTRACT
The Asian continent preserves a rich and diverse record of Paleogene mammal faunas andtheir evolution through time. The sequence of faunal succession is of key importance to ourunderstanding of the origin and diversification of modern mammal groups, as phylogeneticdata suggest that many major modern clades may be rooted in Asia. By calibrating the Asianfauna sequence within a chronostratigraphic framework, we can begin to compare patterns ofsuccession on a global scale and constrain models for the origination and dispersal of modernmammal groups in the early Paleogene.
The Erlian Basin of Inner Mongolia preserves Early Paleogene strata and mammal fossilsassignable to the Gashatan, Bumbanian, and Irdin Manhan Asian Land Mammal Ages (AL-MAs). We measured stratigraphic sections and analyzed the stable isotope composition ofpaleosol carbonates and paleomagnetic directions of rocks at three localities in the ErlianBasin. The data document patterns in lithology, carbon isotope composition, and magneticpolarity that are consistent at all three localities and allow us to present two constrainedhypotheses for the correlation of the local stratigraphic sections. Within the resulting compositesection, we are able to identify a secular decrease in the carbon isotope composition of paleosolcarbonate that can be equated to a multimillion-year trend preserved in late Paleocene and
1 Current address: Department of Biology, University of Utah, Salt Lake City, UT, 84112 ([email protected]).
2 Department of Earth Sciences, University of California, Santa Cruz, CA 95064 ([email protected]).3 Division of Paleontology, American Museum of Natural History ([email protected]).4 Institute of Vertebrate Paleontology and Paleoanthropology, Chinese Academy of Sciences, P.O. Box 643, Beijing
100044, P.R. China ([email protected]).5 Museum of Natural Science, Louisiana State University, Baton Rouge, LA 70803 ([email protected]).
2 NO. 3474AMERICAN MUSEUM NOVITATES
early Eocene terrestrial and marine records. Using this trend and previously documented con-straints on the age of the Bumbanian ALMA, the composite section is shown to correlatewithin the interval of time represented by chrons C26n–C24n of the Geomagnetic PolarityTimescale (GPTS). We outline three possible correlations of the sequence of magnetic polarityzones in our composite section to the GPTS and explore the biostratigraphic implications ofthese. All three possible correlations show that Gashatan faunas in Inner Mongolia occurwithin chron C24R, and the preferred correlation suggests that the Gashatan taxa may havepersisted close to the Paleocene/Eocene boundary. If confirmed through further sampling, thisresult would imply that the first appearance of the modern mammal orders Primates, Artio-dactyla, and Perissodactyla in Asia at the base of the Bumbanian ALMA did not significantlyprecede their first appearances in Europe and North America at the Paleocene/Eocene bound-ary. Fossil sites in the Erlian Basin promise to be central to resolving the debate about whetherthese clades lived and diversified in Asia before dispersing throughout the Northern Hemi-sphere at the Paleocene/Eocene boundary.
INTRODUCTION
The transition between the Paleocene andEocene epochs was one of the most dynamicintervals of the Cenozoic. Long-term trendsin climate ushered in the warmest period ofthe Cenozoic (Zachos et al., 2001). Through-out this gradual shift in climate, faunas andfloras evolved in a series of abrupt eventsleading to the establishment of the first trulymodern terrestrial ecosystems evidenced inthe fossil record of the Holarctic continents.Abrupt changes in climate and faunal andfloral composition coincided at the Paleo-cene/Eocene boundary, when transient globalwarming (e.g., Kennett and Stott, 1991), dis-persal of mammal groups throughout thenorthern hemisphere (e.g., McKenna, 1973),and shifts in floral composition (Harrington,2003) led to reorganization of terrestrial eco-systems on geologically short timescales(;100 thousand years (ky); Rohl et al., 2000;Bowen et al., 2001; Farley and Eltgroth,2003).
One of the most profound changes in ter-restrial ecosystems that occurred near the Pa-leocene/Eocene boundary was the abrupt firstappearance of several modern groups ofmammals in faunas from Asia, Europe, andNorth America (Gingerich, 1989; Hooker,1998; Ting, 1998). The P/E first appearancesincluded the first representatives of Primates,Artiodactyla, and Perissodactyla, three extantorders that went on to diversify and becomeimportant components of modern faunas, andHyaenodontidae, a family of carnivorousmammals that suffered extinction in the Mio-cene (e.g., Gingerich, 1989). The abrupt ap-
pearance of these groups and lack of closelyallied fossil outgroups in early Paleogenefaunas led workers to conclude that the ap-pearances represent immigration from an un-seen locus of evolution (e.g., McKenna,1973). Phylogenetic analysis of recently dis-covered Paleocene mammal fossils from Chi-na, however, has led some workers to con-clude that Asian faunas include taxa closelyallied to the new groups, and that the originsof the earliest Eocene debutants may betraced to a low-latitude Asian Eden (Beard,1998; Beard and Dawson, 1999).
A simple test with the potential to verifyAsia as a source of emigration at the Paleo-cene/Eocene boundary, if not as an evolu-tionary locus, would be to evaluate the rel-ative age of the first appearances of cladeson the three Holarctic continents. If the earlyrepresentatives of one or more of the modernmammal groups were found to have greaterantiquity in Asia than in Europe and NorthAmerica, this would support Asia as a sourceof evolution or emigration. Conversely, find-ing that the Asian first appearances lagged orwere synchronous with those on other con-tinents would conflict with such a hypothesis.
Recent work has significantly clarified therelative age of early Paleogene faunal turn-over events on the Holarctic continents. Ofkey importance is a globally correlatable car-bon isotope excursion documented in marineand terrestrial sedimentary rocks (Koch etal., 1992; Zachos et al., 1993) and recentlychosen as the defining stratigraphic datumfor the Paleocene/Eocene boundary (Ouda,2003). The base of the d13C excursion hasbeen shown to correlate with the P/E first
2005 3BOWEN ET AL.: ERLIAN BASIN STRATA
appearances to within ;10 ky in NorthAmerica (Bowen et al., 2001), where the newgroups appear at the base of the WasatchianNorth American Land Mammal Age (NAL-MA; Gingerich, 2001). Work in southern Eu-rope has shown that the P/E first appearancesthere are unlikely to predate those in NorthAmerica (Cojan et al., 2000). In northern Eu-rope, taxa characteristic of the P/E first ap-pearance event first appear at the Dormaallocality of Belgium (Smith, 2000). By cor-relation to other early Paleogene localities inBelgium and northern France for which bulkorganic carbon isotope data are available,this fauna is thought to occur within the CIEand be time-equivalent to the earliest Was-atchian faunas (Steurbaut et al., 1999; Ma-gioncalda et al., 2004).
In Asia, the first representative of Hyaen-odontidae occurs in a fauna assigned to theGashatan Asian Land Mammal age (AL-MAs; Meng et al., 1998), which has beenshown to be Late Paleocene in age (Bowenet al., 2002). Other important appearanceevents, however, including the first Asian pri-mates, perissodactyls, and perhaps artiodac-tyls (Tong and Wang, 1998) occur within thesubsequent Bumbanian ALMA (Dashzeveg,1988; Ting, 1998). Earlier work (Bowen etal., 2002; Ting et al., 2003) has shown thatthe base of the Bumbanian is no youngerthan the P/E boundary, at ;55 million yearsago (Ma; Wing et al., 1999), and that Gash-atan index taxa persist at least until the endof chron C25n of the geomagnetic polaritytimescale (GPTS) ;55.9 Ma (Cande andKent, 1995). These correlations leave an un-constrained window of time some 900 kylong during which modern groups may haveevolved and diversified in Asia or, alterna-tively, archaic groups may have persisted be-fore the impending restructuring of theircommunities.
Here, our goal is to use magnetic and iso-tope stratigraphy to determine the age ofmammal faunas from the Erlian Basin of In-ner Mongolia (fig. 1). This region has pro-duced several diverse collections of early Pa-leogene mammals, including several assem-blages assigned to the Gashatan ALMA, andnew fossiliferous levels and important spec-imens continue to be discovered (Meng et al.,2004; Smith et al., 2004). We present new
lithological, biostratigraphic, paleomagnetic,and isotopic data from three fossil-bearingstratigraphic sections in the Erlian Basin.These data allow refined stratigraphic corre-lation of rock units within the basin and sug-gest correlations between these units and theGPTS. We then examine the implications ofthese correlations for the potential antiquityof the Bumbanian ALMA and associatedmodern mammal groups in Asia.
GEOLOGICAL SETTING
Fossil mammals of the Erlian Basin occurwithin a widely distributed package of sili-ciclastic sedimentary rocks. These rocks arelargely undeformed and outcrop primarily inwidely separated low mesas and in shallowwashes. As a result of their poor local ex-posure and the relative isolation of outcropsin this region, stratigraphic correlation ofrock units within the basin is difficult and noclear regional stratigraphy has been devel-oped. Several stratigraphic units have beendefined based on a combination of litholog-ical and faunal characteristics, and thesewere recently reviewed by Meng et al. (1998,2004).
The rocks at our study sites include redand tan mudstones, calcareous mudstones,and siltstones, commonly preserving milli-meter-scale laminations of probable lacus-trine origin, massive, brick red mudstonebeds commonly preserving features indica-tive of paleosol development (see below),and laterally extensive sandstone and con-glomerate beds of fluvial origin. These rockshave been previously assigned to the Nom-ogen, Arshanto, and Irdin Manha Forma-tions, although the details of their assignmenthas differed among studies (see Meng et al.,2004). In many cases, these names refer tounits recognized on the basis of combinedlithostratigraphic and biostratigraphic char-acteristics, and as a result it is unclear howto assign many intervals in our local sectionsto these composite stratigraphic units. Thestratigraphic nomenclature for the Erlian Ba-sin is in need of revision, but because of thelimited stratigraphic and geographic cover-age of the present study we will not attemptsuch a revision here. Instead, we will referthroughout to informal lithostratigraphic
4 NO. 3474AMERICAN MUSEUM NOVITATES
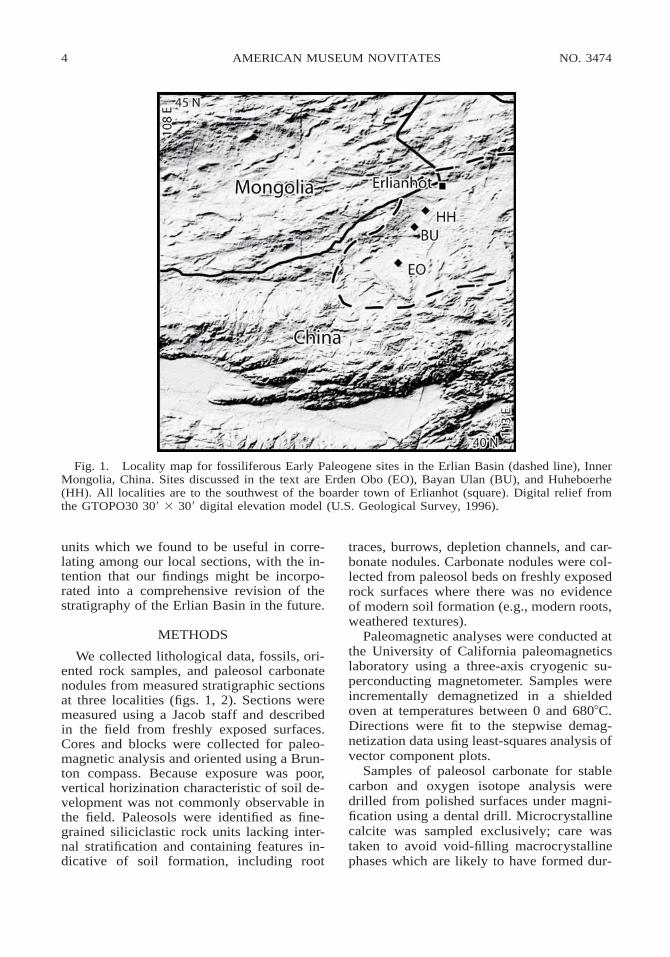
Fig. 1. Locality map for fossiliferous Early Paleogene sites in the Erlian Basin (dashed line), InnerMongolia, China. Sites discussed in the text are Erden Obo (EO), Bayan Ulan (BU), and Huheboerhe(HH). All localities are to the southwest of the boarder town of Erlianhot (square). Digital relief fromthe GTOPO30 309 3 309 digital elevation model (U.S. Geological Survey, 1996).
units which we found to be useful in corre-lating among our local sections, with the in-tention that our findings might be incorpo-rated into a comprehensive revision of thestratigraphy of the Erlian Basin in the future.
METHODS
We collected lithological data, fossils, ori-ented rock samples, and paleosol carbonatenodules from measured stratigraphic sectionsat three localities (figs. 1, 2). Sections weremeasured using a Jacob staff and describedin the field from freshly exposed surfaces.Cores and blocks were collected for paleo-magnetic analysis and oriented using a Brun-ton compass. Because exposure was poor,vertical horizination characteristic of soil de-velopment was not commonly observable inthe field. Paleosols were identified as fine-grained siliciclastic rock units lacking inter-nal stratification and containing features in-dicative of soil formation, including root
traces, burrows, depletion channels, and car-bonate nodules. Carbonate nodules were col-lected from paleosol beds on freshly exposedrock surfaces where there was no evidenceof modern soil formation (e.g., modern roots,weathered textures).
Paleomagnetic analyses were conducted atthe University of California paleomagneticslaboratory using a three-axis cryogenic su-perconducting magnetometer. Samples wereincrementally demagnetized in a shieldedoven at temperatures between 0 and 6808C.Directions were fit to the stepwise demag-netization data using least-squares analysis ofvector component plots.
Samples of paleosol carbonate for stablecarbon and oxygen isotope analysis weredrilled from polished surfaces under magni-fication using a dental drill. Microcrystallinecalcite was sampled exclusively; care wastaken to avoid void-filling macrocrystallinephases which are likely to have formed dur-
2005 5BOWEN ET AL.: ERLIAN BASIN STRATA
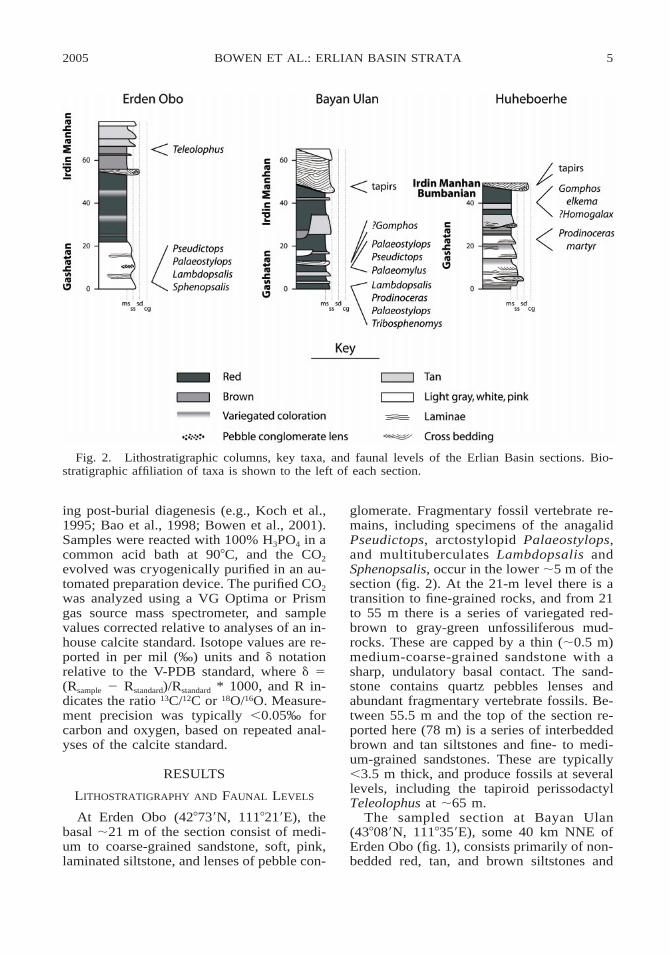
Fig. 2. Lithostratigraphic columns, key taxa, and faunal levels of the Erlian Basin sections. Bio-stratigraphic affiliation of taxa is shown to the left of each section.
ing post-burial diagenesis (e.g., Koch et al.,1995; Bao et al., 1998; Bowen et al., 2001).Samples were reacted with 100% H3PO4 in acommon acid bath at 908C, and the CO2
evolved was cryogenically purified in an au-tomated preparation device. The purified CO2
was analyzed using a VG Optima or Prismgas source mass spectrometer, and samplevalues corrected relative to analyses of an in-house calcite standard. Isotope values are re-ported in per mil (‰) units and d notationrelative to the V-PDB standard, where d 5(Rsample 2 Rstandard)/Rstandard * 1000, and R in-dicates the ratio 13C/12C or 18O/16O. Measure-ment precision was typically ,0.05‰ forcarbon and oxygen, based on repeated anal-yses of the calcite standard.
RESULTS
LITHOSTRATIGRAPHY AND FAUNAL LEVELS
At Erden Obo (428739N, 1118219E), thebasal ;21 m of the section consist of medi-um to coarse-grained sandstone, soft, pink,laminated siltstone, and lenses of pebble con-
glomerate. Fragmentary fossil vertebrate re-mains, including specimens of the anagalidPseudictops, arctostylopid Palaeostylops,and multituberculates Lambdopsalis andSphenopsalis, occur in the lower ;5 m of thesection (fig. 2). At the 21-m level there is atransition to fine-grained rocks, and from 21to 55 m there is a series of variegated red-brown to gray-green unfossiliferous mud-rocks. These are capped by a thin (;0.5 m)medium-coarse-grained sandstone with asharp, undulatory basal contact. The sand-stone contains quartz pebbles lenses andabundant fragmentary vertebrate fossils. Be-tween 55.5 m and the top of the section re-ported here (78 m) is a series of interbeddedbrown and tan siltstones and fine- to medi-um-grained sandstones. These are typically,3.5 m thick, and produce fossils at severallevels, including the tapiroid perissodactylTeleolophus at ;65 m.
The sampled section at Bayan Ulan(438089N, 1118359E), some 40 km NNE ofErden Obo (fig. 1), consists primarily of non-bedded red, tan, and brown siltstones and
6 NO. 3474AMERICAN MUSEUM NOVITATES
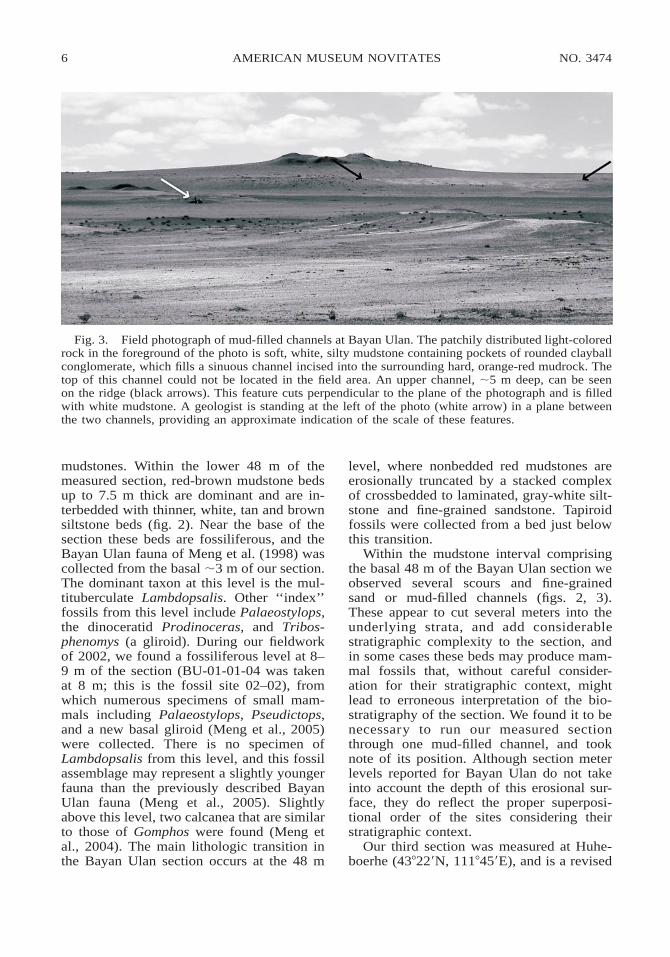
Fig. 3. Field photograph of mud-filled channels at Bayan Ulan. The patchily distributed light-coloredrock in the foreground of the photo is soft, white, silty mudstone containing pockets of rounded clayballconglomerate, which fills a sinuous channel incised into the surrounding hard, orange-red mudrock. Thetop of this channel could not be located in the field area. An upper channel, ;5 m deep, can be seenon the ridge (black arrows). This feature cuts perpendicular to the plane of the photograph and is filledwith white mudstone. A geologist is standing at the left of the photo (white arrow) in a plane betweenthe two channels, providing an approximate indication of the scale of these features.
mudstones. Within the lower 48 m of themeasured section, red-brown mudstone bedsup to 7.5 m thick are dominant and are in-terbedded with thinner, white, tan and brownsiltstone beds (fig. 2). Near the base of thesection these beds are fossiliferous, and theBayan Ulan fauna of Meng et al. (1998) wascollected from the basal ;3 m of our section.The dominant taxon at this level is the mul-tituberculate Lambdopsalis. Other ‘‘index’’fossils from this level include Palaeostylops,the dinoceratid Prodinoceras, and Tribos-phenomys (a gliroid). During our fieldworkof 2002, we found a fossiliferous level at 8–9 m of the section (BU-01-01-04 was takenat 8 m; this is the fossil site 02–02), fromwhich numerous specimens of small mam-mals including Palaeostylops, Pseudictops,and a new basal gliroid (Meng et al., 2005)were collected. There is no specimen ofLambdopsalis from this level, and this fossilassemblage may represent a slightly youngerfauna than the previously described BayanUlan fauna (Meng et al., 2005). Slightlyabove this level, two calcanea that are similarto those of Gomphos were found (Meng etal., 2004). The main lithologic transition inthe Bayan Ulan section occurs at the 48 m
level, where nonbedded red mudstones areerosionally truncated by a stacked complexof crossbedded to laminated, gray-white silt-stone and fine-grained sandstone. Tapiroidfossils were collected from a bed just belowthis transition.
Within the mudstone interval comprisingthe basal 48 m of the Bayan Ulan section weobserved several scours and fine-grainedsand or mud-filled channels (figs. 2, 3).These appear to cut several meters into theunderlying strata, and add considerablestratigraphic complexity to the section, andin some cases these beds may produce mam-mal fossils that, without careful consider-ation for their stratigraphic context, mightlead to erroneous interpretation of the bio-stratigraphy of the section. We found it to benecessary to run our measured sectionthrough one mud-filled channel, and tooknote of its position. Although section meterlevels reported for Bayan Ulan do not takeinto account the depth of this erosional sur-face, they do reflect the proper superposi-tional order of the sites considering theirstratigraphic context.
Our third section was measured at Huhe-boerhe (438229N, 1118459E), and is a revised
2005 7BOWEN ET AL.: ERLIAN BASIN STRATA
version of the section of Meng et al. (2004)reflecting new observations made during the2004 field season. At Huheboerhe, the basal24 m of section consist of lens-shaped, cross-bedded, fine- to medium-grained sandstones,soft, pink, laminated sandy siltstones, andbrechiated to homogeneous, red-weatheringmudstones. Within this package, finergrained rock types become increasingly dom-inant up-section. The uppermost sandy silt-stone bed produced a specimen of Prodino-ceras (23 m). The interval between 24 and47.5 m is predominately mudstone. Bedsnear the base of this interval are tan andbrown, with a transition to gray mudstoneand a single, thick (7.5 m) red mudstone oc-curring at the 40-m level. Specimens of thebasal gliroid Gomphos elkema (Meng et al.,2004), a small perissodactyl, possibly Hom-ogalax, and a hyaenodontid smaller thanProlimnocyon chowi (Meng et al., 1998)were recovered from this red bed duringfieldwork in 2002; very large (up to 10 cmdiameter) paleosol carbonate nodules werealso found near the base of the bed. Screen-washing sediments from this bed in 2004yielded teeth of at least two species of smallrodents. These rodents are generally similarto those from the Bumban beds of Mongolia(Shevyreva, 1989; Dashzeveg, 1990). How-ever, because the rodent specimens from theBumban beds are fragmentary and their tax-onomic identifications are currently uncertain(Averianov, 1996), we do not provide pre-liminary identifications of the Huheboerhespecimens in this study to avoid further com-plication of the situation.
Lower in the mudstone interval, at 28.5 m,pods of hard, brittle, carbonate grainstone upto ;50 cm in diameter were observed weath-ering out in a discrete horizon. These arecomprised primarily of round, carbonate-coated clayballs several millimeters in di-ameter, and are tentatively interpreted as fos-sil cold spring deposits. At the top of thesection, a coarse-grained sandstone and peb-ble conglomerate overlies the thick red mud-stone with a sharp basal contact. The con-glomerate contains abundant fragmentaryvertebrate fossils, including tapiroid perisso-dactyls. Fragmentary fossils from the con-glomerate bed have washed down and can befound on the surface of the underlying, up-
permost red mudstones. Particular care mustbe taken in interpreting the provenance offossils collected from these mudstone beds.
The biostratigraphic affiliations of manyindex taxa from the Erlian Basin sections areshown in figure 2. Prodinoceras, Palaeosty-lops, Tribosphenomys, and the multituber-culates are all indicative of the GashatanALMA, and most of the collections from theErlian Basin sections that bear these taxa rep-resent assemblages that are compositionallysimilar to other assemblages of Gashatan age(Ting, 1998). The only taxon in our sectionsthat is considered diagnostic of the Bumban-ian ALMA is G. elkema (Dashzeveg, 1988;Meng et al., 2004). Fossil tapirs are charac-teristic of subsequent ALMAs, which havebeen termed the Arshantan and Irdin Man-han. These biostratigraphic units are weaklydefined based on a combination of litholog-ical and faunal associations, and are in needof review. Because the tapir specimens andassociated fossils referred to here were col-lected from strata overlying the Bumbanianand Gashatan levels that have been describedas the ‘‘Irdin Manha beds’’, we will describethem as representing the Irdin ManhanALMA.
PALEOMAGNETICS
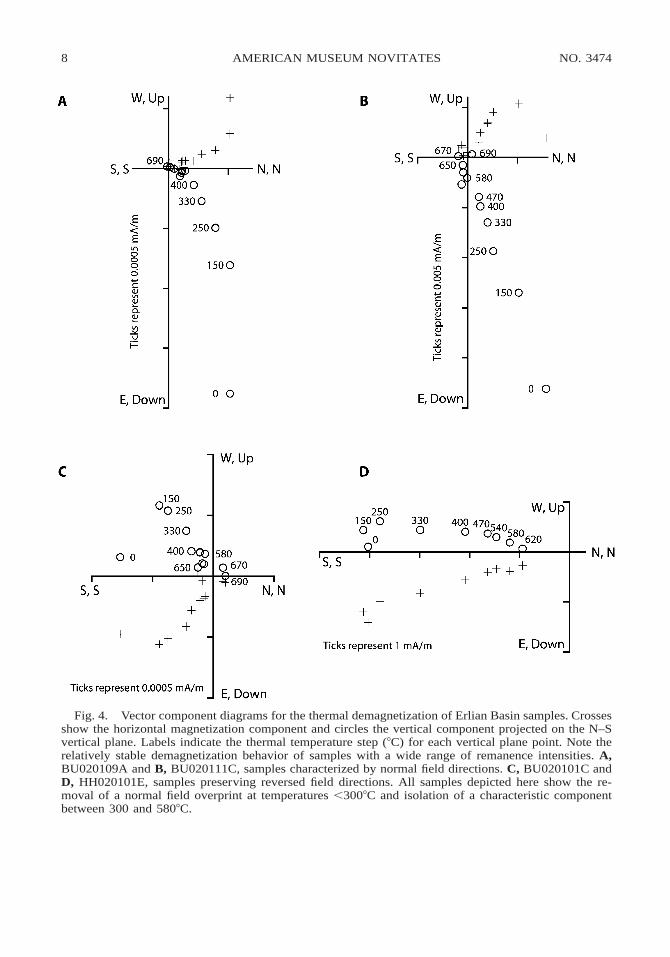
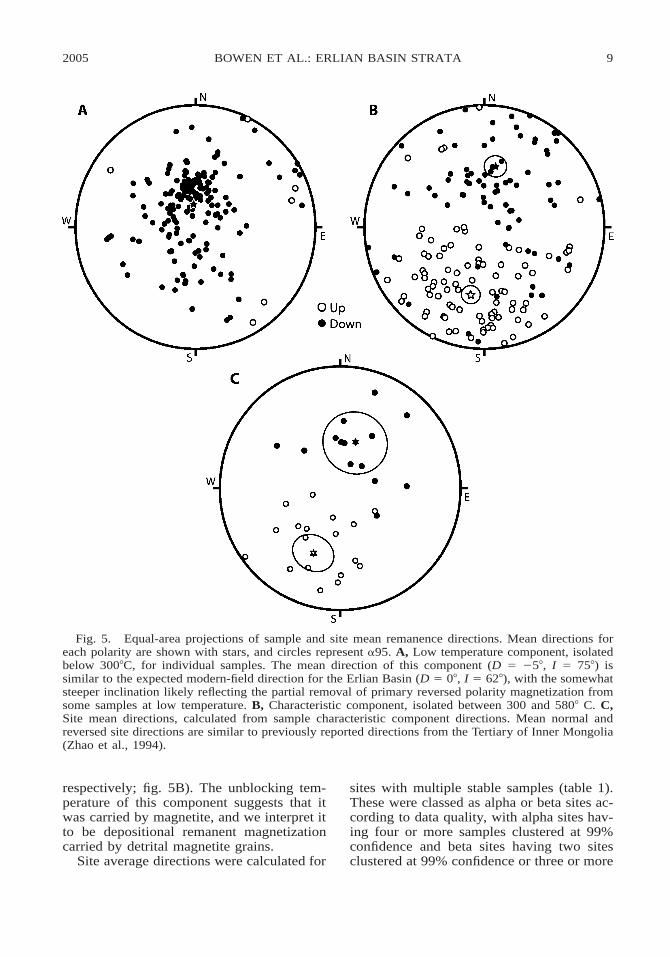
Samples from the Erlian Basin sections (N5 183) displayed a wide array of magneticbehaviors during stepwise demagnetization,but many siltstone samples and some mud-stones exhibited relatively stable behavior.Demagnetization of these samples typicallyrevealed multiple directional components(fig. 4). Most samples preserved a low-tem-perature component, which was removed attemperatures below 3008C and exhibits anaverage declination (D) of 3558 and inclina-tion (I) of 758 (N 5 177; fig. 5A). We inter-pret this component to be a modern fieldoverprint. Stable samples also typically pre-served a second, characteristic direction,which was removed between 300 and 5808C(fig. 4). This component exhibits directionsindicative of both normal and reversed fields,and the average directions for normal and re-versed field samples are roughly antipodal (D5 10.68, I 5 48.08, N 5 84, k 5 5.614, andD 5 191.58, I 5 242.78, N 5 58, k 5 6.215,
8 NO. 3474AMERICAN MUSEUM NOVITATES
Fig. 4. Vector component diagrams for the thermal demagnetization of Erlian Basin samples. Crossesshow the horizontal magnetization component and circles the vertical component projected on the N–Svertical plane. Labels indicate the thermal temperature step (8C) for each vertical plane point. Note therelatively stable demagnetization behavior of samples with a wide range of remanence intensities. A,BU020109A and B, BU020111C, samples characterized by normal field directions. C, BU020101C andD, HH020101E, samples preserving reversed field directions. All samples depicted here show the re-moval of a normal field overprint at temperatures ,3008C and isolation of a characteristic componentbetween 300 and 5808C.
2005 9BOWEN ET AL.: ERLIAN BASIN STRATA
Fig. 5. Equal-area projections of sample and site mean remanence directions. Mean directions foreach polarity are shown with stars, and circles represent a95. A, Low temperature component, isolatedbelow 3008C, for individual samples. The mean direction of this component (D 5 258, I 5 758) issimilar to the expected modern-field direction for the Erlian Basin (D 5 08, I 5 628), with the somewhatsteeper inclination likely reflecting the partial removal of primary reversed polarity magnetization fromsome samples at low temperature. B, Characteristic component, isolated between 300 and 5808 C. C,Site mean directions, calculated from sample characteristic component directions. Mean normal andreversed site directions are similar to previously reported directions from the Tertiary of Inner Mongolia(Zhao et al., 1994).
respectively; fig. 5B). The unblocking tem-perature of this component suggests that itwas carried by magnetite, and we interpret itto be depositional remanent magnetizationcarried by detrital magnetite grains.
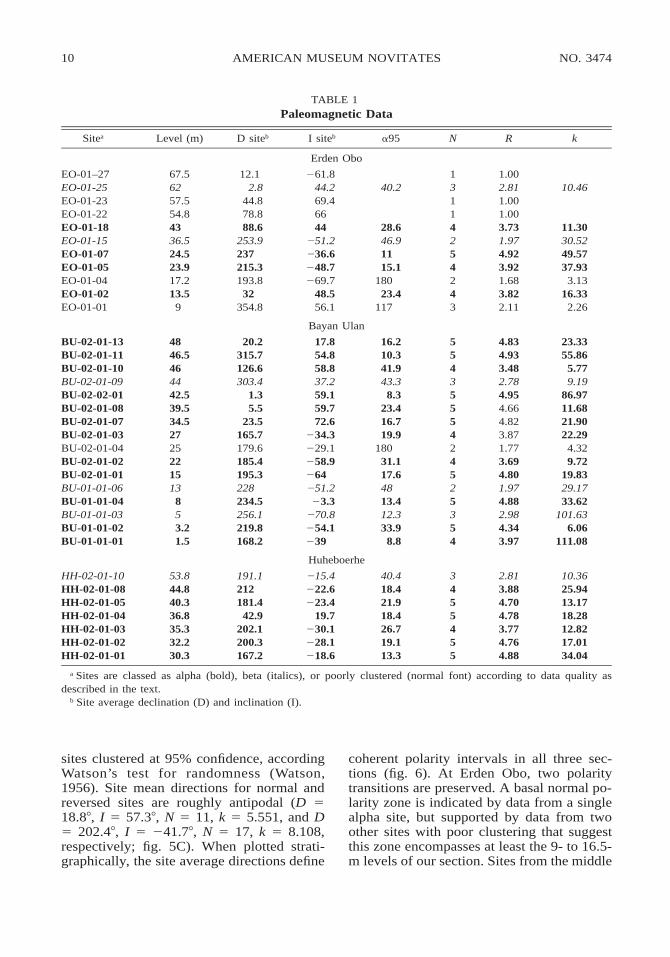
Site average directions were calculated for
sites with multiple stable samples (table 1).These were classed as alpha or beta sites ac-cording to data quality, with alpha sites hav-ing four or more samples clustered at 99%confidence and beta sites having two sitesclustered at 99% confidence or three or more
10 NO. 3474AMERICAN MUSEUM NOVITATES
TABLE 1Paleomagnetic Data
Sitea Level (m) D siteb I siteb a95 N R k
Erden Obo
EO-01–27EO-01-25EO-01-23EO-01-22EO-01-18
67.56257.554.843
12.12.8
44.878.888.6
261.844.269.46644
40.2
28.6
13114
1.002.811.001.003.73
10.46
11.30EO-01-15EO-01-07EO-01-05EO-01-04EO-01-02EO-01-01
36.524.523.917.213.5
9
253.9237215.3193.832
354.8
251.2236.6248.7269.7
48.556.1
46.91115.1
18023.4
117
254243
1.974.923.921.683.822.11
30.5249.5737.93
3.1316.33
2.26
Bayan Ulan
BU-02-01-13BU-02-01-11BU-02-01-10BU-02-01-09BU-02-02-01
4846.5464442.5
20.2315.7126.6303.4
1.3
17.854.858.837.259.1
16.210.341.943.3
8.3
55435
4.834.933.482.784.95
23.3355.86
5.779.19
86.97BU-02-01-08BU-02-01-07BU-02-01-03BU-02-01-04BU-02-01-02
39.534.5272522
5.523.5
165.7179.6185.4
59.772.6
234.3229.1258.9
23.416.719.9
18031.1
55424
4.664.823.871.773.69
11.6821.9022.29
4.329.72
BU-02-01-01BU-01-01-06BU-01-01-04BU-01-01-03
1513
85
195.3228234.5256.1
264251.223.3
270.8
17.64813.412.3
5253
4.801.974.882.98
19.8329.1733.62
101.63BU-01-01-02BU-01-01-01
3.21.5
219.8168.2
254.1239
33.98.8
54
4.343.97
6.06111.08
Huheboerhe
HH-02-01-10HH-02-01-08HH-02-01-05HH-02-01-04HH-02-01-03HH-02-01-02HH-02-01-01
53.844.840.336.835.332.230.3
191.1212181.442.9
202.1200.3167.2
215.4222.6223.4
19.7230.1228.1218.6
40.418.421.918.426.719.113.3
3455455
2.813.884.704.783.774.764.88
10.3625.9413.1718.2812.8217.0134.04
a Sites are classed as alpha (bold), beta (italics), or poorly clustered (normal font) according to data quality asdescribed in the text.
b Site average declination (D) and inclination (I).
sites clustered at 95% confidence, accordingWatson’s test for randomness (Watson,1956). Site mean directions for normal andreversed sites are roughly antipodal (D 518.88, I 5 57.38, N 5 11, k 5 5.551, and D5 202.48, I 5 241.78, N 5 17, k 5 8.108,respectively; fig. 5C). When plotted strati-graphically, the site average directions define
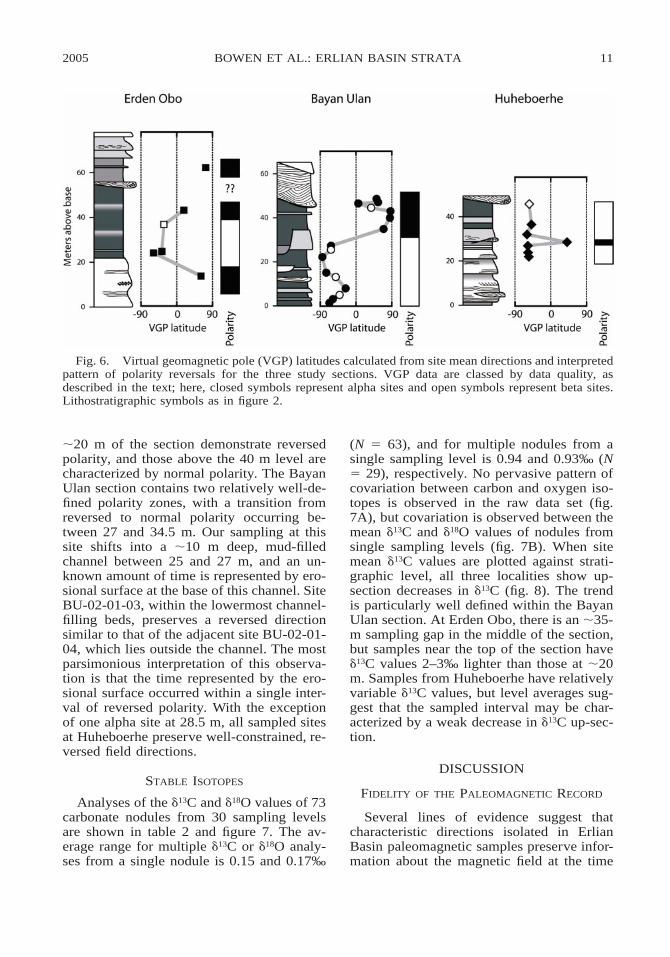
coherent polarity intervals in all three sec-tions (fig. 6). At Erden Obo, two polaritytransitions are preserved. A basal normal po-larity zone is indicated by data from a singlealpha site, but supported by data from twoother sites with poor clustering that suggestthis zone encompasses at least the 9- to 16.5-m levels of our section. Sites from the middle
2005 11BOWEN ET AL.: ERLIAN BASIN STRATA
Fig. 6. Virtual geomagnetic pole (VGP) latitudes calculated from site mean directions and interpretedpattern of polarity reversals for the three study sections. VGP data are classed by data quality, asdescribed in the text; here, closed symbols represent alpha sites and open symbols represent beta sites.Lithostratigraphic symbols as in figure 2.
;20 m of the section demonstrate reversedpolarity, and those above the 40 m level arecharacterized by normal polarity. The BayanUlan section contains two relatively well-de-fined polarity zones, with a transition fromreversed to normal polarity occurring be-tween 27 and 34.5 m. Our sampling at thissite shifts into a ;10 m deep, mud-filledchannel between 25 and 27 m, and an un-known amount of time is represented by ero-sional surface at the base of this channel. SiteBU-02-01-03, within the lowermost channel-filling beds, preserves a reversed directionsimilar to that of the adjacent site BU-02-01-04, which lies outside the channel. The mostparsimonious interpretation of this observa-tion is that the time represented by the ero-sional surface occurred within a single inter-val of reversed polarity. With the exceptionof one alpha site at 28.5 m, all sampled sitesat Huheboerhe preserve well-constrained, re-versed field directions.
STABLE ISOTOPES
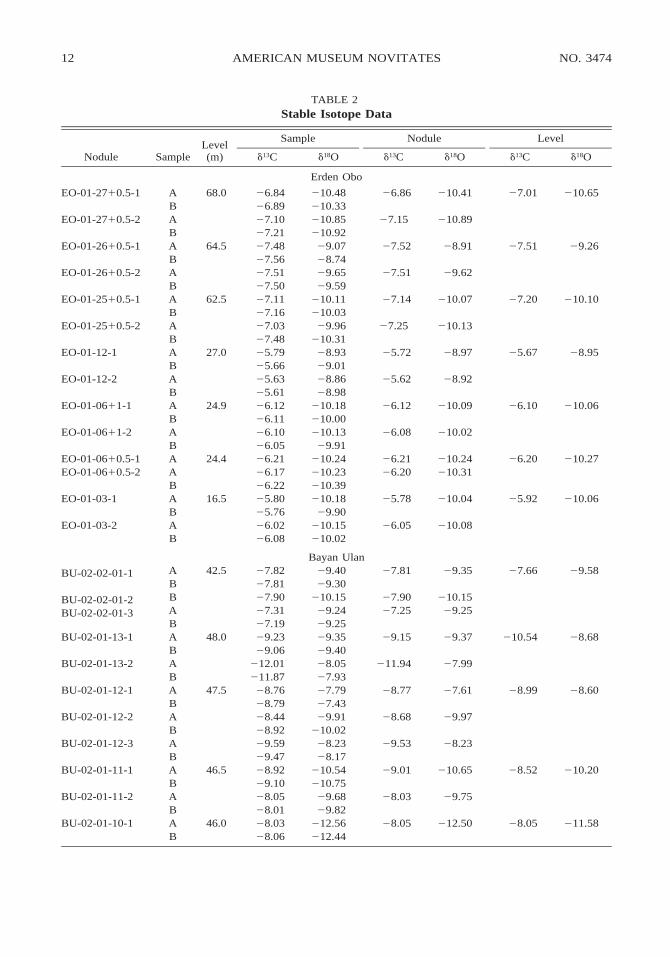
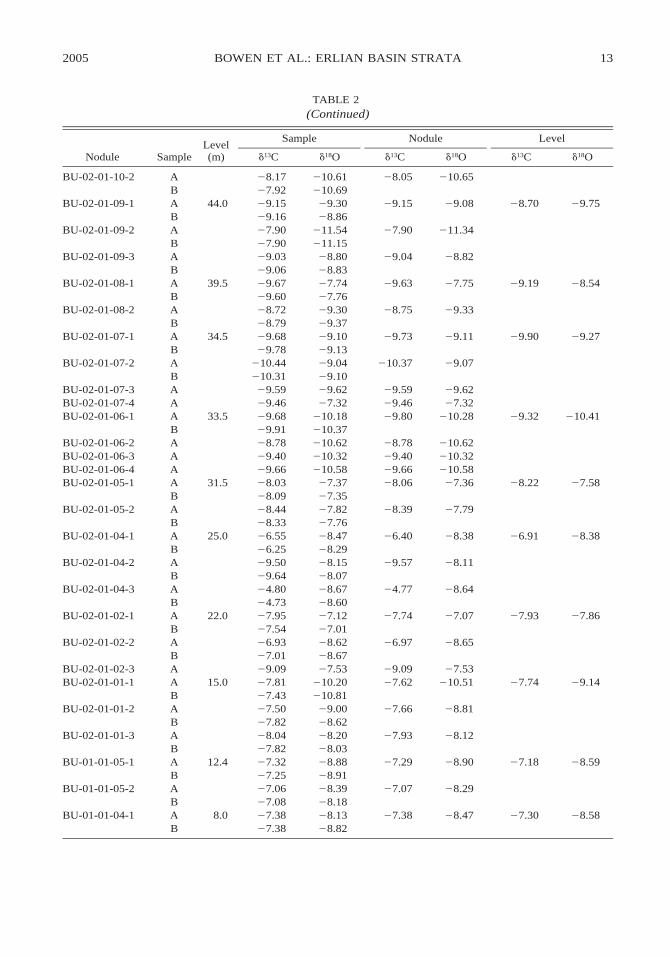
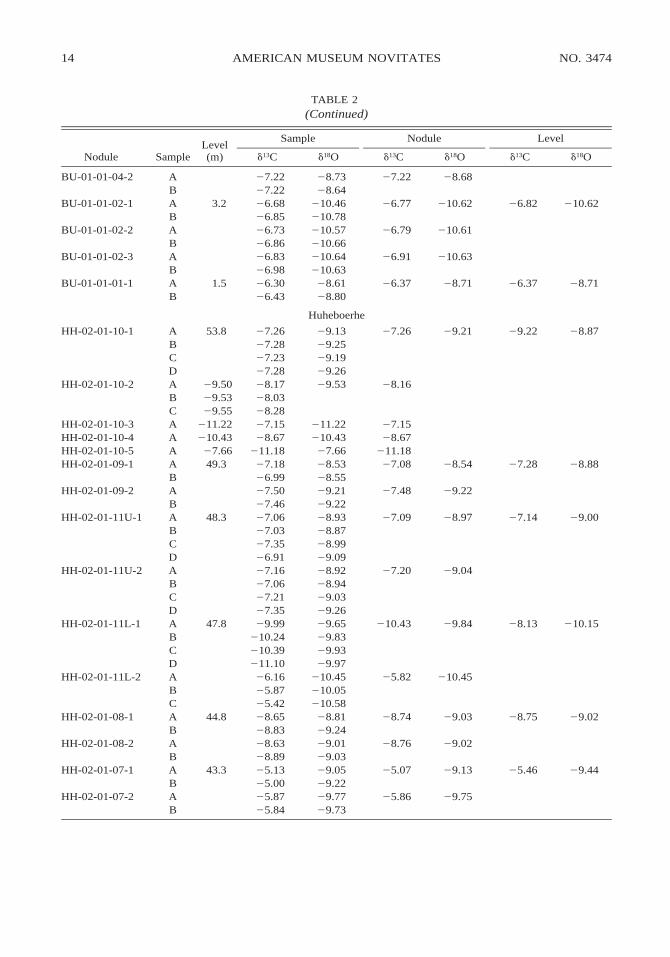
Analyses of the d13C and d18O values of 73carbonate nodules from 30 sampling levelsare shown in table 2 and figure 7. The av-erage range for multiple d13C or d18O analy-ses from a single nodule is 0.15 and 0.17‰
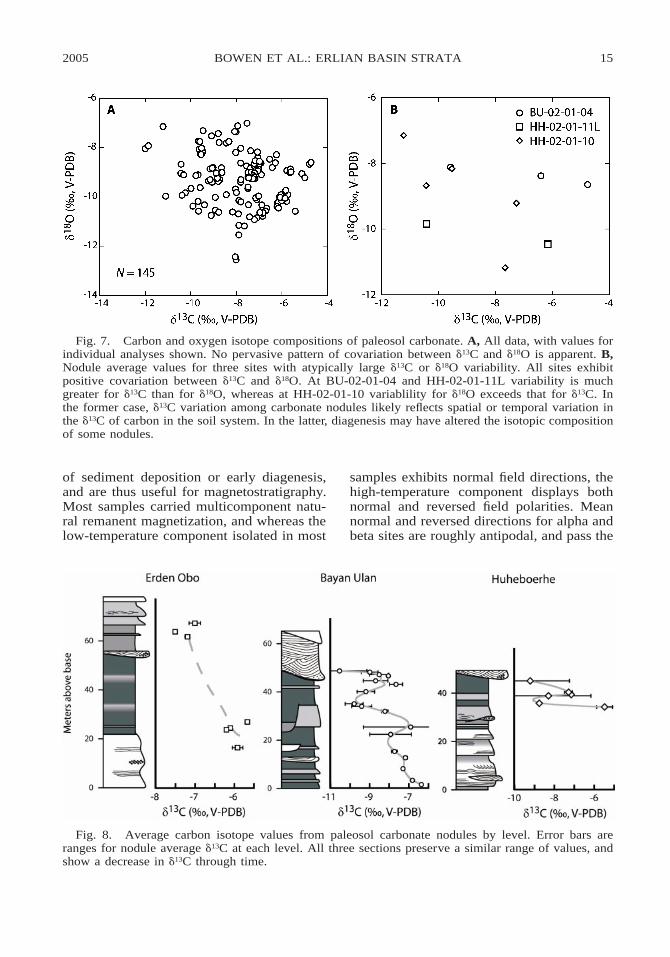
(N 5 63), and for multiple nodules from asingle sampling level is 0.94 and 0.93‰ (N5 29), respectively. No pervasive pattern ofcovariation between carbon and oxygen iso-topes is observed in the raw data set (fig.7A), but covariation is observed between themean d13C and d18O values of nodules fromsingle sampling levels (fig. 7B). When sitemean d13C values are plotted against strati-graphic level, all three localities show up-section decreases in d13C (fig. 8). The trendis particularly well defined within the BayanUlan section. At Erden Obo, there is an ;35-m sampling gap in the middle of the section,but samples near the top of the section haved13C values 2–3‰ lighter than those at ;20m. Samples from Huheboerhe have relativelyvariable d13C values, but level averages sug-gest that the sampled interval may be char-acterized by a weak decrease in d13C up-sec-tion.
DISCUSSION
FIDELITY OF THE PALEOMAGNETIC RECORD
Several lines of evidence suggest thatcharacteristic directions isolated in ErlianBasin paleomagnetic samples preserve infor-mation about the magnetic field at the time
12 NO. 3474AMERICAN MUSEUM NOVITATES
TABLE 2Stable Isotope Data
Nodule SampleLevel(m)
Sample
d13C d18O
Nodule
d13C d18O
Level
d13C d18O
Erden Obo
EO-01-2710.5-1
EO-01-2710.5-2
ABAB
68.0 26.8426.8927.1027.21
210.48210.33210.85210.92
26.86
27.15
210.41
210.89
27.01 210.65
EO-01-2610.5-1
EO-01-2610.5-2
ABAB
64.5 27.4827.5627.5127.50
29.0728.7429.6529.59
27.52
27.51
28.91
29.62
27.51 29.26
EO-01-2510.5-1
EO-01-2510.5-2
ABAB
62.5 27.1127.1627.0327.48
210.11210.0329.96
210.31
27.14
27.25
210.07
210.13
27.20 210.10
EO-01-12-1
EO-01-12-2
ABAB
27.0 25.7925.6625.6325.61
28.9329.0128.8628.98
25.72
25.62
28.97
28.92
25.67 28.95
EO-01-0611-1
EO-01-0611-2
ABAB
24.9 26.1226.1126.1026.05
210.18210.00210.1329.91
26.12
26.08
210.09
210.02
26.10 210.06
EO-01-0610.5-1EO-01-0610.5-2
AAB
24.4 26.2126.1726.22
210.24210.23210.39
26.2126.20
210.24210.31
26.20 210.27
EO-01-03-1
EO-01-03-2
ABAB
16.5 25.8025.7626.0226.08
210.1829.90
210.15210.02
25.78
26.05
210.04
210.08
25.92 210.06
Bayan Ulan
BU-02-02-01-1
BU-02-02-01-2BU-02-02-01-3
ABBAB
42.5 27.8227.8127.9027.3127.19
29.4029.30
210.1529.2429.25
27.81
27.9027.25
29.35
210.1529.25
27.66 29.58
BU-02-01-13-1
BU-02-01-13-2
ABAB
48.0 29.2329.06
212.01211.87
29.3529.4028.0527.93
29.15
211.94
29.37
27.99
210.54 28.68
BU-02-01-12-1
BU-02-01-12-2
ABAB
47.5 28.7628.7928.4428.92
27.7927.4329.91
210.02
28.77
28.68
27.61
29.97
28.99 28.60
BU-02-01-12-3
BU-02-01-11-1
ABAB
46.5
29.5929.4728.9229.10
28.2328.17
210.54210.75
29.53
29.01
28.23
210.65 28.52 210.20
BU-02-01-11-2
BU-02-01-10-1
ABAB
46.0
28.0528.0128.0328.06
29.6829.82
212.56212.44
28.03
28.05
29.75
212.50 28.05 211.58
2005 13BOWEN ET AL.: ERLIAN BASIN STRATA
TABLE 2(Continued)
Nodule SampleLevel(m)
Sample
d13C d18O
Nodule
d13C d18O
Level
d13C d18O
BU-02-01-10-2
BU-02-01-09-1
ABAB
44.0
28.1727.9229.1529.16
210.61210.6929.3028.86
28.05
29.15
210.65
29.08 28.70 29.75
BU-02-01-09-2
BU-02-01-09-3
ABAB
27.9027.9029.0329.06
211.54211.1528.8028.83
27.90
29.04
211.34
28.82
BU-02-01-08-1
BU-02-01-08-2
ABAB
39.5 29.6729.6028.7228.79
27.7427.7629.3029.37
29.63
28.75
27.75
29.33
29.19 28.54
BU-02-01-07-1
BU-02-01-07-2
ABAB
34.5 29.6829.78
210.44210.31
29.1029.1329.0429.10
29.73
210.37
29.11
29.07
29.90 29.27
BU-02-01-07-3BU-02-01-07-4BU-02-01-06-1
AAAB
33.5
29.5929.4629.6829.91
29.6227.32
210.18210.37
29.5929.4629.80
29.6227.32
210.28 29.32 210.41
BU-02-01-06-2BU-02-01-06-3BU-02-01-06-4BU-02-01-05-1
AAAA 31.5
28.7829.4029.6628.03
210.62210.32210.5827.37
28.7829.4029.6628.06
210.62210.32210.5827.36 28.22 27.58
B 28.09 27.35BU-02-01-05-2
BU-02-01-04-1
ABAB
25.0
28.4428.3326.5526.25
27.8227.7628.4728.29
28.39
26.40
27.79
28.38 26.91 28.38
BU-02-01-04-2
BU-02-01-04-3
ABAB
29.5029.6424.8024.73
28.1528.0728.6728.60
29.57
24.77
28.11
28.64
BU-02-01-02-1
BU-02-01-02-2
BU-02-01-02-3
ABABA
22.0 27.9527.5426.9327.0129.09
27.1227.0128.6228.6727.53
27.74
26.97
29.09
27.07
28.65
27.53
27.93 27.86
BU-02-01-01-1
BU-02-01-01-2
ABAB
15.0 27.8127.4327.5027.82
210.20210.8129.0028.62
27.62
27.66
210.51
28.81
27.74 29.14
BU-02-01-01-3
BU-01-01-05-1
ABAB
12.4
28.0427.8227.3227.25
28.2028.0328.8828.91
27.93
27.29
28.12
28.90 27.18 28.59
BU-01-01-05-2
BU-01-01-04-1
ABAB
8.0
27.0627.0827.3827.38
28.3928.1828.1328.82
27.07
27.38
28.29
28.47 27.30 28.58
14 NO. 3474AMERICAN MUSEUM NOVITATES
TABLE 2(Continued)
Nodule SampleLevel(m)
Sample
d13C d18O
Nodule
d13C d18O
Level
d13C d18O
BU-01-01-04-2
BU-01-01-02-1
ABAB
3.2
27.2227.2226.6826.85
28.7328.64
210.46210.78
27.22
26.77
28.68
210.62 26.82 210.62
BU-01-01-02-2
BU-01-01-02-3
ABAB
26.7326.8626.8326.98
210.57210.66210.64210.63
26.79
26.91
210.61
210.63
BU-01-01-01-1 AB
1.5 26.3026.43
28.6128.80
26.37 28.71 26.37 28.71
Huheboerhe
HH-02-01-10-1 ABCD
53.8 27.2627.2827.2327.28
29.1329.2529.1929.26
27.26 29.21 29.22 28.87
HH-02-01-10-2 ABC
29.5029.5329.55
28.1728.0328.28
29.53 28.16
HH-02-01-10-3HH-02-01-10-4HH-02-01-10-5
AAA
211.22210.4327.66
27.1528.67
211.18
211.22210.4327.66
27.1528.67
211.18HH-02-01-09-1
HH-02-01-09-2
ABAB
49.3 27.1826.9927.5027.46
28.5328.5529.2129.22
27.08
27.48
28.54
29.22
27.28 28.88
HH-02-01-11U-1 ABCD
48.3 27.0627.0327.3526.91
28.9328.8728.9929.09
27.09 28.97 27.14 29.00
HH-02-01-11U-2 ABCD
27.1627.0627.2127.35
28.9228.9429.0329.26
27.20 29.04
HH-02-01-11L-1 ABCD
47.8 29.99210.24210.39211.10
29.6529.8329.9329.97
210.43 29.84 28.13 210.15
HH-02-01-11L-2 ABC
26.1625.8725.42
210.45210.05210.58
25.82 210.45
HH-02-01-08-1
HH-02-01-08-2
ABAB
44.8 28.6528.8328.6328.89
28.8129.2429.0129.03
28.74
28.76
29.03
29.02
28.75 29.02
HH-02-01-07-1
HH-02-01-07-2
ABAB
43.3 25.1325.0025.8725.84
29.0529.2229.7729.73
25.07
25.86
29.13
29.75
25.46 29.44
2005 15BOWEN ET AL.: ERLIAN BASIN STRATA
Fig. 7. Carbon and oxygen isotope compositions of paleosol carbonate. A, All data, with values forindividual analyses shown. No pervasive pattern of covariation between d13C and d18O is apparent. B,Nodule average values for three sites with atypically large d13C or d18O variability. All sites exhibitpositive covariation between d13C and d18O. At BU-02-01-04 and HH-02-01-11L variability is muchgreater for d13C than for d18O, whereas at HH-02-01-10 variablility for d18O exceeds that for d13C. Inthe former case, d13C variation among carbonate nodules likely reflects spatial or temporal variation inthe d13C of carbon in the soil system. In the latter, diagenesis may have altered the isotopic compositionof some nodules.
Fig. 8. Average carbon isotope values from paleosol carbonate nodules by level. Error bars areranges for nodule average d13C at each level. All three sections preserve a similar range of values, andshow a decrease in d13C through time.
of sediment deposition or early diagenesis,and are thus useful for magnetostratigraphy.Most samples carried multicomponent natu-ral remanent magnetization, and whereas thelow-temperature component isolated in most
samples exhibits normal field directions, thehigh-temperature component displays bothnormal and reversed field polarities. Meannormal and reversed directions for alpha andbeta sites are roughly antipodal, and pass the

16 NO. 3474AMERICAN MUSEUM NOVITATES
reversal test of McFadden and McElhinny(1990) at 95% confidence. The somewhatdifferent inclinations for the normal and re-versed polarity averages may reflect shallow-ing of the reversed field directions due to thepresence of a minor, secondary magnetiza-tion that was not fully removed during ther-mal demagnetization (e.g., Scott and Hotes,1996). Our average normal and reversed sitedirections are not statistically different at95% confidence from previously reportednormal (D 5 359.68, I 5 53.78, N 5 8, k 565.9) and reversed (D 5 175.88, I 5 267.48,N 5 5, k 5 67.1) directions of Tertiary vol-canic rocks in Inner Mongolia (Zhao et al.,1994). Again, the inclination for our reversedsites is somewhat lower than in the Zhao etal. (1994) study, suggesting the persistenceof a minor magnetic overprint in these sam-ples. Normal and reversed sample polaritiesare consistent among multiple samples atmost sites, and site mean polarities definedcoherent stratigraphic polarity intervals. Inaddition to these considerations, strong sup-port for the fidelity of our paleomagnetic po-larity record is provided by the consistencyof magnetic, isotopic, lithologic, and bio-stratigraphic constraints on the correlation ofthe three measured sections, as discussed be-low.
FIDELITY OF THE ISOTOPIC RECORD
Carbon isotopes in authigenic soil carbon-ate reflect the d13C of soil CO2, which below;50 cm depth within the soil is largely de-rived from the decomposition of soil organicmatter (e.g., Cerling, 1984). The d13C valueof CO2 respired from soil organic matter issimilar to that of carbon fixed from the at-mosphere by plants living on the soil (Bowenand Beerling, 2004), meaning that carbonateformed at depth within a soil provides an in-direct proxy of atmospheric d13C. Because at-mospheric CO2 is well mixed over the time-scales on which soil carbonate form (1–100ky; e.g., Birkeland, 1999), large changes inthe d13C of the atmosphere through timeshould be reflected in aggrading sequencesof carbonate-bearing paleosols and can beused to correlate widely separated terrestrialsedimentary sections (Koch et al., 1992; Co-jan et al., 2000; Bowen et al., 2002). Dia-
genesis of soil carbonate isotope signatureshas been observed (e.g., Budd et al., 2002),however, and the potential for diagenetic ar-tifacts must be addressed before attemptingto use our paleosol carbonate d13C record asa tool for correlation.
Careful examination of the variation andcovariation of d13C and d18O values providesa useful method for identifying diageneticoverprinting in many cases (e.g., Bowen etal., 2001), although such an approach mayfall short for soils formed in environmentswith high diagenetic potential (Budd et al.,2002). We can present two expectations forchanges in isotopic signatures during diagen-esis that might help identify cases where d13Cvalues have been altered. First, diagenesisshould lead to characteristic changes in intra-and internodule isotopic variability, the na-ture of which will depend on the degree ofalteration. If alteration is partial, it should in-crease intranodule isotopic variability, and insome cases internodule variability, throughthe precipitation of diagenetic phases withdifferent d13C and/or d18O values than thepreserved, primary material. In contrast,complete alteration would produce very lowintra- and internodule variability, as all val-ues would be shifted to that of the diageneticphase. Second, because diagenetic fluidshave much more oxygen than carbon, post-burial should alter d18O preferentially relativeto d13C.
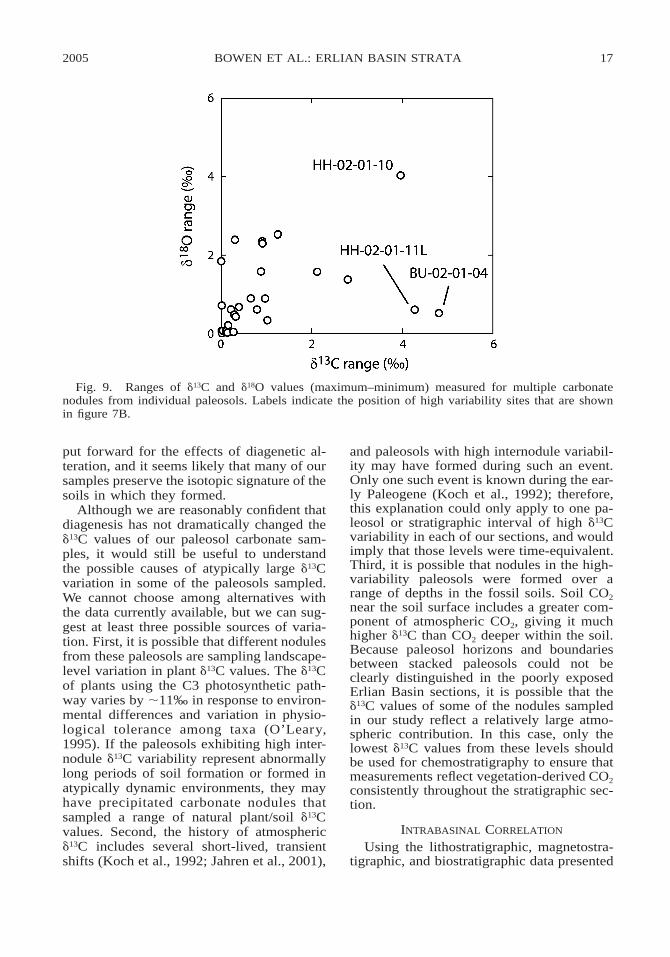
The narrow range of within-nodule isoto-pic variation observed in Erlian Basin sam-ples is similar to that seen in other studies ofwell-preserved paleosol carbonate micrite,but the within-level variation for many pa-leosols is somewhat greater (e.g., Koch et al.,1995; Bowen et al., 2001). Examination ofwithin-level variation on a case-by-case basisshows that there is no strong relation be-tween d13C and d18O variation within individ-ual paleosols (fig. 9), and that many of thosepaleosols with the greatest internodule vari-ability for d13C have relatively low d18O rang-es (figs. 7B, 9). The one exception is siteHH-02-01-10, where the very high range re-ported for d18O results from a single analysisof a small nodule, which gave a d18O valuealmost 2‰ lower than for any other samplefrom that level. In general, these observa-tions are not consistent with the expectations
2005 17BOWEN ET AL.: ERLIAN BASIN STRATA
Fig. 9. Ranges of d13C and d18O values (maximum–minimum) measured for multiple carbonatenodules from individual paleosols. Labels indicate the position of high variability sites that are shownin figure 7B.
put forward for the effects of diagenetic al-teration, and it seems likely that many of oursamples preserve the isotopic signature of thesoils in which they formed.
Although we are reasonably confident thatdiagenesis has not dramatically changed thed13C values of our paleosol carbonate sam-ples, it would still be useful to understandthe possible causes of atypically large d13Cvariation in some of the paleosols sampled.We cannot choose among alternatives withthe data currently available, but we can sug-gest at least three possible sources of varia-tion. First, it is possible that different nodulesfrom these paleosols are sampling landscape-level variation in plant d13C values. The d13Cof plants using the C3 photosynthetic path-way varies by ;11‰ in response to environ-mental differences and variation in physio-logical tolerance among taxa (O’Leary,1995). If the paleosols exhibiting high inter-nodule d13C variability represent abnormallylong periods of soil formation or formed inatypically dynamic environments, they mayhave precipitated carbonate nodules thatsampled a range of natural plant/soil d13Cvalues. Second, the history of atmosphericd13C includes several short-lived, transientshifts (Koch et al., 1992; Jahren et al., 2001),
and paleosols with high internodule variabil-ity may have formed during such an event.Only one such event is known during the ear-ly Paleogene (Koch et al., 1992); therefore,this explanation could only apply to one pa-leosol or stratigraphic interval of high d13Cvariability in each of our sections, and wouldimply that those levels were time-equivalent.Third, it is possible that nodules in the high-variability paleosols were formed over arange of depths in the fossil soils. Soil CO2
near the soil surface includes a greater com-ponent of atmospheric CO2, giving it muchhigher d13C than CO2 deeper within the soil.Because paleosol horizons and boundariesbetween stacked paleosols could not beclearly distinguished in the poorly exposedErlian Basin sections, it is possible that thed13C values of some of the nodules sampledin our study reflect a relatively large atmo-spheric contribution. In this case, only thelowest d13C values from these levels shouldbe used for chemostratigraphy to ensure thatmeasurements reflect vegetation-derived CO2
consistently throughout the stratigraphic sec-tion.
INTRABASINAL CORRELATION
Using the lithostratigraphic, magnetostra-tigraphic, and biostratigraphic data presented
18 NO. 3474AMERICAN MUSEUM NOVITATES
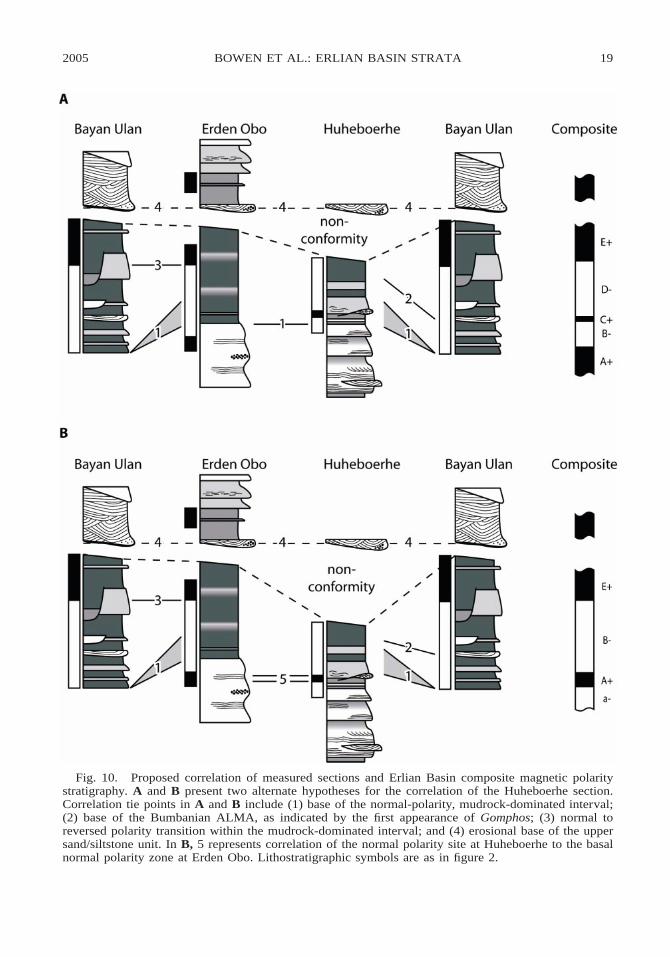
above, we propose two alternative correla-tions among the three local sections studiedhere (fig. 10). The two alternatives differonly in how the Huheboerhe section is cor-related to the Bayan Ulan and Erden Obosections. In alternative correlation A, weplace the greatest weight on our lithologicdata and correlate the base of the mudstoneunit at Huheboerhe to that at Erden Obo (fig.10A). In alternative B, we correlate the Hu-heboerhe section to Erden Obo based on thesingle normal polarity site at Huheboerhe.For alternative B, the placement of the Hu-heboerhe section relative to the others issome ;15 m lower than for correlation A(fig. 10B). The composite stratigraphic sec-tion implied by correlation A includes fivemagnetic polarity zones, which we designateA1 through E1, whereas the composite sec-tion implied by alternative correlation B in-cludes four polarity zones, here designateda2, A1, B2, and E1 (fig. 10).
Both alternative correlations presentedhere assume that the main (mudstone) nor-mal polarity zones at Huheboerhe and BayanUlan represent continuous deposition undernormal polarity conditions (e.g., no reversalsare missed). Although it is possible that oursampling may not capture a reversed polarityzone occurring during the time of depositionof this rock package in one of these sections,we feel that our dense magnetostratigraphicsampling of these units and the consistencyof lithostratigraphic and biostratigraphic pat-terns in the two sections supports the inter-pretation that this is a distinct polarity inter-val that can be correlated among the sites.Furthermore, no significant erosional surfac-es were observed in the mudstone interval atHuheboerhe (with the exception of the majorsandstone scour at the top of the section) orin the lower, fossiliferous part of the BayanUlan mudstone interval. We believe that it isunlikely that a reversed polarity interval wasremoved from this part of our sections as aresult of erosion. A greater degree of chan-neling was observed in the middle part of theBayan Ulan mudstone interval, and we can-not rule out the possibility that polarity zonesmay have been lost in that part of the section.Those eroded beds occur above the fossilif-erous levels considered here, though, and theloss of magnetostratigraphic from that inter-
val would not significantly affect the mainconclusions of our study.
Both correlations are consistent with themajority of our stratigraphic data, and eachhas its own strengths and weaknesses. Themain strengths of alternative correlation Aare that it aligns the transition from sand-stone to mudstone deposition at Erden Oboand Huheboerhe and that it pairs the rela-tively low (28 to 29‰) d13C values fromthe upper mudstone beds at Huheboerhe withthe similar d13C values in the middle of themudstone units at the other sites. Under cor-relation B, these low paleosol carbonate d13Cvalues would correlate to an interval in theother two sections where d13C values in theother sections are between 1 and 3‰ higher.In contrast, the primary shortcoming of al-ternative A is that it correlates the single nor-mal polarity magnetostratigraphy site at Hu-heboerhe within a relatively well-sampled re-versed zone at Bayan Ulan. Further magne-tostratigraphic sampling will be necessary toclearly distinguish between these two alter-native correlations.
Using correlation A, we propose a prelim-inary composite stratigraphic section for theinterval of study in Erlian Basin (fig. 11).The composite section shows an up-sectiondecline in paleosol carbonate d13C, five mag-netic polarity zones, and three distinct bio-stratigraphic intervals. Gashatan fossils occurfrom the base of the composite section, justbelow the base of polarity zone A1, to ap-proximately the midpoint of polarity zoneD2. Bumbanian fossils range from the mid-dle of zone to the top of D2, and Irdin Man-han fossils first appear well above the baseof zone E1. Paleosol carbonate d13C valuesdecrease by ;3‰ up-section, with the high-est measured values occurring near the baseof polarity zone B2 and the lowest withinpolarity zone E1. There is some suggestionthat d13C values may increase slightly at thetop of the section, but these data come ex-clusively from the poorly sampled ErdenObo section, and it is not clear that this pat-tern represents stratigraphic and not spatialvariation. If alternative correlation B for theHuheboerhe section was adopted, the impli-cations for the composite section would berelatively minor. In this case the poorly de-fined polarity zone shown as C1 in figure 11
2005 19BOWEN ET AL.: ERLIAN BASIN STRATA
Fig. 10. Proposed correlation of measured sections and Erlian Basin composite magnetic polaritystratigraphy. A and B present two alternate hypotheses for the correlation of the Huheboerhe section.Correlation tie points in A and B include (1) base of the normal-polarity, mudrock-dominated interval;(2) base of the Bumbanian ALMA, as indicated by the first appearance of Gomphos; (3) normal toreversed polarity transition within the mudrock-dominated interval; and (4) erosional base of the uppersand/siltstone unit. In B, 5 represents correlation of the normal polarity site at Huheboerhe to the basalnormal polarity zone at Erden Obo. Lithostratigraphic symbols are as in figure 2.

20 NO. 3474AMERICAN MUSEUM NOVITATES
Fig. 11. Composite section and preferred correlation of Early Paleogene rocks in the Erlian Basin(left panel) to the Geomagnetic Polarity Timescale (GPTS; Cande and Kent, 1995), the sequence ofNorth American Land Mammal Ages (NALMA), and biozones and paleosol carbonate d13C record ofthe Bighorn Basin, Wyoming (right panel). Data from the local sections have been combined usingcorrelation A (fig. 10A, see text). From left to right, left panel: generalized stratigraphy, compositecarbon isotope stratigraphy, composite magnetostratigraphy, stratigraphic distribution of biozones, andmagnetic polarity zones for the composite section. Symbols in the isotopic and magnetic time seriesrepresent data from the Erden Obo (squares), Bayan Ulan (circles), and Huheboerhe (diamonds) localsections, and alpha and beta magnetostratigraphy sites are indicated by closed and open symbols, re-spectively. Biozones include the Gashatan (G), Bumbanian (B), and Irden Manha (I) ALMAs, and lettersindicate the actual stratigraphic position of fossil collections. Right-hand panel is after Koch et al. (2003),with a generalized schematic carbon isotope curve based on the Bighorn Basin record shown here.Question marks indicate uncertainty in the correlation of the uppermost part of our section given thatpolarity zone E1 may be a composite representing more than one normal polarity chron.
would merge with zone A1 and reversed po-larity zones B2 and D2 would be joined(see fig. 10B). The basal reversed polaritysites at Huheboerhe would then define a re-versed polarity zone at the base of the com-posite section (a2). The Gashatan fossil P.matyr from Huheboerhe would be the onlyfossil taxon known definitively to occurwithin that zone, although the Gashatan as-semblage from the base of the Erden Obosection is unconstrained and could correlateeither within a2 or the base of A1.
AGE AND GLOBAL CORRELATION
Based on the isotope, faunal, and magne-tostratigraphic information summarized in
our composite section (fig. 11), we proposecorrelations between the Erlian Basin strataand the GPTS (Cande and Kent, 1995). Wecan constrain the correlation of our polarityreversals to the GPTS based on the trend inpaleosol carbonate d13C values in the ErlianBasin section, which we believe reflects asecular decrease in the d13C of Earth’s sur-face carbon reservoirs from the Late Paleo-cene to the Early Eocene. This trend has beenpreviously documented in marine (e.g., Za-chos et al., 2001) and terrestrial carbonates(e.g., Koch et al., 1992, 2003), and is of ap-proximately the same magnitude as that seenin our new record. The only other seculartrend of comparable magnitude and the same

2005 21BOWEN ET AL.: ERLIAN BASIN STRATA
direction that has been documented in EarlyPaleogene d13C records is the rapid, transientdecline in d13C at the Paleocene/Eoceneboundary (Zachos et al., 2001). The entiretyof the Paleocene/Eocene boundary event,however, lies within chron C24r of theGPTS, making it a poor match for the d13Cshift preserved in the Erlian Basin section.
The Late Paleocene d13C high occurs with-in chron C26r of the GPTS, and d13C de-creases steadily through time until reachinga minimum within chron C24n. In our ErlianBasin record, this decline spans polarityzones B2 through E1 of the composite sec-tion (fig. 11). Previous work has confirmedthat the boundary between the Gashatan andBumbanian ALMAs occurs within the lowerpart of C24r (Bowen et al., 2002), and be-cause both Gashatan and Bumbanian fossilsoccur in polarity zone D2 we correlate thiszone to C24r. We consider it to be unlikelythat polarity zone C1, defined by a singlenormal polarity site tightly bounded by re-versed sites, represents the 500-ky chronC25n, and prefer the interpretation that itrepresents one of the many short-lived ex-cursions of the magnetic field (cryptochrons)which have been identified within C24r(Cande and Kent, 1995). We therefore sug-gest that zones B2 through D2 correlate toC24r and that A1 represents the top of C25n.This lowermost polarity zone is again de-fined by only one alpha site, but is supportedby poorly clustered normal directions fromtwo other sites at Erden Obo (not shown).The stratigraphic extent of this zone is un-constrained because it occurs at the base ofthe Erden Obo and Bayan Ulan sections, butit is possible that further sampling down-sec-tion at Huheboerhe could allow us to identifythis polarity zone and constrain its base. Fi-nally, we correlate the base of the uppermostpolarity zone E1 to the C24r–C24n bound-ary. Based on the evidence for significanterosion within this part of our section and thepresence of fossils thought to be of middleEocene age (Dashzeveg and Hooker, 1997)in the upper part of E1, however, we feelthat it is likely that this is a composite po-larity zone including the normal subchronswithin C24n and subsequent normal polarityzones.
We also present two alternative correla-
tions which cannot be ruled out given thecurrent data (fig. 12). Using intrabasin cor-relation A, we can present the alternative hy-pothesis that polarity zone C1 does representchron C25n (fig. 12A). In this case, zonesA1 and B2 would correlate to chrons C26nand C25r, respectively. A second alternative,based on intrabasin correlation B, is identicalto the preferred global correlation with theexception that the additional, basal, reversedpolarity zone (designated a2) is correlated tochron C25r. Given the durations of thesechrons in the GPTS, both alternatives arereasonable in that they give fairly constantsediment accumulation rates for the boundedpolarity zones of the composite section. Test-ing these hypotheses will require furthermagnetostratigraphic sampling around andbelow the normal polarity site at Huheboerheto identify the pattern and duration of polar-ity zones near and below the base of the cur-rent composite section.
The proposed correlations to the GPTSsuggests that our section from the Erlian Ba-sin represents more than 3 million years oftime spanning the Paleocene/Eocene bound-ary. Our isotopic sampling does not appearto have recovered evidence of the 100-ky, 3–6‰ carbon isotope excursion marking thePaleocene/Eocene boundary (fig. 11). Thisresult is not surprising given the very lowsediment accumulation rates indicated forour sections by the proposed magnetostrati-graphic correlations. For example, the polar-ity interval representing C24r according tothe preferred global correlation seems to bemost expanded in the Bayan Ulan section,where it is represented by at least 30 m ofsection. Given the estimated duration of C24r(;2.6 m.y.; Cande and Kent, 1995), thisgives an average sediment accumulation rateof ,1.2 cm/ky. If we assume that sedimen-tation was continuous, the P/E boundaryevent would be represented by only ;1.2 m,a thickness of rock much less than our av-erage sampling interval. Further, there is am-ple evidence for significant sedimentary hi-atuses and erosional down-cutting in all threeof our local sections, making it even morelikely that the P/E boundary d13C excursioninterval was not present or not sampled inour sections.

22 NO. 3474AMERICAN MUSEUM NOVITATES
Fig. 12. Two alternative correlations of the Erlian Basin composite magnetic polarity zones andfaunal zones (letter designations as in fig. 11) to the Geomagnetic Polarity Timescale. A, Alternativeglobal correlation based on intrabasin correlation A (see fig. 10A). Polarity zone C1, defined by thesingle normal polarity site at Huheboerhe, is considered to represent chron C25n, and polarity zonesA1 and B2 are shifted to correspond to C26n and C25r, respectively. Only one Gashatan collection,the upper Gashatan level at Bayan Ulan containing Palaeostylops, Pseudictops, and Palaeomylus, fallswithin C24r, and the range of Gashatan faunas is extended downward into C26n. B, Alternative globalcorrelation based on intrabasin correlation B (see fig. 10B). This is identical to the preferred globalcorrelation (fig. 11) with the exception that the lower reversed polarity sites in the Huheboerhe sectionconstitute a basal reversed polarity zone (designated a2), which is correlated to chron C25r. The rangeof Gashatan faunas in the composite section is extended downward into this zone by the Prodinoceras-bearing locality at Huheboerhe.
CONCLUSIONS: THE AGE OF EARLYPALEOGENE ALMAS
The new data from the Erlian Basin placeadditional constraints on the age of Early Pa-leogene ALMAs and their correlation to theland mammal ages of North America and Eu-rope. These data are preliminary, and furthersampling will help to resolve the exactchronostratigraphic placement of the ErlianBasin faunas, but our current findings pro-vide evidence that faunas typical of theGashatan ALMA persist into chron C24r.Previously, the ;900-ky interval of time be-tween the base of C24r and the Paleocene/
Eocene boundary represented an intervalwithin which the nature of Asian faunas wasunconstrained (Bowen et al., 2002; Ting etal., 2003). This window of time representedthe potential extent to which Bumbanian fau-nas, and the Asian first appearances of‘‘new’’ groups of mammals therein, mighthave predated these key first appearances onthe other Holarctic continents. If modernmammals evolved and diversified in anAsian Eden before dispersing throughout theNorthern Hemisphere, they did so within thisinterval. Under all three possible correlationsof the Erlian Basin composite section to the
2005 23BOWEN ET AL.: ERLIAN BASIN STRATA
GPTS, Gashatan fossils are shown to rangeinto the base of C24r, although the extent oftheir persistence within this chron varies sub-stantially among correlations. According tothe preferred global correlation and the al-ternative based on intrabasin correlation B,Gashatan faunas are found throughout morethan half of the interval of the Erlian Basincomposite section representing chron C24r,implying that the Gashatan ALMA must ex-tend quite near to the Paleocene/Eoceneboundary. If the alternative global correlationshown in figure 12A proves correct, how-ever, only a single Gashatan level would liewithin C24r, and significant uncertaintywould remain regarding the placement of theGashatan/Bumbanian boundary relative tothe Paleocene/Eocene boundary.
Though they have received less scrutinythan the Gashatan/Bumbanian boundary, theages of most other ALMA boundaries are al-most entirely unconstrained by independentdata. If either alternative correlation shownin figure 12 proves correct, the known rangeof Gashatan faunas will be extended down-ward into chron C25r and possibly C26n.This would imply that Gashatan faunas spanan interval of time including the boundarybetween the Tiffanian and ClarkforkianNALMAs, which occurs within C25n, andthat the boundary between the Gashatan andthe earlier Nonshanian ALMA correlateswithin the Tiffanian NALMA. At this point,it is difficult to say anything concrete aboutthe upper boundary age of the BumbanianALMA based on our new data. Under intra-basin correlation A, the Gomphos level atHuheboerhe is likely somewhat younger thanthat at Bayan Ulan. Although the correlationof this level relative to the C24r/C24nboundary preserved in the other two localsections is not well constrained, it appearsthat the Bumbanian level at Huheboerhe maylie within the upper part of C24r, making itsomewhat younger than other Bumbanianfaunas (Bowen et al., 2002; Ting et al.,2003). As noted above, Irdin Manhan fossilsoccur within what is likely to be a compositepolarity interval, and further up-section sam-pling will be required in order to constraintheir age and correlation.
The full nature and magnitude of globalchange occurring at the Paleocene/Eocene
boundary is only now being realized. Closeties between climatic events at the P/Eboundary and modernization of mammalfaunas in North America and Europe havebeen established, but the nature of Asian fau-nal modernization near the P/E boundary hasremained a topic of debate. By constrainingthe timing of taxonomic turnover for this re-gion, we can begin to understand whether theevolutionary modernization of faunas on theAsian continent operated at its own pace, tiedto the rest of the Holarctic only by episodicpulses of opportunistic interchange, or ifthese communities developed in pace with,and presumably in response to the same ex-trinsic or intrinsic forcing as, other NorthernHemisphere faunas. Our preliminary resultspresented here suggest that modernization ofAsian faunas near the P/E boundary mayhave been nearly synchronous with turnoverin Europe and North America, and that mam-mals on these three continents may haveevolved in close step through this climati-cally and environmentally dynamic interval.
ACKNOWLEDGMENTS
We thank W. Clyde, R. Coe, G. Dickens,Thierry Smith, and Paul White for helpfulreviews of this manuscript, and R. Coe, C.Pluhar, and X. Zhao of the University of Cal-ifornia Paleomagnetics laboratory for theirassistance. Funding for this work was pro-vided by a U.S. National Science Foundationgrant to Koch, Meng, and collaborators(EAR-0120727), National Natural ScienceFoundation of China grants to Meng(G200007707 and 49928202), and by the In-stitute of Vertebrate Paleontology and Paleo-anthropology (IVPP) of the Chinese Acade-my of Sciences. Bowen was supported by aNational Science Foundation Graduate Re-search Fellowship during part of the project.Field work in Inner Mongolia would nothave been possible without the logistical andintellectual support of the staff and faculty ofthe IVPP.
REFERENCES
Averianov, A. 1996. Early Eocene Rodentia ofKyrgyzstan. Bulletin du Museum Nationald’Histoire Naturelle, 18: 629–662.
Bao, H., P.L. Koch, and R.P. Hepple. 1998. He-
24 NO. 3474AMERICAN MUSEUM NOVITATES
matite and calcite coatings on fossil vertebrates.Journal of Sedimentary Research 68: 727–738.
Beard, K.C. 1998. East of Eden; Asia as an im-portant center of taxonomic origination inmammalian evolution. In K.C. Beard and M.R.Dawson (editors), Dawn of the age of mammalsin Asia, Bulletin of the Carnegie Museum ofNatural History 34: 5–39.
Beard, K.C., and M.R. Dawson. 1999. Intercon-tinental dispersal of Holarctic land mammalsnear the Paleocene/Eocene boundary; paleo-geographic, paleoclimatic and biostratigraphicimplications. Bulletin de la Societe Geologiquede France 170: 697–706.
Birkeland, P.W. 1999. Soils and geomorphology.New York: Oxford University Press, 430 pp.
Bowen, G.J., and D.J. Beerling. 2004. An inte-grated model for soil organic carbon and CO2:implications for paleosol carbonate pCO2 pa-leobarometry. Global Biogeochemical Cycles:18, GB1026, doi:10.1029/2003GB002117.
Bowen, G.J., W.C. Clyde, P.L. Koch, S. Ting, J.Alroy, T. Tsubamoto, Y. Wang, and Y. Wang.2002. Mammalian dispersal at the Paleocene/Eocene boundary. Science 295: 2062–2065.
Bowen, G.J., P.L. Koch, P.D. Gingerich, R.D.Norris, S. Bains, and R.M. Corfield. 2001. Re-fined isotope stratigraphy across the continentalPaleocene-Eocene boundary on Polecat Benchin the Northern Bighorn Basin. In P.D. Ginger-ich (editor), Paleocene-Eocene stratigraphy andbiotic change in the Bighorn and Clarks ForkBasins, Wyoming. University of Michigan Mu-seum of Paleontology 33: 73–88.
Budd, D.A., S.M. Pack, and M.L. Fogel. 2002.The destruction of paleoclimatic isotopic sig-nals in Pleistocene carbonate soil nodules ofWestern Australia. Palaeogeography Palaeocli-matology Palaeoecology 188: 249–273.
Cande, S.C., and D.V. Kent. 1995. Revised cali-bration of the geomagnetic polarity timescalefor the Late Cretaceous and Cenozoic. Journalof Geophysical Research-Solid Earth 100:6093–6095.
Cerling, T.E. 1984. The stable isotopic composi-tion of modern soil carbonate and its relation-ship to climate. Earth and Planetary ScienceLetters 71: 229–240.
Cojan, I., M.G. Moreau, and L.E. Stott. 2000. Sta-ble carbon isotope stratigraphy of the Paleo-gene pedogenic series of southern France as abasis for continental-marine correlation. Geol-ogy 28: 259–262.
Dashzeveg, D. 1988. Holarctic correlation of non-marine Palaeocene-Eocene boundary strata us-ing mammals. Journal of the Geological Soci-ety [London] 145: 473–478.
Dashzeveg, D. 1990. The earliest rodents (Roden-
tia, Ctenodactyloidea) of Central Asia. ActaZoologica Cracoviensia 33: 11–35.
Dashzeveg, D., and J.J. Hooker. 1997. New Cer-atomorph Perissodactyls (Mammalia) from theMiddle and Late Eocene of Mongolia—Theirimplications for phylogeny and dating. Zoolog-ical Journal of the Linnean Society 120: 105–138.
Farley, K.A., and S.F. Eltgroth. 2003. An alter-native age model for the Paleocene-Eocenethermal maximum using extraterrestrial He-3.Earth and Planetary Science Letters 208: 135–148.
Gingerich, P.D. 1989. New earliest Wasatchianmammalian fauna from the Eocene of north-western Wyoming: composition and diversityin a rarely sampled high-floodplain assemblage.University of Michigan Papers on Paleontology28: 1–97.
Gingerich, P.D. 2001. Biostratigraphy of the con-tinental Paleocene-Eocene boundary intervalon Polecat Bench in the Northern Bighorn Ba-sin. In P.D. Gingerich (editor), Paleocene-Eo-cene stratigraphy and biotic change in the Big-horn and Clarks Fork Basins, Wyoming. Uni-versity of Michigan Papers on Paleontology 33:37–71.
Harrington, G.J. 2003. Geographic patterns in thefloral response to Paleocene-Eocene warming.In S.L. Wing, P.D. Gingerich, B. Schmitz, andE. Thomas (editors), Causes and consequencesof globally warm climates in the Early Paleo-gene. Geological Society of America SpecialPaper 369: 381–393.
Hooker, J.J. 1998. Mammalian faunal changeacross the Paleocene-Eocene transition in Eu-rope. In M.-P. Aubry, S. Lucas, and W.A. Berg-gren (editors), Late Paleocene-Early Eoceneclimatic and biotic events in the marine and ter-restrial records: 428–450. New York: ColumbiaUniversity Press.
Jahren, A.H., N.C. Arens, G. Sarmiento, J. Guer-rero, and R. Amundson. 2001. Terrestrial re-cord of methane hydrate dissociation in theEarly Cretaceous. Geology 29: 159–162.
Kennett, J.P., and L.D. Stott. 1991. Abrupt deep-sea warming, palaeoceanographic changes andbenthic extinctions at the end of the Palaeo-cene. Nature 353: 225–229.
Koch, P.L., W.C. Clyde, R.P. Hepple, M.L. Fogel,S.L. Wing, and J.C. Zachos. 2003. Carbon andoxygen isotope records from paleosols span-ning the Paleocene-Eocene boundary, BighornBasin, Wyoming. In S.L. Wing, P.D. Gingerich,B. Schmitz, and E. Thomas (editors), Causesand consequences of globally warm climates inthe early Paleocene. Geological Society ofAmerica Special Paper 369: 49–64.
2005 25BOWEN ET AL.: ERLIAN BASIN STRATA
Koch, P.L., J.C. Zachos, and D.L. Dettman. 1995.Stable isotope stratigraphy and paleoclimatol-ogy of the Paleogene Bighorn Basin (Wyo-ming, USA). Palaeogeography Palaeoclimatol-ogy Palaeoecology 115: 61–89.
Koch, P.L., J.C. Zachos, and P.D. Gingerich. 1992.Correlation between isotope records in marineand continental carbon reservoirs near the Pa-laeocene/Eocene boundary. Nature 358: 319–322.
Magioncalda, R., C. Dupuis, T. Smith, E. Steur-baut, and P.D. Gingerich. 2004. Paleocene-Eocene carbon isotope excursion in organiccarbon and pedogenic carbonate: direct com-parison in a continental stratigraphic section.Geology 32: 553–556.
McFadden, P.L., and M.W. McElhinny. 1990.Classification of the reversal test in paleomag-netism. Geophysics Journal International 103:725–729.
McKenna, M.C. 1973. Sweepstakes, filters, cor-ridors, Noah’s Arks, and beached Viking fu-neral ships in palaeogeography. In D.H. Tarlingand S.K. Runcorn (editors), Implications ofContinental Drift to the earth sciences, Vol. 1:295–308. London: Academic Press.
Meng, J., G.J. Bowen, J. Ye, P.L. Koch, S. Ting,Q. Li, and X. Jin. 2004. Gomphos elkema (Gli-res, Mammalia) from the Erlian Basin: evi-dence for the Early Tertiary Bumbanian landmammal age in Nei-Mongol, China. AmericanMuseum Novitates 3425: 1–25.
Meng, J., A.R. Wyss, Y. Hu, J. Ye, G.J. Bowen,and P.L. Koch. In review. Glires (Mammalia)from the Late Paleocene Bayan Ulan of InnerMongolia. American Museum Novitates.
Meng, J., R. Zhai, and A.R. Wyss. 1998. The latePaleocene Bayan Ulan fauna of Inner Mongo-lia, China. In K.C. Beard and M.R. Dawson(editors), Dawn of the age of mammals in Asia.Bulletin of the Carnegie Museum of NationalHistory 34: 148–185.
O’Leary, M.H. 1995. Environmental effects oncarbon isotope fractionation in terrestrial plants.In E. Wada, T. Yoneyama, M. Minigawa, T.Ando, and B.D. Fry (editors), Stable isotopesin the biosphere: 78–91. Kyoto, Japan: KyotoUniversity Press.
Ouda, K. 2003. The Paleocene/Eocene boundaryin Egypt: an overview. Micropaleontology 49:15–40.
Rohl, U., T.J. Bralower, R.D. Norris, and G. We-fer. 2000. New chronology for the late Paleo-cene thermal maximum and its environmentalimplications. Geology 28: 927–930.
Scott, G.R., and S.A. Hotes. 1996. The reversaltest—an examination of secondary directions.Geophysical Research Letters 23: 1805–1808.
Shevyreva, N.S. 1989. New rodents (Ctenodac-tyloidea, Rodentia, Mammalia) from the LowerEocene of Mongolia. PaleontologicheskyiZhurnal 3: 60–72. [in Russian]
Smith, T. 2000. Mammals from the Paleocene-Eo-cene transition in Belgium (Tienen Formation,MP7): paleobiogeographical and biostrati-graphical implications. GFF (Geologiska For-eningens i Stockholm Forhandlingar) 122: 148–149.
Smith, T., J. Van Itterbeeck, and P. Missiaen.2004. Oldest Plesiadapiform (Mammalia, Pro-primates) from Asia and its paleobiogeographicimplicatoins for faunal interchange with NorthAmerica. Comptes Rendus de l’ Academie desSciences, Paris 3: 43–52.
Steurbaut, E., J. De Coninck, E. Roche, and T.Smith. 1999. The Dormaal Sands and the Pa-leocene/Eocene boundary in Belgium. Bulletinde la Societe Geologique de France 170: 217–227.
Ting, S. 1998. Paleocene and early Eocene landmammal ages of Asia. In K.C. Beard and M.R.Dawson (editors), Dawn of the age of mammalsin Asia, Bulletin of the Carnegie Museum ofNational History 34: 124–147.
Ting, S., G.J. Bowen, P.L. Koch, W.C. Clyde, Y.Wang, and M.C. McKenna. 2003. Biostrati-graphic, chemostratigraphic, and magnetostra-tigraphic study across the Paleocene/Eoceneboundary in the Hengyang Basin, Hunan, Chi-na. In S.L. Wing, P.D. Gingerich, B. Schmitz,and E. Thomas (editors), Causes and conse-quences of globally warm climates in the EarlyPaleogene. Geological Society of America Spe-cial Paper 369: 521–535.
Tong, Y., and J. Wang. 1998. A preliminary reporton the early Eocene mammals of the Wutu fau-na, Shandong Province, China. In K.C. Beardand M.R. Dawson (editors), Dawn of the ageof mammals in Asia, Bulletin of the CarnegieMuseum of National History 34: 186–193.
U. S. Geological Survey. 1996. GTOPO30 global30 arc second elevation data. Sioux Falls, SD:USGS EROS Data Center.
Watson, G.S. 1956. A test for randomness of di-rections. Monthly Notices of the Royal Astro-nomical Society Geophysical Supplement 7:160–161.
Wing, S.L., H. Bao, and P.L. Koch. 1999. An ear-ly Eocene cool period? Evidence for continen-tal cooling during the warmest part of the Ce-nozoic. In B.T. Huber, K.G. Macleod, and S.L.Wing (editors), Warm climates in Earth history:197–237. Cambridge: Cambridge UniversityPress.
Zachos, J.C., K.C. Lohmann, J.C.G. Walker, andS.W. Wise. 1993. Abrupt climate changes and

26 NO. 3474AMERICAN MUSEUM NOVITATES
transient climates during the Paleogene; a ma-rine perspective. Journal of Geology 101: 191–213.
Zachos, J.C., M. Pagani, L. Sloan, E. Thomas, andK. Billups. 2001. Trends, rhythms, and aberra-tions in global climate 65 Ma to present. Sci-ence 292: 686–693.
Zhao, X., R.S. Coe, Y. Zhou, S. Hu, H. Wu, G.Kuang, Z. Dong, and J. Wang. 1994. Tertiarypaleomagnetixm of North and South China anda reappraisal of late Mesozoic paleomagneticdata from Eurasia: implications for the Ceno-zoic tectonic history of Asia. Tectonophysics235: 181–203.

Complete lists of all issues of the Novitates and the Bulletin are available at World Wide Website http://library.amnh.org/pubs. Inquire about ordering printed copies via e-mail [email protected] or via standard mail from: American Museum of Natural History, Library—Scientific Publications, Central Park West at 79th St., New York, NY 10024. TEL: (212) 769-5545. FAX: (212) 769-5009.
a This paper meets the requirements of ANSI/NISO Z39.48-1992 (Permanence of Paper).