Embed Size (px)
Citation preview

KENYATTA UNIVERSITY – INSTITUTE OF OPENING LEARNING
DEPARTMENT OF GEOGRAPHY III
AGE 301: PHYSICAL GEOGRAPHY
DR. JOY APIYO OBANDO
&
DR. GEORGE LUKOYE MAKOKHA
© 2005

FOREWORD
Physical Geography III is a course that builds on the knowledge gained from the study of
Physical Geography I and II. It builds on the knowledge of the atmosphere introduced in
Physical Geography I and introduces the basic concepts of Biogeography, mainly concerned
with the factors that determine the distribution of living organisms and their impact on the
environment. The course also examines the scope and growth of Biogeography, vegetation
and soils. Aspects of the atmosphere such as climatic elements and their distribution, climatic
factors, climatic classification schemes and climatic change are adequately covered.
The overall objective of this course is to enable the learner to be able to explain the concepts,
linkages and processes in the Atmosphere and Biosphere. Learners are expected after studying
this course to explain the patterns and controls of global climates, vegetation and soils and
their influence on the Biosphere. They should also be able to explain the effect of biotic and
abiotic factors on the distribution of living organisms. Lessons 1 to 4 discuss the aspects of
the atmosphere, while the biosphere is covered in Lessons 5 to 10.

ii
TABLE OF CONTENTS PAGE
FOREWORD.............................................................................................................................I
LESSON 1. CLIMATIC ELEMENTS AND THEIR GLOBAL DISTRIBUTION ....... 1
1.1. Introduction ................................................................................................................ 1
1.2. Objectives................................................................................................................... 1
1.3. Temperature ............................................................................................................... 1
1.4. Evaporation ................................................................................................................ 6
1.5. Precipitation ............................................................................................................... 8
1.6. Summary .................................................................................................................. 10
1.7. Definitions of Key Words ........................................................................................ 11
1.8. Revision Questions................................................................................................... 12
1.9. Further Reading........................................................................................................ 12
LESSON 2. CLIMATIC CONTROLS AND FACTORS................................................ 13
2.1. Introduction .............................................................................................................. 13
2.2. Objectives................................................................................................................. 13
2.3. Air Masses................................................................................................................ 13
2.4. Convergence of air masses and fronts...................................................................... 16
2.5. Frontal systems......................................................................................................... 16
2.6. Latitude..................................................................................................................... 19
2.7. Altitude..................................................................................................................... 20
2.8. Land and water masses............................................................................................. 21
2.9. Relief features .......................................................................................................... 21
2.10. Summary .............................................................................................................. 21
2.11. Definition of Key Words...................................................................................... 21
2.12. Revision Questions............................................................................................... 22
2.13. Further Reading.................................................................................................... 22
LESSON 3. CLIMATIC CLASSIFICATION, MICRO AND MAN-MADE
CLIMATES 23
3.1. Introduction .............................................................................................................. 23
3.2. Objectives................................................................................................................. 23
3.3. Purpose and problems of climatic classification ...................................................... 23
3.4. Approaches to climatic classification....................................................................... 24

iii
3.5. Genetic classification schemes................................................................................. 25
3.6. Generic/Empirical Classification Schemes .............................................................. 27
3.7. Climatic regions of the world................................................................................... 29
3.8. Micro-Climates or Local Climates........................................................................... 30
3.9. Man made climates................................................................................................... 31
3.10. Cloud seeding....................................................................................................... 32
3.11. Summary .............................................................................................................. 32
3.12. Definitions of Key Words .................................................................................... 33
3.13. Revision Questions............................................................................................... 33
3.14. Further Reading.................................................................................................... 33
LESSON 4. CLIMATE CHANGE AND FLUCTUATIONS.......................................... 35
4.1. Introduction .............................................................................................................. 35
4.2. Objectives................................................................................................................. 35
4.3. Natural climate change............................................................................................. 35
4.4. Man-made climatic change ...................................................................................... 37
4.5. Global warming and climate changes ...................................................................... 38
4.6. Summary .................................................................................................................. 39
4.7. Definitions of Key Words ........................................................................................ 39
4.8. Revision Questions................................................................................................... 39
4.9. Further Reading........................................................................................................ 39
LESSON 5. SCIENCE OF BIOGEOGRAPHY............................................................... 41
5.1. Introduction .............................................................................................................. 41
5.2. The objectives .......................................................................................................... 41
5.3. Definitions and concepts .......................................................................................... 41
5.4. The scope and growth of Biogeography .................................................................. 42
5.5. The biosphere and role of humankind...................................................................... 43
5.6. Summary .................................................................................................................. 43
5.7. Definition of key words............................................................................................ 44
5.8. Revision Questions................................................................................................... 44
5.9. Further Reading........................................................................................................ 44
LESSON 6. ECOSYSTEM CONCEPT ............................................................................ 45
6.1. Introduction .............................................................................................................. 45
6.2. The objectives .......................................................................................................... 45

iv
6.3. The Ecosystem ......................................................................................................... 45
6.4. Ecosystem structure and function ............................................................................ 46
6.5. Energy flow in ecosystems....................................................................................... 47
6.6. Nutrient cycling in the ecosystem ............................................................................ 49
6.7. Summary .................................................................................................................. 52
6.8. Definition of key words............................................................................................ 52
6.9. Revision Questions................................................................................................... 52
6.10. Further Reading.................................................................................................... 53
LESSON 7. PATTERNS AND TYPES OF DISTRIBUTION OF LIVING
ORGANISMS ......................................................................................................................... 54
7.1. Introduction .............................................................................................................. 54
7.2. The objectives .......................................................................................................... 54
7.3. Patterns and Distribution of Living Organisms........................................................ 54
7.4. Spatial and temporal patterns ................................................................................... 55
7.5. Abiotic Factors and Distribution of Living Organisms............................................ 59
7.6. Biotic Factors and Distribution of Living Organisms.............................................. 65
7.7. Fire ........................................................................................................................... 70
7.8. Anthropogenic.......................................................................................................... 71
7.9. Time and Ecosystems............................................................................................... 71
7.10. Summary .............................................................................................................. 71
7.11. Definition of key words........................................................................................ 71
7.12. Revision Questions............................................................................................... 72
7.13. Further Reading.................................................................................................... 72
LESSON 8. VEGETATION PROCESSES ...................................................................... 73
8.1. Introduction .............................................................................................................. 73
8.2. Objectives................................................................................................................. 73
8.3. Ecological Succession.............................................................................................. 73
8.4. Dominance at Climax............................................................................................... 75
8.5. Dispersal Mechanisms.............................................................................................. 75
8.6. Adaptation ................................................................................................................ 76
8.7. Summary .................................................................................................................. 76
8.8. Definition of key words............................................................................................ 76
8.9. Revision Questions................................................................................................... 77
8.10. Further Reading.................................................................................................... 77

v
LESSON 9. WORLD VEGETATION ITS DISTRIBUTION AND CLASSIFICATION
78
9.1. Introduction .............................................................................................................. 78
9.2. Objectives................................................................................................................. 78
9.3. Vegetation regions of the world ............................................................................... 78
9.4. Forests ...................................................................................................................... 79
9.5. Grasslands ................................................................................................................ 83
9.6. Biological Deserts .................................................................................................... 84
9.7. Aquatic Ecosystems ................................................................................................. 87
9.8. Summary .................................................................................................................. 88
9.9. Definition of key words............................................................................................ 88
9.10. Revision Questions............................................................................................... 88
9.11. Further Reading.................................................................................................... 88
LESSON 10. SOILS .......................................................................................................... 90
10.1. Introduction .......................................................................................................... 90
10.2. The objectives ...................................................................................................... 90
10.3. Formation of Soils................................................................................................ 90
10.4. Physical and chemical properties of soil .............................................................. 91
10.5. Types and classification of soils........................................................................... 92
10.6. The soil catena...................................................................................................... 95
10.7. Soil Conservation and Management .................................................................... 95
10.8. Climate, Vegetation and Soils.............................................................................. 95
10.9. Summary .............................................................................................................. 97
10.10. Definition of key words........................................................................................ 97
10.11. Revision Questions............................................................................................... 97
10.12. Further Reading.................................................................................................... 97

vi
LIST OF FIGURES PAGE
Figure 1. Temperature inversion where warm air is above cooler air at the surface ----- 2
Figure 2. A warm front system ----------------------------------------------------------------------17
Figure 3. A cold front system ------------------------------------------------------------------------17
Figure 4: Cold Front Type of Occlusion -----------------------------------------------------------18
Figure 5: Warm front type of occlusion ------------------------------------------------------------19
Figure 6: The geosystem -------------------------------------------------------------------------------45
Figure 7: A simple food chain ------------------------------------------------------------------------48
Figure 8: Simple Biogeochemical cycle -------------------------------------------------------------49
Figure 9: The equatorial rainforest -----------------------------------------------------------------80
Figure 10: Idealised Soil Profile----------------------------------------------------------------------92

vii
LIST OF TABLES PAGE
Table 1. Thermal properties of air and various surfaces ---------------------------------------- 4
Table 2: Theoretical Planetary Temperature at sea level --------------------------------------- 6
Table 3: Flohn Classification Scheme---------------------------------------------------------------25
Table 4: Budyko Climatic Classification -----------------------------------------------------------26
Table 5: Ecosystems and human induced pressures---------------------------------------------51
1
LESSON 1. CLIMATIC ELEMENTS AND THEIR GLOBAL
DISTRIBUTION
1.1. Introduction
In this lesson, the characteristics and global distribution of three fundamental climatic
elements, namely temperature, evaporation and precipitation will be discussed. In Physical
Geography II, climate was defined as the average conditions of the atmosphere near the
earth’s surface over a period of years. It was generally described in meteorological conditions
such as temperature, humidity, precipitation, wind, radiation, sunshine and cloudiness. The
climate of a region has profound influences its on soil, vegetation and landforms. It
determines the suitability of a region for agriculture and it influences the processes that shape
the landscape. Therefore, understanding the global distribution of the earth’s climatic regions
is the key to understanding many of the characteristics of those regions. Before understanding
the overall global distribution of climate it is important to understand the characteristics and
distribution of specific climatic elements.
1.2. Objectives
1.3. Temperature
Temperature provides a measure of the intensity or degree of hotness of a given object or
body. It is therefore the condition that determines the flow of heat energy from one substance
to another with the flow always being from high to low temperature. Thus by studying the
temperature characteristics of the earth- atmosphere system, one is in fact studying the heat
energy of the system and how it is distributed over the earth’s surface.
By the end of this lesson the learner should be able to:
1. Explain the importance of three main climatic elements, namely
temperature, evaporation and precipitation.
2. Explain the characteristics of the three main climatic elements of
temperature, evaporation and precipitation.
3. Describe the global distribution patterns of the three climatic elements and
explain the factors the cause these patterns.

2
1.3.1. Vertical distribution of temperature
In the troposphere, temperature decreases with increase in elevation, what is commonly
referred to as Environmental Lapse Rate (ELR). This has been calculated for many world
areas to average 6.50C/km. The vertical distribution of temperature is influenced by the nature
of the underlying surface. For example, temperature decreases most rapidly with altitude over
continental areas than water masses in summer.
Another effect of altitude on temperature is the difference it causes on diurnal range of
temperature, such that this range is greater at a higher elevation than at an equivalent climate
at sea level. The main difference occurs during the night when the escape of terrestrial energy
takes place readily because of the lower density of gases at higher elevation. The decrease of
pressure with altitude also modifies the meaning of given values on temperature scales. The
reduced pressure, for example, means that molecules of water vapour escape more easily from
a water surface. Thus at sea level, water boils at a temperature of 1000C, at an elevation of
about 3000m, water will boil at 900C, at 6000m water boils at about 70
0C.
The decrease of temperature with increasing elevation is periodically interrupted, and
temperature increase with altitude may occur. This is referred to as temperature inversion.
Inversion can occur at ground level when associated with radiation cooling or above the
ground level because of subsidence.
Altitude
Inversion
Temperature
Figure 1. Temperature inversion where warm air is above cooler air at the surface
1.3.2. Horizontal distribution of temperature
The horizontal distribution of global temperature is influenced by two main factors:

3
(a) Location factors
(b) Dynamic factors
1.3.2.1. Locational factors
These includes
(i) Latitude of a place
(ii) Surface properties
(iii) Aspect and topography
Latitude: This is of prime importance in determining solar energy receipt. The earth-sun
relationship show that both the angle of the sun in the sky and length of day determine solar
energy receipts. These two factors are determined by latitude. More insulation reaches the
earth’s surface when the angle of the sun’s rays is 900 than when it is less than 90
0. The sun’s
rays pass through a greater thickness of atmosphere to reach the higher latitudes than to reach
the lower latitudes.
The highest temperatures on earth are not found at the equator but near the tropic of cancer
and Capricorn. This occurrence is explained by the apparent migration of the sun between
23.50 N and S. In its passage, the sun seems to move relatively quickly over the equator, but
slows down as it progresses north and south. Thus between 60N, and 6
0S, the sun’s rays are
vertical for 30 days, during the time of the equinoxes. Between 17.50 and 23.5
0 and S, the
vertical rays occur for 86 days near the solstice. The longer period of the high sun and the
concurrent longer days allow time for surface heat accumulation and thus give rise to the zone
of maximum heating near the tropics. The heating is further enhanced by the clear skies near
the tropics compared to the very cloudy equatorial belt.
Temperature regimes, especially the seasonal cycles, are also related to earth’s sun motions.
The temperature regime at equatorial stations shows few variations, with two maximums at
the period of equinoxes. Stations further north show a distant summer-winter maximum and
minimum, with the range generally increasing with latitude.
1.3.2.2. Surface properties
The solar energy received on the earth surface depends on the type of surface the energy is
striking. Of particular note is the surface reflectivity or albedo. Surfaces with high albedo
absorb less incident radiation, with the result that the total energy available is diminished.

4
Thus the polar ice caps are maintained because as much as 80% of the solar radiation falling
on them is reflected.
As shown in Table 1, different surfaces have different specific heat capacity. Specific heat
capacity is defined as the amount of heat in calories required to raise the temperature of 1g of
a substance through 10C. For example the specific heat capacity of water is five times greater
than that of rock and the land surface in general. This means that the amount of heat required
to raise the temperature of water through 10C is five times greater than that required for the
same temperature increase on land. The same amount of energy applied to land surface would
result in the lands becoming much hotter than the water.
The difference is also heightened by the difference in heat conductivity of the two materials
(Table 1). Loose dry soil is a very poor conductor of heat and only a superficial layer will
experience a rise in temperature following energy input. Water has only affair conductivity
but its general mobility and transparency permit heat to circulate below surface layers. A
natural undisturbed soil with a vegetation cover may have daily temperature changes recorded
to 1 metre, while a quiet stand or pool of water has daily temperature variations that can be
measured to a depth of about 6 metres. When such differences are applied to the global scale
it is evident that land surfaces are rapidly and intensely heated by the sun’s rays whereas
water surfaces are only slowly and moderately heated. Again land surfaces cool off more
rapidly and reach much lower temperatures than water surfaces when solar radiation is cut off.
Table 1. Thermal properties of air and various surfaces
Substance Heat capacity
( )13 −−kJmPC
Thermal conductivity
( )11 −−kWmK
Ice 61089.1 x 2.272
Dry sand 61026.1 x 0.164
Wet soil 61068.1 x 1.681
Still water 6102.4 x 0.63
Stirred water 6102.4 x 4101.2 x
Still air 31026.1 x 210205 −x
Stirred air 31026.1 x 4103.1 x

5
Temperature contrasts are therefore greater over land areas, but only moderate over water
areas. It is further true that the larger the mass of land, the greater is the seasonal temperature
contrasts. Because the heating of ground and water surfaces controls heating of the
atmosphere above, the same observations apply to air temperature as to surface temperature.
1.3.2.3. Aspect and Topography
The combined influences of steepness and direction faced by a slope determine its aspect. The
importance of aspect is best seen in differences that occur on north-facing and south- facing
slopes in the northern hemisphere. A north-facing slope may still have snow lying on it while
a south-facing slope is quite clear. The north-facing slope gets less intense radiation and, as
the sun gets lower in the sky, it will be in shadow long before the south-facing slope. The
influence of aspect is seen in many ways; for example, the height of the level of permanent
snow and ice on mountains will vary from one slope to another, while vegetation levels (e.g.
the tree line) will also be affected. Similarly the depth of snow and frost are found to differ on
north-facing and south-facing slopes.
Topography also plays an important role in the nature of climates of neighbouring lowlands.
On a continental scale, mountain ranges that run north-south have a different effect from those
that run east- west. Thus the lack of any extensive east-west barrier in the United States
permits polar and tropical air to penetrate great distances into the continent. One result of this
unobstructed flow of air is the high incidences of tornadoes in the United States. The relief
alignment of continents also affects the flow of air masses into the interior.
1.3.3. Dynamic factors
The imbalance of energy between the tropics and poles means that an exchange of air must
occur through a dynamic process. The mechanisms for the exchange involve the transfers of
latent heat (LE), sensible heat (H), and the heat that is stored within the water of the ocean
(S).
Table 2 provides the theoretical planetary temperature for sea level, assuming the atmosphere
is at rest and the observed mean annual temperature for every 100 C of latitude. The greatest
differences are at the equator and for those latitudes above 600. Tropical latitudes are cooler
than the theoretical value, while high latitudes are warmer. The differences between the actual
and theoretical values result from the transport of energy over the globe by air masses and
ocean currents. Every storm system, circulation pattern and evaporation/precipitation event

6
contributes towards the redistribution of temperature regimes that prevail over the earth’s
surface.
Table 2: Theoretical Planetary Temperature at sea level
Temperature 00C 0° 010 020 030 040 050 060 070 080
Northern hemisphere
Planetary Temperatures 33 32 28 22 14 3 -11 -24 -32
Actual Temperatures 26 26 25 20 14 5 -1 -10 -18
Difference -7 -6 -3 -2 0 +2 10 +14 +14
Southern Hemisphere
Planetary Temperatures 33 32 28 22 14 3 -11 -24 -32
Actual Temperatures 26 25 22 17 11 5 -3 -13 -27
Difference -7 -7 -6 -5 -3 +2 +8 +11 +5
1.3.4. Global pattern of mean sea-land temperature
The global distribution of temperature near the earth’s surface shows that in the northern
hemisphere winter and southern hemisphere summer, the highest temperatures lie in a belt
close to the equator over the oceans and somewhat south of it over the land masses.
Maximum temperatures exceed 300C over portions of these land areas. Minimum
temperatures occur over Polar Regions, with the lowest values below –300C in north central
Asia. There are sharp temperature contrasts between land and sea, particularly on the western
sides of continents where at a given latitude the northern hemisphere land is colder and the
southern hemisphere land warmer than the adjacent ocean. A similar phenomenon, with the
hemispheres reversed occurs in the northern hemisphere summer and southern hemisphere
winter. In this season Antarctica is the coldest region and the warmest areas are those
continental areas just north of the equator. A close comparison of the conditions in the two
seasons clearly indicates that seasonal changes in ocean surface temperature are relatively
minor, but that mid- latitude continental interiors suffer a much greater range.
1.4. Evaporation
Water is brought into the air as vapour by evaporation. It is a physical process by which
vapour escapes from any free liquid water surface or wet surface at a temperature below the
boiling point of water. In addition to loss by evaporation from soil, water is also lost by

7
transpiration from vegetation covering the soil or water surface. This combined loss is known
as evapotranspiration.
Water vapour is the principle participant in the many energy exchanges taking place in the
atmosphere. The energy exchanges are responsible for the weather phenomena, which serve
as important links connecting the various phases of the hydrological cycle.
Measurement of evaporation and evapotranspiration is of importance in many scientific fields.
It is one of the main components of the water budget, knowledge of which is indispensable
for the solution of numerous water management problems. Reliable evaporation data are
required for planning, designing and operating reservoirs, ponds, shipping canals, irrigation
and drainage systems. Evaporation is especially important in arid zones where water must be
used in the most efficient way. Knowledge of the water requirement of crops depends partly
on the accurate determination of the loss of water by evapotranspiration from cultivated
fields.
Evaporation is measured using the following instruments:
(a) Atmometers such as Piche evaporimeter, Livingston atmometer, Bellani plate
atnometer, Diag’o type evaporimeter and Hirata type evaporimeter.
(b) Pan or Tank Evaporimeters such as class 4 pan, circular tank, Kenya evaporation pan,
rectangular tank and sunken tank.
(c) Lysimeters (soil filled tanks) have also been used to measure evapotranspiration. They
are operated under natural conditions and measure the actual evapotranspiration. If
they are supplied daily with water by sprinkling or sub-irrigation, they can provide
values for potential evapotranspiration
1.4.1. Global Distribution of evaporation
The relative sparseness of observations together with the difficulty of reconciling various
estimation methods makes it very difficult to present reliable global maps of evaporation.
Maximum rates of actual evaporation occur over subtropical oceans with a general decrease in
amount poleward. Land values are lower than oceanic ones, the isopleths making a sharp
break at the coasts. Generally on a global scale evapotranspiration from continents is about
470 mm per year, while from the ocean it is about 1300 mm per year. Average
evapotranspiration from the continents varies a great deal through time and space. The major

8
variables are the amounts of water and energy available. In tropical areas where there is ample
water and energy, evapotranspiration rates are very high. In the lower Amazon valley and the
central Congo River Basin the rates of 1200 mm per year, very nearly approach that of
evaporation over the open ocean. In parts of the Atlantic and Gulf Coastal plain of United
States, the amount is almost as high. Evapotranspiration is probably greatest in the Sudd and
in the Chad basin in Sub-Saharan Africa. Here the rate may reach 2400 mm per year far in
excess of local rainfall. These two extensive areas of swamp and shallow lakes are supplied
by rivers. The White Nile feeds the Sudd, and Lake Chad is fed by a series of rivers from the
south. Solar radiation is intense and the air dry, factors that enhance evapotranspiration. On
the other hand, where temperatures are lower such as in Northern Europe, evapotranspiration
rates drop to as little as 200 mm per year.
1.5. Precipitation
The type and size of precipitation leaving the cloud base depends on the conditions within the
cloud, but the precipitation that actually reaches the ground is modified by conditions in the
air layer between the cloud and the ground. In general, the temperature structure determines
whether the precipitation will arrive as frozen or as liquid water, while the humidity of the
layer determines the amount of evaporation that will occur and hence the ultimate size of the
precipitation particles. In both cases the fall velocity will dictate the time over which the
processes can act and hence how completely they will be.
The intensity and duration of precipitation is determined largely by the type of cloud system
involved. This in turn is intimately connected with the cloud formation processes considered
(i.e. Coalescence model and Bergeron-Findeisen model). In general cumulus vertical motions
give large drops and intense precipitation for a short period. Usually their influence is
restricted to a fairly small geographical area. Stratus and altostratus, in contrast involve more
persistent and less vigorous vertical motions over a much wider area. Hence prolonged,
steadier and usually less intense precipitation results. The difference in intensity decreases as
the duration increases. World rainfall statistics suggest that intensity is approximately
proportional to the inverse square root of the duration, but that there are many regional
variations. Types of precipitation include convectional, orographic and frontal already
discussed in prerequisite units of Physical Geography I and II.

9
1.5.1. Global precipitation distribution
We have noted that both the intensity and duration, and thus the amount of precipitation in an
individual event depend on the processes acting to create the precipitating clouds, and that the
real extent of precipitation depends on the same factors. Since particular processes tend to
dominate particular areas of the globe, we can make several pertinent generalisations about
the global precipitation on an annual basis.
The area of maximum annual precipitation over 2000mm per year extends in a band through
the equatorial regions. The subtropical deserts and the Polar Regions have values below
250mm. The mid-latitude regions have intermediate values, being in general about 1000mm
per year.
Mountain ranges play a significant role in the spatial distribution of precipitation. The
windward slopes of mountains receive the greatest amount of precipitation. In the leeward
side of the mountain ranges the precipitation decreases markedly to give rain shadow effects.
1.5.1.1. Tropical precipitation
Precipitation in much of the tropics is associated with convective activity. Strong vertical
motions occur in a fluctuating band near the equator. This release the abundant water vapour,
which creates a regime of intense, short-lived storms from cumulus clouds. Rainfall rates in
excess of 100 mm per hour are not uncommon. Although the location of the storms is partly
controlled by local topographic features, storms tend to recur sporadically, so that
precipitation does not occur at a particular place every day even though there may be a storm
in the area each day.
More widespread uplift is associated with monsoonal circulations. Such circulations are
particularly well developed over tropical Asia. Although this is a strongly seasonal
precipitation regime, the effects of convective uplift, dynamical uplift and topographic forcing
combine to produce high annual rainfall totals. Locally rainfall rates may be very high but
generally the monsoonal condition is characterised by longer lasting, less intense
precipitation.
1.5.1.2. Mid- latitude precipitation
In mid-latitude much of the precipitation production is associated with depressions and fronts.
The result is widespread uplift giving extended periods of gentle rain over a broad area.

10
Rainfall rates vary greatly, although 1-2 mm per hour, which is regarded as a typical value.
The intensity is partly controlled by the amount of water vapour available, which in turn
depends on the source of the air, which is being uplifted. Air derived directly from the
subtropical oceans, where evaporation rates are high is likely to lead to higher precipitation
rates. If the source is the tropical deserts, the air is likely to be much drier and it is not
uncommon in these conditions for dust and sand particles to form the condensation nuclei and
hence to be deposited in large quantities with the rain. Convective activity in the mid-
latitudes is primarily a summer phenomena. It can be intense, but is usually less regular, than
in the tropics.
1.5.1.3. Low precipitation areas
The regions of low precipitation in the sub-tropics result mainly from a lack of mechanisms
for creating uplift and bringing the air to saturation. Certainly over the oceans and to a large
extent over the land deserts as well, there is lack of moisture in the atmosphere in the
atmosphere. In contrast, over the Polar Regions the low precipitation totals are as much
associated with a lack of atmospheric uplift mechanisms.
1.5.2. Rain days
The spatial distribution of rainfall can also be viewed in terms of the number of rain days per
year. A rainy day is usually starting at 0900 GMT, during which 0.2 mm or more of
precipitation falls. The climatic average of rain days varies from over 180 per year in humid
coastal regions to less than one per annum in very arid regions. In general there is a close
relationship between the number of rain days and the total precipitation. However, seasonality
can influence the relationship between rainfall totals and rain day numbers. Places that
experience distinct wet and dry seasons may have high rainfall totals but few numbers of rain
days.
The relationship between rainfall totals and rain days therefore depends strongly on the
climatic regime and on the nature of the precipitation producing systems. For many purposes
the total rainfall in a given period is the most useful measure of precipitation, but in some
cases the number of rain days is more appropriate.
1.6. Summary
In this lesson we discussed the characteristics and global distribution of three key climatic
elements namely; temperature, evaporation and precipitation. It was noted that temperature

11
conditions vary both vertically and horizontally, and that the horizontal distribution of
temperature is affected by two broad factors, namely locational and dynamic factors. The
locational factors are influenced by latitude of a place, surface properties, aspect and
topography. The global atmospheric and oceanic circulation processes that transfer energy
from one place to another control the dynamic factors. The importance and measurement of
evaporation as a process and a climatic element was highlighted and it global distribution
discussed. The same applied to precipitation, apart from a discussion on the comparison
between tropical and mid-latitude precipitation characteristics. Finally the importance of rain
days as a measure of precipitation effectiveness was highlighted.
1.7. Definitions of Key Words
1. Aspect is the combined influences of steepness and direction faced by a slope
2. Evaporation is a physical process by which vapour escapes from any free liquid
water surface or wet surface at a temperature below the boiling point of water
3. Evapotranspiration is a combined loss of water from the soil (evaporation) and the
vegetation covering the soil (transpiration)
4. Precipitation is the liquid or solid water that falls from the atmosphere to the earth
surface. It can also be defined as an atmospheric process in which water droplets in
cloud grow into raindrops
5. Rain day refers to a day starting at 0900 GMT during which 0.2 mm or more of
precipitation falls
6. Surface Albedo or Reflectivity is the percentage of incident radiation reflected from
a surface
7. Specific Heat Capacity is amount of heat in calories required to raise the temperature
of one gram of a substance through one degree Celsius
8. Temperature Inversion refers to the unusual increase of temperature with altitude in
the troposphere caused by either radiational cooling at the ground surface or
subsidence of cool dense air on the surface.

12
1.8. Revision Questions
1. Draw the map of the distribution of global surface temperature in Oliver J. E. and
Hidore J. J. (Climatology) pages 61-63 or in Henderson-Sellers and Robinson P. J.
(Contemporary Climatology page 84)
2. Explain how temperature, evaporation and precipitation are measured in a standard
weather station.
3. How does temperature inversion relate to atmospheric stability?
4. Examine the factors that determine the global distribution of each of the following
elements; temperature, evaporation and precipitation
1.9. Further Reading
1. Barry, R.G. and Chorley, R. J. 1976. Atmosphere Weather and Climate. Methuen and
Co. Ltd.
2. Chritchfield, H.J. 1966. General Climatology, Prentice hall Inc.
3. Dann, W.L. 1975. Meteorology, McGraw-Hill Co. New Jersey.
4. Henderson-Sellers A. and Robinson P. J. Contemporary Climatology
5. Knapp, B.J. 1981. Practical Foundations of Physical Geography, George Allen and
Unwin, London
6. Lake, P. 1961. Physical Geography, Cambridge University Press
7. Mather, J.R. 1974. Climatology, Fundamentals and Applications, McGraw-Hill Co.
8. Muller; R.A. and Oberlander, T.M. 1984. Physical geography Today: A portrait of a
Planet.
9. Oliver, J.E. and Hidore, J.J. 1984. Climatology: An Introduction. Bell and Howell Co.
Toronto

13
LESSON 2. CLIMATIC CONTROLS AND FACTORS
2.1. Introduction
In this lesson, controls or factors that determine climatic conditions globally and regionally
and/or locally are discussed. They include energy and moisture fluxes (controls) and latitude,
altitude, land and sea and relief features (factors). The characteristics of air masses and how
they control climate, the convergence of air masses and fronts, frontal systems are described.
2.2. Objectives
2.3. Air Masses
An air mass is a large body of air of considerable depth that is relatively homogenous in terms
of temperature and moisture. The general circulation of the atmosphere produces in certain
places large masses of air with characteristic and well-defined physical conditions, especially
of temperature and humidity. The sources of air masses are the great permanent or semi-
permanent high-pressure zones of the earth’s circulation. Conversely, areas of low pressure
are regions of convergent air masses. Therefore the chief seats of major high-pressure cells
and therefore the main sources of uniform air masses are:
(a) The Polar Region
(b) The cold continental masses of Eurasia and N. America in winter.
(c) The ‘Horse’ latitude high-pressure cells especially over the oceans in summer, but to a
less extent over such large land masses as N. Africa and Australia in winter.
Air masses may therefore be described as:
By the end of this lesson the learner should be able to:
1. Explain how climatic controls and factors determine climatic conditions of a
given region.
2. Describe the characteristics of air masses and explain how they control climate.
3. Explain the effects of latitude, altitude, land and water masses, and relief features
in the control of climate of a given region or locality.

14
(a) ‘Polar’ or ‘Tropical’ which in general determines their temperature conditions and
through temperature, their capacity for moisture holding.
(b) ‘Continental’ or ‘Maritime’, which in general determines the extent to which their
moisture capacity is realised, i.e. their relative humidity.
The above categorisation identifies four individual kinds of air masses:
(a) Tropical Maritime (Tm)
(b) Polar Maritime (Pm)
(c) Tropical Continental (Tc)
(d) Polar continental (Pc)
Two additional categories are sometimes used in reference to the extremes of the continental
polar air masses and the maritime tropical air masses. Continental arctic (CA) indicates
exceptionally cold dry, air; equatorial (E) indicates very warm, moisture air.
2.3.1. Cold air masses
These air masses have their main sources in polar or arctic regions but owing to the extension
of the continental anticyclones (high-pressure cells) in winter they may spread far down the
interior plains of the U.S.A and as far south as the Himalayan mountain barrier in Asia. In
their place of origin they are characterised by:
(a) Low temperature due to loss of heat by radiation.
(b) Low specific humidity due to the low moisture capacity of air at low temperature.
(c) Stable stratification due to intense cooling of lower layers and a consequent small
lapse rate.
On leaving its place of origin, a cold air mass begins to be warmed in its lower layers by the
warmer sea or land; the results are:
(a) The lapse rate is steepened, sometimes to such an extent that instability results and
strong ascending current rise.
(b) The humidity increases especially over a warm ocean.
(c) The combination of the above two factors produces cumulo-nimbus clouds and
precipitation in the form of short, sharp showers with turbulence, gusts and squalls.
Bright intervals occur between showers.
(d) Visibility is good between showers because of the initial purity of the air and the
dilution of impurities by the strong turbulence

15
2.3.2. Tropical Maritime
The sources of this air mass are the sub-tropical anticyclones (high pressure cells), which
persist throughout the year over the oceans at about latitude 30°N and S. In its place of origin
the tropical maritime is characterised by:
(a) High temperatures derived from the warm sea over which they lie.
(c) High humidity in the lower layers since abundant moisture is available and the
capacity of the air for moisture is high at high temperatures.
(d) A fairly stable stratification.
On leaving its place of origin such tropical maritime air as it moves to higher latitudes usually
becomes cooled in its lower layers by contact with the relatively colder sea or land over which
it passes; the results are:
(a) The lapse rate is diminished and even inverted. Stability is thus greatly increased
convection is made impossible and turbulence is greatly reduced.
(b) The cooling of the lower layers with their high specific humidity results in a great
increase in relative humidity and dew point is soon reached.
(c) The combination of these two factors produces fog, or if turbulence is strong enough,
stratus clouds. Cloud cover is continuous and drizzle or steady rain is produced
especially if the air is lifted for example orographically.
(d) Visibility is low because of the high moisture content and because impurities are
retained in the lower layer due to the absence of convection.
If tropical maritime air invades a hot continent in summer, or moves towards yet warmer seas,
it becomes in effect, a cold air mass since it is travelling into regions hotter than its source. It
therefore shows in a marked degree, the instability characteristic of cold air masses and since
the moisture charge is high, the instability rain so produced is heavy. Most east coasts in mid-
latitudes derive summer maximum of rain from these sources.
2.3.3. Tropical continental
North Africa alone in the Northern Hemisphere produces a tropical continental air mass in
winter (the Harmattan), but in summer the arid western regions of the U.S.A also become a
source of tropical air. In the Southern Hemisphere Australia and, to a less extend South Africa
contribute air of this type. In the source region tropical continental air is dry and in the
summer very hot and unstable. The low humidity results in a high condensation level and no
precipitation, despite instability. In winter it is dry and warm, but stably stratified since it

16
occurs in anticyclonic regions of descending air. When it travels to cooler regions, it increases
its stability, but its temperature provides energy where it meets cold air masses as for
example, along the Mediterranean front.
2.4. Convergence of air masses and fronts
The migration of air masses from their source must result eventually in their meeting and
interference and this will occur in regions of low pressure, which by their very nature must be
regions of convergence. Experience shows that although there is inevitably some marginal
mixing and incorporation, the air masses tend to retain their individual characteristics fairly
clearly defined, especially in the upper air, which is less disturbed by the turbulence that
affects the lower strata in contact with the earth’s surface. The convergence results in the
displacement from the surface of the lighter and warmer air, by the denser and colder air and
this ascent produce condensation and precipitation. The severity of the disturbance that
accompanies this convergence is proportional to the contrast of temperature and humidity of
the air masses involved, for the temperature contrasts provide the main source of energy for
the generation of storms. Storminess is greatest where polar air meets tropical, as it does along
the polar fronts and much less where tropical meets tropical along the equatorial front.
2.5. Frontal systems
2.5.1. Definitions
Frontal systems occur all over the world and in all seasons. They are the chief cause of rapid
large-scale changes in weather conditions. When differing air masses meet a boundary line or
front forms, the process is known as frontogenesis. When the front breaks down, the air
mixes and the front disappear, the process is known as frontolysis
2.5.2. Types of fronts
(a) Warm Fronts
When a mass of warm (usually moist) air encounters a mass of cold air, we have a warm
front. The warm air, which is lighter and less dense, pushes up in a wedge like formation a top
the mass of cold air (figure 2). However the slope formed by the upward-moving mass of
warm air with the horizontal surface is on the order of about 1 to 300, i.e. the upward rise
would be about 1 km for every 300 km of horizontal surface.

17
Direction of movement
Warm direction
Cold air
Warm air
Earth surface
Figure 2. A warm front system
A warm front creates a wide band of weather because of the lifting of the warm air. There is
often considerable cloud cover and precipitation along the frontal surface. The air mass is
usually unstable and convection produces rapid uplift followed by precipitation.
(a) Cold Fronts
When winds from the north bring cold air toward a band of warm air, a cold front results. The
heavier, denser cold air pushes in under the warm air and rapidly forces it upward at a sharp
angle (figure 3). That is why a cold front forms a much steeper wedge than a warm front. In
cold fronts, the ratio between the ascent of air and the horizontal surface is on the order of
about 1 to 50 (i.e. 1 km vertical rise for every 50 km of horizontal surface).
Direction of movement
Cold front
Cold Air
Warm air
Earth’s surface
Figure 3. A cold front system

18
Cold fronts generally produce much narrower bands of weather than warm fronts, and exhibit
the results of convection processes more markedly. The frontal line of a cold front slopes
sharply backward, rather than in the same direction the front is moving. The warm air,
initially at the surface of the Earth is replaced by the oncoming cold air mass. In winter, cold
fronts generally approach more rapidly than they do in summer. The winds are stronger.
In a cold front system, the predominant type of cloud is the cumulus, and frequent
thunderstorms occur (which is not a typical occurrence in warm fronts). The weather patterns
occur in narrow bands. The degree of activity depends on whether the warm air is being
pushed up from the surface quickly or slowly. If the warm air rises slowly, the rate of cooling
is of course slower and the disturbance of the cold front is less violent.
(c) Stationary Fronts
When a frontal system stops moving forward, a stationary front occurs. Stationary fronts may
result from the stalling of either a cold or warm front, and may remain stationary for several
days. When a stationary front starts to move again, it may be either a warm front or a cold
one. The discontinuity of temperatures often weakens and the front simply dissipates. In a
stationary front the weather conditions are fair and stable.
(d) Occluded Fronts
When a cold frontal system overtakes a warm frontal system, the two fronts trap air between
them that is much warmer than the surrounding masses of air. Occluded fronts result.
Warm air Cumulonimbus
Altocumulus Cirrus
Altostratus
Cold currents
Warm front
Nimbostratus
Cold air cool air
Strocumulus Strotocumulus
Figure 4: Cold Front Type of Occlusion

19
Occlusion takes place when a mass of warm air is pushed upward and removed from the
ground by two dense masses of cold air. These air masses meet and push the warmer mass of
air off the ground surface between them. In a cold-front occlusion (figure 4) a warm front is
pushed off the ground by the advancing cold heavy air.
In a warm front occlusion (figure 5), a cold front is pushed off the ground because the air in
the dancing warm front is colder at the leading edge than the air in the cold front with which it
is colluding.
Cirrus
Cumulonimbus
Nimbostratus
cool air
Strocumulus Cold air
Strocumulus
Figure 5: Warm front type of occlusion
2.6. Latitude
Latitude influences the global radiation receipts on the earth surface. This affects the earth’s
temperature distribution. Latitude also influences the pressure pattern, which in turn
determines wind flow and precipitation distribution.
Within the equatorial zone i.e. 10o
N and S latitude, the sun throughout the year provides
intense insolation, while day and night are of roughly equal duration. Astride the tropics of
Cancer and Capricorn are the north tropical zone and south tropical zone respectively;
spanning the latitude belts 10° to 25° N and S. In this zone the sun is overhead at one solstice,
thus a marked seasonal cycle exists, but is combined with a potentially large annual
insolation.

20
Immediately pole ward of the tropical zones are transitional regions, which have become
known widely among geographers as the sub-tropical zones. For convenience, these zones are
here assigned the latitude belts 250 to 30
0 north and south, but it is understood that the
adjective “sub-tropical” as applied to environmental regions may extend a few degrees further
pole ward or equator ward of these parallels.
The middle latitude zones lying between 350 and 55
0 north and south latitude represent
regions in which the sun’s path shifts through a relatively large range of noon altitudes, so
that seasonal contrasts in incoming solar energy are strong. Seasonal differences in lengths of
day and night exist as compared with the tropical zones.
Bordering the middle latitude zones on the pole ward side are the sub arctic zones, 550 to 60
0
north and south latitudes, transitional between middle latitude and arctic zones.
Astride the Arctic and Antarctic circles, 66.5° north and south latitudes lie the arctic zones,
which may be further differentiated, if desired, into an arctic zone and an Antarctic zone. The
latitudinal extent of the arctic zones is here specified as 60° to 75° north and south but these
limits should be imposed severely. The arctic zones have an extremely large yearly variation
in lengths of day and night, yielding enormous contrasts in incoming solar energy from
solstice to solstice.
The polar zones, north and south are circular areas between 75° latitude and the poles. Here
the polar regime of six months day and six months might yields the ultimate in seasonal range
of incoming solar radiation.
2.7. Altitude
Apart from its effects on temperature i.e. decrease of temperature with altitude at an average
rate of 6.5°C/km, altitude also cause changes in pressure and rainfall. Pressure decreases with
altitude at the rate of 1mb/10m. This is up to a bout 1500 m above sea level, after which the
rate is reduced until at 4500 m above sea level, when the rate of decrease is only 1mb/20m.
Orographic rainfall is brought about as a result of rise of moist laden winds over a mountain
barrier.

21
2.8. Land and water masses
As stated earlier land surfaces are rapidly and intensely heated under the sun’s rays, whereas
water surfaces are only slowly and moderately heated. On the other hand, land surfaces cool
off more rapidly and reach much lower temperatures than water surfaces when solar radiation
is cut off. Temperature contrasts are therefore great over land areas, but only moderate over
water areas.
Distance from the coast or water mass can have a marked effect on temperatures and also on
rainfall. Where prevailing winds blow from a warm sea on to the land they will deposit
precipitation. The amount will steadily decrease moving inland. If there is a cold ocean
current offshore, it is possible that the reverse will occur. The cold current lowers the
temperature of onshore winds so that when they reach the coast they become colder and
therefore relative humidity falls and there is no precipitation. This is what occurs along the
coast of Namibia, creating the Namib Desert.
2.9. Relief features
In addition to the effects that mountains have their own climates, they also affect large areas
on the leeward side. The ocean basins have a lot of climatic influence on their coastal strips
than further inland. Not only is the rainfall reduced in the rain shadow areas inland, but also
temperatures are more extreme.
2.10. Summary
In this lesson, climatic controls and factors were defined as aspects of the global environment
that determine global or local climatic conditions. Detail discussion of air masses, which
control the global energy and moisture fluxes and therefore the global climate, was done. The
types, characteristics and weather systems associated with convergence zones and fronts were
highlighted. The influence of regional and local climatic control factors such as latitude,
altitude, land and water masses and relief features was discussed using specific examples.
2.11. Definition of Key Words
1. Air mass is a large body of air of considerable depth that is relatively homogenous in
terms of temperature and moisture

22
2. Atmospheric Stability is the atmosphere is considered stable or unstable depending
on what happens to a parcel of air in that atmosphere when it is given an initial “push”
vertically upwards or downwards. If the parcel of air continues to rise or fall then the
atmosphere is unstable. If it resists movement and returns to its original position then
the atmosphere is considered to be stable. The heating or cooling of the air parcel
normally causes the initial push
3. Front is a meeting line or boundary between two air masses of different temperature
and moisture characteristics
4. Lapse Rate is a change of temperature with either increase or decrease in altitude.
There are basically two types of lapse rates; Environmental Lapse Rate (ELR) and
Adiabatic Lapse Rate (ALR).
2.12. Revision Questions
1. Explain the importance of air masses as the major controls of global climates
2. Examine the differences in the weather patterns formed between a cold and warm
front
3. Using explain how latitude, altitude, relief features and water masses affect the climate
of East Africa.
2.13. Further Reading
1. Barry, R.G. and Chorley, R. J. 1976. Atmosphere Weather and Climate. Methuen
and Co. Ltd.
2. Chritchfield, H.J. 1966. General Climatology Prentice hall Inc.
3. Dann, W.L. 1975. Meteorology, McGraw-Hill Co. New Jersey.
4. Lake, P. 1961. Physical Geography, Cambridge University Press
5. Mather, J.R. 1974. Climatology, Fundamentals and Applications McGraw-Hill Co.
6. Neiwolt, S. 1977). Tropical Climatology, An Introduction to the climates of the Low
Latitudes, John Wiley and Sons Chichester
7. Oliver, J.E. and Hidore, J.J. 1984. Climatology: An Introduction. Bell and Howell
Co. Toronto
8. Strahler, A.N. 1975. Physical Geography John Wiley and Sons Inc.

23
LESSON 3. CLIMATIC CLASSIFICATION, MICRO AND MAN-MADE
CLIMATES
3.1. Introduction
In this lesson the purpose and problems of classifying climates are discussed. Two approaches
to climate classifications, i.e. genetic and generic are examined and types of climatic
classifications using each of these approaches together with their merits and demerits
identified. A discussion of the importance of micro and man-made climates is also made.
3.2. Objectives
3.3. Purpose and problems of climatic classification
The overriding purpose of any classification system is to obtain an efficient arrangement of
information in a simplified and generalised form. The purpose of climatic classification
therefore is to provide an efficient framework for organising climatic data and learning about
the complex variations in world climate. Through climatic classification the details and
complexities of monthly or seasonal climatic statistics are compressed into simpler forms,
which are more easily understood. In short, we classify to simplify and understand the world’s
complex climatic patterns.
Climatic classification though desirable is a difficult exercise. Certain problems faced in
climatic classification are common to all types of classification whether of soil or vegetation.
We have to acknowledge the fact that all classifications are artificial to the extent that we
By the end of this lesson the learner should be able to:
1. Explain the purpose and problems of classifying climates.
2. Compare and contrast genetic and generic climatic classification schemes
giving examples, merits and demerits of each.
3. Explain the importance and characteristics of microclimates and man-made
climates.

24
impose order or boundary on a complexity or continuum. Consequently, many classifications
are subjective. In fact classification is more a product of human ingenuity than a natural
phenomenon. In climatic classification we face other problems, which emanate from the
inadequacy of available climatic data both in terms of coverage of the earth and in terms of
duration and reliability. Climate is also dynamic, not static, so it fluctuates and varies over
time. This of course implies that our climatic boundaries will also fluctuate. Finally, climate is
a multivariate phenomenon consisting of various climatic elements. There is therefore the
problem of identifying the crucial climatic parameters that constitute distinctive climatic
types. The climatic elements most frequently used to characterise the climate over a given
area are temperature and rainfall. Often only the average values of these elements are
employed in the classification exercise. The need to consider other climatic elements cannot
be overemphasized. Also average values of climatic elements must be considered alongside
departures from such averages as extremes may be more significant limiting values. To
overcome the problems created by the multivariate nature of climate, some classification
schemes have taken the natural vegetation as an index of the climatic conditions prevailing
over an area. Several non-climatic factors, however, exert control over the character of the
vegetation in a given area. Such factors include topography, soil type and the effects of human
activities like farming and lumbering.
3.4. Approaches to climatic classification
There are two fundamental approaches to classifications of climates.
(a) The genetic approach.
(b) The generic or Empirical approach.
In genetic approach climatic classification is based on the climatic controls. These are the
factors that determine or cause the different climates. Examples include air circulation
patterns, net radiation and moisture fluxes. In the generic approach, the classification is based
on observed climatic elements themselves or their effects on other phenomena, usually
vegetation or man. Because the controls of climate are far more difficult to measure than the
climatic elements, there is lack of suitable data for most parts of the earth. Most climatic
classification schemes have therefore adopted the empirical approach for which data are more
available.

25
3.5. Genetic classification schemes
3.5.1. Flohn’s classification scheme
This classification recognises seven climatic types on the basis of global wind belts and
precipitation characteristics as shown in Table 3. Temperature does not appear explicitly
in the classification.
Table 3: Flohn Classification Scheme
Climatic type Precipitation characteristics
I Equatorial westerly zone Constantly wet
11 Tropical zone winter trades Summer rainfall
111 Subtropical dry zones
(Trades or subtropical high pressure)
Dry conditions prevail throughout the year
IV Subtropical winter rain zone
(Mediterranean type)
Winter rainfall
V Extra-tropical westerly zone Precipitation throughout the year
VI Sub-polar zone Limited precipitation throughout the year
VIa Boreal continental type Summer rainfall limited, winter snowfall
VII High polar zone Meagre precipitation summer rainfall,
early winter snow fall
3.5.2. Strahler’s classification
This classification divides world’s climates into three major divisions - the low latitude
climates, the middle latitude climates and the high latitude climates. These three divisions are
then subdivided into 14 climatic regions to which is added highland climates having altitude
as the dominant control. The criteria used in this classification scheme are the character of the
dominant air masses and the precipitation characteristics. The classification is as follows:
I Low latitude climates- controlled by equatorial and tropical air masses
(c) Wet equatorial
(d) Trade wind equatorial
(e) Tropical desert and steppe
(f) West coast desert
(g) Tropical wet –dry
II Middle latitude climates- controlled by tropical and polar air masses
(a) Humid subtropical
(b) Marine west coast
(c) Mediterranean

26
(d) Middle latitude desert and steppe
(e) Humid continental
III High latitude climates- controlled by polar and arctic air masses
(a) Continental sub artic
(b) Marine sub artic
(c) Tundra
(d) Ice cap
(e) Highland climates – are found in major highland areas of the world where altitude is
the dormant control of climates.
3.5.3. Budyko’s classification
This classification of climate is based on the energy balance. The classification is based on
values of the radiational index of dryness (Id) defined by the equation of the form:
Lr
RnId =
Where Rn is the amount of radiation available for evaporation from a wet surface assumed to
have an albedo of 0.18, L is the latent heat of evaporation and r is the mean annual
precipitation.
The value of the radiational Index of dryness (Id) is less than unity in humid areas and greater
than unity in dry areas. Using this index the following five major climatic types were
recognized by Budyko (1956) as shown in Table 4.
Table 4: Budyko Climatic Classification
Climatic Type Radiational Index of dryness (Id
I Desert >3.0
II Semi-desert 2.0-3.0
III Steppe 1.0-2.0
IV Forest 0.33-1.3
V Tundra <0.33
Budyko’s classification scheme only gives a generalised picture of the world climates owing
to the fact that very few stations in the world have reliable data on the net radiative flux.
27
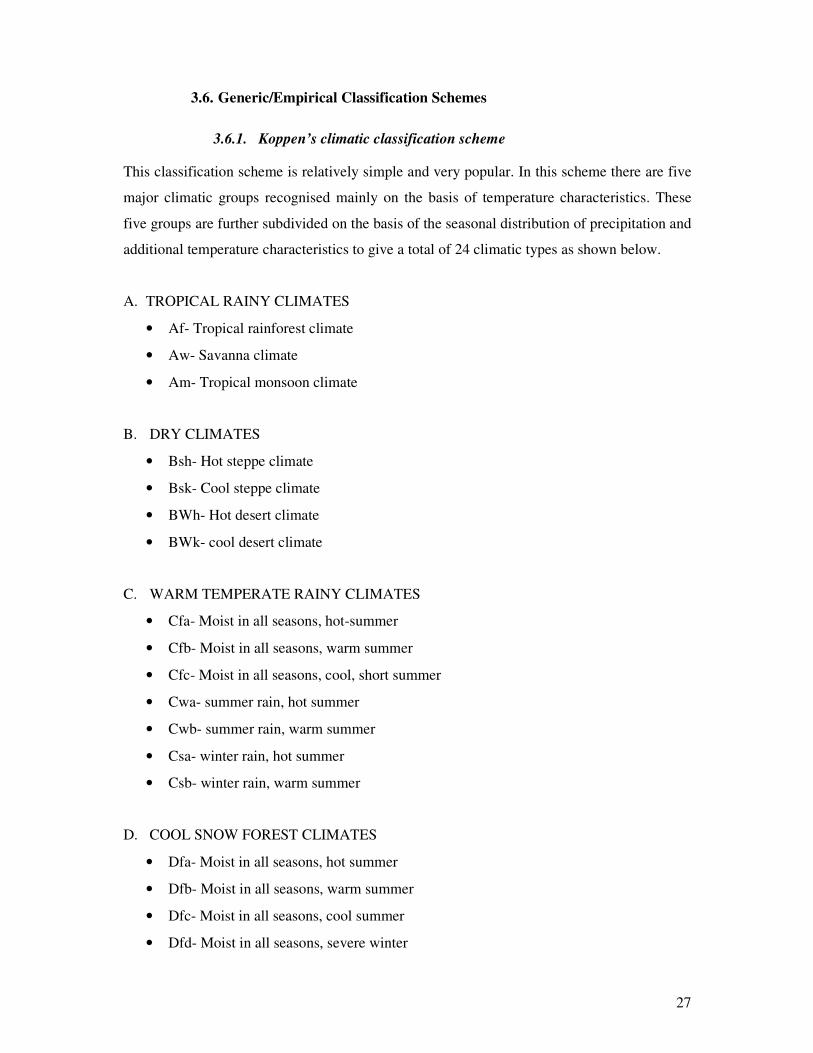
3.6. Generic/Empirical Classification Schemes
3.6.1. Koppen’s climatic classification scheme
This classification scheme is relatively simple and very popular. In this scheme there are five
major climatic groups recognised mainly on the basis of temperature characteristics. These
five groups are further subdivided on the basis of the seasonal distribution of precipitation and
additional temperature characteristics to give a total of 24 climatic types as shown below.
A. TROPICAL RAINY CLIMATES
• Af- Tropical rainforest climate
• Aw- Savanna climate
• Am- Tropical monsoon climate
B. DRY CLIMATES
• Bsh- Hot steppe climate
• Bsk- Cool steppe climate
• BWh- Hot desert climate
• BWk- cool desert climate
C. WARM TEMPERATE RAINY CLIMATES
• Cfa- Moist in all seasons, hot-summer
• Cfb- Moist in all seasons, warm summer
• Cfc- Moist in all seasons, cool, short summer
• Cwa- summer rain, hot summer
• Cwb- summer rain, warm summer
• Csa- winter rain, hot summer
• Csb- winter rain, warm summer
D. COOL SNOW FOREST CLIMATES
• Dfa- Moist in all seasons, hot summer
• Dfb- Moist in all seasons, warm summer
• Dfc- Moist in all seasons, cool summer
• Dfd- Moist in all seasons, severe winter

28
• Dwa- summer rain, hot summer
• Dwb- summer rain, warm summer
• Dwc- summer rain, cool summer
• Dwd- summer rain, severe winter
E. POLAR CLIMATES
• ET- Tundra
• EF- Perpetual snow and ice
In this classification, the major categories (A, B, C, D, and E) are based mainly on
temperature criteria. The subdivisions of each major category are made with reference to the
following:
• (f, m, w, s, W) refer to the seasonal distribution of precipitation.
• (a, b, c, d) refer to the additional temperature characteristics.
• (h, k) refer to the temperature distribution in the arid regions.
Despite its quantitative approach, objectivity, and invaluable merits as a teaching device
several criticisms have been made of the scheme. The scheme has been criticised for lacking a
sub-humid category; for being empirical rather than generic; for lack of justification for the
use of some of the numerical criteria and even for the use of rigid boundary criteria at all in
the light of lack of climatic observations over most parts of the world. Koppen’s climatic
classification has particularly been criticised by Thornthwaite who described it as
unsystematic, being based on a patchwork of unrelated rules and definitions. Koppen’s
climatic regions are in essence vegetation regions climatically defined.
3.6.2. Thornthwaite’s rational classification of climates.
This classification is based on two main climatic indices
a) The moisture index (Im)
b) The annual potential evapotranspiration (P.E)
Im is given as follows Im = 100s-100D
PE

29
Where s is the annual water surplus and D is the annual water deficit. Using this index
Thornthwite arrived at the following climatic types
Climatic Type Moisture Index (Im)
A Perhumid 100 and more
B4. Humid 80 – 100
B3. Humid 60 – 80
B2 Humid 40 – 60
B1. Humid 20 – 40
C2 Moist Sub-humid 0 – 20
C1. Dry Sub-humid -33.3 – 0.0
D. Semi-arid -66.7 - -33.3
E. Arid -100 – -66.7
Thornthwaites’s approach to climatic classification has been found useful in diverse fields
such as ecology, agriculture and water resource development. Thornthwaite’s classification
scheme has however not escaped criticism. Values of potential evapotranspiration on which
the moisture index is based are not readily available for many areas. Thornwaites’ empirical
formula for estimating values of P.E. has failed to produce satisfactory estimates over many
parts of the world particularly the arid and semiarid areas. The ratio of actual
evapotranspiration to potential evapotranspiration (AE/PE) has been shown to be a better
index of delimiting moisture regions than the moisture index.
3.7. Climatic regions of the world
The surface of the earth can be divided into a series of regions, which have similar climates.
The objective of such climatology is to understand climatic conditions likely to be
encountered at any point on earth, together with an explanation of their causes and indications
of their stability and variability with time. This serves two major purposes.
• The information is useful for anyone with more than a passing interest in a particular
place. It can provide information, for example, pertinent to the types of crops, which could
possibly be grown, or the heating or the cooling requirements of housing in the area. Thus
it provides an estimate of the climatic resources of an area.
• The identification of regions is also important for climatology itself. If patterns in the
spatial distribution of regions are found they may provide insight into the processes that

30
are acting to create those regions. Further more, examination of these processes can lead
to estimates of whether a particular region is likely to be modified over time as the result
of natural or anthropogenic changes to the atmosphere or surface.
Many climate regionalization schemes have been developed over the years, either
emphasising a particular set of climatic parameters perceived as important to a particular
activity, or specifying in more general terms the overall world regional climate. This is the
essence of the climatic classification discussed above.
3.8. Micro-Climates or Local Climates
The smallest scale of climate variations can conveniently be termed local climates or
microclimates. The spatial range of these varies from a few square centimetres, the conditions
around a growing plant to a few square kilometres, the climate of a city. It is the micro-
climate which we experience every day that dictates what crops we grow, that determines our
home heating and cooling requirements and influences our city drainage system design. It is
also on the micro-scale that human beings deliberately modify the climate to help meet our
needs for comfort and also the scale upon which the major inadvertent modifications have
already taken place.
The local climate/micro-climate depends for its general characteristics upon the regional
climate and ultimately upon the global climate system. It is therefore useful to keep in mind
constantly that the local climate of a particular place is a variation of the regional climate.
Indeed the mechanisms acting to create a local climate are essentially the same as those
creating the global climate. The major differences are those of emphasis. In particular, the
character of the surface and how it varies spatially and interacts with the overlying
atmosphere are the most vital considerations.
The character of the surface includes aspects such as; the type of surface, whether it be of
grass, forest, concrete, or water; the nature and size of upstanding objects such as fences, trees
or tall buildings; the general topography of the area and its overall altitude, all influence the
surface characteristics and their variations are the major determinant of local differences in
the energy balance. The main physical consequence is that there are spatial temperature
variations. These are likely to lead to air density and pressure differences, which can create
local winds when the regional atmospheric conditions are favourable. These regional

31
conditions are also greatly influenced by the surface characteristics to produce local cloud and
precipitation regimes. These not only influence the local water balance but also the local
energy balance thus bringing us full circle.
Therefore the factors creating local or microclimates can be summarized as follows.
• Energy balance and its implications.
• Surface boundary layer: - Near the surface the effects of friction on the air flow pattern are
marked. Adjacent to the surface is the laminar boundary layer, a layer where there is no
turbulent mixing and all heat transfer is by conduction. Above this is the turbulent
boundary layer; the air is mixed as a result of instability. The thickness of these layers
depends on the nature of the underlying surface. This layer extends up to the point where
the geostrophic approximations become valid.
• Wind profile in the boundary layer:- In order to consider further the fluxes in various
atmospheric and surface conditions in more detail, it is necessary first to consider the
variation of wind speed with height, the “wind profile”.
• Fluxes in the turbulent boundary layer:- The amount of turbulent mixing is largely
controlled by the wind speed and its rate of change with height (wind profile).
• Importance of surface physics: - The flow of heat into the underlying medium is the final
component of the energy balance. The contrast between land and water, which allows both
conduction and convection, is well known.
3.9. Man made climates
The scale of local climate/micro-climate is, by our definition, the scale at which mankind
operates. On a local scale humans can modify the climate deliberately or inadvertently, and
can take steps to utilise it as a resource or avoid its adverse impacts.
Inadvertent modification of climate involves any change in the surface characteristics by
human agency that leads to a climate change. Examples would include the creation of a city or
clearing of a forest for farming activity etc. These are essentially local scale phenomena and
indeed it is on this scale that the major modifications have taken place. However, consistent
local modifications that take place at a large number of sites could combine to produce
coherent regional or even global alternations in climatically important parameters as in global
warming.

32
Deliberate modifications of climate also take place on a local scale. Such intentional climate
modifications include;
• Crop protection climatology: - This aims at preventing the temperature of valuable crops
to fall below freezing e.g. by use of smoke generating heaters within the area to be
protected. The purpose is to warm the air directly and efficiently.
• Local scale climate engineering: - Frost is also of concern to the transportation industry.
Railroad switches (railway points) in areas prone to frost and icing are frequently
electrically heated, while some sensitive intensely used roadways have electrical heaters
built into their roadbed. This is most commonly found on bridges, which lack the thermal
inertia of the land based road and is thus more sensitive to temperature changes.
3.10. Cloud seeding
This is used for both precipitation augmentation and cloud dissipation. The basis for such
modifications is artificial stimulation of the Bergeron-Findeisen process. Cloud seeding can
only be undertaken when a cold cloud is already present and so serves as a means of
precipitation augmentation, not’ rainmaking’ in an area with no naturally occurring chance of
rain. Due to this restriction it is extremely difficult to demonstrate vigorously that a specific
cloud seeding project has led to increase in rainfall. Nevertheless, the balance of evidence
suggests that the technique is useful in areas where a small increase in precipitation can lead
to significant economic gain. Hence, for example, it is widely practised in the somewhat
marginal agricultural areas of the American Midwest and in South Africa. It is also used to
augment winter snowfall in the American Rockies, helping to enhance the amount of water in
that frozen reservoir, which will become available in subsequent growing season.
Attempts are being made to use cloud seeding techniques to modify the microstructure of
clouds as an aid to hail suppression. If a large number of small hailstones can be produced to
replace a small number of large ones, there is likely to be a decrease in the damage the hail
causes. This technique has been experimented in the tea growing areas of Kericho without
much success.
3.11. Summary
In the lesson we discussed the purpose of climatic classification, which is mainly to simplify
and understand the world’s complex climatic patterns. We identified the main problems
experienced in classifying climates and how they can be solved. A comparative discussion of

33
genetic and generic approaches used in climatic classification was done, using examples of
specific types of classification schemes. A discussion of the micro-climates and man-made
climates was done for the purpose of contrasting them with the regional climates derived from
climate classification.
3.12. Definitions of Key Words
1. Climate Classification is an efficient framework of organizing climatic data in order
to simplify and understand the complex variations in world climate
2. Cloud Seeding is a technique where certain condensation enhancing chemicals are
sprayed in the cloud for either precipitation augmentation or cloud dissipation
3. Generic Climate Classification is a classification based on observed climatic
elements themselves or their effects on other phenomena such as vegetation and
humans
4. Genetic Climate Classification is a classification based on climatic controls such as
air circulation patterns, net radiation and moisture fluxes.
5. Man-made Climate is the climate that is modified either deliberately or inadvertently
by human activity
6. Microclimate is the smallest scale of climate variation with a spatial range varying
from a few square centimetres (i.e. condition around a growing plant) to a few square
kilometres (i.e. climate of a city)
3.13. Revision Questions
1. Attempt a classification of the climate of East Africa using generic approach
2. Using examples of other classification schemes not discussed in this chapter, examine
the strengths and weaknesses of genetic and generic approaches of climate
classification.
3. Explain how human activities in your locality influence its microclimate.
3.14. Further Reading
1. Barry, R.G. and Chorley, R. J. 1976. Atmosphere Weather and Climate. Methuen and
Co. Ltd.
2. Chritchfield, H.J. 1966. General Climatology Prentice hall Inc.
3. Dann, W.L. 1975. Meteorology, McGraw-Hill Co. New Jersey.
4. Mather, J.R. 1974. Climatology, Fundamentals and Applications McGraw-Hill Co.

34
5. Neiwolt, S. 1977. Tropical Climatology, An Introduction to the climates of the Low
Latitudes, John Wiley and Sons Chichester
6. Oliver, J.E. and Hidore, J.J. 1984. Climatology: An Introduction. Bell and Howell Co.
Toronto

35
LESSON 4. CLIMATE CHANGE AND FLUCTUATIONS
4.1. Introduction
In this lesson causes of both natural and anthropogenic climate change are discussed. The
current debate on global warming and climate change is highlighted. Climate change takes
place when a shift in a type of climate prevailing over a given area takes place. Such a change
involves a shift in the general circulation of the atmosphere and the energy balance of the
atmosphere. There are two kinds of climate change. Natural climate change and climate
changes caused by human activities i.e. anthropogenic or man made climate change.
4.2. Objectives
4.3. Natural climate change
Natural climate changes are related to the flows of energy into and out of the earth-
atmosphere system and ways in which energy is budgeted within the earth-ocean atmosphere
system. Unfortunately, the explanation of the flows and interchanges is very complex and
requires an examination of all parts of the system. Because of this complexity, it is convenient
to divide theories of climate changes into a number of categories namely;
• Variations in Earth - Sun relationship.
• Variations in Energy output of the sun.
• Atmospheric variations modifying the flow of energy
• Changes in the position of continental land masses (continental drift).
• Variations in heat stored by the oceans.
4.3.1. Earth-Sun relationships
This leads to what is called astronomical causes of climate change. Such changes include:
By the end of this lesson the learner should be able to:
1. Define climate change and explain its causes and effects.
2. Explain the causes of anthropogenic climate change and its impacts.
3. Explain the concept of global warming, its causes and effects.

36
• Changes in the eccentricity of the earth’s orbit.
• Changes in the precession of the equinoxes
• Changes in the obliquity of the plane ecliptic.
4.3.1.1. Eccentricity of the Earth’s orbit
Fluctuations of the eccentricity of the earth’s orbit cause variations in the receipt of solar
energy by the earth. The smaller the eccentricity of the elliptical orbit the smaller will be the
differences in the length of the seasons and the greater the eccentricity the greater will be the
variations between seasons. At the perihelion when the earth is nearest the sun, solar energy
receipts is 6% more than at the aphelion when the earth is farthest away from the sun. The
eccentricity of the earth’s orbit fluctuates within a periodicity of about 92,000 years within
which seasons are supposed to change.
4.3.1.2. Precession of equinoxes
Precession of the equinoxes also varies within a periodicity of about 22,000 years. The term
refers to the regular change in the time the earth is at a given distance from the sun. At present
the equinoxes occur on 21st March and 23
rd September, while solstices occur on 21
st June
(summer solstice) and 21st December (winter solstice) for the Northern Hemisphere.
Fluctuations in the precession of the equinoxes will cause a shift in the seasons.
4.3.1.3. Obliquity of ecliptic
This term refers the angle of the axis in relation to the plane in which the earth revolves
around the sun. At present time the angle is 66.5°, which gives an obliquity angle of 23.5°.
This angle (23.5°) is not constant and on a cycle of a period of 41000 years the angle varies
from 21.50 to 24.5
0. The seasons result from the fact that the earth is inclined at this angle to
its orbit around the sun. Thus a decrease of the obliquity of the ecliptic would decrease
differences between seasons but increase the distinction of climatic zones. On the other hand
an increase in the angle would cause marked seasonal differences but geographical zones
would be less distinct or even disappear.
4.3.2. Changes in solar output
This refers to changes in the amount of solar radiation absorbed outside the earth’s
atmosphere. There are short term, medium term and long term cyclical fluctuation in the
amount of solar output with cycles of 11 years, 22 years, 44 years etc. this is due to changes in
the sunspots (these are dark, circular indentations that occur on the surface of the earth). The

37
visible portion of the sun is called the photosphere and is at about 60000k but the sunspots are
cool at a temperature of about 46000k.
4.3.3. Changes due to atmospheric variations
Another theory of natural climate change has been attributed to natural changes in the
atmospheric conditions. This concerns variations in the transmissivity and absorptivity of the
atmosphere. Natural factors such as volcanic activity (which injects large quantities of dust
and fine particles into the atmosphere) affects atmospheric transmissivity and absorptivity.
4.3.4. Movement of continents
The relative movement of continents and oceans has been linked with climatic changes. This
is because changes in the distribution of land and oceans would bring about a change in
energy distribution and hence general atmospheric circulation and climate because of the
well-known differences in the thermal characteristics of land and water surfaces.
4.3.5. Variations in heat stored by oceans
Natural variations in sea surface temperatures have been linked to changing circulation
patterns and weather anomalies e.g. El Nino Southern Oscillation ( ENSO) and Southern
Oscillation Index (SOI)
4.4. Man-made climatic change
Climatic changes are currently now being attributed more to effects of human activities than
to natural changes. Both inadvertent modification and deliberate modification of climate due
to human activities have resulted in climatic changes within the last four to five decades.
Inadvertent modification of climate through various activities such as urbanisation,
industrialisation, farming, lumbering, overgrazing, irrigation and drainage of swamps has
resulted in changes in global heat balance and therefore changes in climate.
It is now well established that as a result of urbanisation, the climate of urban regions differs
with those of their rural counter parts, and this is seen in the well-known effects of the ‘urban
heat Island’. Agricultural activities such as clearing of natural vegetation and exposing the
earth surfaces affect the reflectivity of the surface (surface albedo) and thus the heat balance.

38
Of the most serious human activities that have affected greatly climatic changes is
industrialisation. The emission of gases as carbon dioxide (C02), methane (CH4),
Chlofluorocarbons (CFC’S, i.e. CF2Cl2, CFCl3 and others), tropospheric Ozone (O3) and
nitrous Oxide (N2O) have an important effect of trapping energy originating from the sun, in
the form of heat near the earth’s surface, (the Green House Effect). It is generally agreed that
the increased concentrations of the above Green House Gases (GHG’s) has led to a warming
of the earth’s surface in the lower atmosphere and hence changes of climate. The effect of
aerosols released to the atmosphere due to human activities cannot be neglected since they
affect heat attenuation and therefore global energy balance.
4.5. Global warming and climate changes
In 1985 scientists attending a conference on climate change in Villach, Australia announced
that due the concentration of Green House Gases, it is now believed that in the first- half of
the this century, a rise in global mean temperature could occur which is greater than any in
man’s history. They predicted a rise in global temperatures of 1.5 - 4.5°C. Although there is
consensus that global climate change will occur, the nature of climate change at the regional
level is not yet well understood.
Recent analysis indicates that the earth as a whole has warmed by a bout 0.3-0.60C over the
past century. It is expected that this rate will increase significantly to 0.5 –1.00C per decade
through the next few decades, if human activities, which emit green house gases, continue
unabated. The warming will not be globally uniform but will differ significantly between
geographical regions. In addition, the warming may vary between seasons. As a result, the
altered temperature gradients will change the pattern of winds and precipitation distribution
regionally. The details of these localised changes are not clearly understood. It is expected,
however, that the interiors of continents will shift displacing current patterns of agricultural
production.
The observed global temperature records, including ocean and land readings, reveal a
warming trend during this century of a magnitude within the range predicted by models.
Furthermore, the latter half of last century registered the warmest temperatures on record.

39
4.6. Summary
In this lesson causes of both natural and anthropogenic climate change were discussed for the
purpose of understanding the climate change debate. The current debate on global warming
and climate change was briefly highlighted. The learner is expected to read more into the
climate change debate for more enlightenment.
4.7. Definitions of Key Words
1. Climate Change is a shift in a type of climate prevailing over a given area or region
usually caused by a shift in the general circulation and energy balance of the
atmosphere
2. Global Warming is a continuous rise in global mean temperature mainly caused by
the increasing concentration of green house gases (GHG’s) arising from human
activity
3. Man-made or Anthropogenic Climate Change refers to climate change which is
attributed to human activities both deliberate and inadvertent
4. Natural Climate Change refers to climate change which occurs on its own and is
related to the flows of energy into and out of the earth-atmosphere system and the
ways in which energy is budgeted within the earth-ocean-atmosphere system
4.8. Revision Questions
1. Examine climate change mitigation and adaptation strategies for Africa as proposed in
the Kyoto Protocol
2. What are the human activities in your home province that are likely to lead to climate
change and how can they be addressed?
3. What is global warming? Discuss the likely consequences of global warming.
4.9. Further Reading
1. Barry, R.G. and Chorley, R. J. 1976. Atmosphere Weather and Climate. Methuen and
Co. Ltd.
2. Chritchfield, H.J. 1966. General Climatology Prentice hall Inc.
3. Dann, W.L. 1975. Meteorology, McGraw-Hill Co. New Jersey.
4. Knapp, B.J. 1981. Practical Foundations of Physical Geography, George Allen and
Unwin, London
5. Lake, P. 1961. Physical Geography, Cambridge University Press

40
6. Mather, J.R. 1974. Climatology, Fundamentals and Applications McGraw-Hill Co.
7. Muller; R.A. and Oberlander, T.M. 1984. Physical Geography Today: A portrait of a
Planet.
8. Neiwolt, S. 1977. Tropical Climatology, An Introduction to the climates of the Low
Latitudes, John Wiley and Sons Chichester
9. Oliver, J.E. and Hidore, J.J. 1984. Climatology: An Introduction. Bell and Howell Co.
Toronto
10. Strahler, A.N. 1975. Physical Geography John Wiley and Sons Inc.
11. Strahler, A.N. and Oberlander, T.M 1992. Modern Physical Geography, John Wiley
and Sons Inc.
12. Strahler, A.H. and. Strahler, A.N. 1976. Elements of Physical Geography, John Wiley
and Sons Inc.
13. Trewartha, G. T. 1968. Fundamentals of Physical Geography, McGraw-Hill Co.
14. Wilcock, D. 1983. Physical Geography, Black

41
LESSON 5. SCIENCE OF BIOGEOGRAPHY
5.1. Introduction
This lesson introduces the learner to the definition and scope of Biogeography, and the
importance of the biosphere. Biogeography is a discipline in Geography which has been
described in many ways. However, descriptions tend to centre on the study of organic
resources, their distribution and the interaction between themselves and the environment.
Increasingly, the role of humankind in the biosphere is gaining importance and this is also
discussed.
5.2. The objectives
5.3. Definitions and concepts
5.3.1. Biogeography
Biogeography seeks to describe and analyse distributional patterns exhibited by organisms at
present and in the past. To enable it to comprehend the distributional patterns, biogeography
needs to study physical and organic factors as they are now and as they have been in former
time. To acquire this knowledge, it must use information drawn largely from the natural and
earth sciences. It is an interdisciplinary subject within these domains. Biogeographers are
concerned with species and their aggregates, which co-exist as communities. The detailed
investigation of a single species yields valuable information about its ecological and
evolutionary history and can identify variables that set limits to its present range.
The origin of Biogeography goes to the 18th
and 19th
centuries. Most of the early study was
the work of Swedish botanist Carl Von Linne who laid the foundation of modern biological
By the end of the lesson you should be able to:
1. Explain the scope of Biogeography.
2. Define the basic concepts in Biogeography.
3. Explain the role of humankind in the Biosphere.

42
taxonomy and its nomenclature. Others include the explorers and naturalists such as
Alexander von Humboldt, Louis Agassiz and Charles Darwin. The studies were triggered by
the growing curiosity about organisms and the complexity of natural phenomena.
Observations about these complexities led to data collection, followed by the writing of
manuscripts. In addition, the origin of biogeography is strongly tied to up with the age of
discovery and exploration. Early voyages drew attention to the extent of biological diversity.
Besides natural phenomena were observed, the association between them the establishment of
the organisms and their physical environment analysed and the natural selection of each
organism for each habitat carried out. From the search for the causes of variations in
distribution there emerged in time the concept of adaptation which later gave rise to the
Darwinian theory of evolution and the origin of species.
5.4. The scope and growth of Biogeography
Biogeography is a biological and geographical science which deals with the study of the
biosphere. In particular, it focuses on the causes and investigates the implications of the
distribution of living organisms. Its scope of study is wide because it overlaps the boundaries
of a multitude of disciplines such as geomorphology, climatology, geology, pedology,
anthropology, botany and zoology. Much about the discipline is covered in non geographical
an often biological sources. Unlike other branches of physical geography, biogeography is
little amenable to isolation and systematisation.
In its early stages of development, biogeography developed primarily on taxonomic lines later
supplemented with ecological and analytical lines. The taxonomic line of investigation was
based on identifying and classifying plants and animals. Phytogeography received greater
emphasis because of early explorations on floras from different parts of the world. In
analysing and explaining the geographical range of taxa, it became possible to deduce the
origin, evolution and dispersal of world flora. Factors that determine floristic distribution such
as time and place of origin of the taxa, present day kind of plate tectonics and environmental
changes were established.

43
5.5. The biosphere and role of humankind
The biosphere comprises that part of the earth where life is present. It is possible that about 13
million different kinds (species) of organisms currently inhabit this relatively shallow,
superficial and more or less continuous zone of land, water and air. However, a substantial
proportion of existing organisms are microscopic and of uncertain taxonomic status. This is
especially true of simpler types of lives such as bacteria and yeasts. If the more easily
recognized organisms are considered, some 300 000 species of green plants and fungi,
together with 1.3 million or so species of animals are known. The part of the Earth’s
environment in which living organisms are found, and with which they interact to produce a
steady-state system, effectively a whole planet ecosystem. Sometimes it is termed ecosphere
to emphasise the interconnection of the biotic and abiotic components. Biotic is applied to the
living components of the biosphere or of an ecosystem as distinct from the non living, abiotic,
physical and chemical components, while abiotic is non-living, devoid of life
The role of humankind in ecosystems causes growing concern to biogeographers. Human
transformation of the natural ecosystem by agriculture and industrialisation has led to changes
in the pattern of plant and animal distribution and to the simplification of organism-
environment relationships. As a result, there has been and continues to be an overall decrease
in diversity and stability of the biosphere.
Human populations can modify the environment, either in a planned or inadvertent manner.
Either way, this can have negative or positive results. Negative effects of human use of the
environment include contamination of fresh water resources; land degradation, toxic waste,
loss of biodiversity and air pollution. Since resources are limited, if we continue to destroy,
pollute or overexploit the physical environment, then we severely threaten our own existence
as a species. The emphasis of biogeography on the role of humans on the biosphere makes it a
study of increasing relevance for future well being of our population.
5.6. Summary
In this lesson we have defined the Biogeography as a discipline and have explained the scope.
The importance of the biosphere has been identified, and the role of humankind in the
biosphere has been mentioned as a growing concern to biogeographers.

44
5.7. Definition of key words
1. Biogeography is the study of distributional patterns exhibited by organisms at present
and in the past.
2. Biosphere refers to the part of the earth where life is present.
3. Biotic is applied to the living components of the biosphere.
4. Abiotic is applied to the non-living components of the biosphere.
5.8. Revision Questions
1. Describe the origin and scope of Biogeography as a discipline.
2. What are the effects of misuse/overuse of the environment resulting in pollution and
degradation of land?
3. State the forms of disturbance on the environment by both natural factors. Discuss the
consequences of continued disturbance on the human environment.
4. What is the role of biotechnology in increasing choices for humankind?
5.9. Further Reading
1. Cox C. and P. D. Moore 1986. Biogeography, An Ecological and Evolutionary Study,
Longman
2. Harper, J. L. and Townsend, C. R. 1986. Individuals, Population and Communities,
Blackwell Scientific Publication.
3. Jones, J.L. 1980. Biogeography, Hultan Educational Publishers
4. Strahler, A.N. and Oberlander, T.M 1992. Modern Physical Geography, John Wiley
and Sons Inc
5. Tivy, J. 1971. Biogeography, A study of plants in the Ecosphere, Oliver and Boyd

45
LESSON 6. ECOSYSTEM CONCEPT
6.1. Introduction
In this lesson, the ecosystem concept is explained, together with its function and structure.
The energy flow and nutrient cycling in the ecosystem are described as two fundamental
ideas, which underlie the ecosystem concept. Ecosystems and human activities are discussed
in the context of changing global diversity.
6.2. The objectives
6.3. The Ecosystem
Chorley and Kennedy (1971) define a system as “a structured set of objects and/or attributes.
These objects and attributes consist of components or variables that exhibit discernible
relationship with one another and operate together as a complex whole according to some
observed pattern.” The earth can be regarded as system also, with energy inputs in the form of
solar energy and a whole range of processes. The earth system is known as the ecosphere or
geosystem (Figure 6), and involves interaction between the living material (organisms, the
Figure 6: The geosystem
By the end of the topic, the learner should be able to:
1. Define the ecosystem concept.
2. Explain the ecosystem structure and function.
3. Describe the energy flow in the ecosystem.
4. Describe nutrient cycling in the ecosystem.
Biosphere
Atmosphere
Lithosphere
Hydrosphere

46
biotic component) and the non-living material (the physical environment, abiotic component).
An ecosystem is the totality of plants and animals in a given region, together with the physical
environment in which they live. The science devoted to the study of ecosystems is called
ecology. The term ecosystem or ecological system was first used by A.G. Tansely (1935) to
describe the interdependence of species in the living world (the biome or community) with
one another and with their non-living (abiotic) environment. Fundamental concepts include
the flow of energy via food chains and food webs, and the cycling of nutrient
biogeochemically. Ecosystem principles can be applied at all scales from an ephemeral pond,
equally to a lake, an ocean, or the whole plant.
6.4. Ecosystem structure and function
The ecosystem provides an appropriate framework for the investigation of the distributional
patterns of organisms because of its attributes. As the organic and inorganic components of an
ecosystem are integrated within it, they can be described and analysed at any scale desired, up
to that of the entire biosphere. Ecosystems are also structured and consist of a number of
levels of organisation associated with the feeding habits of their plant and animal members.
They function by means of a continuous exchange of energy and matter between all parts of
the system. Both energy and matter exchange may be identified and to some extent quantified.
As a type of general system, ecosystems are ‘open’ systems as opposed to ‘closed’ ones and
thus conform to the relevant laws of thermodynamics. Ecosystems posses the property of self-
regulation or feedback and the quality of dynamic equilibrium, that is, they tend towards a
steady state when inputs equal outputs. All parts of this natural system interact, and many of
the components may be said to be in a state of dynamic equilibrium. In natural ecosystem,
operating without human interference, there is a tendency towards self-regulation or
homeostasis. Entropy is a thermodynamic concept, which relates to disorder in systems.
Unstable ecosystems possess a high entropy level or high disorder, while more stable ones are
characterized by lower entropy.
Each species contains one or more groups of individuals that are called populations.
Communities’ make living organisms, together with non-living environment, makes up
ecosystems whose chief characteristic is interdependence. Every ecosystem has its own
composition, structure and function and possesses boundaries that are usually transitional

47
rather than sharp. Ecosystems are therefore identifiable within the biosphere where they
assume responsibility for the maintenance of life in both space and time.
Ecosystems do not undergo biological evolution as entities, but the process of natural
selection acts upon their organisms, either individually or in groups, so that those best fitted to
survive the prevailing circumstances are maintained. Changes in ecosystem over time are a
response to a combination of external principally abiotic and internal mainly biotic factors,
such as climatic modifications and competition for resources, respectively. There are two
fundamental ideas, which underlie the ecosystem concept; these are: energy flow and nutrient
cycling.
6.5. Energy flow in ecosystems
Energy, initially fixed from solar radiation into a chemical form by green plants, moves into
herbivores are a result of their feeding upon plants, and then moves on into carnivores as the
herbivores themselves are consumed. Scavengers, detritus feeders and decomposers exploit
the dead tissues and the leftovers of plant material and herbivores. Thus all organisms in any
community can be classified in term of their feeding behaviour. A series of complex food
webs are usually formed relating each species to many others. Solar energy forms main input
into the ecosystem. Variations in the distribution of solar radiation (energy moving at the or
near the speed of light) with latitude are an important factor in the location of major climatic
belts, which in turn impose broad geographical limits on the distribution of biota over the
biosphere. The efficiency of the photosynthesis process varies from species to species but is
generally quite low. Only about 10% of the solar energy is effectively converted, and because
of losses in maintenance and respiration, this efficiency usually falls to as low as 1% or 2%.
Of total energy arriving at a site, only about 40% is available to plants. The remainder cannot
be absorbed by chlorophyll because it is of the wrong wavelength.
The environment is characterised by interactions between physical, or abiotic components
such as (atmosphere, geology, and soil) and living, biotic components (the organisms). Within
the biotic part of the environment, a fundamental distinction is made between plants and
animals. Thus biologists distinguish between these organisms that make their own food from
simple inorganic material (autotrophic organisms) and those that require complex organic
molecules already constructed from them (heterotrophic organisms).

48
• Heterotrophs are unable to construct their own organic molecules from a solely inorganic
source an as such, must feed on autotrophs in order to survive.
• The autotrophs are also known as primary producers, while the heterotrophs are
consumers.
The distinction according to feeding habit is an important one in ecology, as it allows for a
structural classification of hierarchical structure within ecosystems. In this hierarchy, the key
role is played by those organisms, which contain chlorophyll (green plants) and are therefore
able to make organic compounds from simple inorganic molecules by utilising solar energy to
drive the reaction. This process is called photosynthesis or primary productivity. Green plants
with their ability to fix solar energy, form the basis of the ecosystem hierarchy, they are eaten
by other organisms that live above them in the classification, (consumers), these in turn eaten
yet by more organisms higher up in this hierarchical system. This type of hierarchy is known
as the food chain (Figure 7). The various components of the food chain (food web) are linked
together functionally to produce a dynamic and interacting system, the ecosystem, which is
the building block of the biosphere.
Figure 7: A simple food chain
The productivity of the ecosystem varies in space and time and is dependent upon the
following factors:
i) Incident solar energy (lower at the poles than at the equator).
ii) Environmental conditions (moisture and nutrient availability).
iii) Biomass or standing crop (varies with location).
iv) Chlorophyll biomass (only chlorophyll -containing plants conduct photosynthesis).
v) Leaf area index (proportion of leaf to ground area, varies with location).
vi) Genetic properties of species (some species are more efficient than others and can
photosynthesise at a higher rate under given conditions).
Grass Gazelle Lion

49
6.6. Nutrient cycling in the ecosystem
Apart from energy, life is sustained by a number of chemical elements that enter the
ecosystem via plants. While energy flows through the ecosystem between trophic levels, the
chemical elements, of which matter is composed, cycle within the system. Those elements,
which are necessary for the growth and maintenance of organisms, are known as the mineral
nutrients and these are obtained from the atmosphere, lithosphere or hydrosphere. The mineral
nutrients are dominated by four macronutrients: carbon, hydrogen, oxygen and nitrogen
(available from atmospheric source). A further 40 micronutrients are thought to be essential
to life on earth, the most important being potassium, calcium, magnesium, phosphorous,
sulphur, iron, copper, manganese, zinc, molybdenum, boron and chloride (primarily derived
from bedrock). Thus neither soil nor atmosphere alone can support life, and mineral nutrients
therefore circulate through a series of pathways incorporating organisms, atmosphere and
bedrock. The pathways are often cyclic and are termed biogeochemical pathways (see
simplified pathway in Figure 8). The three biogeochemical cycles which have been most
intensively studied are those involving carbon (complex gaseous cycle), nitrogen
(combination of the two types) and phosphorous (simple sediment-based cycle).
Figure 8: Simple Biogeochemical cycle
The nitrogen cycle is an example of the biogeochemical cycles. Nitrogen is a limiting factor
in agricultural productivity. 79% of earth’s atmosphere consists of gaseous nitrogen; it is in
limited supply in an available or fixed form. Atmospheric nitrogen is an inert gas and must be
made available in a combined nitrate form before plants can utilize it; this involves interaction
of nitrogen fixing bacteria. These microorganisms may operate by themselves in the soil or in
symbiotic relationship with plants, especially of the legume family. Leguminous plants play
Atmosphere
Organisms
Lithosphere

50
an important role in agriculture, forming a vital link in crop rotation. Denitrifying organisms
are also important as these ensure that the total amount of nitrogen in the ecosystem remains
in a dynamic equilibrium and that the reservoir pool is not reduced in size. Artificial addition
of nitrate (fertilizers) has increased adding to the problem of eutrophication (nutrient
enrichment) of natural waters, resulting in ecosystem disturbance and instability.
6.6.1. Ecosystems and human activities
Many kinds of biomes (types of ecosystems) have developed on earth from the great number
of possible combinations of climate, parent rock, and available biota. Some of these
ecosystems are aquatic and some are terrestrial. Each of these biomes is a rather broad
category with considerable variation from place to place around the earth. The terrestrial
ecosystems comprise of grasses and grassland ecosystems, trees and forest ecosystems and
biological deserts. The aquatic ecosystems comprise of marine and freshwater communities.
Table 5 provides a summary of ecosystems and human induced pressures. As indicated, the
global biodiversity is changing at an alarming rate due to this human induces pressures on the
ecosystems. Biodiversity refers to the variability among living organisms from all sources
including terrestrial, marine and other aquatic ecosystems, and the ecological complexes of
which they are part. This includes; diversity within species (genetic diversity), between
species and of ecosystems.

51
Table 5: Ecosystems and human induced pressures
Ecosystem
Pressures Causes
Agroecosystems
• Conversion of farmland to urban and
industrial uses
• Water pollution from nutrient runoff
and siltation
• Water scarcity from irrigation
• Degradation of soil from erosion,
shifting cultivation, or nutrient
depletion
• Changing weather patterns
• Population growth
• Increasing demand for food and industrial
goods
• Urbanization
• Government policies subsidizing agricultural
inputs (water, research, transport) and
irrigation
• Poverty and insecure tenure
• Climate change
Coastal
Ecosystems
• Overexploitation of fisheries
• Conversion of wetlands and coastal
habitats
• Water pollution from agricultural and
industrial sources
• Fragmentation or destruction of
natural tidal barriers and reefs
• Invasion of non-native species
• Potential sea level rise
• Population growth
• Increasing demand for food and coastal
tourism
• Urbanization and recreational development,
which is highest in coastal areas
• Government fishing subsidies
• Inadequate information about ecosystem
conditions, especially for fisheries
• Poverty and insecure tenure
• Uncoordinated coastal and land use policies
• Climate change
Forest
Ecosystems
• Conversion or fragmentation resulting
from agricultural or urban uses
• Deforestation resulting in loss of
biodiversity, release of stored carbon,
air and water pollution
• Acid rain from industrial pollution
• Invasion of non-native species
• Over extraction of water for
agricultural, urban and industrial uses
• Population growth
• Increasing demand for timber, pulp, and
other fibre
• Government subsidies for timber extraction
and logging roads
• Inadequate valuation of costs of industrial air
pollution
• Poverty and insecure tenure
Freshwater
Ecosystems
• Over-extraction of water for
agricultural, urban, and industrial uses
• Over-exploitation of inland fisheries
• Building dams for irrigation,
hydropower, and flood control
• Water pollution for agricultural, urban,
and industrial uses
• Invasion of non-native species
• Population growth
• Widespread water scarcity and naturally
uneven distribution of water resources
• Government subsidies of water use
• Inadequate valuation of costs of water
pollution
• Poverty and insecure tenure
• Growing demand for hydropower
Grassland
Ecosystems
• Conversion or fragmentation owing to
agricultural or urban uses
• Induced grassland fires resulting in
loss of biodiversity, release of stored
carbon and air pollution
• Soil degradation and water pollution
from livestock herds
• Over-exploitation of game animals
• Population growth
• Increasing demand for agricultural products,
especially meat
• Inadequate information about ecosystems
condition
• Poverty and insecure tenure
• Accessibility and ease of conversion of
grasslands
Source: World Resources Institute (2000)

52
6.7. Summary
In this lesson the ecosystem concept has been introduced as an important framework for the
investigation of the distributional patterns of organisms. The ecosystem structure and function
has been explained. The two fundamental ideas, which underlie the ecosystem concept,
namely energy flow and nutrient cycling have been discussed. The biodiversity of ecosystems
is changing at an alarming rate and this is discussed in terms of the human induced pressures
on various ecosystems.
6.8. Definition of key words
1. Ecosystem is the totality of plants and animals in a given region, together with the
physical environment in which they live. The science devoted to the study of
ecosystems in known as ecology.
2. Geosystem refers to the earth as system with energy inputs in the form or solar
energy, together with the interaction between the abiotic and biotic. It is also known as
the ecosphere.
3. Biomes
4. Biodiversity refers to the variability among living organisms from all sources
including terrestrial, marine and other aquatic ecosystems.
5. Autotrophs are organisms that can manufacture their own food from simple inorganic
material. They are also known as primary producers.
6. Heterotrophs are those organisms that require complex organic molecules already
constructed for them, they are also known as consumers.
7. Food Chain is a type of hierarchy showing linkages between various trophic levels,
according to the feeding behaviour and interacting from the green plants or primary
producers to the consumers. A series of complex food webs are usually formed
relating each species to many others.
8. Biogeochemical cycle refers to the circulation of nutrients through a series of
pathways incorporating organisms, atmosphere and bedrock.
6.9. Revision Questions
1. Explain the concept Ecosystem. Discuss the effect of human induced pressures on
forest ecosystems in Kenya.
2. What is biodiversity? Explain the factors that have lead to the changing global
biodiversity

53
3. State the different types of ecosystems. Discuss the effects of human activities on the
biodiversity of the ecosystem in your environment.
4. Construct a food chain for any one terrestrial ecosystem and for an aquatic ecosystem.
6.10. Further Reading
1. Brown, J.H. and Lomolino, M.V. 1998. Biogeography Sinauer Associates, Inc.
Publishers
2. Groombridge, B. 1992. Global Biodiversity: Status of Earth’s Living Resources,
World Conservation Monitoring Centre
3. Heywood V.H. and Watson, R.T. 1995. UNEP Global Biodiversity Assessment,
Cambridge University Press
4. Jones, J.L. 1980. Biogeography, Hultan Educational Publishers
5. Tivy, J. 1971. Biogeography, A study of plants in the Ecosphere, Oliver and Boyd
6. World Resources Institute 2000. World Resources 2000-2001: People and
Ecosystems: The Fraying Web of Life, with United Nations Development Programme,
the United Nations Environment Programme, the World Bank
7. Dobson, A.P. 1996. Conservation and Biodiversity, Scientific American Library
8. Groombridge, B. 1992. Global Biodiversity: Status of Earth’s Living Resources,
World Conservation Monitoring Centre

54
LESSON 7. PATTERNS AND TYPES OF DISTRIBUTION OF LIVING
ORGANISMS
7.1. Introduction
This topic introduces the patterns and types of distribution of living organisms. The biotic and
abiotic facts that influence the patterns and types of distribution are described. The abiotic
factors include climate, soil and relief. The biotic interactions include competition, predation
and symbiosis. These interactions are discussed and their effects on the living organisms
considered.
7.2. The objectives
7.3. Patterns and Distribution of Living Organisms
The distribution of living organisms by spatial patterns and temporal variations is determined
by many factors such as historical changes. What is most puzzling is how these organisms
have got where they are and how they maintain themselves in the face of perturbations that
are part of nature. There are a number of biotic and abiotic factors that are used to explain the
past and present patterns of distribution. These are generally biological factors such as
adaptation, predation and competition on the one hand and physical factors such as climate,
soil and light on the other.
Past sets of controls of distribution range from evolutionary processes to climatic and
geological processes. The Pleistocene ice age is the most recent climatic event that has been
associated with the expansion and contraction of certain biomes. They have also been
By the end of the topic, the learner should be able to:
1. Describe the spatial and temporal variations of biotic factors.
2. Explain how abiotic and biotic factors influence the patterns and distribution of
living organisms
3. Comment on the effects of historical factors on the distribution of plants in East
Africa.
4. Explain the factors that determine the distribution of living organisms.

55
associated with the extinction of the less adapted species. Plate tectonics and continental drift
are identified as being responsible for the splitting asunder of a once continuous distribution
or as welding it in new patterns. The different patterns of distribution that one can observe on
the earth’s surface are partly due to a combination of physical factors, which provide an
envelope within which the life processes function.
7.4. Spatial and temporal patterns
The distribution of organisms in the biosphere is characterized by lack of uniformity;
however, there is no organism that is distributed haphazardly on the earth’s surface. A close
examination shows that the patterns of distribution are never even. Indeed each species
exhibits variations in distribution, both in time and space. Spatial variation in abundance
reflects the extent to which the local environment meets the niche requirements of a species.
Each species tends to be most abundant where all niche parameters are in favourable range
and to be rare or absent where one or more environmental factors are strongly limiting. Living
organisms are not haphazardly distributed on the face of the earth; we can therefore identify
different patterns of distribution. Generally, at any one place there exist patterns of
distribution, which vary in space, called spatial patterns, and those which vary with time
called temporal patterns. The spatial patterns, which occur in different aspects of
measurements and identification, are a function of species richness or diversity, and
continuity or discontinuity. The spatial patterns also are a function of species occurrence.
Spatially, for instance, vegetation is gregarious, i.e. it grows together in groups of various
sizes and shapes. This is because plants are immobile and tend to cluster where growth
conditions are favourable. Clumpness in vegetation is of ecological importance because it
supports the theory of plant associations, what is commonly called plant co-existence.
Clumpness is an adaptation mechanism, which plants use to counteract any environmental
imbalances. This they achieve by means of morphological, behavioural and physiological
properties. By modifying micro climatic conditions, for instance, plants create conditions that
are favourable for the invasion of others, which on their own would not be able to succeed.
These requirements are not important to faunal population, which can avoid harsh
environmental conditions by migration. On the other hand, temporal patterns of distributions
are those studied from the point of view of time. In the long term or short term, basic
distributions can be seen as periodic or non-periodic and continuous or discontinuous. A good
example of this is the occurrence of ephemerals with the onset of rains.

56
The present trend and the evolutionary history have interacted to produce uneven patterns of
distribution. Even in worldwide distribution cosmopolitan organisms do display unevenness.
It may be said that unevenness of spatial and temporal distribution is a natural phenomenon.
Further, it is a basic characteristic of natural distributions and reflects differences, which exist
in the life envelope. Thus, the population factors are far from being evenly distributed.
Therefore, unevenness tends to suggest that there are discontinuities in the envelope and that
the success of the individual species in occupying a portion in the envelope depends upon its
biological adaptation. But the invasion of the open mix by a particular species is equally
crucial.
Clearly, variations in the distribution of organisms are a response to variations in physical and
biological parameters. Each species, therefore, occupies a limited area, which it is best
specialized to exploit. Within a habitat the distribution of a species tends to be characterized
by a gradient. If a cross-section is taken, the number of the species in a population decreases,
then increases then decreases and eventually disappears along a gradient of population factors.
At the margins of this factor, the species population disappears because the individuals cannot
be maintained.
Survival in adjacent habitat eventually becomes unbearable because the species is not adapted
to the conditions therein. Surrounding habitats act as geographical barriers. The latter have to
be crossed for further distribution of the species to occur. Examples of these barriers are
terrains, climate, water bodies and landmasses. Barriers have certain interesting
characteristics. They may be selective, temporary or permanent in their effects. Mountain
barriers, for instance, are not obstacles to flying birds while water bodies are not obstacles to
aquatic life.
Mountains provide obstacles to the spreading of plant species in the form of extreme
temperatures and long distances to flightless organisms; they provide unfavourable substrate
consisting of rocky and shallow soils which cannot support the existence and hence the
expansion of certain organisms. Cold and hot climates are barriers to the distribution of warm
and cold-blooded organisms, respectively.

57
Some of the present pattern of distributions cannot easily be explained and are therefore said
to be responses to catastrophic or gradual change. These include tectonic processes and
climatic changes. They have profound effect, for instance, on the present distribution the
world over. Some patterns of plant distribution are at best accidents of history. Some of these
accidents led to the wiping out of the less resistant species while others have restricted the
distribution of once continuous species to a limited portion. In various places in the world,
living organisms have experienced different developmental changes through their
evolutionary ways.
Therefore a species flourishes best without any external assistance only within a range of
tolerance. The latter is the limit within which a species successfully completes its life cycle
freely. This consideration is very important in determining species density and abundance.
Within the range, maximum population occurs in the ecological optimum or the optimum
range, a zone where survival is most favoured. Organisms occur in great concentrations and
perform extremes of the population factor where conditions for survival become unsuitable
and finally intolerable. Domestication by man, has to certain extent, modified the concept of
range of tolerance. Once he interferes with the dependence of organism on their environment
man, through inputs of energy and matter has enabled the existence of cultigens in areas
where they could never occupy.
Each species is distributed over a particular area of the biosphere, which is termed its range.
Not all ranges are of the same dimensions and their boundaries are determined by a
combination of factors.
• A species range represents a response to the physical environment in which all
organisms live. The physical environment consists of non-living (abiotic) components
such as rock, air and water, which are products of the lithosphere (rock strata),
atmosphere (air masses) and hydrosphere (water bodies) of the earth. The lithosphere,
atmosphere, and hydrosphere thus impinge upon and contribute significantly to the
composition of the biosphere, together with this, they make up the interacting geo
system.
• A species range results from competition with other species for essential resources
such as food and living space. Each species does not possess a unique range. There is
a certain amount of overlap between ranges because each species does not have
exclusive use of a particular resource.

58
• A species range is not only a result of the adaptation of species to its existing
environment (animate and inanimate) but also of its evolutionary history. This history
usually spans thousands or millions of years and has proceeded against a background
of continuous environmental change.
7.4.1. Disjoint Distributions
Continuous distributions of living organisms are anomalous in nature because even the
environmental variables that determine them are highly variable. What is discussed as once
continuous distribution of certain, organisms that was split by continental drifts and plate
tectonics, is therefore questionable. Fossil records on the flora of Africa suggest that
neighbouring populations converge during favourable periods but separated at wide intervals
when conditions were harsh. The degree of convergence is still questionable. For instance, it
may occur in the form of a small strip. However on the local scale, one can talk about the
distribution of a species population being continuous.
Naturally, distributions are disjoint. Thus, a species may occur in areas, which are
geographically far apart. Unravelling the causes of disjoint distribution is one of the
biogeographical problems. Evolutionary disjoints are said to be species which were once
widely distributed but were split or made to contract into isolated patches because of climatic
changes. The survivors of these species today occur in limited numbers in different continents
or on one continent. A good example is the distribution of the African Gorilla.
7.4.2. Endemic Distributions
These are distributions, which are confined to areas of origin or to refugia. Tectonic processes
and past climatic changes have been predicated as being responsible for wiping out world
vegetation and fauna population. If changes are gradual, some organisms will avoid death and
take refuge in suitable habitats. If they are erratic, the organisms will become extinct. The
Pleistocene ice age has similar effects in USA and Europe. They wiped out populations of
vulnerable species while in southern warmer areas and on mountains on which ice formation
was limited some organisms migrated behind retracted ice; others remained confined to
refugia probably due to their inability to overcome barriers. Most flora on sea islands or
mountain tops have high levels of endemism. On the East African mountains, for instance, the
lobelia species on Mt Kenya is endemic. Alternatively, endemism is associated with
organisms that have recently evolved and have therefore not had enough time to spread.

59
Lastly, some endemic species could be on their way to extinction as changes in their habitats
have reached such an intolerable state that they cannot compete successfully for soil and
space.
7.5. Abiotic Factors and Distribution of Living Organisms
Abundance and distribution are influenced by multiple and interacting environmental
variables. The distribution of certain organisms can be explained partly on the basis of the
physical environment. These include a number of factors such as climate, soil/edaphic and
topography that affect the distribution of living organisms directly or indirectly. The direct
effects of these factors are difficult to evaluate but they can be inferred from the response of
organisms such as their birth rate, growth rate and reproduction. These physical factors, also
known as abiotic factors, are commonly described as the life envelope. They are non selective
to the extent that they provide an environment which has to be complete for living organisms.
On the other hand, these factors may be seen as selective to the extent that their unevenness in
distribution tends to put a threshold to certain organisms. Consequently certain physical
factors have limiting effects on the spread of organisms.
7.5.1. Climatic factors
Climate is the single most important factor that plays an overriding role in the distribution of
organisms. The climatic factors can further be grouped into: light, temperature, moisture
wind/atmospheric conditions and humidity. Solar energy is the driving force behind
photosynthesis. Climate leads to temporal variations through its seasonality. Temperature and
moisture are the two main limiting factors of life on earth. Potential evapotranspiration, water
surplus and deficit delimit the distribution patterns of vegetation types. The latter, for instance
determines the abundance and distribution of ephemeral plants in Kenya’s semi-arid
environment. During the wet season, the fields bloom with abundant life, which declines with
the arrival of drought. The long-term effect of change on life processes is best demonstrated
by Pleistocene Ice age episodes. During alternating favourable and unfavourable periods,
different parts of the world experienced fairly high species enrichment and species enrichment
and species improvement respectively. This was due to migration, evolution, reproduction,
and extinction processes. The southward and northward movement of vegetation in North
America following glacial and interglacial conditions is such an example. Analogic to this
pattern is the upward and downward migration of vegetation on the mountains of East Africa.
60
7.5.1.1. Temperature
There are large differences in temperature across earth’s surface due to variation in the
quantity of incoming radiation. The unequal distribution of land and sea since the land is
subject to a greater temperature range than the ocean. There is seasonal variability in light and
temperature conditions due to aspect and topography (altitude). Temperature provides the
medium in which chemical reactions and metabolic activities are enacted. Most chemical
reactions increase in speed with temperature; thus in areas with extreme temperature
conditions, such as very high and very low temperatures, the species decrease in number and
variability. For instance as temperature decreases with increasing latitude, the species
decrease. In plants, temperature affects the chemical breakdown. For each plant species, there
is a minimum and a maximum temperature below and above which chemical reactions cannot
take place. There is an optimum temperature (ideal) within which the species have the highest
species. Variations in absolute temperature, which influence the physiological functions of
plants and animals, are in most cases a result of latitude, altitude and distance from sea. In the
tropics, the effect of temperature is of little significance in the distribution of organisms. Most
places have high enough temperature. The effect of temperature is best demonstrated in
vegetation zonation on mountain areas.
Temperature may influence in life through water availability. High temperature, characteristic
of dry regions amounts to increase of water stress. Only organisms that are adapted to such
conditions can survive in such environment. Extremely low temperatures are an environment
hazard especially in the tropics because it leads to frost formation. Tropical plants have no
bracts and stipulates to protect them against frost. Otherwise, the effect of temperature is best
demonstrated by high latitude plants, which become dormant during the low temperatures of
winter and active during high temperatures of summer. On the average, life processes are best
in the temperature range of 4 0C to 40
0C a few organisms however, in India, can survive in
temperatures below 0 0C. The effects of temperature are also tied up with those of light.
Physiological processes depend upon intensity of light and temperature conditions. Plants for
example, have their own optimum in high temperature conditions where they function freely.
Processes like photosynthesis depend upon light intensity. The latter is a function of
characteristic insulation. In high latitudes, these components affect life processes such as plant
growth and flowering.

61
Correlations may provide only circumstantial evidence and do not necessarily indicate direct
causal relationships. The species may be limited not by their inability to tolerate low
temperatures, but by competition from other species that are superior competitors in cold
climates.
7.5.1.2. Moisture
Moisture is vital in the maintenance of many physiological and chemical processes within
plants and animals. There is a zone of high precipitation at equator. Ocean land configuration
affects precipitation values: areas far from oceanic moisture are more drier than those, which
are Maritime. Biogeographically, what is important is not so much the absolute amount of
water, but rather the relationship between the two variables, precipitation and evaporation. It
is possible to classify ecosystems according to their moisture relations. Hydrophytes: are
plants, which require permanently moist, water logged or even aquatic conditions. Xerophytes
are plants adapted to very dry conditions (characteristics of xerophytes cactus, euphorbia,
prickly pear, reduction in leaf size, rolled or folded leaves to reduce surface area, hence
evaporation, emphasis on growth below ground). Mesophytes are plant species, which are
found, on sites with moderate soil moisture levels. Trophophytes: have organisms with which
to avoid drought - e.g. long roots. The amount and distribution of rainfall is very important for
plant life, and hence animal population. Forest communities characterize sufficient and well-
distributed rainfall while tropical savannas characterize light seasonally distributed rainfall.
Fauna population in the tropical savannas has to be equipped with certain animal mechanisms.
The wildebeest of East Africa, for example are tuned to migrate from Serengeti in Maasai
Mara during dry season to avoid competition for food. The problem of water stress for plants
is averted by adaptation, which includes the development of thick bark, the shedding of leaves
and the replacement of leaves by thorny structures. Water is very important for various
physical processes such as photosynthesis and respiration.
7.5.1.3. Solar radiation
Light and temperature are controlled by the latitude through inclination of the sun, the albedo
of surface bodies, especially at the local level and aspect. The quantity rather than quality of
light is very important in determining the distribution of living organisms. Wavelengths such
as ultraviolet and gamma rays are known to affect regions of high altitudes. The plant
characteristics that may be observed at 1500m and above in East Africa are a result of high
component of ultraviolet light.

62
The components of a plant association depend on the amount of light received. At the regional
scale, equatorial forests have high density compared to temperate or coniferous forests
because of their unlimited supplies of energy. Locally, components of a stand of plants are
dictated by differences in energy demands. At the lowest levels are the shade tolerant or low
light species while at the top canopy are the light lovers or shade intolerants. Accordingly,
light amount determines the abundance and diversity of species and their structural variation.
Solar radiation is the fundamental basis of photosynthesis and in the absence of light, even
when it is in poor supply as on the floor of a dense forest, the number of species is restricted.
Short wave solar radiation reaching the not only determines gross patterns of energy exchange
within the biosphere, but certain of its components are also responsible on a more local scale
for imposing limits to organic growth. The quantity and quality of light are important,
together with the day length or photoperiod. Light varies both spatially and temporally.
Spatially, there is variation due to latitude, thus the equator receives more light that the poles.
These variations result in differences in the distribution and location of plant life. Light
intensity is greatest at the equator. Quality of light varies according to the intercepting surface
(vegetation canopies). Light is one of the main factors that determine shape, size of plants,
suppression. Competition for light dominates the competition for plant survival. Root
development and seedling development also determine the growth of plants. Photosynthesis
depends on light variation. Competition for light by species decreases from the equator to the
poles. Species adapt to stress conditions through mechanisms such as hibernation,
reproduction, migration and feeding habits.
7.5.1.4. Wind
Wind is another climatic factor that affects life processes in different ways and modifies the
hydrologic cycle by increasing the rate of evaporation. As a drying power, wind lowers the
relative humidity in the vicinity of the leaf surface by removing water vapour. This leads to
the creation of a vapour gradient there initiating evaporation in plants. As desiccation
increases, the mesophytes are replaced by the xerophytes.
Wind affects coastal areas. It may lead to total or partial destruction of plants. Strong winds
are experienced several times during the year in different parts of the country, and are
associated with uprooting of trees, tree falls and broken branches. The high latitude and desert
areas, there appears low and deformed growth. Wind equipped with particulate is associated

63
with wind training; a process, which hits plants growth at a certain level, especially where
wind direction is constant. All branches except those in the leeward side are destroyed. The
effect of wind on the plant community depends on the depth of the roots, wind velocity and
frequency of occurrence. Frequent winds in high altitudes are partly accountable for
dwarfness in trees.
Wind retards growth by increasing physiological stress on mating cells. In the seacoast
dwarfness results from unfavourable internal water conditions, which is aggravated by salt
sprays dispersed by wind. The effects of wind on the migration of birds and even of water
plants in very interesting but not yet studied properly. Wind facilitates movement and
increases the organism’s chance of arrival at a new site. Wind can affect plants through soil
structure. Frequent wind activities in coastal and desert sand dunes bring about drifts of sand
in sites devoid of vegetation. Such unstable sites hamper progressive succession of even
simple life forms.
7.5.2. Topographic Factors
As indicated earlier, topographical differences can affect distribution by acting as barriers.
Mountain terrains, for instance, can limit the spread of animals and plants by separating
potential habitats or by the provision of unfavourable climates and substrate. In East Africa,
mountain tops impose a selection effect on distribution by low mean temperature. The current
limited distribution of the equatorial rainforest can be explained by altering rainfall conditions
through aspect. The south east slopes of Mt Kenya and Mt Kilimanjaro carry abundant life
because of high moisture. The drier northward and westward slopes are characterized by scant
life. The effects of aspect and light conditions and hence substrate conditions are distinct.
Topography encompasses numerous abiotic factors, although these are often interlinked in a
complex manner with other environmental components. The main topographic factor is relief,
which induces vertical temperature changes and related climatic adjustments such as humidity
variations (decrease of 0.6oC for every 100m altitudinal rise) leading to altitudinal zonation.
The influence of topography on ecosystem characteristics is often manifested through its
interaction with other components of the physical environment. Plants and animals become
increasingly restricted to low elevations in the northern hemisphere.

64
7.5.3. Edaphic factors
Soils are important in determining the pattern and distribution of living organism; they
provide the anchor for plants and are the nutrient store upon which plant life is dependent.
Soil contains both abiotic and biotic components and provides the vital link between living
and non-living phenomena, without which terrestrial ecosystems would not operate. Soils are
made of the mineral components and vary in type. The soil texture is the proportion of silt,
sand, clay and this determines the degree to which roots penetrate the soil, the water content,
and aeration and soil temperature. Sand for example has large pore spaces. This decreases the
capillary so that sandy soils cannot hold water. Clay soils have small pore spaces, thus water
is easily held. The thin layer found around each soil particle is referred to as hygroscopic
water or water of adhesion. This water is bound to the soil particles, and is unavailable to
plants. Bound to the water of adhesion is another body of water known as water of cohesion
or capillary water. It is the propensity of water to adhere to the surface and get pulled up. The
water is loosely held to the soil particles on the water of adhesion. At saturation a soil is
wetted and all gravitational water is drained out.
Soil is also the habitat of different fauna. The occurrence of certain plant species depends
upon soil conditions. The distribution of cosmopolitan plants depends upon distributed
substrate. The occurrence of a plant species in any substrate depends upon its occurrence and
ability to grow and successfully compete for opportunities the soil offers. Variations in
patterns of distribution can be said to be a response to soil conditions. Soils vary in nutrients
and water conditions, grain size and arrangement, and in depth. There is no soil type with
uniform conditions. Water logged sites attract grasses while well-drained sites favour the
dominance of tall plants. Frequent nutrient shortages in the soil initiate competition among
organisms that may lead to the extinction of less aggressive species. Certain distributions can
be explained on the basis of soil PH, defined as the level of acidity or alkalinity. Acid soils
support oxylophytes while halophytes occur in saline soils.
7.5.4. Geological Factors
Besides the climatic history of an organism’s habitat, distribution can also be determined by
geological factors. Environmental mode is far from having ways been identical or normal.
Most of the processes such as volcanism and mountain building have bursts or peaks that lead
to massive killing and extinction of organisms and species. The eruption of volcanoes and the
burning from underneath of organisms in East Africa’s Rift Valley are such examples.

65
However, some geological changes have been gradual and “accommodating”. The effect of
geological history in the distribution of organisms was recognized. It is associated with the
origin of Vireroin Biogeography.
Wegner’s theory of plate tectonics provided ample evidence for the distribution of similar
animals and plants on different continents. His theory supported by that of palaeomagnetism
and sea-floor spreading, emphasizes that certain distributions have been passive. The involved
organizations have merely been transported across the globe due to constant drifts, which
have split the once continuous continents apart and led to new patterns.
Geological processes caused many variations in landforms and subsequent patterns of
distribution of plants and animals. The diversity of landforms in East Africa is reflected in its
varied climates, which have led to normal diversity in vegetation. The geological processes
have caused variations in land and sea sizes leading to differences in habitats for terrestrial
and aquatic organisms. The effects of these processes are always confused with those of extra-
terrestrial forces such as meteoric impact that led to the disappearance of certain distributions.
This period saw the Mesozoic extinction (65million years B.P) in which certain mammals like
reptiles were eliminated. The asteroid impact hypothesis of the Pleistocene ice age and the
killing of large mammals is another geological episode whose effects can be seen today. From
these and other evidences, it appears that the biosphere has not always evolved gradually, but
in bursts.
7.6. Biotic Factors and Distribution of Living Organisms
The existence of an organism in a certain area is mostly determined by the nature of the
physical environment. The soil and climate, for instance must satisfy at least the minimum
requirements for plant growth and reproduction. Certain biotic factors must be present before
an organism can occupy a potentially favourable physical habitat. There are factors, which
result from the interaction of plants and animals existing under similar conditions. Although
most physical habitats may be favourable, only a few are exploited by a number of species.
The rest have been avoided because of the organisms’ inability to obtain their essential
requirements and to maintain themselves successfully along with others.
For organisms occupying a given habitat, there exists an interwoven web for mutual
interdependence and interactions that result from different life processes. These relations are

66
either beneficial to the existence of others or generally detrimental and therefore inhibiting to
the existence of others. The habitat of an organism is therefore partly physical and partly
biological. Unlike physical factors, biotic factors are more difficult to assess and diverse in
occurrence since they are a combination of the action of a wide variety of organisms. The
factors are selective in their effects and operate within a given envelop of physical settings.
The biotic factors or processes such as routes of dispersal, competition, predation, symbiosis
and fire finally determine the overall range of species and their arrangement in the landscape.
In this lecture, each of these interactions is discussed and its effect on living organisms
considered.
7.6.1. Competition
The struggle for existence between and within species for the insufficient resources available
in a habitat is called competition. The competition amongst plants of the same or different
species for different resource arises because of economic reason. There is greater demand on
resources than there are resources to feed the organisms (supply). The limited area of the
environment in between which plants will compete is referred to a niche. The mega vegetation
(trees) will face intense competition for resources. It is usually competition for space, space
for seedling, water, and light, and soil nutrients. Intense competition amongst seedling will
result in varying survival rates, those that compete successfully are said to be more
demanding or aggressive. The losers are described as suppressed. The physical conditions of
plant growth may be said to be permissive. Biotic factors however, are selective and
competitive. All living organisms are faced with one major problem. They have to struggle
for the limited earth resources.
Competition can occur between populations of the same species referred to as
intracompetition or between populations of different species known as intercompetiton.
The real success of an individual is either type of competition depends upon its requirement,
its life form, its vigour and density of growth and its seasonal development. Usually vigorous
growth is the most successful. Fast growing plants, for instance, modify micro-climatic
conditions thus depressing or excluding the less demanding and less aggressive forms from a
habitat.
The influence of factors being competed for varies from one habitat to another. In the arid and
semi-arid environments, plants compete for soil and water while in the equatorial rainforest;

67
stratified plant stands compete for light. Competition for light and food is basically
synonymous with competition for space. Competition is mitigated in different ways. A
response common in plants is allelopathy. This is a short-term chemical response meant to
inhibit competition for space. Certain plants eliminate others by producing inhibitive
chemicals as leaf leachate or as rhizosphere products. These substances include toxins, which
injure plants within reach. Some of the chemical exudates like those released by milky weed
and walnuts, inhibit seed germination of competing species.
The ungulates of the East African Savannah mitigate competition for food by seasonal
migration. The wildebeest, for instance, migrate from Serengeti plains to Maasai Mara in
Kenya. Within the grazing community of the Savannah, the ungulates mitigate competition
for forage by feeding at different canopy levels, a phenomenon called temporal separation
(Cox and Moore, 1986). The buffalo feeds on the leaves of very large grasses, the zebra eats
the low protein grass stems, next are the antelopes and wildebeest, which feed on short,
trampled grass and lastly are Thomson’s gazelle which feed on a broader leaved
dicotyledonous plants after most grasses have been reduced. Within a tree canopy, insects and
birds avoid competition by the development of specialized microhabitats. This is called
spatial separation of species.
Competition has a lot of effects in a community or organisms. It does reduce the species range
and generally may lead to the elimination of a species, a phenomenon called competitive
exclusion. Also it induces development of stratified communities, especially where light is
limited. Competition may prevent two species from living together in a habitat, or it may
reduce the vigour and therefore, the reproduction rate of certain species. Competition is,
therefore associated with the extinction of less aggressive species and the dominance of the
more aggressive species under given environmental conditions. Coexistence of the competing
species, with time, through evolutionary changes may eventually reduce or remove
competition.
7.6.2. Tolerance Limits
In any environment, all organisms have tolerance limits beyond which they cannot exist. Each
physical environment factor is operative over a gradient, which affects all organisms present,
for example through a range of temperature from low to high. Any organism, which is tolerant
of a wide range of conditions, is termed eurytopic. An organism, which is tolerant of a

68
narrow range of conditions, is referred to as stenotopic. All organisms function with
maximum efficiency over only part of a gradient. Here at its optimum, the organism is able to
exist in large numbers, since its ability to compete is at its greatest. Beyond this limit, it
suffers physiological stress, so that its reproductive capacity is impaired and smaller numbers
can be maintained. The organisms may migrate to more favourable area.
7.6.3. Predation
The distribution of species is affected by another biological factor known as predators.
Predators reduce or eliminate species (the prey) by eating them. Predation is the most obvious
form of species reduction. By reducing the number of preys, predation reduces the pressures
of competition between them. Thus it may allow more species to survive than would be case
in the presence of competition alone. Recent studies of natural communities tend to suggest
that predators may increase the number of different species in a habitat. So predators broaden
the distribution of species rather than confine it.
Despite the debates about predation, there is much yet to be understood. Theoretically,
predators reduce prey to a certain size along which its population oscillates through feedback
mechanism. An increase in predator population is followed by an increase in the prey eaten
and subsequently a reduction in prey population. Below a certain level, the predators find it
time consuming to obtain enough prey. This absence of food leads to competition in predators
and hence natural ecosystems where predators and preys control themselves to a certain size
to avoid impoverishment of either population.
Naturally, predator species depend on more than one prey, an ecological adaptation, in order
to reduce pressure on prey and increase chances of a predator reaching its targets. This
characteristic applies to certain plants as it does to animals. At a very limited level, predation
can be seen as animal interaction, but it also involves carnivorous plants such as Venus
flytrap, which catches and digests various insects. The ability as a predator to find and feed on
its prey depends upon the rate of energy and matter flow from one trophic level to another.
Predators employ various specialized features and behaviour patterns. Hawks, falcons and
eagles, for instance have eyesight that enables them to spot prey from a distance. Wolves are
able to take larger preys than themselves by hunting in packs while spiders build complex
webs to trap moving insects.

69
Preys do not lend themselves easily to predation. Instead, they are equipped with various
avoidance mechanisms such as fast flight or living in habitats with many hiding places; they
also have sharp senses to detect the presence of predators. Some species defend themselves
against predation by taking unattractive scaring shapes. Blowfish, for instance, inflate to
larger size, while cacti have thorns to discourage predation. Some beetles may emit evil
smelling gasses to discourage their enemies.
7.6.4. Symbiosis
When two different species exist in close physical contact and benefit from their association
the phenomenon is called symbiosis. Literally, symbiosis means living together for mutual
advantage. Three types of symbiosis, which can be identified on the basis of energy transfer,
are: mutualism, communalism and parasitism. Through ecological associations, the presence
of one organism may be dependent on the other.
7.6.4.1. Mutualism
This is a symbiotic relationship from which the two species involved benefit. It is the
interaction displayed by Rhizobium bacteria and the root nodules of leguminous plant. Large
colonies of bacteria in root nodules fix gaseous nitrogen to available forms such as nitrate and
ammonium ions. Thus plants benefit by obtaining available nitrogen, which bacteria have
reduced in a habitat. Mutualism is also demonstrated between ants and the acacia of the East
Africa Savannah. The former protect the trees from predation and damages by ungulates
while the latter provide the insects with food (nectarines) and a habitat.
7.6.4.2. Communalism
This is an association from which one species benefits while the other is neither harmed nor
helped. Epiphytes, for instance, use tree trunks to reach upper canopies to get access to
sunlight. These so called air plants, take nothing from the tree leaves and do harm or benefit
from it.
7.6.4.3. Parasitism
This is a symbiotic association where one species the parasite benefits while the other species
the host is harmed. From the host, the parasite takes its nourishment, which can be in form of
blood or sap. Parasites can live on the host (ecoparasite) or in the host (endoparasite). Animal
plaguing parasite includes lice, ticks and worms. Parasites, which plague plants, include
fungi, which cause disease and wheat rust.

70
7.7. Fire
Fire both natural and human induced affects vegetation. It is possible to consider fire abiotic
rather than a biotic environment. Fire is a biotic factor to the extent that its occurrences;
duration and intensity depend upon the amount of combustible litter and to the extend that
most fires started by man. The contrary is true, to the extent that natural fires depend upon
lightning and the fire characteristics depend upon climatic and topographic variations. Fire for
instance, is controlled by wind. The latter determines the speed and direction of fire. Other
climatic factors like humidity and temperature affect the severity of fire. In the East African
Savannah, fires are common during the dry season when weather conditions are favourable
and combustible litter in plenty. Concentrating on logistic of fire may not/ suffice; its effect
on biota. There is a lot of literature, which has been written on fire in the savannah, and any
interested reader may investigate.
Some plants need exposure to fire before germination. Fires result in radical changes in the
community structure. Some plants have roots and shoots, which are, fire adapters. Fire is
usually an occasional factor in the ecosystem, but one, which in a short time can cause
substantial modifications. All independent components of ecosystems are likely to be affected
by fire, which becomes particularly drastic if driven by wind. Most natural cause of fire is
lightening. Fires cause changes in the composition of vegetation and in soil moisture and
nutrient levels. Modifications also occur in microclimates, notably among temperature and
light conditions within the vegetation cover, while plant competitors, animal food supplies
and habitats are likely to be varied. Fire regarded as most important factor in the origin and
development of grassland ecosystem (not necessarily the case). Deliberate burning can be
problem, yet exclusion of fire may also lead to a greater incidence of diseases and pests.
Fire increases plant susceptibility to bacterial and fungal attacks by making scars on them.
Such plants can easily be damaged by wind or may attract later fires. Fire kills animals on the
surface and those in shallow depths. By destroying habitats, it induces the migration of certain
organisms. On the contrary, the creation of open sites attracts seed feeders such as birds and
rodents and increases the population of shade intolerants. Fire, like biological variables, has a
selective effect. Fire occurrence stimulates populations of species, which are fire resistant
plants.

71
7.8. Anthropogenic
Human beings are also biotic factors because they select certain plants and animals over
others. This is done through agriculture, intensification of grazing and fire. Domestication of
animal affects plants differently by grazing and browsing, which results in selection of
species, thus affecting the composition of the natural vegetation. Grazing decreases the
variety of species in an area, eliminates grasses, shrubs, and bushes, weakens desirable
species, and increases competition, survivors and soil fertility decline. Recreation use of
natural area, hunting, vehicles, camping also have an impact on landscapes and environment.
The spread of domesticated plants, some useful (maize, potato), some harmful species
(hyacinth) has been largely due to anthropogenic activities.
7.9. Time and Ecosystems
A fundamental characteristic of ecosystems is their susceptibility to change with the passage
of time. Two kinds of changes take place, each associated with a different time scale: First,
ecosystems are modified in a series of stages which cover the lifespan of their component
individuals and last for decades or centuries. Second, they are affected by changes, which
occur over much longer periods of time, usually measurable in thousands or millions of years,
and are a response to alterations in physical environmental conditions together with the
evolution of their component species.
7.10. Summary
This lesson discusses the distribution of organisms in the biosphere and the factors that
influence them. Indeed, distribution of living organisms is characterized by lack of
uniformity; however, there is no organism that is distributed haphazardly on the earth’s
surface. A close examination shows that the patterns of distribution are never even. Indeed
each species exhibits variations in distribution in both space and time. The patterns and
distribution of living organisms in an ecosystem are determined by several factors both
abiotic and biotic. These patterns are also controlled spatially and vary temporally. The
anthropogenic activities have had a great impact on the distribution of living organisms and
further reading is recommended.
7.11. Definition of key words
1. Symbiosis refers to the relationship between two different species usually for mutual
advantage.

72
2. Tolerance limits refers to the environmental gradient within which a species is able to
survive. Beyond the limit, the species suffers physiological stress so that its
reproductive capacity is impaired and smaller numbers are maintained. Organisms
with a wide range of tolerance are eurotopic, while stenotopic refers to those tolerant
of a narrow range of conditions.
3. Biotic factors result from interaction of plants and animals existing under similar
conditions, they include competition and predation.
4. Abiotic factors relate to the physical environment and include; climate, relief and soi.
5. Competition is the struggle for limited resources by different species of plants and
animals. Intracompetition occurs between populations of the same species and
intercompetition occurs between populations of different species.
7.12. Revision Questions
1. Discuss the effects of climate on the distributions of living organisms in Kenya.
2. Explain how time influences ecosystems.
3. Discuss the species diversity and abundance as dictated by competition in drylands.
4. How have dispersal mechanisms resulted in the species distribution?
5. Explain how the following factors affect the pattern and distribution of living
organisms in an ecosystem: Edaphic factors, Competition, Topography
7.13. Further Reading
1. Coe, M.J .The Ecology of the Alpine Zone of Mt Kenya
2. Cox C. and P. D. Moore 1986. Biogeography, An Ecological and Evolutionary Study,
Longman
3. Harper J. L. and Townsend C. R.1986. Individuals, Population and Communities,
Blackwell Scientific Publication.
4. Ojany F.F and Ogendo, R.B. 1973. Kenya: A study in Physical and Human Geography
Longman, Nairobi

73
LESSON 8. VEGETATION PROCESSES
8.1. Introduction
This chapter introduces the theory of ecological succession. Both the primary and secondary
successions are described, together with the phases of succession. The role of colonizers has
also been explained within the succession phases, indicating the changes that take place in
structure throughout the species enabling replacement of other species, and changing the
environment positively. Vegetation processes are described, indicating the effects of
disturbance on vegetation types. They include the adaptation processes and dispersal
mechanisms.
8.2. Objectives
8.3. Ecological Succession
Succession is a change in composition and nature of vegetation at a given location through
time from inception to maturity. An area of bare ground when stripped of its original
vegetation by fire, floods does not remain devoid of vegetation for a long time. The area is
rapidly colonized by a variety of species, which will subsequently modify one or more
environmental factors. Primary succession is an invasion by plants of an area that had no
previous plant growth; it begins with a bare or uninhabited area. Secondary succession is re-
colonization of areas that have been disturbed. Primary succession occurs in areas where
volcanic eruption has cleared out the existing vegetation, seashores, or retreated glaciers.
Secondary succession occurs in areas affected with serious fires, areas previously farmed or
grazed or used in various ways that lead to removal of vegetation. A major environmental
disturbance and disrupting a previously initiated succession or producing a marked
By the end of the topic, the learner should be able to:
1. Explain the theory of ecological succession.
2. Describe factors that initiate successional processes.
3. Explain the processes of adaptation and dispersal.

74
modification in stable vegetation initiates secondary succession. The recent tsunami disaster
in the Indian Ocean has initiated secondary succession in the affected areas. Generally in
primary succession unlike the secondary, the soil is not fully developed.
Colonizers
Primary colonizers tend to be low taxonomically such as herbaceous annuals, lichens and
mosses. They tend to be short-lived, morphologically simple plants. They also have a long
range of tolerance. They are extremely hardy plants and can survive in areas of extreme
temperatures or moisture levels. They tend to form large single stands and are fast growing.
Moisture relationships usually control the ability of colonizers to invade a new area.
Colonizers ameliorate the soil, dampening the dry soil and drying the wet one in the process
they diversify the environment creating new nutrients. The colonizers play a role in the
weathering of the soil from solid rock, they add organic matter to the soil; reduce the soil
temperature, free minerals for use. In so doing, they improve the environment, making it
possible for more species of a less hardy nature to grow. Changes in structure occur
throughout the species, thus morphologically more advanced, taller, and long-lived plants are
able to grow and replace the initial colonizers.
Phases of Succession
The process of succession can be divided into several important phases as follows:
i) Nudation: which is the initiation of the succession by a major disturbance in the
environment.
ii) Migration: of available seeds (species) to fill the vacant ecological niches. In
secondary succession, spores and seeds may already be present in the soil awaiting
the right conditions. Some plants may delay their germination – these species can
be said to be better adapted to colonization than others.
iii) Ecesis: is the establishment or subsequent ability of the seeds to germinate, grow
and reproduce successfully.
iv) Competition: the struggle of species for the available resources (nutrients, water,
light, space). Some plants are eliminated; where as the most competitive plants are
adapted.
v) Reaction: The plants continue to interact within the existing conditions.
vi) Final Stabilization: The plant community becomes stable and is referred to as the
climax community. Succession is a directional vegetation change induced by

75
environmental or other disturbances, the initial rates of vegetation change is high
and subsequently falls to a low level often which further development is governed
by very slow change - the relative stable state is referred to as the climax.
8.4. Dominance at Climax
The climax community is the last stage of an ecological succession of communities and
manifests the most stable condition within a succession, stable vegetation being in
equilibrium with its environment. According to the monoclimax theory of Clements (1916),
the climax formation is mainly controlled by vegetation factors. Therefore the climatic climax
is not affected by other environmental factors such as soil or topography. Stabilization may in
fact be an illusion. A degree of instability is characteristic of communities because of climatic
change, and the continuing nature of evolutionary process. Environmental factors are not
constant and climate although an important factor does not influence the vegetation
communities on its own.
8.5. Dispersal Mechanisms
For an organism to occupy a potential habitat, it should be able to get there. The extension of
its range in the habitat depends on its range of tolerance and its ability to compete
successfully with those already in existence or that invade it later. The organisms therefore,
require an efficient migration or dispersal mechanism and aggressiveness in resource
exploitation. Less efficient migrators cannot realize their potential range, and they tend to be
limited in distribution. The process of organism dispersal is important not only for the spread
of the organism but also to avoid competition for limited resources.
It involves the movement of organisms from their evolution areas and refugia. Organisms
start spreading differently once opportunities become available. Some movement will involve
diffusion across hospitable terrain along a pathway called corridor route. The movement along
this route is very slow and may take thousands of years, sometimes involving some
evolutionary processes. The habitats en route are very diverse, thus permitting movement of a
lot of organisms. The Bering Strait is an example of a corridor route that assisted the dispersal
of organisms between Europe and North America until the recent Pleistocene period. The
edge interconnecting habitats sometimes becomes selective to migrators. This imposes stress
on some and not others. Such dispersal pathways are called filter routes. A third route is the

76
sweepstakes route in which potential habitats are isolated by barriers such as mountains, water
masses and islands of vegetation.
The spread of an organism along a sweepstake route depends upon chance dispersal. The
journey, which involves birds, insects, and propagules with aerial adaptation to cross barriers,
leads to a final biota, which is not representative of the source area. Such no-representative
distribution depends upon the efficiency of dispersal mechanism and the ability of an
organism to establish itself successfully in the new environment.
8.6. Adaptation
The plant can respond to the changing abiotic conditions by adapting to existing new
conditions. Adaptations to the new conditions can be either by being resilient or changing
their morphology to survive. The species can also become extinct if unable to cope with the
new conditions. Extinction may be brought about by extreme conditions, sometime plants
exist to create new niches that may lead to their death, yet they may have prepared the
ecosystem for a new species to become established. A species, which because of its presence
may be inhibiting the establishment of another, may simultaneously be modifying the site in
such a way that on its death, a new species may establish which could not have done so
before. Changes in environmental factors may kill plants in an area, and thus create niches for
colonization by other species. In addition, the species already present may simply alter the
balance of competition between the existing species such that some expand the size of
individuals or of their populations at the expense of others.
8.7. Summary
The theory of ecological succession is discussed, together with the climax community.
Dispersal mechanisms adopted by plants are also described as an important vegetation
processes that enables them to establish successfully in a new environment. The adaptation
strategies for plants in new conditions are also provided to show that establishment of the
vegetation depends on several factors and that indeed; succession can be interrupted by
several natural and human induced disturbances.
8.8. Definition of key words
1. Primary succession is an invasion by plants of an area that had no previous plant
growth; it begins with a bare or uninhabited area.

77
2. Secondary succession is re-colonization of areas that have been disturbed.
3. The climax community is the last stage of an ecological succession of communities
and manifests the most stable condition within a succession, stable vegetation being in
equilibrium with its environment.
4. Colonizers are plants that modify the environment following disturbance. They are
extremely hardy plants.
5. Adaptation is the response of the plants to changing abiotic conditions, by either
being resilient or changing their morphology to survive.
8.9. Revision Questions
1. Explain the stages of ecological succession in an ecosystem following a catastrophic
disturbance by a tsunami.
2. Discuss the theory of climax community.
3. Explain the climatic parameters that influence the climax vegetation in tropical forest
ecosystems.
4. Examine the forms and types of disturbance and regeneration of vegetation
8.10. Further Reading
1. Knapp, B.J. 1981. Practical Foundations of Physical Geography, George Allen and
Unwin, London
2. Muller; R.A. and Oberlander, T.M. 1984. Physical Geography Today: A portrait of a
Planet.
3. Myers, A. and Giller, P. (Eds.) 1988. Analytical Biogeography: An Integrated
Approach to the Study of animal and plant distribution, Chapman and Hall
4. Pears, N. 1977 Basic Biogeography, Longman
5. Simmons, I. 1982. Biogeographical Processes, George Allen and Unwin
6. Strahler, A.H. and. Strahler, A.N. 1976. Elements of Physical Geography, John Wiley
and Sons Inc.
7. Trewartha, G. T. 1968. Fundamentals of Physical Geography, McGraw-Hill Co.
8. Wilcock, D. 1983. Physical Geography, Black

78
LESSON 9. WORLD VEGETATION ITS DISTRIBUTION AND
CLASSIFICATION
9.1. Introduction
This lesson describes the distribution of world vegetation and its classification. The
classification takes into consideration the life forms of the plants in terms of trees and forests,
grasses and grasslands and natural deserts. The vegetation characteristics in each of the
biomes are discussed in detail. The discussion focuses on the terrestrial biome which can be
subdivided into grasses and grassland ecosystems, biological deserts and trees and forest
ecosystems. The human impact on the vegetation regions is also described.
9.2. Objectives
9.3. Vegetation regions of the world
The surface of the earth can be divided into a series of regions or biomes, which have similar
vegetation. A biome is a major type of natural vegetation that occurs wherever particular
climatic and soil conditions prevail. However, the biome may contain different species in
different regions. Many kinds of biomes have developed from earth great number of possible
combinations of climate, parent rock and biota some of these are aquatic and some are
terrestrial. Each biome is a rather broad category with considerable variation. Due to human
induced pressures on the earth these vegetation types are no longer continuous but are
fragmented and no longer natural systems.
By the end of the topic, the learner should be able to:
1. Describe the characteristics and the distributions of the world vegetation.
2. Classify the world vegetation types
3. Explain the factors that lead to the varied distribution of world vegetation
4. Discuss the human induced changes on the world vegetation.

79
9.4. Forests
9.4.1. Tropical Rainforest
The tropical rainforest occur where there is always plenty of moisture and heat, no drought,
no winter. They have a rich floristic and faunistic composition. The plants and animals of all
kinds, which have no resistance to drought or cold, occur here. These forests are best
developed in tropical America, particularly the Amazon basin, in the East Indies and
surrounding areas, and to a lesser extent in Africa.
The typical rain forest has many layers. Dominant trees are generally 30 - 50 metres tall,
emergent trees extend to 60 metres. Below the crowns of dominant trees are several other
strata of plants that can tolerate deep shade. Concentration of life is in the canopy, where there
is plenty of light. Since there is enough heat and moisture, the principal limiting factor in the
rain forest is usually light. The crowns of large trees are covered with epiphytes, non-parasitic
plants that use trees only for support. These epiphytic plants manufacture their own food, and
with aerial roots or water catchments, get their water from the torrential rains that occur
almost daily. In the American rain forest, orchids and bromeliads (relatives of the pineapple)
are the most abundant epiphytes. In the East Indies, there are no bromeliads but orchids and
ferns are abundant as epiphytes. Lianas, which are vines rooted in the ground but having their
leaves and flowers in the canopy 30 metres above, are also characteristic of all tropical
rainforests. Figure 9 shows a typical tropical forest.

80
Figure 9: The equatorial rainforest
The floristic richness of the rain forest is greater than that of any other ecosystem type; there
are thousands of species of orchids alone. The number of tree species is so great that only in a
few places do we find rain forests dominated by one or two species. In some places in the
Brazilian forests, there are as many as 300 species of trees occurring in one square kilometre.
The animal life is dependent on this highly productive vegetation is also quite varied. All
trophic levels are represented in abundance. Many of the animals live only in the canopy
where so much of the production originates: monkeys, lemurs, snakes, birds, and insects. The
canopy biota of the rain forest is an amazing collection of an almost infinite variety of
adaptations to special ecological niches, and an unsurpassed (but exceedingly complex) place
of the study of the evolution of ecological relationships.
As an ecosystem, the tropical rain forest is the most productive of all. The net productivity of
above ground plant parts is in the range of 10-20 grams/m2/year. Much of this is in the wood,
which supports eventually only organisms such as termites, fungi and bacteria. Much of the
mineral reservoir is tied up in the standing crop. Thus phosphorous, nitrogen is usually
limiting.

81
Although the equatorial forests are the most luxuriant form of vegetation in the world, the
soils supporting them are generally thin and infertile. When leaves and dead wood fall to the
ground they are rapidly decomposed and the mineral they contain are recycled straight back
into the trees. The regular heavy rainfall also leaches the soil minerals so most of the plant
nutrients are contained in the vegetation rather than in the soils. If the protective cover of
vegetation is removed then the deforestation leads to the rapid removal of the thing layer of
good soil and to severe soil erosion. The equatorial forest is found in the Amazon and Zaire
Basins, West African coast lands, Malaysia, coastal Burma, Cambodia and Vietnam, most of
Indonesia and New Guinea.
9.4.2. Tropical Monsoon Forest
The Tropical Monsoon forest has a smaller number of species than in the equatorial forest.
Most of the trees are deciduous, losing their leaves in the hot dry season. Heavy rain and high
temperatures in the wet season result in rapid growth and the trees soon become covered with
leaves. The trees are tall rising up to about 30 metres, however they lack canopy. Thus the
undergrowth is denser since more light reaches the ground. They have a variety of tall species
including camphor, ebony, teak and bamboo, valuable hardwoods such as teak. The tropical
monsoon forest is found in Burma, Thailand, Cambodia, Laos, Vietnam, parts of India, east
Java and the islands of the east, N. Australia.
9.4.3. Temperate Forests
9.4.3.1. Temperate Evergreen Forest
They occur in regions, which have rainfall throughout the year with winter temperatures over
10o
C, which means that plant growth can go on all year. Most of the trees are broad-leaved
evergreens, although there are deciduous trees as well. The forests contain evergreen oak,
camphor, and walnut, which are all of economic value. Most of these forests look similar to
tropical forests in that the vegetation is dense. Tropical evergreen forests are found in China,
USA, southeast Australia South Africa - mainly on the eastern sides of the land masses in the
warm temperate latitudes. Sometimes referred to as warm temperate forests.
9.4.3.2. Deciduous Forest
Trees shade their broad leaves in autumn and remain bare in winter to minimize water by
transpiration. As water availability improves on the onset of spring, the trees regain their
leaves and remain green in summer. Many trees grow in stands of the same species including
pine trees and firs.

82
9.4.3.3. Coniferous Forest
Coniferous forests are specially adapted to the long cold and often snowy winters. They are
conical is shape to combat the snowfall during winter. They also have needle shaped leaves, a
characteristic that enables the trees to reduce water loss by transpiration during the winter
when all the moisture is frozen in the soil. The leaves have a tough thick skin, which protects
them from winter cold. The tree is conical and has flexible branches, which allow the snow to
slide off. It has widely spread shallow roots to collect water from the topsoil above the
permafrost. Coniferous forests can only withstand the winter cold to a point beyond which
they cannot survive towards the poles. The tree species are found in uniform stands. The
major species are spruce, fir and pine. In low altitudes these forests are also found on high
altitudes such as high mountainsides of tropical areas. In most coniferous forests, a thick
carpet of mosses occurs. The forest species are generally few and large tracts of forests can
consist of only one or two species.
Coniferous trees produce soft wood, which is in great demand for making paper, especially
for making paper, newsprint, matches, furniture and synthetic fibres. These forests have
practically not undergrowth because the soil is frozen for many months each year. Coniferous
forests are most extensive in high latitudes and on high mountains although it does not
develop on sandy soils in warmer regions. There are two main belts of this forest: across
Eurasia extending from the Atlantic to the Pacific, and across N. America extending from
coast to coast.
9.4.3.4. Mixed Forest
Coniferous forests give way to broad-leaved summer green deciduous forests in warmer well-
watered localities. This zone of transition is referred to as mixed forests.
9.4.3.5. Mediterranean vegetation
In the Mediterranean countries of northern and southern Africa, the natural vegetation is
adapted to withstand the long summer drought. Thus the evergreen trees and shrubs have
thick hairy or oily leaves, which help to prevent loss of water through evaporation. Plants also
have deep, widely spread roots reaching far beneath the ground in search of water. Bushes and
short grasses are found near the borders with hot deserts. There are a wide variety of trees
found in the Mediterranean areas. These include cork oak, olives, pines, firs and cedar. The
cork oak is very useful, because its bark is used in the manufacture of bottle corks. The
Mediterranean vegetation occurs chiefly on the western sides of landmasses and in the warm

83
temperate latitudes. Lowlands around the Mediterranean Sea, SW Australia, South Africa,
central Chile and central California.
9.5. Grasslands
9.5.1. Tropical Grasslands
The tropical grasslands or Savannah is characterised by a much greater diversity of
composition, form and habitat than is found in the temperate grasslands. It is composed of
herbaceous stratum in which more or less xerophytic perennial grasses are pronounced.
Savannah may include varying proportions of drought resistant woody plants varying from
low shrubs to tall trees. Savannah is found in areas with marked seasonal drought. It occurs in
a variety of tropical climates, from those with 500 - 700 mm per annum and from 8 months
consecutive drought to none. Soils are varied. The distribution of the savannah areas is
coincident with discontinuous high plateau surfaces and the frequently abrupt vegetation
change between them. Evidence that some savannahs are of secondary origin, derived from a
pre-existing forest, either as a result of deforestation and/or burning.
9.5.2. Temperate Grasslands
The temperate grasslands include the Prairies, Steppes, the Pampas and the Veld. These have
originated as an adaptation to the climatic differentiation during the past climates. Much of
the temperate grassland has been removed by cultivation, while the remaining has been
modified by intensification of livestock farming. These are also known as mid-latitude
grasslands. These grasslands are almost treeless and they contrast sharply with tropical
grasslands. Five main zones of temperate grasslands are recognised over the world.
9.5.2.1. Steppe
The name steppe has been applied to the wild grasslands of Europe and Asia. The life forms
are similar to the prairies in North America. Tussocky grasses form tufts of grass or clumps of
grass. The grasses grow to one metre in height.
9.5.2.2. Prairies
The dominant grasses grow to about 1 metre in height. A mixture of sword forming grasses
occurs in areas as well as bunch grass. In spite of the general tussocky appearance,
particularly in winter, the true prairie forms a continuous sward or green turf over the ground.
The turf is short grass bound closely to the earth by matted roots. The mixed prairie is
composed of grasses of two distinct lifeforms, those growing to a height of one metre and the
dwarf grasses whose fruiting stems reach only a few centimetres high such as buffalo grass.

84
The desert plains tend to have a dry prairie dominated by dwarf species of grass, cactus and
sagebrush.
9.5.2.3. Veld
Warm temperate grasslands cover much of the eastern portion of the plateau of South Africa,
which is known as the high veld. Here there are few trees and in summer the grass grows tall
reaching a height of 1 metre. In winter, however, the grass withers away and becomes brown
in colour. The southern Transvaal and Orange Free State are almost entirely grassland areas.
The grass cover extends unbroken over very long distances.
9.5.2.4. Pampas
The pampas of Argentina were predominantly grass covered with species of feather grass and
other tall species similar to the tall prairies of North America. The dominant species of the
moist pampas are bunch grasses where a large percentage of the soil surface lay bare between
individual tussocks.
9.5.2.5. Downs
In Australia, tall grass isolated with trees and areas of scrub are similar to the savannah
grasslands. In New Zealand the grass is tussocky and very uniform in structure and
appearance. The leaves of the grasslands wither and die during the cold season, however the
roots do not die and in the warm season when the snow thaws, the aerial parts grow. These
grasslands have been replaced by cultivated vegetation and heavy grazing has altered the
vegetation immensely.
9.6. Biological Deserts
Deserts are not the same everywhere. There are hot deserts and cold deserts. Differences in
moisture, temperature, soil drainage, topography, alkalinity, and salinity create variations in
vegetation cover, dominant plants and groups of associated species. The hot deserts range
from no or scattered vegetation, to ones with some combination of dwarf shrubs and
succulents. Hot deserts include the Sahara, Namib and Kalahari in Africa and the Arabian
desert in the Middle East. Cold deserts include Great Basin of North America, the Gobi, Takla
Makan and Turkestan deserts of Asia.
9.6.1. Warm deserts
A desert is a land where evaporation exceeds rainfall. No specific amount of rainfall serves as
criterion; deserts range from extremely arid to those with sufficient moisture to support a
variety of life. Deserts have been classified according to rainfall into semi deserts (rainfall
between 150 and 300 to 400 mm per year) true deserts (rainfall below 120 mm per year) and

85
extreme deserts (rainfall below 70 mm per year). Deserts occupy about 26% of the continental
area and occur in two distinct belts between 15 degrees and 35 degrees latitude in both the
Northern and Southern Hemispheres - the tropic of Cancer and the Tropic of Capricorn.
Deserts are a result of several forces. One force that leads to the formation of deserts and the
broad climatic regions of the Earth are the movement of air masses. High pressure areas alter
the course of rain. Secondly, the influence of mountain ranges causes a rain shadow on the lee
side.
All deserts have in common low rainfall, high evaporation (from 7 to 50 times as much as
precipitation) and a wide daily range of temperature from hot by day to cool by night. Low
humidity allows up to 90% of solar radiation to penetrate the atmosphere. Rain is usually
torrential, and runoff instead of penetrating the hard ground resulting into Bad Lands. The
unprotected soil erodes easily and further eroded by wind.
Woody stemmed and soft brittle stemmed shrubs are characteristic of desert plants. The
shrubs grow with other plants including cacti and succulents. Both plants and animals are
adapted to the scarcity of water either by drought evasion or by drought resistance. Plant
evaders only flower in the presence of moisture. They persist as seeds during drought periods,
ready to sprout, flower and produce seeds when moisture and temperature are favourable.
Drought evading animals may go into a stage of dormancy during the dry season. Nutrient
cycling is tight, phosphorous and nitrogen is in short supply.
In spite of the aridity, deserts have not been spared impacts from humans. Only extremely arid
deserts have escaped significant disturbance. Desert regions, especially the Middle East have
been invaded by the oil industry, radically changing and polluting the desert environment.
Irrigation agriculture has turned some areas of desert green, but for how long? Some species
in the deserts have been disturbed threatening extinction.
The greatest impact occurs on the semi arid edges of natural deserts of the world, which
support some agriculture and grazing. Mismanagement of land has created new deserts.
Expanding population and periods on inadequate rainfall encourage encroachment on
marginal lands, which are then overgrazed and over cultivated exposing the land to erosion by
water and wind. Infrequent rainfall in these areas brings about famine and further degradation.
Eventually the land is destroyed, to a point of no return, - the result is desertification - the

86
creation of new deserts on the periphery of natural deserts. Supplied with water and managed
well, many deserts areas can be converted into productive agricultural land, but poor irrigation
practices can lead to salinization.
9.6.2. Cold deserts (Tundra)
Tundra means treeless plain (Finnish) and is found in the Northern Hemisphere as a , a frozen
plain. At the top of the Northern Hemisphere is the arctic tundra; at lower latitudes is the
alpine tundra. The tundra is characterised by low temperatures, a short growing season and
low precipitation (cold air carries very little water vapour).
The arctic tundra is a land dotted with lakes and crossed by streams. Where the ground is low
and moist, extensive bogs exist. On high dry areas and places exposed to the wind, vegetation
is scanty and scattered and the ground is bare and rock covered. The arctic tundra falls into
two broad categories; the tundra desert (100% cover and wet to moist soil), and polar desert
(less than 5% cover and dry soil).
Conditions unique to the arctic tundra are a product of at least three interacting forces:
permafrost, vegetation and the transfer of heat. Permafrost is the permanently frozen
subsurface that may be hundreds of metres deep. It develops where the ground temperatures
remain below zero for many years. Its upper layers thaw in summer and refreeze in winter.
Because the permafrost is impervious to water, it forces all water to remain and move above
it, resulting in a soggy ground which enables the plants to exist even in the driest part of the
Arctic.
Vegetation and its accumulated organic matter protect the permafrost by shading and
insulation, which reduce and retard the warming and thawing of the soil in the summer. Any
natural or human disturbance can cause the permafrost to melt, and if vegetation is removed,
thawing occurs. Permafrost chills the soil, retarding the general growth of both above ground
and below ground parts of the plants, limiting the activity of soil microrganisms and
impoverishing the aeration and nutrient content of the soil.
Alternating freezing and thawing of the upper layer of the soil create the unique
symmetrically patterned landforms so typical of the tundra. The action of frost pushes
material and stones upward and outward from the mass to form a patterned surface.

87
Solifluction is another movement, which forms terraces, through mass movement of super
saturated soil.
Alpine tundra has little permafrost, confined mostly to high elevations, but frost induced
processes such as solifluction terraces and stone polygons are present. The lack for permafrost
results in drier soils, only in alpine wet meadows and bogs of moisture conditions compare to
those of the Arctic. Precipitation (snowfall and humidity) is higher in the alpine regions than
in the arctic tundra, but steep topography induces a rapid runoff of water.
Structurally the vegetation of the tundra is simple. The number of species is few, the growth is
slow, and most of the biomass and functional activity are confined to relatively few groups.
Species, which survive, must have the ability to withstand constant disturbance of the soil,
buffeting by the wind, and abrasion from wind carried particles of soil and ice. Vegetation is
patchy; ground is low covered with cotton grass, dwarf heath, moss. Well-drained areas
support heath grass, herbs, mosses, and lichens. The driest and most exposed sites are usually
covered with coarse rocky material and subject to extreme action by frost, can support sparse
vegetation. Tropical alpine tundras support tussock grass, small leafed shrubs and heaths.
Primary production is low, low temperature, a short growing season ranging from 50 to 60
days in the high arctic to 160 days in the low latitude alpine tundra.
Eskimos lived in harmony with the arctic environment. Western culture has broken down the
traditional way of life and weakened the ecological relationship. Winter igloos and summer
tents have given way to permanent settlements with wooden houses, dog drawn sleigh have
been replaced with snowmobiles and harpoons and spears with rifles. These social and
cultural changes have affected the environment negatively. The oil industry with heavy
equipment, oil pipelines, oil spills have destroyed the plant cover allowing the permafrost to
melt, and resulting in soil subsidence and gulley erosion. Solid waste and sewage pollute
streams and surface waters and toxic chemicals drain into the arctic wetlands. Roads have
opened up the tundra to recreational developments ski trails and increased human activity
damage the soil and vegetation and animal life.
9.7. Aquatic Ecosystems
The physical factors that influence the distribution and abundance of aquatic communities
vary in space and time and are different from those that determine terrestrial communities.

88
They include temperature of water, which varies less on a daily, seasonal, and latitudinal basis
in aquatic environments than in terrestrial ones. Others are tidal cycles, which fluctuate
bimonthly with the phases of the moon, salinity and light. The division of aquatic systems is
into, marine ecosystems which include; oceans, inter-tidal zones and coral reefs, estuaries, salt
marshes and mangrove forests; and the fresh water communities which include: lakes and
ponds, freshwater wetlands and flowing water ecosystems.
9.8. Summary
The distribution of world vegetation into grasslands, forests and deserts is presented for the
tropical and temperate areas. The characteristics of this vegetation are presented as well as the
human impact on the original vegetation of the regions. The discussion is mainly on the
terrestrial ecosystems. Further reading on aquatic ecosystems is recommended.
9.9. Definition of key words
1. Savannah is the tropical grassland found in areas with marked seasonal drought and
composed with a great diversity of species. This ecosystem is of secondary origin,
derived from a pre-existing forest.
2. Veld is the temperate grassland found in southern Africa, as an adaptation to climatic
differentiation.
3. Tundra refers to the treeless plain of cold desert found in the northern hemisphere.
4. Biome is a type of ecosystem.
9.10. Revision Questions
1. Describe the characteristics and distribution of the tropical savannah in Africa and
evaluate their potentials and the constraints faced in their development.
2. Explain the human impact on the world vegetation types.
3. Discuss the factors that relationship between vegetation and climate using examples
from East Africa.
9.11. Further Reading
1. Muller; R.A. and Oberlander, T.M. 1984. Physical Geography Today: A portrait of a
Planet.
2. Neiwolt, S. 1977. Tropical Climatology, An Introduction to the climates of the Low
Latitudes, John Wiley and Sons Chichester

89
3. Oliver, J.E. and Hidore, J.J. (984. Climatology: An Introduction. Bell and Howell Co.
Toronto
4. Simmons, I. 1982. Biogeographical Processes, George Allen and Unwin
5. Strahler, A.H. and. Strahler, A.N. 1976. Elements of Physical Geography, John Wiley
and Sons Inc.
6. Strahler, A.N. 1975. Physical Geography John Wiley and Sons Inc.
7. Strahler, A.N. and Oberlander, T.M (1992) Modern Physical Geography, John Wiley
and Sons Inc.
8. Trewartha, G. T. 1968. Fundamentals of Physical Geography, McGraw-Hill Co.
9. Waters, G. and Odero, J. 1990. Geography of Kenya and the East African Region
10. Wilcock, D. 1983. Physical Geography, Black

90
LESSON 10. SOILS
10.1. Introduction
This topic introduces the learner to soil components and formation of soils, physical and
chemical properties of soils, soil regimes and types and classification of soils. The formation
of soils is described in terms of the interaction of several processes that include physical,
chemical and biological. The types and classification of soils is explained using the
climatological basis generally in tropical and temperate soils. In addition, the soil
conservation and management practices are described. Lastly, the linkages between climate,
vegetation and soils are provided.
10.2. The objectives
10.3. Formation of Soils
Soil forms the thin surface layer to the earth’s crust. It provides the foundation for plant and,
consequently, animal life on land. Soil results from the interrelationship between and
interaction of, several physical, chemical and biological processes all of which vary according
to different natural environments. The study of the soil, its origin, characteristics and
utilisation is known as pedology.
The first stage in the formation of soil the weathering of parent rock to give a layer of loose,
broken material known as regolith. Regolith may also be derived from the deposition of
alluvium, drift, loess and volcanic material. The second stage, the formation of true soil or
topsoil, results from the addition of water, gases (air), living organisms (biota) and decayed
By the end of the topic, the learner should be able to:
1. Explain the soil forming processes.
2. Describe the physical and chemical properties of soil.
3. Classify soils and account for the distribution of major soils types.

91
organic matter (humus). Five main factors are involved in soil formation namely parent rock,
climate, topography, organisms and time. These same factors affect the rate of weathering.
When a soil develops from an underlying rock, its supply of minerals is largely dependent on
the parent rock. These minerals are susceptible to different rates and processes of weathering.
Parent rock contributes to control of depth, texture, drainage or permeability and quality
(nutrient content) of a soil and also influences its colour.
Climate determines the type of soil at a global scale. The distribution and location of world
soils corresponds closely to patterns of climate and vegetation. Climate affects the rate of
parent rock weathering with the most rapid breakdown being in hot humid environments.
Precipitation affects the type of vegetation, which grows in an area, and this in turn provides
humus. In areas of heavy rainfall, the downward movement of water through the soil
transports mineral salts with it, a process known as leaching. Where rainfall is light or where
evaporation exceeds precipitation water and mineral salts are drawn upwards towards the
surface, a process known as capillary action. Leaching tends to produce acidic soils, while
capillary action results in alkaline soils. Temperatures determine the length of the growing
season and affect the supply of humus. Vegetation decays more quickly in hot, wet climates
as temperature further influences the activity and number of organisms and the rate of
evaporation.
10.4. Physical and chemical properties of soil
All soils contain mineral particles (inorganic material), humus (organic material), water, air
and living organisms. The actual amount of these components depends upon the type of soil.
The soil profile (Figure 10) is a vertical section through the soil showing its different
horizons. Most soil profiles consist of three layers, which are called horizons. These are A, B
and C. Horizon A consists of the soil proper, B is the subsoil and C is the solid rock. The top
part of A horizon is often rich in humus, and the texture of the soil becomes coarser as the C
horizon is approached.
When rainfall is greater than evaporation, water moves downwards in the soil and mineral
matter is removed from the top layer (A horizon) and is deposited in the layer beneath (B
horizon). Very often these deposits give rise to a hard layer, which is called a hard pan, and

92
this can cause drainage to be poor. When this takes place, in a soil the soil is referred to as
leached.
Figure 10: Idealised Soil Profile
10.5. Types and classification of soils
Climate plays the greatest part in the formation of soil, and any classification of soils
therefore tends to have a climatological basis. This means that each major soil type
corresponds with a specific type of climate. These types are called zonal soils. They generally
occur in extensive belts and they are mature soils.
10.5.1. Tropical Soils
a) Laterite
In hot wet regions leaching helps to produce a brown soil, which is known a laterite, also
referred to as murram in Kenya. In humid tropical regions soil water contains very little
organic matter, and such water does not dissolve iron and aluminium hydroxides. Most other
minerals however dissolve and these are carried in solution to B-horizon where they are
deposited. Ultimately a soil may be formed which is composed mainly of iron and aluminium
compounds. This is called laterite. This is usually red in colour and becomes extremely sticky

93
when wet. It is useful material for making bricks since it sets hard on drying. Because it is the
end product in the process of weathering, it is almost completely resistant to further
weathering and buildings made of it last a very long time. Some laterites are very rich in
aluminium compounds and are called bauxite. Bauxite deposits are usually white or grey in
colour. Hardpans also occur in laterites. Laterite can form from any type of rock.
In hot deserts and semi-desert regions there is an upward movement of water in the soil. This
results in the deposition of mineral matter in the A-horizon. The soils of the dry Savannah are
low in humus and generally shallow. They are usually heavily leached, that is the soluble
organic nutrients have been washed out of the soil. They may be high in sand, derived from
the insoluble quartz component of the underlying rock. The soils of woodland and wooded
grassland are moderately high in humus and of medium depth. They are often rich in iron and
aluminium oxides, which may form a surface crust or a layer of nodules below the surface
known as laterite or murram.
b) Tropical Red Soils/ Highland Soils
The natural vegetation in most of these areas was forest though much of it has now been
cleared for cultivation. The soils are relatively high in humus and rather deep except on very
steep slopes where they are shallow and rocky. They vary also according to altitude, above
about 2000 m; there are brown soils, rather shallow. Between 1500 and 2000 the soils are
deeper and more fertile. Especially fertile soils are formed on areas of young volcanic lavas,
for example, the red clay loam soils of Central Kenya and the highlands of northern Tanzania.
The red colour is due to a high content of oxidised iron and the soils are also rich in minerals
such as magnesium, calcium and potassium. These soils support the growing of coffee, tea
and other cash and food crops.
c) Tropical Desert Soils
These are “skeletal” soils, which are very shallow and low in organic material. These are
common in north eastern Kenya. Depending on parent material (the underlying rock) they
may be stony or sandy. In Marsabit District there are stony soils formed on young volcanic
lava plateau, in Wajir and Garissa there are sandy soils. These soils may contain layers or
nodules (lumps) of calcrete which is calcium carbonate deposited by the evaporation of
ground water. This is particularly common in areas of limestone rock such as in Mandera
District.

94
d) Tropical Black Soils
This type of soil develops in humid tropical regions, which have volcanic rocks. The soil is
rich in calcium carbonate and other minerals, and it is usually very sticky. The black clays are
known as ‘vertisols’ or black cotton soils and are particularly formed in areas of poor
drainage, i.e. on plains and plateaus. They are quite rich in nutrients and humus but are
difficult to cultivate because of their texture. During the dry season, they became very hard
and deep cracks form and during the rainy season they become very muddy and sticky.
10.5.2. Temperate Soils
a) Podzols
In cold wet regions leaching helps to produce a grey soil, which is known as a podzol.
b) Chernorzems (Black Soils)
These are probably the richest soils in the world. They form under a natural vegetation of
grass in the temperate latitudes and are rich in humus. This is because there is little leaching.
Most of the world's wheat is grown on these soils.
c) Temperate Brown Soils
These soils are typical of the areas with a natural vegetation of deciduous forest. The soils are
rich in humus, though since much of the forest has now been removed for agriculture,
manures have been applied to the soils to maintain the organic content.
d) Temperate Desert Soils
The soils of arid temperate regions have not been leached. They are therefore rich in plant
foods, and if irrigated, they are often very fertile. The soils are grey to brown in colour and
they occur chiefly in Russia and in western USA.
10.5.3. Other Soils
There are other soils, which are less influenced by climate than the zonal soils. These include
peat soils, alluvial soils, wind deposited soils and terra rosa. Peat soils form where drainage is
very poor, for instance in swamps such that vegetation does not properly decay. Alluvial soils
consist of a mixture of clay, sand and silt which has been deposited by water. Terra Rossa are
red soils, which form in limestone regions under semi arid conditions. Loess is a wind
deposited soil.

95
10.6. The soil catena
In hilly regions steep slope may influence soil development. The steepness of a slope may
cause weathered materials to slide down the valley bottom. On steep slopes without
vegetation, soil erosion is more rapid than on gentle slopes. For this reason, steep slopes tend
to have a thin layer of soil. In an area where the relief comprises alternating hills with steep
slopes and valleys, there will be a repetitive sequence of soil from the hilltop to the valley
bottom. In other words, thinner soils will be found on the steep slopes, while the valley-
bottoms will have deep soils. This sequence of soil in hilly areas is known as a catena.
10.7. Soil Conservation and Management
Soil erosion is frequently caused by human activities particularly those, which involve
removal of natural vegetation such as agriculture, grazing, logging and so on. So long as the
vegetation cover remains, it intercepts the raindrops and protects the surface from the impact
of the drops. The roots help to maintain an open porous soil, hence high infiltration capacity.
The physical presence of vegetation retards the flow of water leading to deposition of
sediment. Removal of vegetation cover can lead to serious effects immediately. The effects of
roots and organic matter can be maintained for longer periods. This though depends on
climate, especially temperatures; in hot regions have higher breakdown. Tropical soils are
very vulnerable to breakdown and subsequently overland flow. Soil conservation and
management measures usually have two aims: to improve infiltration and to reduce velocity
of flow of surface run off, to dispose of runoff, to prevent overland flow. There are three main
categories of measures for soil conservation and management namely: agronomic, soil
management and mechanical measures.
10.8. Climate, Vegetation and Soils
The linkage between climate, vegetation and soils best demonstrates the interaction and
interrelations between the atmosphere, biosphere and lithosphere. Vegetation that has evolved
in response to the average climatic conditions of a region as well as its occasional temperature
and moisture extremes is called natural vegetation. Energy availability is crucial in
determining natural vegetation at higher latitudes, whereas moisture supply is more important
at lower latitudes. In sub-humid climates grasslands are predominant, while in humid climates
the natural vegetation is usually forest. In polar and sub-arctic climates, where solar energy
input is more critical than moisture, the natural vegetation is tundra. Vegetation in widely

96
separated regions with similar climates has been known to evolve similar characteristics.
Therefore major vegetation regions of the world correspond to climatic regions of the world.
Similarly on a global scale, major soil types show a close relationship to climatic zones. The
energy and moisture delivered by the atmosphere influence many aspects of soil formation.
These include translocation, the rates of chemical reactions, and organic activity in the soil.
Abundant rainfall aids translocation, and warm and wet conditions favour chemical reactions
and organic activity. Both vegetative production and the activity of soil bacteria and other
larger organisms are curtailed in desert and tundra regions and enhanced in humid tropical
regions. In dry desert environment, both plant litter and soil organisms are minimal, and in the
tundra organic litter decays slowly, often forming acidic peat. Plant production is at a
maximum in the warm and wet tropics, but here the destruction of litter by organisms is so
rapid and thorough that the soil is actually poor in organic matter.
Climate affects the chemistry of soil moisture, which in turn affects the solubility of various
substances in the soil. For example iron can be removed only by acidic water. Soil water tends
to be acidic in cool wet areas, which are normally covered by coniferous forest. Therefore
iron is leached from the topsoil profiles in such areas. In dry regions lime leached from the
upper portion of the soil is re-deposited at a lower level where the moisture evaporates rather
than moving through the water table.
Many soils contain features formed thousand of years ago under different environmental
conditions. Such remnant features are important indicators of past climates and vegetation,
and have given evidence of shifts in climatic boundaries. Soils also reflect expansion and
contraction of the world’s deserts, as well as less severe climatic fluctuations in nearly all
parts of the world.
In Kenya regions of moderate temperatures and high rainfall such as western, central rift,
central region and coastal strip are endowed with fertile soils and natural forests. They are
therefore the most agriculturally productive regions of the country. Most of the remaining
parts of the country are arid and semi-arid having poor soils, scanty vegetation, and mainly
utilised for pastoralism.

97
10.9. Summary
The formation of soil, its properties and types are discussed in this lesson. The classification
of the soils in the tropical and temperate regions is also presented. The soil conservation and
management has been mentioned. Finally, the linkage between climate vegetation and soils
best demonstrates the interaction and interrelations between the atmosphere, biosphere and
lithosphere.
10.10. Definition of key words
1. Pedology is the study of soil, their origin, characteristics and utilisation.
2. Leaching is the downward movement of water through the soil together with mineral
salts in areas of heavy rainfall.
3. Capillary action is a process in which mineral salts are drawn upwards towards the
surface. It occurs where rainfall is light or evaporation exceeds precipitation.
4. Soil Profile describes a vertical section through the soils showing its different
horizons.
10.11. Revision Questions
1. Describe the composition and formation of soil
2. Diagrammatically describe and ideal soil profile. What factors influence the
development of a soil profile?
3. Describe the soil conservation and management measures used by farmers in your
home district.
10.12. Further Reading
1. Strahler, A.H. and. Strahler, A.N. 1976. Elements of Physical Geography, John Wiley
and Sons Inc.
2. Muller; R.A. and Oberlander, T.M. 1984. Physical Geography Today: A portrait of a
Planet.
3. Neiwolt, S. 1977. Tropical Climatology, An Introduction to the climates of the Low
Latitudes, John Wiley and Sons Chichester
4. Oliver, J.E. and Hidore, J.J. 1984. Climatology: An Introduction. Bell and Howell Co.
Toronto
5. Strahler, A.N. 1975. Physical Geography John Wiley and Sons Inc.

98
6. Strahler, A.N. and Oberlander, T.M. 1992. Modern Physical Geography, John Wiley
and Sons Inc.
7. Strahler, A.H. and. Strahler, A.N. 1976. Elements of Physical Geography, John Wiley
and Sons Inc.
8. Trewartha, G. T. 1968. Fundamentals of Physical Geography, McGraw-Hill Co.
9. Wilcock, D. 1983. Physical Geography, Black