Embed Size (px)
Citation preview
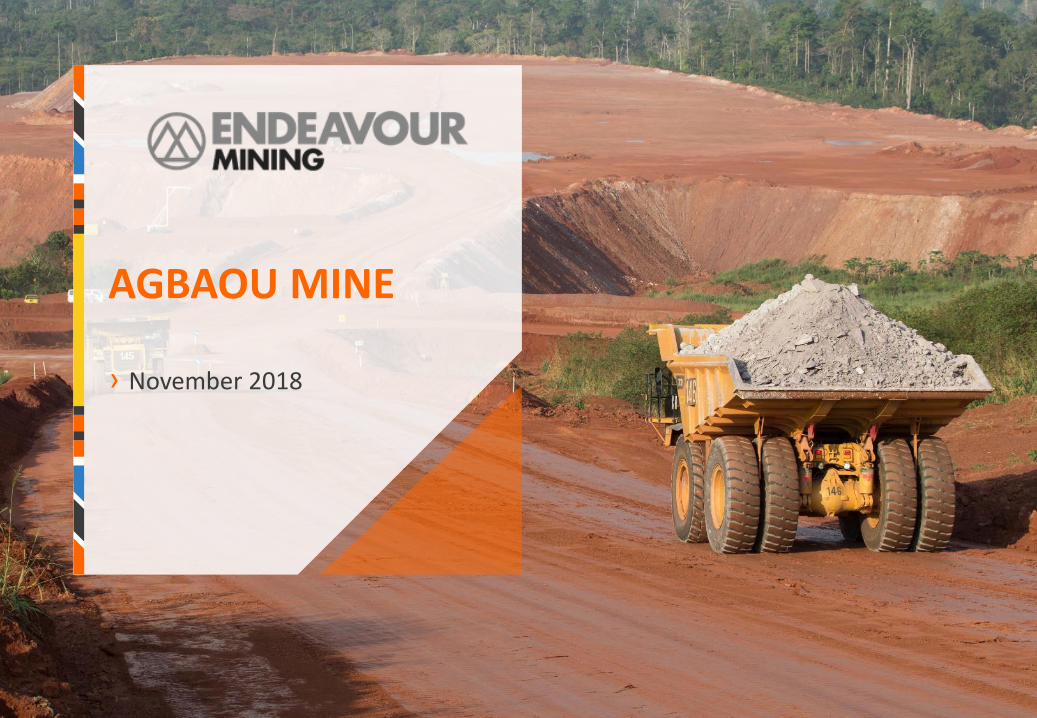
AGBAOU MINE
› November 2018
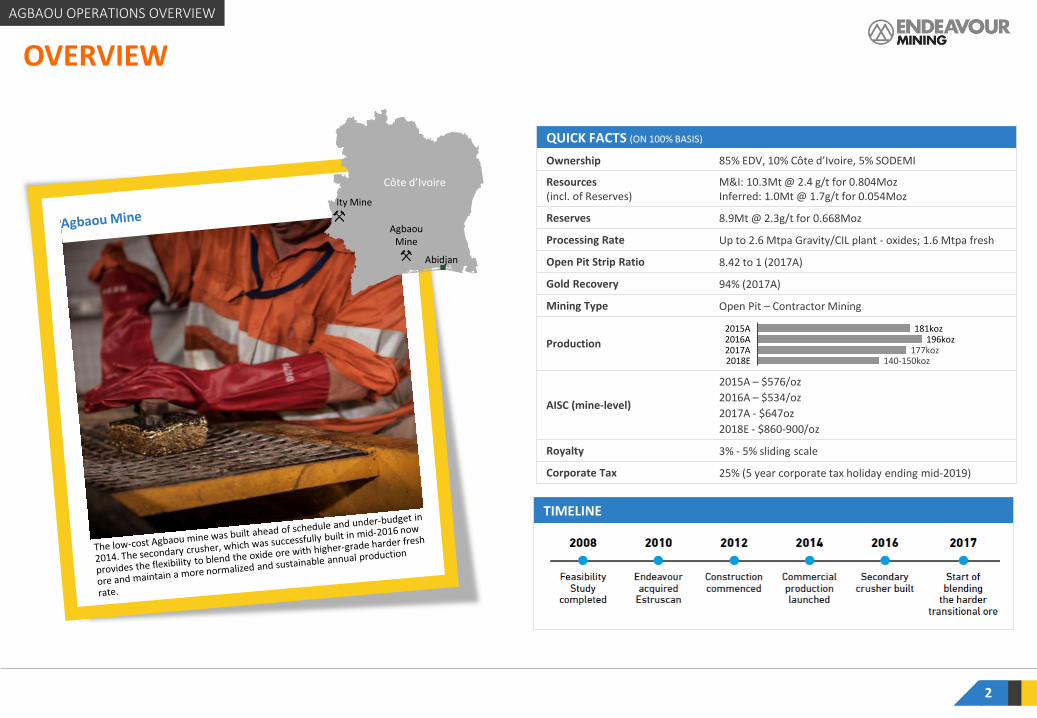
OVERVIEW
QUICK FACTS (ON 100% BASIS)
Ownership 85% EDV, 10% Côte d’Ivoire, 5% SODEMI
Resources(incl. of Reserves)
M&I: 10.3Mt @ 2.4 g/t for 0.804MozInferred: 1.0Mt @ 1.7g/t for 0.054Moz
Reserves 8.9Mt @ 2.3g/t for 0.668Moz
Processing Rate Up to 2.6 Mtpa Gravity/CIL plant - oxides; 1.6 Mtpa fresh
Open Pit Strip Ratio 8.42 to 1 (2017A)
Gold Recovery 94% (2017A)
Mining Type Open Pit – Contractor Mining
Production
AISC (mine-level)
2015A – $576/oz
2016A – $534/oz
2017A - $647oz
2018E - $860-900/oz
Royalty 3% - 5% sliding scale
Corporate Tax 25% (5 year corporate tax holiday ending mid-2019)
177koz2016A
181koz2015A
140-150koz
196koz2017A2018E
2
Agbaou Mine
Abidjan
Ity Mine
Côte d’Ivoire
TIMELINE
AGBAOU OPERATIONS OVERVIEW
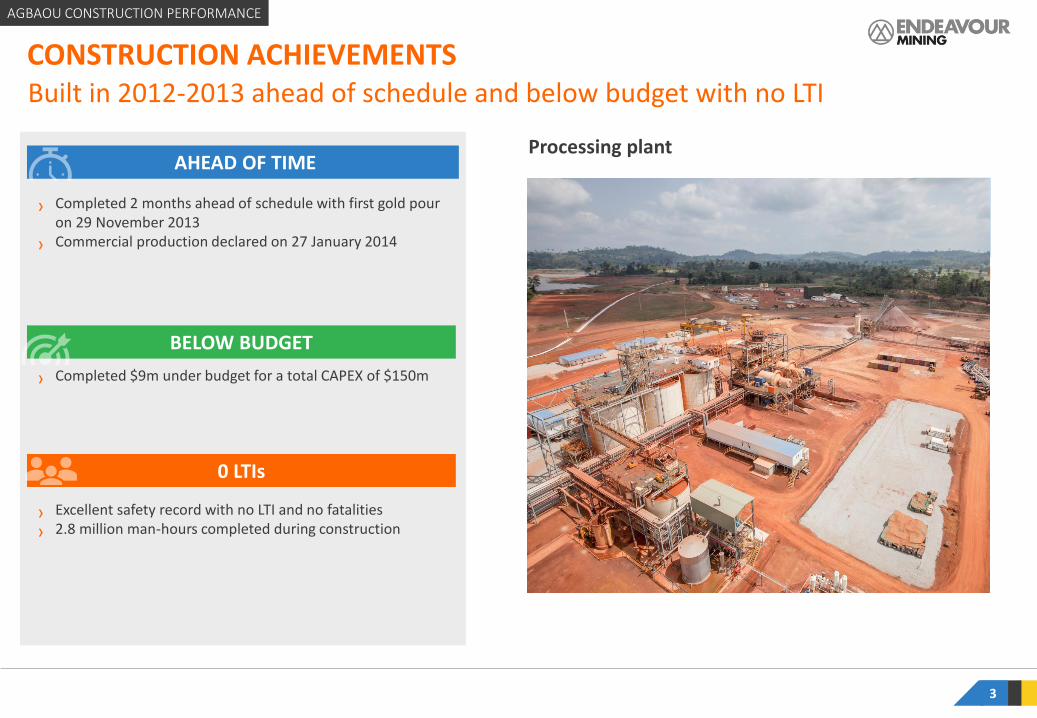
› Completed 2 months ahead of schedule with first gold pour on 29 November 2013
› Commercial production declared on 27 January 2014
› Completed $9m under budget for a total CAPEX of $150m
› Excellent safety record with no LTI and no fatalities
› 2.8 million man-hours completed during construction
3
Built in 2012-2013 ahead of schedule and below budget with no LTI
CONSTRUCTION ACHIEVEMENTS
AHEAD OF TIME
0 LTIs
BELOW BUDGET
Processing plant
AGBAOU CONSTRUCTION PERFORMANCE
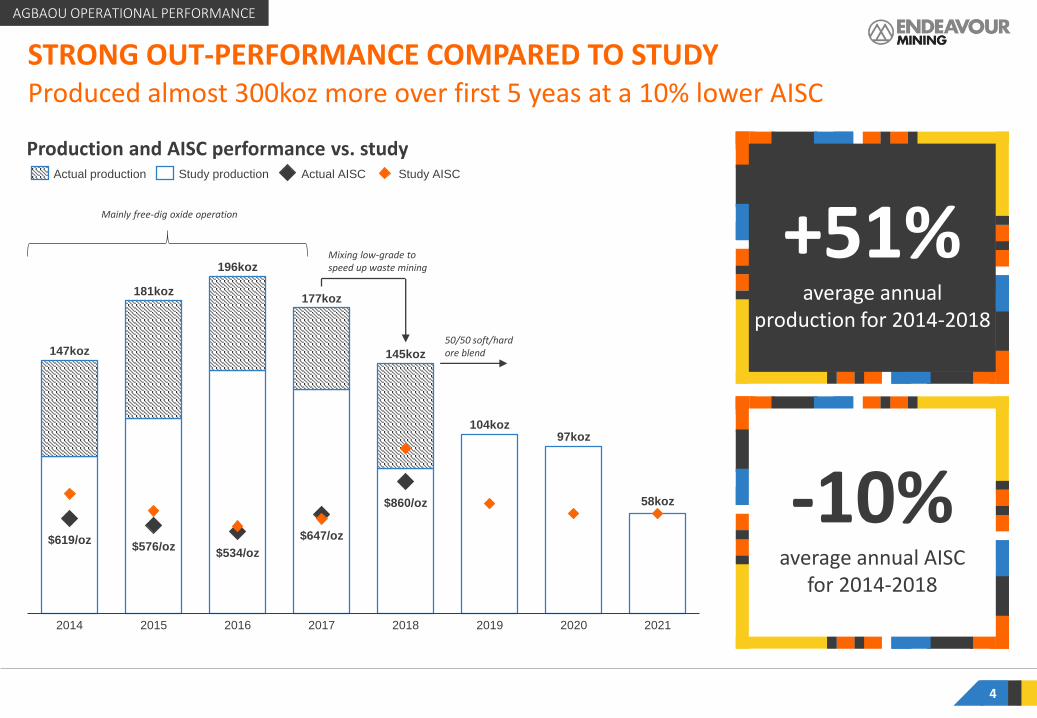
Production and AISC performance vs. study
STRONG OUT-PERFORMANCE COMPARED TO STUDY
4
+51%average annual
production for 2014-2018
-10%average annual AISC
for 2014-2018
Produced almost 300koz more over first 5 yeas at a 10% lower AISC
104koz97koz
58koz
$619/oz$576/oz
$534/oz
$647/oz
$860/oz
20212014 2017 20202015 2016 20192018
147koz
181koz
196koz
177koz
145koz
Actual production Study production Actual AISC Study AISC
Mixing low-grade to speed up waste mining
50/50 soft/hard ore blend
Mainly free-dig oxide operation
AGBAOU OPERATIONAL PERFORMANCE
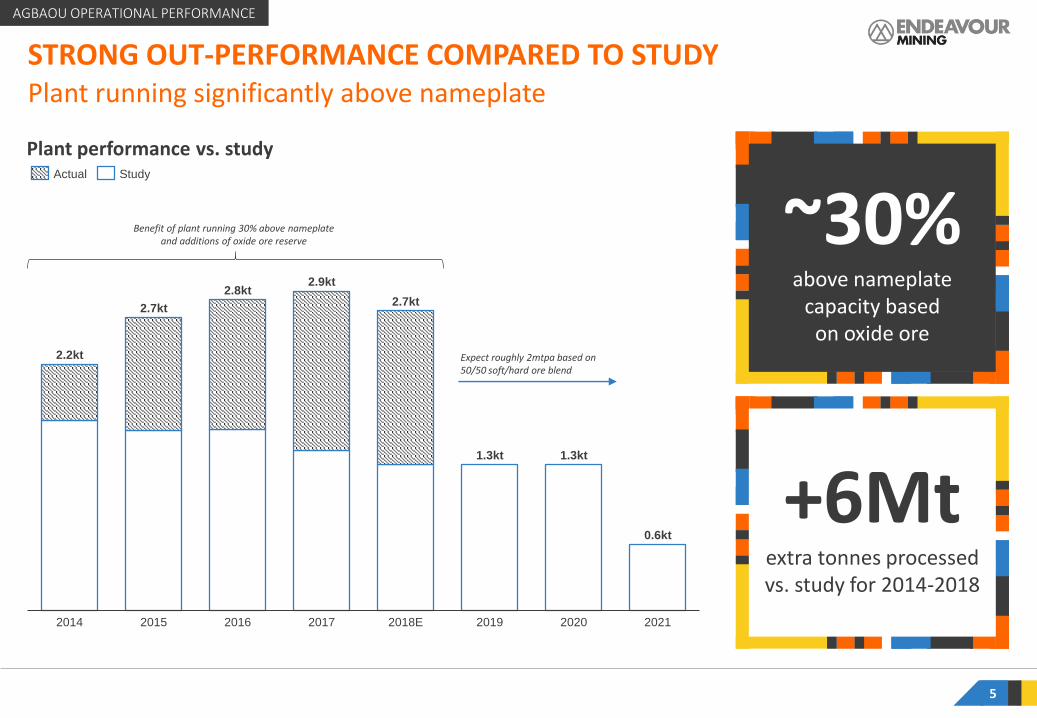
Plant performance vs. study
STRONG OUT-PERFORMANCE COMPARED TO STUDY
5
~30%above nameplate
capacity based on oxide ore
+6Mtextra tonnes processed vs. study for 2014-2018
Plant running significantly above nameplate
1.3kt 1.3kt
0.6kt
202120202014 2015 2018E2016 2017 2019
2.2kt
2.7kt
2.8kt2.9kt
2.7kt
Actual Study
Expect roughly 2mtpa based on 50/50 soft/hard ore blend
Benefit of plant running 30% above nameplate and additions of oxide ore reserve
AGBAOU OPERATIONAL PERFORMANCE
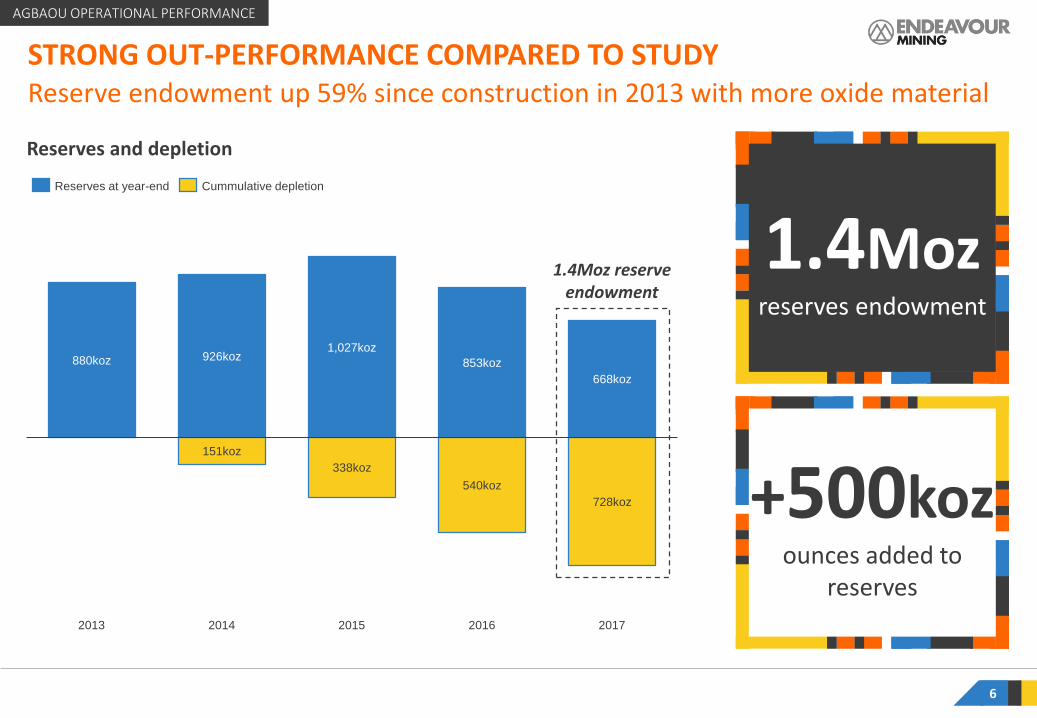
Reserves and depletion
STRONG OUT-PERFORMANCE COMPARED TO STUDY
6
1.4Mozreserves endowment
+500kozounces added to
reserves
Reserve endowment up 59% since construction in 2013 with more oxide material
880koz 926koz1,027koz
853koz
668koz
151koz
338koz
540koz
728koz
20142013 20162015 2017
Reserves at year-end Cummulative depletion
1.4Moz reserve endowment
AGBAOU OPERATIONAL PERFORMANCE
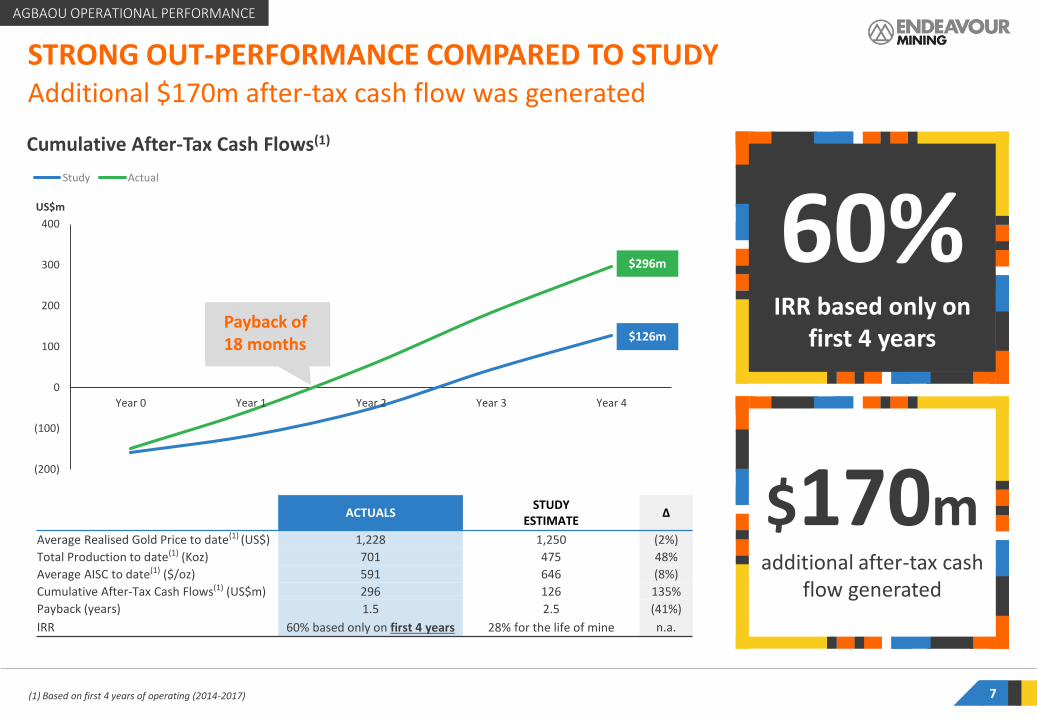
(1) Based on first 4 years of operating (2014-2017) 7
60%IRR based only on
first 4 years
$170madditional after-tax cash
flow generated
Additional $170m after-tax cash flow was generated
STRONG OUT-PERFORMANCE COMPARED TO STUDY
Cumulative After-Tax Cash Flows(1)
(200)
(100)
0
100
200
300
400
Year 0 Year 1 Year 2 Year 3 Year 4
US$m
Study Actual
$296m
$126m
ACTUALS STUDY
ESTIMATEΔ
Average Realised Gold Price to date(1) (US$) 1,228 1,250 (2%)
Total Production to date(1) (Koz) 701 475 48%
Average AISC to date(1) ($/oz) 591 646 (8%)
Cumulative After-Tax Cash Flows(1) (US$m) 296 126 135%
Payback (years) 1.5 2.5 (41%)
IRR 60% based only on first 4 years 28% for the life of mine n.a.
AGBAOU OPERATIONAL PERFORMANCE
Payback of 18 months
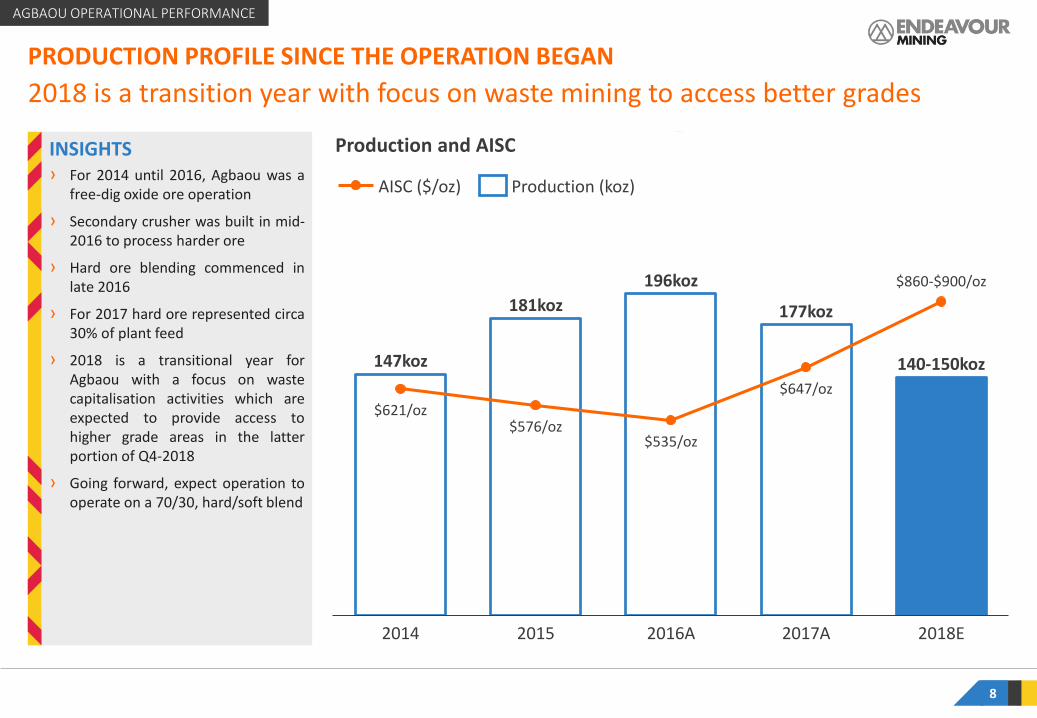
PRODUCTION PROFILE SINCE THE OPERATION BEGAN
8
2018 is a transition year with focus on waste mining to access better grades
INSIGHTS› For 2014 until 2016, Agbaou was a
free-dig oxide ore operation
› Secondary crusher was built in mid-2016 to process harder ore
› Hard ore blending commenced inlate 2016
› For 2017 hard ore represented circa30% of plant feed
› 2018 is a transitional year forAgbaou with a focus on wastecapitalisation activities which areexpected to provide access tohigher grade areas in the latterportion of Q4-2018
› Going forward, expect operation tooperate on a 70/30, hard/soft blend
147koz
181koz
196koz
$621/oz$576/oz
$535/oz
2016A2014 2017A 2018E2015
177koz
$647/oz
140-150koz
$860-$900/oz
AISC ($/oz) Production (koz)
Production and AISC
AGBAOU OPERATIONAL PERFORMANCE
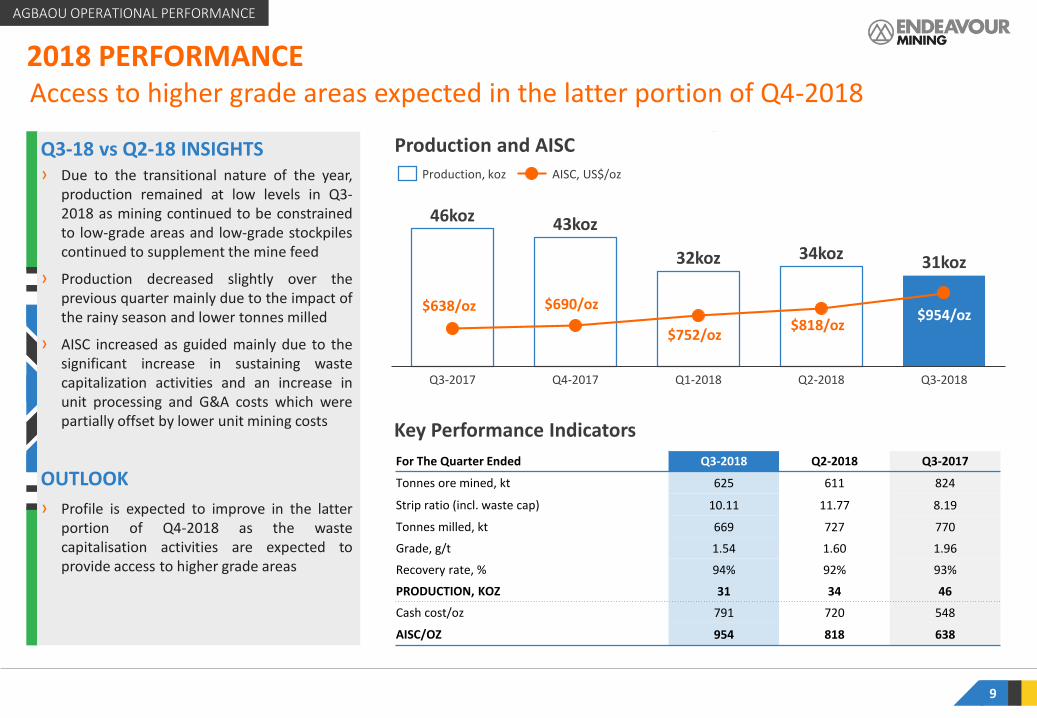
Production and AISCQ3-18 vs Q2-18 INSIGHTS› Due to the transitional nature of the year,
production remained at low levels in Q3-2018 as mining continued to be constrainedto low-grade areas and low-grade stockpilescontinued to supplement the mine feed
› Production decreased slightly over theprevious quarter mainly due to the impact ofthe rainy season and lower tonnes milled
› AISC increased as guided mainly due to thesignificant increase in sustaining wastecapitalization activities and an increase inunit processing and G&A costs which werepartially offset by lower unit mining costs
OUTLOOK
› Profile is expected to improve in the latterportion of Q4-2018 as the wastecapitalisation activities are expected toprovide access to higher grade areas
9
Q1-2018 Q3-2018Q3-2017 Q4-2017 Q2-2018
46koz
32koz
43koz
34koz 31koz
AISC, US$/ozProduction, koz
$638/oz $690/oz
$752/oz$818/oz
For The Quarter Ended Q3-2018 Q2-2018 Q3-2017
Tonnes ore mined, kt 625 611 824
Strip ratio (incl. waste cap) 10.11 11.77 8.19
Tonnes milled, kt 669 727 770
Grade, g/t 1.54 1.60 1.96
Recovery rate, % 94% 92% 93%
PRODUCTION, KOZ 31 34 46
Cash cost/oz 791 720 548
AISC/OZ 954 818 638
$954/oz
Key Performance Indicators
Access to higher grade areas expected in the latter portion of Q4-20182018 PERFORMANCE
AGBAOU OPERATIONAL PERFORMANCE
INSIGHTS
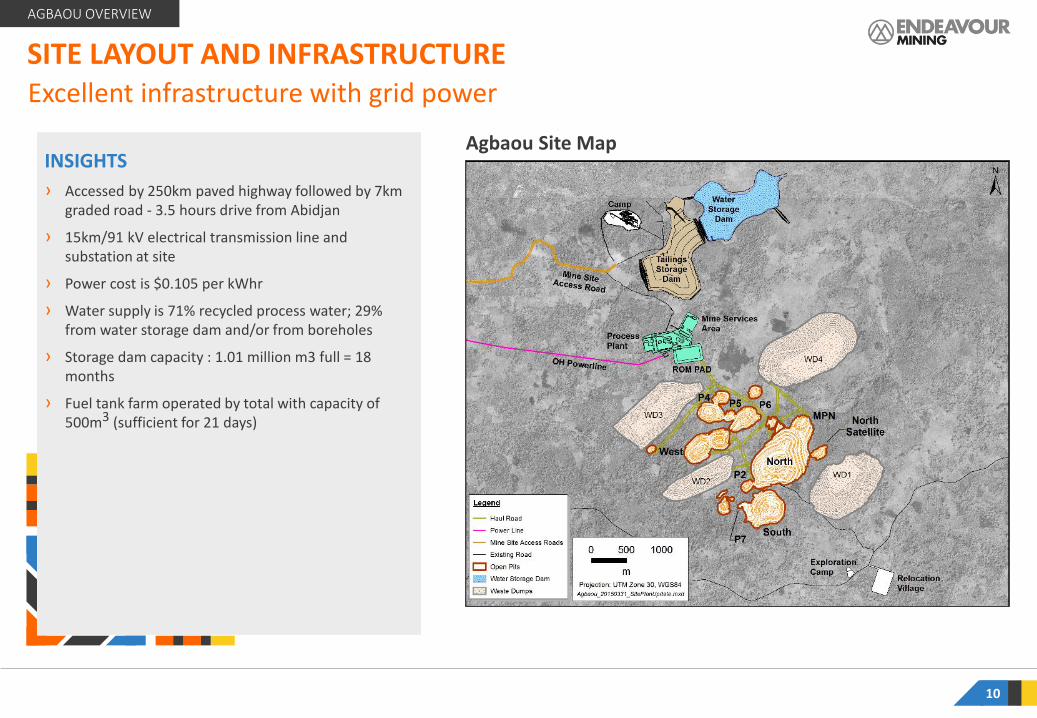
› Accessed by 250km paved highway followed by 7km graded road - 3.5 hours drive from Abidjan
› 15km/91 kV electrical transmission line and substation at site
› Power cost is $0.105 per kWhr
› Water supply is 71% recycled process water; 29% from water storage dam and/or from boreholes
› Storage dam capacity : 1.01 million m3 full = 18 months
› Fuel tank farm operated by total with capacity of 500m3 (sufficient for 21 days)
SITE LAYOUT AND INFRASTRUCTURE
10
Excellent infrastructure with grid power
Agbaou Site Map
AGBAOU OVERVIEW
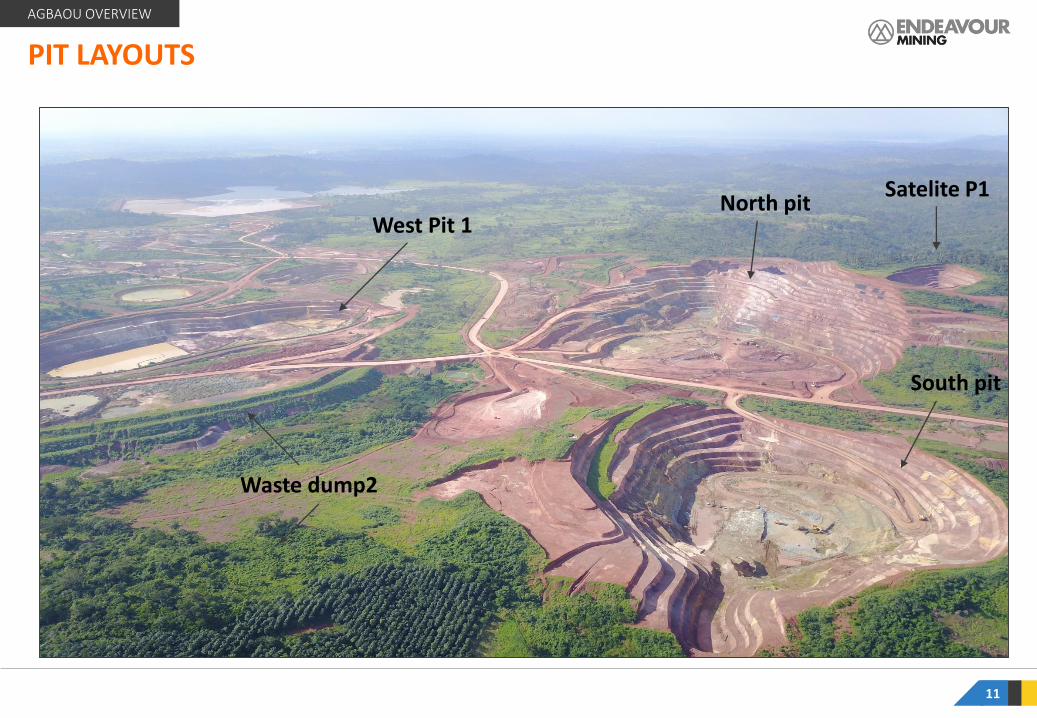
PIT LAYOUTS
Satelite P1North pit
Waste dump2
West Pit 1
South pit
11
AGBAOU OVERVIEW
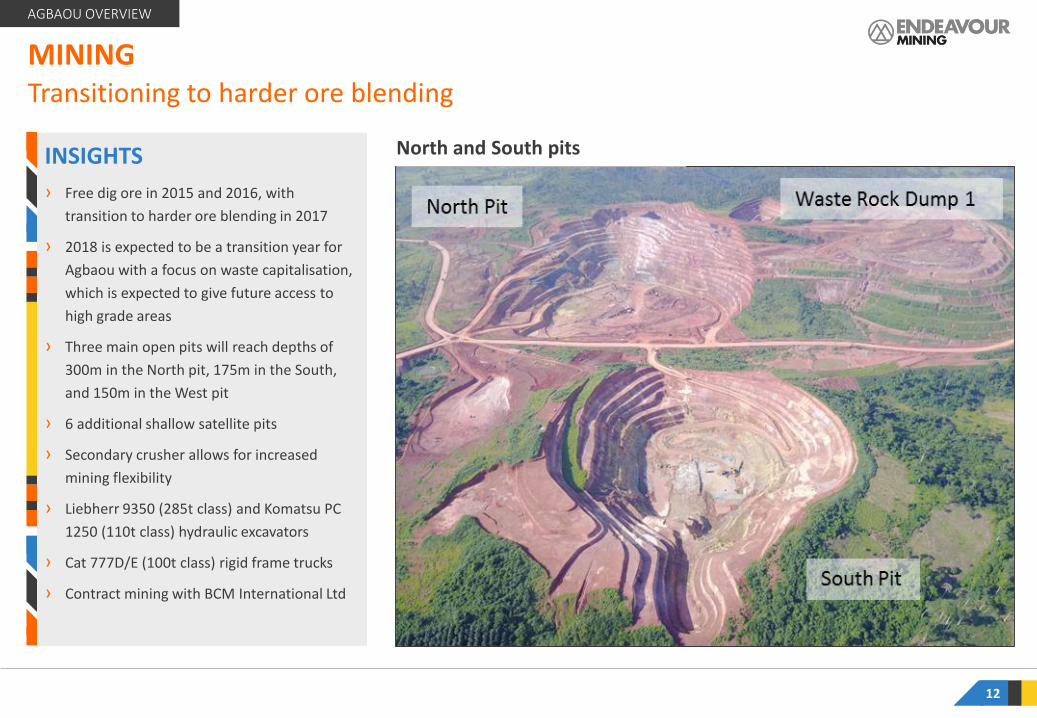
INSIGHTS
› Free dig ore in 2015 and 2016, with
transition to harder ore blending in 2017
› 2018 is expected to be a transition year for
Agbaou with a focus on waste capitalisation,
which is expected to give future access to
high grade areas
› Three main open pits will reach depths of
300m in the North pit, 175m in the South,
and 150m in the West pit
› 6 additional shallow satellite pits
› Secondary crusher allows for increased
mining flexibility
› Liebherr 9350 (285t class) and Komatsu PC
1250 (110t class) hydraulic excavators
› Cat 777D/E (100t class) rigid frame trucks
› Contract mining with BCM International Ltd
MINING
12
Transitioning to harder ore blending
North and South pits
AGBAOU OVERVIEW
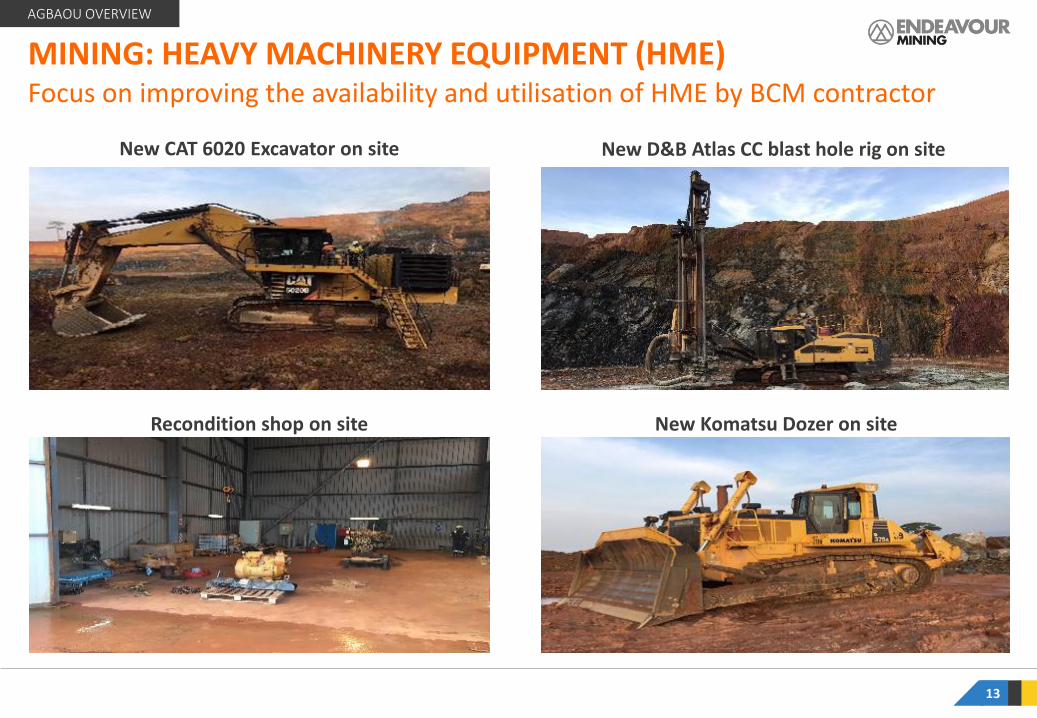
New CAT 6020 Excavator on site New D&B Atlas CC blast hole rig on site
Recondition shop on site New Komatsu Dozer on site
MINING: HEAVY MACHINERY EQUIPMENT (HME)Focus on improving the availability and utilisation of HME by BCM contractor
13
AGBAOU OVERVIEW
INSIGHTS
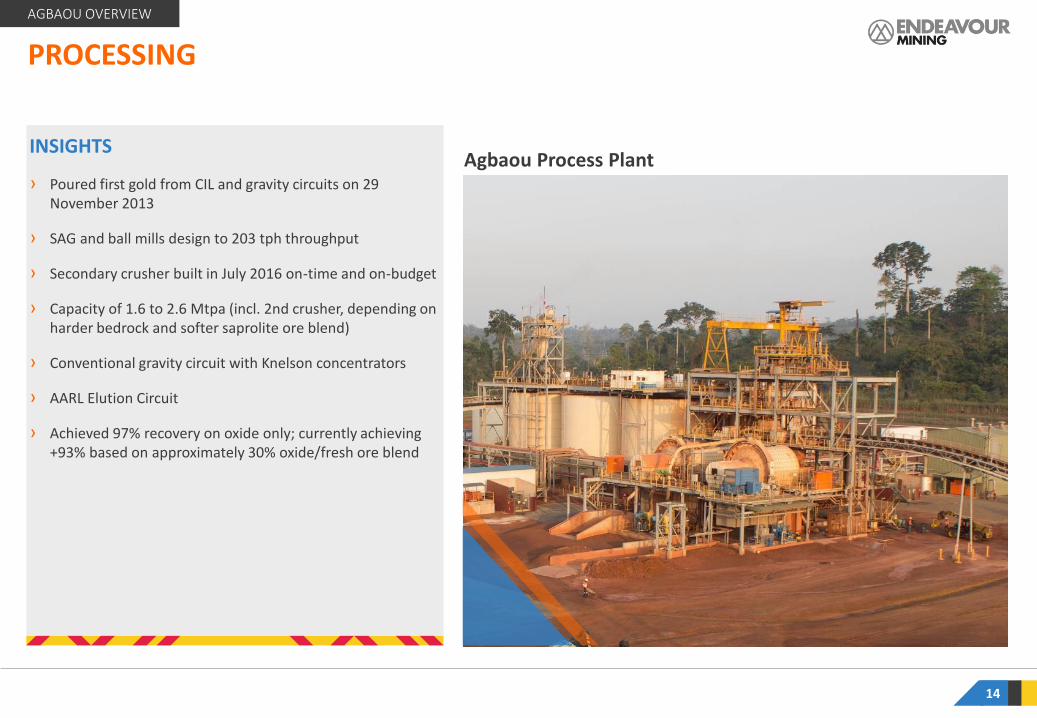
› Poured first gold from CIL and gravity circuits on 29 November 2013
› SAG and ball mills design to 203 tph throughput
› Secondary crusher built in July 2016 on-time and on-budget
› Capacity of 1.6 to 2.6 Mtpa (incl. 2nd crusher, depending on harder bedrock and softer saprolite ore blend)
› Conventional gravity circuit with Knelson concentrators
› AARL Elution Circuit
› Achieved 97% recovery on oxide only; currently achieving +93% based on approximately 30% oxide/fresh ore blend
PROCESSING
14
Agbaou Process Plant
AGBAOU OVERVIEW
PROCESSING
15
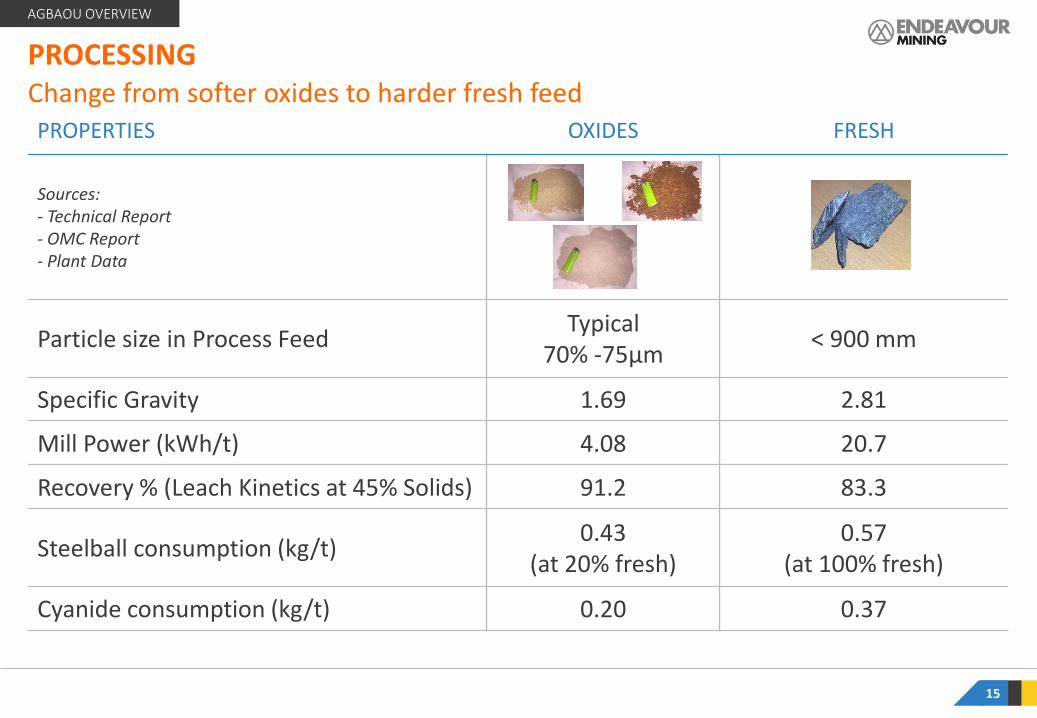
Change from softer oxides to harder fresh feedPROPERTIES OXIDES FRESH
Sources:- Technical Report - OMC Report- Plant Data
Particle size in Process FeedTypical
70% -75µm< 900 mm
Specific Gravity 1.69 2.81
Mill Power (kWh/t) 4.08 20.7
Recovery % (Leach Kinetics at 45% Solids) 91.2 83.3
Steelball consumption (kg/t)0.43
(at 20% fresh)0.57
(at 100% fresh)
Cyanide consumption (kg/t) 0.20 0.37
AGBAOU OVERVIEW
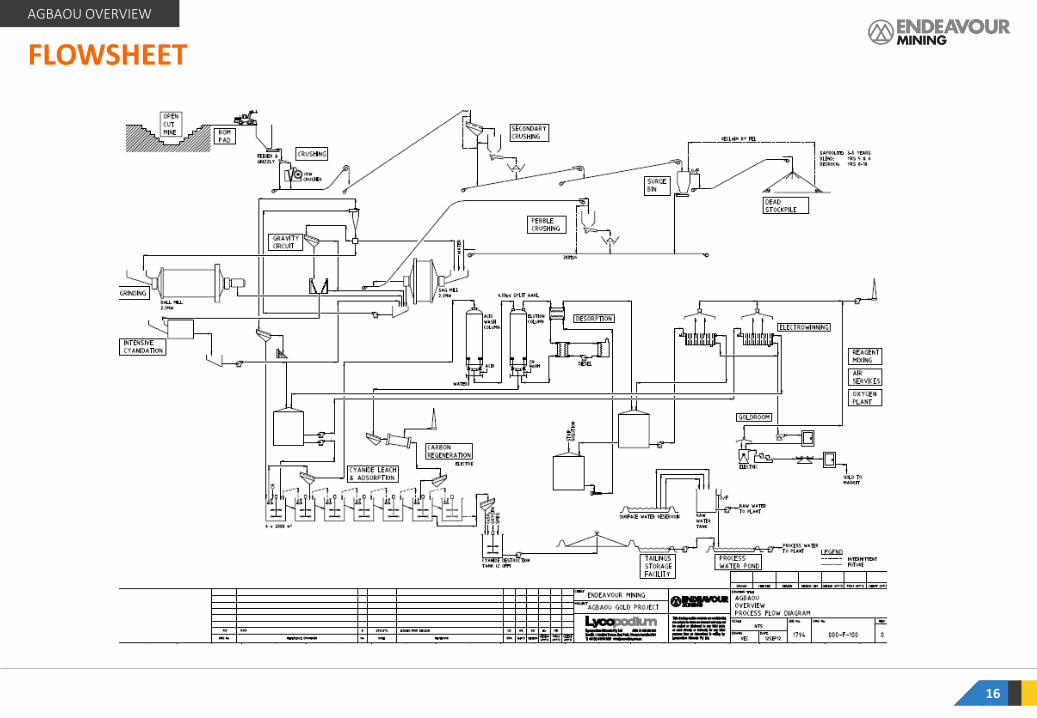
FLOWSHEET
16
AGBAOU OVERVIEW
17
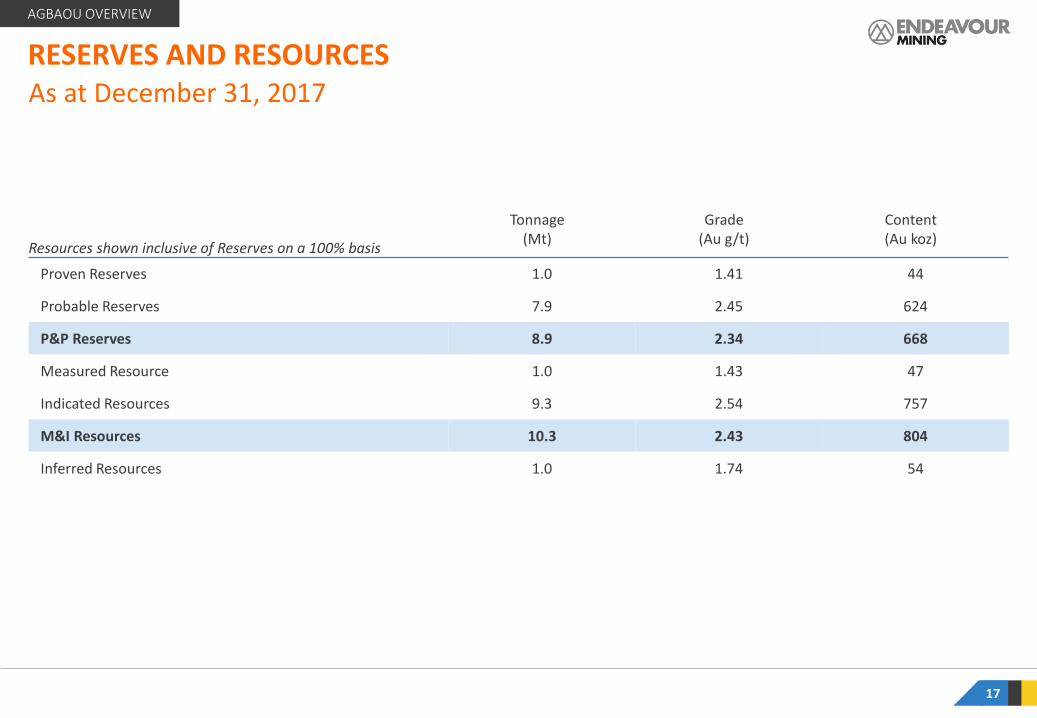
RESERVES AND RESOURCESAs at December 31, 2017
Resources shown inclusive of Reserves on a 100% basis
Tonnage (Mt)
Grade (Au g/t)
Content (Au koz)
Proven Reserves 1.0 1.41 44
Probable Reserves 7.9 2.45 624
P&P Reserves 8.9 2.34 668
Measured Resource 1.0 1.43 47
Indicated Resources 9.3 2.54 757
M&I Resources 10.3 2.43 804
Inferred Resources 1.0 1.74 54
AGBAOU OVERVIEW
AGBAOU EXPLORATION
18
19
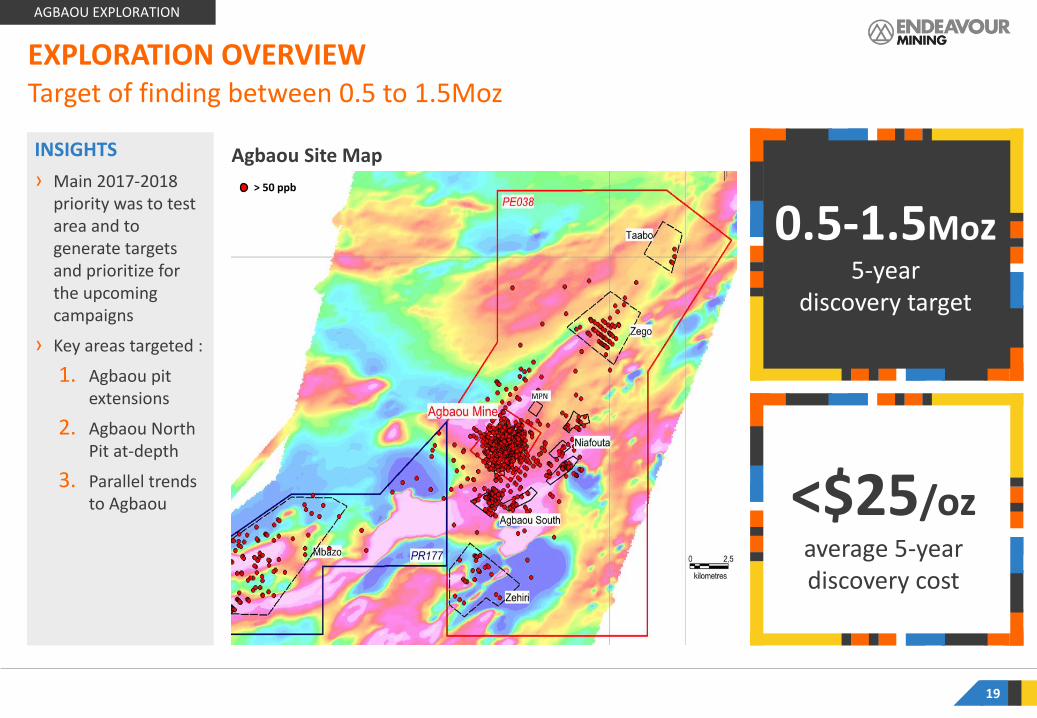
EXPLORATION OVERVIEWTarget of finding between 0.5 to 1.5Moz
Agbaou Site Map
AGBAOU EXPLORATION
INSIGHTS
› Main 2017-2018 priority was to test area and to generate targets and prioritize for the upcoming campaigns
› Key areas targeted :
1. Agbaou pit extensions
2. Agbaou North Pit at-depth
3. Parallel trends to Agbaou
0.5-1.5Moz5-year
discovery target
<$25/ozaverage 5-year discovery cost
> 50 ppb
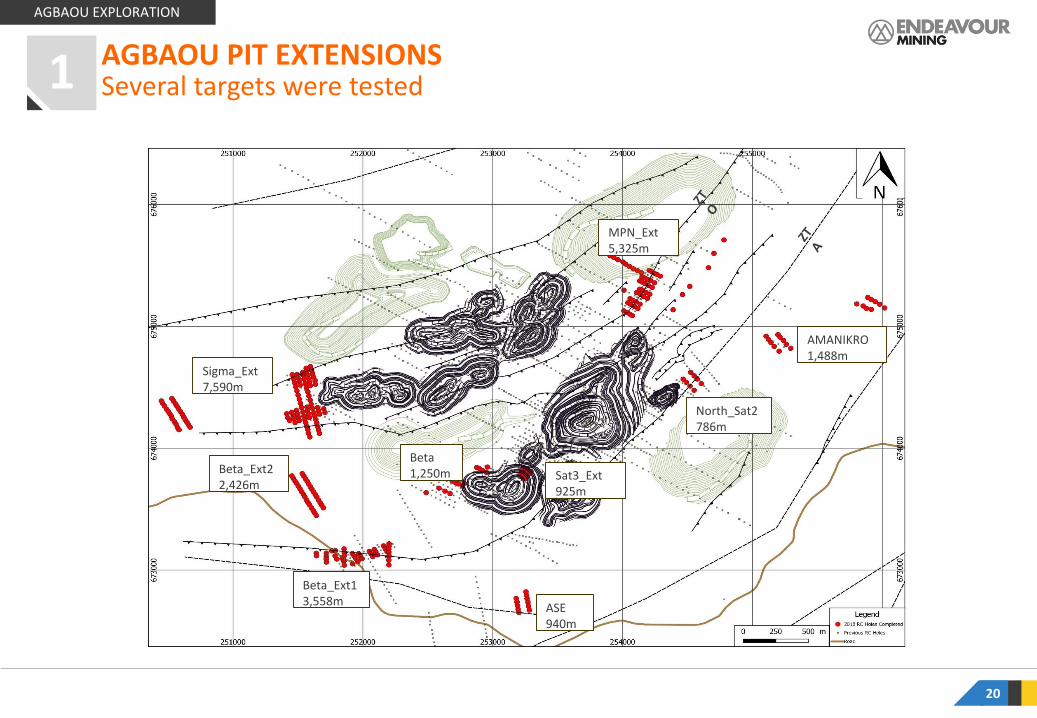
Several targets were tested
20
AGBAOU PIT EXTENSIONS
North Pit – Looking N
MPN_Ext5,325m
ASE940m
Beta_Ext22,426m
Sat3_Ext925m
Beta1,250m
North_Sat2786m
Beta_Ext13,558m
AMANIKRO1,488m
Sigma_Ext 7,590m
AGBAOU EXPLORATION
1
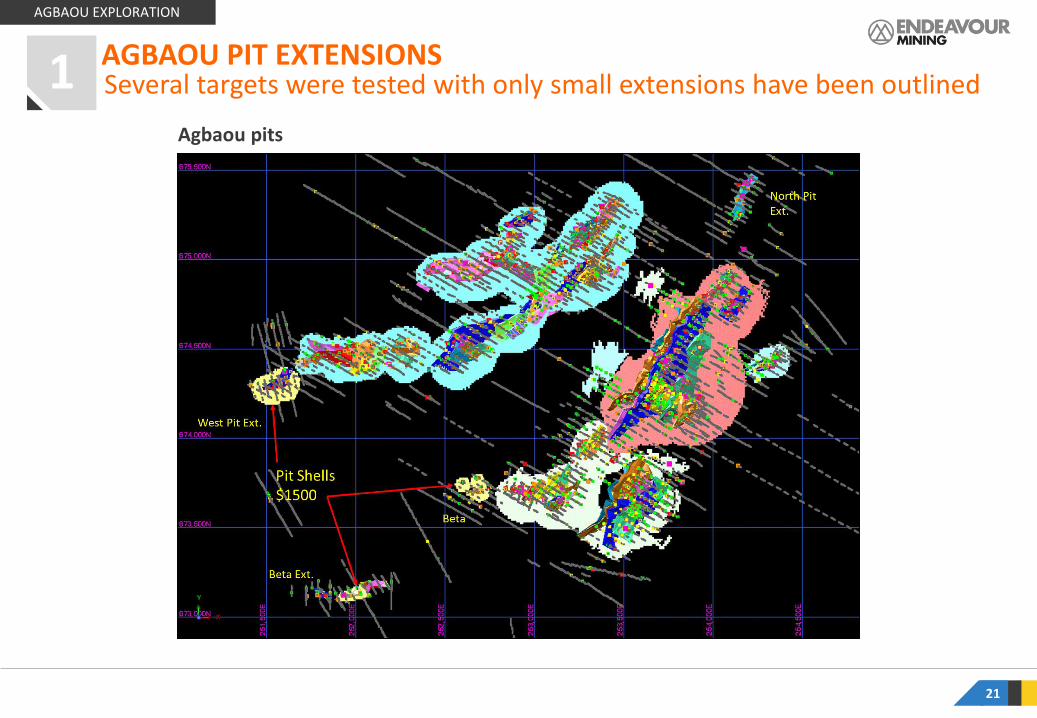
Several targets were tested with only small extensions have been outlined
21
AGBAOU PIT EXTENSIONS
Agbaou pits
AGBAOU EXPLORATION
1 1
22
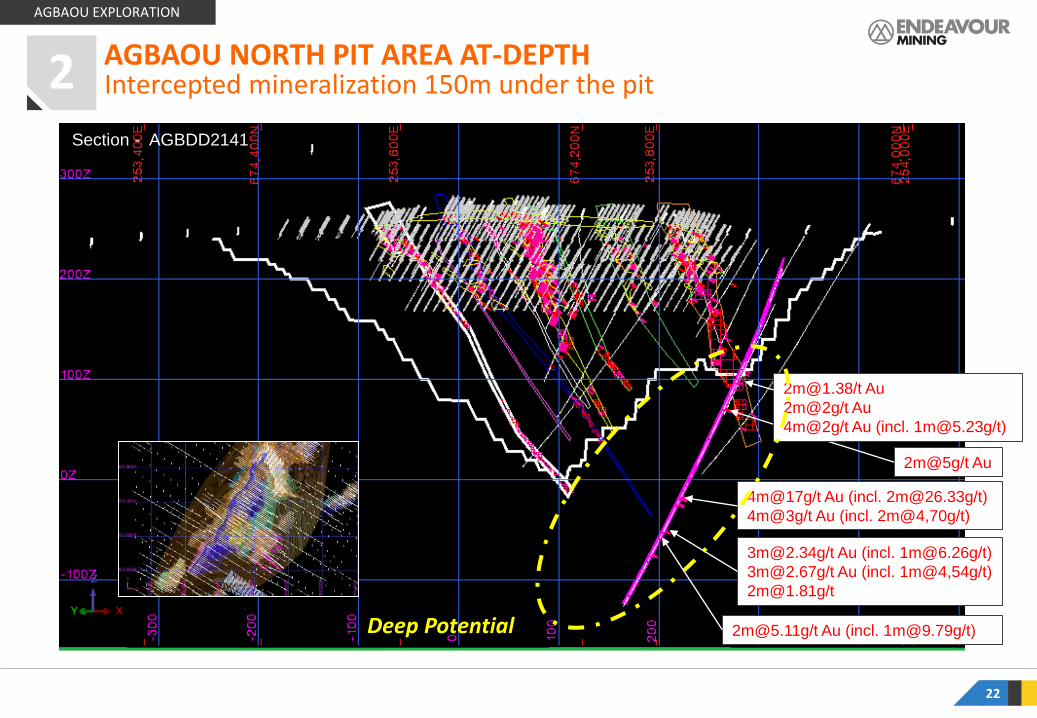
Intercepted mineralization 150m under the pitAGBAOU NORTH PIT AREA AT-DEPTH
AGBAOU EXPLORATION
2
2m@5g/t Au
4m@17g/t Au (incl. [email protected]/t)
4m@3g/t Au (incl. 2m@4,70g/t)
[email protected]/t Au (incl. [email protected]/t)
[email protected]/t Au (incl. [email protected]/t)
[email protected]/t Au (incl. 1m@4,54g/t)
[email protected]/t Au
2m@2g/t Au
4m@2g/t Au (incl. [email protected]/t)
Deep Potential
Section - AGBDD2141
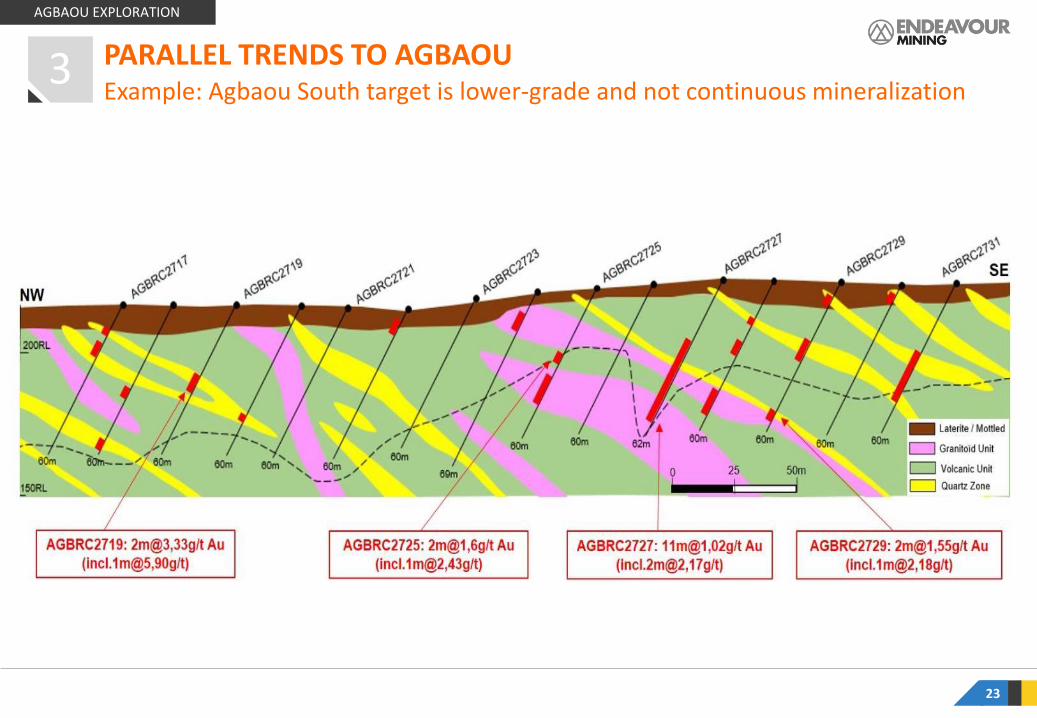
Example: Agbaou South target is lower-grade and not continuous mineralization
PARALLEL TRENDS TO AGBAOU
23
3
AGBAOU EXPLORATION
SUSTAINABILITY AT AGBAOU
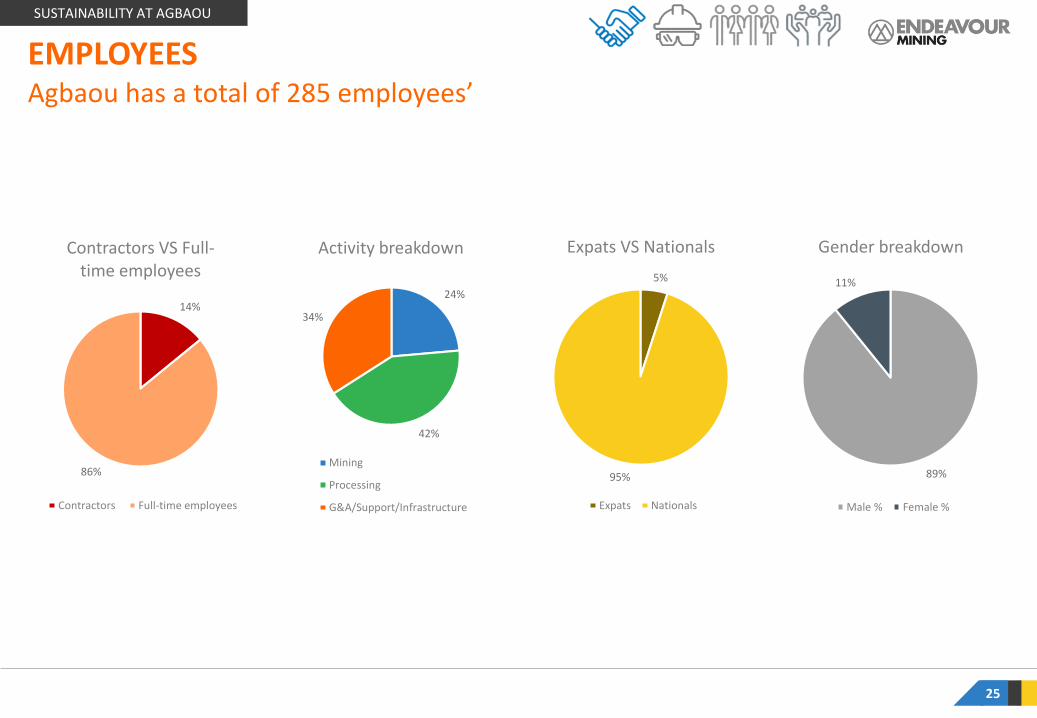
89%
11%
Gender breakdown
Male % Female %
14%
86%
Contractors VS Full-time employees
Contractors Full-time employees
24%
42%
34%
Activity breakdown
Mining
Processing
G&A/Support/Infrastructure
5%
95%
Expats VS Nationals
Expats Nationals
25
SUSTAINABILITY AT AGBAOU
EMPLOYEESAgbaou has a total of 285 employees’
26
SUSTAINABILITY AT AGBAOU
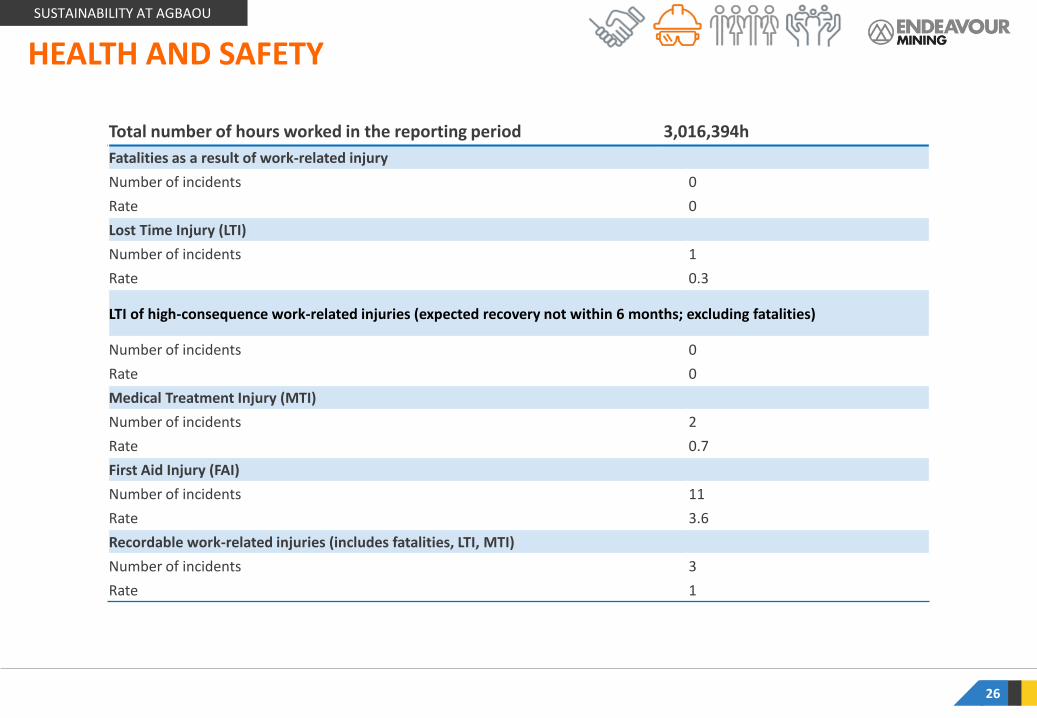
HEALTH AND SAFETY
Total number of hours worked in the reporting period 3,016,394h
Fatalities as a result of work-related injury
Number of incidents 0
Rate 0
Lost Time Injury (LTI)
Number of incidents 1
Rate 0.3
LTI of high-consequence work-related injuries (expected recovery not within 6 months; excluding fatalities)
Number of incidents 0
Rate 0
Medical Treatment Injury (MTI)
Number of incidents 2
Rate 0.7
First Aid Injury (FAI)
Number of incidents 11
Rate 3.6
Recordable work-related injuries (includes fatalities, LTI, MTI)
Number of incidents 3
Rate 1
27
SUSTAINABILITY AT AGBAOU
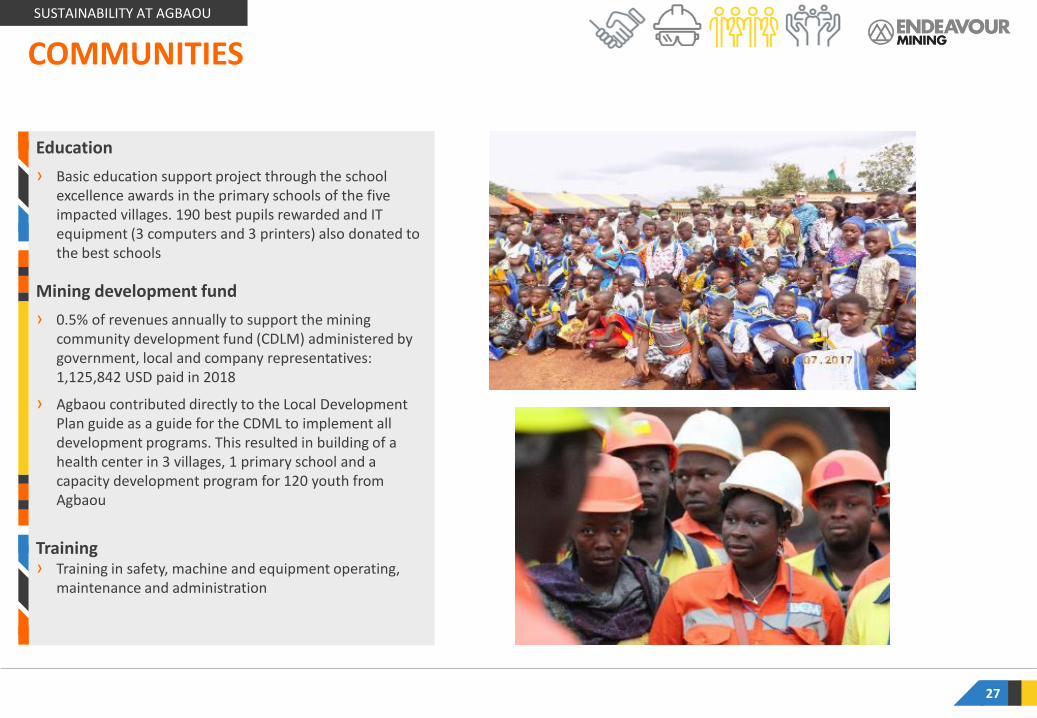
COMMUNITIES
Education
› Basic education support project through the school excellence awards in the primary schools of the five impacted villages. 190 best pupils rewarded and IT equipment (3 computers and 3 printers) also donated to the best schools
Mining development fund
› 0.5% of revenues annually to support the mining community development fund (CDLM) administered by government, local and company representatives: 1,125,842 USD paid in 2018
› Agbaou contributed directly to the Local Development Plan guide as a guide for the CDML to implement all development programs. This resulted in building of a health center in 3 villages, 1 primary school and a capacity development program for 120 youth from Agbaou
Training› Training in safety, machine and equipment operating,
maintenance and administration
28
SUSTAINABILITY AT AGBAOU
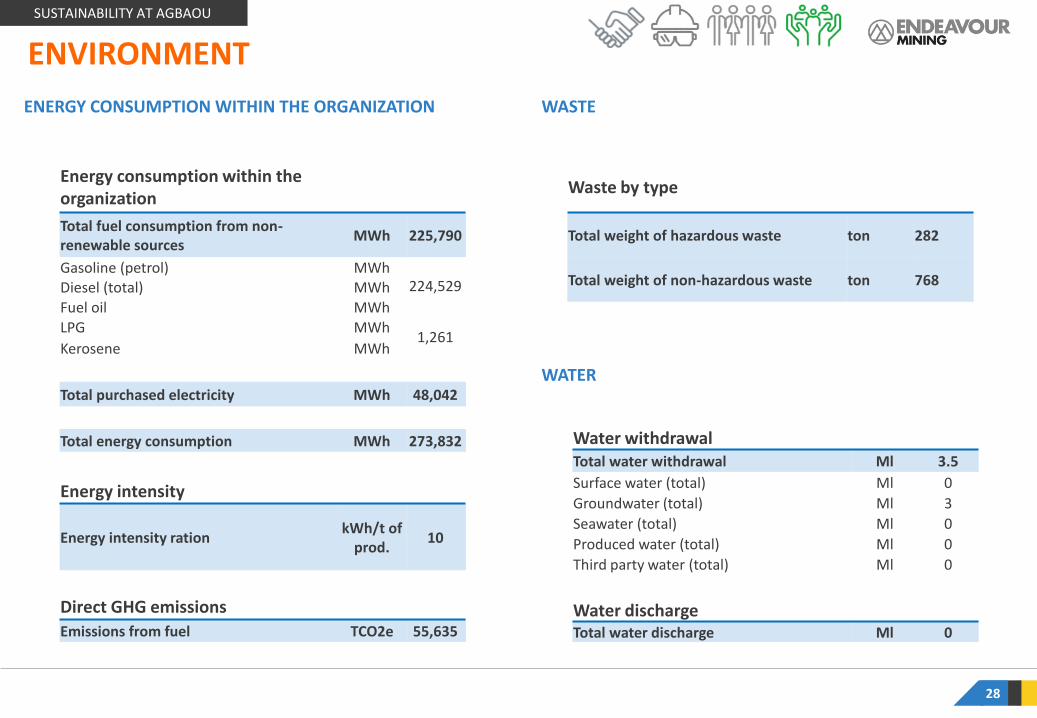
ENVIRONMENT
ENERGY CONSUMPTION WITHIN THE ORGANIZATION WASTE
Energy consumption within the organization
Total fuel consumption from non-renewable sources
MWh 225,790
Gasoline (petrol) MWh224,529Diesel (total) MWh
Fuel oil MWh
1,261LPG MWh
Kerosene MWh
Total purchased electricity MWh 48,042
Total energy consumption MWh 273,832
Energy intensity
Energy intensity rationkWh/t of
prod.10
Direct GHG emissions
Emissions from fuel TCO2e 55,635
Waste by type
Total weight of hazardous waste ton 282
Total weight of non-hazardous waste ton 768
Water withdrawalTotal water withdrawal Ml 3.5
Surface water (total) Ml 0
Groundwater (total) Ml 3
Seawater (total) Ml 0
Produced water (total) Ml 0
Third party water (total) Ml 0
Water dischargeTotal water discharge Ml 0
WATER
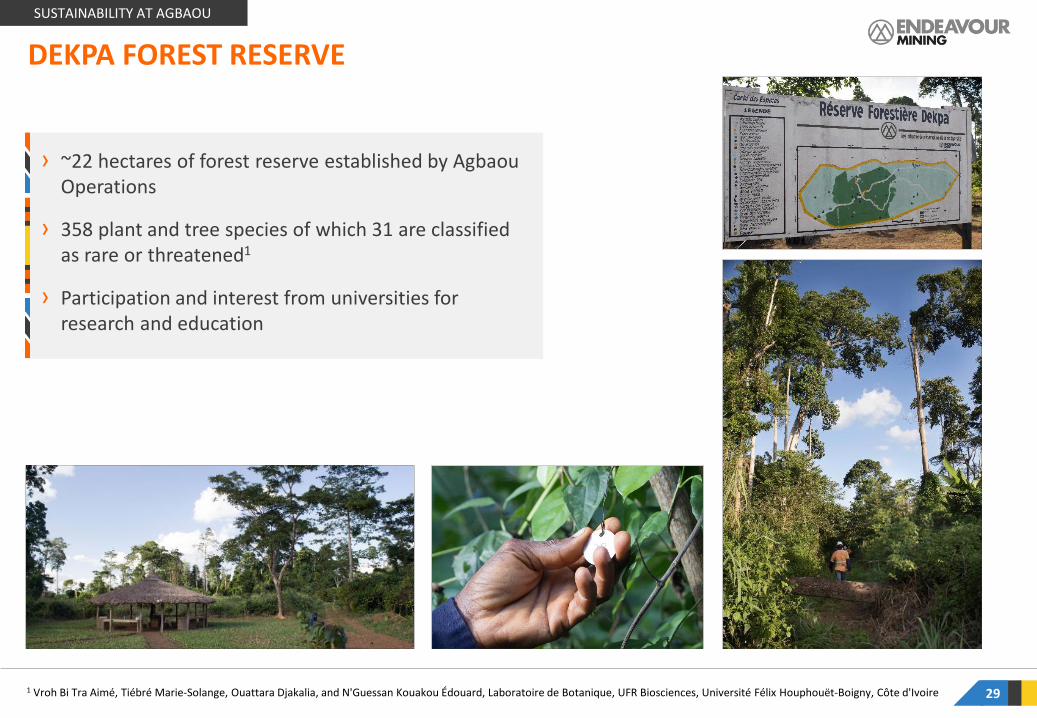
› ~22 hectares of forest reserve established by Agbaou Operations
› 358 plant and tree species of which 31 are classified as rare or threatened1
› Participation and interest from universities for research and education
DEKPA FOREST RESERVE
1 Vroh Bi Tra Aimé, Tiébré Marie-Solange, Ouattara Djakalia, and N'Guessan Kouakou Édouard, Laboratoire de Botanique, UFR Biosciences, Université Félix Houphouët-Boigny, Côte d'Ivoire 29
SUSTAINABILITY AT AGBAOU