Embed Size (px)
Citation preview

Presenter:Denny SmithDirector, Corporate Services
A.G. Edwards
2006 Energy Conference
March 14, 2006

2
Forward Looking Statement
We often discuss expectations regarding our markets, demand for our products and services, and our future performance in our annual and quarterly reports, press releases, and other written and oral statements. Such statements, including statements in this document incorporated by reference that relate to matters that are not historical facts are “forward-looking statements” within the meaning of the safe harbor provisions of Section 27Aof the Securities Act of 1933 and Section 21E of the Securities Exchange Act of 1934. These “forward-looking statements” are based on our analysis of currently available competitive, financial and economic data and our operating plans. They are inherently uncertain and investors must recognize that events and actual results could turn out to be significantly different from our expectations.
You should consider the following key factors when evaluating these forward-looking statements:• fluctuations in worldwide prices and demand for natural gas and oil;• fluctuations in levels of natural gas and crude oil exploration and development activities;• fluctuations in the demand for our services;• the existence of competitors, technological changes and developments in the oilfield services industry;• the existence of operating risks inherent in the oilfield services industry;• the existence of regulatory and legislative uncertainties;• the possibility of changes in tax laws;• the possibility of political instability, war or acts of terrorism in any of the countries in which we do business and;• general economic conditions.
Our businesses depend, to a large degree, on the level of spending by oil and gas companies for exploration, development and production activities. Therefore, a sustained increase or decrease in the price of natural gas or oil, which could have a material impact on exploration and production activities, could also materially affect our financial position, results of operations and cash flows.
The above description of risks and uncertainties is by no means all inclusive, but is designed to highlight what we believe are important factors to consider.
3
Balance Sheet Data as of December 31, 2005
A Conservative and Flexible Financial Position
(1) Some debt issues are unrated
Actual
Pro-FormaConvert
RedemptionCash & Securities $1,646
8221,2093,8877,2172,0203,76935%9%164
A3A-
S&P 500, OSX
$877Accounts Receivable 822Working Capital 1,209Property, Plant and Equipment, Net 3,887Total Assets 6,447Total Debt 1,250Stockholders’ Equity 3,769Total Debt to Total Capitalization 25%Net Debt to Capitalization 9%Weighted Average Shares Outstanding 164Moody’s Rating (1)
Standard & PoorsIndexes
($ in millions)
4
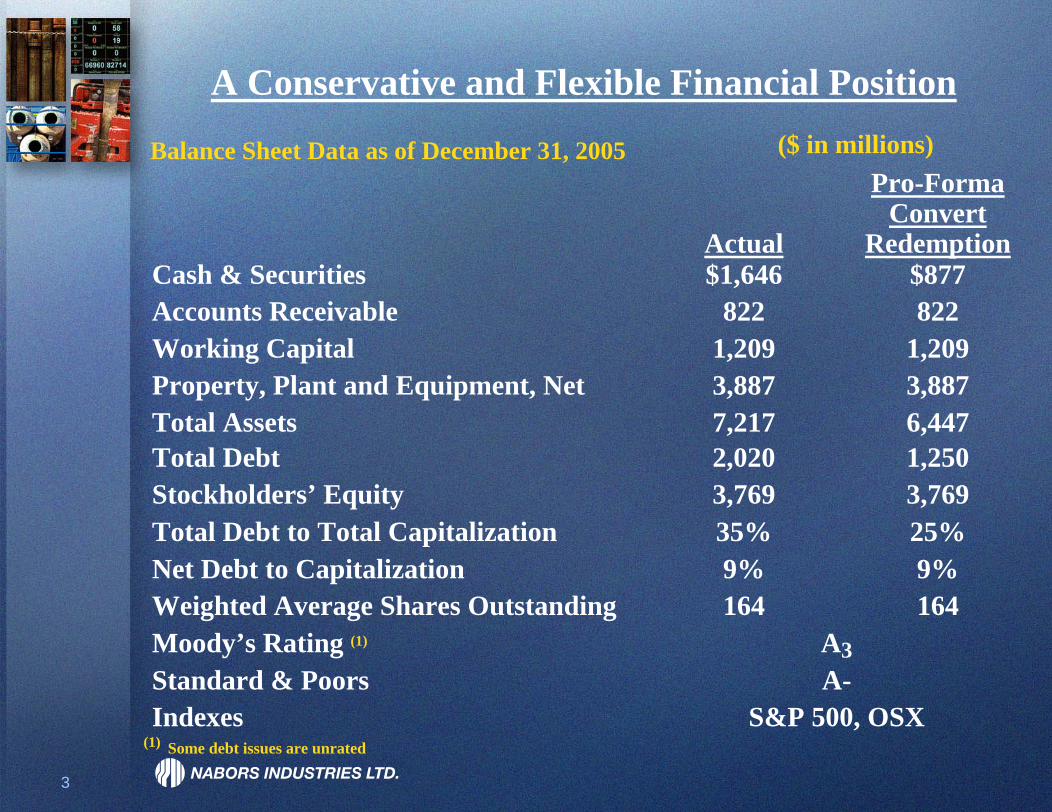
ROCE Will Always Be Our Major Metric
5
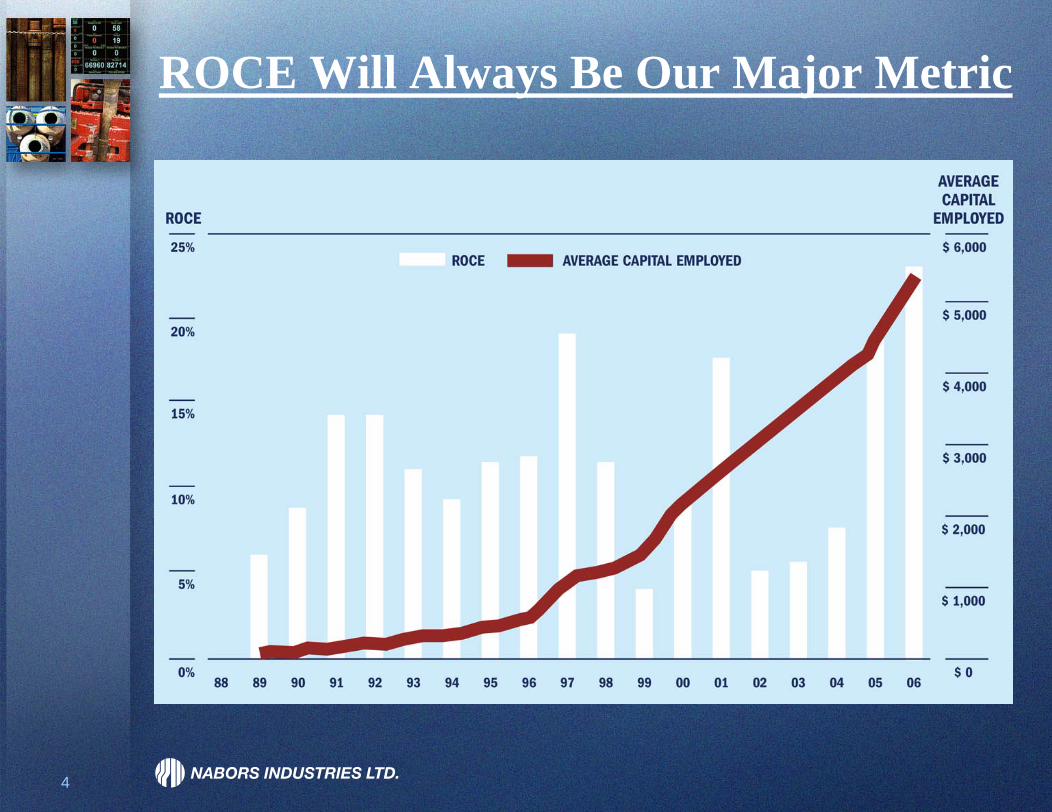
Drilling2004Avg.
2005Avg.
4Q05Actual Today
1Q06Expected
North America7
1991447
5216
335
400138538
Alaska 7 8 82551765
6619.5
430.5
448162
8US 48 Drilling 236 248 258GOM Offshore 16 14 17Canada 53 65 74
610
InternationalInt’l Land (1) 61 63 68Int’l Offshore (1) 21.5 22.5 20.5
Total Drilling 394.5 420.5 445.5
W.O./Well ServicingUS Lower 48 424 415 443Canada 142 159 168
Total W.O./Well Servicing 566 574 611
Fleet Status as of March 7, 2006
(1) Represents Nabors’ Net Interest in J.V. Rigs in Saudi @ 50%, operating rig count includes those leased from GOM Offshore(2) Represents current firm and prospective near-term contract commitments

6
A New Era for Nabors
1987 – 2001 Acquire and consolidate
1992 – 2004 Upgrade and redeploy rigs
2000 – ? Realize pricing leverage
2005 – ? Underwritten capacity expansion

7
How We See the Next Two Years
EPS Operating Income* ROCE
2005 $ 4.07 + $ 880
$ 1,400 +
$ 1,900 +
19%
2006 $ 6.00 + 23%
2007 $ 8.00 + 25%
*See discussion of this “Non-GAAP” financial measure and the required reconciliations at the end of the summary slides

8
Current and Forward Market Outlook
» Nabors’ conviction in a strong and sustainable cycle
» Rig demand continues to exceed supply
» Strategic advantages that allow Nabors to capture a disproportionate share of global incremental rig demand
» Nabors is second to none in technology, innovation and performance
» The breadth and magnitude of our opportunities are unparalleled and unprecedented
9
Conviction in a Strong and Sustainable Cycle
» Customer plans and willingness to commit to long-term rig contracts into 2010
» Customer ability to assure returns with forward sales
» Infrastructure lead times for alternatives
» Enduring supply challenges in North America gas
» Emerging supply challenges in global oil
» Increasing rig intensity per BOE
10
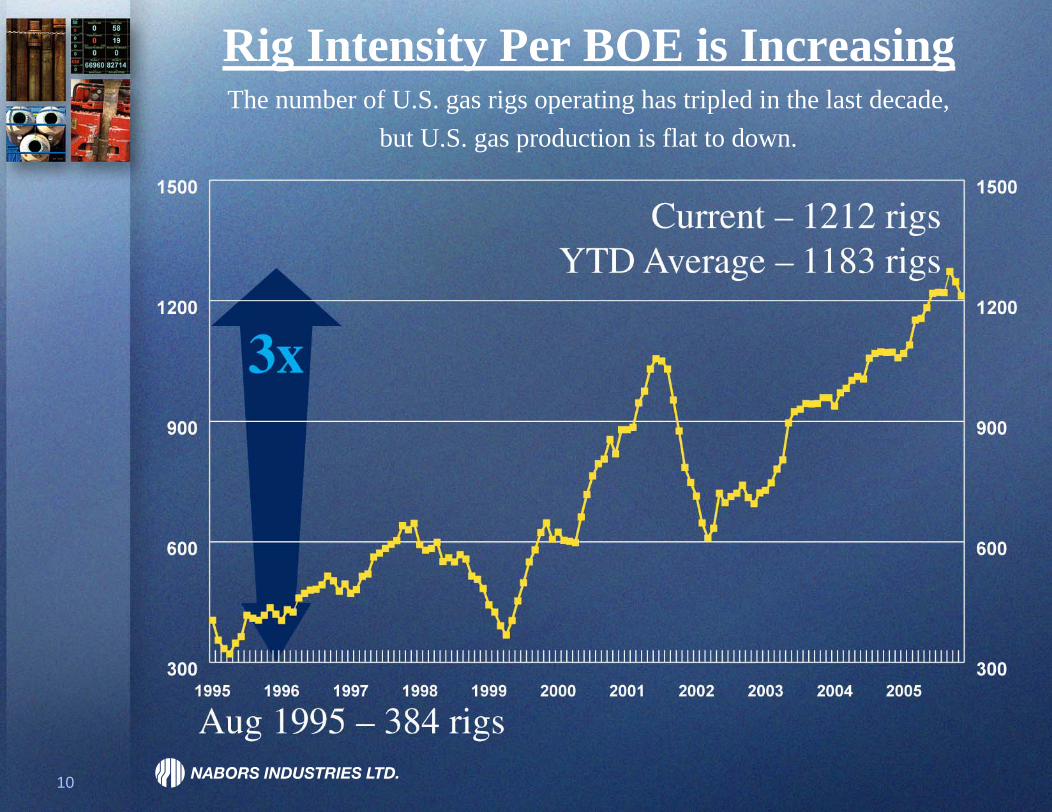
Rig Intensity Per BOE is IncreasingThe number of U.S. gas rigs operating has tripled in the last decade,
but U.S. gas production is flat to down.
11
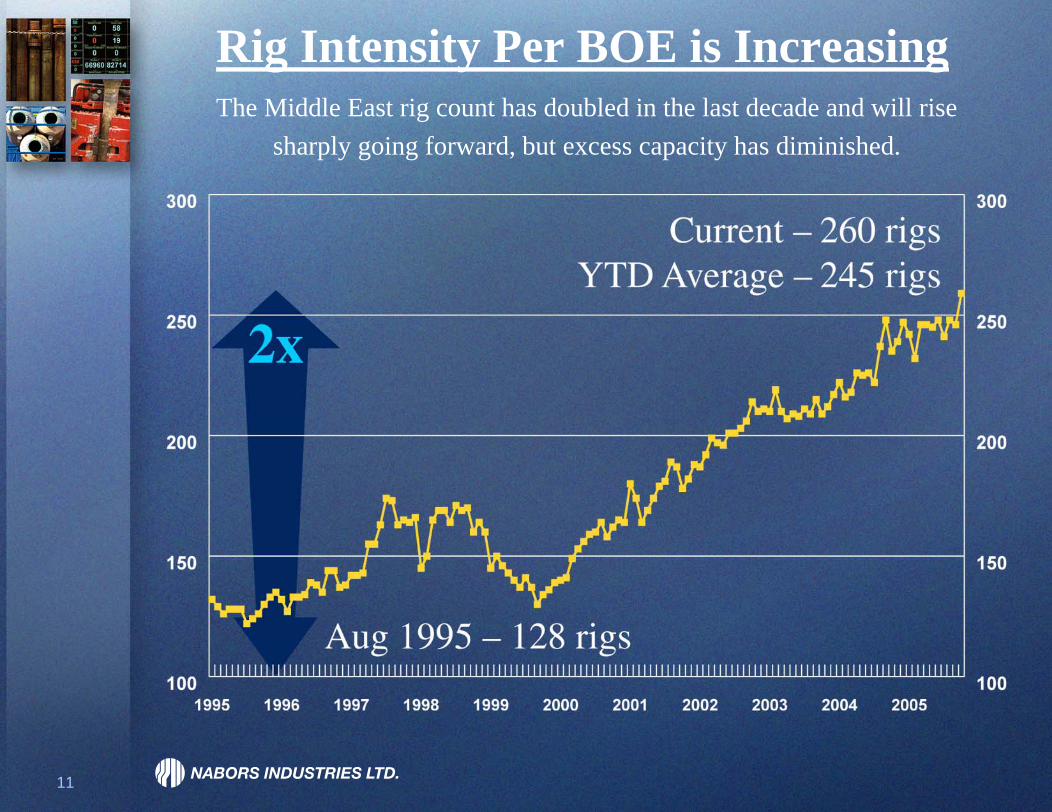
Rig Intensity Per BOE is IncreasingThe Middle East rig count has doubled in the last decade and will rise
sharply going forward, but excess capacity has diminished.

12
Saudi Aramco’s Ramp-up is a Good Indicator of Prospective Rig
Demand Due to Rig IntensityExpected Rig Counts Land Offshore Total NBR
2007 – 2008 ? ? +/- 150 ?
Current rigs in countryJune 2004 37 7 44 16
Dec 2005 66 12 79 27
Future contracted rigs
4Q 2006 80 19 99 32
2Q 2007 ? ? 110 32
Potential
13
The Nature of New Rig Demand
» Rig demand is strong in virtually all markets worldwide led by North America
» Rig demand is strongest for higher specification and faster moving rigs
» New rigs incorporate the latest in technology and automation

14
Drilling Efficiency is Paramount
» The number of complex and sophisticated wells are increasing rapidly world-wide
• Horizontal and multilaterals
» Higher specification rigs are in strong demand• Higher hydraulic horsepower• Capable of moving more rapidly• Equipped with latest technology and automation
» Same-well drilling days are improving with rig upgrades and technology advances

15
Drilling Efficiency Improvements East Texas
2001 3Q05 2005 AVG.$Millions $Millions % Delta 01
Bossier Conventional 12, 500 TD
Average days on well 30 22
Drilling costs $0.8 $0.9 13%
Completion costs $0.2 $0.8 300%
Total well costs $1.0 $1.7 70%
Cotton Valley – Carthage 9,200-10,200’
Average days on well 20 12Drilling costs $0.6 $0.7 17%Completion costs $0.2 $0.7 225%Total Well Costs $0.8 $1.4 69%
Average 1,000 HP East Texas Rig
Revenue/Rig Day $12,127 $15,139 25%Margin/Rig Day $5,122 $7,663 50%
Average Henry Hub Cash Price $3.96 $9.84 148%
Rig margins are increasing faster than drilling cost

16
Nabors’ Edge in New Capacity
»Advantageous cost and availability of capital»Advantageous operating costs
– Established infrastructure in 28 countries– Economies of Scale– Synergies among subsidiaries
»Advantageous capital costs of new and reactivated rigs– Procuring for over 400 operating rigs yields favorable
price and delivery– Multiple sourcing of major components and rig delivery
»Advantageous delivery schedule– Multiple rigs in multiple venues, quicker
17
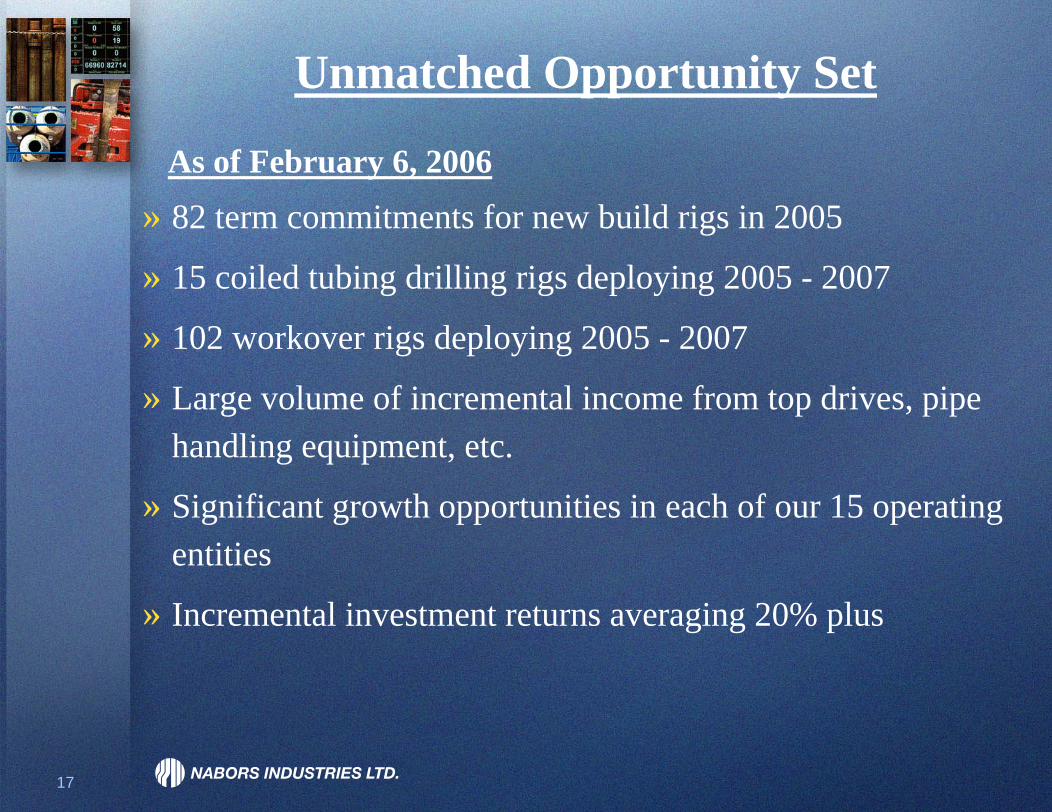
Unmatched Opportunity Set
» 82 term commitments for new build rigs in 2005
» 15 coiled tubing drilling rigs deploying 2005 - 2007
» 102 workover rigs deploying 2005 - 2007
» Large volume of incremental income from top drives, pipe handling equipment, etc.
» Significant growth opportunities in each of our 15 operating entities
» Incremental investment returns averaging 20% plus
As of February 6, 2006
18
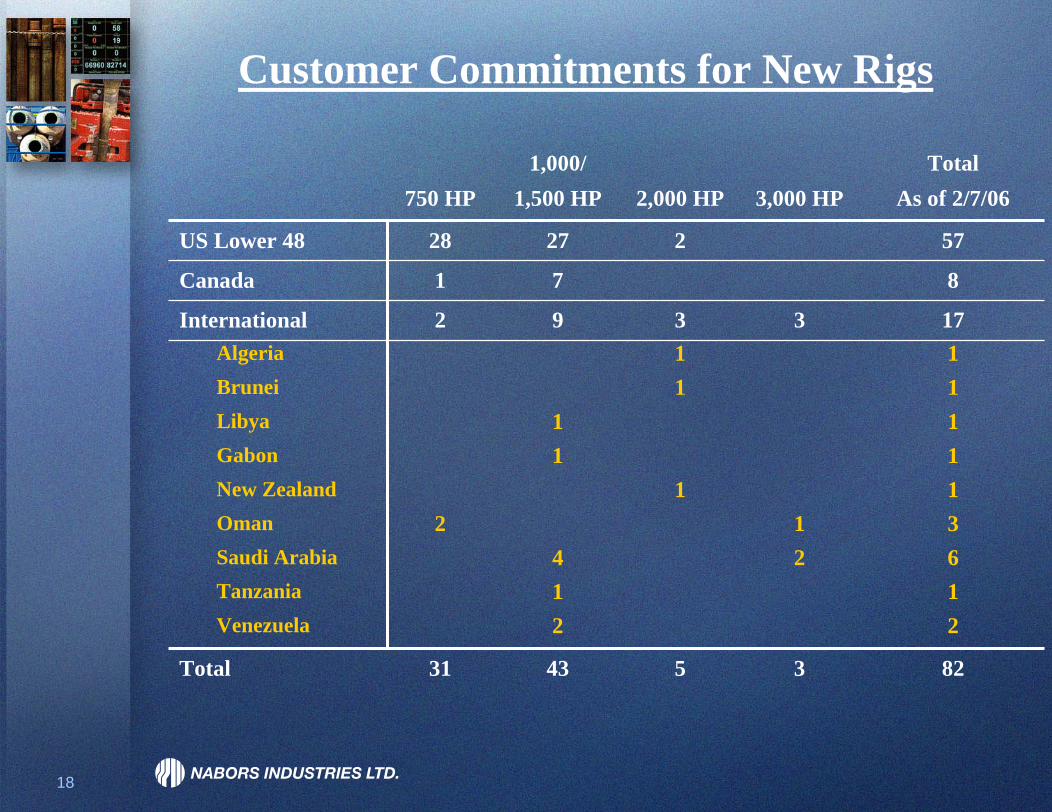
Customer Commitments for New Rigs
750 HP1,000/
1,500 HP 2,000 HP 3,000 HPTotal
As of 2/7/06
US Lower 48 28 27 2 57
Canada 1 7 8
International 2 9 3 3 17Algeria 1 1Brunei 1 1Libya 1 1Gabon 1 1New Zealand 1 1Oman 2 1 3Saudi Arabia 4 2 6Tanzania 1 1Venezuela 2 2
Total 31 43 5 3 82
19
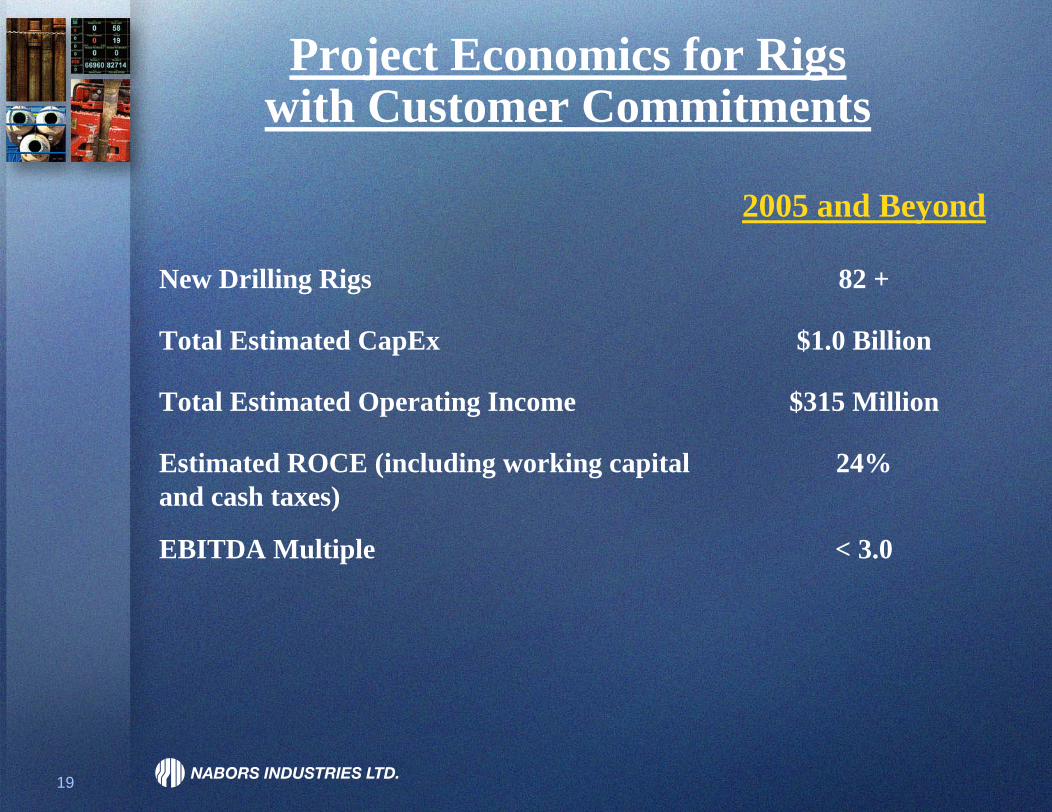
Project Economics for Rigswith Customer Commitments
2005 and Beyond
New Drilling Rigs 82 +
Total Estimated CapEx $1.0 Billion
Total Estimated Operating Income $315 Million
Estimated ROCE (including working capital and cash taxes)
24%
EBITDA Multiple < 3.0
20
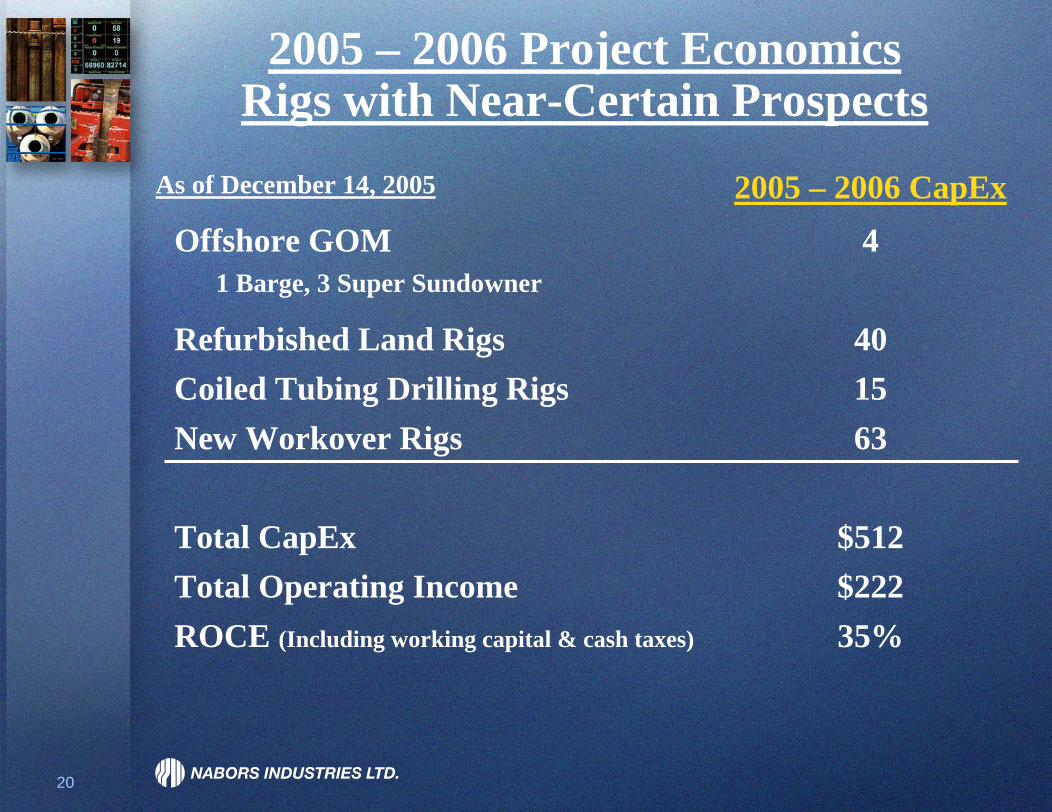
2005 – 2006 Project EconomicsRigs with Near-Certain Prospects
2005 – 2006 CapExOffshore GOM 4
1 Barge, 3 Super Sundowner
Refurbished Land Rigs 40Coiled Tubing Drilling Rigs 15New Workover Rigs 63
Total CapEx $512Total Operating Income $222ROCE (Including working capital & cash taxes) 35%
As of December 14, 2005
21
Minimizing Uncovered Capital Commitments
» Rig and component equipment orders structured as options
» Standardization of rig designs for all markets» Standardization of major rig components
• Allows for major components to be interchangeable on all new rigs
• Allows for all major components to be fungible to maintenance capital requirements of the existing 430 rigs currently operating worldwide
22
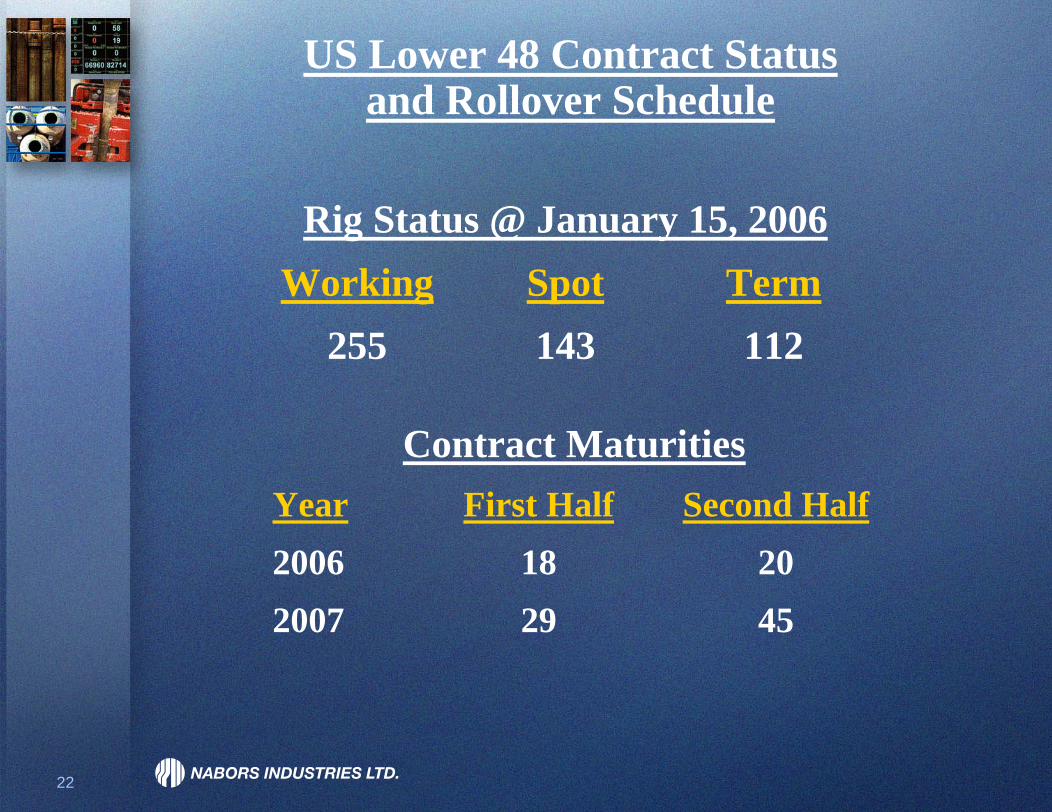
US Lower 48 Contract Statusand Rollover Schedule
Rig Status @ January 15, 2006Working Spot Term
255 143 112
4529200720182006
Second HalfFirst HalfYear
Contract Maturities
23
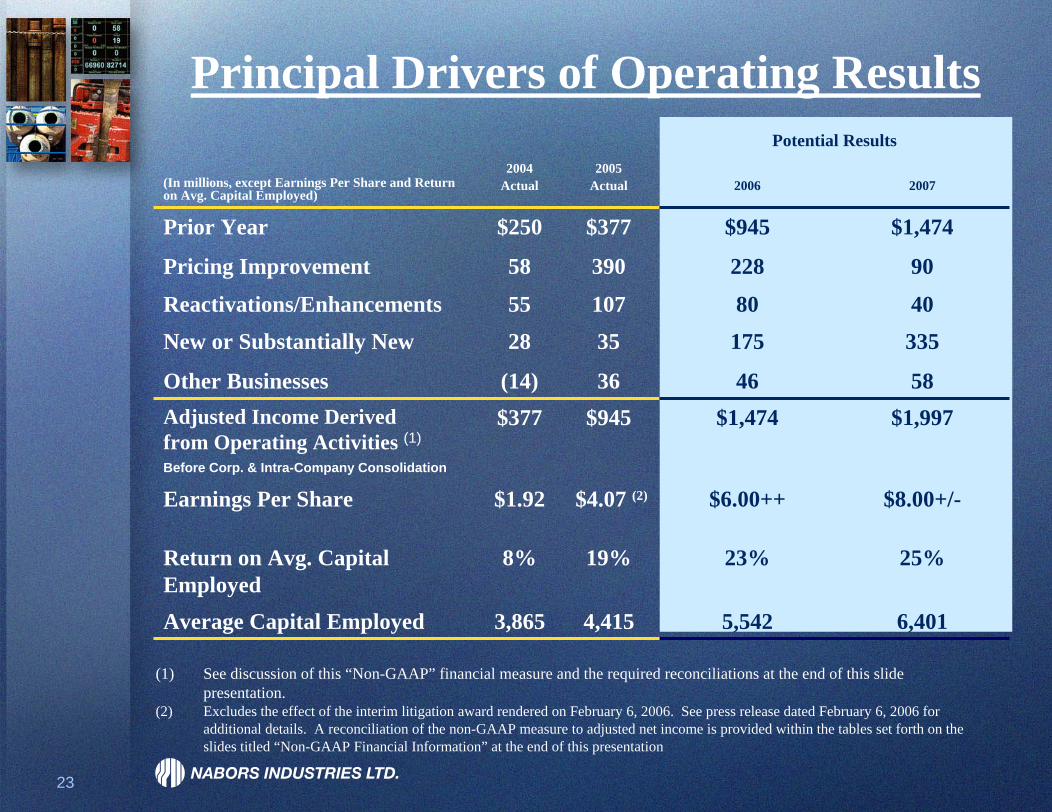
Principal Drivers of Operating ResultsPotential Results
Average Capital Employed 3,865 4,415 5,542 6,401
(In millions, except Earnings Per Share and Return on Avg. Capital Employed)
2004Actual
2005Actual 2006 2007
Prior Year $250
58
55
28
(14)$377
$1.92
8%
$377 $945 $1,474
Pricing Improvement 390 228 90
Reactivations/Enhancements 107 80 40
New or Substantially New 35 175 335
Other Businesses 36 46 58Adjusted Income Derivedfrom Operating Activities (1)
Before Corp. & Intra-Company Consolidation
$945 $1,474 $1,997
Earnings Per Share $4.07 (2) $6.00++ $8.00+/-
Return on Avg. Capital Employed
19% 23% 25%
(1) See discussion of this “Non-GAAP” financial measure and the required reconciliations at the end of this slide presentation.
(2) Excludes the effect of the interim litigation award rendered on February 6, 2006. See press release dated February 6, 2006 for additional details. A reconciliation of the non-GAAP measure to adjusted net income is provided within the tables set forth on the slides titled “Non-GAAP Financial Information” at the end of this presentation
24
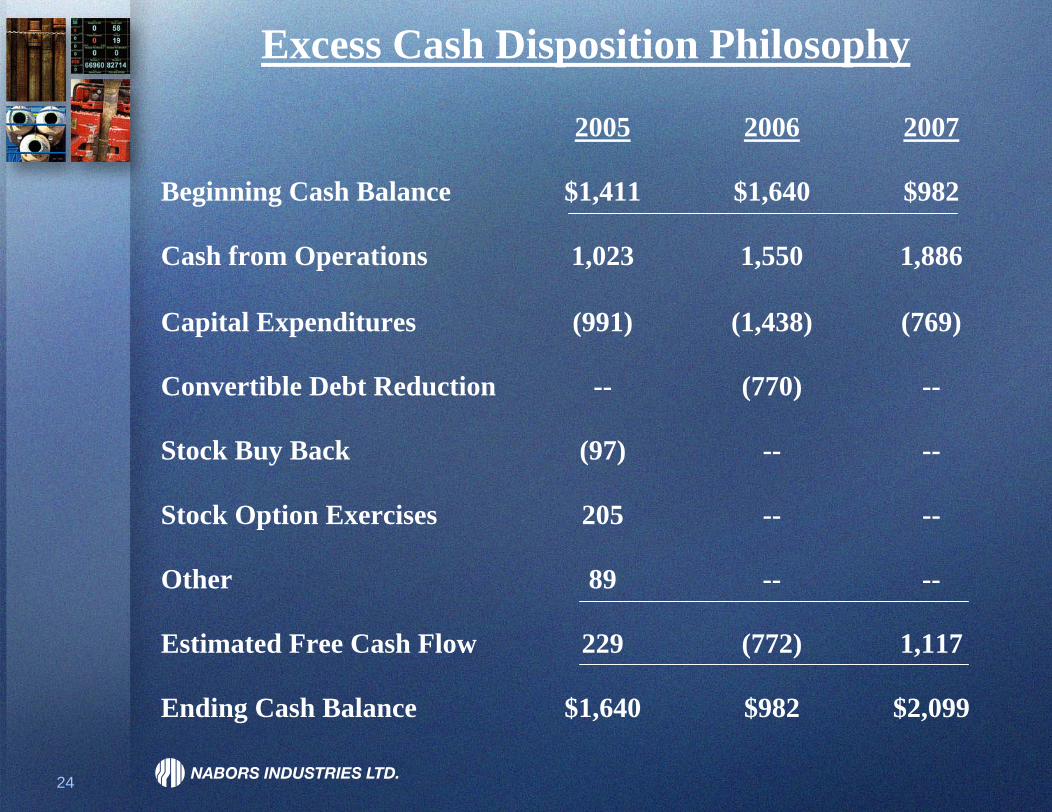
Excess Cash Disposition Philosophy
2005 2006 2007
Beginning Cash Balance $1,411 $1,640 $982
Cash from Operations 1,023 1,550 1,886
Capital Expenditures (991) (1,438) (769)
Convertible Debt Reduction -- (770) --
Stock Buy Back (97) -- --
Stock Option Exercises 205 -- --
Other 89 -- --
Estimated Free Cash Flow 229 (772) 1,117
Ending Cash Balance $1,640 $982 $2,099
AUXILIARYINFORMATION
26
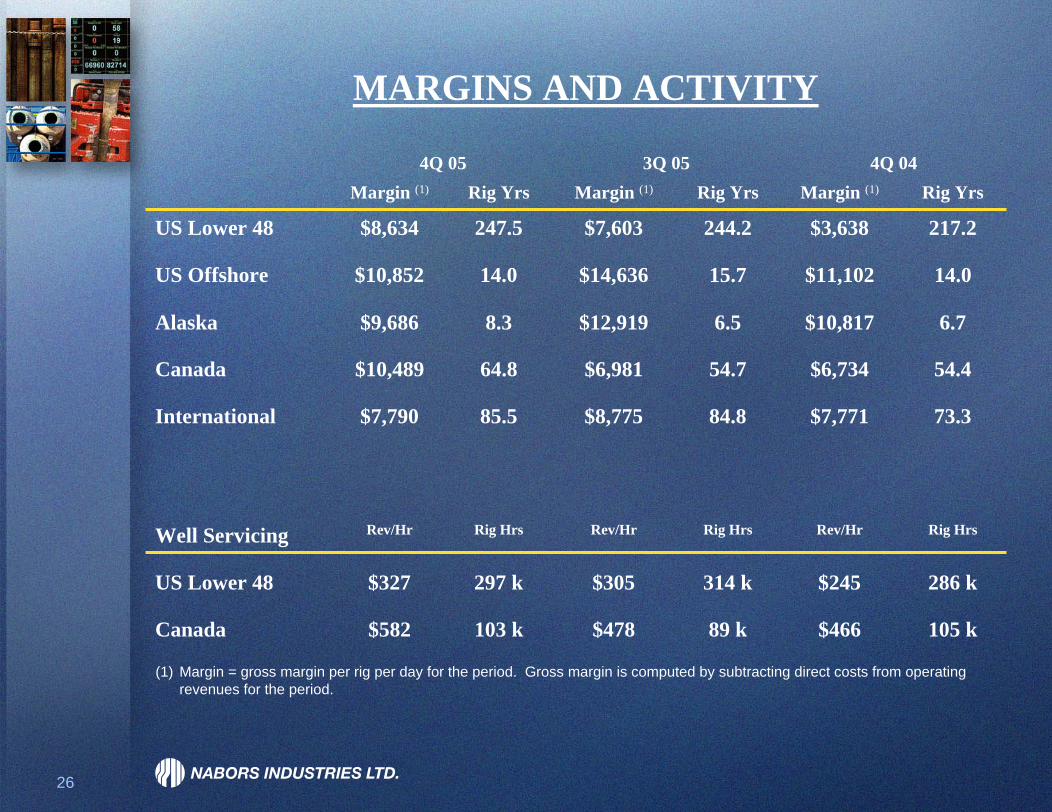
MARGINS AND ACTIVITY
4Q 05 3Q 05 4Q 04Margin (1) Rig Yrs Margin (1) Rig Yrs Margin (1) Rig Yrs
US Lower 48 $8,634 247.5 $7,603 244.2 $3,638 217.2
US Offshore $10,852 14.0 $14,636 15.7 $11,102 14.0
Alaska $9,686 8.3 $12,919 6.5 $10,817 6.7
Canada $10,489 64.8 $6,981 54.7 $6,734 54.4
International $7,790 85.5 $8,775 84.8 $7,771 73.3
Well Servicing Rev/Hr Rig Hrs Rev/Hr Rig Hrs Rev/Hr Rig Hrs
US Lower 48 $327 297 k $305 314 k $245 286 k
Canada $582 103 k $478 89 k $466 105 k
(1) Margin = gross margin per rig per day for the period. Gross margin is computed by subtracting direct costs from operating revenues for the period.
27
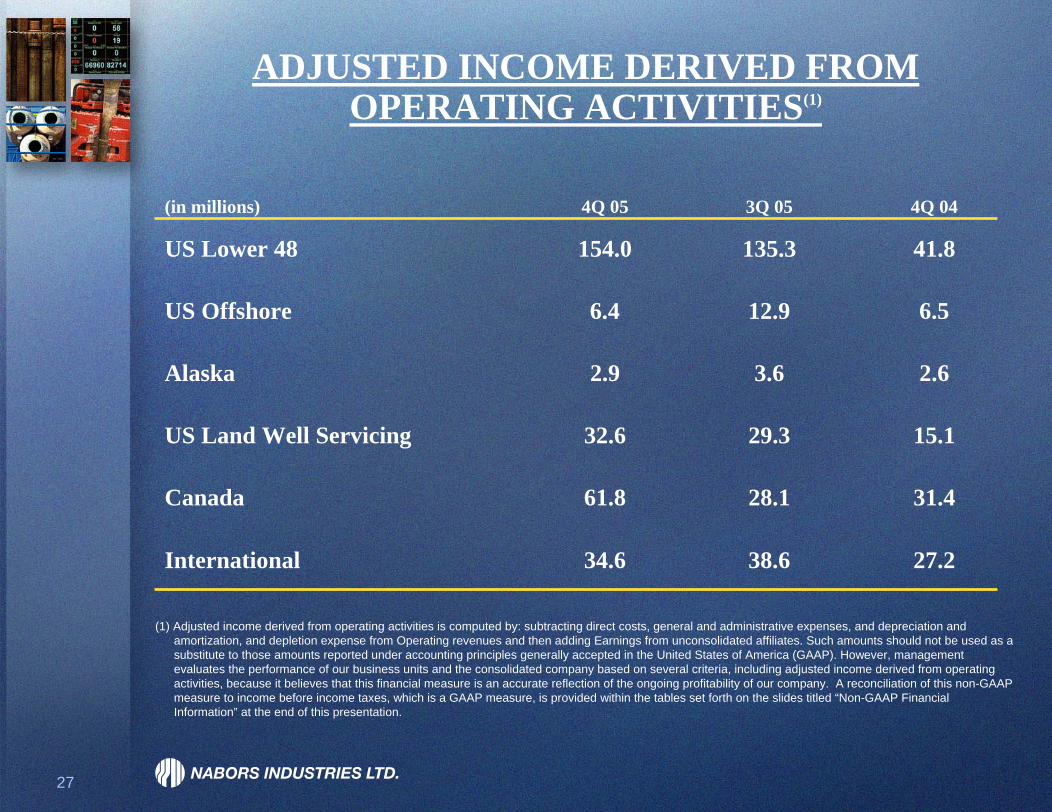
ADJUSTED INCOME DERIVED FROMOPERATING ACTIVITIES(1)
(in millions) 4Q 05 3Q 05 4Q 04
US Lower 48 154.0 135.3 41.8
US Offshore 6.4 12.9 6.5
Alaska 2.9 3.6 2.6
US Land Well Servicing 32.6 29.3 15.1
Canada 61.8 28.1 31.4
International 34.6 38.6 27.2
(1) Adjusted income derived from operating activities is computed by: subtracting direct costs, general and administrative expenses, and depreciation and amortization, and depletion expense from Operating revenues and then adding Earnings from unconsolidated affiliates. Such amounts should not be used as a substitute to those amounts reported under accounting principles generally accepted in the United States of America (GAAP). However, management evaluates the performance of our business units and the consolidated company based on several criteria, including adjusted income derived from operating activities, because it believes that this financial measure is an accurate reflection of the ongoing profitability of our company. A reconciliation of this non-GAAP measure to income before income taxes, which is a GAAP measure, is provided within the tables set forth on the slides titled “Non-GAAP Financial Information” at the end of this presentation.
28
Non-GAAP Financial Information
Within the preceding slides in this presentation, we present, both historically and on a forward-looking basis, our adjusted income derived from operating activities, which is a “non-GAAP”financial measure under Regulation G. The components of adjusted income derived from operating activities are computed using amounts which are determined in accordance with accounting principles generally accepted in the United States of America (GAAP). Adjusted income derived from operating activities is computed by: subtracting direct costs, general and administrative expenses, and depreciation and amortization, and depletion expense from Operating revenues and then adding Earnings from unconsolidated affiliates. Such amounts should not be used as a substitute to those amounts reported under GAAP. However, management evaluates the performance of our business units and the consolidated company based on several criteria, including adjusted income derived from operating activities, because it believes that this financial measure is an accurate reflection of the ongoing profitability of our company. We have provided within the table presented below a reconciliation for the applicable historical and forward-looking periods of adjusted income derived from operating activities to income before income taxes, which is its nearest comparable GAAP financial measure.
29
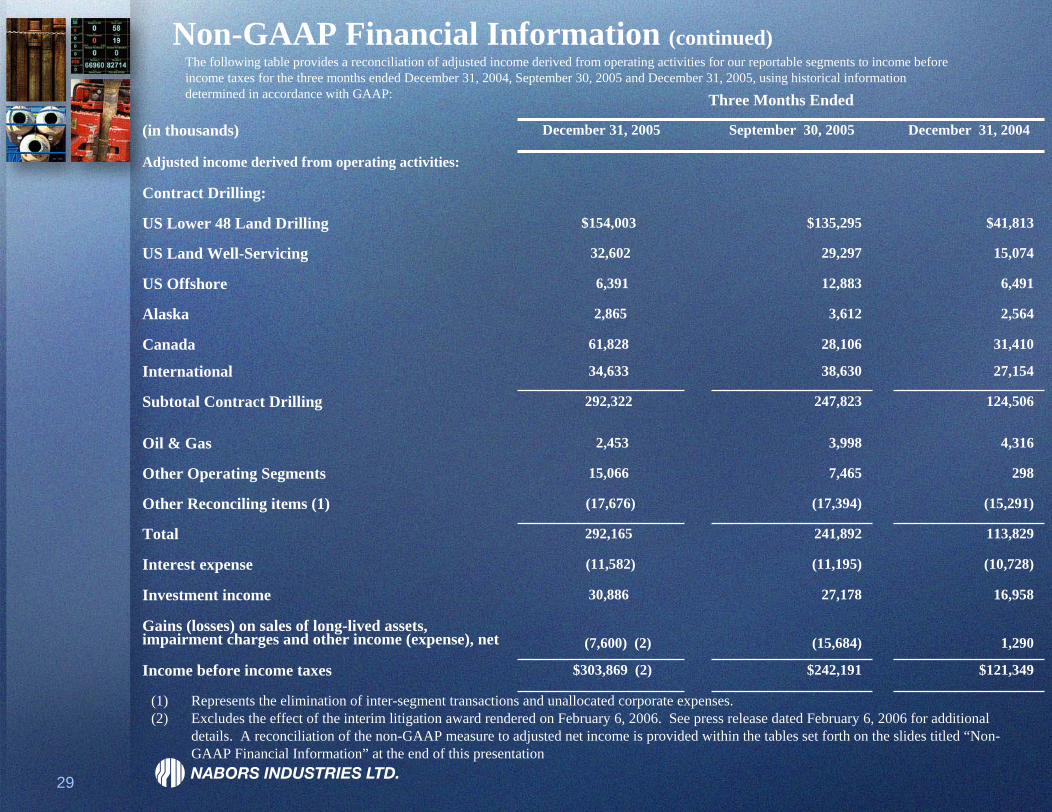
Non-GAAP Financial Information (continued)The following table provides a reconciliation of adjusted income derived from operating activities for our reportable segments to income before income taxes for the three months ended December 31, 2004, September 30, 2005 and December 31, 2005, using historical information determined in accordance with GAAP: Three Months Ended
(in thousands) December 31, 2005 September 30, 2005 December 31, 2004
Adjusted income derived from operating activities:
Contract Drilling:
US Lower 48 Land Drilling $154,003 $135,295 $41,813
US Land Well-Servicing 32,602 29,297 15,074
US Offshore 6,391 12,883 6,491
Alaska 2,865 3,612 2,564
Canada 61,828 28,106 31,410
International 34,633 38,630 27,154
Subtotal Contract Drilling 292,322 247,823 124,506
Oil & Gas 2,453 3,998 4,316
Other Operating Segments 15,066 7,465 298
Other Reconciling items (1) (17,676) (17,394) (15,291)
Total 292,165 241,892 113,829
Interest expense (11,582) (11,195) (10,728)
Investment income 30,886 27,178 16,958
Gains (losses) on sales of long-lived assets, impairment charges and other income (expense), net (7,600) (2) (15,684) 1,290
Income before income taxes $303,869 (2) $242,191 $121,349
(1) Represents the elimination of inter-segment transactions and unallocated corporate expenses.(2) Excludes the effect of the interim litigation award rendered on February 6, 2006. See press release dated February 6, 2006 for additional
details. A reconciliation of the non-GAAP measure to adjusted net income is provided within the tables set forth on the slides titled “Non-GAAP Financial Information” at the end of this presentation

30
Non-GAAP Financial Information (continued)
The following table provides a reconciliation of adjusted income derived from operating activities for our consolidated company to income before income taxes, which is determined in accordance with GAAP. This reconciliation is provided using information determined in accordance with GAAP for the following periods: (1) the years ended December 31, 2004 and 2005 using historical financial information and (2) the years ended December 31, 2006 and 2007, which are presented on a projected basis.
(in thousands)2004
Actual2005
Actual2006
Forecast2007
Forecast
Adjusted income derived from operating activities excluding inter-segment transactions and unallocated corporate expenses $376,983 $944,805 $1,474,286 $1,997,066
Inter-segment transactions and unallocated corporate expenses (47,331) (64,998) (90,503) (87,819)
Adjusted income derived from operating activities 329,652 879,807 1,383,783 1,909,247
Interest expense (48,507) (44,847) (28,174) (26,400)
Investment income 50,064 85,430 53,029 76,824
Gains (losses) on sales of long-lived asset, impairment charges and otherincome (expense), net 4,629 (31,378) (1) (4,866) (15,522)
Income before income taxes $335,838 $889,012 (1) $1,403,772 $1,944,149
(1) Excludes the effect of the interim litigation award rendered on February 6, 2006. See press release dated February 6, 2006 for additional details. A reconciliation of the non-GAAP measure to adjusted net income is provided within the tables set forth on the slides titled “Non-GAAP Financial Information” at the end of this presentation

31
(In thousands)
Three Months Ended
December 31, 2005
Year Ended December 31,
2005
Reconciliation of net income:
As presented $ 221,572 $ 659,648
Impact of litigation award (10,953) (10,953)
Net income, as adjusted $ 210,619 $ 648,695
Reconciliation of adjusted diluted earnings per share:
As presented $ 1.35 $ 4.07
Impact of litigation award (.06) (.07)
Diluted earnings per share, as adjusted $ 1.29 $ 4.00
Results presented for the three months and year ended December 31, 2005 exclude the incremental impact of $11 million, net of tax, related to an interim litigation award entered against the Company on February 6, 2006. The interim judgment totaled $25.6 million on a pretax basis (plus an undetermined amount of attorney's fees and costs), which was in excess of reserves established by the Company of $10.6 million (pretax) as of September 30, 2005. We have provided a reconciliation below of net income, as presented herein, to net income including the incremental impact of the interim litigation award (its nearest comparable GAAP financial measure) and diluted earnings per share, as presented herein, to diluted earnings per share including the incremental impact of the interim litigation award (its nearest comparable GAAP financial measure). The Company included these net income and diluted earnings per share amounts in this release even though these amounts exclude the incremental impact of the litigation award because management believes these non-GAAP financial measures to be more indicative of the Company's on-going operating results and financial condition.
Non-GAAP Financial Information