Embed Size (px)
Citation preview
AFW Accounting for Past DeliveryAppendices
March 2019


AFW Accounting for Past Delivery Appendices
Contents
Appendix Action ref(s)
PD.A1.1 PwC (financial) Data Table Assurance Report AFW.PD.A1; AFW.PD.A5; AFW.PD.B3
PD.A3.1 Atkins Technical Assurance Report March 2019 AFW.PD.A3
PD.A5.1 p47 of Setting price controls for 2015-20: Final pricecontrol determination notice: policy chapter A3 – wholesale waterand wastewater costs and revenues
AFW.PD.A5
PD.B3.1 Complaints root cause analysis and action plan examples AFW.PD.B3
PD.B3.2 Chart showing reduction in complaints response time forall business areas
AFW.PD.B3
PD.B3.3 Chart showing improvements to CSAT score Apr ‘15 - Jan‘19
AFW.PD.B3
PD.B3.4 Chart showing reduction in Stage One complaints Apr ‘15-Jan ‘19
AFW.PD.B3
PD.B3.5 Chart showing reduction in Stage Two complaints Apr ‘15- Jan ‘19
AFW.PD.B3
PD.B3.6 Volume of complaints per 10,000 properties by provider –17/18
AFW.PD.B3
PD.B3.7 Volume of complaints per 10,000 properties 18/19 (Q1-Q3)
AFW.PD.B3
PD.B3.8 Percentage of complaints resolved at Stage One 15/16-18/19
AFW.PD.B3
PD.B3.9 Chart showing percentage of calls answered within 30seconds
AFW.PD.B3
AFW Accounting for Past Delivery Appendices 3
Appendix Action ref(s)
PD.B3.10 Case Study – Applying lessons learned from poor, good,and acceptable performance in customer communications
AFW. PD.B3
PD.B3.11 Drivers of improvements to complaints performance AFW.PD.B3
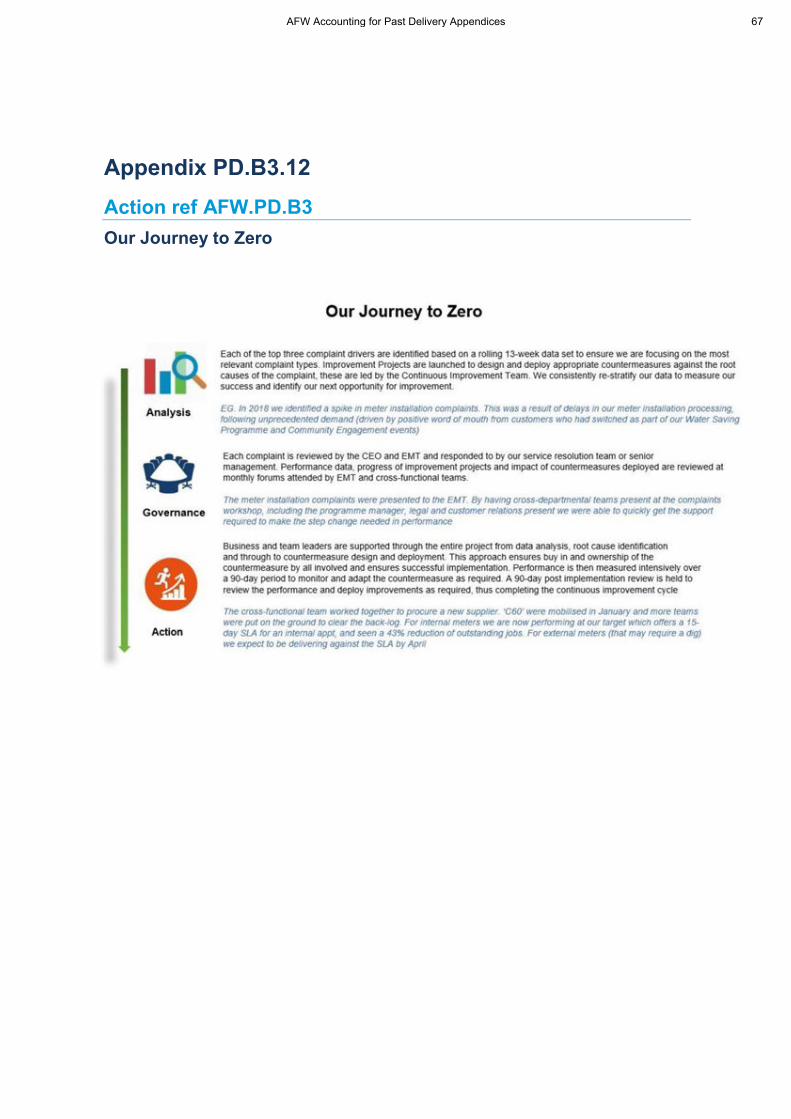
PD.B3.12 Our journey to zero AFW.PD.B3
PD.B4.1 Letter from Sir Tony Redmond, January 2018 AFW.PD.B4
PD.B4.2 Benchmarking best practice beyond the water sector AFW.PD.B4
PD.B4.3 Table to show drivers of improvements to complaints performance
AFW.PD.B4
PD.B4.4 Case Study – Applying lessons learned from poor, good and acceptable performance in customer communications
AFW.PD.B4
PD.B4.5 Ensuring a continuous improvement process now and inthe future
AFW.PD.B4
PD.C.1 Response to Ofwat leakage information request Additional Ofwatfeedback
PD.C.2 Extract from Audit Committee Feb 2019 Additional Ofwatfeedback
AFW Accounting for Past Delivery Appendices 4

Appendix PD.A1.1
Action refs AFW.PD.A1; AFW.PD.A5; AFW.PD.B3
PwC (financial) Data Table Assurance Report
AFW Accounting for Past Delivery Appendices 5

AFW Accounting for Past Delivery Appendices 6

www.pwc.com
PR19 Review of the Financial Data Tables
Affinity Water Limited
Confidential
27 March 2019
AFW Accounting for Past Delivery Appendices 7

Strictly Private and Confidential
The Directors, Affinity Water Limited, Tamblin Way, Hatfield, Hertfordshire AL10 9EZ
27 March 2019
Data Tables Assurance: Report in response to Ofwat queries
Dear Sirs,
We are pleased to enclose our report to the Board in respect of our review of the updated financial data tables prepared for re-submission by 1 April 2019 to Ofwat, as part of the PR19 process.
The primary purpose of this report is to:
Communicate our approach to the work Confirm the scope of our review; and Provide you with a record of any findings from our work.
Our work has been conducted to provide assurance to you in response to the changes to financial data tables following feedback from Ofwat on 31 January 2019.
Yours faithfully
Dave Gandee Partner PricewaterhouseCoopers LLP
PricewaterhouseCoopers LLP, Abacus House, Castle Park, Cambridge, CB3 0AN T: +44(0)1223 460 05, F: +44(0) 1223 552 336, www.pwc.co.uk
PricewaterhouseCoopers LLP is a limited liability partnership registered in England with registered number OC303525. The registered office of PricewaterhouseCoopers LLP is 1 Embankment Place, London WC2N 6RH.PricewaterhouseCoopers LLP is authorised and regulated by the Financial Conduct Authority for designated investment business.
AFW Accounting for Past Delivery Appendices 8
Data tables and narrative documents review
PwC 3
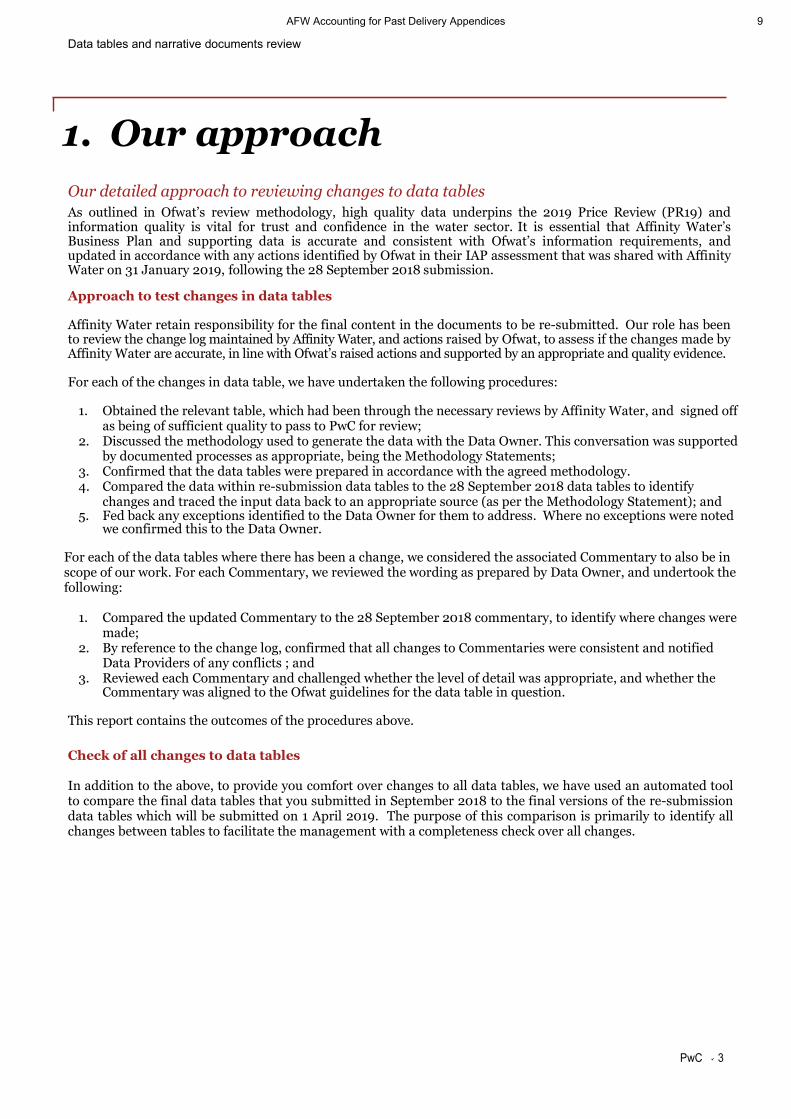
1. Our approach
Our detailed approach to reviewing changes to data tables As outlined in Ofwat’s review methodology, high quality data underpins the 2019 Price Review (PR19) and information quality is vital for trust and confidence in the water sector. It is essential that Affinity Water’s Business Plan and supporting data is accurate and consistent with Ofwat’s information requirements, and updated in accordance with any actions identified by Ofwat in their IAP assessment that was shared with Affinity Water on 31 January 2019, following the 28 September 2018 submission.
Approach to test changes in data tables
Affinity Water retain responsibility for the final content in the documents to be re-submitted. Our role has been to review the change log maintained by Affinity Water, and actions raised by Ofwat, to assess if the changes made by Affinity Water are accurate, in line with Ofwat’s raised actions and supported by an appropriate and quality evidence.
For each of the changes in data table, we have undertaken the following procedures:
1. Obtained the relevant table, which had been through the necessary reviews by Affinity Water, and signed off
as being of sufficient quality to pass to PwC for review; 2. Discussed the methodology used to generate the data with the Data Owner. This conversation was supported
by documented processes as appropriate, being the Methodology Statements; 3. Confirmed that the data tables were prepared in accordance with the agreed methodology. 4. Compared the data within re-submission data tables to the 28 September 2018 data tables to identify
changes and traced the input data back to an appropriate source (as per the Methodology Statement); and 5. Fed back any exceptions identified to the Data Owner for them to address. Where no exceptions were noted
we confirmed this to the Data Owner.
For each of the data tables where there has been a change, we considered the associated Commentary to also be in scope of our work. For each Commentary, we reviewed the wording as prepared by Data Owner, and undertook the following:
1. Compared the updated Commentary to the 28 September 2018 commentary, to identify where changes were
made; 2. By reference to the change log, confirmed that all changes to Commentaries were consistent and notified
Data Providers of any conflicts ; and 3. Reviewed each Commentary and challenged whether the level of detail was appropriate, and whether the
Commentary was aligned to the Ofwat guidelines for the data table in question.
This report contains the outcomes of the procedures above.
Check of all changes to data tables In addition to the above, to provide you comfort over changes to all data tables, we have used an automated tool to compare the final data tables that you submitted in September 2018 to the final versions of the re-submission data tables which will be submitted on 1 April 2019. The purpose of this comparison is primarily to identify all changes between tables to facilitate the management with a completeness check over all changes.
AFW Accounting for Past Delivery Appendices 9
Data tables and narrative documents review
PwC 4
2. Summary of findings
Our review identified a number of recurring issues Having reviewed all 51 data tables in the scope of our work, we have identified a number of exceptions that are summarised below:
Data tables were not always appropriately signed off by the relevant layers of management, which meant
that in certain regards we have acted as a 2nd line of defence; Commentaries have not always been updated fully, and explanations for the changes in data from 28
September 2019 to March 2019 are not as complete and transparent as we would expect; We have identified a number of instances whereby the data in the data table has not been calculated in
accordance with the methodology; The Change Log, which was expected to be the central repository of all changes made to the data tables, has
not been maintained in line with those changes. Hence it has not been possible to always use the Change Log as a complete and accurate summary of the changes;
Using an automated tool to compare the data between 28 September 2018 data tables and 1 April 2019 re-submission data tables, we have identified changes in certain tables where Data Owners initially confirmed that no such changes will be made;
Certain key pieces of information were not always included, such as the Ofwat IAP reference, or a breakdown of sections or lines that have changed, which makes it difficult to follow the ‘audit trail’; and
A number of isolated ‘one-off’ errors that were identified and required rectification by Affinity Water.
Whilst we identified a number of exceptions, as above, it should be noted that in all cases the exceptions were passed to the relevant Affinity Water staff on a timely basis and were subsequently addressed. We then undertook a follow up review of the resulting changes to confirm that the exceptions were remediated appropriately, and can confirm that this is the case.
AFW Accounting for Past Delivery Appendices 10

Data tables and narrative documents review
PwC 5
3. Change Analysis
Data Tables reviewed and changes identified
To identify all changes in the Data Tables we used an automated tool that utilised scanning analytics, comparing changes between the September 2018 Data Tables and the April 2019 re-submission Data Tables. We were able to reconcile these changes with the change log, and identify additional changes. In total, we identified 2,920 changes. The table below shows the detail of the data tables we have re-examined, and the outcome of change analysis. Note that we have included a complete list of data tables that were in scope for our work in 28 September 2018 submission, with those that have changed since that date being in scope for re-submission work. The data tables which are out of scope, as there were no changes, are highlighted in grey. No Business Plan Data Sheet Number of changes
1 App10 - Financial ratios 104 2 App11 - Income statement based on the actual company structure 49 3 App11a - Income statement based on a notional company structure 45 4 App12 - Balance sheet based on the actual company structure 78 5 App12a - Balance sheet based on a notional company structure 90 6 App13 - Trade receivables 24 7 App14 - Trade and other payables 37 8 App15 - Cashflow based on the actual company structure 31 9 App15a - Cashflow based on a notional company structure 25 10 App16 - Tangible Fixed assets 60 11 App17 - Appointee revenue summary 0 12 App18 - Share capital and dividends 4 13 App19 - Debt and interest costs 46 14 App21 - Direct procurement for customers 22 15 App22 - Pensions 0 16 App23 - Inflation measures 312 17 App24 - Input proportions 70 18 App24a - Real price effects (RPEs) and productivity assumptions 101 19 App25 - PR14 reconciliation adjustments summary 3 20 App26 - RoRE Scenarios 145 21 App28 - Developer services (wholesale) 12 22 App29 - Wholesale tax 71 23 App32 - Weighted average cost of capital for the Appointee 0 24 App33 - Wholesale operating leases reclassified under IFRS16 0 25 App7 - Proposed price limits and average bills 8 26 App8 - Appointee financing 11 27 App9 - Adjustments to RCV from disposals of land 3 28 R1 - Residential retail - All sections NOT B 162 29 R3 - Residential retail ~ further information on bad debt 7 30 R7 - Revenue and cost recovery for retail 25 31 R8 - Net retail margins 0 32 R9 - PR14 reconciliation of household retail revenue 10 33 Wn3 - Wholesale revenue projections for the water network plus price control 81 34 Wn4 - Cost recovery for water network plus 50 35 Wn5 - Weighted average cost of capital for the water network plus control 0 36 Wr2 - Wholesale water resource opex - Part A 120 37 Wr3 - Wholesale revenue projections for the water resources price control 61 38 Wr4 - Cost recovery for water resources 65 39 Wr5 - Weighted average cost of capital for the water resources control 0
40 Wr7 - New water resources capacity ~ forecast cost of options beginning in 2020-25 - Line 15 578
41 WS1 - Wholesale water operating and capital expenditure by business unit - PART A, C and D
190 42
WS1 - Wholesale water operating and capital expenditure by business unit - PART B 18 + 20
43 WS12 - RCV allocation in the wholesale water service - PART A+B 10
44 WS12 - RCV allocation in the wholesale water service - PART C
AFW Accounting for Past Delivery Appendices 11

Data tables and narrative documents review
PwC 6
No Business Plan Data Sheet Number of changes 45 WS12a - Change in RCV allocation in the wholesale water service 5 46 WS13 - PR14 wholesale revenue forecast incentive mechanism for the water service 15 47 WS15 - PR14 wholesale total expenditure outperformance sharing for the water
service 15
48 WS1a (DRAFT) - Wholesale water operating and capital expenditure by business unit including operating leases reclassified under IFRS16 154
49 WS5 - Other wholesale water expenditure 6 50 WS7 - Wholesale water local authority rates 15 51 WS8 - Third party costs by business unit for the wholesale water service 0
AFW Accounting for Past Delivery Appendices 12

Data tables and narrative documents review
PwC 7
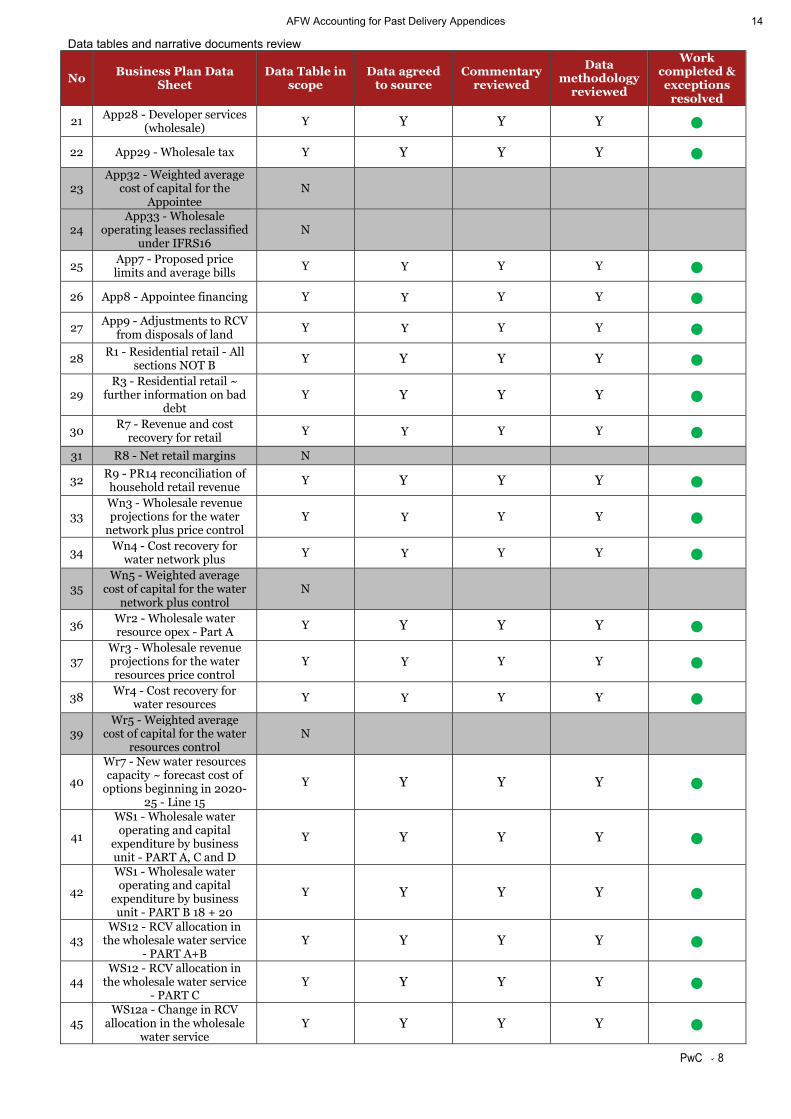
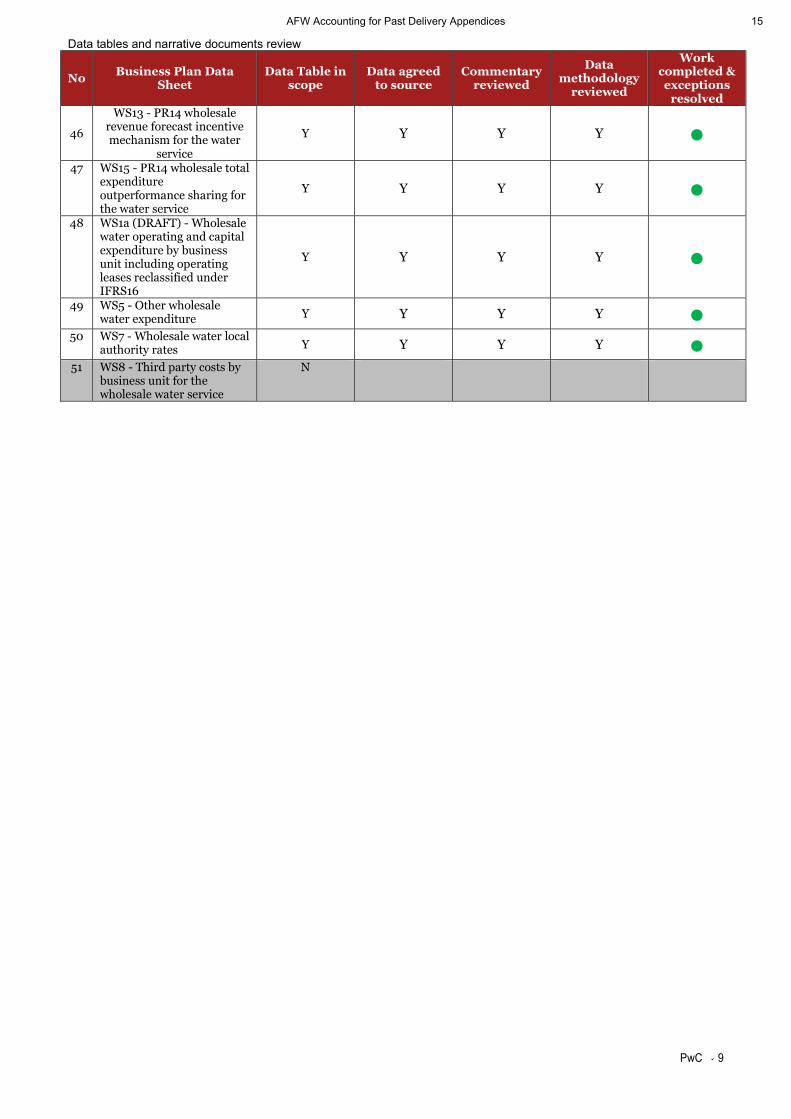
4. Testing by Data Table
Data tables and narrative documents reviewed
The table below shows the detail of data tables we have re-examined, and the outcome of our testing. Note that we have included a complete list of data tables that were in scope for our work in 28 September 2018 submission, with those that have changed since that date being in scope for re-submission work. The data tables which are out of scope are highlighted in grey.
No Business Plan Data
Sheet Data Table in
scope Data agreed
to source Commentary
reviewed
Data methodology
reviewed
Work completed & exceptions
resolved 1 App10 - Financial ratios
Y Y Y Y ● 2 App11 - Income statement
based on the actual company structure
Y Y Y Y ●
3 App11a - Income statement based on a notional company structure
Y Y Y Y ●
4 App12 - Balance sheet based on the actual company structure
Y Y Y Y ●
5 App12a - Balance sheet based on a notional company structure
Y Y Y Y ●
6 App13 - Trade receivables Y Y Y Y ●
7 App14 - Trade and other payables Y Y Y Y ●
8 App15 - Cashflow based on the actual company structure
Y Y Y Y ●
9 App15a - Cashflow based on a notional company structure
Y Y Y Y ●
10 App16 - Tangible Fixed assets Y Y Y Y ●
11 App17 - Appointee revenue summary Y Y Y Y ●
12 App18 - Share capital and dividends Y Y Y Y ●
13 App19 - Debt and interest costs Y Y Y Y ●
14 App21 - Direct procurement for customers Y Y Y Y ●
15 App22 - Pensions N 16 App23 - Inflation measures
Y Y Y Y ● 17 App24 - Input proportions
Y Y Y Y ● 18 App24a - Real price effects
(RPEs) and productivity assumptions
Y Y Y Y ●
19 App25 - PR14 reconciliation adjustments summary
Y Y Y Y ●
20 App26 - RoRE Scenarios Y Y Y Y ●
AFW Accounting for Past Delivery Appendices 13
Data tables and narrative documents review
PwC 8
No Business Plan Data
Sheet Data Table in
scope Data agreed
to source Commentary
reviewed
Data methodology
reviewed
Work completed & exceptions
resolved
21 App28 - Developer services (wholesale)
Y Y Y Y ●
22 App29 - Wholesale tax Y Y Y Y ●
23 App32 - Weighted average
cost of capital for the Appointee
N
24 App33 - Wholesale
operating leases reclassified under IFRS16
N
25 App7 - Proposed price limits and average bills Y Y Y Y ●
26 App8 - Appointee financing Y Y Y Y ●
27 App9 - Adjustments to RCV
from disposals of land Y Y Y Y ●
28 R1 - Residential retail - All sections NOT B
Y Y Y Y ●
29 R3 - Residential retail ~
further information on bad debt
Y Y Y Y ●
30 R7 - Revenue and cost
recovery for retail Y Y Y Y ● 31 R8 - Net retail margins N
32 R9 - PR14 reconciliation of household retail revenue
Y Y Y Y ●
33 Wn3 - Wholesale revenue projections for the water
network plus price control Y Y Y Y ●
34 Wn4 - Cost recovery for
water network plus Y Y Y Y ●
35 Wn5 - Weighted average
cost of capital for the water network plus control
N
36 Wr2 - Wholesale water resource opex - Part A
Y Y Y Y ●
37 Wr3 - Wholesale revenue projections for the water resources price control
Y Y Y Y ●
38 Wr4 - Cost recovery for water resources
Y Y Y Y ●
39 Wr5 - Weighted average
cost of capital for the water resources control
N
40
Wr7 - New water resources capacity ~ forecast cost of
options beginning in 2020-25 - Line 15
Y Y Y Y ●
41
WS1 - Wholesale water operating and capital
expenditure by business unit - PART A, C and D
Y Y Y Y ●
42
WS1 - Wholesale water operating and capital
expenditure by business unit - PART B 18 + 20
Y Y Y Y ●
43 WS12 - RCV allocation in
the wholesale water service - PART A+B
Y Y Y Y ●
44 WS12 - RCV allocation in
the wholesale water service - PART C
Y Y Y Y ●
45 WS12a - Change in RCV
allocation in the wholesale water service
Y Y Y Y ●
AFW Accounting for Past Delivery Appendices 14
Data tables and narrative documents review
PwC 9
No Business Plan Data
Sheet Data Table in
scope Data agreed
to source Commentary
reviewed
Data methodology
reviewed
Work completed & exceptions
resolved
46
WS13 - PR14 wholesale revenue forecast incentive mechanism for the water
service
Y Y Y Y ●
47 WS15 - PR14 wholesale total expenditure outperformance sharing for the water service
Y Y Y Y ●
48 WS1a (DRAFT) - Wholesale water operating and capital expenditure by business unit including operating leases reclassified under IFRS16
Y Y Y Y ●
49 WS5 - Other wholesale water expenditure Y Y Y Y ●
50 WS7 - Wholesale water local authority rates Y Y Y Y ●
51 WS8 - Third party costs by business unit for the wholesale water service
N
AFW Accounting for Past Delivery Appendices 15

This document has been prepared only for Affinity Water Limited and solely for the purpose and on the terms agreed with Affinity Water Limited in our agreement dated 28 February 2019. We accept no liability (including for negligence) to anyone else in connection with this document, and it may not be provided to anyone else.
© 2019 PwC. All rights reserved. “PwC” refers to the PwC network and/or one or more of its member firms, each of which is a separate legal entity. Please see www.pwc.com/structure for further details.
AFW Accounting for Past Delivery Appendices 16
AFW Securing Confidence and Assurance Appendices
Appendix PD.A3.1
Action ref AFW.PD.A3
Atkins Technical Assurance Report March 2019
AFW Accounting for Past Delivery Appendices 17

AFW Accounting for Past Delivery Appendices 18

AMP6 Technical Assurance
Assurance Report on PR19 Tables Re-Submission
Affinity Water
29 March 2019
Contains sensitive information
AFW Accounting for Past Delivery Appendices 19

AMP6 Technical Assurance Assurance Report on PR19 Tables Re-Submission
Contains sensitive information Private and confidential Atkins Assurance Report on PR19 Tables Re-Submission | Version 2.0 | 29 March 2019 | 5160860
Notice
This document and its contents have been prepared and are intended solely for Affinity Water’s information and use in relation to technical assurance on its PR19 Business Plan submission.
Atkins Limited assumes no responsibility to any other party in respect of or arising out of or in connection with this document and/or its contents.
This document has 19 pages including the cover.
Document history
Job number: 5160860 Document ref:
Revision Purpose description Originated Checked Reviewed Authorised Date
Rev 1.0 Draft report JPA TH/NK JAJ JPA 25/03/19
Rev 2.0 Final report JPA JAJ BA JPA 29/03/19
AFW Accounting for Past Delivery Appendices 20
AMP6 Technical Assurance Assurance Report on PR19 Tables Re-Submission
Contains sensitive information Private and confidential Atkins Assurance Report on PR19 Tables Re-Submission | Version 2.0 | 29 March 2019 | 5160860
Table of contents
Chapter Pages
1. Introduction 4 1.1. Background 4 1.2. Report Structure 4
2. Scope of Work 4
3. Key Findings 6 3.1. PR19 Data Tables 6 3.2. Performance Commitments and Outcome Delivery Incentives 12
Appendix 14
Appendix A. Audit and Meeting Schedule 15
Tables Table 2-1 Tables and Information Blocks Include in our Audits including comparison with scope from September 2018 submission 5
AFW Accounting for Past Delivery Appendices 21
AMP6 Technical Assurance Assurance Report on PR19 Tables Re-Submission
Contains sensitive information Private and confidential Atkins Assurance Report on PR19 Tables Re-Submission | Version 2.0 | 29 March 2019 | 5160860 4
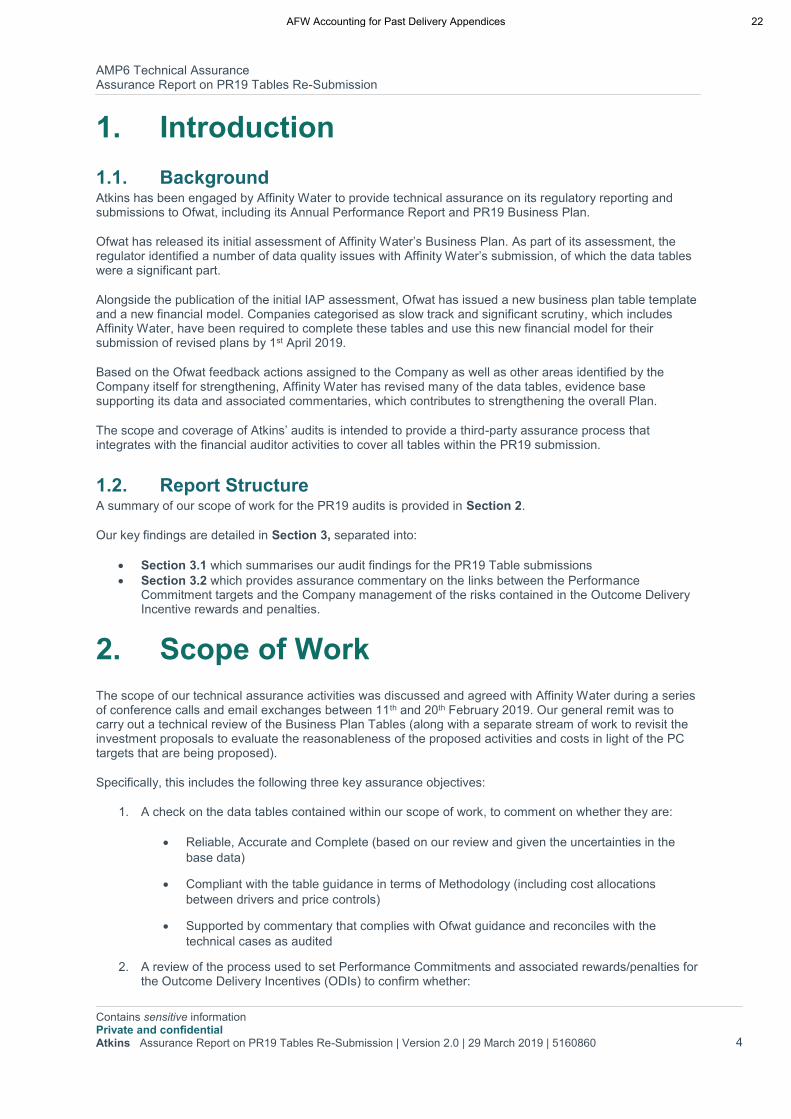
1. Introduction
1.1. Background Atkins has been engaged by Affinity Water to provide technical assurance on its regulatory reporting and submissions to Ofwat, including its Annual Performance Report and PR19 Business Plan.
Ofwat has released its initial assessment of Affinity Water’s Business Plan. As part of its assessment, the regulator identified a number of data quality issues with Affinity Water’s submission, of which the data tables were a significant part.
Alongside the publication of the initial IAP assessment, Ofwat has issued a new business plan table template and a new financial model. Companies categorised as slow track and significant scrutiny, which includes Affinity Water, have been required to complete these tables and use this new financial model for their submission of revised plans by 1st April 2019.
Based on the Ofwat feedback actions assigned to the Company as well as other areas identified by the Company itself for strengthening, Affinity Water has revised many of the data tables, evidence base supporting its data and associated commentaries, which contributes to strengthening the overall Plan.
The scope and coverage of Atkins’ audits is intended to provide a third-party assurance process that integrates with the financial auditor activities to cover all tables within the PR19 submission.
1.2. Report Structure A summary of our scope of work for the PR19 audits is provided in Section 2.
Our key findings are detailed in Section 3, separated into:
• Section 3.1 which summarises our audit findings for the PR19 Table submissions
• Section 3.2 which provides assurance commentary on the links between the Performance Commitment targets and the Company management of the risks contained in the Outcome Delivery Incentive rewards and penalties.
2. Scope of Work
The scope of our technical assurance activities was discussed and agreed with Affinity Water during a series of conference calls and email exchanges between 11th and 20th February 2019. Our general remit was to carry out a technical review of the Business Plan Tables (along with a separate stream of work to revisit the investment proposals to evaluate the reasonableness of the proposed activities and costs in light of the PC targets that are being proposed).
Specifically, this includes the following three key assurance objectives:
1. A check on the data tables contained within our scope of work, to comment on whether they are:
• Reliable, Accurate and Complete (based on our review and given the uncertainties in the
base data)
• Compliant with the table guidance in terms of Methodology (including cost allocations
between drivers and price controls)
• Supported by commentary that complies with Ofwat guidance and reconciles with the
technical cases as audited
2. A review of the process used to set Performance Commitments and associated rewards/penalties for the Outcome Delivery Incentives (ODIs) to confirm whether:
AFW Accounting for Past Delivery Appendices 22

AMP6 Technical Assurance Assurance Report on PR19 Tables Re-Submission
Contains sensitive information Private and confidential Atkins Assurance Report on PR19 Tables Re-Submission | Version 2.0 | 29 March 2019 | 5160860 5
• The definition of the metrics, targets and threshold for the proposed PCs and ODIs are clear
and transparent in accordance with Ofwat’s stated expectations.
• The proposals contained within the totex Investment Programme align with the PC targets
that are proposed, and Affinity Water has reasonably considered the uncertainties and
marginal cost risks when setting ODI rewards/penalties
• Affinity Waters’ modelling of the impact that PC targets and ODIs could have on return on
regulatory equity (RoRE) contains risk and uncertainty ranges that are reasonably reflective
of the data, processes and investment outputs that were used to generate the ODIs.
As per item 2, in general terms we were engaged to assist in confirming that there is a ‘line of sight’ between the Performance Commitment (PC) targets that were agreed with the CCG and the totex investment that has been proposed in the Business Plan. The derivation of the PCs themselves and the customer aspects of the ODIs (preferences, willingness to pay etc) have been challenged separately by the Customer Challenge Group, and in line with our activities during the original submission in September 2018, they are not included within our scope of works.
Our audits relate to the technical, rather than financial, aspects of the Business Plan so only covered a specific number of tables and lines. These are summarised in Table 2-1 below, which also highlights variations compared with the scope from the September 2018 submission.
Table 2-1 Tables and Information Blocks Include in our Audits including comparison with scope from September 2018 submission
Table Block/Line Reference Observations
App 1 - Performance commitments
All blocks and all lines Changed the outcomes tables to reflect some of the actions from the IAP assessment, including further information about the P10 and P90 performance levels
App1a - Outcome delivery incentive (ODI) - additional information
All blocks and all lines New table
App2 – Leakage additional information and old definition reporting
Block A Block B Block C Block D
App 3 – AIM
All blocks and all lines Changed the outcomes tables to reflect some of the actions from the IAP assessment, including further information about the P10 and P90 performance levels
App 4 – Affordability
All blocks and all lines Table substantially revised to incorporate Affordability data table submission requested after original September 2018 submission and also including some previously unreported additional data lines.
App 5 - PR14 Reconciliation: Performance Commitments
All blocks and all lines Updated to take account of revised forecasts for 2018/19.
App 27 - ODI PR14 reconciliation All blocks and all lines
App 30 – Voids All blocks and all lines
App 31 - Past Performance All blocks and all lines Not applicable in re-submission
R1 – Properties Block B only
R2 - Special cost factor data and R8 - PR14 reconciliation
All blocks and all lines Not applicable in re-submission
R3 - Customer metrics Block C (17-28) Not applicable in re-submission
R10 – PR14 Service incentive mechanism All Blocks
WS1 - Capex Block B (12-17, 19, 21)) Split grants and contributions into opex
and capex
WS2 – Capex Block A (1-39)
AFW Accounting for Past Delivery Appendices 23
AMP6 Technical Assurance Assurance Report on PR19 Tables Re-Submission
Contains sensitive information Private and confidential Atkins Assurance Report on PR19 Tables Re-Submission | Version 2.0 | 29 March 2019 | 5160860 6
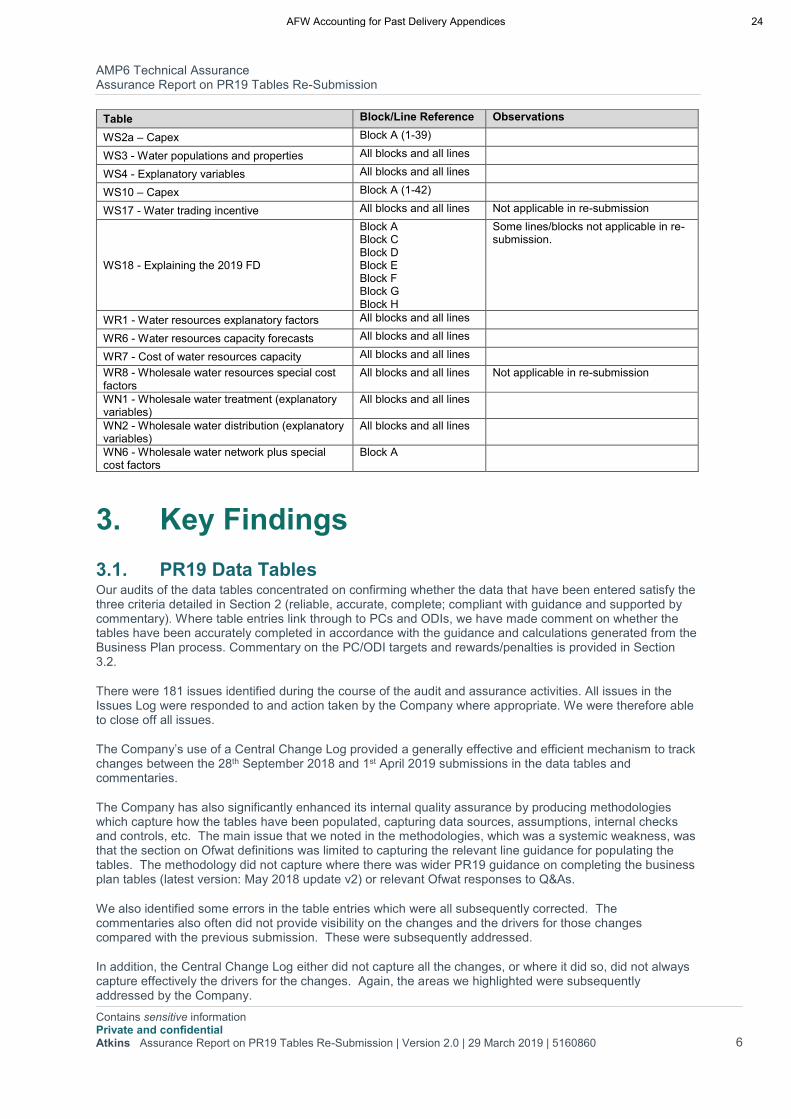
Table Block/Line Reference Observations
WS2a – Capex Block A (1-39)
WS3 - Water populations and properties All blocks and all lines
WS4 - Explanatory variables All blocks and all lines
WS10 – Capex Block A (1-42)
WS17 - Water trading incentive All blocks and all lines Not applicable in re-submission
WS18 - Explaining the 2019 FD
Block A Block C Block D Block E Block F Block G Block H
Some lines/blocks not applicable in re-submission.
WR1 - Water resources explanatory factors All blocks and all lines
WR6 - Water resources capacity forecasts All blocks and all lines
WR7 - Cost of water resources capacity All blocks and all lines
WR8 - Wholesale water resources special cost factors
All blocks and all lines Not applicable in re-submission
WN1 - Wholesale water treatment (explanatory variables)
All blocks and all lines
WN2 - Wholesale water distribution (explanatory variables)
All blocks and all lines
WN6 - Wholesale water network plus special cost factors
Block A
3. Key Findings
3.1. PR19 Data Tables Our audits of the data tables concentrated on confirming whether the data that have been entered satisfy the three criteria detailed in Section 2 (reliable, accurate, complete; compliant with guidance and supported by commentary). Where table entries link through to PCs and ODIs, we have made comment on whether the tables have been accurately completed in accordance with the guidance and calculations generated from the Business Plan process. Commentary on the PC/ODI targets and rewards/penalties is provided in Section 3.2.
There were 181 issues identified during the course of the audit and assurance activities. All issues in the Issues Log were responded to and action taken by the Company where appropriate. We were therefore able to close off all issues.
The Company’s use of a Central Change Log provided a generally effective and efficient mechanism to track changes between the 28th September 2018 and 1st April 2019 submissions in the data tables and commentaries.
The Company has also significantly enhanced its internal quality assurance by producing methodologies which capture how the tables have been populated, capturing data sources, assumptions, internal checks and controls, etc. The main issue that we noted in the methodologies, which was a systemic weakness, was that the section on Ofwat definitions was limited to capturing the relevant line guidance for populating the tables. The methodology did not capture where there was wider PR19 guidance on completing the business plan tables (latest version: May 2018 update v2) or relevant Ofwat responses to Q&As.
We also identified some errors in the table entries which were all subsequently corrected. The commentaries also often did not provide visibility on the changes and the drivers for those changes compared with the previous submission. These were subsequently addressed.
In addition, the Central Change Log either did not capture all the changes, or where it did so, did not always capture effectively the drivers for the changes. Again, the areas we highlighted were subsequently addressed by the Company.
AFW Accounting for Past Delivery Appendices 24
AMP6 Technical Assurance Assurance Report on PR19 Tables Re-Submission
Contains sensitive information Private and confidential Atkins Assurance Report on PR19 Tables Re-Submission | Version 2.0 | 29 March 2019 | 5160860 7
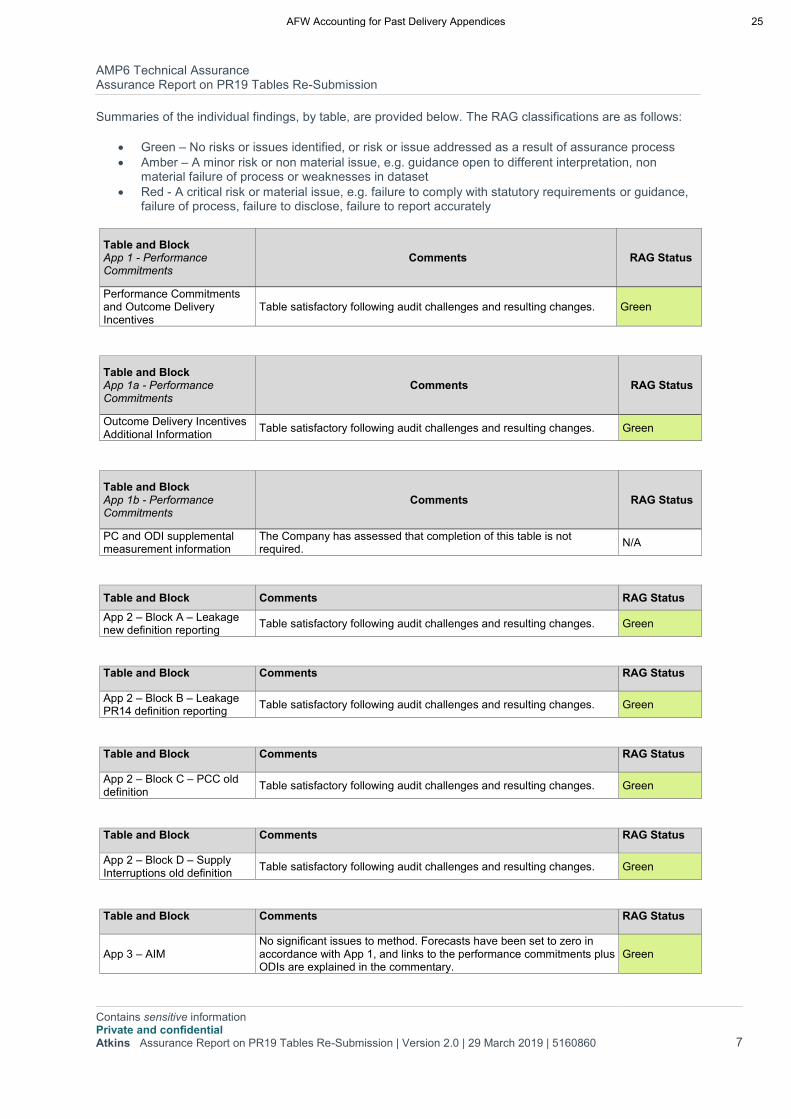
Summaries of the individual findings, by table, are provided below. The RAG classifications are as follows:
• Green – No risks or issues identified, or risk or issue addressed as a result of assurance process
• Amber – A minor risk or non material issue, e.g. guidance open to different interpretation, non material failure of process or weaknesses in dataset
• Red - A critical risk or material issue, e.g. failure to comply with statutory requirements or guidance, failure of process, failure to disclose, failure to report accurately
Table and Block App 1 - Performance Commitments
Comments RAG Status
Performance Commitments and Outcome Delivery Incentives
Table satisfactory following audit challenges and resulting changes. Green
Table and Block App 1a - Performance Commitments
Comments RAG Status
Outcome Delivery Incentives Additional Information
Table satisfactory following audit challenges and resulting changes. Green
Table and Block App 1b - Performance Commitments
Comments RAG Status
PC and ODI supplemental measurement information
The Company has assessed that completion of this table is not required.
N/A
Table and Block Comments RAG Status
App 2 – Block A – Leakage new definition reporting
Table satisfactory following audit challenges and resulting changes. Green
Table and Block Comments RAG Status
App 2 – Block B – Leakage PR14 definition reporting
Table satisfactory following audit challenges and resulting changes. Green
Table and Block Comments RAG Status
App 2 – Block C – PCC old definition
Table satisfactory following audit challenges and resulting changes. Green
Table and Block Comments RAG Status
App 2 – Block D – Supply Interruptions old definition
Table satisfactory following audit challenges and resulting changes. Green
Table and Block Comments RAG Status
App 3 – AIM No significant issues to method. Forecasts have been set to zero in accordance with App 1, and links to the performance commitments plus ODIs are explained in the commentary.
Green
AFW Accounting for Past Delivery Appendices 25

AMP6 Technical Assurance Assurance Report on PR19 Tables Re-Submission
Contains sensitive information Private and confidential Atkins Assurance Report on PR19 Tables Re-Submission | Version 2.0 | 29 March 2019 | 5160860 8
Table and Block Comments RAG Status
App 4 – Block A – Affordability Table satisfactory following audit challenges and resulting changes. Green
App4 – Block B - Vulnerability Table satisfactory following audit challenges and resulting changes. Green
Table and Block Comments RAG Status
App 5 - PR14 Reconciliation: Performance Commitments – R-A1 SIM service score
SIM score in App 5 for 2018/19 forecast (81) is an earlier forecast and does not reconcile with the R10 entry (82), the latter of which is the best central estimate. The Company has noted this discrepancy in its App 5 commentary.
Red
App 5 - PR14 Reconciliation: Performance Commitments – Other Lines
Table entries satisfactory following audit challenges and resulting changes.
Green
Table and Block App 27 - ODI PR14 reconciliation
Comments RAG Status
Block A - In-period ODI revenue adjustments by PR14 price control units (2012-13 prices)
Table satisfactory following audit challenges and resulting changes. Green
Block B -End of period ODI revenue adjustments by PR14 price control units (2012-13 prices)
Table satisfactory following audit challenges and resulting changes. Green
Block C - End of period ODI RCV adjustments by PR14 price control units (2012-13 prices)
Table satisfactory following audit challenges and resulting changes. Green
Block D - In-period ODI revenue adjustments allocated to PR19 price controls (2012-13 prices)
Table satisfactory following audit challenges and resulting changes. Green
Block E - End of period ODI revenue adjustments allocated to PR19 price controls (2012-13 prices)
Table satisfactory following audit challenges and resulting changes. Green
Block F - End of period ODI RCV adjustments allocated to PR19 price controls (2012-13 prices)
Table satisfactory following audit challenges and resulting changes. Green
Block G - In-period ODI revenue adjustments input to PR19 financial model (2017-18 prices)
Table satisfactory following audit challenges and resulting changes. Green
Block H - End of period ODI revenue adjustments input to PR19 financial model (2017-18 prices)
Table satisfactory following audit challenges and resulting changes. Green
Block I - End of period ODI RCV adjustments input to PR19 financial model (2017-18 prices)
Table satisfactory following audit challenges and resulting changes. Green
Table and Block Comments RAG Status
App 30 – Void Properties Table satisfactory following audit challenges and resulting changes. Green
Table and Block Comments RAG Status
AFW Accounting for Past Delivery Appendices 26
AMP6 Technical Assurance Assurance Report on PR19 Tables Re-Submission
Contains sensitive information Private and confidential Atkins Assurance Report on PR19 Tables Re-Submission | Version 2.0 | 29 March 2019 | 5160860 9
R1 – Block B - Customer numbers
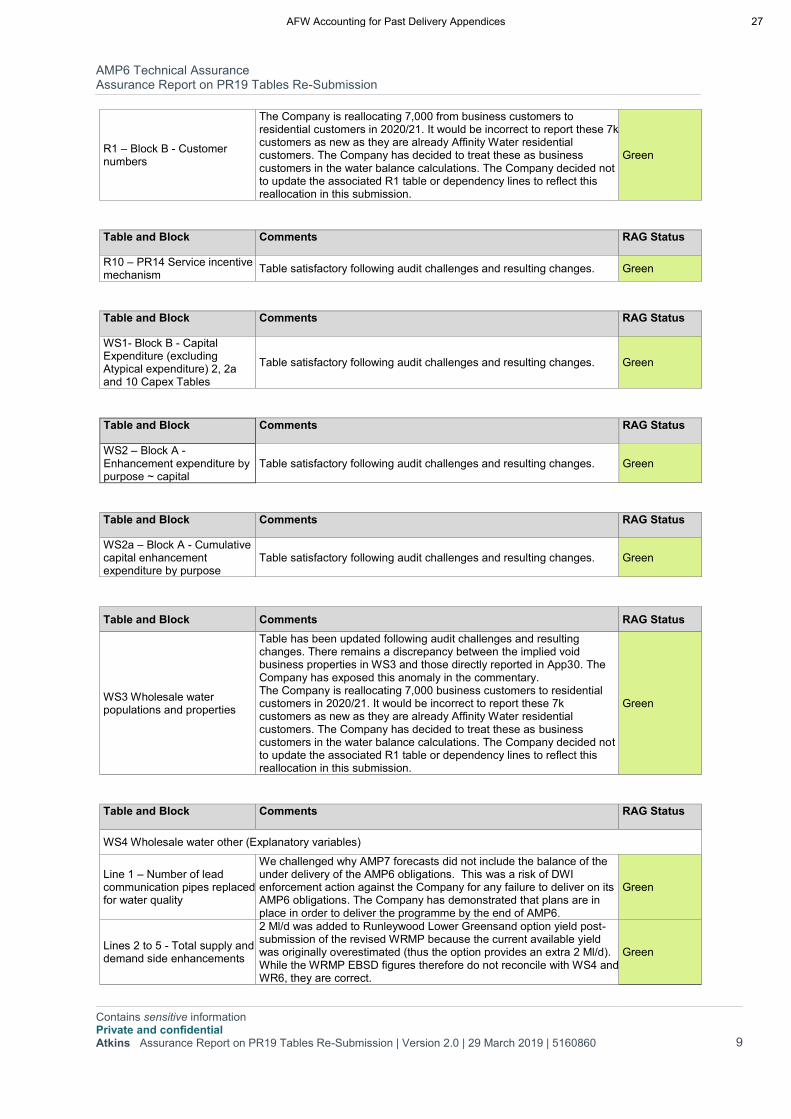
The Company is reallocating 7,000 from business customers to residential customers in 2020/21. It would be incorrect to report these 7k customers as new as they are already Affinity Water residential customers. The Company has decided to treat these as business customers in the water balance calculations. The Company decided not to update the associated R1 table or dependency lines to reflect this reallocation in this submission.
Green
Table and Block Comments RAG Status
R10 – PR14 Service incentive mechanism
Table satisfactory following audit challenges and resulting changes. Green
Table and Block Comments RAG Status
WS1- Block B - Capital Expenditure (excluding Atypical expenditure) 2, 2a and 10 Capex Tables
Table satisfactory following audit challenges and resulting changes. Green
Table and Block Comments RAG Status
WS2 – Block A - Enhancement expenditure by purpose ~ capital
Table satisfactory following audit challenges and resulting changes. Green
Table and Block Comments RAG Status
WS2a – Block A - Cumulative capital enhancement expenditure by purpose
Table satisfactory following audit challenges and resulting changes. Green
Table and Block Comments RAG Status
WS3 Wholesale water populations and properties
Table has been updated following audit challenges and resulting changes. There remains a discrepancy between the implied void business properties in WS3 and those directly reported in App30. The Company has exposed this anomaly in the commentary. The Company is reallocating 7,000 business customers to residential customers in 2020/21. It would be incorrect to report these 7k customers as new as they are already Affinity Water residential customers. The Company has decided to treat these as business customers in the water balance calculations. The Company decided not to update the associated R1 table or dependency lines to reflect this reallocation in this submission.
Green
Table and Block Comments RAG Status
WS4 Wholesale water other (Explanatory variables)
Line 1 – Number of lead communication pipes replaced for water quality
We challenged why AMP7 forecasts did not include the balance of the under delivery of the AMP6 obligations. This was a risk of DWI enforcement action against the Company for any failure to deliver on its AMP6 obligations. The Company has demonstrated that plans are in place in order to deliver the programme by the end of AMP6.
Green
Lines 2 to 5 - Total supply and demand side enhancements
2 Ml/d was added to Runleywood Lower Greensand option yield post-submission of the revised WRMP because the current available yield was originally overestimated (thus the option provides an extra 2 Ml/d). While the WRMP EBSD figures therefore do not reconcile with WS4 and WR6, they are correct.
Green
AFW Accounting for Past Delivery Appendices 27

AMP6 Technical Assurance Assurance Report on PR19 Tables Re-Submission
Contains sensitive information Private and confidential Atkins Assurance Report on PR19 Tables Re-Submission | Version 2.0 | 29 March 2019 | 5160860 10
Lines 6 to 8 Energy consumption
Revised as a result of challenges made through the audit process and resulting analysis
Green
Line 9 – Mean zonal compliance
No issues identified. Green
Line 10 – Compliance Risk Index
Changes made as a result of challenges made at audit. Green
Line 11 – Event Risk Index Changes made as a result of challenges made at audit. Green
Line 12 - Volume of leakage above or below the sustainable economic level
Table satisfactory following audit challenges and resulting changes. Green
Table and Block Comments RAG Status
WS10 – Block A - Transition capital expenditure purposes We have not been informed of any decisions to bring forward AMP7
expenditure into 2019/20 Not applicable
WS10 – Block B - Transition summary totals
Table and Block Comments RAG Status
WS18 Explaining the 2019 FD
Block A - Customer service Line 1 updated in line with historic APR reporting. Line 2 revised in line with actual reporting for 2018/19.
Green
Block C – Affordability Changes made as a result of challenges made during audit process. Green
Block E – Environmental Greenhouse gas emission revised to be based on historic trend data and incorporate company energy policy / planned energy efficiency activities.
Green
Block F – Bill Impacts No issues. Green
Block G - Total expenditure (real prices ~ 2017-18 FYA CPIH deflated)
No issues. Green
Block H – Customer engagement
No issues. Green
Table/ Block Comments RAG Status
WR1 Water resources explanatory factors
2017/18 figures were confirmed as part of the APR audits. Forecasts were reviewed against the latest version of the revised WRMP and these reconcile.
Green
Table and Block Comments RAG Status
WR6 Water resources capacity forecasts
Figures reconcile with WRMP modelling outputs. Green
Table and Block Comments RAG Status
WR7 Cost of Water resources capacity
The schemes that are listed reconcile with the WRMP model outputs and costs contained in the investment programme. We note that the majority of costs are associated with the initial development of the Abingdon reservoir scheme. One line was changed as a result of the audit process.
Green
Table and Block Comments RAG Status
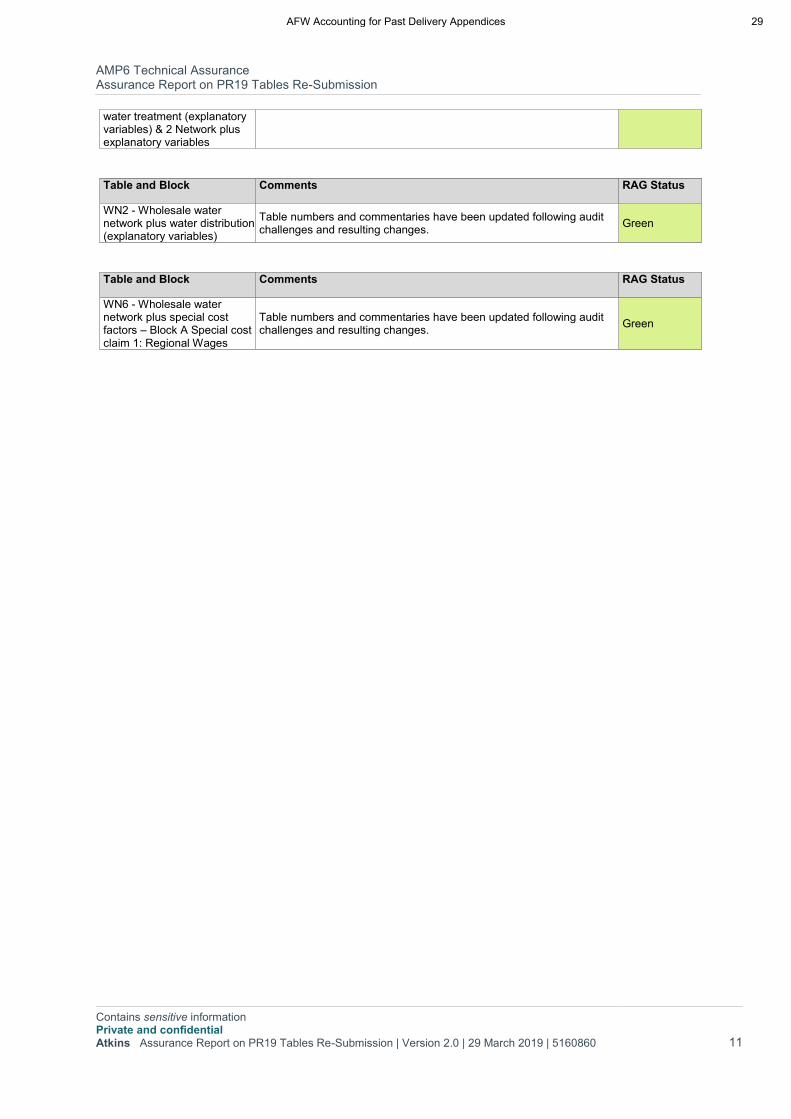
WN1 - Wholesale network plus raw water transport and
Table numbers and commentaries have been updated following audit challenges and resulting changes.
Green
AFW Accounting for Past Delivery Appendices 28
AMP6 Technical Assurance Assurance Report on PR19 Tables Re-Submission
Contains sensitive information Private and confidential Atkins Assurance Report on PR19 Tables Re-Submission | Version 2.0 | 29 March 2019 | 5160860 11
water treatment (explanatory variables) & 2 Network plus explanatory variables
Table and Block Comments RAG Status
WN2 - Wholesale water network plus water distribution (explanatory variables)
Table numbers and commentaries have been updated following audit challenges and resulting changes.
Green
Table and Block Comments RAG Status
WN6 - Wholesale water network plus special cost factors – Block A Special cost claim 1: Regional Wages
Table numbers and commentaries have been updated following audit challenges and resulting changes.
Green
AFW Accounting for Past Delivery Appendices 29
AMP6 Technical Assurance Assurance Report on PR19 Tables Re-Submission
Contains sensitive information Private and confidential Atkins Assurance Report on PR19 Tables Re-Submission | Version 2.0 | 29 March 2019 | 5160860 12
3.2. Performance Commitments and Outcome Delivery Incentives
Our draft findings were presented at the Board Meeting on 27th March 2019. In general terms, our audits were aimed at confirming that there is a ‘line of sight’ between the Performance Commitment (PC) targets and the totex investment that has been proposed in the Business Plan. The derivation of the PCs themselves and the customer aspects of the ODIs (preferences, willingness to pay, etc.) have been challenged separately by the Customer Challenge Group, and in line with our activities during the original submission in September 2018, they were not included within our scope of works.
Our audits relate to the technical, rather than financial, aspects of the Business Plan so they only covered a specific number of tables and lines. These are summarised above.
We discuss our findings from our review of the resubmitted Performance Commitments and associated rewards/penalties for the Outcome Delivery Incentives (ODIs) in the sections below.
3.2.1. Definition of metrics, targets and threshold for the PCs and ODIs We reviewed the detail of the preparation of the entries to Table App1 and found the definition of metrics, targets and threshold for the PCs and ODIs proposed to be clear and transparent in accordance with Ofwat’s stated expectations. The Company has in general accommodated the required changes from Ofwat in the IAP and has provided explanations where it has not done so. Targets and thresholds are aligned with the Company’s assessment of their achievability.
We note a particular target that may attract attention is the burst rate. The Company has elected to target the maintenance of stable performance across AMP 7, by continuing at the end-AMP6 level. We believe this to be reasonable in the context of increased burst identification due to the ambitious AMP7 leakage reduction programme, an aging asset stock and the need to resolve low pressure issues.
3.2.2. Totex Investment Programme alignment with proposed PC targets We reviewed the Totex Investment Programme and found it to align with the proposed PC targets. We believe that Affinity Water has reasonably considered the uncertainties and marginal cost risks when setting ODI rewards/penalties.
We reviewed the proposed Investment Portfolio, which is broken down into Capex and Opex, and includes Base Capex, Enhanced Capex and Enhanced Opex and Contributions. The Investment Portfolio does not include most components of Base Opex, other than some of the overall Leakage expenditure. We considered both the Base Programme and the Enhancement Programme.
We reviewed the enhanced programme and reviewed the larger elements of the programme where the Company had considered Ofwat’s IAP challenges in detail. The Company had considered the detailed breakdown of costs and whether efficiencies could be achieved. We saw how the Company was challenging itself to achieve efficiencies through changed operational practices and lessons learned through similar work in AMP6.
For lead communication pipes (CPs) and service pipe replacement, we noted a potentially low unit rate, which will need clear definition of scope, as the rates appear to be based upon more conventional CP and (garden) service pipe replacement, rather than considering work up to the internal stop tap.
For Pesticides Monitors, we noted that costing was based upon the manufacturers price, which will need supply efficiencies to be achieved.
We note that leakage is considered by Ofwat as Base and that this is subject to challenge by the Company. We considered leakage as a block of totex and found that the Company was making assumptions about future efficiency gains through innovation and improved operational practices that are costed and understood.
We reviewed the Investment Portfolio to seek line of sight between PCs and expenditure. We found that each PC had expenditure against it or that it was included in the consideration of other PCs. We also considered the expenditure portfolio and confirmed the reason why each element was included. Overall, we
AFW Accounting for Past Delivery Appendices 30

AMP6 Technical Assurance Assurance Report on PR19 Tables Re-Submission
Contains sensitive information Private and confidential Atkins Assurance Report on PR19 Tables Re-Submission | Version 2.0 | 29 March 2019 | 5160860 13
were content that all bases were covered, but achieving the performance with the included expenditure will rely on cross PC synergies, holistic thinking, good operational practice and effective management.
3.2.3. Impact of PC targets and ODIs on RoRE We reviewed the make-up of the Return on Regulated Equity (RoRE), with the main focus on the penalties and rewards associated with Performance Commitments. We went through the Company’s P10 and P90 assessments made for each Performance Commitment and considered the assessed P10 scenario and the impact of PC targets and ODIs on RoRE. We confirmed that the processes applied contain risk and uncertainty ranges that are reasonably reflective of the data, processes and investment outputs that were used to generate the ODIs.
We noted that the proposed RoRE for the “P10 scenario” was less than 3% and that the RoRE proposals are very skewed towards penalty and there is a limited scope for reward. The P10 for individual PCs has been determined through expert judgement. We considered each and found them to be reasonable, based upon historic performance. A particular PC which received our attention was leakage which had a P10 value significantly below the 2018/19 outturn. The P10 figure appears reasonable against historic leakage. The higher 2018/19 value is a “one-off” caused by a single long running burst trunk main, which has triggered internal actions to avoid a recurrence. The suite of PC performance levels coinciding with the overall “P10 scenario” appeared reasonable and possible.
AFW Accounting for Past Delivery Appendices 31

Contains sensitive information Private and confidential Atkins Assurance Report on PR19 Tables Re-Submission | Version 2.0 | 29 March 2019 | 5160860 14
Appendix
AFW Accounting for Past Delivery Appendices 32

AMP6 Technical Assurance Assurance Report on PR19 Tables Re-Submission
Contains sensitive information Private and confidential Atkins Assurance Report on PR19 Tables Re-Submission | Version 2.0 | 29 March 2019 | 5160860 15
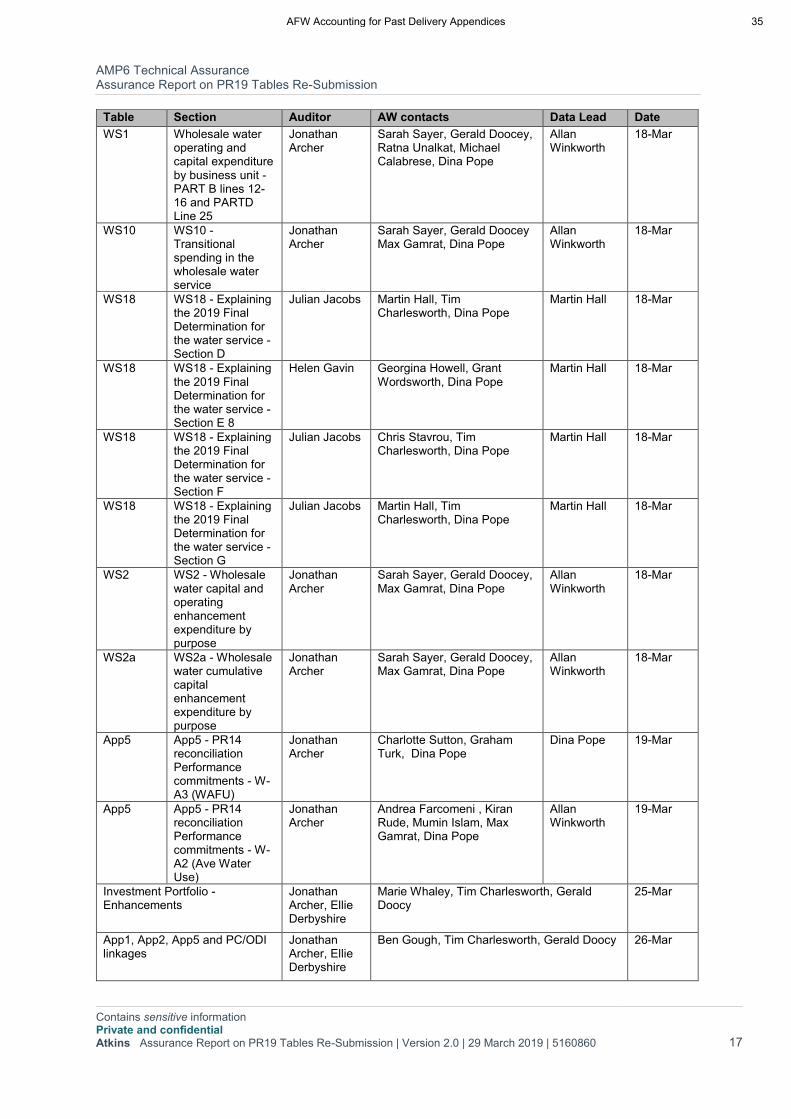
Appendix A. Audit and Meeting Schedule
Table Section Auditor AW contacts Data Lead Date
App2 Section D - Old Definition Supply Interruptions
Jonathan Archer
Ben Gough, Tim Charlesworth
Martin Hall 11-Mar
App2 App2 line 9 Potable mains
Jonathan Archer
Alex Rigby, Patrick Campbell Allan Winkworth
11-Mar
Leakage - App2 and App5
App2 and App5 - Leakage
Jonathan Archer
Ritchie Carruthers, Mumin Islam Tony Summerscales, Patrick Campbell
Allan Winkworth
11-Mar
Wn1 Wholesale water treatment (explanatory variables) - All
Simon Ingall Jon Weaver, Mike Collin, Richard Box, Eldos Then, Alex Rigby, Alice Elder, Natalie Fitzpatrick, Karinn Locke, Patrick Campbell
Allan Winkworth
11-Mar
Wn2 Wholesale Water Distribution (explanatory variables)- ALL
Simon Ingall Alex Rigby, Natalie Fitzpatrick, Richard Box, Eldos Then, Kiran Ruda, Mike Collin, Mumin Islam, Patrick Campbell
Allan Winkworth
11-Mar
WS4 WS4 - Wholesale water other (explanatory variables) 12
Jonathan Archer
Ritchie Carruthers, Mumin Islam
Allan Winkworth
11-Mar
App1, 1a and 1b
All Sections - Performance commitments (PCs) and outcome delivery incentives (ODIs)
Jonathan Archer
Ben Gough , Tim Charlesworth
Martin Hall 12-Mar
App30 Voids Julian Jacobs Martin Hall, Jackie Welsh Pragya Ahikari
12-Mar
App4 App4 – Common metrics for affordability and vulnerability
Julian Jacobs Liz Freitas, Jackie Welsh, James Tipler, Katy Taqvi
Pragya Ahikari
12-Mar
R1 R1 - Residential retail - All section B
Simon Ingall Ben Drake, Michael Calabrese
Ratna Unalkat
12-Mar
WS18 WS18 - Explaining the 2019 Final Determination for the water service - Section C
Julian Jacobs Liz Freitas, Jackie Welsh Pragya Ahikari
12-Mar
WS3 Wholesale water properties and population
Simon Ingall Ritchie Carruthers, Mumin Islam
Allan Winkworth
12-Mar
App27 App27 - Financial outcome delivery incentives summary
Jonathan Archer
Martin Hall , Tim Charlesworth
Martin Hall 13-Mar
Wn6 Wholesale water network plus special cost factors
Jonathan Archer
Martin Hall , Tim Charlesworth
Martin Hall 13-Mar
Wr8 Wr8 - Wholesale water resources special cost factors
Jonathan Archer
Martin Hall , Tim Charlesworth
Martin Hall 13-Mar
WS18 WS18 - Explaining the 2019 Final Determination for
Julian Jacobs Eddie Lintott and Fiona Waller
Martin Hall 13-Mar
AFW Accounting for Past Delivery Appendices 33

AMP6 Technical Assurance Assurance Report on PR19 Tables Re-Submission
Contains sensitive information Private and confidential Atkins Assurance Report on PR19 Tables Re-Submission | Version 2.0 | 29 March 2019 | 5160860 16
Table Section Auditor AW contacts Data Lead Date
the water service - Section A Line 2
WS18 WS18 - Explaining the 2019 Final Determination for the water service - Section A Line 1
Julian Jacobs Ritchie Carruthers, Mumin Islam
Allan Winkworth
13-Mar
WS18 WS18 - Explaining the 2019 Final Determination for the water service - Section B
Julian Jacobs Alister Leggatt, Ellie Powers Allan Winkworth
13-Mar
WS18 WS18 - Explaining the 2019 Final Determination for the water service - Section E 7
Julian Jacobs David Watts, Ellie Powers Allan Winkworth
13-Mar
WS4 WS4 - Wholesale water other (explanatory variables) 1 + 9-11
Julian Jacobs Eddie Lintott and Fiona Waller
Martin Hall 13-Mar
WS4 WS4 - Wholesale water other (explanatory variables) 6 - 8
Simon Ingall Charlotte Sutton, Graham Turk
Allan Winkworth
13-Mar
App3 App3 – Abstraction Incentive Mechanism - surface and ground water abstractions under the AIM threshold
Monica Barker
Ilias Karapanos, Dan Yarker, Affie Panayiotou, Max Gamrat, Dina Pope
Allan Winkworth
17-Mar
App5 App5 - PR14 reconciliation – performance commitments - W-A4 ( Sustainable Abstraction Reduction) and W-A5 (AIM)
Monica Barker
Ilias Karapanos, Dan Yarker, Affie Panayiotou, Max Gamrat, Dina Pope
Allan Winkworth
17-Mar
Wr1 Wr1 - Wholesale water resources (explanatory variables) - All
Monica Barker
Richard Box, Eldos Then, Jon Weaver, Natalie Fitzpatrick, Alex Rigby, Mike Collin, Nick Honeyball, Patrick Campbell, Karinn Locke, Max Gamrat, Dina Pope
Allan Winkworth
17-Mar
Wr6 Wr6 - Water resources capacity forecasts
Monica Barker
Ritchie Carruthers, Mumin Islam Max Gamrat, Dina Pope
Allan Winkworth
17-Mar
Wr7 Wr7 - New water resources capacity ~ forecast cost of options beginning in 2020-25 - All lines except 15
Monica Barker
Andrea Farcomeni , Mumin Islam, Max Gamrat, Dina Pope
Allan Winkworth
17-Mar
WS4 WS4 - Wholesale water other (explanatory variables) 2-5
Monica Barker
Andrea Farcomeni , Mumin Islam, Max Gamrat, Dina Pope
Allan Winkworth
17-Mar
R3 R3 - Residential retail ~ further information on bad debt (Block C)
Julian Jacobs Ben Drake, Michael Calabrese, Dina Pope
Ratna Unalkat
18-Mar
AFW Accounting for Past Delivery Appendices 34
AMP6 Technical Assurance Assurance Report on PR19 Tables Re-Submission
Contains sensitive information Private and confidential Atkins Assurance Report on PR19 Tables Re-Submission | Version 2.0 | 29 March 2019 | 5160860 17
Table Section Auditor AW contacts Data Lead Date
WS1 Wholesale water operating and capital expenditure by business unit - PART B lines 12-16 and PARTD Line 25
Jonathan Archer
Sarah Sayer, Gerald Doocey, Ratna Unalkat, Michael Calabrese, Dina Pope
Allan Winkworth
18-Mar
WS10 WS10 - Transitional spending in the wholesale water service
Jonathan Archer
Sarah Sayer, Gerald Doocey Max Gamrat, Dina Pope
Allan Winkworth
18-Mar
WS18 WS18 - Explaining the 2019 Final Determination for the water service - Section D
Julian Jacobs Martin Hall, Tim Charlesworth, Dina Pope
Martin Hall 18-Mar
WS18 WS18 - Explaining the 2019 Final Determination for the water service - Section E 8
Helen Gavin Georgina Howell, Grant Wordsworth, Dina Pope
Martin Hall 18-Mar
WS18 WS18 - Explaining the 2019 Final Determination for the water service - Section F
Julian Jacobs Chris Stavrou, Tim Charlesworth, Dina Pope
Martin Hall 18-Mar
WS18 WS18 - Explaining the 2019 Final Determination for the water service - Section G
Julian Jacobs Martin Hall, Tim Charlesworth, Dina Pope
Martin Hall 18-Mar
WS2 WS2 - Wholesale water capital and operating enhancement expenditure by purpose
Jonathan Archer
Sarah Sayer, Gerald Doocey, Max Gamrat, Dina Pope
Allan Winkworth
18-Mar
WS2a WS2a - Wholesale water cumulative capital enhancement expenditure by purpose
Jonathan Archer
Sarah Sayer, Gerald Doocey, Max Gamrat, Dina Pope
Allan Winkworth
18-Mar
App5 App5 - PR14 reconciliation Performance commitments - W-A3 (WAFU)
Jonathan Archer
Charlotte Sutton, Graham Turk, Dina Pope
Dina Pope 19-Mar
App5 App5 - PR14 reconciliation Performance commitments - W-A2 (Ave Water Use)
Jonathan Archer
Andrea Farcomeni , Kiran Rude, Mumin Islam, Max Gamrat, Dina Pope
Allan Winkworth
19-Mar
Investment Portfolio - Enhancements
Jonathan Archer, Ellie Derbyshire
Marie Whaley, Tim Charlesworth, Gerald Doocy
25-Mar
App1, App2, App5 and PC/ODI linkages
Jonathan Archer, Ellie Derbyshire
Ben Gough, Tim Charlesworth, Gerald Doocy 26-Mar
AFW Accounting for Past Delivery Appendices 35

AMP6 Technical Assurance Assurance Report on PR19 Tables Re-Submission
Contains sensitive information Private and confidential Atkins Assurance Report on PR19 Tables Re-Submission | Version 2.0 | 29 March 2019 | 5160860 18
Table Section Auditor AW contacts Data Lead Date
Full investment portfolio Jonathan Archer, Ellie Derbyshire
Sarah Sayer, Marie Whaley, Patrick Campbell, Tim Charlesworth, Gerald Doocy
27-Mar
Board Meeting Jonathan Archer
Board members and Exec members 27-Mar
Board Meeting Jonathan Archer
Board members and Exec members 29-Mar
AFW Accounting for Past Delivery Appendices 36
© Atkins Ltd except where stated otherwise. The Atkins logo, ‘Carbon Critical Design’ and the strapline ‘Plan Design Enable’ are trademarks of Atkins Ltd.
Jonathan Archer Atkins Ltd Email: [email protected] Direct telephone: 01372 756647
AFW Accounting for Past Delivery Appendices 37

AFW Accounting for Past Delivery Appendices 38

AFW Securing Confidence and Assurance Appendices
Appendix PD.A5.1
Action ref AFW.PD.A5
p47 of Setting price controls for 2015-20: Final price control determination notice: policy chapter A3 – wholesale water and wastewater costs and revenues
AFW Accounting for Past Delivery Appendices 39

AFW Accounting for Past Delivery Appendices 40

Final price control determination notice: policy chapter A3 – wholesalewater and wastewater costs and revenues
47
A3.3.2.1 Our draft determinations
In our draft determinations we explained that this category of income comprisedcapital contributions from connection charges and revenue from infrastructurecharges – typically from developers of new properties and made in relation to newconnections.
Unless otherwise stated in the company-specific appendix to our draftdeterminations, we used company business plan forecasts as the basis of expectedreceipts from these sources in our draft determinations.
A3.3.2.2 Issues raised by representations
We received one representation in response to our draft determinations on thissubject.
South East Water identified that it had made an error in preparing its revisedbusiness plan in June 2014, which had the effect of understating its future level ofexpected income from connection and infrastructure charges by around £18 millionover the next price control period. It stated that this did not affect the level of nettotex in its plan, rather that it had understated both the level of gross capex and alsothe receipts from capital contributions, which offset each other.
A3.3.2.3 Our final determinations
We have retained the approach adopted at draft determinations, but updated ourfinancial modelling to correct for South East Water’s error.
We also reiterate what we said in our final methodology statement about connectioncharges:
“If a company increased revenue by unduly reducing connection charges we
may take corrective action to ensure that companies returned these monies
(with financing costs) to customers. Similarly, although we have decided not
to allow automatic adjustments to allowed revenues for demand variations in
wholesale controls, if demand for connections is unexpectedly high then we
would nevertheless consider allowing extra revenue to compensate for the
loss of price control revenue on a case-by-case basis.”
AFW Accounting for Past Delivery Appendices 41

AFW Accounting for Past Delivery Appendices 42
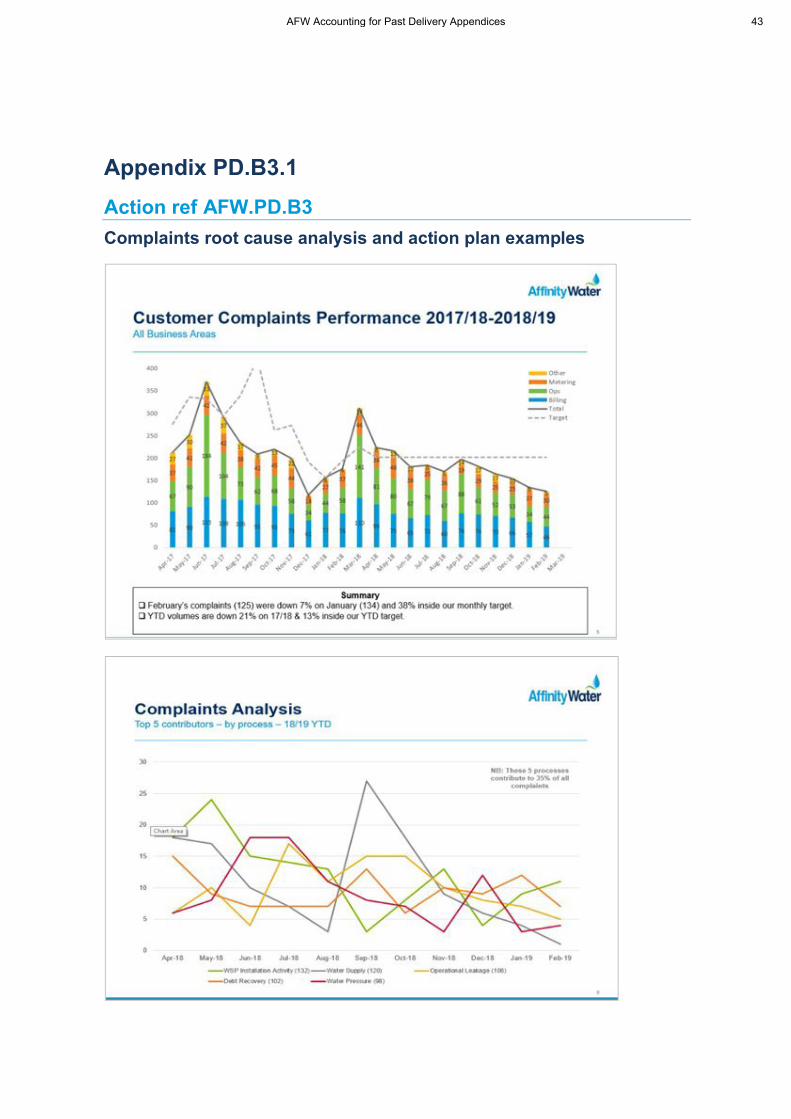
Appendix PD.B3.1
Action ref AFW.PD.B3
Complaints root cause analysis and action plan examples
AFW Accounting for Past Delivery Appendices 43
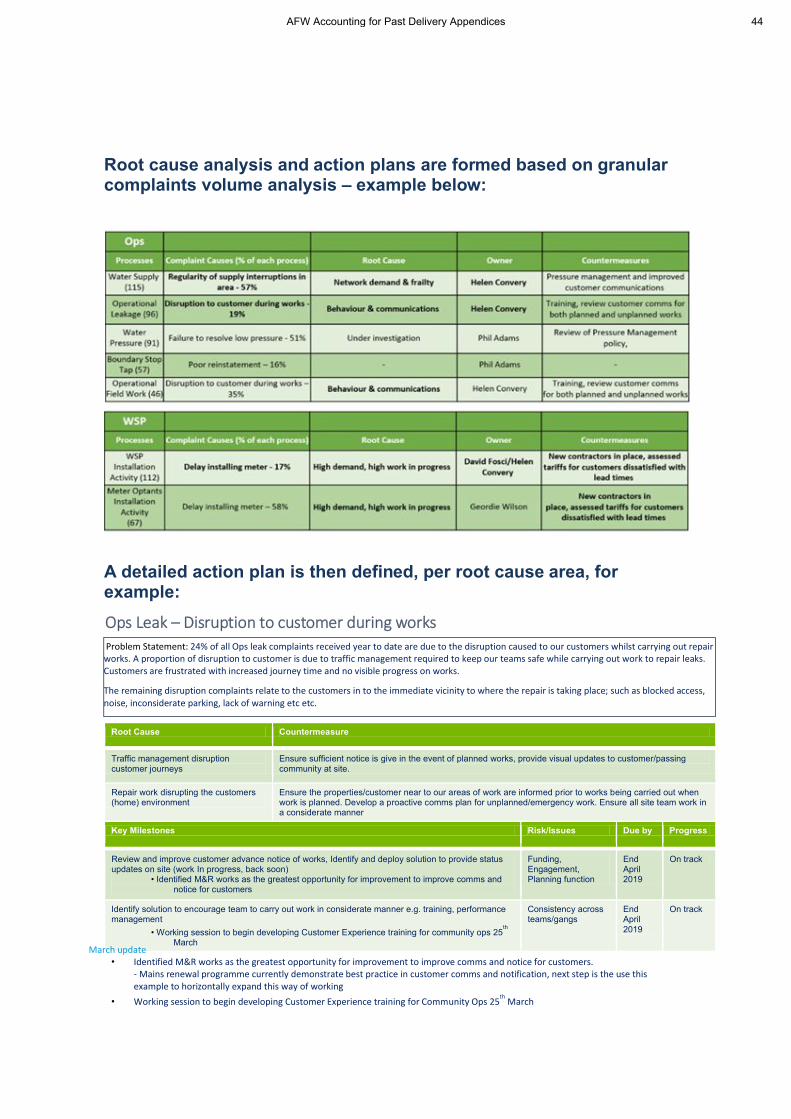
Root cause analysis and action plans are formed based on granular complaints volume analysis – example below:
A detailed action plan is then defined, per root cause area, for example:
Root Cause Countermeasure
Traffic management disruption customer journeys
Ensure sufficient notice is give in the event of planned works, provide visual updates to customer/passing community at site.
Repair work disrupting the customers (home) environment
Ensure the properties/customer near to our areas of work are informed prior to works being carried out when work is planned. Develop a proactive comms plan for unplanned/emergency work. Ensure all site team work in a considerate manner
Key Milestones Risk/Issues Due by Progress
Review and improve customer advance notice of works, Identify and deploy solution to provide status updates on site (work In progress, back soon)
• Identified M&R works as the greatest opportunity for improvement to improve comms and notice for customers
Funding, Engagement, Planning function
End April 2019
On track
Identify solution to encourage team to carry out work in considerate manner e.g. training, performance management
• Working session to begin developing Customer Experience training for community ops 25th
March
Consistency across teams/gangs
End April 2019
On track
March update • Identified M&R works as the greatest opportunity for improvement to improve comms and notice for customers.
- Mains renewal programme currently demonstrate best practice in customer comms and notification, next step is the use this example to horizontally expand this way of working
• Working session to begin developing Customer Experience training for Community Ops 25th
March
Ops Leak – Disruption to customer during works Problem Statement: 24% of all Ops leak complaints received year to date are due to the disruption caused to our customers whilst carrying out repair works. A proportion of disruption to customer is due to traffic management required to keep our teams safe while carrying out work to repair leaks. Customers are frustrated with increased journey time and no visible progress on works.
The remaining disruption complaints relate to the customers in to the immediate vicinity to where the repair is taking place; such as blocked access, noise, inconsiderate parking, lack of warning etc etc.
AFW Accounting for Past Delivery Appendices 44

Appendix PD.B3.2
Action ref AFW.PD.B3
Chart showing reduction in complaints response time for all business areas 15/16 18/19
AFW Accounting for Past Delivery Appendices 45

AFW Accounting for Past Delivery Appendices 46
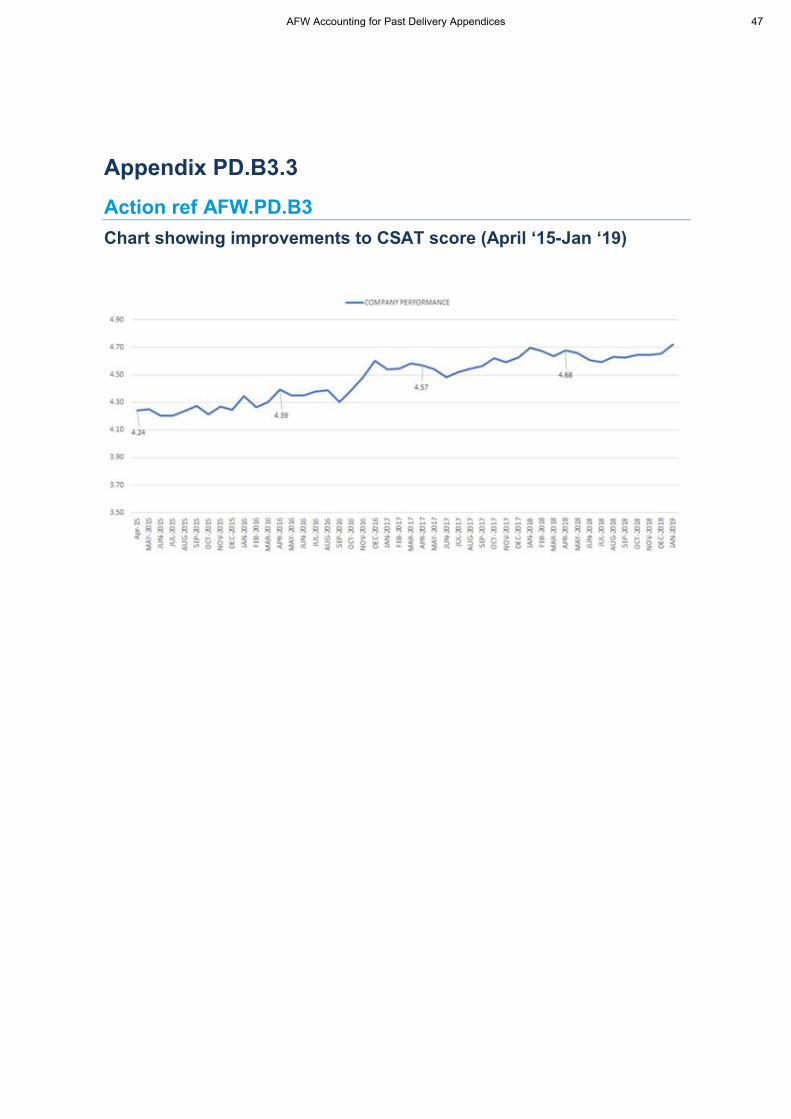
Appendix PD.B3.3
Action ref AFW.PD.B3
Chart showing improvements to CSAT score (April ‘15-Jan ‘19)
AFW Accounting for Past Delivery Appendices 47

AFW Accounting for Past Delivery Appendices 48
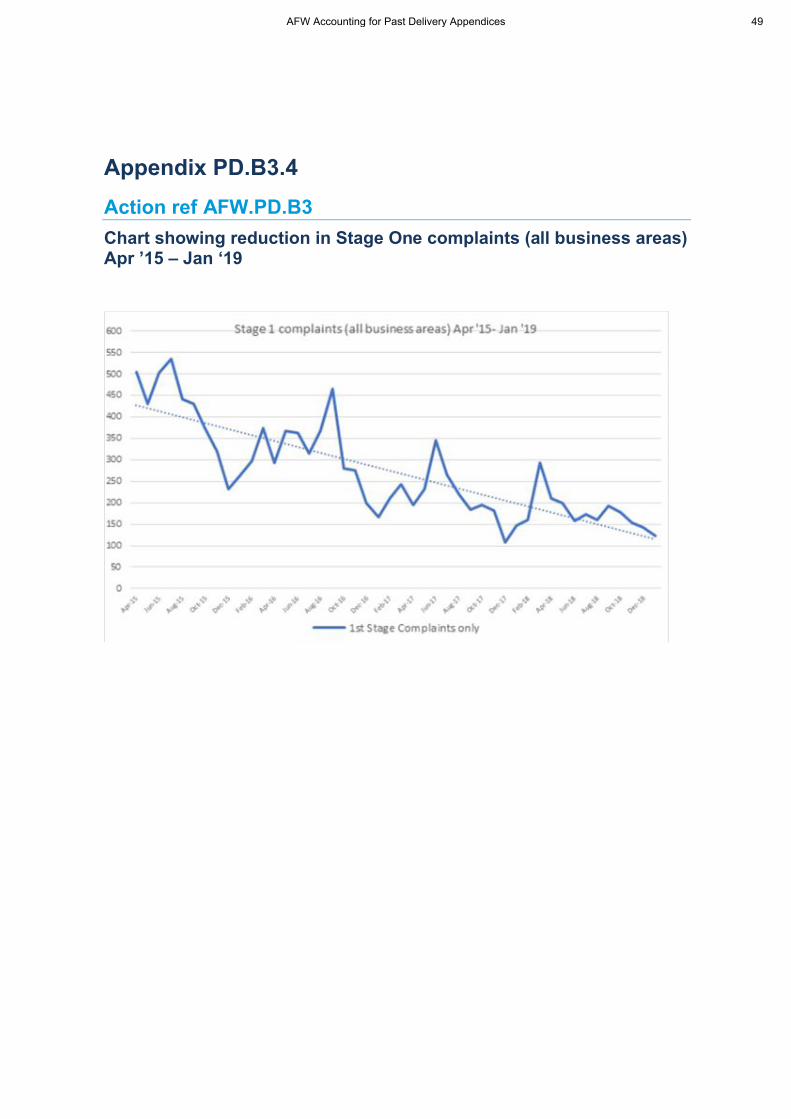
Appendix PD.B3.4
Action ref AFW.PD.B3
Chart showing reduction in Stage One complaints (all business areas)Apr ’15 – Jan ‘19
AFW Accounting for Past Delivery Appendices 49

AFW Accounting for Past Delivery Appendices 50

Appendix PD.B3.5
Action ref AFW.PD.B3
Chart showing reduction in Stage 2 complaints (all business areas) April ’15- Jan ’19
AFW Accounting for Past Delivery Appendices 51

AFW Accounting for Past Delivery Appendices 52
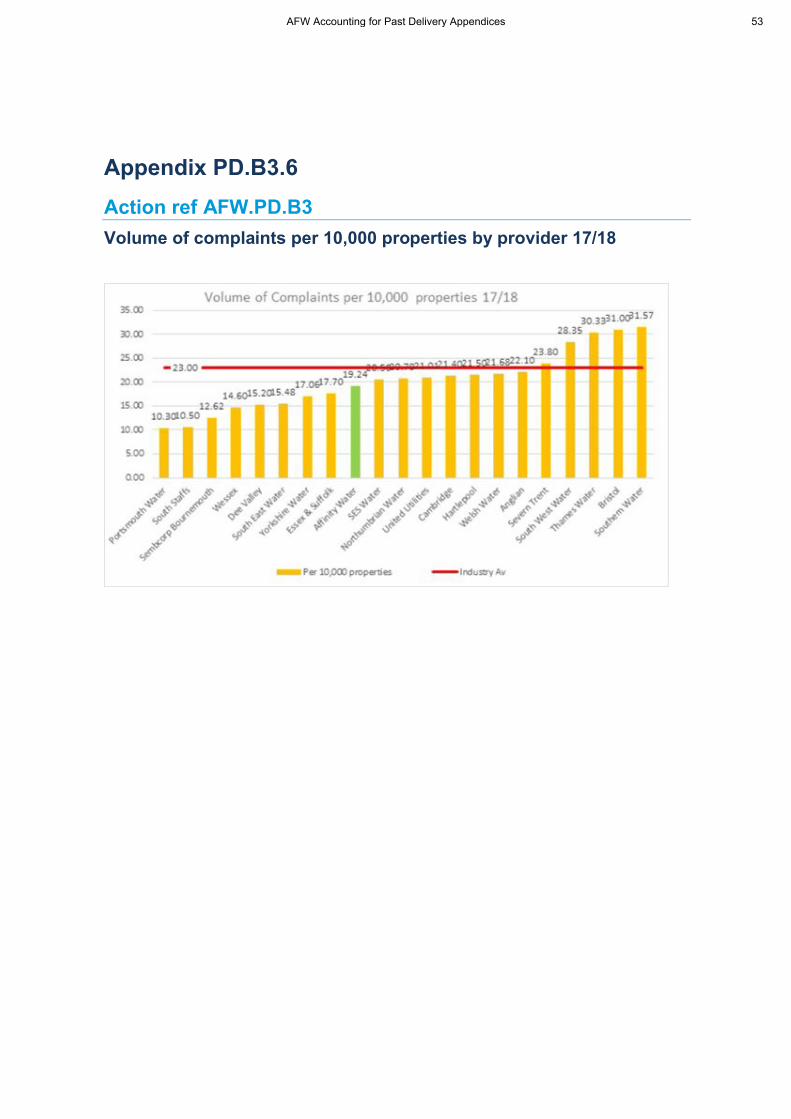
Appendix PD.B3.6
Action ref AFW.PD.B3
Volume of complaints per 10,000 properties by provider 17/18
AFW Accounting for Past Delivery Appendices 53

AFW Accounting for Past Delivery Appendices 54

Appendix PD.B3.7
Action ref AFW.PD.B3
Volume of complaints per 10,000 properties 18/19 (Q1-Q3)
AFW Accounting for Past Delivery Appendices 55

AFW Accounting for Past Delivery Appendices 56
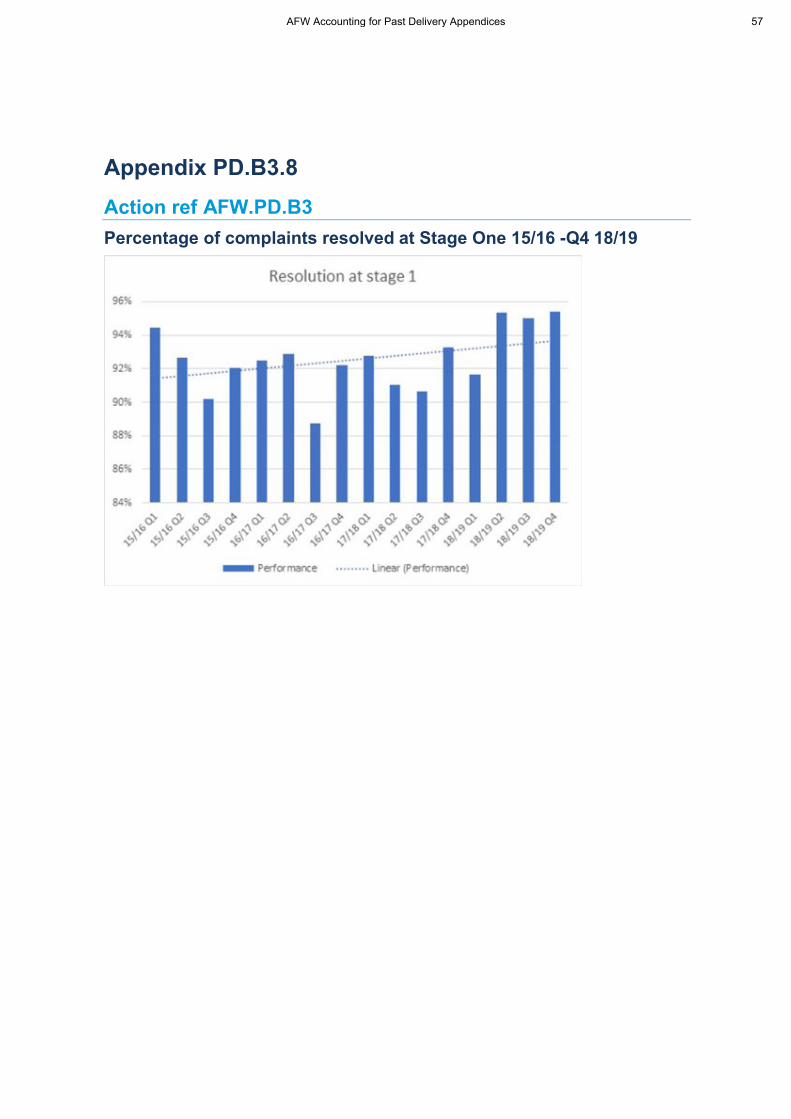
Appendix PD.B3.8
Action ref AFW.PD.B3
Percentage of complaints resolved at Stage One 15/16 -Q4 18/19
AFW Accounting for Past Delivery Appendices 57

AFW Accounting for Past Delivery Appendices 58
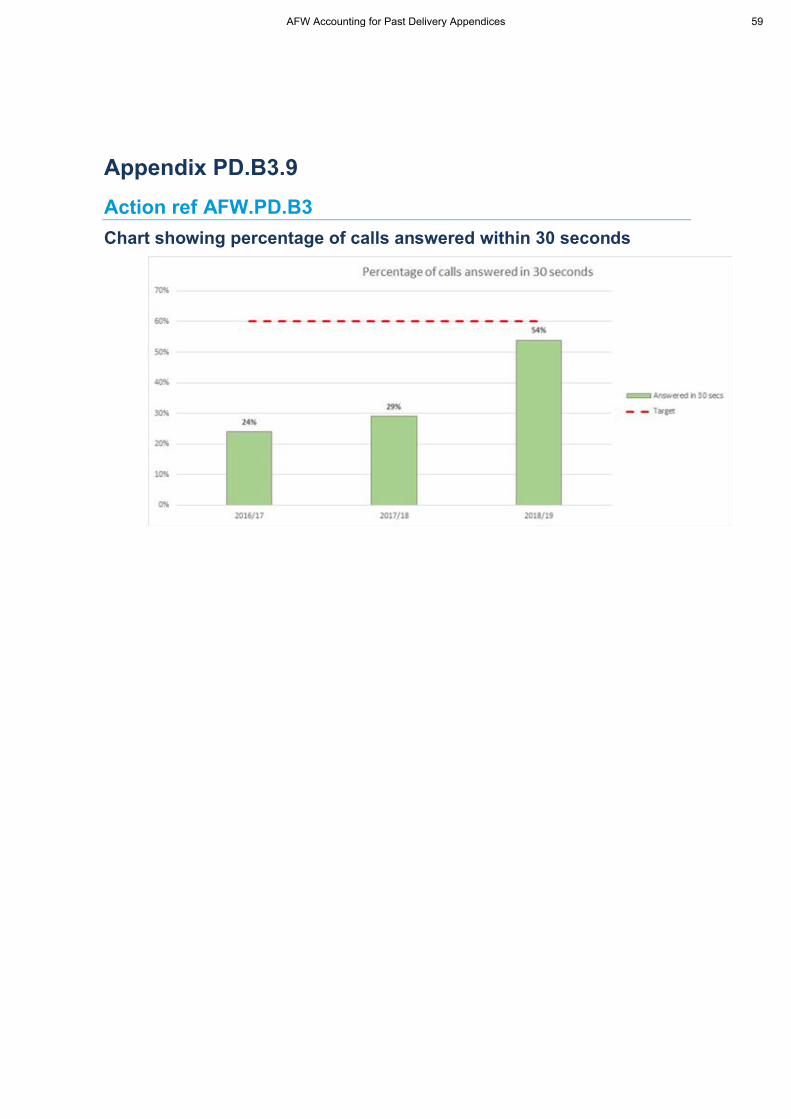
Appendix PD.B3.9
Action ref AFW.PD.B3
Chart showing percentage of calls answered within 30 seconds
AFW Accounting for Past Delivery Appendices 59

AFW Accounting for Past Delivery Appendices 60

Appendix PD.B3.10
Action ref AFW.PD.B4
Case Study - Applying lessons learned from poor, good andacceptable performance in customer communicationsThe customer pain-point
We have recognised that customer communication is having one of the greatest impacts oncustomer satisfaction. For example, our complaints analysis highlighted that our debt recoveryletters were a cause of dissatisfaction.
Actions taken
Following consultation with our customers and customer-facing advisors we madeimprovements to these letters. We acknowledged and thanked those customers who had madecontinuous effort to reduce their debt, whilst prompting them to set up a payment plan to clearremaining arrears.
Results
Changes to our payment plan reminder letters was a key factor in reducing debt recovery complaints by 20%. We have subsequently reviewed and made positive changes to other lettersand emails that we have identified for improvement.
Taking our learnings into AMP7
We will continue to look at our detailed complaints and customer feedback analysis to identifyopportunities to improve our existing customer comms. We will put in place usability or café-testing to get direct and early customer feedback in our re-design process. Through this we willbe able to validate at an early stage whether our letters are intuitive, meet the customers’ need and written in a tone that is trusted, engaging and empathetic
For example, as part of our Water Saving Programme, we have engaged with customers and an Impact Communication Specialist, Outré with a target to double the number of Customerstransferring to metered charges (36%) whilst reducing the number of complaints received about‘forced’ metering.
AFW Accounting for Past Delivery Appendices 61

Our revised emails and letters will highlight how customers can have control over their bill by only being charged for the water they use.
Old and new water saving letters
AFW Accounting for Past Delivery Appendices 62

Appendix PD.B3.11
Action refs AFW.PD.B3
Drivers of improvements to complaints performance
AFW Accounting for Past Delivery Appendices 63

AFW Accounting for Past Delivery Appendices 64

AFW Accounting for Past Delivery Appendices 65

AFW Accounting for Past Delivery Appendices 66
Appendix PD.B3.12
Action ref AFW.PD.B3
Our Journey to Zero
AFW Accounting for Past Delivery Appendices 67

AFW Accounting for Past Delivery Appendices 68

Appendix PD.B4.1
Action ref AFW.PD.B4
Letter from Sir Tony Redmond - January 2018
AFW Accounting for Past Delivery Appendices 69

AFW Accounting for Past Delivery Appendices 70
Appendix PD.B4.2
Action ref AFW.PD.B4
Benchmarking best practice beyond the water sector
We continuously look beyond our sector to find examples of best practice and learn fromfailures
In our recruitment process, we look for candidates who can drive us forward and challengeour thinking. We have recruited people from leading customer-centric organisations outside ofour sector including Telecommunications, Finance, Transport and Retail. They have broughtwith them new perspectives and experience in implementing new ways of working. Theycontinue to help us lead transformational change and embed new ways of thinking across theorganisation.
At our Customer Excellence Days we have invited in thought-leaders on CustomerExperience, including Plusnet, Standing on Giants and Sir Tony Redmond to share their outlooks and run workshops with our managers and leadership teams. We have also sent our teams to learn directly from other organisations such as OVO and EON and have been invitedto judge at national awards including the "UK National Innovation Awards"
We have commissioned benchmarking research on best practice in operational excellenceand digital customer service and we are currently undertaking a brand review in readiness forCMEX.
We are privileged to have a highly knowledgeable and engaged Customer Challenge Groupwho we consult with regularly. The Customer Challenge Group hold us to account and allow usto draw on a wealth of academic and professional experience. They have been instrumental in helping us reach customers in vulnerable circumstances with an appropriate water saving message and inputting into our future water resource plans.
We have active members of the Institute of Customer Service and regularly attend their seminars and roundtables to learn from organisations facing similar challenges and opportunities as our own. Our employees are also encouraged to attend conferences, seminarsand training.
AFW Accounting for Past Delivery Appendices 71

AFW Accounting for Past Delivery Appendices 72

Appendix PD.B4.3
Action ref AFW.PD.B4
Table to show drivers of improvements to complaint performance
AFW Accounting for Past Delivery Appendices 73

AFW Accounting for Past Delivery Appendices 74

AFW Accounting for Past Delivery Appendices 75

AFW Accounting for Past Delivery Appendices 76

Appendix PD.B4.4
Action ref AFW.PD.B4
Case Study – Applying lessons learned from poor, good andacceptable performance in customer communications
The customer pain-point
We have recognised that customer communication is having one of the greatest impacts oncustomer satisfaction. For example, our complaints analysis highlighted that our debt recoveryletters were a cause of dissatisfaction.
Actions taken
Following consultation with our customers and customer-facing advisors we madeimprovements to these letters. We acknowledged and thanked those customers who had madecontinuous effort to reduce their debt, whilst prompting them to set up a payment plan to clearremaining arrears.
Results
Changes to our payment plan reminder letters was a key factor in reducing debt recovery complaints by 20%. We have subsequently reviewed and made positive changes to other lettersand emails that we have identified for improvement.
Taking our learnings into AMP7
We will continue to look at our detailed complaints and customer feedback analysis to identifyopportunities to improve our existing customer comms. We will put in place usability or café-testing to get direct and early customer feedback in our re-design process. Through this we willbe able to validate at an early stage whether our letters are intuitive, meet the customers’ need and written in a tone that is trusted, engaging and empathetic
For example, as part of our Water Saving Programme, we have engaged with customers and an Impact Communication Specialist, Outré with a target to double the number of Customerstransferring to metered charges (36%) whilst reducing the number of complaints received about‘forced’ metering.
AFW Accounting for Past Delivery Appendices 77
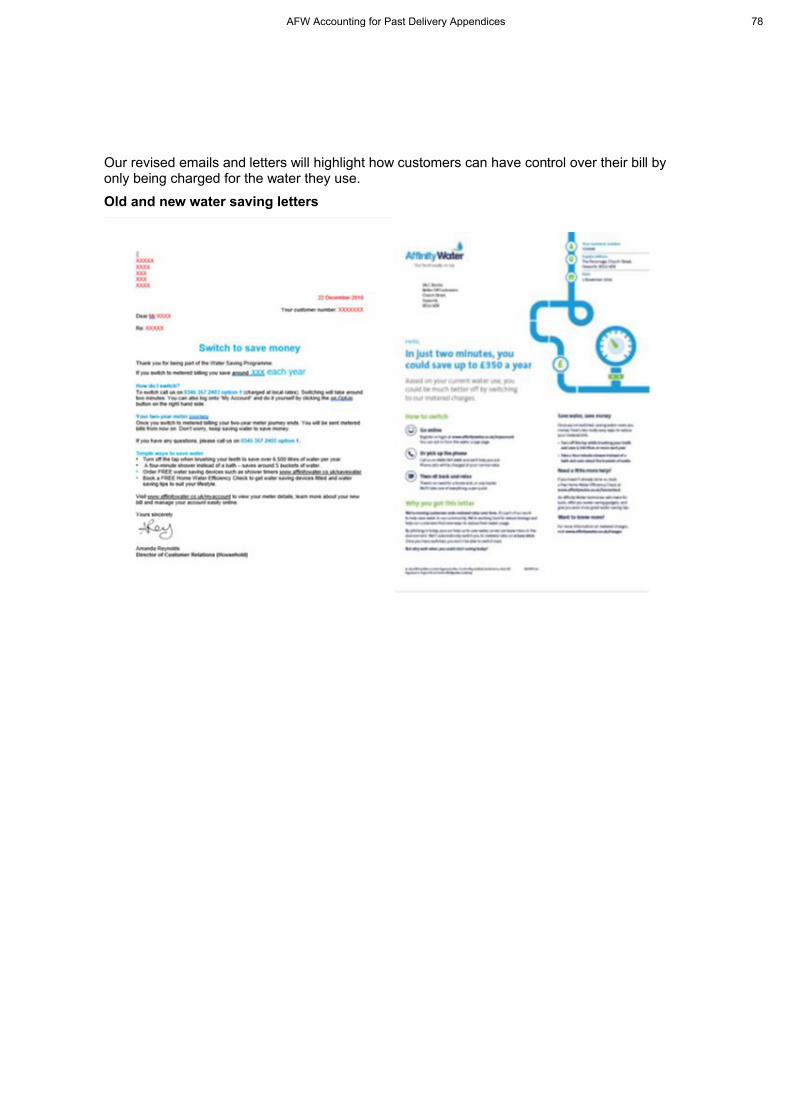
Our revised emails and letters will highlight how customers can have control over their bill byonly being charged for the water they use.
Old and new water saving letters
AFW Accounting for Past Delivery Appendices 78
Appendix PD.B4.5
Action ref AFW.PD.B4
Ensuring a continuous improvement process now and in the future
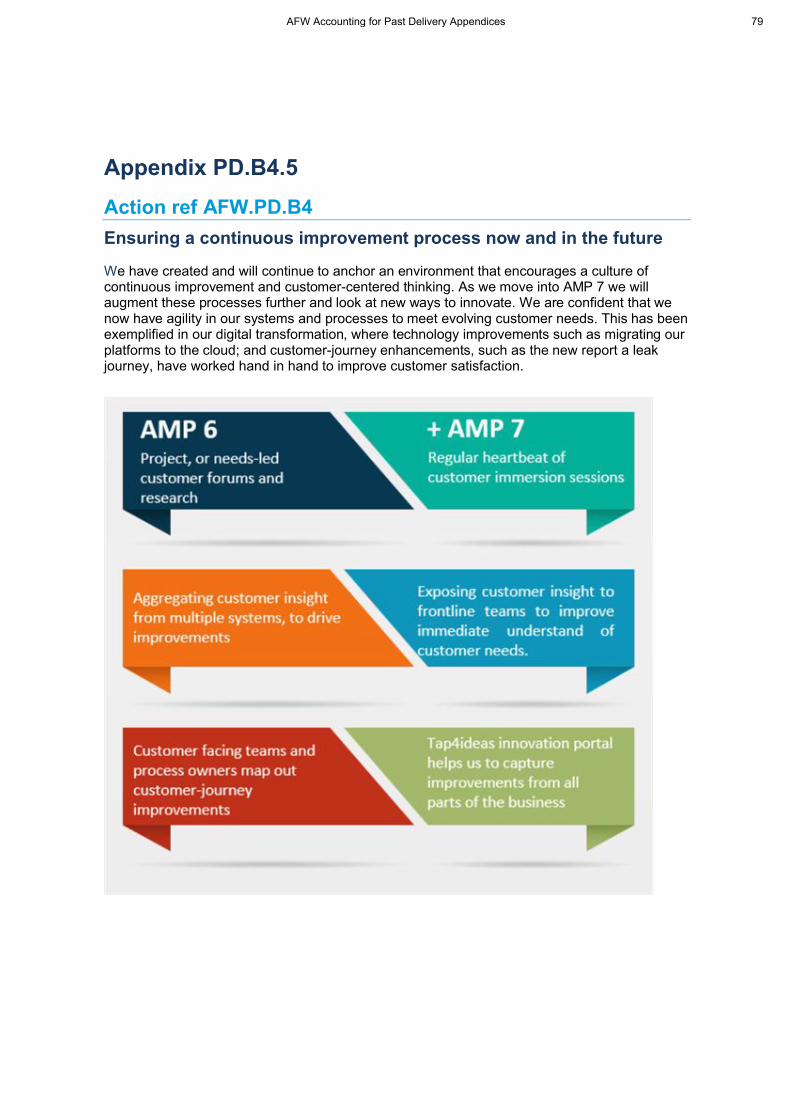
We have created and will continue to anchor an environment that encourages a culture ofcontinuous improvement and customer-centered thinking. As we move into AMP 7 we will augment these processes further and look at new ways to innovate. We are confident that wenow have agility in our systems and processes to meet evolving customer needs. This has beenexemplified in our digital transformation, where technology improvements such as migrating ourplatforms to the cloud; and customer-journey enhancements, such as the new report a leakjourney, have worked hand in hand to improve customer satisfaction.
AFW Accounting for Past Delivery Appendices 79

AFW Accounting for Past Delivery Appendices 80

Appendix PD.C.1
Action ref: Additional Ofwat Feedback
Response to Ofwat leakage information request
AFW Accounting for Past Delivery Appendices 81
Q1 Q3 Q4 Q5 Q6 Q7
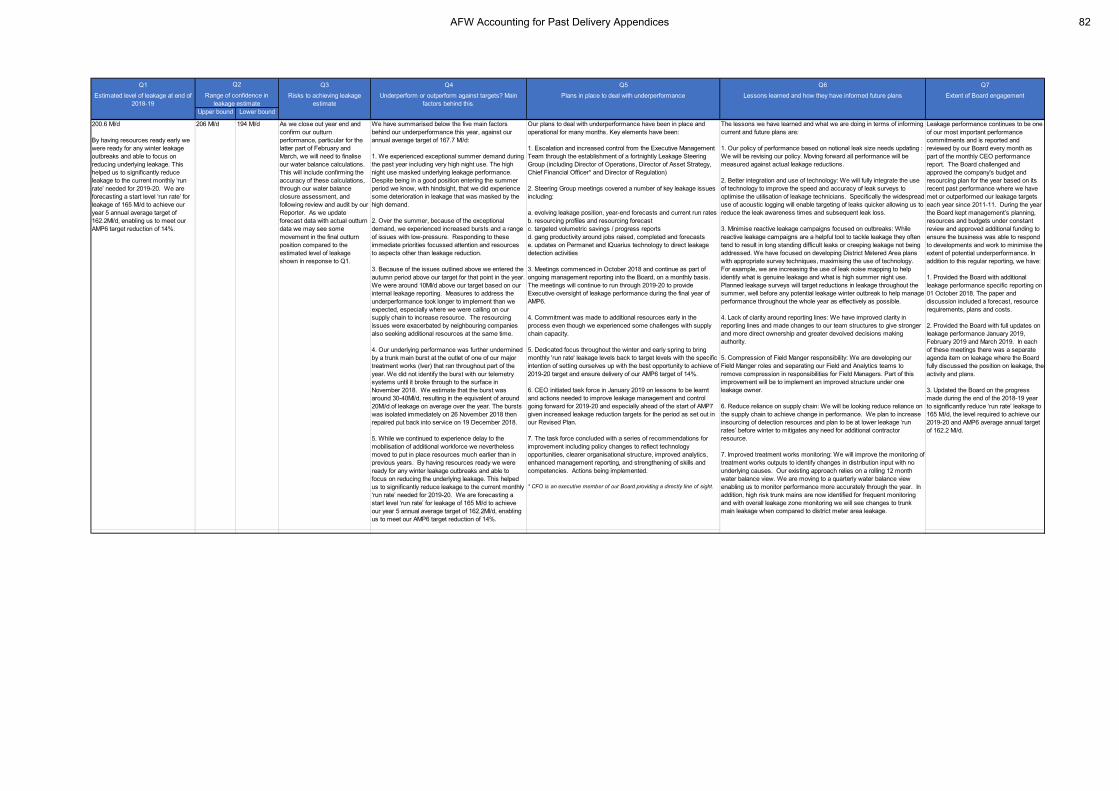
Estimated level of leakage at end of 2018-19
Risks to achieving leakage estimate
Underperform or outperform against targets? Main factors behind this.
Plans in place to deal with underperformance Lessons learned and how they have informed future plans Extent of Board engagement
Upper bound Lower bound
Leakage performance continues to be one of our most important performance commitments and is reported and reviewed by our Board every month as part of the monthly CEO performance report. The Board challenged and approved the company's budget and resourcing plan for the year based on its recent past performance where we have met or outperformed our leakage targets each year since 2011-11. During the year the Board kept management’s planning, resources and budgets under constant review and approved additional funding to ensure the business was able to respond to developments and work to minimise the extent of potential underperformance. In addition to this regular reporting, we have:
1. Provided the Board with additional leakage performance specific reporting on 01 October 2018. The paper and discussion included a forecast, resource requirements, plans and costs.
2. Provided the Board with full updates on leakage performance January 2019, February 2019 and March 2019. In each of these meetings there was a separate agenda item on leakage where the Board fully discussed the position on leakage, the activity and plans.
3. Updated the Board on the progress made during the end of the 2018-19 year to significantly reduce ‘run rate’ leakage to 165 Ml/d, the level required to achieve our 2019-20 and AMP6 average annual target of 162.2 Ml/d.
The lessons we have learned and what we are doing in terms of informing current and future plans are:
1. Our policy of performance based on notional leak size needs updating : We will be revising our policy. Moving forward all performance will be measured against actual leakage reductions.
2. Better integration and use of technology: We will fully integrate the use of technology to improve the speed and accuracy of leak surveys to optimise the utilisation of leakage technicians. Specifically the widespread use of acoustic logging will enable targeting of leaks quicker allowing us to reduce the leak awareness times and subsequent leak loss.
3. Minimise reactive leakage campaigns focused on outbreaks: While reactive leakage campaigns are a helpful tool to tackle leakage they often tend to result in long standing difficult leaks or creeping leakage not being addressed. We have focused on developing District Metered Area plans with appropriate survey techniques, maximising the use of technology. For example, we are increasing the use of leak noise mapping to help identify what is genuine leakage and what is high summer night use. Planned leakage surveys will target reductions in leakage throughout the summer, well before any potential leakage winter outbreak to help manage performance throughout the whole year as effectively as possible.
4. Lack of clarity around reporting lines: We have improved clarity in reporting lines and made changes to our team structures to give stronger and more direct ownership and greater devolved decisions making authority.
5. Compression of Field Manger responsibility: We are developing our Field Manger roles and separating our Field and Analytics teams to remove compression in responsibilities for Field Managers. Part of this improvement will be to implement an improved structure under one leakage owner.
6. Reduce reliance on supply chain: We will be looking reduce reliance on the supply chain to achieve change in performance. We plan to increase insourcing of detection resources and plan to be at lower leakage ‘run rates’ before winter to mitigates any need for additional contractor resource.
7. Improved treatment works monitoring: We will improve the monitoring of treatment works outputs to identify changes in distribution input with no underlying causes. Our existing approach relies on a rolling 12 month water balance view. We are moving to a quarterly water balance view enabling us to monitor performance more accurately through the year. In addition, high risk trunk mains are now identified for frequent monitoring and with overall leakage zone monitoring we will see changes to trunk main leakage when compared to district meter area leakage.
Q2
Range of confidence in leakage estimate
200.6 Ml/d
By having resources ready early we were ready for any winter leakage outbreaks and able to focus on reducing underlying leakage. This helped us to significantly reduce leakage to the current monthly ‘run rate’ needed for 2019-20. We are forecasting a start level ‘run rate’ for leakage of 165 Ml/d to achieve our year 5 annual average target of 162.2Ml/d, enabling us to meet our AMP6 target reduction of 14%.
206 Ml/d 194 Ml/d As we close out year end and confirm our outturn performance, particular for the latter part of February and March, we will need to finalise our water balance calculations. This will include confirming the accuracy of these calculations, through our water balance closure assessment, and following review and audit by our Reporter. As we update forecast data with actual outturn data we may see some movement in the final outturn position compared to the estimated level of leakage shown in response to Q1.
We have summarised below the five main factors behind our underperformance this year, against our annual average target of 167.7 Ml/d:
1. We experienced exceptional summer demand during the past year including very high night use. The high night use masked underlying leakage performance. Despite being in a good position entering the summer period we know, with hindsight, that we did experience some deterioration in leakage that was masked by the high demand.
2. Over the summer, because of the exceptional demand, we experienced increased bursts and a range of issues with low-pressure. Responding to these immediate priorities focussed attention and resources to aspects other than leakage reduction.
3. Because of the issues outlined above we entered the autumn period above our target for that point in the year. We were around 10Ml/d above our target based on our internal leakage reporting. Measures to address the underperformance took longer to implement than we expected, especially where we were calling on our supply chain to increase resource. The resourcing issues were exacerbated by neighbouring companies also seeking additional resources at the same time.
4. Our underlying performance was further undermined by a trunk main burst at the outlet of one of our major treatment works (Iver) that ran throughout part of the year. We did not identify the burst with our telemetry systems until it broke through to the surface in November 2018. We estimate that the burst was around 30-40Ml/d, resulting in the equivalent of around 20Ml/d of leakage on average over the year. The bursts was isolated immediately on 26 November 2018 then repaired put back into service on 19 December 2018.
5. While we continued to experience delay to the mobilisation of additional workforce we nevertheless moved to put in place resources much earlier than in previous years. By having resources ready we were ready for any winter leakage outbreaks and able to focus on reducing the underlying leakage. This helped us to significantly reduce leakage to the current monthly ‘run rate’ needed for 2019-20. We are forecasting a start level ‘run rate’ for leakage of 165 Ml/d to achieve our year 5 annual average target of 162.2Ml/d, enabling us to meet our AMP6 target reduction of 14%.
Our plans to deal with underperformance have been in place and operational for many months. Key elements have been:
1. Escalation and increased control from the Executive Management Team through the establishment of a fortnightly Leakage Steering Group (including Director of Operations, Director of Asset Strategy, Chief Financial Officer* and Director of Regulation)
2. Steering Group meetings covered a number of key leakage issues including:
a. evolving leakage position, year-end forecasts and current run ratesb. resourcing profiles and resourcing forecastc. targeted volumetric savings / progress reportsd. gang productivity around jobs raised, completed and forecastse. updates on Permanet and IQuarius technology to direct leakage detection activities
3. Meetings commenced in October 2018 and continue as part of ongoing management reporting into the Board, on a monthly basis. The meetings will continue to run through 2019-20 to provide Executive oversight of leakage performance during the final year of AMP6.
4. Commitment was made to additional resources early in the process even though we experienced some challenges with supply chain capacity.
5. Dedicated focus throughout the winter and early spring to bring monthly 'run rate' leakage levels back to target levels with the specific intention of setting ourselves up with the best opportunity to achieve of 2019-20 target and ensure delivery of our AMP6 target of 14%.
6. CEO initiated task force in January 2019 on lessons to be learnt and actions needed to improve leakage management and control going forward for 2019-20 and especially ahead of the start of AMP7 given increased leakage reduction targets for the period as set out in our Revised Plan.
7. The task force concluded with a series of recommendations for improvement including policy changes to reflect technology opportunities, clearer organisational structure, improved analytics, enhanced management reporting, and strengthening of skills and competencies. Actions being implemented.
* CFO is an executive member of our Board providing a directly line of sight.
AFW Accounting for Past Delivery Appendices 82

AFW Accounting for Past Delivery Appendices 83
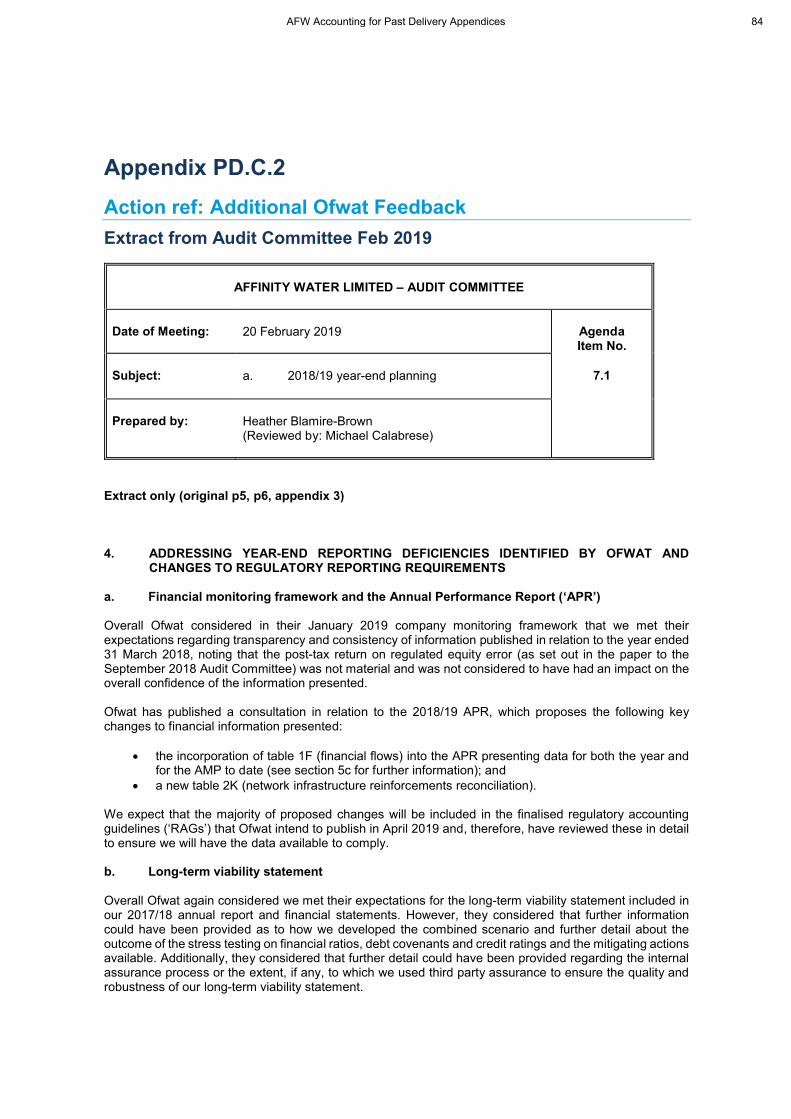
Appendix PD.C.2
Action ref: Additional Ofwat Feedback
Extract from Audit Committee Feb 2019
AFFINITY WATER LIMITED – AUDIT COMMITTEE
Date of Meeting: 20 February 2019 AgendaItem No.
Subject: a. 2018/19 year-end planning 7.1
Prepared by: Heather Blamire-Brown(Reviewed by: Michael Calabrese)
Extract only (original p5, p6, appendix 3)
4. ADDRESSING YEAR-END REPORTING DEFICIENCIES IDENTIFIED BY OFWAT ANDCHANGES TO REGULATORY REPORTING REQUIREMENTS
a. Financial monitoring framework and the Annual Performance Report (‘APR’)
Overall Ofwat considered in their January 2019 company monitoring framework that we met theirexpectations regarding transparency and consistency of information published in relation to the year ended31 March 2018, noting that the post-tax return on regulated equity error (as set out in the paper to theSeptember 2018 Audit Committee) was not material and was not considered to have had an impact on theoverall confidence of the information presented.
Ofwat has published a consultation in relation to the 2018/19 APR, which proposes the following keychanges to financial information presented:
∑ the incorporation of table 1F (financial flows) into the APR presenting data for both the year andfor the AMP to date (see section 5c for further information); and
∑ a new table 2K (network infrastructure reinforcements reconciliation).
We expect that the majority of proposed changes will be included in the finalised regulatory accountingguidelines (‘RAGs’) that Ofwat intend to publish in April 2019 and, therefore, have reviewed these in detailto ensure we will have the data available to comply.
b. Long-term viability statement
Overall Ofwat again considered we met their expectations for the long-term viability statement included inour 2017/18 annual report and financial statements. However, they considered that further informationcould have been provided as to how we developed the combined scenario and further detail about theoutcome of the stress testing on financial ratios, debt covenants and credit ratings and the mitigating actionsavailable. Additionally, they considered that further detail could have been provided regarding the internalassurance process or the extent, if any, to which we used third party assurance to ensure the quality androbustness of our long-term viability statement.
AFW Accounting for Past Delivery Appendices 84
We plan to include further narrative to capture these points in either our long-term viability statement in our strategic report or the viability statement section in our APR, including adding in detail from our dataassurance summary on the assurance procedures performed by PwC over the accuracy of the underpinning stress testing.
c. Financial flows
Ofwat again considered that we met their expectations in relation to the data submitted for the prior year. We will use the final calculations incorporating changes made following Ofwat queries (as set out in the paper to September 2018 Audit Committee) as the basis for the 2019/20 calculation.
d. Cost assessment
Ofwat had minor concerns in this area and raised several queries to seek explanation for data variances where there was no supporting commentary, which led to minor data corrections. These queries were largely in relation to non-financial data included in tables 4P and 4Q (including energy consumption and the number of meters installed) that led to the restatement of these figures following the publication of the annual report and financial statements at the end of June 2018. Cost assessment tables (tables 4J to 4W) are not required by the RAGs to be included in the APR and so for this year-end, we propose taking these out of the APR and publishing these in a separate document on our website by 15 July to allow additional time to resolve issues identified by PwC and Atkins in conducting their assurance procedures over these tables.
Ofwat also expressed concern over the number of cost allocations still based on management estimate and chosen cost allocation methods not being properly justified in our accounting separation methodology statement, noting that there was no mention of the assurance that had been undertaken on the accounting separation methodology.
Ofwat provides a hierarchy of cost drivers to be used in the RAGs and utilisation of management estimates as a cost driver is permitted where information is unavailable to use the preferred cost driver. However, when this is the case, there should be a supporting commentary included in the accounting separation methodology statement to justify why the management estimate is appropriate.
There were seven references to management estimates and three instances of where we consider chosen cost allocation methods were not properly justified in our 2017/18 accounting separation methodology statement, as detailed in Appendix 3. We are in the process of reviewing these cost allocations to identify potential alternative cost allocation methods or provide further detail in our accounting separation methodology statement regarding the basis for the estimate.
We are, however, limited by not having a system in place to analyse costs at an activity level. This is partly as a result of the business not operating with, and therefore our accounting records not having, the same structure that Ofwat requires for cost allocation. The Activity Based Costing (‘ABC’) project, which we have mentioned in our previous two accounting separation methodology statements, is not at a stage whereby the output can be used for regulatory reporting. Further work needs to be done to capture costs at an activity level for smaller site assets.
Our 2017/18 data assurance summary published on our website did not include detail on the external assurance procedures performed by PwC and Atkins over the cost allocation tables. A section on assurance will be included in this year’s data assurance summary, which will be referenced to in our accounting separation methodology statement.
However, whilst PwC review the principles on which the accounting separation methodology has been prepared against the relevant RAGs and compare cost drivers stated within the methodology statement against the preferred cost drivers listed in the RAGs, they do not form an opinion on whether the cost drivers used are the most appropriate; but rather only assess compliance or non-compliance. Deloitte LLP in their 2016 review of cost drivers used in section 2 of our APR provided detail to enable us to conclude on whether the cost drivers used were the most appropriate and changes were made to our methodology for the
AFW Accounting for Past Delivery Appendices 85

2015/16 APR to address the findings contained in their report. A similar exercise could be performed in relation to the cost assessment tables; however, cost drivers applied mirror those used in section 2 of our APR and, therefore, we do not consider that such an exercise would not provide any further assurance. We note that Atkins do perform audit procedures over the capital expenditure allocations in the cost assessment tables.
AFW Accounting for Past Delivery Appendices 86

APPENDIX 3: COST ALLOCATIONS BASED ON MANAGEMENT ESTIMATE OR UNJUSTIFIEDCOST ALLOCATIONS IN 2017/18 ACCOUNTING SEPARATION METHODOLOGY STATEMENT
Section Narrative in 2017/18 methodology statement Ofwat concern3.2.1 Sewerage billing, cashcollection and infrastructurecommission
Other smaller costs such as bank fees for cashtransfers, Hi-Affinity (our billing system) licensefees and audit fee are also considered.
No justificationfor costallocation
3.2.2 Recharges for supportservices (AfB)
Services per the agreement charged at a fixedannual fee, calculated using the actual cost tothe business per employee and the estimatedtime commitment for the service.
Use ofmanagementestimates
3.4.1 General and support -Legal and Insurance
1. Management estimate on insurancepremium and claim history
2. Number of FTEs for remaining cost
Use ofmanagementestimates
3.4.2 Other business activity(Regulation)
This cost includes direct allocation from theregulation cost centre plus an element ofgeneral and support cost based on theallocation mentioned above. This cost is thenallocated on an even basis across the five original business units; water resources, rawwater distribution, water treatment, treated water distribution and retail.
No justificationfor costallocation
3.5.1 Operating cost analysis for wholesale business - Other Operating Expenditure - Direct cost
Employment, Materials, Hired & Contracted, Other Direct Cost: If a cost centre covers morethan one BU, costs are allocated based on management estimate of the costs.
Use ofmanagementestimates
3.5.1 Operating cost analysis for wholesale business - OtherOperating Expenditure -Indirect cost
General & Support costs are applied pro-rata to direct employees within each business unit, direct allocation or split based on managementestimates.
Use ofmanagementestimates
3.5.1 Operating cost analysisfor wholesale business - OtherOperating Expenditure -Indirect cost
Scientific Services – costs are allocated all towholesale and split into BU by managementestimate.
Use ofmanagementestimates
3.5.1 Operating cost analysisfor wholesale business - ThirdParty Services
Special agreements – separately calculated toreflect management estimates of resourcesconsumed to deliver the BU.
Use ofmanagementestimates
3.5.4 Operating cost analysis for wholesale business - Otheroperating expenditure (excluding renewals)
Other operating expenditure (excluding renewals) consists of a number of cost codes,some costed directly to price control units andothers proportionally allocated.
No justificationfor cost allocation
AFW Accounting for Past Delivery Appendices 87