Embed Size (px)
Citation preview

ANNUAL REPORTFOR THE YEAR ENDED 30 JUNE 2018
AFTERPAY TOUCH GROUP LIMITED
3

• CONTENTS
CONTENTSCHAIRMAN’S MESSAGE 5
DIRECTORS’ REPORT 7
REMUNERATION REPORT 20
AUDITOR’S INDEPENDENCE DECLARATION 35
AFTERPAY TOUCH GROUP FINANCIAL STATEMENTS 37
CONSOLIDATED STATEMENT OF COMPREHENSIVE INCOME 38
CONSOLIDATED STATEMENT OF FINANCIAL POSITION 39
CONSOLIDATED STATEMENT OF CHANGES IN EQUITY 40
CONSOLIDATED STATEMENT OF CASH FLOWS 41
NOTES TO THE FINANCIAL STATEMENTS 43
DIRECTORS’ DECLARATION 64
INDEPENDENT AUDITOR’S REPORT 65
ADDITIONAL SECURITIES EXCHANGE INFORMATION 70
CORPORATE INFORMATION 74
we are moving further towards our goal to be the world’s most loved way to pay.
4

CHAIRMAN’S MESSAGE
Dear fellow Shareholders,
It has been another year of inspiring growth
for Afterpay and a successful first year for the
merged Afterpay Touch Group.
Driven by a passion and determination to
empower the customer and innovate the
retail economy, Afterpay has grown rapidly to
become Australia’s leading ‘buy now, receive
now, pay later’ service. We are proud of the
outstanding success of our product which has
in many ways transformed the way people
spend on what we call ‘life’s little essentials’.
We ascribe much of this success to putting
our customers’ interests first by not charging
interest and offering a free service for our
customers if repayments are made on time.
After launching Afterpay in the United States
earlier this year, and currently planning our
launch in to the United Kingdom market, we
are moving further towards our goal to be the
world’s most loved way to pay.
We have created a retail community that
is delivering incremental value to all key
stakeholders in the retail industry. Now
celebrating more than 2.3 million active
customers and an annualised underlying
sales run rate of over $3.0 billion, we are now
more inspired and energised than ever to
expand Afterpay’s application to additional
verticals and geographies.
Innovation, technology leadership and data
analytics are at the core of our value proposition.
Our capabilities, insights and results are improving
with scale and we are committed to continually
building and improving our proprietary systems
and intellectual property. The ability to utilise
data not just to improve the profitability of our
service but to enhance the value we provide
to customers and retailers is driving our
development efforts.
Our ability to attract talented people in Australia
and the United States has been greatly
strengthened through Afterpay’s merger with
Touchcorp at the end of the 2017 financial
year and the strategic relationship with Matrix
Partners, a successful technology focused
United States based Venture Capital firm, in
January 2018. The merger is now complete and
the rationale for these relationships has been
demonstrated by our pace of innovation and
expansion into new geographies and vertical
markets at speed.
In order to support the continued growth of
Afterpay, the Group increased its funding
diversification and maturity profile during the year.
The existing receivables facility with NAB was
increased from $200 million in June 2017 to $300
million as of today and a NZ$20 million facility
with ASB Bank (‘ASB’) was established to assist
funding the Group’s New Zealand operations.
The Group also successfully issued 4-year senior
unsecured notes to institutional and professional
investors raising $50 million. As of today, the
Group has established an additional $200
million warehouse facility with Citi. The facility
supplements the existing Australian NAB facility
and provides a basis for developing international
banking activities.
CHAIRMAN’S MESSAGE
5

CHAIRMAN’S MESSAGE (CONTINUED)
Our customers remain at the centre of everything
we do and the Group is committed to the
promotion of responsible customer spending.
This year we also implemented several product
enhancements including the capping of late
fees and external ID checks supplementing
Afterpay’s proprietary transaction integrity
engine. We are committed to a practice
of pro-active engagement with relevant
government and industry stakeholders to ensure
we listen, take feedback and continuously
improve our processes and systems to benefit
underlying consumers.
The performance of the Group during the
financial year has been strong. The Group
revenue and other income increased from $29.0
million to $142.3 million across the period, driven
by significant growth in the number of retailers
integrated with the Afterpay platform. By the end
of the financial year, more than 16,500 retailers
had integrated with the Afterpay platform. This
figure has grown to over 17,700 retailers today
and we see significant scope for further growth,
especially with international expansion. It is
pleasing that this rapid growth profile has been
paired with improving underlying transaction
profitability, declining customer default rates
and Afterpay’s ability to generate overall
operating profitability.
The year saw Afterpay recognised as ‘Fintech organisation
of the Year’ for the second consecutive year. This is a credit
to the team of people working in both the previous Afterpay
and Touchcorp businesses and is representative of what we
can achieve as a combined Group.
I look forward to another exciting year ahead as we continue
to build our base in new markets and maintain our core
mission to become the world’s most loved way to pay.
I would like, once again, to thank Michael Jefferies for
his unique and invaluable contribution over many years.
Mike was the long-serving Chairman of Touchcorp and
stepped into an Executive role following the tragic passing
of Touchcorp’ s Managing Director, Adrian Cleeve, in late
2016. Michael Jefferies had been an outstanding director
and worked tirelessly for the benefits of all shareholders and
staff. His contribution to his fellow directors and the personal
support that he has provided to a great many members of
the Afterpay Touch team has been immense.
I would like to thank the Board and entire Afterpay Touch
team for their efforts and contribution to date, steadfast
loyalty and amazing support during the year. I would also
like to thank our shareholders, customers, retail partners and
everyone who uses our products for their strong support
and contributing to the Group’s success.
Anthony Eisen
Executive Chairman
Our customers remain at the
centre of everything
we do
6

DIRECTORS’ REPORT
DIRECTORS’ REPORT
The Directors submit their report on the
consolidated entity consisting of Afterpay Touch
Group Limited and the entities it controlled
(Group) at the end of, or during the year ended,
30 June 2018.
DIRECTORSThe names and details of the Group’s Directors
in office during the financial year and until the
date of this report are as follows. Directors
were in office for the entire financial year unless
otherwise stated.
Anthony Eisen EXECUTIVE CHAIRMAN
David Hancock EXECUTIVE DIRECTOR AND AFTERPAY TOUCH GROUP HEAD
Nicholas Molnar EXECUTIVE DIRECTOR AND CEO OF AFTERPAY
Clifford Rosenberg INDEPENDENT NON-EXECUTIVE DIRECTOR
Elana Rubin INDEPENDENT NON-EXECUTIVE DIRECTOR
Dana Stalder INDEPENDENT NON-EXECUTIVE DIRECTOR (APPOINTED 24 JANUARY 2018)
Michael Jefferies INDEPENDENT NON-EXECUTIVE DIRECTOR (RESIGNED 16 JANUARY 2018)
INFORMATION ON DIRECTORS
ANTHONY EISEN
EXECUTIVE CHAIRMAN
Anthony was appointed an Executive Director of
Afterpay Touch Group on 5 July 2017. Anthony has
over 20 years’ experience in investing, public company
directorships and providing corporate advice across
a variety of sectors. Prior to co-founding Afterpay, he
was the Chief Investment Officer at Guinness Peat
Group (GPG). He was actively involved in a number of
financial services, software and technology companies
in which GPG was a major shareholder. Before joining
GPG, Anthony was involved in investment banking,
specialising in mergers and acquisitions. He is currently
also a Director of Foundation Life (N.Z) Limited.
INTERESTS IN SHARES AND OPTIONS
22,500,000 ordinary shares.
1,500,000 unlisted options issued under the Company’s Employee Option
Plan, with an exercise price of $1.00 per option and an expiry date of 31
December 2020.
DAVID HANCOCK
EXECUTIVE DIRECTOR AND GROUP HEAD
David was appointed an Independent Non-Executive
Director of Afterpay Touch Group on 30 March 2017.
On 5 July 2017, David was appointed Group Head of
the Company.
David has over 25 years of broad experience in financial
services and has held a variety of roles in capital
markets, fixed income and equities. David has served
on a number of boards including as a previous Director
of Tower Insurance Limited and Elmo Software Limited.
David is currently a Non-Executive Director of Freedom
Insurance Group Limited.
INTERESTS IN SHARES AND OPTIONS
1,900,000 ordinary shares.
200,000 unlisted options issued under the Company’s Employee Option Plan, with
an exercise price of $1.00 per option and an expiry date of 31 December 2020.
2,000,000 Loan Shares with an exercise price of $2.70 per option and an expiry
date of 1 September 2022, subject to shareholder approval.
7
DIRECTORS’ REPORT • INFORMATION ON DIRECTORS (CONTINUED)
NICHOLAS MOLNAR
EXECUTIVE DIRECTOR AND CEO OF AFTERPAY
Nicholas was appointed an Executive Director of
Afterpay Touch Group on 5 July 2017. Nicholas
has extensive experience in online retail. Prior
to co-founding Afterpay, Nicholas launched the
leading American online jeweller, Ice.com, into
Australia under the local brand Iceonline.com.au.
Nicholas successfully grew Ice in Australia to
become the largest online-only jewellery and
watch retailer. Prior to launching Ice, Nicholas
was an Investment Analyst at venture capital
fund M. H. Carnegie & Co., where he was
primarily responsible for growth stage investment
opportunities in the technology sector.
Nicholas holds a Bachelor of Commerce from
Sydney University.
INTERESTS IN SHARES AND OPTIONS
22,500,000 ordinary shares.
1,500,000 unlisted options issued under the Company’s Employee
Option Plan, with an exercise price of $1.00 per option and an expiry
date of 31 December 2020.
MICHAEL JEFFERIES
INDEPENDENT NON-EXECUTIVE DIRECTOR (RESIGNED 16 JANUARY 2018)
Michael was appointed a Non-Executive
Director of Afterpay Touch Group on 5 July 2017.
Michael is a chartered accountant with extensive
experience in finance and investment including
more than 20 years as an executive of Guinness
Peat Group plc, an international investment group
listed on the major stock exchanges in London,
Australia and New Zealand.
In addition to his role with the Company, he is
also the Non-Executive Chairman of Pantoro
Limited, a Non-Executive Director of Homeloans
Limited and Ozgrowth Limited and has previously
been a Director of a number of listed public
companies in Australia and New Zealand
including ClearView Wealth Limited, Tower
Australia Limited, Metals X Limited and Tower
Limited (New Zealand). Michael has over 30 years
of public company and finance experience.
INTERESTS IN SHARES AND OPTIONS
4,323,226 ordinary shares.
200,000 unlisted options issued under the entity’s Employee Option
Plan, with an exercise price of $1.00 per option and an expiry date of
31 December 2020.
CLIFFORD ROSENBERG
INDEPENDENT NON-EXECUTIVE DIRECTOR
Clifford was appointed an Independent Non-
Executive Director of Afterpay Touch Group on
30 March 2017. Clifford has spent more than
20 years working at digital companies leading
innovation and change in the industry both as an
entrepreneur and senior executive. Clifford was
a senior executive at LinkedIn for six and a half
years and until recently serving as the Managing
Director of LinkedIn for South East Asia, Australia
and New Zealand. Prior to LinkedIn, Clifford
was Managing Director at Yahoo Australia and
New Zealand, and previously the founder and
Managing Director of iTouch Australia and New
Zealand, one of the biggest mobile content and
application service providers in Australia. Prior
to iTouch Clifford was the Head of Strategy for
Vodafone Australasia.
Clifford is also a Non-Executive Director of ASX
listed companies Nearmap Ltd, Pureprofile Ltd,
Cabcharge Australia Limited and IXUP Limited.
Clifford has a Bachelor of Business Science
(Honours) degree and a Master of Science
in Management.
INTERESTS IN SHARES AND OPTIONS
800,000 ordinary shares.
700,000 unlisted options issued under the Company’s Employee
Option Plan, with an exercise price of $0.20 per option and an expiry
date of 1 September 2020.
200,000 unlisted options issued under the Company’s Employee
Option Plan, with an exercise price of $1.00 per option and an expiry
date of 31 December 2020.
ELANA RUBIN
INDEPENDENT NON-EXECUTIVE DIRECTOR
Elana was appointed an Independent Non-
Executive Director of Afterpay Touch Group on
30 March 2017. Elana has been a longstanding
Director of a number of public and private
companies, with extensive experience in
property, insurance and financial services. Elana
is currently a Non-Executive Director of Mirvac
Limited, Slater and Gordon Limited and a number
of unlisted companies and government agencies.
Elana was previously a Non-Executive Director of
Touchcorp, TAL Life and Bravura Solutions, and
was the former Chair of AustralianSuper and the
Victorian WorkCover Authority. Elana has over 20
years’ experience as a Non-Executive Director.
INTERESTS IN SHARES AND OPTIONS
56,567 ordinary shares.
8
DIRECTORS’ REPORT • INFORMATION ON DIRECTORS (CONTINUED)
DANA STALDER
INDEPENDENT NON-EXECUTIVE DIRECTOR
Dana was appointed an Independent Non-
Executive Director of Afterpay Touch Group on
24 January 2018. Since 2008, Dana has been
a General Partner at Matrix Partners, a venture
capital firm based in the United States.
Dana has over 20 years of experience across
multiple disciplines including finance, technology
product management, and sales and marketing
in technology companies, including Paypal, eBay
and Netscape.
Dana has served on the board of directors
of Zendesk, Inc, a publicly held cloud
based software application company, since
November 2010, and currently serves on the
board of directors of several privately-held
technology companies.
INTERESTS IN SHARES AND OPTIONS
Nil interests in shares and options. Matrix Partners X, L.P. and Weston
& Co. C LCC, where Dana is a General Partner, hold 2,717,394 shares
and 163,032 shares, respectively.
SOPHIE KARZIS (B. JURIS, LLB)
COMPANY SECRETARY
Sophie is a practicing lawyer with over 15 years’
experience as a corporate and commercial lawyer,
and Company Secretary and General Counsel
for a number of private and public companies.
Sophie is the principal of Boardroom Limited,
a corporate law practice with a focus on equity
capital markets, mergers and acquisitions,
corporate governance for ASX-listed entities, as
well as the more general aspects of corporate and
commercial law. Sophie is the Company Secretary
of a number of ASX-listed and unlisted entities,
and is a member of the Law Institute of Victoria as
well as the Governance Institute of Australia.
INTERESTS IN SHARES AND OPTIONS
23,305 ordinary shares.
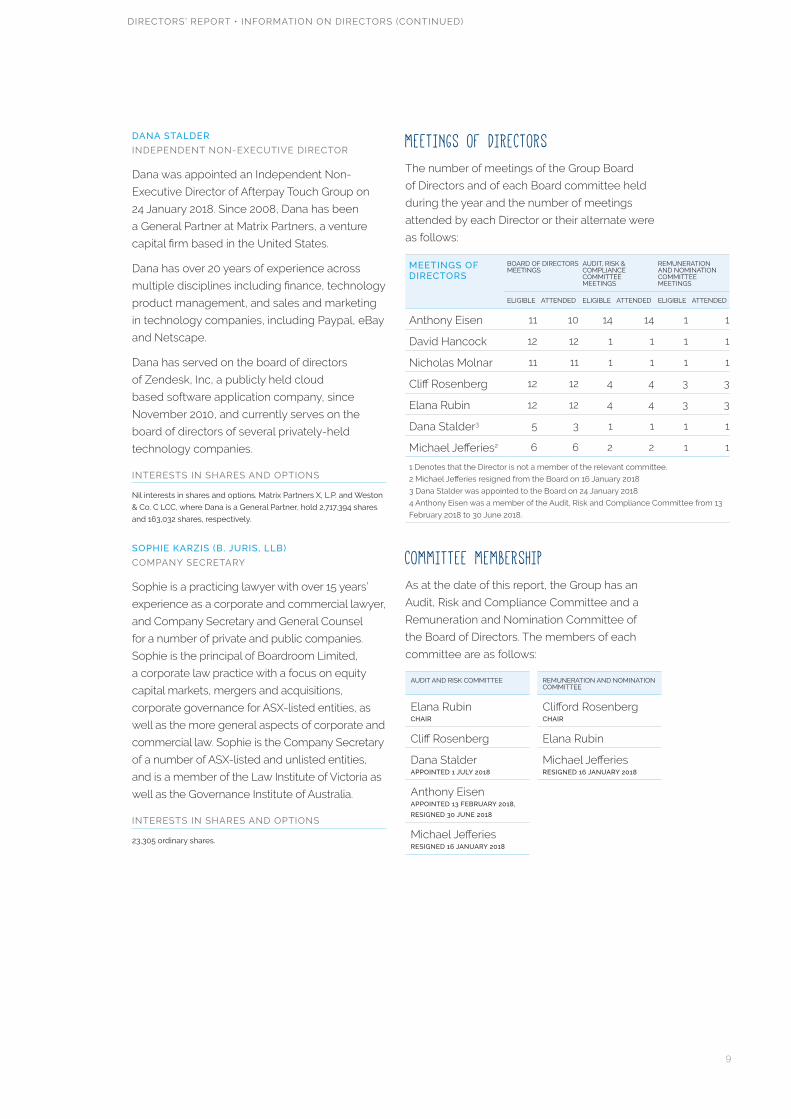
MEETINGS OF DIRECTORSThe number of meetings of the Group Board
of Directors and of each Board committee held
during the year and the number of meetings
attended by each Director or their alternate were
as follows:
MEETINGS OF DIRECTORS
BOARD OF DIRECTORS MEETINGS
AUDIT, RISK & COMPLIANCE COMMITTEE MEETINGS
REMUNERATION AND NOMINATION COMMITTEE MEETINGS
ELIGIBLE ATTENDED ELIGIBLE ATTENDED ELIGIBLE ATTENDED
Anthony Eisen 11 10 14 14 1 1
David Hancock 12 12 1 1 1 1
Nicholas Molnar 11 11 1 1 1 1
Cliff Rosenberg 12 12 4 4 3 3
Elana Rubin 12 12 4 4 3 3
Dana Stalder3 5 3 1 1 1 1
Michael Jefferies2 6 6 2 2 1 1
1 Denotes that the Director is not a member of the relevant committee.
2 Michael Jefferies resigned from the Board on 16 January 2018
3 Dana Stalder was appointed to the Board on 24 January 2018
4 Anthony Eisen was a member of the Audit, Risk and Compliance Committee from 13
February 2018 to 30 June 2018.
COMMITTEE MEMBERSHIPAs at the date of this report, the Group has an
Audit, Risk and Compliance Committee and a
Remuneration and Nomination Committee of
the Board of Directors. The members of each
committee are as follows:
AUDIT AND RISK COMMITTEE REMUNERATION AND NOMINATION COMMITTEE
Elana Rubin CHAIR
Clifford Rosenberg CHAIR
Cliff Rosenberg Elana Rubin
Dana Stalder APPOINTED 1 JULY 2018
Michael Jefferies RESIGNED 16 JANUARY 2018
Anthony Eisen APPOINTED 13 FEBRUARY 2018,
RESIGNED 30 JUNE 2018
Michael Jefferies RESIGNED 16 JANUARY 2018
9

DIRECTORS’ REPORT • PRINCIPAL ACTIVITIES
PRINCIPAL ACTIVITIESAfterpay Touch Group is a multinational
technology driven payments company. The
Group operates a Pay Later business, being
Afterpay, and a Pay Now business, being
Touchcorp. Afterpay is a significant driver of retail
innovation in the markets it operates. Touchcorp
is an innovative digital payments business
servicing major consumer facing organisations in
the telecommunication, health and convenience
retail sectors.
PAY LATER
Pay Later provides a customer centric, omni
channel retail service that facilitates commerce
between retail merchants and their end-
customers. Afterpay delivers its services
through a proprietary platform that allows retail
merchants to offer customers the ability to buy
products on a ‘buy now, receive now, pay later’
basis with an easy and non-invasive application
process, and at no additional cost to the end-
customer. Unlike traditional credit services, the
customers do not have to:
• Apply for or enter into a traditional loan;
• Pay any additional amount (by way of interest
or upfront fees to Afterpay) for the merchant’s
products as long as repayments are made on
time; or
• Complete cumbersome physical paperwork
that cause delays or a failure to complete
a purchase.
Instalment payment terms are presented to
customers for a maximum of 56 days. The
customer usually repays the purchase value to
Afterpay in four equal, fortnightly instalments.
Retail merchants benefit from providing Afterpay
to their customers because:
• Customers are often more inclined to make a
purchase or increase the value of their purchase
because of the budgeting flexibility Afterpay
offers; and
• Afterpay pays the retail merchant upfront and
assumes all customer non-payment risks.
The Pay Later business currently operates in
Australia, New Zealand and the United States.
PAY NOW
The Pay Now business includes three divisions:
Mobility, Health and E-Services. Each of these
divisions provides services using the proprietary
Touch System Platform. This Platform enables
consumers to quickly and simply purchase
products in-store, via secure self-service
methods, across mobile applications, web sites,
interactive voice recognition (“IVR”) systems and a
variety of other methods.
The underlying technology and processes
employed by the Pay Now business are designed
to minimise friction for merchant retailers and
enhance the shopping experience for consumers.
This allows for the seamless purchase of goods
and services without unnecessary processes
while having confidence in the reliability of
transaction services.
The Pay Now business also provides customers
with performance and cost advantages through
sophisticated fraud management capabilities.
This provides relevant merchant retailers with
the capacity to maximise transaction acceptance
while minimising the cost of fraud. In some cases,
the Pay Now business accepts fraud risk for
merchant retailers.
10

DIRECTORS’ REPORT • OPERATIONS AND ACTIVITIES
OPERATIONS AND ACTIVITIES
information, including Earnings Before Interest, Tax,
Depreciation and Amortisation (EBITDA), Earnings
Before Tax, Depreciation and Amortisation (EBTDA),
Net Transaction Loss (NTL) and Net Transaction
Margin (NTM).
These measures are used internally by
Management to assess the performance of the
business and make decisions on the allocation of
resources and are included in this report to provide
greater understanding of the underlying financial
performance of the Group’s operations. When
reviewing business performance, this non-IFRS
information should be used in addition to, and
not as a replacement for, measures prepared in
accordance with IFRS. The non-IFRS information
has not been subject to audit or review by the
Group’s external auditor.
FINANCIAL RESULTSThe Group financial snap shot which summarises
key financial and operating metrics is set out below:
BACKGROUND TO RESULTSIn reviewing the results of the Group, it is
important to understand that the year ended 30
June 2018 is the first full year of results showing
the performance and cash flows of the combined
business post the Merger.
As the Merger became legally effective on 28
June 2017 upon implementation of the Afterpay
Scheme and the Touchcorp Scheme, the
Merger was reflected in the Group’s statement
of financial position only as if the acquisition of
Touchcorp by Afterpay occurred on 30 June 2017.
The statement of financial performance and cash
flow only shows the Afterpay Group for the 12
months ended on 30 June 2017.
The Group results are reported under Australian
Accounting Standards (“AAS”). Compliance with
AAS also results in compliance with International
Financial Reporting Standards (“IFRS”). This
report also includes certain non-IFRS financial
FINANCIAL SNAP SHOT
A$’000 (UNLESS OTHERWISE STATED)
AFTERPAY TOUCH AFTERPAY NET CHANGE
FY18 FY17 $ %
Group - key financial metrics
Revenue and other Income 142,345 29,026 113,319 390%
Afterpay 116,774 29,026 87,748 302%
Pay Now 25,571 - N/A N/A
EBITDA, FX, share-based payments, one-off items 33,768 5,950 27,818 468%
EBTDA, FX, share-based payments, one-off items 27,682 5,770 21,912 380%
EBTDA 9,743 (11,714) 21,457 183%
Net Profit/(Loss) after tax - statutory (8,976) (9,620) 644 7%
Afterpay - key operating metrics
Underlying merchant sales ($m) 2,185 561 1,624 289%
Merchant revenue %1 4.0% 4.1% N/A N/A
Net transaction loss (NTL) %1 (0.4)% (0.6)% N/A N/A
Net transaction margin (NTM) %1 2.6% 2.5% N/A N/A
Total active customers (m) - current2 2.3 0.8 1.5 176%
Number of merchants (‘000) - current2 17.7 6.0 11.7 195%
1. % of underlying sales 2. FY18 metrics as at 31 July 2018.11

DIRECTORS’ REPORT • FINANCIAL RESULTS (CONTINUED)
The statutory performance of the Group for the year
ended 30 June 2018 is summarised in the table below:
STATUTORY FINANCIAL SUMMARY CONSOLIDATED AFTERPAY
2018 2017 NET CHANGE
$’000 $’000 $’000 %
Revenue from ordinary activities 113,899 22,906 90,993 397%
Cost of sales (28,210) (5,263) (22,947) 436%
Gross profit 85,689 17,643 68,046 386%
Other income 28,446 6,120 22,326 365%
Net finance expense (6,086) (180) (5,906) 3281%
Operating expenses (80,367) (17,813) (62,554) 351%
EBTDA, FX, share-based payments, one-off items 27,682 5,770 21,912 380%
Share-based payments (non-cash) (16,374) (1,838) (14,536) 791%
One-off costs (2,960) (2,051) (909) 44%
EBTDA (excluding FX, Touchcorp customer development contract)
8,348 1,881 6,467 344%
Foreign currency gains 1,395 - 1,395 N/A
Depreciation and amortisation (17,329) (2,708) (14,621) 540%
Touchcorp customer development contract - (13,596) 13,596 N/A
Loss before tax (7,586) (14,423) 6,837 47%
Income tax (expense)/benefit (1,390) 4,803 (6,193) (129%)
Loss for the year (8,976) (9,620) 644 7%
AFTERPAY
PAY NOW
FY18 REVENUE CONTRIBUTION
FY17 REVENUE CONTRIBUTION
18% 47%
82% 53%
REVENUE CONTRIBUTION BY SEGMENT
The 2018 financial year has seen the continued
strong growth of Afterpay with international
expansion, higher in-store transactions, new
merchant integrations and greater brand
awareness. The substantial change in Group
performance also reflects the success of the
Merger with the current year being the first full
year period of Group performance. As detailed
in past reports including the scheme booklet,
the Group intends to streamline the Pay Now
business and a review of the European E-services
business is in progress.
The Group recorded an increase of earnings
before tax, depreciation and amortisation, foreign
currency translation, share-based payments
(non-cash) and one-off items from $5.8m to
$27.7m or 380%. The increase is primarily due to
the strong growth in revenue derived from the
increase in numbers of merchants and customers
using Afterpay and the first-year combination
of the Pay Now business. This is partially offset
by the increase in finance costs and operating
expenses to support business growth.
FY17 Pay Now revenue is unaudited
12

DIRECTORS’ REPORT • FINANCIAL RESULTS (CONTINUED)
The Pay Later business has experienced strong
growth during the year with underlying merchant
sales increasing from $561m to $2.18bn for the
twelve-months of 30 June 2017 and 30 June
2018, respectively. This represents a sales growth
of 288.6% year on year. Integrated merchants
continued to grow strongly up by 176.7% from
6,000 merchants reported at 30 June 2017 to
approximately 16,600 current live merchants
at 30 June 2018. The Afterpay customer base
continues to grow with approximately 2.2m
unique registered end-customers and more
than 92% of customers are active and returning
customers. The average customer purchases
increased from $0.7k for the 2017 financial year
to $1.1k for the 2018 financial year. The growth in
the Afterpay brand contributed to $88.3m of the
$113.9m revenue from ordinary activities, with Pay
Now contributing the remaining $25.6m.
Financing costs reflect interest expense,
financing facility expenditure, costs associated
to extend funding facilities and the new senior
debt issuance. The funding is to support
the growth in the receivables platform and
international expansion.
The change in operating expenses reflects
an increase in employee costs as the team
scales, costs to support the global expansion
of the business and growth within Australia. The
increase in employee costs reflects both the
first year that all Afterpay and Touch employees
are consolidated within the same Group and an
increase in headcount to support growth. There
is also an increase in provisioning for losses
as a direct result of the growth of the Afterpay
receivables balances.
The management of risk continues to be the
Group’s priority and this was reflected in the
NTL improving as a percentage of underlying
merchant sales, despite the increased underlying
sales performance and merchant diversification
in the 2018 financial year. The Group’s receivables
impairment expense remains low compared to
industry standards which is primarily due to a
number of prudent procedures such as credit
and ID checks, proprietary fraud and repayment
capacity checks, the requirement that the
first repayment is made immediately for new
customers, low limits until a regular on-time
repayment record is established (and capped on
a continuing basis), and customers unable to use
Afterpay if outstanding balances remain unpaid.
The Group reports a statutory pre and post-tax
loss of $7.6m and $9.0m, respectively, for the
year ended 30 June 2018. The overall statutory
profitability of the Group was materially impacted
by the one-off share-based payments expense
(non-cash) associated with the new Group
Head and one-off expenditure incurred during
the period related to international expansion,
Merger finalisation and additional funding
establishment costs.
Share ownership is an important element of
the remuneration for executives. This aligns
the interests of employees with those of the
shareholders. The share-based payments
expense is $16.4m (non-cash) for the year ended
30 June 2018. This has been driven primarily
through the issuance of share-based payment
incentives to international and local senior
executives, as well as the result of the fair value
of shares to be issued to the Group Head which is
still subject to shareholder approval. An estimate
of the value of the share issue to the Group Head
has been included pending this approval.
One-off costs $3.0m relate to international
expansion of $1.2m, post-merger related
integration expense of $1.7m and facility
establishment and amending fees of $0.1m.
The balance sheet of the Group remains strong
with positive Net assets of $183.6m at 30 June
2018 compared to $160.1m as at 30 June 2017.
The growth in Current assets of $156.8m is
primarily driven through the growth related
increase in net receivables of $140.7m, primarily
derived from the Afterpay business. Current
liabilities of the Group have risen through
business, employee and merchant growth, with
the timing of merchant settlements associated
with 30 June 2018 being a Saturday impacting
the closing balance. The increase in Non-current
liabilities of $113.5m at 30 June 2018 is primarily
due to draw downs under the NAB facility and
the issuance of senior unsecured debt of $50m,
to assist the Group’s expansion of the Afterpay
product locally and internationally.
13
DIRECTORS’ REPORT • FINANCIAL RESULTS (CONTINUED)
The Group has maintained strong underlying
operating cash flows, thanks to the material
increase in underlying merchant sales and
corresponding repayments from customers. This
is also reflective of the first year of consolidated
group presentation. Underlying operating cash
flows for the business remain robust adjusted
for the increase in receivables associated with
the growth of the Afterpay product. Excluding
the impacts of receivable settlements, operating
cash flows for the period were $35.4m. Receipts
from customers increased from $440.9m to $2.2b,
while payments to merchants increased from
$516.1m to $2.3b. Given the deferred nature of the
customer payments for each outgoing settlement
and strong month on month growth in sales, net
cash flows used for operating activities continues
to be supported by financing cash flows. Key
financing cash flow movements during the
period relate to proceeds through the issuance
of unsecured debt notes as well as further draw
downs and repayment of the NAB funding facility.
FUNDING
The Group continues to remain conservatively
leveraged with significant headroom in its existing
facilities supported by a large and growing
receivables balance. The Group’s funding facility
with NAB increased from $200m in June 2017 to
$350m in November 2017, remaining at $350m
at 30 June 2018. At the balance sheet date, the
Group had a drawn balance of $111.6m, with
$238.4m undrawn. The facility is secured against
Afterpay Australia’s receivable balance. The
Group also holds a NZ$20m facility available with
ASB to assist funding the Group’s New Zealand
operations, as at balance date there were no
draw downs on this facility.
Further to the above the Group has increased
its funding diversification and tenor to the
Group’s debt maturity profile through the
issuance of 4-year senior unsecured notes to
institutional and professional investors. The
notes were successfully issued on 18 April 2018
raising $50m. Funds raised were utilised for
general working capital purposes and planned
geographical expansion.
14

DIRECTORS’ REPORT • DIRECTORS’ REPORT
The performance of the Group during the financial year has been strong. The Group revenue and other income increased from $29.0 million to $142.3 million.
15
DIRECTORS’ REPORT • BUSINESS UPDATE
PAY LATERThis year was a year of significant growth for
the Afterpay business both within Australia and
internationally. This is reflected in key business
metrics including:
• Underlying sales of $2.18bn were realised
during the year against $561m in the 2017
financial year. The Group continues to
investigate new opportunities to expand the
Afterpay product offering with the onboarding
of merchants in Health, Beauty, Entertainment
and Travel such as Primary Dental, Dreamworld
and Jetstar. This will remain a focus of the Group
during the next financial period; and
• The increase in underlying sales was achieved
through the onboarding of new merchants
with approximately 16,600 live merchants as
at 30 June 2018 (up from 6,000 as reported
for 30 June 2017) and strong growth in
customer numbers.
A key Group strategy in the financial year has
been the expansion of the Afterpay product
In-store with significant growth of integrated
shopfronts achieved during the period.
The Group has also achieved success in its
international expansion with several marquee
merchants onboarded in the United States along
with the establishment of an experienced team.
A continual focus of the Group is customer
advocacy and the promotion of responsible
customer spending. Significant investment has
been made on a number of Afterpay product
enhancements. Key product enhancements
include the introduction of external ID checks
supplementing Afterpay’s proprietary transaction
engine, as well as the introduction of late fee
capping at 25% of the purchase value (maximum
fee $68 per order).
Market and industry support of the Afterpay
brand continues to grow evidenced by the Group
being awarded ‘Fintech organisation of the year’
BUSINESS UPDATE
for the second consecutive year. The Group was also
recognised by its industry peers as ‘Payments innovator
of the year’ and as the recipient of the ‘Fintech business
excellence’ award at the Australian FinTech Awards. The
Group also achieved a public market milestone during
the period joining the ASX200 Index.
N.Z. OPERATIONS
During the first half, the Group expanded markets
outside Australia with the successful launch of the
Afterpay product offering in New Zealand. While New
Zealand is a relatively small retail market compared to
Australia, Afterpay is pleased with the progress made
during the period and since inception (approximately
nine months). Afterpay is signing up the largest retailers
and most well-loved brands in New Zealand, including
Glassons, Hallensteins and Icebreaker. Afterpay is
also continuing to expand its Australian retail base to
New Zealand. New Zealand customer numbers are
consistently growing in line with our retail footprint
expansion.
U.S. OPERATIONS
The Group’s U.S. operations commenced in mid
May 2018. For the period of less than two months of
operations, there were more than 120 U.S. merchants
and 50k customers utilising the Afterpay platform. The
Group is positioning the U.S. business for scale through
key personnel hires and continues to achieve strong
momentum onboarding new merchants and growing
the U.S. customer base.
PAY NOWFollowing the successful merger of the Group entities,
there are a number of opportunities for complementary
product development between Pay Now and Pay Later
product suites. The Group will focus on developing
proprietary, profitable, transaction based products that
are scalable in their markets and add to the transaction
integrity and data capabilities of the combined Group.
The Group is undertaking a strategic review of the
Pay Now business to ensure that all its activities are
compatible within the Group’s growth strategy.
16

DIRECTORS’ REPORT • BUSINESS UPDATE
REVENUE MODEL
PAY LATER
Afterpay generates its revenue primarily from
transaction fees paid by its retail merchant
clients (Merchant Fees) in relation to underlying
Afterpay sales.
Merchant Fees are paid to Afterpay on each
approved order placed by a customer through
the Afterpay system. Merchant Fees are
predominantly based on a percentage of the
customer order value plus a fixed per transaction
fee. Merchant Fees represented approximately
75.6% of Afterpay’s income for the twelve-month
period ending 30 June 2018, with the remaining
24.4% principally comprised of late fees charged
to customers who do not make their agreed
instalment payments on time. Afterpay is focused
on consistently reducing the percentage of
revenue represented by late fees through
continuous improvement of its platform and risk
assessment tools.
The increase in Merchant Fees during the
financial year was driven by the growth in the
number of merchants that provide the Afterpay
service to their customers as well as an increase
in the proportion of customers that choose to
use Afterpay as a method of online payment with
participating merchants. Seasonality will also
impact Afterpay transaction revenue in any given
period, which is a function of consumer buying
patterns at different times of the calendar year.
Afterpay employs capital to fund the period
between paying its retail merchant clients upfront
and the time it takes to recoup full payment
from the customer. Afterpay aims to fully recoup
the value of any discrete transaction within a
maximum of 56 days. Afterpay’s business model
aims to recycle capital efficiently and to drive
higher transaction volumes per dollar of capital
employed. The average weighted duration to
recoup customer payments during the 12 months
ended 30 June 2018 was less than 30 days.
PAY NOW
Pay Now generates revenue from four
main sources:
• Transaction fees for the delivery of
completed transactions;
• Integration fees for the connection of new
customers to the Touch System Platform;
• Integration fees for granting existing customers
access to additional service models; and
• Infrastructure fees for providing a bespoke Touch
platform.
Transaction fees are calculated as either a
percentage of the transaction volume (in the mobility
business) or as a fixed transaction fee (in the retail
e-services business). Pay Now also generates
additional revenue from marketing and advertising
services, mostly through the sale of advertising
space in the Touch magazine, and providing other
direct and indirect communications to merchant
retailers and consumers.
SIGNIFICANT CHANGES IN THE STATE OF AFFAIRSIn the opinion of the Directors, there were no
significant changes in the state of affairs of the
consolidated entity during the financial period, other
than the Group restructure which was affected
through the Merger as noted in this report.
SIGNIFICANT EVENTS SUBSEQUENT TO THE END OF THE FINANCIAL YEAR
CLEARPAY
Subsequent to 30 June 2018, the Group entered
into a Share Purchase Agreement (SPA) to acquire
ClearPay Finance Limited (ClearPay), an entity 100%
owned by ThinkSmart Limited (ThinkSmart). ClearPay
is a U.K. based payments company through which
customers can purchase items up to £450 in value
and make repayments in three interest-free monthly
instalments. The acquisition completed on 23 August
2018, however ThinkSmart will continue to operate
the business for a period of approximately 90 days
from the completion date.
Under the SPA, the Group will acquire 90% of the issued
shares in ClearPay for total consideration of 1m APT
shares. The Group also has an option to acquire the
remaining shares held by ThinkSmart, exercisable any
time after 5 years from completion based on agreed
valuation principles. The consideration for the remaining
10% can either be paid in cash or APT shares.
17

DIRECTORS’ REPORT • SIGNIFICANT EVENTS SUBSEQUENT TO THE END OF THE FINANCIAL YEAR (CONTINUED)
CAPITAL MANAGEMENT
The receivables financing facility limit provided
by NAB was reduced from $350m to $300m
on 15 August 2018 to reflect the cash proceeds
from the $50m senior unsecured notes issued
by the Group in April 2018.
On 22 August 2018, the Group incorporated
Citi as an additional lender into the existing
NAB Australian warehouse receivables facility,
providing an additional $200m of funding
capacity. This increased the total facility limit to
fund Australian originated receivables to $500m.
The Group is undertaking a fully underwritten
Institutional Placement to eligible investors,
to raise at least $108.1m to fund Afterpay’s
international expansion strategy.
Pricing will be determined via an institutional
bookbuild, with an underwritten floor price of
$15.75 per share. The underwritten floor price
represents a 9.9% discount to the 5 day VWAP
to close of trade on 22 August 2018. New shares
issued under the Placement will rank equally
with the Group’s existing shares.
Other than noted above, no other matter or
circumstance has occurred subsequent to
period end that has significantly affected, or
may significantly affect, the operations of the
Group, the results of those operations or the
state of affairs of the Group or economic entity in
subsequent financial years.
LIKELY DEVELOPMENTS AND EXPECTED RESULTS OF OPERATIONSThe Group believes there is significant scope
to increase revenue and profitability from its
business strategy. The Group’s focus is to deliver
long-term returns, strong revenue growth
and profitability to shareholders, by increasing
the number of underlying Afterpay sales and
Afterpay merchant fees. The Group is also
focused on optimising the performance of the
Pay Now business lines. Optimisation reviews
are currently underway and this may result in a
rationalisation of product lines or areas of focus.
Further information on likely developments in
the operations of the consolidated entity and the
expected results of operations have not been
included in this report because the Directors
believe it to be commercial in confidence
and therefore likely to result in unreasonable
prejudice to the Group.
KEY RISKS AND BUSINESS CHALLENGESThe Group continues to establish its presence in
the Australian, New Zealand and the United States
markets. The Group’s ability to profitably scale
its business is reliant on increases in transaction
volumes and increases in its customer and retail
merchant client base.
In particular, the Afterpay product has a competitive
advantage in being one of the first to provide its style
of service to the Australian, New Zealand and the
United States retail markets. However, there is always
a risk of new entrants in the market which may
disrupt the business and its market share.
The principal risks and business challenges for the
Pay Later operations are:
• Ability to attract new talent and retain existing key
employees in the highly competitive technology
sector;
• Ability to retain and grow Afterpay’s retail merchant
client base;
• Ability to retain and grow Pay Later customers in
Australia and overseas;
• Risks associated with the emergence of new
technologies and customer requirements;
• Success of international expansion;
• Maintaining and optimising its systems and
processes to make accurate real time fraud and
repayment capability assessments in connection
with the customer approval processes;
• The possible requirement for additional funding
to support the expected growth in instalment
payments receivables;
• Changes to the regulatory environment that may
impact the Group’s products and their delivery.
In order to manage these challenges, the Group has
strengthened its business development resources
and processes, continues to invest in improving its
transaction integrity engine, and continues to invest in
expanding its service offering.
For the Pay Now business line, the Group
continues to explore opportunities for product
development complementary to the Pay Later
product. In particular, the business is focused on the
development of proprietary, profitable, transaction
based products that are scalable in their markets
and further add to the transaction integrity and data
capabilities of the combined group and will not
18

DIRECTORS’ REPORT • KEY RISKS AND BUSINESS CHALLENGES (CONTINUED)
devote resources to new activities that do not
further those objectives. The Group is continuing
to undertake a strategic review of all business
lines to ensure that all Pay Now activities remain
appropriately focused.
The principal risks and business challenges for
the Pay Now operations are:
• Large, single counter-party contracts and
revenue streams;
• Lengthy tender and decision-making processes
for the large retailers, financial institutions and
government authorities;
• Risks associated with the emergence of new
technologies and customer requirements.
In order to manage these challenges, the Group
aims to have a balanced portfolio of products
and services, across an increasing range of
industry verticals.
There is a risk for both the Pay Later and Pay
Now operations that additional Government
or other regulation might delay or prevent the
Group from growing across other jurisdictions
and there is the risk of a decline in economic
activity levels resulting in the Group’s existing
customers processing fewer transactions
resulting in decreased revenue. These factors
may affect the Group’s ability to accurately
forecast the timing and quantum of both new and
on-going business.
SUSTAINABILITYThe Group endeavours to operate our business
in ways that produce social, economic and
environmental benefits for the communities
we serve in Australia, New Zealand and the
United States. As a successful public company,
we understand that long-term future success
depends upon continuously improving our
reputation and enhancing employee morale.
We pay attention to the expectations of our
employees and stakeholders, while respecting
and serving our communities as best we can.
The Group has a small environmental footprint
and as such our largest impacts come from
our travel, energy and consumables. We take
steps to improve our environmental impact
through office based initiatives carried out by
our operations and facilities teams. We are also
proud to partner with like minded charities to
assist in addressing the social and environmental issues
important to our people and our customers.
The Group Head is responsible for reporting to the Board
on any environmental and regulatory issues at each
Directors meeting, if required.
There are no matters that the Board considers need to
be included in this report. The Group is not subject to the
reporting requirements of either the Energy Efficiency
Opportunities Act 2006 or the National Greenhouse and
Energy Reporting Act 2007.
SHARE OPTION PLAN
UNISSUED SHARES
As at the date of this report there were 31,906,116 (including
2m Loan Shares to Group Head, which are pending
shareholders approval) ordinary shares under options.
Option holders do not have any right, by virtue of the
option, to participate in any share issue of the Group or
any related body corporate.
Details of the option plan are disclosed in Note 13 to the
Financial Statements.
DEEDS OF ACCESS, INDEMNITY AND INSURANCE FOR DIRECTORS AND OFFICERS
ACCESS
The Group has entered into deeds of access, indemnity
and insurance with each Director which contain rights of
access to certain books and records of the Group.
INDEMNIFICATION
Under the Constitution, the Group is required to indemnify
all Directors and officers, past and present, against all
liabilities allowed under law. Under the deed of access,
indemnity and insurance, the Group indemnifies parties
against all liabilities to another person that may arise from
their position as an officer of the Group or its subsidiaries
to the extent permitted by law. The deed stipulates that
the Group will meet the full amount of any such liabilities,
including reasonable legal costs and expenses.
INSURANCE
Under the Constitution, the Group may arrange and
maintain Directors’ and officers’ insurance for its Directors
to the extent permitted by law and under the deed
of access, indemnity and insurance, the Group must
maintain insurance cover for each Director for the duration
of the access period.
19

REMUNERATION REPORT
REMUNERATION REPORT
20

REMUNERATION REPORT • INTRODUCTION TO REMUNERATION AT AFTERPAY TOUCH GROUP
SECTION 1: INTRODUCTION TO REMUNERATION AT AFTERPAY TOUCH GROUPAfterpay Touch Group is pleased to present its Remuneration Report (‘Report’) for the 12
months ended 30 June 2018 (‘Reporting Period’). This Report forms part of the Directors’
Report and has been audited as required by the Corporations Act 2001 (Cth). It contains
information regarding the remuneration arrangements for key management personnel
(‘KMP’) of the Group and outlines the relationship between the Group’s performance and
remuneration outcomes for KMPs.
1.1 OUR PHILOSOPHY
The Group’s executive remuneration framework is underpinned by the philosophy of ‘Acting as Owners’. Guided by this philosophy, the Group looks to remuneration that is firstly ‘Market Competitive’, secondly offers ‘Pay for Performance’ and thirdly supports our core value of being ‘Customer-First’. We are committed to delivering remuneration that reflects these principles to ensure we attract and retain leading talent, align remuneration to shareholder outcomes and encourage the continued development of products which deliver the best possible user experience for our customers. Total remuneration for executives includes a moderate fixed component relative to ASX listed peers in favour of a higher at-risk or performance related component in the form of Short Term Incentives (STIs) and Long Term Incentives (LTIs).
REMUNERATION PRINCIPLES
The Group is one of a small segment of ASX listed companies that operate in the globalised technology sector and has operations in the US market. The technology sector and US market are highly competitive for top tier talent and place a greater emphasis on at-risk remuneration in the form of share-based awards than is typical for Australian listed companies. Given this context, the Group provides a high proportion of LTI share-based payments vs fixed remuneration for senior executives to ensure the Group can be ‘Market Competitive’ and attract, motivate and retain key talent in the global technology talent pool, in order to achieve excellent performance for shareholders.
MARKET COMPETITIVE
The Group offers at-risk remuneration (either in the form of STI or LTI arrangements) linked to the achievement of individual and Group performance targets to align executive remuneration outcomes with shareholder outcomes. In this way the Group’s and the individual’s actual performance directly affects what the executive is paid and a ‘Pay for Performance’ link is established. In the case of LTI share-based awards, an executive’s remuneration is also directly linked to the value of APT shares creating a strong alignment of interests.
PAY FOR PERFORMANCE
The Group is focused on never losing sight of its key stakeholders including customers, merchants, shareholders and external parties such as interest groups. Business and operational risk have also been a consideration in designing the remuneration framework, including with regard to the performance targets chosen, deferred vesting periods and, in some instances, the Board’s discretion on approving and granting payments.
CUSTOMER FIRST
1.2 CHANGES TO OUR REMUNERATION FRAMEWORK FOR FY19
FY18 EXECUTIVE KMP REMUNERATION PROGRAMMES
AT-RISK EQUITY PLAN FOR EMPLOYEES OF US BUSINESS
FY19 REMUNERATION PROGRAMMES
At-risk Executive STI arrangement which is available to a small group of senior executives including KMP. Further information about STI arrangements is set out in sections 3.2 below
At-risk Executive LTI arrangement which is available to a small group of senior executives including KMP. Under Executive LTI arrangements, executives are issued one-off share-based grants (in the form of options, loan shares or performance rights) at the time they commence employment, with deferred vesting, in order to attract key executive talent into the organisation. Further information about the LTI arrangements is set out in section 3.3 below.
During the year, an at-risk equity plan was established for employees of the US business (‘US ESOP’) which is designed to attract, retain and incentivise talent in the US market to grow the business in that region in line with the Group’s strategic objectives.
No members of KMP are currently eligible to participate in this plan. Further information about the US ESOP Plan is set out in section 3.4 below.
In FY19 the Group’s STI and LTI remuneration programmes will be reviewed with a view to driving an even stronger ‘Acting as Owners’ philosophy, to more closely align these programmes with market practice of ASX listed companies and to potentially make them available to a broader cross-section of employees.
Further details regarding the new arrangements will be disclosed in the Group’s FY19 Remuneration Report.
21

REMUNERATION REPORT • INTRODUCTION TO REMUNERATION AT AFTERPAY TOUCH GROUP (CONTINUED)
1.3 WHO IS COVERED BY THIS REPORT
This Report covers KMP of the Group, who are the people responsible for determining
and executing the Group’s strategy. This includes KMP (the Executive Chairman,
Executive Directors and heads of business units who are part of the executive
leadership team) as well as Non-Executive Directors.
TABLE 1. KMP DURING THE REPORTING PERIOD
KMP POSITION TERM AS KMP
EXECUTIVE DIRECTORS
Anthony Eisen Executive Chairman Full Year
David Hancock Executive Director and Group Head Full Year
Nicholas Molnar Executive Director and CEO of Afterpay Full Year
NON-EXECUTIVE DIRECTORS
Clifford Rosenberg Director Full Year
Elana Rubin Director Full Year
Dana Stalder1 Director Part Year
Michael Jefferies2 Director Part Year
OTHER EXECUTIVE KMP
Nadine Lennie3 Chief Financial Officer Part Year
Luke Bortoli4 Chief Financial Officer Part Year
1. Dana Stalder was appointed as a Non-Executive Director on 24 January 2018.
2. Michael Jefferies ceased as a Non-Executive Director on 16 January 2018.
3. Nadine Lennie ceased performing the substantive duties of CFO on 15 March 2018
4. Luke Bortoli commenced employment on 21 May 2018.
SECTION 2: EXECUTIVE KMP REMUNERATION
OVERVIEW
Executive KMP remuneration is linked to the drivers of the Group’s business strategy
and is aimed at rewarding executives for delivering excellent performance and
generating value for shareholders. The at-risk components of remuneration (STI and
LTI) are tied to measures that reflect the successful execution of our business strategy
over both the short and long term. This means the Group’s actual performance directly
affects what KMP are paid.
2.1 EXECUTIVE KMP REMUNERATION IN THE REPORTING PERIOD
Total remuneration for KMP includes both a moderate fixed component (base salary)
and an at-risk or performance related component (STI and LTI awards). An outline of
these components is set out below.
22
REMUNERATION REPORT • EXECUTIVE KMP REMUNERATION (CONTINUED)
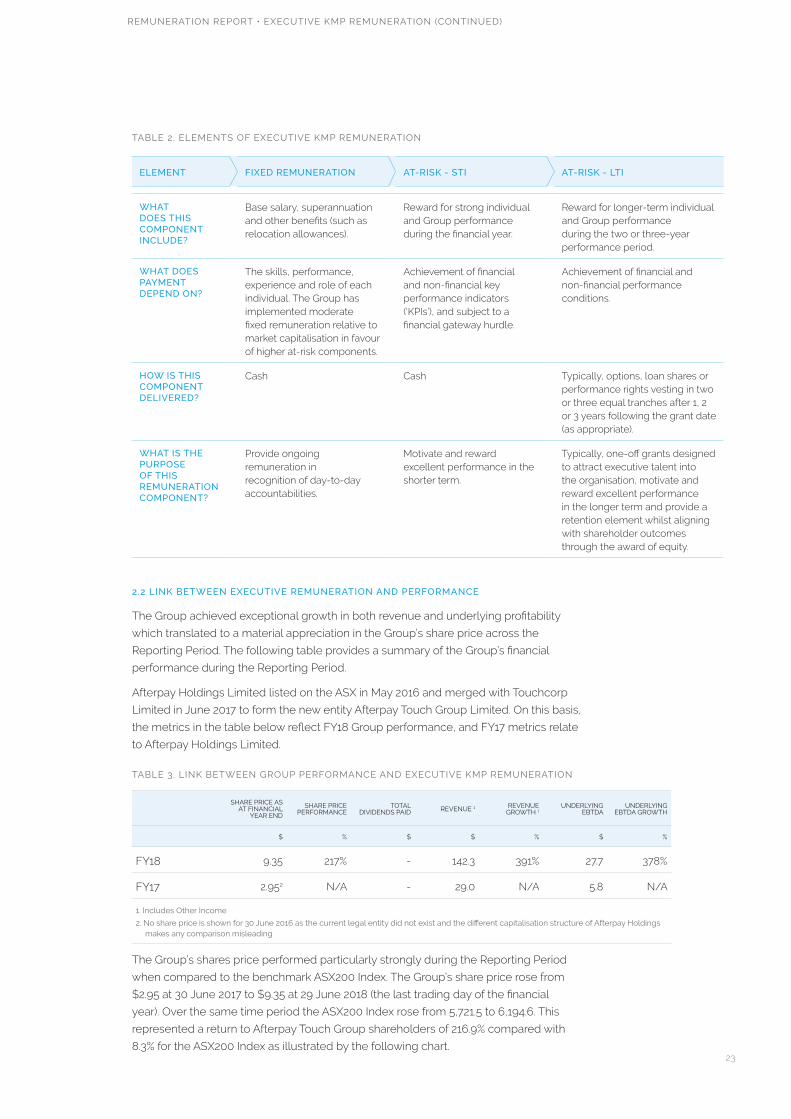
TABLE 2. ELEMENTS OF EXECUTIVE KMP REMUNERATION
ELEMENT FIXED REMUNERATION AT-RISK - STI AT-RISK - LTI
WHAT DOES THIS COMPONENT INCLUDE?
Base salary, superannuation and other benefits (such as relocation allowances).
Reward for strong individual and Group performance during the financial year.
Reward for longer-term individual and Group performance during the two or three-year performance period.
WHAT DOES PAYMENT DEPEND ON?
The skills, performance, experience and role of each individual. The Group has implemented moderate fixed remuneration relative to market capitalisation in favour of higher at-risk components.
Achievement of financial and non-financial key performance indicators (‘KPIs’), and subject to a financial gateway hurdle.
Achievement of financial and non-financial performance conditions.
HOW IS THIS COMPONENT DELIVERED?
Cash Cash Typically, options, loan shares or performance rights vesting in two or three equal tranches after 1, 2 or 3 years following the grant date (as appropriate).
WHAT IS THE PURPOSE OF THIS REMUNERATION COMPONENT?
Provide ongoing remuneration in recognition of day-to-day accountabilities.
Motivate and reward excellent performance in the shorter term.
Typically, one-off grants designed to attract executive talent into the organisation, motivate and reward excellent performance in the longer term and provide a retention element whilst aligning with shareholder outcomes through the award of equity.
2.2 LINK BETWEEN EXECUTIVE REMUNERATION AND PERFORMANCE
The Group achieved exceptional growth in both revenue and underlying profitability
which translated to a material appreciation in the Group’s share price across the
Reporting Period. The following table provides a summary of the Group’s financial
performance during the Reporting Period.
Afterpay Holdings Limited listed on the ASX in May 2016 and merged with Touchcorp
Limited in June 2017 to form the new entity Afterpay Touch Group Limited. On this basis,
the metrics in the table below reflect FY18 Group performance, and FY17 metrics relate
to Afterpay Holdings Limited.
TABLE 3. LINK BETWEEN GROUP PERFORMANCE AND EXECUTIVE KMP REMUNERATION
SHARE PRICE AS
AT FINANCIAL YEAR END
SHARE PRICE PERFORMANCE
TOTAL DIVIDENDS PAID REVENUE 1 REVENUE
GROWTH 1UNDERLYING
EBTDAUNDERLYING
EBTDA GROWTH
$ % $ $ % $ %
FY18 9.35 217% - 142.3 391% 27.7 378%
FY17 2.952 N/A - 29.0 N/A 5.8 N/A
1. Includes Other Income
2. No share price is shown for 30 June 2016 as the current legal entity did not exist and the different capitalisation structure of Afterpay Holdings makes any comparison misleading
The Group’s shares price performed particularly strongly during the Reporting Period
when compared to the benchmark ASX200 Index. The Group’s share price rose from
$2.95 at 30 June 2017 to $9.35 at 29 June 2018 (the last trading day of the financial
year). Over the same time period the ASX200 Index rose from 5,721.5 to 6,194.6. This
represented a return to Afterpay Touch Group shareholders of 216.9% compared with
8.3% for the ASX200 Index as illustrated by the following chart.23

REMUNERATION REPORT • EXECUTIVE KMP REMUNERATION (CONTINUED)
FIGURE 1: PERFORMANCE OF APT VS. ASX 200
50
100
150
200
250
300
350
ASX 200
APT
JUNE 17 JUNE 18
SOURCE: FACTSET
SECTION 3: EXECUTIVE REMUNERATION IN THE REPORTING PERIOD
3.1 FIXED REMUNERATION
All senior executives receive fixed remuneration which includes cash, compulsory
superannuation and any salary-sacrificed items (including fringe benefits). As
appropriate, KMP receive additional support including accommodation allowances,
travel, ad-hoc taxation advice and insurance. KMP do not receive retirement benefits
beyond superannuation.
When determining the level of fixed remuneration for each role, the Group considers the
remuneration levels offered at organisations from which it sources talent and to whom
it could potentially lose talent. From time to time, the Board engages independent
remuneration advisers to provide remuneration benchmarking data as input into setting
remuneration for KMP. Typically, fixed remuneration for the Group’s KMP is lower
than the average of larger ASX listed companies given our focus on variable ‘at-risk’
remuneration.
3.2 EXECUTIVE STI AWARDS GRANTED DURING REPORTING PERIOD
The table below outlines the key terms and conditions applying to the Executive STI
arrangements for the KMPs during the Reporting Period.
TABLE 4. DESCRIPTION OF EXECUTIVE STI GRANTED IN FY18
OVERVIEW OF STI DURING THE REPORTING PERIOD
STI arrangements are an at-risk component of executive remuneration involving the payment of a cash award if vesting conditions are met, including satisfaction of performance conditions.
PERFORMANCE PERIOD
STI awards are measured over the 12-month financial year. Any STI award payments are made after performance is tested at the end of the performance period.
PERFORMANCE CONDITIONS
STI performance conditions include Group KPIs and individual KPIs.
Group KPIs may consist of financial, strategic and customer satisfaction components including revenue growth; Net Transaction Margin performance; Net Promoter Scores and underlying profitability measures. These measures have been chosen as they are significant factors in the Group’s overall financial performance and its reputation within the markets it operates.
Individual KPIs consist of personal business goals which align with the Group’s strategies, as well as a compliance component.
The Board believes that having a mix of financial and non-financial KPIs will provide measurable financial performance criteria strongly linked to year-on-year shareholder returns and encourage the achievement of personal business goals consistent with the Group’s overall objectives.
24

REMUNERATION REPORT • EXECUTIVE REMUNERATION IN THE REPORTING PERIOD (CONTINUED)
MEASUREMENT OF PERFORMANCE CONDITIONS
Performance against the KPIs is assessed annually by the Board based on recommendations from the Remuneration and Nomination Committee and Group Head after the end of the performance period as part of the broader performance review process for each KMP.
Financial and non-financial conditions are assessed quantitatively against predetermined benchmarks where appropriate. When testing financial KPIs, financial results are extracted by reference to the Group’s financial statements.
These methods of assessing performance were chosen because they are, as far as practicable, objective and fair. The use of financial statements ensures the integrity of the measure and alignment with the true financial performance of the Group.
TREATMENT ON CESSATION OF EMPLOYMENT
If a KMP ceases to be employed during the 12-month performance period in ‘good leaver’ circumstances, they may be entitled to a pro rata STI award unless the Board determines otherwise.
PERCENTAGE OF STI PAID AND FORFEITED DURING THE REPORTING PERIOD
Details of the STI outcomes during the Reporting Period are outlined in the table below.
TABLE 5. EXECUTIVE KMP STI OUTCOMES
EXECUTIVE KMP MAXIMUM STI OPPORTUNITY1
DOLLAR VALUE OF STI AWARD GRANTED2
% OF MAXIMUM STI AWARD GRANTED
% OF MAXIMUM STI AWARD FORFEITED
Anthony Eisen4 N/A 300,000 N/A N/A
David Hancock 300,000 300,000 100% 0%
Nicholas Molnar 300,000 300,000 100% 0%
Luke Bortoli - - N/A N/A
Nadine Lennie3 - - N/A N/A
1. The minimum potential value of STI awards is nil.
2. The STI cash award will be paid to eligible Executive KMP in September 2018.
3. Nadine Lennie ceased employment with the Group during the performance period, and accordingly her STI award was forfeited.
4. Anthony Eisen’s terms of employment do not specify a STI component. The Board has approved a discretionary payment in relation to Anthony Eisen’s performance for the Reporting Period.
3.3 EXECUTIVE LTI AWARDS
The table below outlines the key terms and conditions applying to the Executive LTI
arrangements for the KMPs during the Reporting Period.
TABLE 6. DESCRIPTION OF LTI
OVERVIEW OF EXECUTIVE LTI ARRANGEMENT DURING THE REPORTING PERIOD
Executive LTI awards are an at-risk component of executive remuneration typically involving the one-off grant of share-based awards (in the form of options, performance rights or loan shares) at the time the executive commences employment. They are used to attract and retain key executive talent to the organisation.
The Group will continue to review its incentive arrangements on an ongoing basis to ensure they continue to meet the evolving needs of the Group. One-off LTI grants are likely to remain a key remuneration arrangement designed to attract executives and retain talent over the medium term.
FORM OF AWARD Options entitle the holder to one share in the Group for every option exercised, subject to satisfaction of performance conditions and payment of the exercise price. Options are granted for nil consideration as they are part of an executive’s remuneration. Please refer to Table 12 for details of options awarded during the Reporting Period.
Loan shares are shares subject to an interest-free non-recourse loan and are subject to dealing restrictions until the loan is repaid. Refer to Table 12 for details of loan share LTIs during the Reporting Period.
Performance rights entitle the holder to one share in the Group for each right that vests, subject to satisfaction of performance conditions. No performance rights were granted during the Reporting Period.
25

REMUNERATION REPORT • EXECUTIVE REMUNERATION IN THE REPORTING PERIOD (CONTINUED)
PERFORMANCE PERIOD
LTI awards typically vest in two or three equal tranches after 1, 2 or 3 years following the grant date (as appropriate). LTI awards only vest after performance against the performance conditions is measured after each of the relevant vesting dates.
PERFORMANCE CONDITIONS
A combination of individual financial and non-financial performance conditions is chosen that is relevant to each KMP. These KPIs will ultimately drive future growth and returns for shareholders in the medium to long term. Non-financial individual targets are chosen to encourage the achievement of personal business goals consistent with the Group’s overall strategic objectives.
MEASUREMENT OF PERFORMANCE CONDITIONS
Performance against KPIs is assessed annually for each member of the KMP after each of the relevant vesting dates by the Board based on recommendations from the Remuneration and Nomination Committee and Group Head where appropriate.
Financial and non-financial performance conditions are assessed quantitatively against predetermined benchmarks where appropriate. When testing the financial performance conditions, financial results are extracted by reference to the Group’s financial statements. Where quantitative assessment is not practicable, qualitative performance appraisals are undertaken by the Board in consultation with the Remuneration and Nomination Committee.
These methods of assessing performance were chosen because they are, as far as practicable, objective and fair. The use of financial statements ensures the integrity of the measure and alignment with the true financial performance of the Group.
DISPOSAL RESTRICTIONS
Options are subject to dealing restrictions until they are exercised. Upon exercise and payment of the exercise price, participants are allocated fully paid ordinary shares in the Group.
Loan shares are subject to dealing restrictions until they have vested and the loan has been repaid, unless otherwise determined by the Board.
Participants are free to deal with the shares allocated to them following vesting (and exercise where applicable) subject to the Group’s Securities Trading Policy.
TREATMENT ON CESSATION OF EMPLOYMENT
Options only vest at the applicable vesting date if the participant:
• remains employed with the Group on that date; or
• they have ceased employment as a “good leaver” (for example, due to death, total or
permanent disablement, illness, genuine redundancy, or other factors determined by
the Board to constitute sufficient reason to treat the person as a “good leaver”).
Loan Shares vest on the applicable vesting date if the participant remains employed on that date, or earlier if they cease employment as a good leaver.
CHANGE OF CONTROL
If a takeover bid is made, or a scheme of arrangement, selective capital reduction or other transaction is initiated which has an effect similar to a full takeover bid for shares in the Group, the Board has discretion to waive any outstanding performance conditions.
CLAWBACK The Board has broad clawback powers that it may exercise if, for example, a participant has acted fraudulently or unlawfully or engaged in conduct in material breach of the Group’s policies and codes of conduct.
3.4 U.S. ESOP PLAN
In line with the Group’s objective of expanding into the United States market, the Board
established a US equity incentive plan (‘US ESOP Plan’) during the Reporting period for
employees of the Group’s wholly owned subsidiary, Afterpay US, Inc (‘Afterpay US’).
During FY18, the Group made a number of senior appointments in the US with the US
ESOP Plan being a key driver of their appointment.
The US ESOP Plan allows for an entitlement of up to 10% of the fully diluted stock of
Afterpay US to employees, directors, and consultants. The options will convert to either
APT shares or, if a direct IPO of Afterpay U.S. occurs, shares in the Afterpay U.S. entity.
The Board supported the development of an employee equity incentive plan dedicated
to US employees in order to maximise the chances of successfully delivering on the
Group’s US growth aspirations and attracting world-class talent. The Board obtained
advice that the US Plan was designed in line with typical US option plan structures and
would therefore be competitive in attracting and retaining talent in that regard. In the FY18
period, no KMP participated in the US ESOP plan.
26

REMUNERATION REPORT • EXECUTIVE REMUNERATION IN THE REPORTING PERIOD (CONTINUED)
3.5 EXECUTIVE CONTRACTS
All KMP have a written executive service agreement with the Group. The key terms of
these agreements are set out below:
TABLE 7. KEY TERMS OF KMP CONTRACTS IN FY18
TERM EXECUTIVE KMP
DURATION Ongoing term
PERIODS OF NOTICE REQUIRED TO TERMINATE
Either party may terminate the contract by giving 3 months’ notice for all KMP other than David Hancock for whom 6 months’ notice applies.
The Group may terminate immediately in certain circumstances, including where the relevant Executive KMP engages in serious misconduct.
TERMINATION PAYMENTS
David Hancock is entitled to six months’ base salary where termination occurs (i) by the Company without notice or for incapacity, or (ii) by David Hancock on other grounds (such as a material adverse change in role). David Hancock is not entitled to this payment if the Company terminates for cause.
Other members of the KMP are entitled to 3 months’ salary where termination occurs other than for cause.
SECTION 4: REMUNERATION GOVERNANCE
OVERVIEW
The following table represents the Group’s remuneration decision making structure.
FIGURE 2. REMUNERATION GOVERNANCE AND DECISION MAKING
BOARD
Review and approve remuneration framework, remuneration principles and specific remuneration outcomes for Executive Directors.
Exercise of discretion in relation to targets, goals and funding pools.
REMUNERATION AND NOMINATION COMMITTEE
The Board has adopted a Remuneration Policy. In line with that Policy, the Committee is responsible for assisting the Board to determine the appropriate remuneration and KPIs for directors and senior management. The Committee refers to the Policy when developing Board recommendations about KMP remuneration outcomes.
MANAGEMENT REMUNERATION ADVISERS
Proposals on executive remuneration outcomes Implementing remuneration policies
External and independent remuneration advice and information
4.1 BOARD AND REMUNERATION AND NOMINATION COMMITTEE RESPONSIBILITIES
The Remuneration and Nomination Committee assists the Board in setting remuneration
strategies and determining remuneration of and incentives for Non-Executive Directors,
Executive Directors, the Group Head and other senior executives. The Remuneration and
Nomination Committee Charter sets out the Remuneration and Nomination Committee’s
role and responsibilities, composition, structure and membership requirements.
It is critical that the Remuneration and Nomination Committee is independent of
management when making decisions affecting employee remuneration. Accordingly,
the Committee is comprised entirely of Non-Executive Directors, all of whom are
independent. Where appropriate, the Group Head, Executive Chairman and Chief
Financial Officer attend Committee meetings, however they do not participate in formal
decision-making or in discussions relating to their own remuneration. 27

REMUNERATION REPORT • REMUNERATION GOVERNANCE (CONTINUED)
Details of the composition and responsibilities of the Remuneration and Nomination
Committee are set out in the Corporate Governance Statement which can be found at the
Corporate Governance section of our website.
4.2 USE OF REMUNERATION CONSULTANTS
The Remuneration and Nomination Committee may seek and consider advice from
external advisers from time to time to assist the Committee discharge its duties. Any
advice from consultants is used to guide the Committee and the Board, but does not
serve as a substitute for thorough consideration by Non-Executive Directors.
Remuneration advisers may be engaged by the Chairperson of the Remuneration
and Nomination Committee, however, during the Reporting Period, consultants
did not provide the Remuneration and Nomination Committee with remuneration
recommendations relating to KMP. Benchmark data and tax advice only was provided to
the Committee.
SECTION 5: NON-EXECUTIVE DIRECTOR REMUNERATION
OVERVIEW OF POLICY
The table below sets out the key objectives of the Group’s Non-Executive
Director remuneration policy and how they are achieved through the Group’s
remuneration framework.
TABLE 8. NON-EXECUTIVE DIRECTOR REMUNERATION POLICY
SECURING AND RETAINING TALENTED, QUALIFIED DIRECTORS
PRESERVING INDEPENDENCE AND IMPARTIALITY
ALIGNING DIRECTOR AND SECURITY HOLDER INTERESTS
The Remuneration and Nomination Committee makes recommendations to the Board regarding remuneration for Non-Executive Directors.
Director remuneration consists of base fees and additional fees for the Chairman of any Board Committee. No element of Non-Executive Director remuneration is ‘at risk’ to preserve the Directors’ independence and impartiality.
Directors are encouraged to hold securities in the Group to create alignment between the interests of Directors and shareholders.
The Board will continue to review its approach to Non-Executive Director remuneration
to ensure it remains market competitive and in line with high standards of
corporate governance.
5.1 COMPONENTS AND DETAILS OF NON-EXECUTIVE DIRECTOR REMUNERATION
Non-Executive Directors’ fees (including committee fees) are set by the Board within
the maximum aggregate amount of A$700,000 approved by shareholders at this time.
The executive directors, including the Executive Chairman, are not entitled to be paid
Directors’ fees.
Given the growth and increase in complexity of the business, annual Non-Executive
Directors’ fees were benchmarked by independent consultants during the Reporting
Period. Benchmarking was undertaken against similar industries as well as across
companies with a similar market capitalisation. Based on this benchmarking analysis, it
was agreed to increase the base fees per annum for each Non-Executive Director from
$60,000 to $85,000 per annum with effect from 1 January 2018 reflecting the increase in
Group market capitalisation from $627m at 30 June 2017 to $1.3b at 1 January 2018. The
Chairman and members of each Committee receive an additional fee. These fees are set
out in the table below.
28
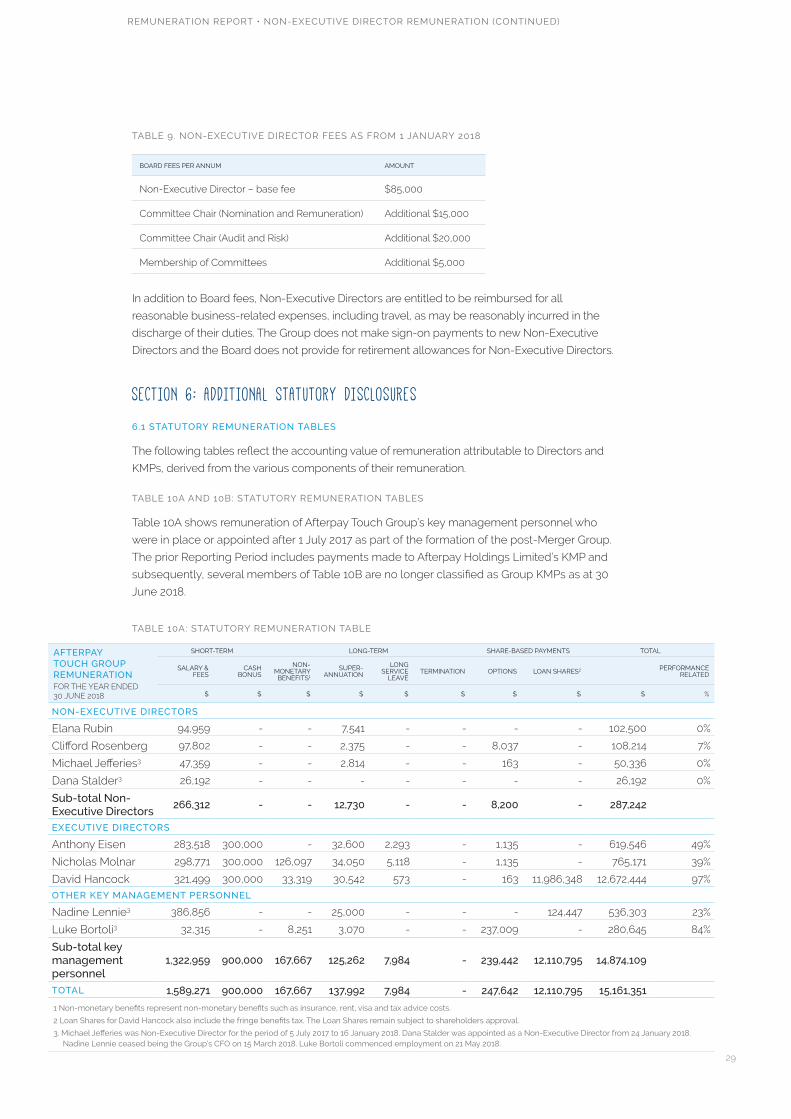
REMUNERATION REPORT • NON-EXECUTIVE DIRECTOR REMUNERATION (CONTINUED)
TABLE 9. NON-EXECUTIVE DIRECTOR FEES AS FROM 1 JANUARY 2018
BOARD FEES PER ANNUM AMOUNT
Non-Executive Director – base fee $85,000
Committee Chair (Nomination and Remuneration) Additional $15,000
Committee Chair (Audit and Risk) Additional $20,000
Membership of Committees Additional $5,000
In addition to Board fees, Non-Executive Directors are entitled to be reimbursed for all
reasonable business-related expenses, including travel, as may be reasonably incurred in the
discharge of their duties. The Group does not make sign-on payments to new Non-Executive
Directors and the Board does not provide for retirement allowances for Non-Executive Directors.
SECTION 6: ADDITIONAL STATUTORY DISCLOSURES
6.1 STATUTORY REMUNERATION TABLES
The following tables reflect the accounting value of remuneration attributable to Directors and
KMPs, derived from the various components of their remuneration.
TABLE 10A AND 10B: STATUTORY REMUNERATION TABLES
Table 10A shows remuneration of Afterpay Touch Group’s key management personnel who
were in place or appointed after 1 July 2017 as part of the formation of the post-Merger Group.
The prior Reporting Period includes payments made to Afterpay Holdings Limited’s KMP and
subsequently, several members of Table 10B are no longer classified as Group KMPs as at 30
June 2018.
TABLE 10A: STATUTORY REMUNERATION TABLE
AFTERPAY TOUCH GROUP REMUNERATIONFOR THE YEAR ENDED 30 JUNE 2018
SHORT-TERM LONG-TERM SHARE-BASED PAYMENTS TOTAL
SALARY & FEES
CASH BONUS
NON-MONETARY
BENEFITS1
SUPER-ANNUATION
LONG SERVICE
LEAVETERMINATION OPTIONS LOAN SHARES2 PERFORMANCE
RELATED
$ $ $ $ $ $ $ $ $ %
NON-EXECUTIVE DIRECTORS
Elana Rubin 94,959 - - 7,541 - - - - 102,500 0%
Clifford Rosenberg 97,802 - - 2,375 - - 8,037 - 108,214 7%
Michael Jefferies3 47,359 - - 2,814 - - 163 - 50,336 0%
Dana Stalder3 26,192 - - - - - - - 26,192 0%
Sub-total Non-Executive Directors
266,312 - - 12,730 - - 8,200 - 287,242
EXECUTIVE DIRECTORS
Anthony Eisen 283,518 300,000 - 32,600 2,293 - 1,135 - 619,546 49%
Nicholas Molnar 298,771 300,000 126,097 34,050 5,118 - 1,135 - 765,171 39%
David Hancock 321,499 300,000 33,319 30,542 573 - 163 11,986,348 12,672,444 97%
OTHER KEY MANAGEMENT PERSONNEL
Nadine Lennie3 386,856 - - 25,000 - - - 124,447 536,303 23%
Luke Bortoli3 32,315 - 8,251 3,070 - - 237,009 - 280,645 84%
Sub-total key management personnel
1,322,959 900,000 167,667 125,262 7,984 - 239,442 12,110,795 14,874,109
TOTAL 1,589,271 900,000 167,667 137,992 7,984 - 247,642 12,110,795 15,161,351
1 Non-monetary benefits represent non-monetary benefits such as insurance, rent, visa and tax advice costs.
2 Loan Shares for David Hancock also include the fringe benefits tax. The Loan Shares remain subject to shareholders approval.
3. Michael Jefferies was Non-Executive Director for the period of 5 July 2017 to 16 January 2018. Dana Stalder was appointed as a Non-Executive Director from 24 January 2018. Nadine Lennie ceased being the Group’s CFO on 15 March 2018. Luke Bortoli commenced employment on 21 May 2018.
29

REMUNERATION REPORT • ADDITIONAL STATUTORY DISCLOSURES (CONTINUED)
The Group announced on 30 August 2017 that it intended to offer David Hancock 2m loan
funded shares (‘Loan Shares’) as part of the LTI component of his remuneration package. This
grant reflected David Hancock joining the Group in the newly created role of Group Head
at a moderate fixed remuneration and potential STI opportunity relative to ASX listed peers
in favour of higher long-term at-risk performance incentives that aligns David Hancock with
shareholders. The grant of Loan Shares remains subject to shareholder approval.
This structure means that the majority of David Hancock’s $12.7m total remuneration
relates to the proposed one-off LTI grant. The proposed issue price of the Loan Shares
will be the volume weighted average price of the shares on the ASX for the 5 trading days
up to and including the grant date which will be a date as soon as practicable following
shareholder approval.
Assuming shareholder approval is received, a loan will be issued to David Hancock for the
total value of the Loan Shares. The first tranche of the proposed one-off LTI grant of Loan
Shares will vest on 1 September 2018 (or the date shareholder approval is received if this
occurs after this date) and the second tranche will vest on 1 September 2019, subject to
David Hancock remaining an employee on the relevant vesting date or ceasing employment
as a ‘good leaver’ as determined by the Board.
The loan or a proportion thereof, will become payable upon the earlier of David Hancock
disposing of any vested Loan Shares or the expiry of the loan on 1 September 2022. The
loan may become payable earlier under certain circumstances including if David Hancock
ceases to be an employee of the Group. Upon expiry or sale of the Loan Shares, part of the
loan balance may be waived if David Hancock satisfies certain conditions. The proportion of
the loan balance that may be waived will be the tax adjusted difference per share between
the issue price of the loan shares and $2.70. This arrangement provides for an effective
purchase price of the Loan Shares of $2.70 plus the capital gains tax that would otherwise be
payable on the difference between the issue price and $2.70 by the Group Head. The $2.70
figure represents the share price upon formation of the Group at the Merger and reflects
the intention to implement the LTI as if it had been in place from the date David Hancock
assumed the substantive responsibilities of Group Head.
AFTERPAY GROUP REMUNERATIONFOR THE YEAR ENDED 30 JUNE 2017
SHORT-TERM LONG-TERM SHARE-BASED PAYMENTS TOTAL
SALARY & FEES
CASH BONUS
SUPER-ANNUATION
LONG SERVICE
LEAVETERMINATION OPTIONS PERFORMANCE
RIGHTSPERFORMANCE
RELATED
$ $ $ $ $ $ $ $ %
NON-EXECUTIVE DIRECTORS
Michael Jefferies 52,500 - 4,987 - - 417 - 57,904 0%
David Hancock 75,000 - 7,125 - - 417 - 82,542 0%
Clifford Rosenberg 75,000 - 7,125 - - 27,651 - 109,776 0%
Sub-total Non-Executive Directors
202,500 - 19,237 - - 28,485 - 250,222
EXECUTIVE DIRECTORS
Anthony Eisen 221,283 75,000 26,646 1,396 - 3,023 - 327,347 23%
Nicholas Molnar 268,269 75,000 30,875 1,698 - 3,023 - 378,865 20%
OTHER KEY MANAGEMENT PERSONNEL
Richard Harris 213,351 100,000 28,500 1,359 - 163,401 - 506,611 18%
David Whiteman 209,810 - 20,084 1,359 - 48,831 - 280,084 0%
Fabio de Carvalho 211,275 83,584 26,940 1,359 - 19,775 - 342,933 22%
Barry Odes1 163,525 79,178 22,571 348 - 343,454 77,357 686,433 28%
Matthew Walton1 156,322 30,000 17,065 356 93,750 356,176 72,362 726,031 14%
Sub-total Executive Directors
1,443,835 442,762 172,681 7,875 93,750 937,683 149,719 3,248,304
TOTAL 1,646,335 442,762 191,918 7,875 93,750 966,168 149,719 3,498,526
1. Does not represent full year. Barry Odes started on 15 September 2016 and Matthew Walton started on 10 October 2016.
TABLE 10B: STATUTORY REMUNERATION TABLES
30

REMUNERATION REPORT • ADDITIONAL STATUTORY DISCLOSURES (CONTINUED)
The Group’s share price increased 246% from 29 June 2017 (the first date the Group’s
shares were quoted after the Merger) to 30 June 2018. On this basis, the value of the
proposed one-off LTI grant of loan shares has increased in line with the significant
increase in APTs share price since the Merger. The valuation of the proposed one-off
LTI grant of loan shares will continue to change with the Group’s share price until such
time as the proposed LTI grant is approved by shareholders with the issue price of the
shares and the grant date then fixed. The proposed one-off LTI grant of loan shares is
recognised in the profit and loss statement as a share-based payments expense but is
a non-cash charge. There is an accrual for fringe benefits tax associated with the loan
arrangement in the share-based payments expense as a result of the tax consequences
of potentially waiving the loan balance if certain conditions are satisfied.
6.2 MOVEMENTS IN SECURITIES
The number of shares in the Group held during the Reporting Period by each member of
KMP, including their related parties, are set out below.
TABLE 11. MOVEMENTS IN SHAREHOLDINGS NOT HELD UNDER AN EMPLOYEE SHARE PLAN
OPENING BALANCE 1-JUL-17
PURCHASE OF SHARES
SALES OF SHARES
OTHER CHANGES DURING THE
YEAR
BALANCE 30-JUN-18
NON-EXECUTIVE DIRECTORS
Elana Rubin 46,567 10,000 - - 56,567
Clifford Rosenberg 1,000,000 - (200,000) - 800,000
Dana Stalder - - - - -
EXECUTIVES
Anthony Eisen 25,000,000 - (2,500,000) - 22,500,000
Nicholas Molnar 25,000,000 - (2,500,000) - 22,500,000
David Hancock 2,400,000 - (500,000) - 1,900,000
OTHER KEY MANAGEMENT PERSONNEL
Nadine Lennie - - - 128,000 128,000
Luke Bortoli - - - - -
TOTAL 53,446,567 10,000 (5,700,000) 128,000 47,884,567
The table below discloses the number of share options and loan shares granted, vested or
lapsed during the year. KMPs have been granted options that vest over a number of years
as detailed in Section 3.3. The Board makes an assessment of each KMP’s performance
in line with the criteria in Section 3.3 at each vesting date and will only allow the options
to vest if it determines that the KMP has met or exceeded his or her individual KPIs.
Additionally, the value of the options is intrinsically linked with the Group’s share price
performance. Options may vest at zero realisable value where the Group’s share price is
below the exercise price of the options. Share options and loan shares do not carry any
voting or dividend rights and can only be exercised once the vesting conditions have been
met, until their expiry.
31

REMUNERATION REPORT • ADDITIONAL STATUTORY DISCLOSURES (CONTINUED)
TABLE 12: OPTIONS AND LOAN SHARES HELD UNDER AN EMPLOYEE SHARE PLAN
As the loan provided by the Group to David Hancock to fund the purchase of the shares is
limited recourse, the Group classifies the loan shares as “in substance options” under the
Australian Accounting Standards. The figures in Table 12 have been prepared accordingly.
TABLE 13: MOVEMENTS IN OPTIONS AND LOAN SHARES HELD UNDER AN EMPLOYEE SHARE PLAN
NAME1 INSTRUMENT HELD AT 1 JULY 2017
GRANTED EXERCISED LAPSED/FORFEITED
HELD AT 30 JUNE 2018
Anthony Eisen Options 1,500,000 - - - 1,500,000
Nicholas Molnar Options 1,500,000 - - - 1,500,000
David Hancock2 Options 200,000 - - - 200,000
Loan Shares - 2,000,000 - - 2,000,000
Clifford Rosenberg
Options 900,000 - - - 900,000
Nadine Lennie Loan Shares 128,000 - 128,000 - -
Luke Bortoli Options - 1,350,000 - - 1,350,000
1. All options and loan shares are held directly by KMP.
2. David Hancock’s one-off loan shares to be granted subject to approval from shareholders. Although such approval has not yet been received, these loan shares have been included for accounting purposes for the time that the Group Head was employed in that capacity.
3. Options that vested in the year are disclosed in Table 12. While no KMP options were exercised during the year, no options that vested during the year were unexercisable.
NAMEFINANCIAL
YEAR
OPTIONS AWARDED
DURING THE REPORTING
PERIOD
LOAN SHARES AWARDED
DURING THE REPORTING
PERIODAWARD
DATE
FAIR VALUE PER
OPTION AT AWARD
DATE 4 $
VESTING DATE 5
EXERCISE PRICE 6
$EXPIRY DATE 7
NUMBER VESTED DURING
THE REPORTING
PERIOD
NUMBER LAPSED DURING
THE REPORTING
PERIOD
VALUE OF OPTIONS
GRANTED DURING THE REPORTING
PERIOD $
VALUE OF LOAN SHARES
RECORDED DURING THE REPORTING
PERIOD $
VALUE OF LOAN SHARES
EXERCISED DURING
THE REPORTING
PERIOD 8 $
Anthony Eisen
2018 - - - - - - -
500,000 - - - -
Nicholas Molnar
2018 - - - - - - -
500,000 - - - -
David Hancock1 2018 - 2,000,000 23/8/17 5.93 1/9/18 4.26 1/9/22 66,667 - - 11,986,348 -
Nadine Lennie2 2018 - - - - - - - 128,000 - - - 628,480
Luke Bortoli3
2018 1,350,000 - 1/6/18 3.45 1/6/19 5.00 31/12/22 - - 4,657,500 - -
1. David Hancock’s one-off loan shares to be granted subject to approval from shareholders. Although such approval has not yet been received, these loan shares have been included for accounting purposes for the time that the Group Head was employed in that capacity. Half of David Hancock’s loan shares will vest on 1 September 2018 and the remainder will vest on 1 September 2019.
2. Nadine Lennie’s loan shares were granted on 19 April 2017 with an exercise price $2.22 and were fully vested on 31 December 2017.
3. One third of Luke Bortoli’s options will vest at 1 June 2019, 1 June 2020 and 1 June 2021, respectively.
4. The fair value of options and loan shares are calculated using the Binomial Model. David Hancock’s Loan Shares are fair valued as at 30 June 2018.
5. Vesting date is the earliest date the vested options can be exercised.
6. The calculation of exercise prices and fair values for loan shares and options is discussed in further detail in Note 13. Note in particular that under AASB 2 Share-based payments, the Loan Shares are treated as “in substance options”.
7. The expiry date of loan shares refers to the date upon which the loan must be repaid. Loans may be repayable earlier upon certain conditions being satisfied such as the employee ceasing their employment. A portion of the repayment requirement may be waived as discussed in Section 6.1.
8. The value at exercise date has been determined by the share price at the close of business on exercise date less the Loan Share exercise price, multiplied by the number of Loan Shares exercised during 2018.
32
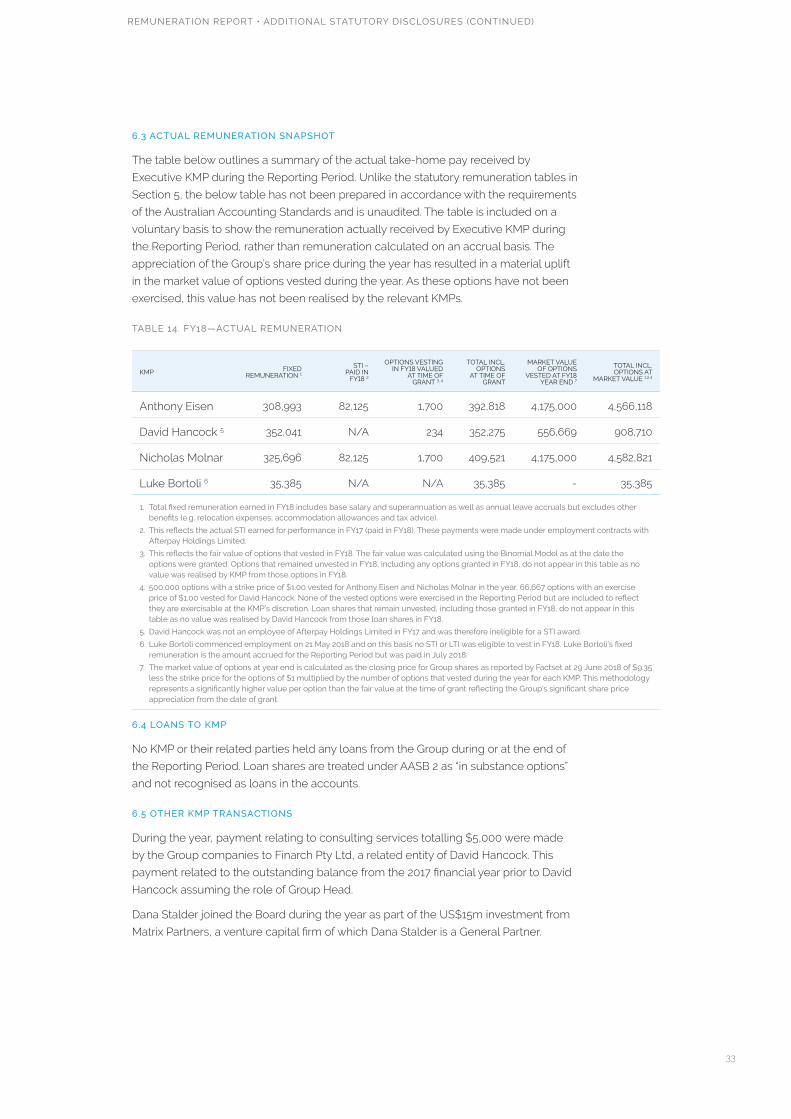
REMUNERATION REPORT • ADDITIONAL STATUTORY DISCLOSURES (CONTINUED)
6.3 ACTUAL REMUNERATION SNAPSHOT
The table below outlines a summary of the actual take-home pay received by
Executive KMP during the Reporting Period. Unlike the statutory remuneration tables in
Section 5, the below table has not been prepared in accordance with the requirements
of the Australian Accounting Standards and is unaudited. The table is included on a
voluntary basis to show the remuneration actually received by Executive KMP during
the Reporting Period, rather than remuneration calculated on an accrual basis. The
appreciation of the Group’s share price during the year has resulted in a material uplift
in the market value of options vested during the year. As these options have not been
exercised, this value has not been realised by the relevant KMPs.
TABLE 14. FY18—ACTUAL REMUNERATION
KMP FIXED REMUNERATION 1
STI – PAID IN
FY18 2
OPTIONS VESTING IN FY18 VALUED
AT TIME OF GRANT 3, 4
TOTAL INCL. OPTIONS
AT TIME OF GRANT
MARKET VALUE OF OPTIONS
VESTED AT FY18 YEAR END 7
TOTAL INCL. OPTIONS AT
MARKET VALUE 1,2,4
Anthony Eisen 308,993 82,125 1,700 392,818 4,175,000 4,566,118
David Hancock 5 352,041 N/A 234 352,275 556,669 908,710
Nicholas Molnar 325,696 82,125 1,700 409,521 4,175,000 4,582,821
Luke Bortoli 6 35,385 N/A N/A 35,385 - 35,385
1. Total fixed remuneration earned in FY18 includes base salary and superannuation as well as annual leave accruals but excludes other benefits (e.g. relocation expenses, accommodation allowances and tax advice).
2. This reflects the actual STI earned for performance in FY17 (paid in FY18). These payments were made under employment contracts with Afterpay Holdings Limited.
3. This reflects the fair value of options that vested in FY18. The fair value was calculated using the Binomial Model as at the date the options were granted. Options that remained unvested in FY18, including any options granted in FY18, do not appear in this table as no value was realised by KMP from those options in FY18.
4. 500,000 options with a strike price of $1.00 vested for Anthony Eisen and Nicholas Molnar in the year. 66,667 options with an exercise price of $1.00 vested for David Hancock. None of the vested options were exercised in the Reporting Period but are included to reflect they are exercisable at the KMP’s discretion. Loan shares that remain unvested, including those granted in FY18, do not appear in this table as no value was realised by David Hancock from those loan shares in FY18.
5. David Hancock was not an employee of Afterpay Holdings Limited in FY17 and was therefore ineligible for a STI award.
6. Luke Bortoli commenced employment on 21 May 2018 and on this basis no STI or LTI was eligible to vest in FY18. Luke Bortoli’s fixed remuneration is the amount accrued for the Reporting Period but was paid in July 2018.
7. The market value of options at year end is calculated as the closing price for Group shares as reported by Factset at 29 June 2018 of $9.35 less the strike price for the options of $1 multiplied by the number of options that vested during the year for each KMP. This methodology represents a significantly higher value per option than the fair value at the time of grant reflecting the Group’s significant share price appreciation from the date of grant.
6.4 LOANS TO KMP
No KMP or their related parties held any loans from the Group during or at the end of
the Reporting Period. Loan shares are treated under AASB 2 as “in substance options”
and not recognised as loans in the accounts.
6.5 OTHER KMP TRANSACTIONS
During the year, payment relating to consulting services totalling $5,000 were made
by the Group companies to Finarch Pty Ltd, a related entity of David Hancock. This
payment related to the outstanding balance from the 2017 financial year prior to David
Hancock assuming the role of Group Head.
Dana Stalder joined the Board during the year as part of the US$15m investment from
Matrix Partners, a venture capital firm of which Dana Stalder is a General Partner.
33

DIRECTORS’ REPORT (CONTINUED)
INSURANCE OF DIRECTORS AND OFFICERSDuring the year the Group paid a premium for a
Directors and Officers Liability Insurance Policy.
This policy covers Directors and Officers of the
Group and the consolidated entity. In accordance
with normal commercial practices under the
terms of the insurance contracts, the nature of
the liabilities insured against and the amount of
the premiums are prohibited by the policy.
PROCEEDINGS ON BEHALF OF THE GROUPNo person has sought to bring proceedings on
behalf of the Group, and the Group is not a party
to any proceedings, for the purpose of taking
responsibility on behalf of the Group for any
such proceedings, or for a particular step in any
such proceedings.
NON-AUDIT SERVICESThe Company may decide to employ the auditor
on assignments additional to their statutory
audit duties where the auditor’s expertise
and experience with the Group and/or the
consolidated entity are important.
The Board of Directors has considered the
position and, in accordance with the advice
received from the Audit Committee is satisfied
that the provision of the non-audit services
is compatible with the general standard of
independence for auditors imposed by the
Corporations Act 2001. The Directors are satisfied
that the provision of non-audit services by the
auditor, as set out below, did not compromise
the auditor independence requirements of the
Corporations Act 2001 for the following reasons:
• all non-audit services have been reviewed by the
Audit Committee to ensure they do not impact
the impartiality and objectivity of the auditor; and
• none of the services undermine the general
principles relating to auditor independence as set
out in APES 110 Code of Ethics for Professional
Accountants, including reviewing or auditing
the auditor’s own work, acting in a management
or a decision-making capacity for the Group,
acting as advocate for the Group or jointly sharing
economic risk and rewards.
Details of the audit and non-audit fees paid or
payable for services provided by the auditor of
the parent entity, and its related practices, are
detailed in Note 21.
INDEMNIFICATION OF AUDITORSTo the extent permitted by law, the Group has agreed
to indemnify its auditors, Ernst & Young, as part of the
terms of its audit engagement agreement against claims
by third parties arising from the audit (for an unspecified
amount). No payment has been made to indemnify
Ernst & Young during or since the financial year.
CORPORATE GOVERNANCEIn recognising the need for the highest standards of
corporate behaviour and accountability, the Directors
of Afterpay Touch Group Limited support and have
substantially adhered to the principles of corporate
governance.
The Board monitors the operational and financial
position and performance of Afterpay Touch Group
Limited and oversees its business strategy, including
approving the strategic goals of the Group and
considering and approving its annual business plan
and associated budget. The Board is committed to
generating appropriate level of shareholder value and
financial return and achieving the growth and success of
the Group. In conducting the Group’s business with these
objectives, the Board seeks to ensure that the Group is
properly managed to protect and enhance shareholder
interests and that the Group, its Directors, officers and
personnel operate in an appropriate environment of
corporate governance. Accordingly, the Board has
adopted a framework of corporate governance including
risk management practices and internal controls
that it believes appropriate for the Group’s business.
Details of the Group’s key policies and the charters for
the Board and each of its committees is available at
www.afterpaytouchgroup.com.
ROUNDINGThe amounts contained in this report and in the financial
report have been rounded to the nearest $1,000 (unless
otherwise stated) under the option available to the
Group under ASIC Corporations (Rounding in Financial/
Director’s Reports) Instruments 2016/191. The Group is
an entity to which the legislative instrument applies.
Signed in accordance with a resolution of the Directors.
Anthony Eisen
Executive Chairman Melbourne 23 August 201834

AUDITOR’S INDEPENDENCE DECLARATION
A member firm of Ernst & Young Global Limited Liability limited by a scheme approved under Professional Standards Legislation
Auditor’s Independence Declaration to the Directors of Afterpay Touch Group Limited As lead auditor for the audit of Afterpay Touch Group Limited for the financial year ended 30 June 2018, I declare to the best of my knowledge and belief, there have been:
a) no contraventions of the auditor independence requirements of the Corporations Act 2001 in relation to the audit; and
b) no contraventions of any applicable code of professional conduct in relation to the audit. This declaration is in respect of Afterpay Touch Group Limited and the entities it controlled during the financial year.
Ernst & Young
David McGregor Partner 23 August 2018
8 Exhibition Street Melbourne VIC 3000 Australia GPO Box 67 Melbourne VIC 3001
Tel: +61 3 9288 8000 Fax: +61 3 8650 7777 ey.com/au
AUDITOR’S INDEPENDENCE DECLARATION
35

AFTERPAYTOUCH FY18 ANNUAL REPORT • FINANCIAL STATEMENTS
Market and industry support of the Afterpay product continues to grow and the Group was awarded “Fintech organisation of the year” for the second consecutive year
36

AFTERPAYTOUCH FY18 ANNUAL REPORT • FINANCIAL STATEMENTS
AFTERPAY TOUCH GROUP FINANCIAL STATEMENTS
37

AFTERPAYTOUCH FY18 ANNUAL REPORT • FINANCIAL STATEMENTS
FOR THE YEAR ENDED 30 JUNE 2018 CONSOLIDATED AFTERPAY1
2018 2017
NOTE $’000 $’000
Revenue from ordinary activities 113,899 22,906
Revenue 113,899 22,906
Cost of sales (28,210) (5,263)
Gross profit 85,689 17,643
Other income 28,446 6,120
Total other income 28,446 6,120
Depreciation and amortisation expense 5 (17,329) (2,708)
Employment expenses 5 (38,619) (6,570)
Receivables impairment expense 9 (32,610) (8,158)
Operating expenses 5 (27,077) (20,319)
Operating loss (1,500) (13,992)
Finance income 531 347
Finance cost (6,617) (778)
Loss before tax (7,586) (14,423)
Income tax (expense)/benefit 6 (1,390) 4,803
Loss for the year (8,976) (9,620)
Other comprehensive loss
Other comprehensive loss to be reclassified to profit or loss in subsequent periods (net of tax)
Exchange differences on translation of foreign operations (45) -
Other comprehensive loss (45) -
Total comprehensive loss for the year, net of tax (9,021) (9,620)
Loss per share 15
Basic, loss for the year attributable to ordinary equity holders of the Parent ($0.04) ($0.05)
Diluted, loss for the year attributable to ordinary equity holders of the Parent ($0.04) ($0.05)
1. Due to the proximity of the Merger to 30 June 2017, the comprehensive income only related to Afterpay Group.
CONSOLIDATED STATEMENT OF COMPREHENSIVE INCOME
The above consolidated statement of comprehensive income should be read in conjunction with the accompanying notes.38

AFTERPAYTOUCH FY18 ANNUAL REPORT • FINANCIAL STATEMENTS
AT 30 JUNE 2018 CONSOLIDATED CONSOLIDATED RESTATED1
2018 2017
NOTE $’000 $’000
Assets
Current assets
Cash and cash equivalents 7 25,457 29,602
Other financial asset 8 23,741 8,893
Receivables 9 239,068 98,385
Other current assets 17,320 11,937
Total current assets 305,586 148,817
Non-current assets
Property, plant and equipment 10 4,008 4,460
Intangible assets 10 72,495 76,509
Deferred tax assets 6(d) 9,261 9,066
Other non-current assets 875 1,475
Total non-current assets 86,639 91,510
Total assets 392,225 240,327
Liabilities
Current liabilities
Trade and other payables 42,916 22,836
Onerous contract provision 5 - 6,153
Employee benefit provision 1,793 1,426
Unearned income 252 142
Interest bearing borrowings 11 50 -
Income tax payable 1,582 1,065
Total current liabilities 46,593 31,622
Non-current liabilities
Employee benefit provision 157 140
Onerous contract provision 5 - 1,538
Office lease provision 365 196
Interest bearing borrowings 11 161,555 46,748
Total non-current liabilities 162,077 48,622
Total liabilities 208,670 80,244
Net assets 183,555 160,083
Equity
Issued capital 16(a) 192,628 171,411
Accumulated losses (22,195) (13,219)
Reserves 13,122 1,891
Total equity 183,555 160,083
1. Certain amounts shown here do not correspond to the 2017 financial statements and reflect adjustments made, refer to Note 4.
CONSOLIDATED STATEMENT OF FINANCIAL POSITION
The above consolidated statement of financial position should be read in conjunction with the accompanying notes. 39
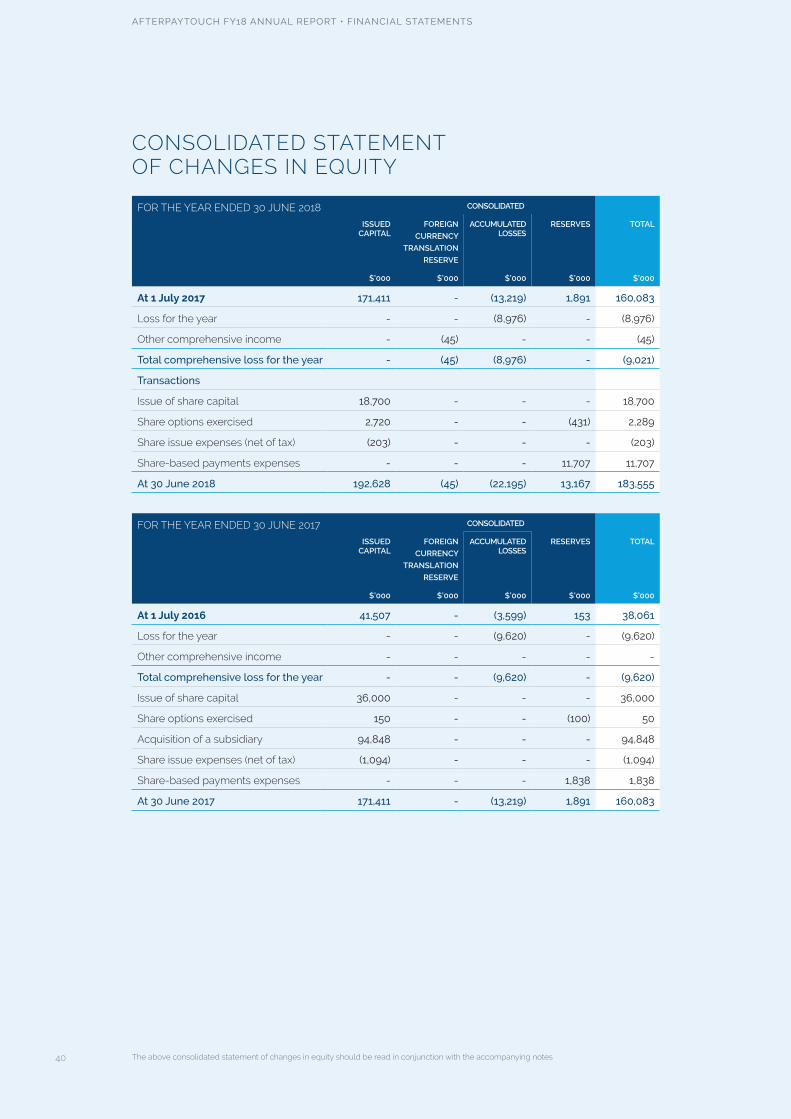
AFTERPAYTOUCH FY18 ANNUAL REPORT • FINANCIAL STATEMENTS
FOR THE YEAR ENDED 30 JUNE 2018 CONSOLIDATED
ISSUED CAPITAL
FOREIGN
CURRENCY
TRANSLATION
RESERVE
ACCUMULATED LOSSES
RESERVES TOTAL
$’000 $’000 $’000 $’000 $’000
At 1 July 2017 171,411 - (13,219) 1,891 160,083
Loss for the year - - (8,976) - (8,976)
Other comprehensive income - (45) - - (45)
Total comprehensive loss for the year - (45) (8,976) - (9,021)
Transactions
Issue of share capital 18,700 - - - 18,700
Share options exercised 2,720 - - (431) 2,289
Share issue expenses (net of tax) (203) - - - (203)
Share-based payments expenses - - - 11,707 11,707
At 30 June 2018 192,628 (45) (22,195) 13,167 183,555
FOR THE YEAR ENDED 30 JUNE 2017 CONSOLIDATED
ISSUED CAPITAL
FOREIGN
CURRENCY
TRANSLATION
RESERVE
ACCUMULATED LOSSES
RESERVES TOTAL
$’000 $’000 $’000 $’000 $’000
At 1 July 2016 41,507 - (3,599) 153 38,061
Loss for the year - - (9,620) - (9,620)
Other comprehensive income - - - - -
Total comprehensive loss for the year - - (9,620) - (9,620)
Issue of share capital 36,000 - - - 36,000
Share options exercised 150 - - (100) 50
Acquisition of a subsidiary 94,848 - - - 94,848
Share issue expenses (net of tax) (1,094) - - - (1,094)
Share-based payments expenses - - - 1,838 1,838
At 30 June 2017 171,411 - (13,219) 1,891 160,083
CONSOLIDATED STATEMENT OF CHANGES IN EQUITY
The above consolidated statement of changes in equity should be read in conjunction with the accompanying notes40

AFTERPAYTOUCH FY18 ANNUAL REPORT • FINANCIAL STATEMENTS
FOR THE YEAR ENDED 30 JUNE 2018 CONSOLIDATED AFTERPAY
2018 2017
NOTE $’000 $’000
Cash flows from operating activities
Receipts from customers (inclusive of GST) 2,201,510 440,879
Payments to employees (inclusive of on-costs) (17,853) (3,669)
Payments to merchants and suppliers (inclusive of GST) (2,287,985) (516,077)
Income tax paid (1,004) -
Net cash flows used in operating activities 7 (105,332) (78,867)
Cash flows from investing activities
Interest received 524 433
Increase in term deposit (2,165) (100)
Acquisition of a subsidiary, net of cash acquired - 17,169
Payments for recognised intangible assets (10,509) -
Purchase of intangibles (990) (452)
Purchase of plant, property and equipment (1,082) (78)
Net cash flows (used in)/from investing activities (14,222) 16,972
Cash flows from financing activities
Proceeds from borrowings 49,815 37,855
Proceeds from exercise of share options 2,276 50
Proceeds from issue of shares 18,700 36,000
Capital raising and Bonds issuance expenses (1,100) (1,588)
Interest and bank fees paid (5,909) (543)
Proceeds from Bonds issuance 50,000 -
Net cash flows from financing activities 113,782 71,774
Net increase in cash and cash equivalents (5,772) 9,879
FX on cash balance 1,627 -
Cash and cash equivalents at beginning of the year 29,602 19,723
Cash and cash equivalents at end of the year 25,457 29,602
CONSOLIDATED STATEMENT OF CASH FLOWS
The above consolidated statement of cash flows should be read in conjunction with the accompanying notes 41

CONTENTS1. BASIS OF PREPARATION 43
2. SEGMENT INFORMATION 44
3. SIGNIFICANT ACCOUNTING POLICIES – REVENUE 44
4. BUSINESS COMBINATIONS 45
5. EXPENSES 46
6. INCOME TAX 47
7. CASH AND CASH EQUIVALENTS 49
8. OTHER FINANCIAL ASSET 49
9. RECEIVABLES 50
10. PROPERTY, PLANT AND EQUIPMENT AND INTANGIBLE ASSETS 51
11. INTEREST BEARING BORROWINGS 54
12. FINANCIAL RISK MANAGEMENT OBJECTIVES AND POLICIES 54
13. SHARE-BASED PAYMENTS PLANS 57
14. KEY MANAGEMENT PERSONNEL 58
15. EARNINGS PER SHARE (EPS) 58
16. CONTRIBUTED EQUITY AND RESERVES 59
17. RELATED PARTY DISCLOSURE 59
18. INFORMATION RELATING TO AFTERPAY TOUCH GROUP LIMITED 60
19. DEED OF CROSS GUARANTEE 60
20. COMMITMENTS AND CONTINGENCIES 61
21. AUDITOR’S REMUNERATION 61
22. EVENTS AFTER THE BALANCE SHEET DATE 61
23. OTHER SIGNIFICANT ACCOUNTING POLICIES 62
42

NOTES TO THE FINANCIAL STATEMENTS
NOTES TO THE FINANCIAL STATEMENTS
1. BASIS OF PREPARATION
CORPORATE INFORMATION
The consolidated financial statements of
Afterpay Touch Group Limited for the year
ended 30 June 2018 were authorised for issue in
accordance with a resolution of the Directors on
23 August 2018.
The securities of Afterpay Touch Group Limited
(the Company) are listed on the Australian
Securities Exchange (ASX). The activities
of Afterpay Touch Group Limited and its
subsidiaries (the Group) are described in the
Directors’ Report. The Group’s principal place
of business is 406 Collins Street, Melbourne
Victoria, Australia.
The Company was incorporated on 30 March
2017 as a for-profit company and domiciled
in Australia. On 19 June 2017, the Company
completed the acquisition of Afterpay and
Touchcorp which resulted in the Company
becoming the ultimate parent of Afterpay
Holdings Limited and Touchcorp Limited.
The Company was incorporated as a special-
purpose company to make an offer to acquire all
of the shares of Afterpay and Touchcorp.
The Company’s consolidated financial
statements for the period ended 30 June 2017
are presented as the continuation of Afterpay
financial statements and the acquisition of
Touchcorp as at 30 June 2017.
BASIS OF ACCOUNTING
The financial report is a general purpose financial
report, which has been prepared in accordance
with Australian Accounting Standards and other
authoritative pronouncements of the Australian
Accounting Standards Board. The financial report
has been prepared on a historical cost basis and
is presented in Australian dollars and all values
are rounded to the nearest thousand ($’000),
except when otherwise indicated.
A. COMPLIANCE WITH IFRS
The financial report complies with Australian
Accounting Standards and International Financial
Reporting Standards (IFRS), as issued by the
International Accounting Standards Board.
B. COMPARATIVES
Certain amounts in the comparative information
have been restated to conform with current
period financial statement presentation.
C. FUNCTIONAL CURRENCY
The consolidated financial statements are
presented in Australian Dollars, which is the
functional currency of the parent entity. Entities in
the Group may have other functional currencies,
reflecting the currency of the primary economic
environment in which the relevant entity operates.
If an entity in the Group has undertaken
transactions in foreign currency, these transactions
are translated into that entity’s functional currency
using the exchange rates prevailing at the dates of
the transactions. Where the functional currency of a
subsidiary is not Australian dollars, the subsidiary’s
assets and liabilities are translated on consolidation
to Australian dollars using the exchange rates
prevailing at the reporting date, and its profit and
loss is translated at average exchange rates. All
resulting exchange differences are recognised in
other comprehensive income and in the foreign
currency translation reserve in equity.
D. BASIS OF CONSOLIDATION
The consolidated financial information comprises
the financial information of the Group and its
subsidiaries as at 30 June 2018. The Group has
control of its subsidiaries when it is exposed to,
and has the rights to, variable returns from its
involvement with those entities and when it has
the ability to affect those returns. A list of significant
controlled entities (subsidiaries) at year-end is
contained in Note 17.
A change in the ownership interest of a subsidiary,
without a loss of control, is accounted for as an
equity transaction. If the Group loses control over
a subsidiary, it derecognises the related assets
(including goodwill), liabilities, non-controlling
interest and other components of equity while any
resultant gain or loss is recognised in profit or loss.
Any investment retained is recognised at fair value.
E. SIGNIFICANT ACCOUNTING JUDGEMENTS, ESTIMATES AND ASSUMPTIONS
Management has identified a number of accounting
policies for which significant judgements, estimates
and assumptions are made. Actual results may
differ from these estimates under different
assumptions and conditions and may materially
affect financial results or the financial position
reported in future periods. Further details of these
assumptions may be found in the relevant notes to
the financial statements.
43

NOTES TO THE FINANCIAL STATEMENTS (CONTINUED)
2. SEGMENT INFORMATIONThe Group determines and presents operating
segments based on the information that is
provided internally to review and support
decision making within the business.
The business operates under two key
business lines:
• Pay Later which comprises Afterpay Australia,
New Zealand and the United States.
• Pay Now which comprises Mobility and
Payments, Health and Retail Services.
Services provided between operating segments
are on arm’s length basis.
While the Group has operations in New Zealand,
Europe and the United States, the business
segments operate principally in Australia.
3. SIGNIFICANT ACCOUNTING POLICIES – REVENUE
REVENUE RECOGNITION
Revenue is recognised and measured at the fair
value of the consideration received or receivable
to the extent that is probable that the economic
benefits will flow to the Group and the revenue
can be reliably measured. The following specific
recognition criteria must also be met before
revenue is recognised.
RENDERING OF SERVICES – PAY LATER
The Group facilitates the sales of products and
services by merchants to end-customers by
allowing end-customers to buy now and pay
later without having to take out a traditional
loan or paying any interest and fees. Afterpay
pays merchants upfront and assumes all
non-payment risk. For this, the merchant pays
Afterpay a fee with revenue recognised for
the service upon end-customers’ acceptance
through the Afterpay System.
SEGMENT INFORMATION PAY LATER PAY NOW CORPORATE TOTAL
$’000 $’000 $’000 $’000
Revenue from ordinary activities 88,328 25,571 - 113,899
Cost of sales (17,636) (10,574) - (28,210)
Gross profit 70,692 14,997 - 85,689
Other income 28,446 - - 28,446
Total other income 28,446 - - 28,446
Net finance income/(cost) (6,109) 23 - (6,086)
Receivables impairment expenses (32,548) (62) - (32,610)
Operating expenses (25,608) (7,688) (14,461) (47,757)
EBTDA excluding FX, share-based payment expense (non-cash) and one-off items
34,873 7,270 (14,461) 27,682
Share-based payments (non-cash) - - - (16,374)
One-off costs - - - (2,960)
Foreign currency gains - - - 1,395
Depreciation and amortisation - - - (17,329)
Loss before income tax - - - (7,586)
Income tax expense - - - (1,390)
Loss for the year - - - (8,976)
44

NOTES TO THE FINANCIAL STATEMENTS • SIGNIFICANT ACCOUNTING POLICIES – REVENUE (CONTINUED)
RENDERING OF SERVICES – PAY NOW
The Group facilitates the sales of electronic
products and services for which it receives a fee
for every successful transaction. Revenue from
integration services is recognised by reference
to stage of completion of a contract or contracts
in progress at balance date.
Stage of completion is measured by reference
to labour hours incurred to date as a percentage
of total estimated labour hours for each contract.
Where there is a final customer acceptance
condition in the contract, revenue is recognised
only upon customer acceptance. Where the
contract outcome cannot be measured reliably,
revenue is recognised only to the extent that the
expenses incurred are eligible to be recovered.
OTHER INCOME - LATE FEE CHARGES
Late fee charges are currently used by Afterpay
as an incentive mechanism in order to encourage
end-customers to pay their outstanding balances
as and when they fall due. Revenue is recognised
upon charge to end-customer at certain time
points where late fees become applicable and
are expected to be recovered.
INTEREST REVENUE
Revenue is recognised as the interest accrues
using the effective interest method. This is a
method of calculating the amortised cost of
a financial asset and allocating the interest
income over the relevant period using the
effective interest rate, which is the rate that
exactly discounts estimated future cash receipts
through the expected life of the financial asset to
the net carrying amount of the financial asset.
4. BUSINESS COMBINATIONSOn 19 June 2017, the Group acquired 100% of the
voting shares of Afterpay and Touchcorp shares.
The rationale for the Merger was compelling
as it brought together the complementary skill
and product sets of Afterpay and Touchcorp.
Afterpay has grown its merchant numbers,
customer numbers and revenues at a strong
rate since Afterpay commenced business in the
first half of 2015, with that growth supported and
enabled in a technology sense by Touchcorp.
The Merger brought together the key executives
responsible for this success under a single
company structure allowing shareholders in
both Afterpay and Touchcorp to benefit from
having a single corporate objective.
Given the relative market capitalisation of
Afterpay and Touchcorp, together with the future
anticipated Afterpay Touch Group Board and
executive representation, Afterpay was identified
as the acquirer of Touchcorp Ltd and the Afterpay
Touch Group.
The fair value of the identifiable assets and liabilities
of Touchcorp as at the date of acquisition were:
NOTE $’000
Property, plant and equipment
4,384
Intangible assets 10 42,486
Cash and cash equivalents 17,169
Receivables and other current assets
167,726
Deferred tax asset, net 6 2,086
Payables (18,586)
Net assets acquired 215,265
Goodwill arising on acquisition
10 23,575
Purchase consideration transferred
238,840
Number of shares issue to Touchcorp shareholders (’000)
82,322
Fair value of shares issued ($’000) 237,088
Fair value of employee shares issued subject to non-recourse loans ($’000)
1,752
Total purchase consideration ($’000)
238,840
The net assets recognised in the 30 June 2017
financial statements were based on the provisional
assessment of their value while the Group sought an
independent valuation for the Touchcorp intangible
assets. The valuations had not been completed
by the date the 2017 financial statements were
approved for issue by the Board of Directors. During
the financial year, the fair valuation of net assets
acquired was completed and the fair value of the
core technology intangible assets was $27.0m,
an increase of $9.6m and a customer contract
intangible asset of $15.3m was recognised. The 2017
comparative information was restated to reflect the
adjustment to the provisional amounts. As a result
of the fair value uplift of the intangible assets, there
was an increase in the deferred tax liabilities of
$7.8m. These fair value adjustments decreased the
provisional goodwill by $17.2m to $23.6m. Refer to
Note 10 for details.
The purchase consideration was based on
Afterpay’s share price of $2.88, being the share price
at the close of business on 19 June 2017. 45

NOTES TO THE FINANCIAL STATEMENTS • BUSINESS COMBINATIONS (CONTINUED)
S I GN I F I C ANT A C C O UNT IN G J U D G EMENTS , EST IMAT ES AND ASSUM P T I ONS
BUSINESS COMBINATIONS
Business combinations are accounted for
using the acquisition method. The cost of an
acquisition is measured as the aggregate of the
consideration transferred, which is measured
at acquisition date fair value, and the amount of
any non-controlling interests in the acquiree.
When the Group acquires a business, it
assesses the financial assets and liabilities
assumed for appropriate classification and
designation in accordance with the contractual
terms, economic circumstances and pertinent
conditions as at the acquisition date.
For core technology, a valuation methodology
based on a replacement cost model was
used, as there is a lack of comparable market
data because of the nature of the assets. For
customer contracts, a discounted cash flow
model was used and this is based on historical
data and estimated future performance of
each contract.
Goodwill is initially measured at cost (being the
excess of the aggregate of the consideration
transferred and the amount recognised for non-
controlling interests and any previous interest
held over the net identifiable assets acquired
and liabilities assumed).
If the fair value of the net assets acquired
is in excess of the aggregate consideration
transferred, the Group re-assesses whether it
has correctly identified all of the assets acquired
and all of the liabilities assumed and reviews
the procedures used to measure the amounts
to be recognised at the acquisition date. If the
reassessment still results in an excess of the
fair value of the net assets acquired over the
aggregate consideration transferred, the gain is
recognised in profit or loss.
5. EXPENSESCONSOLIDATED AFTERPAY
2018 2017
$’000 $’000
Depreciation and amortisation
Depreciation (1,808) (21)
Amortisation (15,521) (2,687)
Total depreciation and amortisation
(17,329) (2,708)
Employee benefits expense
Share-based payments (non-cash)
(16,374) (1,838)
Wages and salaries (19,199) (4,100)
Other employee on-costs (3,046) (632)
Total employment expenses
(38,619) (6,570)
Operating expenses
Debt recovery costs, including bank charges
(6,569) (565)
Consulting and contractor costs
(4,339) (1,088)
Marketing expense (5,794) (818)
Communication and technology
(2,653) (76)
Operating lease expense (1,530) (181)
Merger related costs (1,686) (1,558)
Asset impairment and provision for onerous contract 1
- (13,596)
General and administrative expenses
(4,506) (2,437)
Total operating expenses (27,077) (20,319)
1. This relates to the 5-year customer development contract
to develop and pay rebates to a party with whom Touchcorp
sought to co-operate to increase the numbers of transactions
carried on the Touch System Platform. Due to the financial
performance and the changing focus of the merged Group, in
the 2017 financial statements, the Group impaired the prepaid
asset related to the agreement of $5.9m and recognised an
onerous contract provision of $7.7m. The provision had been
calculated on the remaining cost to fulfill the obligations, which
was fully paid by the end of 30 June 2018.
S I GN I F I C ANT A C C O UNT IN G P O L I C I E S
EMPLOYEE LEAVE BENEFITS
Liabilities for wages and salaries, including non-
monetary benefits and annual leave expected
to be settled within 12 months of the reporting
date are recognised in respect of employees’
services up to the reporting date. They are
measured at the amounts expected to be paid
when the liabilities are settled. Expenses for
non-accumulating sick leave are recognised
when the leave is taken and are measured at the
rates paid or payable.46

NOTES TO THE FINANCIAL STATEMENTS (CONTINUED)
6. INCOME TAXA. INCOME TAX BENEFIT/(EXPENSE)
CONSOLIDATED AFTERPAY
2018 2017
$’000 $’000
The major components of income tax benefit:
Current Income tax charge
Current income tax charge
(8,974) (2,119)
Adjustments in respect of current income tax of previous years
62 -
Deferred income tax
Relating to origination/reversal of temporary differences
7,493 5,868
Reversal/recognition of deferred tax asset in relation to tax losses
- 1,054
Adjustment in relation to deferred income tax of previous years
29 -
Income tax (expense)/benefit as reported in the income statement
(1,390) 4,803
B. STATEMENT OF CHANGES IN EQUITY
CONSOLIDATED CONSOLIDATED
2018 2017
$’000 $’000
Deferred income tax related to items charged (credited) directly to equity:
(84) (468)
Net deferred income tax on share issue expenses
(84) (468)
C. NUMERICAL RECONCILIATION BETWEEN AGGREGATE TAX EXPENSE RECOGNISED IN THE INCOME STATEMENT AND TAX BENEFIT CALCULATED PER THE STATUTORY INCOME TAX RATE
A reconciliation between tax expense and the product
of accounting loss before income tax multiplied by the
Group’s applicable income tax rate is as follows:
CONSOLIDATED AFTERPAY
2018 2017
$’000 $’000
Accounting loss before tax (7,586) (14,423)
At the Group's statutory rate of 30% (2017: 30%)
2,276 4,327
Expenditure not allowed for income tax purposes
(3,558) (578)
Foreign tax rate differential (59) -
Amount over provided in prior year
91 -
Tax losses not recognised (140) -
Recognition of tax losses not previously recognised
- 1,054
Income tax (expense)/benefit (1,390) 4,803
D. DEFERRED INCOME TAX
Deferred income tax at 30 June relates to the following:
CONSOLIDATED CONSOLIDATED RESTATED
2018 2017
$’000 $’000
Deferred tax liabilities
Capitalisation of research and development expenditure
3,612 2,879
Prepayments 413 23
Customer contracts 3,144 4,609
Unrealised foreign exchange 447 -
Other 195 -
Gross deferred tax liabilities 7,811 7,511
Set-off of deferred tax assets (7,811) (7,511)
Deferred tax liabilities - -
Deferred tax assets
Employee related provisions 3,307 470
Share issue expenses 1,085 1,490
R&D offsets 410 3,285
Impairment provision - 2,307
Doubtful debts 4,530 1,642
Other 922 (369)
Losses 6,818 7,752
Gross deferred tax assets 17,072 16,577
Set-off of deferred tax liabilities
(7,811) (7,511)
Net deferred tax assets 9,261 9,06647

NOTES TO THE FINANCIAL STATEMENTS • INCOME TAX (CONTINUED)
TAX CONSOLIDATION LEGISLATION
Afterpay Touch Group Limited and its wholly-
owned Australian controlled subsidiaries formed
a tax consolidated group effective from 15
August 2017. Afterpay Touch Group Limited and
the members of the tax consolidated group
recognise their own current tax and deferred
tax assets and liabilities arising from temporary
differences using the “standalone taxpayer
approach” by reference to the carrying amounts
of assets and liabilities in the separate financial
statements of each entity and the tax values
applying under tax consolidation.
In addition to its current and deferred tax
balances, Afterpay Touch Group Limited has
assumed the current tax liabilities and any
deferred tax assets arising from unused tax
credits or losses of the members in the tax
consolidated group.
NATURE OF TAX FUNDING ARRANGEMENTS AND TAX SHARING ARRANGEMENTS
Entities in the tax-consolidated group entered
into a tax funding agreement with the head
entity. The arrangements require payments to/
(from) the head entity equal to the current tax
liability/(asset) assumed by the head entity and
any deferred taxes relating to unused tax losses
or unused tax credits transferred to the head
entity, resulting in the head entity recognising
an inter-entity receivable/(payable) equal in
amount to the tax liability/(asset) assumed.
The inter-entity receivables/(payables) are
at call. Contributions to fund the current tax
liabilities are payable as per the tax funding
arrangement. The head entity, in conjunction
with other members of the tax-consolidated
group, has entered into a tax sharing agreement.
The tax sharing agreement provides for the
determination of the allocation of income
tax liabilities between the entities should be
the head entity default on its tax payment
obligations. No amounts have been recognised
in the financial statements in respect of this
agreement as payment of any amounts under
the tax sharing agreement is considered remote.
OTHER TAXES
Revenues, expenses and assets are recognised
net of the amount of goods and services tax
(GST) except:
• When the GST incurred on a purchase of
goods and services is not recoverable from
the taxation authority, in which case the GST
is recognised as part of the cost of acquisition
of the asset or as part of the expense item as
applicable.
• Receivables and payables are stated with the
amount of GST included.
S I GN I F I C ANT A C C O UNT IN G J U D G EMENTS , EST IMAT ES AND ASSUM P T I ONS
TAXATION INTERPRETATION, REGULATION AND TIMING RECOGNITION
Uncertainties exist with respect to the
interpretation of complex tax regulations,
changes in tax laws, and the amount and timing
of future taxable income. Differences arising
between the actual results and the assumptions
made, or future changes to such assumptions,
could necessitate future adjustments to current
and deferred tax already recorded.
S I GN I F I C ANT A C C O UNT IN G P O L I C I E S
INCOME TAX
Income tax expense comprises current and
deferred tax. Income tax expense is recognised
in profit or loss, except to the extent it relates
to items recognised directly in equity, in which
case it is recognised in equity.
Current tax in respect of the taxable income for
the year is measured at the amount expected
to be recovered from or paid to the taxation
authorities. The tax rates and tax laws used to
compute the amount are those that are enacted
or substantively enacted by the reporting date.
Deferred tax is recognised using the balance
sheet method in which temporary differences
are calculated based on the difference between
the tax bases of assets and liabilities and
their carrying amounts for financial reporting
purposes.
Deferred tax assets and liabilities are measured
at the tax rates that are expected to apply in the
year when the asset is realised, or the liability is
settled, based on tax rates (and tax laws) that
have been enacted or substantively enacted at
the reporting date.
Deferred tax assets are recognised for
deductible temporary differences and unused
tax credits and tax losses, only to the extent
that it is probable that future taxable profit
will be available against which the assets can
be utilised.
Unrecognised deferred tax assets are
reassessed at each reporting date and are
recognised to the extent that it has become
probable that future taxable profit will allow the
deferred tax asset to be recovered.
Deferred tax assets and deferred tax liabilities
are offset only if a legally enforceable right
exists to set off current tax assets against current
tax liabilities and the deferred tax assets and
liabilities relate to the same taxable entity and
the same taxation authority.
48

NOTES TO THE FINANCIAL STATEMENTS • INCOME TAX (CONTINUED)
The net amount of GST recoverable from, or
payable to, the taxation authority is included as
part of receivables or payables in the statement
of financial position.
Cash flows are included in the statement of cash
flows on a gross basis and the GST component
of cash flows arising from investing and
financing activities, which is recoverable from, or
payable to, the taxation authority, is classified as
operating cash flows.
Commitments and contingencies are disclosed
net of the amount of GST recoverable from, or
payable to, the taxation authority.
7. CASH AND CASH EQUIVALENTS
CONSOLIDATED CONSOLIDATED
2018 2017
$’000 $’000
Cash at bank and in hand
10,292 16,565
Short-term deposits 15,165 13,037
Total cash and cash equivalents
25,457 29,602
The total Group’s cash balance is $49.2m (2017:
$38.5m) which includes the restricted cash
classified as other financial assets, as in Note 8.
RECONCILIATION FROM THE NET LOSS BEFORE TAX TO THE NET CASH FLOWS FROM OPERATIONS
CONSOLIDATED AFTERPAY
2018 2017
$’000 $’000
Loss before tax (7,586) (14,423)
Adjustments for:
Depreciation 1,808 21
Amortisation 15,521 2,687
Asset impairment and provision for onerous contract
- 13,596
Share-based payments 16,374 1,838
Finance cost 6,617 777
Finance income (531) (347)
Unrealised foreign currency gains
(1,501) -
Changes in assets and liabilities
Increase in receivables (140,683) (84,842)
Increase in prepayments and other assets
(4,483) (4,117)
Increase in trade and other payables
9,132 5,943
Net cash used in operating activities
(105,332) (78,867)
S I GN I F I C ANT A C C O UNT IN G P O L I C I E S
CASH AND CASH EQUIVALENTS
Cash and cash equivalents in the Statement
of financial position comprise cash at bank
and in hand and short-term deposits with an
original maturity of three months or less, that
are readily convertible to known amounts of
cash and which are subject to an insignificant
risk of changes in value. For the purposes of
the Statement of cash flows, cash and cash
equivalents consist of cash and cash equivalents
as defined above.
8. OTHER FINANCIAL ASSETCONSOLIDATED CONSOLIDATED
2018 2017
$’000 $’000
Other financial asset 23,741 8,893
Total other financial asset
23,741 8,893
Other financial asset is cash held in the Group’s
Warehouse Trust with National Australia Bank
(NAB) for the purposes of repayment of the
Group’s secured interest bearing borrowings (as
disclosed in Note 11) and payment of interest
and bank fees associated to that borrowings.
The Group has a non-controlling interest of
15.3% in a privately held company in the start-
up phase which is designated as an available
for sale financial asset. The fair value of the
Group’s non-controlling interest was valued at
$0 at 30 June 2018 (2017: $0) due to uncertainty
concerning the Company’s future prospects and
its ability to generate profits. The shares of the
non-controlling interest are privately held and
not listed on any third party public exchange.
This is a Level 3 financial asset.
49
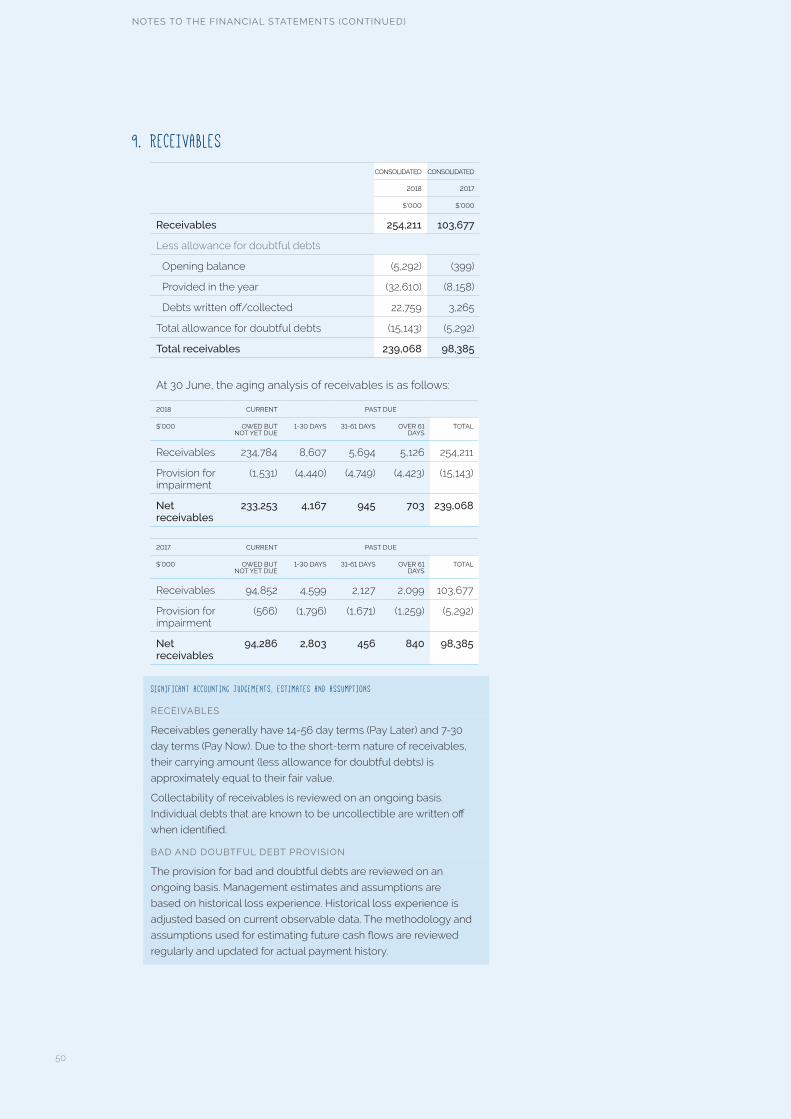
NOTES TO THE FINANCIAL STATEMENTS (CONTINUED)
9. RECEIVABLES
CONSOLIDATED CONSOLIDATED
2018 2017
$’000 $’000
Receivables 254,211 103,677
Less allowance for doubtful debts
Opening balance (5,292) (399)
Provided in the year (32,610) (8,158)
Debts written off/collected 22,759 3,265
Total allowance for doubtful debts (15,143) (5,292)
Total receivables 239,068 98,385
At 30 June, the aging analysis of receivables is as follows:
2018 CURRENT PAST DUE
$’000 OWED BUT NOT YET DUE
1-30 DAYS 31-61 DAYS OVER 61 DAYS
TOTAL
Receivables 234,784 8,607 5,694 5,126 254,211
Provision for impairment
(1,531) (4,440) (4,749) (4,423) (15,143)
Net receivables
233,253 4,167 945 703 239,068
2017 CURRENT PAST DUE
$’000 OWED BUT NOT YET DUE
1-30 DAYS 31-61 DAYS OVER 61 DAYS
TOTAL
Receivables 94,852 4,599 2,127 2,099 103,677
Provision for impairment
(566) (1,796) (1,671) (1,259) (5,292)
Net receivables
94,286 2,803 456 840 98,385
S I GN I F I C ANT A C C O UNT IN G J U D G EMENTS , EST IMAT ES AND ASSUM P T I ONS
RECEIVABLES
Receivables generally have 14-56 day terms (Pay Later) and 7-30
day terms (Pay Now). Due to the short-term nature of receivables,
their carrying amount (less allowance for doubtful debts) is
approximately equal to their fair value.
Collectability of receivables is reviewed on an ongoing basis.
Individual debts that are known to be uncollectible are written off
when identified.
BAD AND DOUBTFUL DEBT PROVISION
The provision for bad and doubtful debts are reviewed on an
ongoing basis. Management estimates and assumptions are
based on historical loss experience. Historical loss experience is
adjusted based on current observable data. The methodology and
assumptions used for estimating future cash flows are reviewed
regularly and updated for actual payment history.
50

NOTES TO THE FINANCIAL STATEMENTS (CONTINUED)
10. PROPERTY, PLANT AND EQUIPMENT AND INTANGIBLE ASSETS
(A) PROPERTY, PLANT AND EQUIPMENT
The net book value of property, plant and equipment of $4.0m (2017:
$4.5m) primarily includes computer and equipment, furniture fittings
and leasehold improvements. During the period, the Group purchased
property, plant and equipment of $1.3m and recognised depreciation
of $1.8m.
RECOGNITION AND MEASUREMENT
Property, plant and equipment is stated at historical cost less
accumulated depreciation and any accumulated impairment losses.
USEFUL LIFE OF ASSETS
Depreciation is calculated on the straight-line basis over the estimated
useful life of the specific assets as follows:
• Plant and equipment - 3 to 5 years
(B) INTANGIBLE ASSETS
CORE TECHNOLOGY
WORK IN PROGRESS
PATENTS CUSTOMER CONTRACTS
GOODWILL TOTAL
$’000 $’000 $’000 $’000 $’000 $’000
Cost
At 1 July 2016 13,000 - 126 - - 13,126
Additions 1,641 661 - - - 2,302
Acquisition of a subsidiary (restated*)
27,008 - - 15,352 23,575 65,935
At 30 June 2017 41,649 661 126 15,352 23,575 81,363
Additions 10,517 976 14 - - 11,507
Transferred 1,374 (1,374) - -
At 30 June 2018 53,540 263 140 15,352 23,575 92,870
Amortisation
At 1 July 2016 (2,167) - - - - (2,167)
Amortisation (2,687) - - - - (2,687)
At 30 June 2017 (4,854) - - - - (4,854)
Amortisation (10,619) - (20) (4,882) - (15,521)
At 30 June 2018 (15,473) - (20) (4,882) - (20,375)
Net book value
At 30 June 2018 38,067 263 120 10,470 23,575 72,495
At 30 June 2017 (restated*) 36,795 661 126 15,352 23,575 76,509
* The core technology, customer contracts and goodwill are restated and do not correspond to the figures in 2017 financial statements
since adjustments to the final valuation of acquisition of Touchcorp were made, as detailed in Note 4.
INTANGIBLE ASSETS – RECOGNITION AND MEASUREMENT
GOODWILL
On acquisition, goodwill is initially measured at the excess of the fair
value of the purchase consideration of the acquired business over the fair
value of the identifiable net assets.
Goodwill is allocated to each of the cash generating units expected to
benefit from the business combination. Goodwill is not amortised, but is
measured at cost less any accumulated impairment losses. Impairment 51

NOTES TO THE FINANCIAL STATEMENTS • PROPERTY, PLANT AND EQUIPMENT AND INTANGIBLE ASSETS (CONTINUED)
is reviewed annually or more frequently if circumstances arise which indicate potential
impairment. The results of the impairment test outlines that each cash generating
unit’s recoverable amount exceeds the carrying value of its net assets, inclusive
of goodwill.
The recoverable amount is the greater of fair value less costs to sell and value in use.
In assessing for impairment, the Group’s assets are grouped at the lowest levels for
which there are separately identifiable cash inflows which are largely independent of
the cash flows from other assets or cash generating units. Assets apart from goodwill
that have previously recognised impairment in the past are reviewed for possible
reversal at the end of each reporting period.
INTANGIBLE ASSETS
Intangible assets acquired separately are measured at cost on initial recognition.
Following initial recognition, intangible assets are carried at cost less any accumulated
amortisation and accumulated impairment losses. Internally generated intangibles,
excluding capitalised development costs, are not capitalised and the related
expenditure is reflected in profit or loss in the period in which the expenditure
is incurred.
Intangible assets useful lives are assessed to be either finite or indefinite.
RESEARCH AND DEVELOPMENT COSTS
Research costs are expensed as incurred.
Development expenditures on an individual project are recognised as an intangible
asset when the Group can demonstrate:
• The technical feasibility of completing the intangible asset so that the asset will be
available for use or sale;
• Its intention to complete and its ability to use or sell the asset;
• How the asset will generate future economic benefits;
• The ability to measure reliably the expenditure during development;
• The ability to use the intangible asset generated.
Following initial recognition of the development expenditure as an asset, the asset is
carried at cost less any accumulated amortisation and accumulated impairment losses.
Amortisation of the asset begins when development is complete and the asset is
available for use. It is amortised over the period of expected future benefit.
USEFUL LIFE OF ASSETS
INTANGIBLE ASSETS
A summary of the policies applied to the Group’s intangible assets is as follows:
PATENTS CORE TECHNOLOGY CUSTOMER CONTRACTS
USEFUL LIVES Finite Finite Finite
AMORTISATION METHOD USED
20 years – Straight-line 5 years – Straight-line 2–4 years – Straight-line
INTERNALLY GENERATED / ACQUIRED
Acquired Acquired and Internally generated
Acquired
IMPAIRMENT TESTING Amortisation method reviewed at every reporting period. Reviewed annually for indicators of impairment
Amortisation method reviewed at every reporting period. Reviewed annually for indicators of impairment.
Amortisation method reviewed at every reporting period. Reviewed annually for indicators of impairment
52

NOTES TO THE FINANCIAL STATEMENTS • PROPERTY, PLANT AND EQUIPMENT AND INTANGIBLE ASSETS (CONTINUED)
IMPAIRMENT TESTS FOR GOODWILL, INTANGIBLE ASSETS AND PROPERTY, PLANT AND EQUIPMENT
This is the first year the Group performed its annual impairment test, post the merger
in June 2017. The Group considers the relationship between its market capitalisation
and its book value, among other factors, when reviewing for indicators of impairment.
At 30 June 2018, the market capitalisation of the Group was significantly greater
than the Group’s equity book value, indicating no potential impairment of goodwill
and impairment of the assets of the cash generating units. In addition, the Group
performed a detailed impairment review of the goodwill and intangible assets and
concluded that there was no impairment recognised for the year ended 30 June 2018.
The Group allocated goodwill to Pay Later and Pay Now which are the two operating
segments expected to benefit from the business combination.
A summary of the allocation is presented below:
PAY LATER PAY NOW TOTAL SEGMENTS
$’000 $’000 $’000
Core technology 25,709 12,358 38,067
Work in progress 263 - 263
Patents - 120 120
Customer contracts - 10,470 10,470
Goodwill allocation 21,220 2,355 23,575
Total intangible assets 47,192 25,303 72,495
PAY LATER SEGMENT
The estimated net value in use of the Pay Later operating segment at 30 June 18,
which has been determined based on the cash flow projections from financial
budgets reviewed and approved by senior management covering one year period.
The pre-tax discount rate applied to cash flow projections is 15.9% and cash flows
have been extrapolated using the most conservative approach compared to historical
growth experienced by the segment, which ranges between 3%-7.5% and a terminal
growth rate less than 3% has been used.
PAY NOW SEGMENT
The recoverable amount of the Pay Now operating segment is also determined
based on a value in use calculation using cash flow projections from financial budgets
approved by senior management covering one-year period. The pre-tax discount rate
applied to cash flow projections is 13.4% and the projected cash flows are assumed
to be stable for the Pay Now segment and the terminal growth rate is the expected
industry growth rate of less than 3%.
The recoverable amount of the intangible assets in both segments exceeds the
carry value at 30 June 2018. A change of -/+1 and 2 times of the income and
expense adjustment factor does not result in an impairment of intangible assets at
30 June 2018.
S I GN I F I C ANT A C C O UNT IN G J U D G EMENTS , EST IMAT ES AND ASSUM P T I ONS
The asset impairment assessment process requires significant management
judgement. In determining whether goodwill has been impaired, an estimate of the
recoverable amount of the cash generating unit is required using a discounted cash
flow methodology. This calculation uses cash flow projections based on operating
budgets and a one-year strategic business plan, after which a terminal value, based
on management’s view of the expected long-term growth profile of the business
is applied. The implied pre-tax discount rate which is utilised is calculated with
reference to long-term government bond rates, external analyst views and the
Group’s pre-tax cost of debt. The determination of cash flows over the life of an
asset requires management judgement in assessing the future number of merchant
acquisitions, customer usage, potential price changes as well as any changes to the
costs of the product and of other operating costs incurred by the Group.
53

NOTES TO THE FINANCIAL STATEMENTS (CONTINUED)
11. INTEREST BEARING BORROWINGS
CONSOLIDATED CONSOLIDATED
2018 2017
$’000 $’000
Secured interest bearing borrowings
111,593 46,748
Senior unsecured notes
49,491 -
Convertible notes 128 -
Finance lease liability
393
Total interest bearing borrowings
161,605 46,748
The secured interest bearing borrowings have
been drawn down under a $350m two-year
facility with NAB. The loan is repayable on
the maturity date which is 30 November 2019.
The facility has been secured against Afterpay
Australia’s receivables with a carrying value of
$221.9m as at 30 June 2018. As at 30 June 2018,
the facility carries a weighted average of interest
of 3.8% per annum (2017: 4.6%) and an unused
balance of $238.4m.
The senior unsecured notes were issued to
institutional and professional investors for a fixed
rate of 7.25% over four-year maturity with interest
payable every six-month period.
The convertible notes represent US$0.1m
issued to Matrix Partners. The notes carry a fixed
interest rate of 6% for 7 years. The notes have a
conversion period of 5 to 7 years from the date
of issue, with conversion at the noteholder’s
election. Conversion value is based on up to 10%
of the future value of Afterpay US more than
US$50m, to be determined by independent
valuation using valuation metrics, multiples
and methods which the market is using to
value Afterpay Touch at the time of conversion.
The conversion value will be issued in the
form of Afterpay Touch shares, valued at the
market price of Afterpay Touch shares at the
relevant time.
The finance lease liability represents the
remaining outstanding office fitout expenditure
with a proportion payable within the next
12 months.
The Group also holds a NZ$20m facility
with ASB to assist the Group’s New Zealand
operations, as at balance date there were no
drawdowns on this facility,
CR
ED
IT R
ISK
FO
REIGN CURRENCY RIS
K
INTEREST RA
TE
RIS
K
12. FINANCIAL RISK MANAGEMENT OBJECTIVES AND POLICIESThe Group’s principal financial instruments
comprise receivables, payables, cash and
short-term deposits, other financial assets and
secured interest-bearing borrowings.
The Group manages its exposure
to key financial risks, including
interest rate, credit, liquidity
and currency risk in
accordance with the
Group’s financial risk
management policy.
The objective of which
is to support the delivery
of the Group’s financial
targets, whilst protecting
future financial security.
The main risks arising from
the Group’s financial instruments
are interest rate risk, foreign currency risk,
liquidity risk and credit risk. The Group uses
different methods to measure and manage
different types of risks to which it is exposed.
These include monitoring levels of exposure
to interest rate and foreign exchange risk and
assessments of market forecasts for interest rate
and foreign exchange, and by depositing funds
with a number of different banking institutions.
Ageing analysis and monitoring of specific credit
allowances are undertaken to manage credit
risk. Liquidity risk is monitored through the
development of future rolling cash
flow forecasts.
The Group’s risk exposures and
responses are as follows:
CREDIT RISK
Credit risk arises from the
financial assets of the Group.
The Group’s exposure to credit
risk arises from potential default
of the end-customer receivable,
with a maximum exposure equal to
the carrying amount of these instruments.
The Group utilises its proprietary risk decisioning
rules to mitigate credit risk. The Group also
regularly reviews the adequacy of the provision
for doubtful debts to ensure that it is sufficient
to mitigate the credit risk exposure in terms of
financial reporting. The provision for doubtful 54

NOTES TO THE FINANCIAL STATEMENTS • FINANCIAL RISK MANAGEMENT OBJECTIVES AND POLICIES (CONTINUED)
debts raised represents management’s best
estimate of losses incurred at reporting date
based on historical loss experience and their
experienced judgement.
FOREIGN CURRENCY RISK
The Group’s balance sheet can be affected
by movements in the Euro, Swiss Franc, US
Dollars, Singapore Dollars, Malaysian Ringgit,
New Zealand Dollars, Norwegian Krone and
Swedish Krona.
The Group has transactional currency exposures
arising from sales and purchases by both Pay
Later and Pay Now business.
INTEREST RATE RISK
The Group’s exposure to market interest rates
relates primarily to the Group’s cash and cash
equivalents and interest-bearing borrowings.
At balance date, the Group had the following
mix of financial assets and liabilities exposed to
Australian variable interest rate risk that are not
designated in cash flow hedges:
CONSOLIDATED CONSOLIDATED
2018 2017
$’000 $’000
Financial assets
Cash and cash equivalents
25,457 29,702
Other financial asset 23,741 8,893
Term deposits (other current assets)
2,165 100
Subtotal financial assets
51,363 38,595
Financial liabilities
Secured interest bearing borrowings
111,593 46,748
Subtotal financial liabilities
111,593 46,748
Net exposure (60,230) (8,153)
The Convertible Note and Senior Unsecured Notes issued by
the Group during the period are on a fixed interest rate term,
consequently they are not exposed to interest rate risks.
The following sensitivity analysis is based on the
interest rate risk exposures in existence at the
reporting date.
At 30 June 2018, if interest rates had moved,
as illustrated in the table below, with all other
variables held constant, post tax profit and
equity would have been affected as follows:
SENSITIVITY TO REASONABLY POSSIBLE MOVEMENTS:
POST TAX PROFIT EQUITY
HIGHER/(LOWER) HIGHER/(LOWER)
2018 2017 2018 2017
$’000 $’000
-0.25% (25 basis points)
105 14 105 14
+1.00% (100 basis points)
(422) (57) (422) (57)
If there is reduction in interest rates, the Group’s
post tax profit should be better. The Group has
higher interest bearing borrowings compared to
the cash balances at the balance sheet date.
Significant assumptions used in the interest rate
sensitivity analysis include:
• ►Management believes that interest rates will
remain constant during the 12 month period
subsequent to balance date.
• The net exposure at balance date being
representative of what the group was and is
expecting to be exposed to in the next twelve
months from balance date.
At 30 June 2018, the Group has the following
exposure to foreign currency that is not
designated in cash flow hedges:
CONSOLIDATED CONSOLIDATED
2018 2017
$’000 $’000
Financial assets
Cash and cash equivalents
NZD 670 -
USD 19,981 -
Other 6 41
Receivables and other current assets
NZD 5,422 154
USD 7,694 -
EUR 245 -
CHF 308 206
Other 36 102
34,362 503
Financial liabilities
Trade and other payables
- NZD 761 -
- USD 2,958 -
- EUR 144 98
- CHF 166 83
- Other 19 301
4,048 482
Net exposure 30,314 21
55
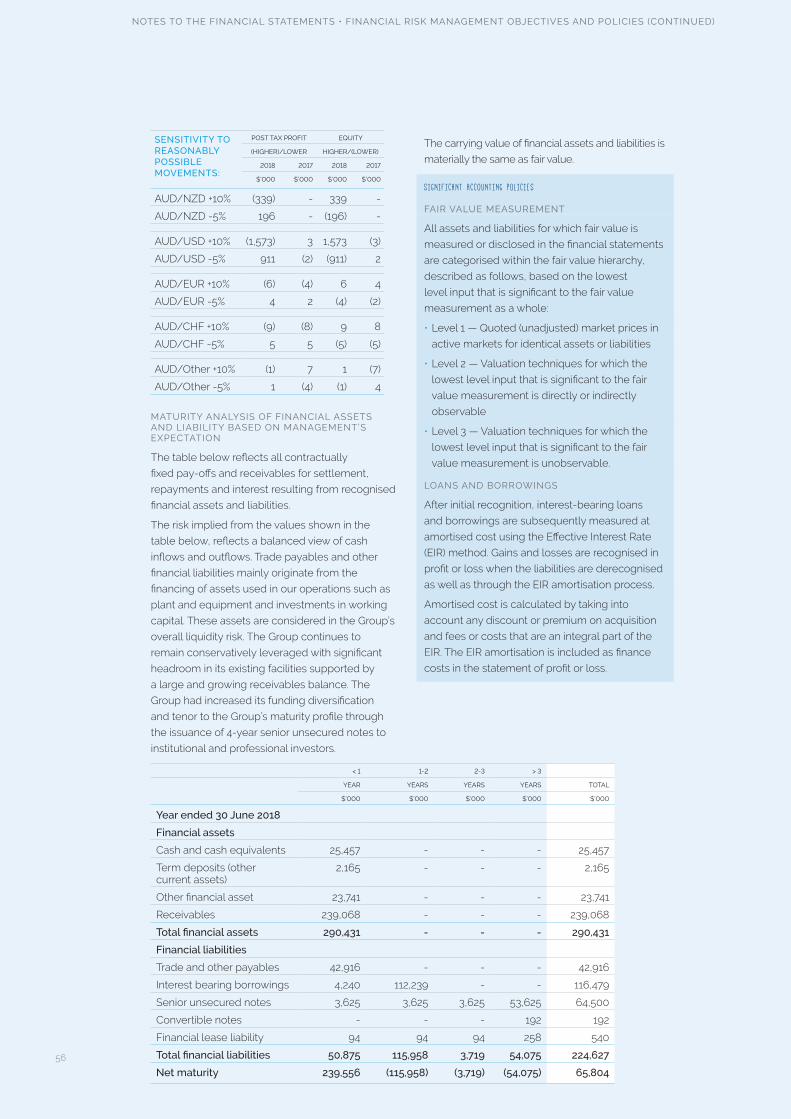
NOTES TO THE FINANCIAL STATEMENTS • FINANCIAL RISK MANAGEMENT OBJECTIVES AND POLICIES (CONTINUED)
SENSITIVITY TO REASONABLY POSSIBLE MOVEMENTS:
POST TAX PROFIT EQUITY
(HIGHER)/LOWER HIGHER/(LOWER)
2018 2017 2018 2017
$’000 $’000 $’000 $’000
AUD/NZD +10% (339) - 339 -
AUD/NZD -5% 196 - (196) -
AUD/USD +10% (1,573) 3 1,573 (3)
AUD/USD -5% 911 (2) (911) 2
AUD/EUR +10% (6) (4) 6 4
AUD/EUR -5% 4 2 (4) (2)
AUD/CHF +10% (9) (8) 9 8
AUD/CHF -5% 5 5 (5) (5)
AUD/Other +10% (1) 7 1 (7)
AUD/Other -5% 1 (4) (1) 4
MATURITY ANALYSIS OF FINANCIAL ASSETS AND LIABILITY BASED ON MANAGEMENT’S EXPECTATION
The table below reflects all contractually
fixed pay-offs and receivables for settlement,
repayments and interest resulting from recognised
financial assets and liabilities.
The risk implied from the values shown in the
table below, reflects a balanced view of cash
inflows and outflows. Trade payables and other
financial liabilities mainly originate from the
financing of assets used in our operations such as
plant and equipment and investments in working
capital. These assets are considered in the Group’s
overall liquidity risk. The Group continues to
remain conservatively leveraged with significant
headroom in its existing facilities supported by
a large and growing receivables balance. The
Group had increased its funding diversification
and tenor to the Group’s maturity profile through
the issuance of 4-year senior unsecured notes to
institutional and professional investors.
< 1 1-2 2-3 > 3
YEAR YEARS YEARS YEARS TOTAL
$’000 $’000 $’000 $’000 $’000
Year ended 30 June 2018
Financial assets
Cash and cash equivalents 25,457 - - - 25,457
Term deposits (other current assets)
2,165 - - - 2,165
Other financial asset 23,741 - - - 23,741
Receivables 239,068 - - - 239,068
Total financial assets 290,431 - - - 290,431
Financial liabilities
Trade and other payables 42,916 - - - 42,916
Interest bearing borrowings 4,240 112,239 - - 116,479
Senior unsecured notes 3,625 3,625 3,625 53,625 64,500
Convertible notes - - - 192 192
Financial lease liability 94 94 94 258 540
Total financial liabilities 50,875 115,958 3,719 54,075 224,627
Net maturity 239,556 (115,958) (3,719) (54,075) 65,804
The carrying value of financial assets and liabilities is
materially the same as fair value.
S I GN I F I C ANT A C C O UNT IN G P O L I C I E S
FAIR VALUE MEASUREMENT
All assets and liabilities for which fair value is
measured or disclosed in the financial statements
are categorised within the fair value hierarchy,
described as follows, based on the lowest
level input that is significant to the fair value
measurement as a whole:
• Level 1 — Quoted (unadjusted) market prices in
active markets for identical assets or liabilities
• Level 2 — Valuation techniques for which the
lowest level input that is significant to the fair
value measurement is directly or indirectly
observable
• Level 3 — Valuation techniques for which the
lowest level input that is significant to the fair
value measurement is unobservable.
LOANS AND BORROWINGS
After initial recognition, interest-bearing loans
and borrowings are subsequently measured at
amortised cost using the Effective Interest Rate
(EIR) method. Gains and losses are recognised in
profit or loss when the liabilities are derecognised
as well as through the EIR amortisation process.
Amortised cost is calculated by taking into
account any discount or premium on acquisition
and fees or costs that are an integral part of the
EIR. The EIR amortisation is included as finance
costs in the statement of profit or loss.
56

NOTES TO THE FINANCIAL STATEMENTS (CONTINUED)
13. SHARE-BASED PAYMENTS PLANS
SIGN I F I C ANT A C C O UNT IN G P O L I C I E S
Benefits are provided to certain employees of
the Group in the form of shared based payments
through share options, performance rights
and loan shares. The fair value of the equity to
which employees become entitled is measured
at grant date and recognised as an expense
over the vesting period, with a corresponding
increase to an equity account. Settlement of
share options upon vesting are recognised as
contributed equity.
Where the transaction is with a non-employee,
the cost is based on the fair value of the asset
or service received. That cost is recognised,
together with a corresponding increase in other
capital reserves or share capital in equity, over
the period in which the performance and/or
service conditions are fulfilled and/or the asset
or service is delivered/received.
The fair value of the options or loan shares
are determined using a Binomial model.
This expense takes into account the impact
of any non-vesting conditions but ignores
the effect of any service and non-market
performance vesting conditions. Non-market
vesting conditions are taken into account when
considering the number of options expected to
vest and at the end of each reporting period, the
Group revisits its estimate. Revisions to the prior
period estimate are recognised in the income
statement and equity.
The fair value of performance rights is
determined in accordance with the fair market
value of the shares available at the grant date.
The fair value of performance rights has been
calculated using the five-day volume weighted
average price (VWAP) of the five trading days
immediately preceding grant date.
S I GN I F I C ANT A C C O UNT IN G J U D G EMENTS , EST IMAT ES AND ASSUM P T I ONS
The value of the US business was a significant
estimate used to determine the fair value of the
options issued under the US ESOP and the fair
value of the share-based payments component
of the Matrix convertible note.
The fair value of the services received by non-
employees in exchange for share options also
requires management judgement.
The determination of the fair value of the loan
shares for the Group Head require judgement
and have been determined based on the 30
June 2018 share price as an input into the
Binomial model.
Some of the inputs to the Binomial model require
application of significant judgement.
The Group has employee share option plans
(ESOPs) for both Australian (APT ESOP) and
US (US ESOP) employees. These plans align
the interests of employees with the objectives
of the Group and provide incentives to
Executive Directors, senior executives and staff.
Under the ESOP plans, awards are made to
employees who have an impact on the Group’s
performance. ESOP awards are delivered in the
form of options over shares which vest over
a number of years subject and also to meet
certain performance measures..
The Australian share options are subject to an
average of two to three-year service period. The
US share options are subject to an average of
4 year service period. The options under both
plans have graded vesting terms.
The Group had also issued performance rights
to certain senior executives and staff as part
of the incentive plan. The performance rights
vest between 1 – 2 years, and are subject to
service conditions.
Certain executives have been provided loan
shares with non-interest bearing, limited
recourse loans from the Group for the sole
purpose of acquiring shares in the Group. Under
AASB 2 Share-Based Payment, these shares and
loans are treated as “in substance options” even
where the equity instrument itself is not a share
option.
ADDITIONAL INFORMATION ABOUT THE US ESOP
The US share options are options for shares
in the Afterpay US Inc. entity (US ESOP). Upon
exercise of the options, the US option holders
will have an ownership interest of up to 10%
of Afterpay US Inc. Per the terms of the US
ESOP, the exercised shares will automatically
convert into fully paid ordinary shares of APT if
the conversion option of the convertible note
is exercised from January 2023 to January
2025 (as discussed in Note 11). Conversion into
APT shares may also occur at the discretion
of the APT Board if the convertible note is not
converted and expires. The number of APT
shares issued will be based on the fair value
of the US shares at the date of conversion
compared to the VWAP of APT shares.
CONVERTIBLE NOTE
The Group determined the US$100k convertible
notes subscribed by Matrix included a share-
based payment component, for services to
be delivered by Matrix. The fair value of the
convertible notes when issued of US$1.7m
exceeded their face value and was determined
to be a share-based payment in accordance
with AASB 2. 57

NOTES TO THE FINANCIAL STATEMENTS • SHARE-BASED PAYMENTS PLANS (CONTINUED)
The fair value of the convertible notes was
determined by using the multi-stage process,
which involved calculating the equity value of
Afterpay US Inc., which was then used as an
input into the Binomial Model. The share-based
payments will be recognised over the expected
period the services will be performed, currently
estimated at 5 years.
The table above illustrates the number and
weighted average exercise prices (WAEP) of,
and movements in, share options issued during
the period.
The fair value of the equity-settled share options
granted under the ESOP was calculated using
the Binomial Model with following assumptions:
2018 2017 2018 2018
APT ESOP US ESOP MATRIX CONVERTIBILE
NOTE
Expected volatility
40% 40% 60% 60%
Risk-free interest rate
2.07% 2.10% 2.52% 2.66%
Expected life (years)
4 4 5 7
Dividend yield
0% 0% 0% 0%
ESOP 2018 2018 2018 2018 2017 2017 2017
WAEP NUMBER NUMBER WAEP
SHARE OPTIONS NUMBER
PERFORMANCE RIGHTS NUMBER
SHARE OPTIONS
PERFORMANCE RIGHTS
SHARE OPTIONS NUMBER
PERFORMANCE RIGHTS
NUMBER
SHARE OPTIONS
`000 `000 $ $ `000 `000 $
Outstanding at the beginning of the year
18,431 155 0.94 - 14,475 0.41
Granted during the year under APT ESOP 1
5,438 - 5.05 - 2,047 155 2.34
Granted during the year under US ESOP
6,992 - 0.25 - - - -
Forfeited during the year (147) (12) 2.28 - (100) 1.00
Exercised during the year (808) (108) 2.82 - (87) 1.72
Issued at merger - - - - 2,096 3.11
Outstanding at the end of the year 29,906 35 1.58 - 18,431 155 0.94
Exercisable at the end of the year 11,718 - 0.90 - 6,482 50 0.83
1. Options granted do not include 2m Loan Shares to be granted to the Group Head which is still subject to approval from shareholders. Although such approval has not yet been received, these Loan Shares have been included in the Share-Based Payments Expense for the time that the Group Head was employed in that capacity, based on a fair value estimate, utilising the year end share price. The actual fair value will be determined upon shareholder approval when the loan shares are officially granted and any fair value adjustments will be recognised at that time.
14. KEY MANAGEMENT PERSONNELCOMPENSATION OF KEY MANAGEMENT PERSONNEL
CONSOLIDATED AFTERPAY
2018 2017
$ $
Short-term employee benefits
2,656,938 2,089,097
Post employment benefits
137,992 191,918
Other long-term benefits
7,984 7,875
Termination benefits - 93,750
Share-based payment (non-cash)
12,358,437 1,115,887
Total compensation 15,161,351 3,498,527
15. EARNINGS PER SHARE (EPS)Basic EPS amounts are calculated by dividing
the loss for the year attributable to ordinary
equity holders of the Parent by the weighted
average number of ordinary shares outstanding
during the year.
Diluted EPS amounts are calculated by dividing
the loss attributable to ordinary equity holders of
the Parent by the sum of the weighted average
number of ordinary shares outstanding during
the year and the weighted average number
of ordinary shares that would be issued on
conversion of all the dilutive potential ordinary
shares into ordinary shares.
The following reflects the income and
share data used in the basic and diluted
EPS computations:58

NOTES TO THE FINANCIAL STATEMENTS • EARNINGS PER SHARE (CONTINUED)
CONSOLIDATED AFTERPAY
2018 2017
$’000 $’000
Loss attributable to ordinary equity holders of the Parent for basic earnings
(9,021) (9,620)
’000 ’000
NUMBER NUMBER
Weighted average number of ordinary shares for basic EPS
214,551 175,463
Effect of dilution from:
Share options 16,487 6,482
Weighted average number of ordinary shares adjusted for the effect of dilution
231,038 181,945
There have been no other transactions involving
ordinary shares or potential ordinary shares
between the reporting date and the date of
authorisation of these financial statements.
16. CONTRIBUTED EQUITY AND RESERVES
A ORDINARY SHARES
CONSOLIDATED CONSOLIDATED
2018 2017
$’000 $’000
Issued and fully paid 192,628 171,411
B MOVEMENT IN ORDINARY SHARES ON ISSUE
’000 ’000
NUMBER $
At 1 July 2016 165,000 41,507
Share issue 15,000 36,000
Share options exercised
87 150
Acquisition of a subsidiary
32,322 94,848
Share issue expenses (net of tax)
- (1,094)
At 30 June 2017 212,409 171,411
Shares issued 2,880 18,700
Share options exercised
916 2,720
Share issue expenses (net of tax)
- (203)
At 30 June 2018 216,205 192,628
C CAPITAL MANAGEMENT
When managing capital, management’s objective is
to ensure the entity continues as a going concern, as
well as to provide optimal returns to shareholders and
benefits for other stakeholders. The Group constantly
reviews the capital structure and the level of return
on assets.
S I GN I F I C ANT A C C O UNT IN G P O L I C I E S
CONTRIBUTED EQUITY
Ordinary shares are classified as equity. Incremental
costs directly attributable to the issue of new shares or
options are shown in equity as a deduction, net of tax,
from the proceeds.
17. RELATED PARTY DISCLOSUREULTIMATE CONTROLLING ENTITY
The ultimate controlling entity is Afterpay Touch Group
Limited, otherwise described as the parent company.
SUBSIDIARIES
The consolidated financial statements include
the financial statements of Afterpay Touch Group
Limited and its subsidiaries. These are listed in the
following table:
COUNTRY OF INCORPORATION
% EQUITY INTEREST
Afterpay Pty Ltd* Australia 100%
Afterpay Holdings Limited*
Australia 100%
Afterpay Warehouse Trust
Australia 100%
Afterpay Touch Group No.2 Pty Ltd*
Australia 100% INCOR-PORATED IN THE PERIOD
Afterpay US Inc. United States
100% INCOR-PORATED IN THE PERIOD
Afterpay NZ Limited
New Zealand
100% INCOR-PORATED IN THE PERIOD
Touchcorp Ltd* Bermuda 100%
Touch Holdings Pty Ltd*
Australia 100%
Touch Networks Australia Pty Ltd*
Australia 100%
Touch Australia Pty Ltd*
Australia 100%
Touch Networks Pty Ltd*
Australia 100%
Touchcorp Singapore Pte Ltd
Singapore 100%
Touch Networks Payments (Malaysia) Sdn Bhd
Malaysia 100%
*Refer to Note 19 for further information on the parties to a deed
of cross guarantee
59

NOTES TO THE FINANCIAL STATEMENTS • RELATED PARTY DISCLOSURE (CONTINUED)
During the year, payment relating to consulting
services totalling $5,000 were made by the
Group companies to Finarch Pty Ltd, a related
entity of David Hancock. This payment related to
the outstanding balance from the 2017 financial
year prior to David Hancock assuming the role of
Group Head.
Dana Stalder joined the Board during the year
as part of the US$15m investment from Matrix
Partners, a venture capital firm of which Dana
Stalder is a General Partner.
18. INFORMATION RELATING TO AFTERPAY TOUCH GROUP LIMITED(THE PARENT)
2018 2017
$’000 $’000
Current assets 67,285 -
Non-current assets 160,778 160,778
Total assets 228,063 160,778
Current liabilities (6,011) (384)
Non-current liabilities (49,492) -
Total liabilities (55,503) (384)
Net assets 172,560 160,394
Issued capital 181,927 160,778
Reserves 11,198 128
Accumulated losses (20,565) (512)
Total equity 172,560 160,394
Loss of the parent entity (20,053) (384)
Total comprehensive loss of the Parent entity
(20,053) (384)
19. DEED OF CROSS GUARANTEEThe subsidiaries identified with the following
symbol “*” in Note 17 “Related Party Disclosure”
are parties to a deed of cross guarantee under
which each guarantees the debts of the others.
By entering into the Deed, the wholly owned
entities have been relieved from the requirement
to prepare a financial report and Directors’
report under ASIC Corporations (Wholly-owned
Companies) Instruments 2016/785.
These subsidiaries and Afterpay Touch Group
Limited together referred to as the “Closed
Group”, originally entered the Deed on 29
November 2017. The effect of the Deed is that
each party to it has guaranteed to pay any
deficiency in the event of the winding up of
any of the entities in the Closed Group. The
Consolidated Statement of Financial Position of
the entities which are members of the Closed
Group is as follows:
CONSOLIDATED
2018
$’000
Assets
Current assets
Cash and cash equivalents 18,957
Receivables 227,093
Other current assets 17,093
Total current assets 263,143
Non-current assets
Property, plant and equipment 3,902
Intangible assets 30,766
Deferred tax asset 13,795
Other non-current assets 875
Total non-current assets 49,338
Total assets 312,481
Liabilities
Current liabilities
Trade and other payables 39,546
Employee benefit provision 1,785
Unearned income 252
Interest bearing liability 50
Income tax payable 1,481
Total current liabilities 43,114
Non-current liabilities
Employee benefit provision 157
Related party borrowing 64,118
Interest bearing liability 49,833
Lease fit out 365
Total non-current liabilities 114,473
Total liabilities 157,587
Net assets 154,894
Equity
Contributed equity 166,264
Accumulated losses (25,862)
Reserves 14,492
Total equity 154,894
DEED OF CROSS GUARANTEE CONSOLIDATED
$’000
Consolidated statement of Comprehensive Income
Profit before income tax 2,708
Income tax expense (4,332)
Loss after income tax (1,624)
As the Deed was entered during the current financial
year, a reconciliation of open retained earnings to
closing balance has not been presented for the
current reporting period.
At 30 June 2018, the Consolidated Statement of
Financial Position reflected an excess of current
assets over current liabilities of $220.0m. The
Directors are not aware of any uncertainties relating
to events or conditions that may cast significant
doubt upon the Group’s ability to continue as a
going concern at 30 June 2018.60

NOTES TO THE FINANCIAL STATEMENTS (CONTINUED)
20. COMMITMENTS AND CONTINGENCIESOPERATING LEASE COMMITMENTS – GROUP AS LESSEE
The Group has entered into commercial
leases for its registered offices in Melbourne
and Sydney. The lease for Singapore office
was terminated in August 2017. The Group
has also entered into leases for a data centre
and associated communication costs, and an
agreement of the supply of terminals. There
are no restrictions placed upon the lessee by
entering into this lease. Future minimum rentals
payable under the non-cancellable operating
lease are as follows:
2018 2017
$’000 $’000
Within one year 1,864 1,285
After one year but not more than five years
3,174 3,473
Total minimum lease payments
5,038 4,758
LEGAL COMMITMENTS AND CLAIMS
Claims can be raised by customers and suppliers
against the Group in the ordinary course of
business. There were no outstanding claims at
30 June 2018 which required recognition of a
provision or contingent liability.
BANK GUARANTEES
The Group has entered into a bank guarantee
arrangement totalling $2.2m of which $2.0m has
been cross guaranteed as part of a consolidated
sub-agency agreement. The remaining
guarantee is part of the Group’s normal
business operations.
S I GN I F I C ANT A C C O UNT IN G P O L I C I E S
LEASES
The determination of whether an arrangement
is or contains a lease is based on the substance
of the arrangement and requires an assessment
of whether the fulfilment of the arrangement is
dependent on the use of the specific asset and
the arrangement conveys a right to use the asset.
GROUP AS A LESSEE
Operating lease payments are recognised as
an expense in the consolidated statement of
comprehensive income on a straight-line basis
over the lease term.
Finance leases are recognised as a lease
asset and lease liability in the consolidated
statement of financial position, calculated at the
present value of the minimum lease payment
at inception of the lease. Depreciation of the lease
asset is recognised on a straight-line basis through the
consolidated statement of comprehensive income.
A proportion of the lease payment is assigned as a
finance charge in the statement of comprehensive
income with the remainder allocated as a reduction
in the lease liability in the consolidated statement of
financial position.
21. AUDITOR’S REMUNERATION
CONSOLIDATED AFTERPAY
2018 2017
$ $
Amounts received or due and receivable by Ernst & Young (Australia) for:
• An audit or review of the financial report of the entity and any other entity in the consolidated Group
371,145 253,610
• Other services in relation to the entity and any other entity in the consolidated Group
159,208 180,500
- Accounting assistance for new accounting standards implementation
130,000 -
- Due diligence in relation to the Merger with Touchcorp
- 147,000
- Tax compliance, grant assistance & planning
- 33,500
- Other non-audit services 29,208 -
Total auditor's remuneration 530,353 434,110
22. EVENTS AFTER THE BALANCE SHEET DATE
CLEARPAY
Subsequent to 30 June 2018, the Group entered
into a Share Purchase Agreement (SPA) to acquire
ClearPay Finance Limited (ClearPay), an entity 100%
owned by ThinkSmart Limited (ThinkSmart). ClearPay
is a U.K. based payments company through which
customers can purchase items up to £450 in value
and make repayments in three interest-free monthly
instalments. The acquisition completed on 23 August
2018, however ThinkSmart will continue to operate the
business for a period of approximately 90 days from
the completion date.
Under the SPA, the Group will acquire 90% of the
issued shares in ClearPay for total consideration of 1m
APT shares. The Group also has an option to acquire
the remaining shares held by ThinkSmart, exercisable
any time after 5 years from completion based on
agreed valuation principles. The consideration for
the remaining 10% can either be paid in cash or APT
shares.
61

NOTES TO THE FINANCIAL STATEMENTS • EVENTS AFTER THE BALANCE SHEET DATE (CONTINUED)
CAPITAL MANAGEMENT
The receivables financing facility limit provided
by NAB was reduced from $350m to $300m
on 15 August 2018 to reflect the cash proceeds
from the $50m senior unsecured notes issued
by the Group in April 2018.
On 22 August 2018, the Group incorporated
Citi as an additional lender into the existing
NAB Australian warehouse receivables facility,
providing an additional $200m of funding
capacity. This increased the total facility limit to
fund Australian originated receivables to $500m.
The Group is undertaking a fully underwritten
Institutional Placement to eligible investors,
to raise at least $108.1m to fund Afterpay’s
international expansion strategy.
Pricing will be determined via an institutional
bookbuild, with an underwritten floor price of
$15.75 per share. The underwritten floor price
represents a 9.9% discount to the 5 day VWAP
to close of trade on 22 August 2018. New
shares issued under the Placement will rank
equally with the Group’s existing shares.
Other than noted above, no other matter or
circumstance has occurred subsequent to
period end that has significantly affected, or
may significantly affect, the operations of the
Group, the results of those operations or the
state of affairs of the Group or economic entity in
subsequent financial years.
23. OTHER SIGNIFICANT ACCOUNTING POLICIES
NEW AC CO UNT IN G ST AND A R DS AND INT ER P R E T A T I ONS
The following standards and interpretations which
are considered relevant to the Group have been
issued and amended by the AASB but are not yet
effective for the period ending 30 June 2018.
SUMMARY
A A S B 9 F IN AN C I A L INSTR UMENTS
AASB 9 (December 2014) replaces AASB
139 Financial instruments: Recognition and Measurement. This new version supersedes
those previously issued. The incurred loss model
in AASB 139 has been replaced with a single,
forward-looking ‘expected loss’ impairment
model under AASB 9. This results generally in
the recognition of impairment earlier than was
previously required under AASB 139.
AASB 9 requires the Group to recognise
expected credit losses on financial assets
measured at amortised cost or fair value
through other comprehensive income, with the
exception for investments in equity instruments, and
contract assets arising under AASB 15 Revenue from Contracts with Customers’ on the following bases:
• 12-month expected credit losses which result from
default events on a financial instrument that are
possible within 12 months after the reporting date; or
• if there is a significant increase in credit risk from
initial recognition, then lifetime expected credit
losses which result from all possible default events
over the expected life of a financial instrument.
Lifetime expected credit loss measurement applies
to Receivables and contract assets generated under
AASB 15, without a significant financing component,
due to the simplicity and short-term nature of these
financial assets.
APPLICATION DATE OF STANDARD
1-Jan-18
IMPACT ON GROUP FINANCIAL REPORT
The Group will adopt AASB 9 on 1 July 2018 and will
not restate comparative information. During the period,
the Group has performed an impact assessment of
AASB 9, This assessment which is based on currently
available information and may be subject to changes
arising from further reasonable and supportable
information being made available to the Group in 2019
when the Group will adopt AASB 9.
The adoption of AASB 9 impacts the Group’s
receivable balance which is measured at amortised
cost. Lifetime expected credit loss measurement
applies to the Group’s receivables. This is due to the
short contractual term of the portfolio with a maximum
of 56 days, with the current average weighted
duration to recoup end-customer payment being
approximately 30 days.
Late fee income from consumers is currently
recognised as ‘Other Income’ by the Group. The
current treatement of recognising late fees when they
are expected to be recovered will continue.
Based on the Group’s current assessment, a reduction
in the opening retained earnings balance of $2.9m
(no profit and loss impact) for the adoption of AASB 9
is expected. This is due to the recognition of a higher
credit loss allowance on contractual cash flows,
including late fees, due to the Group.
Applying AASB 9 on a consistent basis by adjusting
the opening position as at 1 July 2017 and including the
credit losses for the financial year ending 30 June 2018,
would result in bad and doubtful debts expense being
higher by $1.6m and net receivables being lower by
$2.9m at 30 June 2018.
APPLICATION DATE FOR GROUP
1-Jul-18
62

NOTES TO THE FINANCIAL STATEMENTS • OTHER SIGNIFICANT ACCOUNTING POLICIES (CONTINUED)
SUMMARY
A A S B 15 R EVENU E FROM CONTR A C TS WIT H C USTOMERS
AASB 15 – Revenue from contracts with customers
was issued by the AASB in December 2014 and
replaces all revenue recognition requirements,
including those as set out in AASB 118 -
Revenue. The new standard attempts to remove
inconsistencies and weaknesses in existing
revenue recognition frameworks, improve
comparability across entities, and simplify financial
statement preparation by streamlining and
reducing the volume of guidance.
The standard contains a single model that
applies to all revenue arising from contracts.
AASB 15 introduces a single principles-based
five step model for recognising revenue and
introduces the concept of recognising revenue
when an obligation to a customer is satisfied.
Application of AASB 15 is expected to have
varying levels of impact across the Group’s two
segments - Afterpay and Pay Now. Afterpay
generates revenue from end consumers
ordering goods and services from merchants
integrated on the Afterpay platform. The Pay Now
business generates revenue through transaction
processing and professional services with specific
performance obligations.
AASB 15 requires the Group to apply the standard
in accordance with other applicable accounting
standards, specifically, AASB 9. Regarding
Afterpay, revenue recognised from the merchant
is collected through the consumer receivable and
is a financial asset, as it is a contract to receive
cash flows. On initial assessment, the Group has
determined that a portion of merchant revenue
must initially be recognised under AASB 9 –
Financial Instruments. AASB 9 states that after initial
recognition, entities shall classify financial assets
at amortised cost using the effective interest
method (EIR). The EIR is the rate that exactly
discounts estimated future cash receipts through
the expected life of the financial asset or financial
liability to the gross carrying amount of a financial
asset.
APPLICATION DATE OF STANDARD
1-Jan-18
IMPACT ON GROUP FINANCIAL REPORT
The Group will adopt AASB 15 and AASB 9 on
1 July 2018 and will not restate comparative
information. During the period, the Group has
performed an impact assessment of AASB 15 and
AASB 9. This assessment is based on currently
available information and may be subject to
changes arising from further reasonable and
supportable information being made available
to the Group in the 2019 financial year when the
Group will adopt the new standards.
The adoption of AASB 9 impacts the Afterpay customer
receivable balance which is measured at amortised
cost. Under AASB 9, merchant revenue is to be
recognised over the life of the associated consumer
receivable. With the current average weighted
duration to recoup end-customer payment being
approximately 30 days, the Group will defer revenue
over the average time it takes for the collection of the
receivable to occur. Based on the Group’s current
assessment, deferring the entire merchant fee on an
effective interest basis results in a reduction in opening
retained earnings of $4.9m for the recognition and
adoption of AASB 9, this is in addition to the adjustment
for provisioning of $2.9m noted above. A deferral
of merchant fee revenue in this manner is a timing
difference only and does not affect the receipt in cash
when an order is processed.
The Group is still finalising its analysis of the potential
impacts to the Pay Now segment. Evaluation to
date has focused primarily on Pay Now’s transaction
processing revenue as this accounts for the majority
of the segment’s revenue. To date, no material
measurement differences or opening retained
earnings differences have been identified between
AASB 118, the current revenue recognition standard,
and AASB 15.
APPLICATION DATE FOR GROUP
1-Jul-18
SUMMARY
A A S B 1 6 L E AS ES
In February 2016, AASB issued AASB 16 ‘Leases’, which
replaces the current guidance in AASB 117 ‘Leases’.
The new standard significantly changes accounting
for lessees requiring recognition of all leases on the
balance sheet, including those currently accounted
for as operating leases. A lessee will recognise
liabilities reflecting future lease payments and ‘right-
of-use assets’, initially measured at a present value
of unavoidable lease payments. Depreciation of
leased assets and interest on lease liabilities will be
recognised over the lease term.
AASB 16 substantially carries forward the lessor
accounting requirements in AASB 117. Accordingly, a
lessor continues to classify its leases and account for
them as operating leases or finance leases.
There is an optional exemption for certain short-term
leases and leases of low-value assets; however, this
exemption can only be applied by lessees.
APPLICATION DATE OF STANDARD
1-Jan-19
IMPACT ON GROUP FINANCIAL REPORT
The Group has assessed the impact of the adoption of
AASB 16, which is not expected to result in a material
impact to the Group’s financial report.
APPLICATION DATE FOR GROUP
1-Jul-19
63

DIRECTORS’ DECLARATION
In accordance with a resolution of the Directors of Afterpay Touch
Group Limited, I state that:
In the opinion of the Directors:
a. The financial statements and notes of Afterpay Touch Group
Limited for the year ended 30 June 2018 are in accordance with
the Corporations Act 2001, including:
(i) Giving a true and fair view of its financial position as at 30 June
2018 and of the Group’s performance for the year ended on
that date; and
(ii) Complying with Accounting standards (including the Australian
Accounting Interpretations) and Corporations Regulations 2001.
b. There are reasonable grounds to believe that the Group will
be able to pay its debts as and when they become due and
payable;
c. The remuneration disclosures set out in the Directors’ report
comply with Accounting Standards AASB 124 Related Party Disclosures and the Corporations Regulations 2001; and
d. The financial statements and notes also comply with
International Financial Reporting Standards as disclosed in the
financial statements.
The Directors have been given the declarations by the Group
Head required by section 295A of the Corporations Act 2001.
On behalf of the Board.
Anthony Eisen
Executive Director Melbourne 23 August 2018
64

AFTERPAYTOUCH FY18 ANNUAL REPORT • FINANCIAL STATEMENTS
A member firm of Ernst & Young Global Limited Liability limited by a scheme approved under Professional Standards Legislation
8 Exhibition Street Melbourne VIC 3000 Australia GPO Box 67 Melbourne VIC 3001
Tel: +61 3 9288 8000 Fax: +61 3 8650 7777 ey.com/au
INDEPENDENT AUDITOR’S REPORT
To the Shareholders of Afterpay Touch Group Limited
Report on the Audit of the Financial Report
Opinion
We have audited the financial report of Afterpay Touch Group Limited (the Company) and its subsidiaries (collectively the Group), which comprises the consolidated statement of financial position as at 30 June 2018, the consolidated statement of comprehensive income, the consolidated statement of changes in equity and the consolidated statement of cash flows for the year then ended, notes to the financial statements, including a summary of significant accounting policies, and the directors’ declaration.
In our opinion, the accompanying financial report of the Group is in accordance with the Corporations Act 2001, including:
(i) giving a true and fair view of the consolidated financial position of the Group as at 30 June 2018 and of its consolidated financial performance for the year ended on that date; and
(ii) complying with Australian Accounting Standards and the Corporations Regulations 2001.
Basis for Opinion We conducted our audit in accordance with Australian Auditing Standards. Our responsibilities under those standards are further described in the Auditor’s Responsibilities for the Audit of the Financial Report section of our report. We are independent of the Group in accordance with the auditor independence requirements of the Corporations Act 2001 and the ethical requirements of the Accounting Professional and Ethical Standards Board’s APES110 Code of Ethics for Professional Accountants (the Code) that are relevant to our audit of the financial report in Australia. We have also fulfilled our other ethical responsibilities in accordance with the Code.
We believe that the audit evidence we have obtained is sufficient and appropriate to provide a basis for our opinion.
Key Audit Matters
Key audit matters are those matters that, in our professional judgment, were of most significance in our audit of the financial report of the current year. These matters were addressed in the context of our audit of the financial report as a whole, and in forming our opinion thereon, but we do not provide a separate opinion on these matters. For each matter below, our description of how our audit addressed the matter is provided in that context.
We have fulfilled the responsibilities described in the Auditor’s Responsibilities for the Audit of the Financial Report section of our report, including in relation to these matters. Accordingly, our audit included the performance of procedures designed to respond to our assessment of the risks of material misstatement of the financial report. The results of our audit procedures, including the procedures performed to address the matters below, provide the basis for our audit opinion on the accompanying financial report.
INDEPENDENT AUDITOR’S REPORT
65

AFTERPAYTOUCH FY18 ANNUAL REPORT • FINANCIAL STATEMENTS
A member firm of Ernst & Young Global LimitedLiability limited by a scheme approved under Professional Standards Legislation
Merger transaction
Why significant How our audit addressed the key audit matter
On 19 June 2017 the merger of Touchcorp Limited and Afterpay Holdings Limited was completed. The transaction was accounted for asan acquisition of Touchcorp Limited by AfterpayHoldings Limited.
There was judgment involved in determining thetransaction purchase price, the fair value of netassets acquired, the acquirer and the acquisitiondate.
Due to the significance of the transaction and themagnitude of the goodwill arising from theacquisition of $23.6 million, this was considered akey audit matter.
Accounting for the acquisition of TouchcorpLimited is final and is disclosed in Note 4 of thefinancial report.
Our audit procedures included the following: ► Assessed the terms and conditions of the merger
agreement, as well as agreeing key terms to underlying evidence including contracts, Scheme booklets and final shareholder votes.
► Examined the Group’s determination and valuation of the assets acquired and liabilities assumed. We considered whether there were any other identifiable intangible assets acquired by using our knowledge of the industry and assessing the terms of the acquisition agreements.
► Assessed the competence, qualifications and objectivity of the experts engaged by the Group to assist with the identification and valuation of assets acquired.
► Assessed the key assumptions and valuation methodology used by the Group considering external market data, which involved the input of our valuation specialists.
► Assessed the adequacy of the Group’s disclosures in the financial report in respect of the merger.
Doubtful debts provision
Why significant How our audit addressed the key audit matter
The nature of the Group’s business is to assume the credit risk of merchant transactions with consumers.
The model used to calculate the doubtful debt provisions is performed manually using daily payment data and applied to the receivables balance.
Due to the significance and magnitude of receivables and the judgment associated with the doubtful debt provision in determining the recoverability of the amounts outstanding at balance date, this was considered a key audit matter.
The Group’s disclosure for the doubtful debts provision is disclosed in Note 9 of the financial report.
Our audit procedures over the doubtful debt provision and related consolidated statement of comprehensive income expense included the following:
► Assessed and analysed all the key assumptions and methodology applied in the model, including payment and ageing history, and compared these assumptions to the prior periods.
► Tested the integrity of the generation of the debtors ageing reports used in the provisioning process.
► Assessed the adequacy of the provision against the aged balances, particularly on balances that were past due but not impaired.
66

A member firm of Ernst & Young Global Limited Liability limited by a scheme approved under Professional Standards Legislation
Capitalisation of internally generated intangible assets
Why significant How our audit addressed the key audit matter
The Group’s revenue is generated through the processing of transactions with its customers through its internally developed software platforms, disclosed as Core Technology in Note 10 of the financial report. Costs incurred during the year that were capitalised to the Core Technology and Work in Progress totalled $11.5 million. Capitalised development costs was a key audit matter as product development is core to the Company’s operations. This involves judgement to determine whether the costs meet the capitalisation criteria in accordance with Australian Accounting Standards.
Our audit procedures included the following:
► Selected a sample of capitalised costs to determine the nature of the cost and assess whether the project met the capitalisation criteria set out in Australian Accounting Standards.
► Agreed a sample of capitalised employee costs to employee contracts and enquired with the Company regarding the related development activities that were undertaken and determined whether the sample of employees were directly involved in developing software. In addition, we assessed the effectiveness of the Group’s key controls related to payroll processing.
► Assessed the useful life and amortisation rate allocated to capitalised development costs.
► Assessed the consistency of the capitalisation methodology applied by the Company in comparison to prior reporting periods.
► Assessed the adequacy of the disclosures included in Note 10.
Share based payments
Why significant How our audit addressed the key audit matter
The Group has entered into a number of share based payment transactions with employees and consultants.
As disclosed in Note 13 of the financial report, a convertible note was issued to Matrix Partners during the period which the Group determined included a share based payment for unidentifiable services to be provided by Matrix Partners. The valuation of the share based payment also included complexity due to an input into the valuation being the valuation of Afterpay US, Inc. which had not commenced trading.
In addition, share options were issued to a number of employees of Afterpay US, Inc, a subsidiary of the Group. There is judgement required in determining the value of these awards as the issuing entity, Afterpay US, Inc, is a private company. This was considered a key audit matter as there is judgement in determining that the convertible note contained a share based payment, as well as judgement involved in the valuation of Afterpay US, Inc. for both the share based payment for services and employee options.
We assessed the terms of the convertible note with Matrix Partners taking into consideration the requirements of Australian Accounting Standards, to assess whether there was a share based payment element of the convertible note.
The valuation of Afterpay US, Inc. was required at the grant date of the convertible note as well as the grant date for the employee options. The valuation was prepared by an external valuer engaged by the Group. To assess the valuation of Afterpay US, Inc. at both grant dates, we assessed, in conjunction with our valuations specialists:
► the cash flow assumptions in the forecast period; ► the discount rate applied; ► the treatment of working capital in the valuation, given
the significant working capital requirements to fund customer receivables; and
► terminal growth rate and value assumptions.
In conjunction with our Valuations specialists, we assessed the other inputs into the valuation of the share based payments, mainly being the volatility applied. We assessed the vesting terms and period for the recognition of the share based payment expense. We also assessed whether all disclosures required by Australian Accounting Standards had been made and appropriately reflected the agreements and the calculations and estimates made.
67
A member firm of Ernst & Young Global Limited Liability limited by a scheme approved under Professional Standards Legislation
Information Other than the Financial Report and Auditor’s Report Thereon
The Directors are responsible for the other information. The other information comprises the information in the Group’s Annual Report for the year ended 30 June 2018, but does not include the financial report and the auditor’s report thereon.
Our opinion on the financial report does not cover the other information and we do not express any form of assurance conclusion thereon, with the exception of the Remuneration Report and our related assurance opinion.
In connection with our audit of the financial report, our responsibility is to read the other information and, in doing so, consider whether the other information is materially inconsistent with the financial report or our knowledge obtained in the audit or otherwise appears to be materially misstated. If, based upon the work we have performed, we conclude that there is a material misstatement of this other information, we are required to report that fact. We have nothing to report in this regard.
Responsibilities of the Directors for the Financial Report
The Directors of the Company are responsible for the preparation of the financial report that gives a true and fair view in accordance with Australian Accounting Standards and the Corporations Act 2001 and for such internal control as the directors determine is necessary to enable the preparation of the financial report that gives a true and fair view and is free from material misstatement, whether due to fraud or error.
In preparing the financial report, the directors are responsible for assessing the Group’s ability to continue as a going concern, disclosing, as applicable, matters related to going concern and using the going concern basis of accounting unless the directors either intend to liquidate the Group or cease operations, or have no realistic alternative but to do so.
Auditor’s Responsibilities for the Audit of the Financial Report
As part of an audit in accordance with the Australian Auditing Standards, we exercise professional judgment and maintain professional scepticism throughout the audit. We also:
Identify and assess the risks of material misstatement of the financial report, whether due to fraud or error, design and perform audit procedures responsive to those risks, and obtain audit evidence that is sufficient and appropriate to provide a basis for our opinion. The risk of not detecting a material misstatement resulting from fraud is higher than for one resulting from error, as fraud may involve collusion, forgery, intentional omissions, misrepresentations, or the override of internal control.
Obtain an understanding of internal control relevant to the audit in order to design audit procedures that are appropriate in the circumstances, but not for the purpose of expressing an opinion on the effectiveness of the Group’s internal control.
Evaluate the appropriateness of accounting policies used and the reasonableness of accounting estimates and related disclosures made by the directors.
Conclude on the appropriateness of the directors’ use of the going concern basis of accounting and, based on the audit evidence obtained, whether a material uncertainty exists related to events or conditions that may cast significant doubt on the Group’s ability to continue as a going concern. If we conclude that a material uncertainty exists, we are required to draw attention in our auditor’s report to the related disclosures in the financial report or, if such disclosures are inadequate, to modify our opinion. Our conclusions are based on the audit evidence obtained up to the date of our auditor’s report. However, future events or conditions may cause the Group to cease to continue as a going concern.
68
A member firm of Ernst & Young Global Limited Liability limited by a scheme approved under Professional Standards Legislation
Evaluate the overall presentation, structure and content of the financial report, including the disclosures, and whether the financial report represents the underlying transactions and events in a manner that achieves fair presentation.
Obtain sufficient appropriate audit evidence regarding the financial information of the entities or business activities within the Group to express an opinion on the financial report. We are responsible for the direction, supervision and performance of the Group audit. We remain solely responsible for our audit opinion.
We communicate with the directors regarding, among other matters, the planned scope and timing of the audit and significant audit findings, including any significant deficiencies in internal control that we identify during our audit.
We also provide the directors with a statement that we have complied with relevant ethical requirements regarding independence, and to communicate with them all relationships and other matters that may reasonably be thought to bear on our independence, and where applicable, related safeguards.
From the matters communicated to the directors, we determine those matters that were of most significance in the audit of the financial report of the current year and are therefore the key audit matters. We describe these matters in our auditor’s report unless law or regulation precludes public disclosure about the matter or when, in extremely rare circumstances, we determine that a matter should not be communicated in our report because the adverse consequences of doing so would reasonably be expected to outweigh the public interest benefits of such communication.
Report on the Remuneration Report
Opinion on the Remuneration Report
We have audited the Remuneration Report included in pages 21 to 33 of the Directors' Report for the year ended 30 June 2018.
In our opinion, the Remuneration Report of Afterpay Touch Group Limited for the year ended 30 June 2018, complies with section 300A of the Corporations Act 2001.
Responsibilities
The Directors of the Company are responsible for the preparation and presentation of the Remuneration Report in accordance with section 300A of the Corporations Act 2001. Our responsibility is to express an opinion on the Remuneration Report, based on our audit conducted in accordance with Australian Auditing Standards.
Ernst & Young
David McGregor Partner Melbourne 23 August 2018
69

ADDITIONAL SECURITIES EXCHANGE INFORMATION
ADDITIONAL SECURITIES EXCHANGE INFORMATION
In accordance with ASX Listing Rule 4.10, the
Company provides the following information
to shareholders not elsewhere disclosed in
this Annual Report. The information provided is
current as at 21 August 2018 (Reporting Date).
CORPORATE GOVERNANCE STATEMENTThe Company’s Directors and management are
committed to conducting the Group’s business
in an ethical manner and in accordance with
the highest standards of corporate governance.
The Company has adopted and substantially
complies with the ASX Corporate Governance
Principles and Recommendations (Third Edition)
(Recommendations) to the extent appropriate to
the size and nature of the Group’s operations.
The Company has prepared a statement
which sets out the corporate governance
practices that were in operation throughout the
financial year for the Company, identifies any
Recommendations that have not been followed,
and provides reasons for not following such
Recommendations (Corporate Governance
Statement).
In accordance with ASX Listing Rules 4.10.3 and
4.7.4, the Corporate Governance Statement
will be available for review on Afterpay Touch
Group’s website (https://www.afterpaytouch.
com/corporate-governance/) and will be lodged
together with an Appendix 4G with ASX at the
same time that this Annual Report is lodged with
ASX.
The Appendix 4G will particularise each
Recommendation that needs to be reported
against by Afterpay Touch Group, and will provide
shareholders with information as to where
relevant governance disclosures can be found.
The Company’s corporate governance policies
and charters are all available on Afterpay Touch
Group’s website (https://www.afterpaytouch.
com/corporate-governance/).
SUBSTANTIAL HOLDERSAs at the Reporting Date, the names of the
substantial holders of the Company and the
number of equity securities in which those
substantial holders and their associates have
a relevant interest, as disclosed in substantial
holding notices given to the Company, are as
follows:
HOLDER OF EQUITY SECURITIES
CLASS OF EQUITY
SECURITIES
NUMBER OF EQUITY
SECURITIES HELD
% OF TOTAL ISSUED
SECURITIES CAPITAL IN RELEVANT
CLASS
Anthony Eisen Ordinary Shares
22,500,000 10.33
Nicholas Molnar
Ordinary Shares
22,500,000 10.33
NUMBER OF HOLDERSAs at the Reporting Date, the number of holders
in each class of equity securities:
CLASS OF EQUITY SECURITIES NUMBER OF HOLDERS
Fully paid ordinary shares 26,121
Fully paid ordinary shares restricted 29
Options to acquire ordinary shares 28
Performance Rights 2
VOTING RIGHTS OF EQUITY SECURITIESThe only class of equity securities on issue in the
Company which carries voting rights is ordinary
shares.
As at the Reporting Date, there were 26,121
holders of a total of 217,776,619 ordinary shares of
the Company. 70

ADDITIONAL SECURITIES EXCHANGE INFORMATION • VOTING RIGHTS OF EQUITY SECURITIES (CONTINUED)
At a general meeting of the Company, every holder of ordinary shares
present in person or by proxy, attorney or representative has one vote on a
show of hands and on a poll, one vote for each ordinary share held. On a poll,
every member (or his or her proxy, attorney or representative) is entitled to
vote for each fully paid share held and in respect of each partly paid share, is
entitled to a fraction of a vote equivalent to the proportion which the amount
paid up (not credited) on that partly paid share bears to the total amounts
paid and payable (excluding amounts credited) on that share. Amounts paid
in advance of a call are ignored when calculating the proportion.
DISTRIBUTION OF HOLDERS OF EQUITY SECURITIESThe distribution of holders of equity securities on issue in the Company as at
the Reporting Date is as follows:
DISTRIBUTION OF ORDINARY SHAREHOLDERS
HOLDINGS RANGES HOLDERS TOTAL UNITS %
1 – 1,000 15,979 6,071,362 2.79
1,001 – 5,000 7,630 18,195,037 8.35
5,001 – 10,000 1,361 10,261,699 4.71
10,001 – 100,000 1,058 27,053,705 12.42
100,001 – 999,999,999 93 156,194,816 71.72
Totals 26,121 217,776,619 100
LESS THAN MARKETABLE PARCELS OF ORDINARY SHARES (UMP SHARES)The number of holders of less than a marketable parcel of ordinary shares
based on the closing market price at the Reporting Date is as follows:
TOTAL SHARES UMP SHARES
UMP HOLDERS
% OF ISSUED SHARES HELD BY UMP HOLDERS
HOLDERS OF $2.30 OPTIONS EXPIRING 31 DEC 2020
217,776,619 613 138 0.000003 -
TWENTY LARGEST SHAREHOLDERSThe Company only has one class of quoted securities, being ordinary shares.
The names of the 20 largest holders of ordinary shares, and the number of
ordinary shares and percentage of capital held by each holder is as follows:
RANK HOLDER NAME BALANCE AS AT REPORTING
DATE
%
1 J P MORGAN NOMINEES AUSTRALIA LIMITED 25,214,915 11.58
2 HSBC CUSTODY NOMINEES (AUSTRALIA) LIMITED 23,220,857 10.66
3 ANTHONY MATHEW EISEN 22,500,000 10.33
4 NICHOLAS MOLNAR PTY LTD <NICHOLAS DAVID FAMILY A/C> 22,500,000 10.33
71

ADDITIONAL SECURITIES EXCHANGE INFORMATION • TWENTY LARGEST SHAREHOLDERS (CONTINUED)
RANK HOLDER NAME BALANCE AS AT REPORTING
DATE
%
5 ATC CAPITAL PTY LTD 9,984,000 4.58
6 CITICORP NOMINEES PTY LIMITED 5,552,737 2.55
7 NATIONAL NOMINEES LIMITED 5,206,297 2.39
8 ESTATE LATE ADRIAN CLEEVE 3,200,001 1.47
9 NETWEALTH INVESTMENTS LIMITED <WRAP SERVICES A/C> 2,776,777 1.28
10 MATRIX PARTNERS X L P 2,717,394 1.25
11 UBS NOMINEES PTY LTD 2,242,545 1.03
12 BNP PARIBAS NOMINEES PTY LTD <IB AU NOMS RETAILCLIENT DRP> 2,208,977 1.01
13 FIFTY SECOND CELEBRATION PTY LTD <MCBAIN FAMILY A/C> 2,000,000 0.92
14 HSBC CUSTODY NOMINEES (AUSTRALIA) LIMITED <NT-COMNWLTH SUPER CORP A/C>
1,603,856 0.74
15 FIONA KATE HANCOCK 1,500,000 0.69
16 BNP PARIBAS NOMINEES PTY LTD <AGENCY LENDING DRP A/C> 1,387,214 0.64
17 MR MICHAEL LESLIE JEFFERIES 1,280,000 0.59
18 BNP PARIBAS NOMS PTY LTD <DRP> 1,135,386 0.52
19 HSBC CUSTODY NOMINEES (AUSTRALIA) LIMITED - A/C 2 1,115,656 0.51
20 CLEEVECORP PTY LTD 1,000,450 0.46
Total number of shares of Top 20 Holders 138,347,062 63.53
Total Remaining Holders Balance 79,429,557 36.47
ESCROW
CLASS OF RESTRICTED SECURITIES
TYPE OF RESTRICTION NUMBER OF SECURITIES
END DATE OF ESCROW PERIOD
Ordinary shares Voluntary escrow 250,000 18-Oct-19
Ordinary shares Voluntary escrow 1,440,213 16-Jan-21
Ordinary shares Voluntary escrow 1,440,213 16-Jan-25
Ordinary shares Voluntary escrow 1,138,400 On APT’s instructions
UNQUOTED EQUITY SECURITIESThe number of each class of unquoted equity securities on issue, and the
number of holders in each such class, are as follows:
CLASS OF EQUITY SECURITIES NUMBER OF UNQUOTED EQUITY
SECURITIES
NUMBER OF HOLDERS
Options to acquire ordinary shares 17,345,000 28
Performance Rights 35,000 2
No person holds 20% or more of any class of Unquoted Equity Securities on
issue.
COMPANY SECRETARYThe Company’s secretary is Ms Sophie Karzis.
72
ADDITIONAL SECURITIES EXCHANGE INFORMATION (CONTINUED)
REGISTERED OFFICEThe address and telephone number of the Company’s registered office is:
Level 5, 406 Collins Street
Melbourne VIC 3000
Telephone: +61 1300 100 729
SHARE REGISTRYThe address and telephone number of the Company’s share registry,
Computershare Investor Services, are:
STREET ADDRESS:
Yarra Falls
452 Johnson Street
Abbotsford Victoria 3067
Telephone: 1300 137 328
STOCK EXCHANGE LISTINGThe Company’s ordinary shares are quoted on the Australian Securities
Exchange (ASX). The Company was admitted to the official list of the ASX on
29 June 2017 (ASX issuer code: APT).
OTHER INFORMATIONThe Company is not currently conducting an on-market buy-back.
There are no issues of securities approved for the purposes of item 7 of
section 611 of the Corporations Act which have not yet been completed.
No securities were purchased on-market during the reporting period under
or for the purposes of an employee incentive scheme or to satisfy the
entitlements of the holders of options or other rights to acquire securities
granted under an employee incentive scheme.
73

CORPORATE INFORMATIONAFTERPAY TOUCH GROUP LIMITED
ABN 618 280 649
BOARD OF DIRECTORS
Anthony Eisen (Executive Chairman)
Nicholas Molnar (Executive Director and CEO of Afterpay)
Dana Stalder (Independent Non-Executive Director)
David Hancock (Executive Director and Afterpay Touch Group Head)
Elana Rubin (Independent Non-Executive Director)
Clifford Rosenberg (Independent Non-Executive Director)
AUDITOR
Ernst & Young
Ernst & Young Building
8 Exhibition Street
Melbourne VIC 3000
SHARE REGISTRY
Computershare Investor Services
Yarra Falls
452 Johnston Street
Abbotsford Victoria 3067
Phone: 1300 137 328
STOCK EXCHANGE LISTING
Afterpay Touch Group Limited shares are listed on the Australian Securities Exchange
AUSTRALIAN REGISTERED OFFICE
Level 5, 406 Collins Street
Melbourne VIC 3000 Australia
COMPANY SECRETARY
Sophie Karzis
Boardroom Limited
Level 7, 333 Collins Street
Melbourne VIC 3000
Phone: +61 3 9286 7500
SOLICITORS
Baker & McKenzie
Level 19, CBW
181 William Street
Melbourne Vic 3000

75