Embed Size (px)
Citation preview

After the Reboot: The State of Computing
Education in UK Schools and Colleges
Final Report
September 2017
Pye Tait Consulting
Royal House, 110 Station Parade, Harrogate, HG1 1EP
Tel: 01423 509433
Fax: 01423 509502
Email: [email protected]
Website: www.pyetait.com
Cert No: QEC19593371/0/Q

Understanding Computing Education in the UK
May 2017 Page 2
Contents
Figures ........................................................................................................................................ 4
Tables ......................................................................................................................................... 5
Acknowledgements .................................................................................................................... 6
Executive Summary .................................................................................................................... 7
1. Introduction ......................................................................................................................... 16
1.1 Rebooting Computing Education ................................................................................... 16
1.2 Computing Curricula in the UK ....................................................................................... 18
1.3 Informing Future Support .............................................................................................. 20
1.4 Research Objectives and Approach ............................................................................... 21
2. Computing-Related Qualifications ....................................................................................... 24
2.1 NPD Data (England Only)................................................................................................ 24
2.2 Survey Data (England, Wales and Northern Ireland) ..................................................... 25
2.3 Chapter Summary........................................................................................................... 26
3. Teaching Expertise ............................................................................................................... 28
3.1 Understanding and Favourability ................................................................................... 28
3.2 Confidence...................................................................................................................... 40
3.3 Qualifications, Experience and CPD ............................................................................... 48
3.4 Chapter Summary........................................................................................................... 60
4. Teaching and Assessment Approaches ................................................................................ 62
4.1 Pedagogy ........................................................................................................................ 62
4.2 Cross-Curricular Links ..................................................................................................... 63
4.3 Access to Teaching Support ........................................................................................... 64
4.4 Assessment ..................................................................................................................... 71
4.5 Chapter Summary........................................................................................................... 72
5. The Learning Environment ................................................................................................... 74
5.1 Timetabled Hours ........................................................................................................... 74
5.2 Specialist and Non-Specialist Teachers .......................................................................... 74
5.3 Investment ..................................................................................................................... 77

Understanding Computing Education in the UK
May 2017 Page 3
5.4 Physical Capacity ............................................................................................................ 80
5.5 Extra-Curricular Computing Activities ............................................................................ 84
5.6 Chapter Summary........................................................................................................... 86
6. Widening Access .................................................................................................................. 88
6.1 Girls in Computing .......................................................................................................... 88
6.2 Improving Access for All ................................................................................................. 89
6.3 Chapter Summary........................................................................................................... 91
7. Key Findings ......................................................................................................................... 92
Appendices ............................................................................................................................... 96
A1 Sampling and Methodology ............................................................................................ 96
A2 Survey Respondent Profile .............................................................................................. 99
A3 NPD Data Table ............................................................................................................. 103
A4 Reference Guide to School Ages and Years .................................................................. 105
A5 Statistical Tests .............................................................................................................. 106
Understanding Computing Education in the UK
May 2017 Page 4
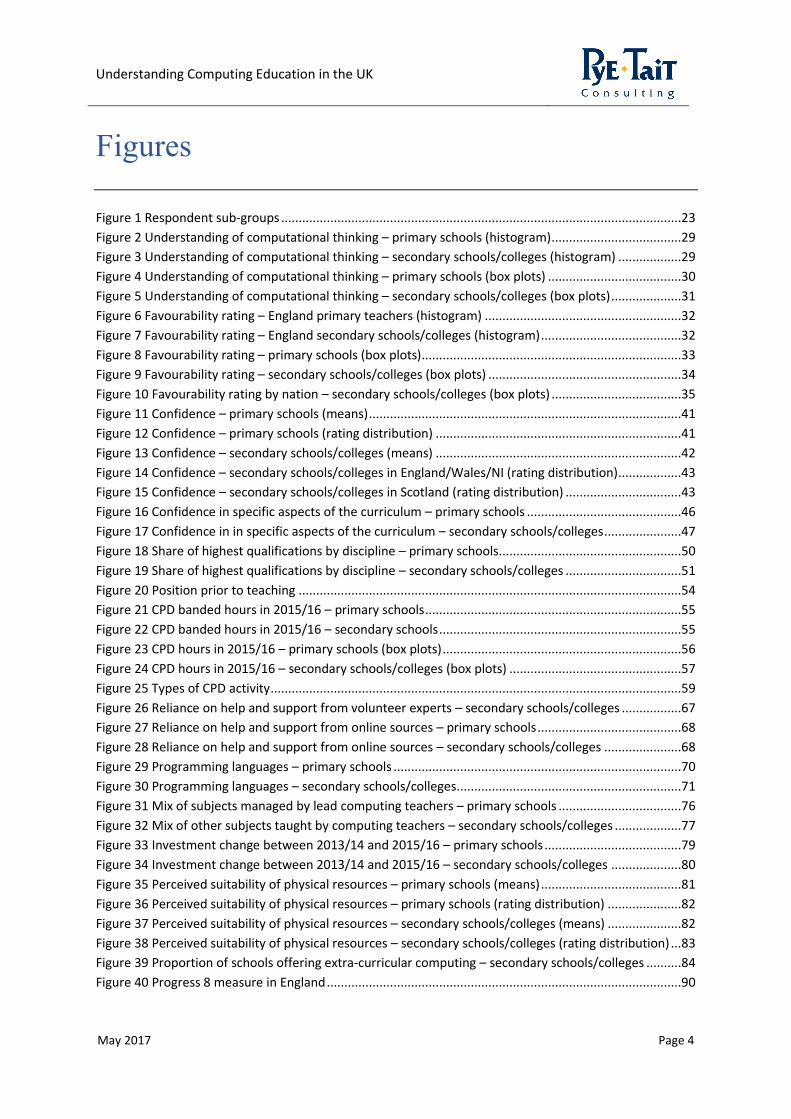
Figures
Figure 1 Respondent sub-groups ..................................................................................................................23
Figure 2 Understanding of computational thinking – primary schools (histogram) .....................................29
Figure 3 Understanding of computational thinking – secondary schools/colleges (histogram) ..................29
Figure 4 Understanding of computational thinking – primary schools (box plots) ......................................30
Figure 5 Understanding of computational thinking – secondary schools/colleges (box plots) ....................31
Figure 6 Favourability rating – England primary teachers (histogram) ........................................................32
Figure 7 Favourability rating – England secondary schools/colleges (histogram) ........................................32
Figure 8 Favourability rating – primary schools (box plots) ..........................................................................33
Figure 9 Favourability rating – secondary schools/colleges (box plots) .......................................................34
Figure 10 Favourability rating by nation – secondary schools/colleges (box plots) .....................................35
Figure 11 Confidence – primary schools (means) .........................................................................................41
Figure 12 Confidence – primary schools (rating distribution) ......................................................................41
Figure 13 Confidence – secondary schools/colleges (means) ......................................................................42
Figure 14 Confidence – secondary schools/colleges in England/Wales/NI (rating distribution) ..................43
Figure 15 Confidence – secondary schools/colleges in Scotland (rating distribution) .................................43
Figure 16 Confidence in specific aspects of the curriculum – primary schools ............................................46
Figure 17 Confidence in in specific aspects of the curriculum – secondary schools/colleges ......................47
Figure 18 Share of highest qualifications by discipline – primary schools ....................................................50
Figure 19 Share of highest qualifications by discipline – secondary schools/colleges .................................51
Figure 20 Position prior to teaching .............................................................................................................54
Figure 21 CPD banded hours in 2015/16 – primary schools .........................................................................55
Figure 22 CPD banded hours in 2015/16 – secondary schools .....................................................................55
Figure 23 CPD hours in 2015/16 – primary schools (box plots) ....................................................................56
Figure 24 CPD hours in 2015/16 – secondary schools/colleges (box plots) .................................................57
Figure 25 Types of CPD activity .....................................................................................................................59
Figure 26 Reliance on help and support from volunteer experts – secondary schools/colleges .................67
Figure 27 Reliance on help and support from online sources – primary schools .........................................68
Figure 28 Reliance on help and support from online sources – secondary schools/colleges ......................68
Figure 29 Programming languages – primary schools ..................................................................................70
Figure 30 Programming languages – secondary schools/colleges ................................................................71
Figure 31 Mix of subjects managed by lead computing teachers – primary schools ...................................76
Figure 32 Mix of other subjects taught by computing teachers – secondary schools/colleges ...................77
Figure 33 Investment change between 2013/14 and 2015/16 – primary schools .......................................79
Figure 34 Investment change between 2013/14 and 2015/16 – secondary schools/colleges ....................80
Figure 35 Perceived suitability of physical resources – primary schools (means) ........................................81
Figure 36 Perceived suitability of physical resources – primary schools (rating distribution) .....................82
Figure 37 Perceived suitability of physical resources – secondary schools/colleges (means) .....................82
Figure 38 Perceived suitability of physical resources – secondary schools/colleges (rating distribution) ...83
Figure 39 Proportion of schools offering extra-curricular computing – secondary schools/colleges ..........84
Figure 40 Progress 8 measure in England .....................................................................................................90

Understanding Computing Education in the UK
May 2017 Page 5
Tables
Table 1 Teacher profiles – definitions and typical characteristics ........................................................ 13
Table 2 Total survey responses ............................................................................................................. 22
Table 3 Computing-related qualifications and student entries (summary NPD data for surveyed
schools) ................................................................................................................................................. 25
Table 4 Computing-related qualifications and total student entries (surveyed schools) ..................... 25
Table 5 Understanding and favourability (primary schools in England) ............................................... 37
Table 6 Understanding and favourability (secondary schools/colleges in England) ............................ 38
Table 7 Teacher profiles – definitions ................................................................................................... 39
Table 8 Confidence – primary schools (by respondent category) ........................................................ 42
Table 9 Confidence – secondary schools/colleges (by respondent category) ...................................... 44
Table 10 Share of highest qualification disciplines by nation ............................................................... 52
Table 11 Share of highest qualification disciplines by teacher profile ................................................. 53
Table 12 CAS Engagement by teacher profiles ..................................................................................... 59
Table 13 Most beneficial supporting organisations and resources – primary schools ......................... 65
Table 14 Most beneficial supporting organisations and resources – secondary schools ..................... 66
Table 15 Online groups and forums that schools find most useful ...................................................... 69
Table 16 Average FTE staff per school with at least some responsibility for computing education .... 75
Table 17 Average computing budgets (£) – secondary......................................................................... 78
Table 18 Frequency of extra-curricular computing activities – primary schools .................................. 85
Table 19 Frequency of extra-curricular computing activities – secondary schools/colleges ............... 85
Table 20 Sampling – primary schools.................................................................................................... 96
Table 21 Sampling – secondary schools/colleges ................................................................................. 97
Table 22 Nation ..................................................................................................................................... 99
Table 23 Job Role ................................................................................................................................ 100
Table 24 Subject of Highest Qualification (Teachers) ......................................................................... 100
Table 25 CAS Engagement Status ....................................................................................................... 100
Table 26 Length of time teaching ....................................................................................................... 100
Table 27 Mode of Employment .......................................................................................................... 100
Table 28 Region of England ................................................................................................................. 101
Table 29 School Type (England) - Primary schools ............................................................................. 101
Table 30 School Type (England) - Secondary schools/colleges ........................................................... 102
Table 31 Computing-related qualifications and student entries (full NPD data for surveyed schools)
............................................................................................................................................................ 103
Table 32 School key stages, levels and years (UK) .............................................................................. 105

Understanding Computing Education in the UK
May 2017 Page 6
Acknowledgements
Pye Tait Consulting would like to thank all primary and secondary schools/colleges that responded to
the online survey questionnaire, those teachers who gave of their time to attend one of eight small
discussion groups, as well as schools that hosted case study visits. Your time and input to the
research has been extremely valuable and is very much appreciated.
In addition we would like to thank The Royal Society and all members of the Computing Education
Project Advisory Group for their help and support, particularly in promoting the online survey as
widely as possible through their networks.
We are also grateful to Dan Toms MBCS, Computing at School (CAS) Master Teacher and expert
technical Associate to Pye Tait Consulting for this project.

Understanding Computing Education in the UK
May 2017 Page 7
Executive Summary
Background
The Royal Society’s 2012 report, ‘Shut down or restart?’, concluded that computing education in
many UK schools was unsatisfactory, due to a lack of specialist teachers, a broadly interpreted
curriculum, lack of Continuing Professional Development (CPD) and inadequate infrastructure1. In
the same year, the then Education Secretary, Michael Gove, announced the withdrawal of ICT in
favour of a radical new computing curriculum for 5-16 year olds in England. The new curriculum,
introduced in September 2014, established computer science and computational thinking2 as a core
subject alongside others such as English, mathematics and the sciences.
In 2016, almost two years on from the introduction of the new curriculum in England, The Royal
Society launched a UK-wide programme of work to gather evidence about the state of computing
education. This took into account devolved educational policy and the separate curriculum
arrangements in each of the four nations. The three-package programme of work incorporated a
literature review to examine effective computing pedagogy and assessment methods, a quantitative
and qualitative study of computing practice in schools (the subject of this research), and, thirdly, a
review of attainment data. Collectively the evidence will inform the next stage of the programme,
which, looking forward from 2017, intends to develop fresh support for schools and colleges.
The Royal Society commissioned Pye Tait Consulting to undertake research into computing practice
in UK schools and colleges, involving an online survey run concurrently with eight small discussion
groups, followed by eight case study school visits. The research spanned four main areas:
• Participation, profile and attainment of students in computing education;
• Teacher expertise, including the profile and background of computing teachers, their
knowledge, confidence and participation in Continuing Professional Development (CPD);
• The learning environment, including how computing is coordinated and resourced, and the
use of external support; and
• Widening access, including steps taken by schools to increase participation among girls and
other groups of students who might otherwise experience difficulties engaging with the
subject.
The online survey obtained 341 responses from primary school teachers (329 unique schools) and
604 responses from secondary school/college teachers (562 unique institutions) across the UK.
Whilst every effort was taken to deliver a representative sample, the self-completion nature of this
1 The Royal Society (2012) Shutdown or restart? – The way forward for computing in UK schools 2 Computational thinking involves taking a complex problem and breaking it down into a series of smaller parts. Simple steps or rules (algorithms) are then created to solve each part. Finally, these algorithms are used to program a computer to help solve the complex problem in the best way.
Understanding Computing Education in the UK
May 2017 Page 8
large-scale quantitative survey mean that it has not been possible to eliminate the risk of bias,
particularly towards those who have stronger understanding and favourability towards the
computing curriculum. This is discussed in more detail in Appendix A1.3.
Summary of Research Findings
The following findings are based on the views of surveyed teachers.
Main benefits of computing education as perceived by surveyed teachers:
✓ Underpins the UK’s future growth in a fast-paced and evolving digital sector. ✓ Teaches valuable and transferrable problem-solving skills through computational thinking. ✓ Provides creative teaching opportunities through a range of resources which can be
accessed free or at relatively low cost. ✓ Offers cross-curricular links, e.g. ‘debugging’ sentence structures in English and helping to
tackle and break down maths problems. ✓ Pupils can learn while having fun, such as through national coding competitions and
school robotics clubs, and teachers can also learn and develop from the students themselves.
✓ Creates additional opportunities for links with industry, such as through work experience.

Understanding Computing Education in the UK
May 2017 Page 9
Primary Schools – Key facts from the survey
The Learning Environment The majority of responding primary schools (84%) have a designated lead teacher of computing education. In most surveyed schools, pupils receive 1 hour of computing education per week. There are disparities between schools as to whether levels of investment in computing (£ and time) have increased/decreased/stayed the same over the past three years. Suitability of school equipment and other physical resources for computing is rated on average at 6.7 out of 10. A full range of scores were received in the survey, from 1 ‘poor’ to 10 ‘excellent’). Extra-curricular (informal) computing activities are offered by 62% of surveyed schools, with the most common being weekly computing clubs. The most helpful reported resources include CAS Barefoot, Scratch and Rising Stars.
Teaching Expertise
52% of surveyed teachers rated their understanding of computational thinking with a score of at least 8 out of 10. Scores were received from across the spectrum from 1 ‘no understanding’ to 10 ‘complete and full understanding’. Ratings are significantly higher among those teachers who hold their highest qualification in computer science, compared to those qualified in another discipline. 65% rated their favourability towards the new computing curriculum with a score of at least 8 out of 10. Again scores were received from across the range from 1 ’not at all favourable’ to 10 ‘completely favourable’. 7% of responding primary teachers hold their highest qualification in computer science. The most commonly reported number of computing-related CPD hours is zero (28% of respondents). A variety of CPD-related activities were reported and are discussed in the main report.

Understanding Computing Education in the UK
May 2017 Page 10
Secondary Schools – Key Facts from the Survey
The Learning Environment The majority of responding secondary schools (88%) have a department that specifically teaches computing education. The remainder teach computing as part of another faculty, most commonly combined with business studies, technology or maths. Non-specialist teachers of computing are drawn from a range of other subject backgrounds, most commonly business studies, maths and design & technology. In most surveyed schools, students receive 1 hour of computing education at Key Stage 3 (England/Wales) and 1 hour at levels S1/S2 (Scotland). Most surveyed secondary schools have experienced a decrease in the level of investment in computing (£ and time) over the past three years. Suitability of school equipment and other physical resources for computing is rated 6.9 out of 10. A full range of scores were received, from 1 ‘poor’ to 10 ‘excellent’). At least some form of extra-curricular computing activity is offered by 77% of responding schools, with the most common being weekly computing clubs.
Teaching Expertise
75% of surveyed teachers rated their understanding of computational thinking with a score of at least 8 out of 10. Scores were received from across the spectrum from 1 ‘no understanding’ to 10 ‘complete and full understanding’. As is the case among primary schools, ratings are significantly higher among those teachers who hold their highest qualification in computer science, compared to those qualified in another discipline. 38% rated their favourability towards the new computing curriculum with a score of at least 8 out of 10. Again scores were received from across the range from 1 ’not at all favourable’ to 10 ‘completely favourable’. 36% of responding secondary teachers hold their highest qualification in computer science. The most commonly reported number of computing-related CPD hours is zero (26% of respondents) and almost all CPD is undertaken in teachers’ own time. A variety of CPD-related activities were reported and are discussed in the main report.
Widening Access
Encouraging girls’ interest in computing is perceived by teachers to be easier in primary schools, and that more pronounced gender stereotypes are formed during secondary years, which can be harder to overcome.
Teachers find that some less able students struggle with computational thinking, but the experimental aspects of the subject, where making mistakes is part of the process, help to make computing unique and appealing for students.

Understanding Computing Education in the UK
May 2017 Page 11
Top 10 obstacles faced by teachers Each of the following obstacles was mentioned by a minority of research participants (i.e. across the
survey, discussion groups and case studies) but they are ranked below from most to least cited.
1. Subject knowledge: Whilst just over half of surveyed primary teachers and three quarters of
secondary teachers rated their own understanding of computational thinking with a score of at
least 8 out of 10, a lack of subject-specific technical knowledge (e.g. coding and programming)
was the single most commonly reported barrier mentioned by respondents in the wider context
of their school, including colleagues responsible for teaching at least some aspect of the subject.
2. CPD: Some teachers say that they don’t have enough time in their working day for computing-
related professional development and that other commitments, such as marking and lesson
planning, already place high demands on their time out of school hours.
3. Teaching resources: There are reported difficulties being able to identify and select good quality
resources covering teaching materials and content.
4. Funding: Some schools have insufficient funding to acquire the types of equipment and software
needed to deliver the curriculum effectively.
5. Curriculum focus: There is concern among some teachers that the new computing curriculum in
England focuses too strongly on computer science at the expense of ICT, which is still considered
important for students to develop skills that are vital for life and work (such as keyboard and
spreadsheet skills). This concern is exacerbated by the withdrawal of GCSE and A level
qualifications in ICT (with final awards for these subjects taking place in summer 2018).
6. Senior leaders: A lack of buy-in to computing among senior school leaders can have a knock-on
impact on funding, resourcing and access to high quality CPD.
7. Performance benchmarks: Lack of clarity around performance benchmarks for GCSE and A level
Computer Science qualifications is making it difficult for schools to measure students’ progress
and make grade predictions.
8. GCSE and A level specifications: There is a view that GCSE and A level Computer Science
specifications contain too much content.
9. Mixed abilities: Being able to support mixed ability students in one class can prove a challenge,
i.e. stretching the most able and not alienating less able students for whom computational
thinking could prove extremely difficult.

Understanding Computing Education in the UK
May 2017 Page 12
10. Inconsistencies: Two case study schools and several focus group participants described
disparities in the abilities of students starting in the first year of secondary school, which they
put down to variations in the level of computing education among feeder primary schools.
Top 10 support needs of teachers
Each of the following support needs are ranked from most to least cited, and in some cases were
mentioned by research participants in the wider context of their school and their colleagues, i.e. to
strengthen overall capacity and capability.
1. More training, such as face-to-face workshops and seminars, where teachers (particularly non-
specialists), can develop their understanding of computing theory and technical competence in
using equipment and gadgets. This
2. Dedicated time for training and CPD to ensure this is undertaken consistently and effectively
(including re-training of subject teachers without a background in computing but who need to
teach the subject).
3. More specialist expertise to help with computing education in schools, such as recruitment of
suitably qualified and experienced computing teachers, involvement of volunteers, university
students, guest speakers etc.
4. Networking, collaboration and mentoring opportunities in conjunction with other educational
institutions, businesses and relevant bodies, to help develop own knowledge, share ideas and
best practice.
5. Easier access to the right teaching resources (high quality and low cost/free), such as lesson
plans and effective pedagogy.
6. Better equipment for use in schools, such as laptops, netbooks, tablets, and robotics, as well as
suitable learning spaces where students can balance desk-based and computer-based work.
7. More funding for schools to be able to invest in training, teaching resources, infrastructure and
equipment.
8. A higher profile for computing education, particularly to influence senior leadership teams and
parents.
9. Clearer performance and assessment benchmarks from exam boards, including provision of
more and better support and guidance.
10. Curriculum clarity, on how to interpret and meet the requirements of the new computing
curriculum in England.

Understanding Computing Education in the UK
May 2017 Page 13
Teacher Profiles
Based on the survey findings, it has been possible to develop a set of four broad teacher profiles.
These have been defined based on the combination of how teachers rated their ‘understanding of
computational thinking’ (from 1 to 10) in relation to their ‘favourability towards the computing
curriculum’ (also from 1 to 10). The details and typical characteristics of each profile are set out in
Table 1.
Due to the self-selecting nature of the online survey (discussed above and in Appendix A1.3), the
percentage of surveyed teachers captured by each profile is not necessarily representative of the
wider teaching population. Furthermore the profiles should not be considered completely rigid as
some teachers may not fully identify with the characteristics of any one group. Further details about
the formation of the profiles is explained in section 3.1.3.
Table 1 Teacher profiles – definitions and typical characteristics
Profile Definition (based on the combination of ‘understanding’ and ‘favourability’)
Typical characteristics (albeit does not apply to all respondents within each group)
Advocates profile Strong understanding of computational thinking and high favourability towards the computing curriculum. 54% of surveyed teachers
Rating of understanding of computational thinking: At least 7 out of 10 Rating of favourability to the new computing curriculum: At least 7 out of 10
The strongest advocates are generally confident in their ability to deliver the computing curriculum. They tend to hold their highest qualification in computer science (secondary schools), commit the highest number of hours to computing-related CPD, and have engaged in CAS-related CPD. Advocates are likely to be important influencers within and between schools, instrumental to helping supporters to improve their knowledge and understanding, and better engaging critics by helping to strengthen their buy-in.
Supporters profile Comparatively less understanding of computational thinking but high favourability towards the computing curriculum. 8% of surveyed teachers
Rating of understanding of computational thinking: Less than 7 out of 10 Rating of favourability to the new computing curriculum: At least 7 out of 10
Supporters are generally less confident than Advocates and Critics in delivering the computing curriculum. They hold a mix of qualifications and show mixed levels of commitment to computing-related CPD. With additional support from advocates to improve their knowledge and understanding, these teachers have the potential to be advocates of the future.

Understanding Computing Education in the UK
May 2017 Page 14
Critics profile Strong understanding of computational thinking but comparatively low favourability towards the computing curriculum. 24% of surveyed teachers
Rating of understanding of computational thinking: At least 7 out of 10 Rating of favourability to the new computing curriculum: Less than 7 out of 10
Critics are generally less confident than Advocates in delivering the computing curriculum, which may be a causal factor for being comparatively less favourable to the curriculum. They hold a mix of qualifications and show mixed levels of commitment to computing-related CPD. This group is typically well-placed to deliver the new computing curriculum but stronger buy-in is generally needed.
Less Engaged profile Comparatively less understanding of computational thinking and comparatively low favourability towards the computing curriculum. 14% of surveyed teachers
Rating of understanding of computational thinking: Less than 7 out of 10 Rating of favourability to the new computing curriculum: Less than 7 out of 10
Less Engaged teachers are comparatively less confident in delivering the computing curriculum than the other groups. This group mainly consists of teachers who hold their highest level qualification in a discipline unrelated to computing, science or maths. Commitment to computing-related CPD hours is also comparatively lower. This group of teachers may be less likely to take a proactive approach to delivering computing curriculum and more work is needed to encourage buy-in and develop subject knowledge.
Key Findings
Further details underpinning each of the following key findings is provided in section 7, including
signposting to the main evidence in the report.
1. The new computing curriculum in England is generally welcomed by teachers participating in the
research, although schools/colleges appear to be on a long term journey to developing and
delivering effective learning. This is especially the case given that some schools have not yet fully
‘transitioned’ from offering GCSE/A level ICT to equivalent qualifications in Computer Science,
and evidence that the subject is being delivered in some schools by a combination of specialist
and non-specialist teachers.
2. There is evidence of a shortage of suitably skilled and qualified computing teachers, particularly
in secondary schools, with the risk that this situation could worsen in the future if additional
support is not put in place.
3. Teachers believe that the new computing curriculum in England has been introduced with
insufficient guidance around whom would teach the subject and how training, CPD and other
guidance for teachers could take place.

Understanding Computing Education in the UK
May 2017 Page 15
4. Variations in computing budgets and the suitability of physical resources and infrastructure in
schools points to disparities in the opportunities for teaching and learning computing.
5. Following its introduction, some teachers remain concerned the new computing curriculum in
England risks placing too much emphasis on computer science at the expense of ICT and digital
literacy being marginalised.
6. Variations in the abilities of computing students entering secondary school appears to be
affected by current disparities in the level of understanding, favourability and confidence in
computing education among feeder primary schools;
7. Participation in computing education appears to be improving among girls, but some schools are
being more proactive than others in widening access and broadening the appeal of the subject
to different groups of learners;
8. Finally, there are some excellent examples from the discussion groups and case studies of
transferrable best practice from schools that have successfully embedded computing education
to date, including computer science.
Recommendations are not included within this report. These have been developed separately by
The Royal Society based on the findings from all three separately delivered Work Packages.

Understanding Computing Education in the UK
May 2017 Page 16
1. Introduction
1.1 Rebooting Computing Education
For the UK to be a world-leading digital economy that works for everyone, the Government is
committed to everyone having the digital skills they need to fully participate in society3.
Computing underpins almost all aspects of the modern world and many new developments in
science and engineering could not have been realised without it. Some of the UK’s most eminent
stars in this field have included Ada Lovelace, Alan Turing, and more recently Sir Tim Berners-Lee
who is credited as the inventor of the World Wide Web. Today’s UK computer scientists are working
in fields as diverse as high-tech medical applications, cube satellites, GPS farm robotics and
autonomous vehicles. Computing is also fundamental to our national defence, with the need to
ensure the safety and security of cyberspace an essential requirement for the entire digital
economy4.
The ‘digital economy’ alone is complex to define and measure, research carried out by the National
Institute of Economic and Social Research (NIESR) suggests that it comprises 14% of active
companies in the UK. This goes far beyond the likes of dot.com or biotechnology start-ups, but
extends across all corners of industry, from architecture firms, whose activities have become almost
entirely digital, to machine tool manufacturers who now use huge online data-processing facilities to
monitor every aspect of their processes5. Qualifications in computer science therefore have the
potential to underpin today’s digital, and possibly tomorrow’s quantum, society, and to prepare
students for rewarding careers in world-changing innovations.
Computer science largely disappeared from schools in the 1990s and early 2000s in favour of
Information and Communication Technology (ICT), which focused on the ‘use’ of technology and
software rather than its creation and on the underlying principles of computation. But since the late
2000s, a mixture of pressure from industry and lobbying
by interest groups has led to resurgent interest in computer science for developing essential transferable
skills (often referred to as ‘computational thinking’), along with valuable knowledge and skills for a
modern tech-driven world6.
In a speech at the 2012 annual British Educational Training and Technology Show (BETT), the then
Education Secretary, Michael Gove, described computer science as “a rigorous, fascinating and
intellectually challenging subject, requiring a thorough grounding in logic, and merging increasingly
with other scientific fields such as computational biology”. He added that “whilst technologies
3 Department for Culture, Media and Sport (2017) UK Digital Strategy 4 Ibid. 5 NIESR (2013) Measuring the UK’s Digital Economy with Big Data 6 ACM (2013) Restart: The Resurgence of Computer Science in UK Schools

Understanding Computing Education in the UK
May 2017 Page 17
evolve, the foundational concepts and principles that underpin them will still hold true and remain
relevant for students through their working lives”.
In its 2012 report ‘Shut down or restart?’, The Royal Society concluded that existing computing
education7 in many UK schools was unsatisfactory for reasons such as non-specialist teachers, a
broadly interpreted curriculum, lack of Continuing Professional Development (CPD) and inadequate
infrastructure8. Drawing on the findings from ‘Shut down or restart?’, and in association with sector
experts convened by the British Computer Society and the Royal Academy of Engineering, the
Education Secretary announced the withdrawal of ICT in favour of a radical new computing
curriculum for 5-16 year olds in England. The new curriculum established computer science and
computational thinking (explored further in section 3.1) for the first time anywhere, as a core
subject alongside mathematics and the sciences.
The Royal Society is committed to supporting effective teaching of the school and college computing
curricula across the UK (5-18 year olds) Its programme of work to gather and share evidence about
how this is being delivered in practice will lead to the development of support for UK schools and
colleges, which may include:
• Classroom resources, teacher guidance, and CPD programmes;
• Effective assessment tools that teachers can use to understand and guide progress;
• Guidance about how to address gender imbalance in the uptake of computing; and
• Opportunities for project work in schools, perhaps with corporate partners9.
To inform its work, the Society has identified three distinct and complementary components of
computing:
7 From this point forward, the term ‘computing’ or ‘computing education’ is used as a generic term to refer to the curriculum and course offers in each of the devolved nations. 8 The Royal Society (2012) Shutdown or restart? – The way forward for computing in UK schools 9 Source: The Royal Society [online] ‘Computing Education’. Available at: https://royalsociety.org/topics-policy/projects/computing-education/
Computer science
Digital literacy
Information technology
Understanding Computing Education in the UK
May 2017 Page 18
Whilst there is no single accepted ‘definition’ for each component, Computing At School defines
each one as follows:
• Computer science: Covers the scientific and practical study of computation, i.e. what can be
computed, how to compute it, and how computation may be applied to the solution of
problems;
• Information technology: Concerned with how computers and telecommunications
equipment work, and how they may be applied to the storage, retrieval, transmission and
manipulation of data; and
• Digital literacy: The ability to effectively, responsibly, safely and critically navigate, evaluate
and create digital artefacts using a range of digital technologies10.
Further details about how computing education is interpreted in UK education curricula are
explained in the next section.
1.2 Computing Curricula in the UK
Educational policy is devolved in the UK and each of the four UK nations operates its own
curriculum. A summary of current arrangements and recently announced changes to computing
education in each nation is set out below. A supporting matrix of school ages and years (for
reference) can be found in Appendix A4.
10 Computing at School (2014) Computing in the National Curriculum – A Guide for Secondary Teachers

Understanding Computing Education in the UK
May 2017 Page 19
England: New National Curriculum for Computing, introduced from September 2014 The new computing curriculum is non-prescriptive and there are no specified coding languages, software or hardware to use. From age 5, pupils are taught the principles of information and computation and how digital systems work. They go on to learn how to put this knowledge to use through programming. Building on this, pupils are equipped to use information technology to create programs, systems and a range of content. At Key Stage 4 (equivalent to GCSE), all pupils must have “the opportunity” to study aspects of information technology and computer science. As part of a wider programme of qualifications reform, revised AS and A Levels in Computer Science have recently been introduced into schools. GCSE qualifications in ICT have been withdrawn and will no longer be offered from September 2017. Source: Department for Education
Scotland: Curriculum for Excellence – Technologies (refreshed as part of the 2016 Digital Learning and Teaching Strategy for Scotland) The Scottish Government introduced the Curriculum for Excellence in 2010-11. This set out to help children and young people gain the knowledge, skills and attributes needed for the 21st century. The ‘Technologies’ area sets out experiences and outcomes for students in a range of contexts spanning: Business; Computing Science; Food and Textiles; and Craft, Design, Engineering and Graphics As part of the 2016 Digital Learning and Teaching Strategy for Scotland, the Scottish Government has refreshed the experiences and outcomes in the Technologies area of the Curriculum for Excellence. This includes discrete units covering (among others): Digital Literacy; Computer Science; and Technological Developments in Society (including Business Education). Source: The Scottish Government

Understanding Computing Education in the UK
May 2017 Page 20
Wales: The 2008 National Curriculum for Information and Communication Technology (ICT) is due to be replaced by a new Curriculum for Life, including aspects of computer science. The current ICT curriculum in Wales applies to pupils from Key Stage 2 (ages 7-11) to Key Stage 4 (ages 14-16) in maintained schools. Learners develop their ICT skills by finding, developing, creating and presenting information and ideas and by using a wide range of equipment and software. In September 2016, a new Digital Competence Framework was made available for schools and other settings in Wales, making it the responsibility of all teachers and practitioners to include digital competence within lessons. The new Curriculum for Life is expected to be launch from September 2018. This will include six ‘Areas of Learning and Experience’. One of these will (Science and Technology) will include computer science. Source: Welsh Government
Northern Ireland: ‘Using ICT’ is embedded across the Northern Ireland Curriculum Across the Northern Ireland Curriculum in primary and secondary schools, pupils are expected to develop the skills of ‘Using ICT’ by engaging in meaningful research and purposeful activities set in relevant contexts. They should use ICT to handle and communicate information, solve problems, pose questions and take risks. They should process, present and exchange their ideas and translate their thinking into creative outcomes that show an awareness of the audience and purpose. They should also use ICT to collaborate within and beyond the classroom, to share and exchange their work. At a level appropriate to their ability, pupils are expected to develop their ICT skills in five key areas, that is to: Explore; Express; Exchange; Evaluate; and Exhibit. Source: Department of Education (Northern Ireland)
1.3 Informing Future Support
In 2016, The Royal Society launched an important multi-strand programme designed to improve the
quality, scale and effectiveness of computing education in schools and colleges across the UK. This
consisted of three work packages:
1. A literature review of effective computing pedagogy and effective assessment of computing;
2. Quantitative and qualitative research among UK schools and colleges to examine the present
state of computing education in schools; and
3. A baseline study on participation and attainment data.

Understanding Computing Education in the UK
May 2017 Page 21
The programme is rooted in ongoing dialogue with the teaching profession and though partnerships
with expert organisations such as the British Computer Society (BCS), Computing at School (CAS), the
Royal Academy of Engineering and global organisations such as Microsoft and Google.
The resulting evidence base will inform advice about the development of new support for schools
and colleges, such as:
• Classroom resources, teacher guidance, and CPD programmes;
• Effective assessment tools that teachers can use to understand and guide progress;
• Guidance about how to address gender imbalance in the uptake of computing; and
• Opportunities for project work in schools, perhaps with corporate partners.
1.4 Research Objectives and Approach
1.4.1 Research Objectives
The Royal Society commissioned Pye Tait Consulting to lead on work package 2 (see section 1.3) and
this report presents the results of that research. The research spanned four main areas:
• Participation of students in computing, including non-compulsory education (GCSEs and A
levels) and informal (i.e. extra-curricular) activities;
• Teachers and teaching, including the profile and background of computing teachers, their
knowledge, confidence and attitudes relating to computing education (especially the new
curriculum in England), and participation in Continuing Professional Development (CPD);
• The learning environment, including how computing is coordinated and resourced, as well as
the use of external support;
• Widening access, including steps taken by schools to increase participation among girls and
other groups of students who might otherwise experience difficulties engaging with the
subject.
1.4.2 Summary of approach and overview of survey responses
The main research tool was an online survey of UK primary and secondary schools/colleges, aimed at
teachers with at least some responsibility for delivering computing education. The survey was
supplemented by eight small discussion groups among teachers, hosted in various locations across
the UK, as well as eight school case study visits to identify best practice in teaching and learning of
the subject.
Total survey responses (by level and nation) are summarised in Table 2. The survey is broadly

Understanding Computing Education in the UK
May 2017 Page 22
representative by UK nation at secondary level, although this proved more challenging at primary
level. More detail on sampling is set out in Appendix A1 (including Tables 19 and 20).
Whilst every effort has been made to minimise the effect of self-selection bias in the survey (i.e.
where schools more favourable to computing may be more predisposed to complete the survey) this
has inevitably been impossible to avoid. Further details about the steps considered and taken to
minimise this risk are set out in Appendix A1.3.
Table 2 Total survey responses
Nation PRIMARY – Total
responses
PRIMARY – Unique
schools
SECONDARY –
Total responses
SECONDARY –
Unique
schools/colleges
England 297 285 526 490
Scotland 38 37 46 44
Wales 4 4 18 16
Northern Ireland 2 2 14 12
Total 341 329 604 562
1.4.3 Analysis and reporting
The findings within this report describe responses to the online survey, small discussion groups and
case study visits. Different tools are used to achieve this, including computing percentages, averages
and (where appropriate) cross-tabulations by key sub-groups.
The sub-groups derived for the analysis of both primary and secondary school/college survey data
are shown in Figure 1. In addition, certain questions at secondary level have been cross-tabulated by
nation (England/Scotland/Wales/Northern Ireland).
Additionally, for vital topics relating to teaching expertise, statistical testing has been performed to
evaluate possible differences between respondent sub-groups. This means that, in addition to
describing differences found in the sample via percentages and averages, the differences in
distributions have been tested to assess whether they were produced by chance or whether they
represent meaningful differences between the sub-groups.
Footnotes are included throughout this report to indicate where statistical tests have been
performed and the full suite of tests and their results are set out in Appendix A5.

Understanding Computing Education in the UK
May 2017 Page 23
Figure 1 Respondent sub-groups11
In addition to the above categories, analysis of survey responses from England has enabled the
development of a set of four teacher profiles. These are introduced in section 3.1.3 and analysis of
certain findings from that point forward reveal further characteristics about each profile.
Additional information about the survey respondent profile and associated base numbers can be
found in Appendix A2.
11 Computing at School (CAS) is a membership organisation providing professional practice for computing teachers and promoting excellence in computer science education. For the purpose of this research, CAS engaged respondents are those who have undertaken computing-related CPD in at least one of the following areas in 2015/16: CAS toolkits (e.g. Quickstart), CAS Barefoot workshops and CAS Master Teacher training
Group 1:
At least some CAS
Engagement
Undertaken at least
some CAS-related CPD
Not undetaken CAS-related
CPD
Group 2:
Teaching Specialism
Heads and subject
leaders of computing
Other 'non-specialist' teachers
Group 3:
Highest Qualification Held
Computer Science
Other maths/science
discipline
Other (unrelated) discipline
Group 4:
Teaching Experience
< 1 year
1-2 years
3-5 years
6-9 years
10+ years

Understanding Computing Education in the UK
May 2017 Page 24
2. Computing-Related Qualifications
For surveyed secondary schools and colleges, this section sets out the total (and percentage mix) of
student entries to computing-related qualifications in 2015/1612.
Two separate datasets have been used in order to provide as fully rounded a picture as possible. This
is important as each offers different strengths and limitations in the context of this research. In view
of this, the datasets are not directly comparable due to differences in the geographical scope,
qualification listings and approaches to categorisation.
• Section 2.1 draws on qualifications data attained from the National Pupil Database (NPD)13.
It covers qualifications offered at Key Stage 4 and Key Stage 5 but is limited to England only.
• Section 2.2 draws on qualifications data from the survey of secondary schools and colleges
The resulting data are therefore limited to institutions responding to the survey but
coverage is provided of qualifications offered across England, Wales and Northern Ireland14.
It should be noted that the data from the survey only apply to qualifications offered at Key
Stage 4.
2.1 NPD Data (England Only)
Based on data from the National Pupil Database (NPD), schools in England offer a variety of
computing-related qualifications, accredited by a range of awarding organisations.
More than a third of GCSE/AS/A level entries in 2015/16 (36%) were for qualifications in the NPD
category of Computer Appreciation/Introduction. This is followed by just under a quarter (24%) in
the category of ICT and a slightly lower proportion (22%) relating to Computer Studies/Computing
(Table 3).
The data should be read in conjunction with the master table provided in Appendix A3, which
provides a more detailed breakdown of qualifications within each NPD category, along with total
entrants among surveyed schools.
12 Only applicable for those schools that provided a Unique Provider Reference (URN) or post code to enable data matching to take place. 13 NPD data used for this purpose relate to students in Key Stage 4 (GCSE/equivalent) and Key Stage 5 (AS/A level/equivalent), for England only. 14 Students in secondary schools in Scotland follow qualifications that are accredited by the Scottish Qualifications
Authority (SQA). Graded computing-related qualifications include National 5, Advanced and Advanced Higher qualifications in Computing Science. Other, smaller, qualifications, such as National Certificates and National Progression Awards, include a broader range of computing-related titles, such as Cyber Security, Digital Media Animation and Internet Technology to name but a few.

Understanding Computing Education in the UK
May 2017 Page 25
Table 3 Computing-related qualifications and student entries (summary NPD data for surveyed schools)15
NPD qualifications category
Total entries Percentage mix
Computer Appreciation/Introduction 15,860 36%
ICT 10,721 24%
Computer Studies/Computing 9,806 22%
Applied ICT 5,610 13%
Computer Architecture/Systems 1,452 3%
Office Technology 1,158 3%
Systems/Network Management 1 0%
Total 44,607 100%
2.2 Survey Data (England, Wales and Northern Ireland)
This alternative approach to examining computing-related qualification entries for surveyed schools
and colleges uses information gathered from the survey itself and covers England, Wales and
Northern Ireland.
Based on 308 schools/colleges that provided qualifications data, almost all (94%) reported that they
offer more than one computing-related qualification. In 2015/16, the most popular of these was the
OCR GCSE in Computing/Computer Science (8,670 total entries, representing a 29% share). This was
followed by the BCS Level 2 Electronic Computer Driving Licence (6,926 entries /23% share) and the
OCR Level 1/2 Cambridge National Certificate in ICT (2,798 entries /9% share).
A total of 66 surveyed schools (13%) reported entries for GCSE ICT qualifications accredited by the
main awarding organisations covering England, Wales and Northern Ireland (AQA, CIE, CCEA,
Edexcel, OCR and WJEC). Most offered these alongside computer science-based qualifications,
although 24 schools (5% of all those surveyed) reported ICT entries but none for computer science-
based programmes.
The mix of entries is shown in Table 4. For ease of reference, GCSE Computer Science qualifications
are highlighted in yellow and GCSE ICT qualifications are highlighted in green.
Table 4 Computing-related qualifications and total student entries (surveyed schools)16
15 Schools/colleges in England only 2015/16.

Understanding Computing Education in the UK
May 2017 Page 26
Qualification Title Total entries
% mix Qualification Title Total entries
% mix
OCR GCSE Computing/Computer Science 8,670 28.5%
OCR GCSE ICT
122 0.4%
BCS Level 2 ECDL Certificate in IT Application Skills 6,926 22.8%
Microsoft Office Specialist Qualifications
120 0.4%
OCR Level 1/2 Cambridge National Certificate in ICT 2,798 9.2%
OCR Creative iMedia
203 0.7%
AQA GCSE Computer Science 2,649 8.7%
AQA GCSE ICT 116 0.4%
Edexcel GCSE ICT 2,568 8.4%
CIE IGCSE ICT 100 0.3%
Pearson Edexcel Level 1/2 Certificate in Digital Applications 1,432 4.7%
BTEC Extended Diploma in IT
36 0.1%
Edexcel GCSE Computer Science
1,141 3.8%
OCR Cambridge Technical Introductory Diploma in IT 18 0.1%
Pearson BTEC Level 1/2 First Award in Information and Creative Technology 1,064 3.5%
NCFE Creative Studies Interactive Media
17 0.1%
WJEC GCSE Computer Science
616 2.0%
Eduqas GCSE Computer Science 15 0.0%
WJEC GCSE ICT
525 1.7%
Pearson Edexcel Level 1/2 Diploma in Digital Applications 11 0.0%
CCEA GCSE ICT
501 1.6%
City & Guilds Level 2 Certificate for IT Users 3 0.0%
CIE IGCSE Computer Science
359 1.2%
City & Guilds Level 2 Certificate For Software Developers 0 0.0%
TLM Level 2 Certificate in Open Systems Computing (QCF)
197 0.6%
NCFE Level 2 Certificate in Creative Studies: Computer Technology 0 0.0%
AQA Functional Skills ICT 196 0.6%
2.3 Chapter Summary
16 Schools/colleges in England, Wales and Northern Ireland only 2015/16.

Understanding Computing Education in the UK
May 2017 Page 27
Secondary schools/colleges offer a range of computing-related qualifications, including GCSEs and A
levels in computer science and/or ICT, as well as more specialised Awards and Certificates. Among
surveyed schools in England, Wales and Northern Ireland, the OCR GCSE in Computing/Computer
Science is the most popular (accounting for the highest share of students entrants in 2015/16),
followed by the BCS Level 2 Electronic Computer Driving Licence (ECDL) Certificate in IT Application
Skills.
GCSE and A level qualifications in ICT are being phased out in England (final awards for these
qualifications are taking place in summer 2018). At the time of writing, many schools are therefore in
the process of transitioning away from ICT qualifications in favour of Computer Science. It is the
impact of this transition (i.e. an anticipated reduction in the number of GCSE and A level ICT entries
and a rise in the number of equivalent Computer Science entries) that make the findings in
subsequent sections of this report particularly timely and important. This is especially the case in
relation to teachers’ levels of knowledge, favourability and confidence.

Understanding Computing Education in the UK
May 2017 Page 28
3. Teaching Expertise
The survey of schools and colleges explored teaching expertise for computing education in terms of
teachers’ understanding of the subject matter, favourability towards the curriculum, and confidence
in their own abilities to teach to the levels required. Other aspects covered in this section include the
background qualifications and experience of surveyed computing teachers and the amount and
nature of computing–related CPD that was undertaken in 2015/16.
3.1 Understanding and Favourability
3.1.1 Understanding of Computational Thinking
Computational Thinking involves taking a complex problem and breaking it down into a series of
smaller, more manageable parts (decomposition). Each part can then be looked at individually,
considering how similar problems have been solved in the past (pattern recognition), and focusing
only on the important details whilst ignoring irrelevant information (abstraction). Next, simple steps
or rules to solve each of the smaller problems can be designed (algorithms). Finally, these simple
steps or rules are used to program a computer to help solve the complex problem in the best way17.
The new computing curriculum in England (Key Stages 1 to 4) requires students to understand the
principles of computation and analyse problems in computational terms. In Scotland, the revised
Curriculum for Excellence – Technologies (refreshed as part of the 2016 Digital learning and teaching
Strategy for Scotland) requires students to understand the world through computational thinking.
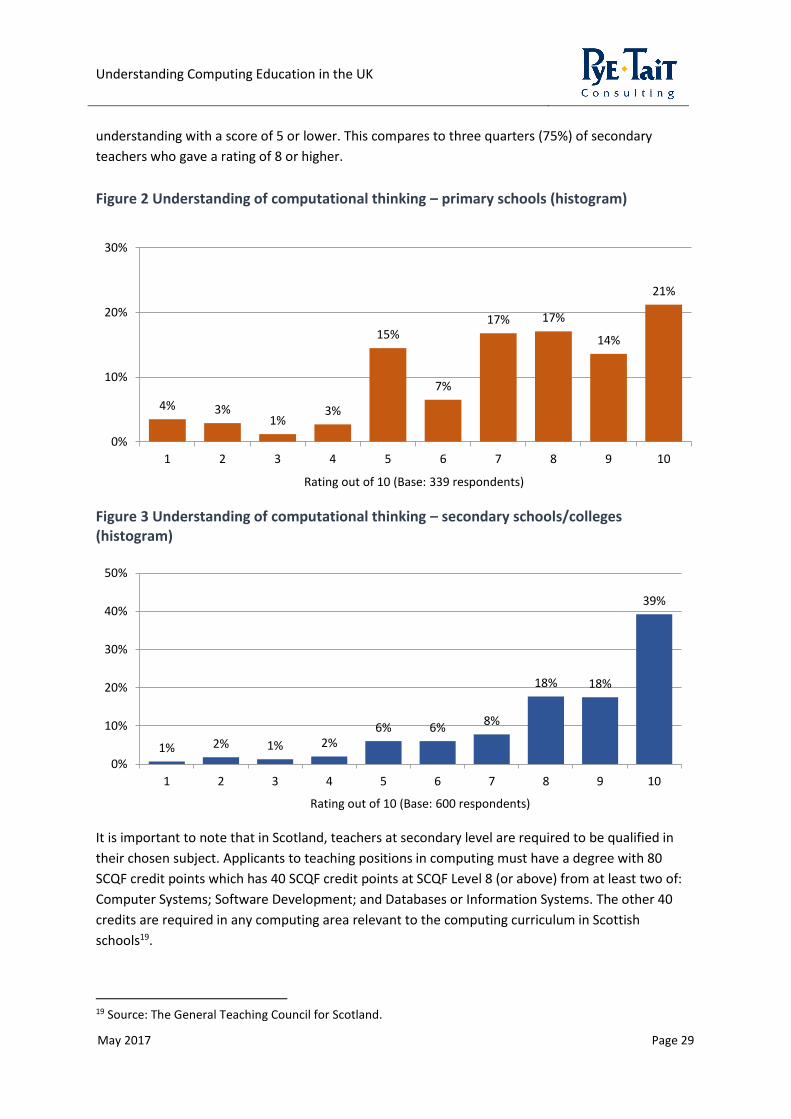
Surveyed schools were asked to rate on a scale from 1 ‘no understanding’ to 10 ‘complete
understanding’, how well they understood this concept (using the above definition) prior to
completing the survey. The results are shown in Figures 2 to 5, comprising.
• Basic histograms showing the distribution of self-reported teacher ratings (Figures 2 and 3);
• Box plots by category of teacher, length of teaching experience and (for secondary
schools/colleges only) by nation (Figures 4 and 5)18.
The observed distribution of ratings among primary teachers is generally mixed, although surveyed
secondary teachers show comparatively stronger levels of understanding. Specifically, more than
half of primary teachers (52%) gave a rating of 8 or higher, although a quarter (25%) rated their
17 Source: BBC Bitesize 18 Base numbers of respondents per category are set out in Appendix A2 and are considerably higher for some compared to others, notably England compared to the devolved nations.
Understanding Computing Education in the UK
May 2017 Page 29
understanding with a score of 5 or lower. This compares to three quarters (75%) of secondary
teachers who gave a rating of 8 or higher.
Figure 2 Understanding of computational thinking – primary schools (histogram)
Figure 3 Understanding of computational thinking – secondary schools/colleges (histogram)
It is important to note that in Scotland, teachers at secondary level are required to be qualified in
their chosen subject. Applicants to teaching positions in computing must have a degree with 80
SCQF credit points which has 40 SCQF credit points at SCQF Level 8 (or above) from at least two of:
Computer Systems; Software Development; and Databases or Information Systems. The other 40
credits are required in any computing area relevant to the computing curriculum in Scottish
schools19.
19 Source: The General Teaching Council for Scotland.
4% 3%1%
3%
15%
7%
17% 17%
14%
21%
0%
10%
20%
30%
1 2 3 4 5 6 7 8 9 10
Rating out of 10 (Base: 339 respondents)
1% 2% 1% 2%6% 6%
8%
18% 18%
39%
0%
10%
20%
30%
40%
50%
1 2 3 4 5 6 7 8 9 10
Rating out of 10 (Base: 600 respondents)

Understanding Computing Education in the UK
May 2017 Page 30
Sub-group analysis using box plots20 reveals that surveyed secondary teachers in Scotland have
comparatively stronger levels of understanding than those in the other UK nations. Additionally,
primary and secondary teachers who hold their highest qualification in Computer Science have a
better understanding of computational thinking than those qualified in another discipline. Statistical
testing points to this being a significant finding. There is also evidence of significance that primary
teachers who have engaged in CAS-related CPD have a better understanding of computational
thinking compared to others21. Among secondary teachers, levels of understanding are generally
consistent between the nations.
Figure 4 Understanding of computational thinking – primary schools (box plots)
20 Key to the box plots: Mean = coloured spots; 1st Quartile and 3rd Quartile = lower and upper limits of the coloured boxes; Median = horizontal line within the coloured boxes; Range = lower and upper limits of the whisker lines. 21 See Appendix A5 for details of the statistical tests, the results of which should be used with care.
0
1
2
3
4
5
6
7
8
9
10
UK HOD/SubjectLead
OtherTeacher
Highest Qual- Computer
Science
Highest Qual- Other
Maths andScience
Highest Qual- All OtherDisciplines
CAS Engaged Non-CASEngaged
Teacher category (X) / Rating out of 10 (Y)
0
1
2
3
4
5
6
7
8
9
10
Less than 1 year 1-2 years 3-5 years 6-9 years 10+ years
Length of teaching experience (X) / Rating out of 10 (Y)

Understanding Computing Education in the UK
May 2017 Page 31
Figure 5 Understanding of computational thinking – secondary schools/colleges (box plots)
0
1
2
3
4
5
6
7
8
9
10
UK England Scotland Wales Northern Ireland
Nation (X) / Rating out of 10 (Y)
0
1
2
3
4
5
6
7
8
9
10
HOD/SubjectLead
Other Teacher Highest Qual -Computer
Science
Highest Qual -Other Mathsand Science
Highest Qual -All Other
Disciplines
CAS Engaged Non-CASEngaged
Teacher category (X) / Rating out of 10 (Y)
0
1
2
3
4
5
6
7
8
9
10
Less than 1 year 1-2 years 3-5 years 6-9 years 10+ years
Length of teaching experience (X) / Rating out of 10 (Y)

Understanding Computing Education in the UK
May 2017 Page 32
3.1.2 Favourability to the Curriculum
Based on a rating scale from 1 ‘not at all favourable’ to 10 ‘completely favourable’, teacher attitudes
towards the new computing curriculum in England are mixed. The observed distribution of ratings
given by secondary schools/colleges is more dispersed than primary schools. Specifically, almost two
thirds of primary teachers (65%) gave a rating of 8 or higher. This compares with just 38% of
secondary teachers. A further 38% of secondary teachers rated their favourability at 5 or below
(Figures 6 and 7).
Figure 6 Favourability rating – England primary teachers (histogram)
Figure 7 Favourability rating – England secondary schools/colleges (histogram)
Perhaps unsurprisingly, the box plots show that surveyed primary and secondary teachers who hold
their highest qualification in Computer Science are comparatively more favourable than those
qualified in a different discipline. This is a statistically significant finding. There is also evidence of
1% 0% 1% 2%
12%
7%
13%
29%
14%
22%
0%
5%
10%
15%
20%
25%
30%
1 2 3 4 5 6 7 8 9 10
Rating out of 10 (Base: 297 respondents)
8%
6% 5% 5%
14%
9%
14%16%
7%
15%
0%
5%
10%
15%
20%
1 2 3 4 5 6 7 8 9 10
Rating out of 10 (Base: 522 respondents)
Understanding Computing Education in the UK
May 2017 Page 33
significance that primary teachers who have engaged in CAS-related CPD are more favourable than
those that have not done so.
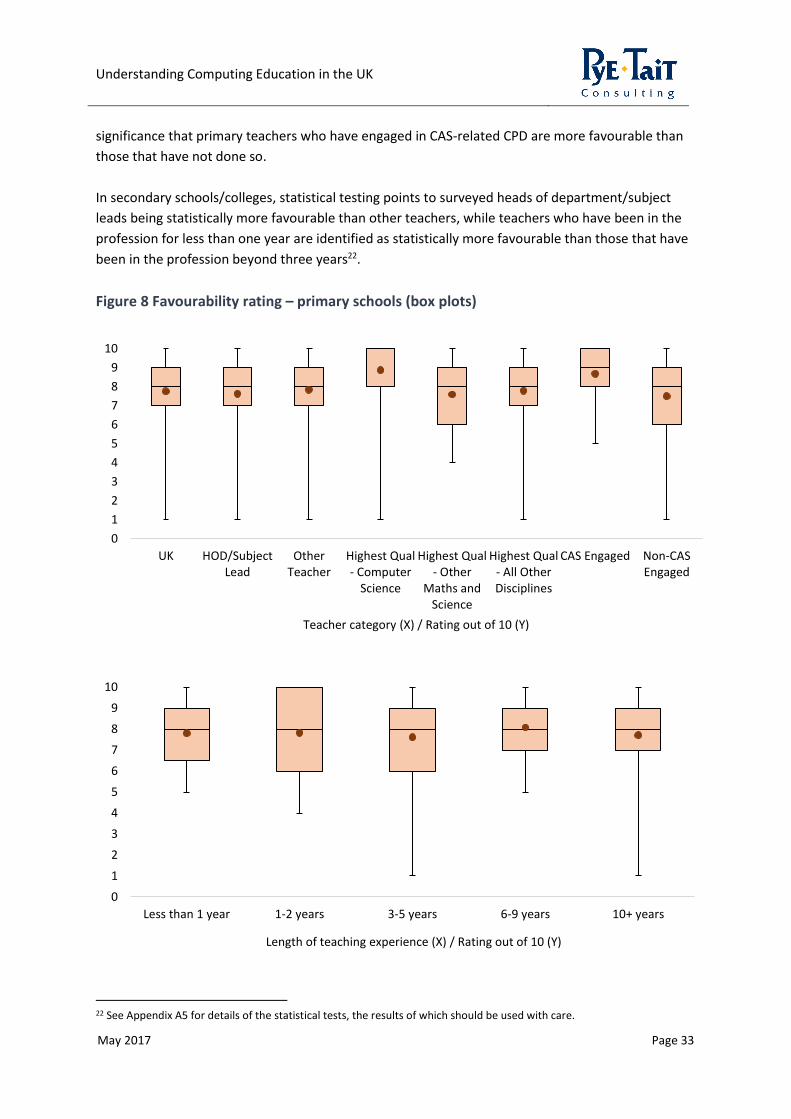
In secondary schools/colleges, statistical testing points to surveyed heads of department/subject
leads being statistically more favourable than other teachers, while teachers who have been in the
profession for less than one year are identified as statistically more favourable than those that have
been in the profession beyond three years22.
Figure 8 Favourability rating – primary schools (box plots)
22 See Appendix A5 for details of the statistical tests, the results of which should be used with care.
0
1
2
3
4
5
6
7
8
9
10
UK HOD/SubjectLead
OtherTeacher
Highest Qual- Computer
Science
Highest Qual- Other
Maths andScience
Highest Qual- All OtherDisciplines
CAS Engaged Non-CASEngaged
Teacher category (X) / Rating out of 10 (Y)
0
1
2
3
4
5
6
7
8
9
10
Less than 1 year 1-2 years 3-5 years 6-9 years 10+ years
Length of teaching experience (X) / Rating out of 10 (Y)

Understanding Computing Education in the UK
May 2017 Page 34
Figure 9 Favourability rating – secondary schools/colleges (box plots)
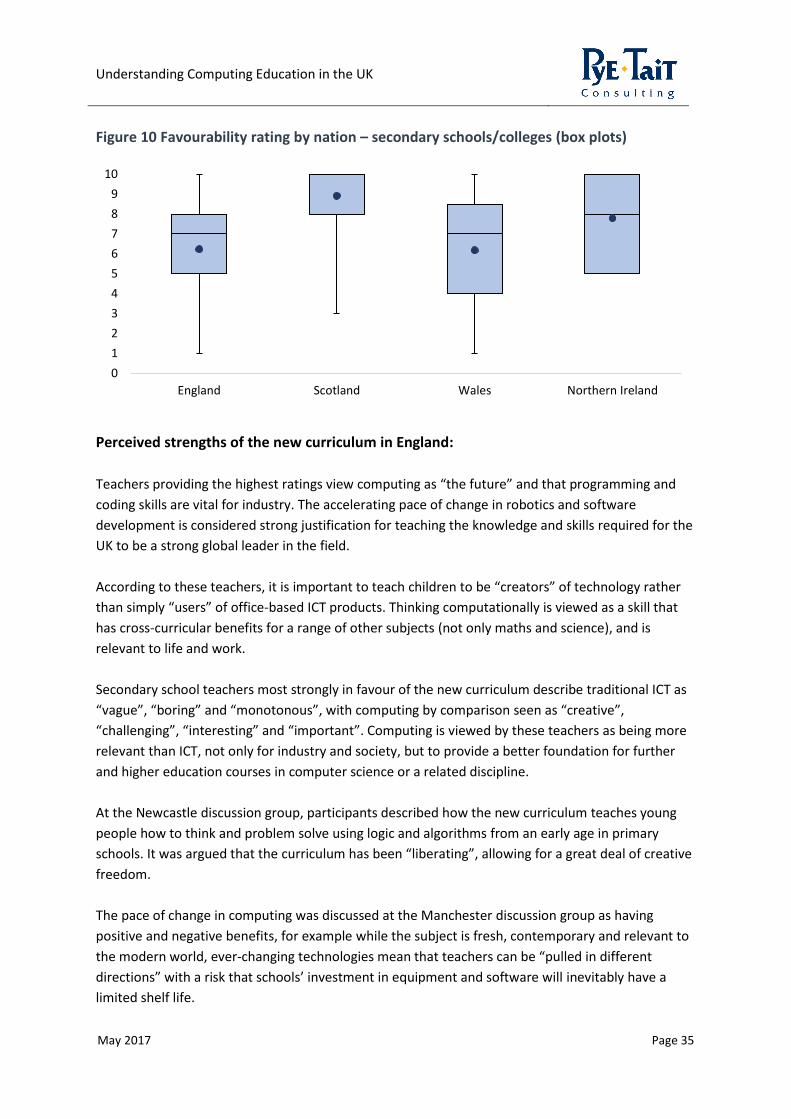
Secondary teachers in the devolved UK nations rated their favourability towards the approach taken
in the new curriculum in England. Teachers in Scotland and Northern Ireland are comparatively more
favourable than those in Wales (the latter being on par with England) – Figure 10.
0
1
2
3
4
5
6
7
8
9
10
HOD/SubjectLead
Other Teacher Highest Qual -Computer
Science
Highest Qual -Other Mathsand Science
Highest Qual -All Other
Disciplines
CAS Engaged Non-CASEngaged
Teacher category (X) / Rating out of 10 (Y)
0
1
2
3
4
5
6
7
8
9
10
Less than 1 year 1-2 year 3-5 years 6-9 years 10+ years
Length of teaching experience (X) / Rating out of 10 (Y)
Understanding Computing Education in the UK
May 2017 Page 35
Figure 10 Favourability rating by nation – secondary schools/colleges (box plots)
Perceived strengths of the new curriculum in England:
Teachers providing the highest ratings view computing as “the future” and that programming and
coding skills are vital for industry. The accelerating pace of change in robotics and software
development is considered strong justification for teaching the knowledge and skills required for the
UK to be a strong global leader in the field.
According to these teachers, it is important to teach children to be “creators” of technology rather
than simply “users” of office-based ICT products. Thinking computationally is viewed as a skill that
has cross-curricular benefits for a range of other subjects (not only maths and science), and is
relevant to life and work.
Secondary school teachers most strongly in favour of the new curriculum describe traditional ICT as
“vague”, “boring” and “monotonous”, with computing by comparison seen as “creative”,
“challenging”, “interesting” and “important”. Computing is viewed by these teachers as being more
relevant than ICT, not only for industry and society, but to provide a better foundation for further
and higher education courses in computer science or a related discipline.
At the Newcastle discussion group, participants described how the new curriculum teaches young
people how to think and problem solve using logic and algorithms from an early age in primary
schools. It was argued that the curriculum has been “liberating”, allowing for a great deal of creative
freedom.
The pace of change in computing was discussed at the Manchester discussion group as having
positive and negative benefits, for example while the subject is fresh, contemporary and relevant to
the modern world, ever-changing technologies mean that teachers can be “pulled in different
directions” with a risk that schools’ investment in equipment and software will inevitably have a
limited shelf life.
0
1
2
3
4
5
6
7
8
9
10
England Scotland Wales Northern Ireland

Understanding Computing Education in the UK
May 2017 Page 36
Several participants in the discussion groups and case studies emphasised the importance of
teachers and pupils “learning together”, which they feel makes the subject unique in that respect.
Where there are students in secondary schools with a strong outside interest in the subject (in one
case study school, two A level students were involved in developing their own mobile apps) this
presents opportunities for those students to help in various ways, such as running lunchtime clubs or
supporting younger year groups. This two-way learning approach was described as invaluable for
teachers, especially non-specialists, in overcoming the “fear factor” associated with computing. The
challenge here, as mentioned in the Cardiff discussion group, is when teachers feel intimidated by
students for being less tech-savvy, as this can have a knock-on effect on teacher confidence.
“Computer science is a rigorous academic discipline and underpins the majority of today's science
and technology (and more)… The skills developed are critical to almost all senior management roles
and across all business sectors.”
Head of Computing, Secondary school
Perceived issues associated with the new curriculum in England:
Not all teachers share the same enthusiasm for the subject and there is anecdotal evidence from the
discussion group discussions that some schools are not implementing the subject. A notable
concern, particularly among some secondary schools (in which surveyed teachers are comparatively
less favourable than those of primary schools), is that the balance in the new curriculum is weighted
too heavily towards computer science and that vital and fundamental ICT skills risk being side-lined.
With the growing use of tablets and other touch-screen technology, there is a worry that children
are losing important basic skills such as using a mouse, keyboard, manually saving documents in
folders, working with spreadsheets and delivering effective presentations. Participants argued
strongly in the Birmingham discussion group that such skills are important for more jobs than those
requiring programming and coding skills, and that it must not be assumed that young people learn
these tasks by themselves. Teachers generally in favour of the new computing curriculum also
emphasised strongly that ICT must not be eclipsed, making the point that a balance needs to be
maintained between digital literacy, ICT and computer science.
Primary school teachers unfavourable to the new curriculum described the requirements as being
too advanced for the available physical resources and budget, that staff lack the required skill-set
and knowledge to teach the subject, and that the language used in the curriculum is overly-
technical.
“Far too much is expected of children in terms of their understanding of all things technology related.
We should be focusing on making sure they can read, write and use maths confidently, before trying
to teach them coding.”
Computing teacher, Primary School

Understanding Computing Education in the UK
May 2017 Page 37
A small number of teachers made the point in response to the survey and during discussion groups
that the new curriculum appears to have been implemented without due regard to who would teach
it and how it would be taught. One secondary teacher described computer science as having been
“parachuted in” and that it was rather assumed ICT teacher would be able to adapt or migrate to
this subject without appreciating how different the two subjects are in reality.
3.1.3 Defining Teacher Profiles
By cross-tabulating how teachers rated their ‘understanding of computational thinking’ (using the
definition in section 3.1.1) against their ‘favourability towards the computing curriculum’, it is
possible to develop a set of four teacher profiles.
Firstly, the cross-tabulations and numbers of respondents providing ratings in response to both of
these questions are shown in Table 5 (primary) and Table 6 (secondary). With respect to secondary
schools/colleges in particular, it is clear that for the least knowledgeable teachers there is an upper
limit on their affection for the curriculum, and this ceiling rises with teacher confidence. The floor on
favourability remains steadily low, with some of the most knowledgeable teachers giving the new
curriculum the lowest possible ratings.
The four coloured quadrants in Tables 5 and 6 are used as a basis for defining teacher profiles –
explained further below.
Table 5 Understanding and favourability (primary schools in England)
Favo
ura
bili
ty t
o t
he
cu
rric
ulu
m
Understanding of computational thinking
Rating Base 1 2 3 4 5 6 7 8 9 10
Base 297 6 7 4 6 40 21 51 52 43 67
1 3 - - - - 1 - - - - 2
2 1 - - - - - 1 - - - -
3 3 - - - 2 1 - - - - -
4 5 1 2 - - 1 1 - - - -
5 35 2 3 1 1 12 2 6 5 1 2
6 20 - - - - 9 3 1 7 - -
7 38 1 1 1 - 7 3 8 7 5 5
8 86 1 - - 1 6 7 18 18 11 24
9 41 - - 1 1 2 3 11 7 11 5
10 65 1 1 1 1 1 1 7 8 15 29

Understanding Computing Education in the UK
May 2017 Page 38
Table 6 Understanding and favourability (secondary schools/colleges in England)
Favo
ura
bili
ty t
o t
he
cu
rric
ulu
m
Understanding of computational thinking
Rating Base 1 2 3 4 5 6 7 8 9 10
Base 522 4 9 7 10 34 32 39 98 93 196
1 42 2 2 3 1 6 2 5 7 1 13
2 30 - 5 - 2 1 5 1 7 3 6
3 28 1 - 2 1 6 1 3 4 1 9
4 27 - 1 1 2 2 2 2 4 3 10
5 75 1 - - 1 8 10 5 14 16 20
6 47 - 1 1 - - 3 7 13 6 16
7 75 - - - 2 3 4 8 20 13 25
8 82 - - - 1 3 2 5 17 13 41
9 37 - - - - 2 2 3 2 22 6
10 79 - - - - 3 1 - 10 15 50
An explanation of how the coloured quadrants form teacher profiles is set out in Table 7. These
archetypal groups are used from this point forward to compare levels of teacher confidence, CPD
activities, and use of teaching support.
The profiles should not be considered completely rigid, nor do the groups necessarily have clear
boundaries in reality. They are intended purely as framework for defining broad typologies of
teachers in the context of computing education. For example in the ‘advocates group’ (green), those
respondents providing ratings of 10 out of 10 to both questions (bottom right corner of Tables 5 and
6) may be considered stronger ‘advocates’ than those providing ratings of 7 or 8 out of 10. Similarly
those providing ratings of 1 or 2 out of 10 for both questions (top left corner of tables 5 and 6) may
be considered ‘less engaged’ than those providing ratings closer to the centre of the scale.

Understanding Computing Education in the UK
May 2017 Page 39
Table 7 Teacher profiles – definitions
Quadrant Defining characteristics
England respondents
Primary Secondary
Advocates profile: Strong understanding of computational thinking and high favourability towards the computing curriculum.
Rating of understanding of computational thinking: At least 7 out of 10. Rating of favourability to the new computing curriculum: At least 7 out of 10.
189 250
Supporters profile: Comparatively less understanding of computational thinking but high favourability towards the computing curriculum.
Rating of understanding of computational thinking: Less than 7 out of 10. Rating of favourability to the new computing curriculum: At least 7 out of 10.
41 23
Critics profile: Strong understanding of computational thinking but comparatively low favourability towards the computing curriculum.
Rating of understanding of computational thinking: At least 7 out of 10. Rating of favourability to the new computing curriculum: Less than 7 out of 10.
24 176
Less Engaged profile: Comparatively less understanding of computational thinking and comparatively low favourability towards the computing curriculum.
Rating of understanding of computational thinking: Less than 7 out of 10. Rating of favourability to the new computing curriculum: Less than 7 out of 10.
43 73
3.1.4 Digital Competence Framework – Wales
In Wales from September 2016, a new Digital Competence Framework23 was made available for
schools, placing responsibility on all teachers and practitioners to embed digital competence in
lessons.
On a scale from 1 to 10, surveyed schools in Wales were asked to rate their preparedness for the
new framework. Responses from 18 secondary schools in Wales resulted in an average rating of 6.8
out of 10, while the average rating from four responding primary schools was 3.8 out of 10. These
findings should be treated with extreme caution given the low base number of responses.
23 Digital competence enables a person to be a confident digital citizen, to interact and collaborate digitally, to produce work digitally and to be confident in handling data and computational thinking (problem solving). Digital competence is distinct from ICT but they the two are interrelated (particularly in primary education).

Understanding Computing Education in the UK
May 2017 Page 40
While primary schools did not provide supporting reasons, secondary respondents described being
generally confident in their underpinning knowledge to embed digital literacy, or mentioned actively
looking into how this could be applied within their school. It was argued that the framework’s
success will ultimately depend on the effectiveness of ‘top down’ implementation and training for
staff
One participant at the Cardiff discussion group mentioned “we’re a non-digital generation” and
described how aspects of computer science could be quite a leap for some teachers. A counter-
argument was that the new framework is rightfully aspirational and that it would be “unacceptable”
if teachers are not equipped to deliver it, thereby emphasising the importance of a clear strand of
CPD in this area.
3.1.5 Curriculum for Excellence – Scotland
In Scotland, the proposed changes to the Curriculum for Excellence generally appear to be well
received, with discussion group and case study participants welcoming the clearer distinction
between the topics of computer science and digital literacy. They are also favourable to the
framework’s use of ‘experience’ and ‘outcome’ measures, which are viewed as a clear way of
benchmarking progress and helping students to decide if the subject would be the right choice for
them.
One respondent expressed some concern about the introduction of new foundation skills, which
they feel would be beyond most primary schools due to lack of technology and insufficient staff
expertise.
3.1.6 Entitlement Framework – Northern Ireland
The entitlement framework in Northern Ireland refers to the post 14 curriculum which aims to
provide access for students to a broad and balanced curriculum to enable them to reach their full
potential. Discussion group participants in Belfast described how this has stimulated their decision to
offer Computer Science qualifications in their schools from England-based awarding organisations as
a fresh, forward-looking and strong academic subject. These participants praised the changes taking
place in England and feel strongly that Northern Ireland should follow suit.
3.2 Confidence
3.2.1 General Confidence in delivering Computing Education
On a scale from 1 ‘not at all confident’ to 10 ‘completely confident’, teachers were asked to rate
their own confidence in delivering the curriculum at each distinct Key Stage/level.

Understanding Computing Education in the UK
May 2017 Page 41
Observed levels of confidence are lower among surveyed secondary schools than primary schools,
and there is a drop in the mean confidence rating across each successive level of secondary
education, from 8.5 at Key Stage 3, down to 6.6 at A level/equivalent (Figures 11 to 15 and Tables 8
and 9).
For both primary and secondary schools/colleges, there is evidence of statistical significance that
teachers holding their highest qualification in Computer Science are more confident than those
qualified in other disciplines. In secondary schools/colleges, the difference in ratings given by heads
of department/computing subject leads and other teachers is also significant24.
Figure 11 Confidence – primary schools (means)
Figure 12 Confidence – primary schools (rating distribution)
24 See Appendix A5 for details of the statistical tests, the results of which should be used with care.
7.4
7.3
8.0
7.5
0 1 2 3 4 5 6 7 8 9 10
Key Stage 1
Key Stage 2
Scotland First level (P2 – P4)
Scotland Second level (P5 – P7)
Base Eng/Wal/NI: 297 respondents. Base Sco: 35 respondents
12 8 629 29 32
67
34
70
65
11 8
32 25
48
77
33
52
0
20
40
60
80
100
120
140
160
1 2 3 4 5 6 7 8 9 10
Rating out of 10 (X) / Number of respondents (Y)
Key Stage 1 Key Stage 2
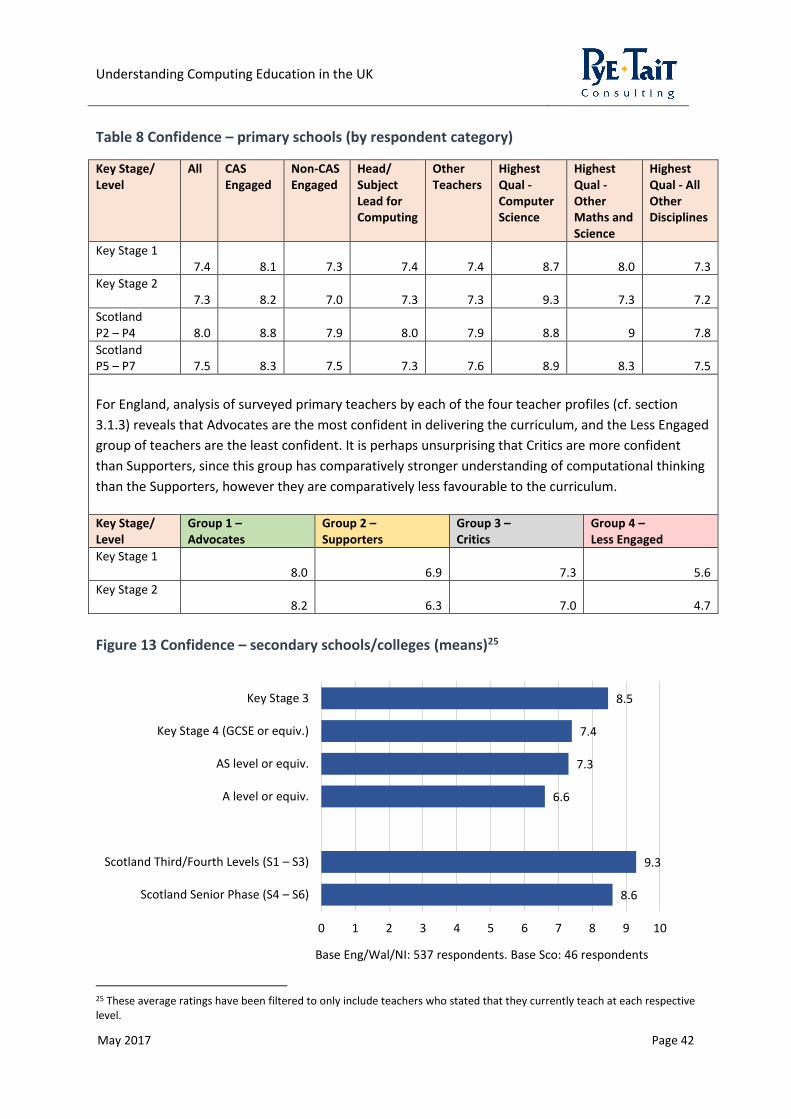
Understanding Computing Education in the UK
May 2017 Page 42
Table 8 Confidence – primary schools (by respondent category)
Key Stage/ Level
All CAS Engaged
Non-CAS Engaged
Head/ Subject Lead for Computing
Other Teachers
Highest Qual - Computer Science
Highest Qual - Other Maths and Science
Highest Qual - All Other Disciplines
Key Stage 1 7.4 8.1 7.3 7.4 7.4 8.7 8.0 7.3
Key Stage 2 7.3 8.2 7.0 7.3 7.3 9.3 7.3 7.2
Scotland P2 – P4 8.0 8.8 7.9 8.0 7.9 8.8 9 7.8
Scotland P5 – P7 7.5 8.3 7.5 7.3 7.6 8.9 8.3 7.5
For England, analysis of surveyed primary teachers by each of the four teacher profiles (cf. section
3.1.3) reveals that Advocates are the most confident in delivering the curriculum, and the Less Engaged
group of teachers are the least confident. It is perhaps unsurprising that Critics are more confident
than Supporters, since this group has comparatively stronger understanding of computational thinking
than the Supporters, however they are comparatively less favourable to the curriculum.
Key Stage/ Level
Group 1 – Advocates
Group 2 – Supporters
Group 3 – Critics
Group 4 – Less Engaged
Key Stage 1 8.0 6.9 7.3 5.6
Key Stage 2 8.2 6.3 7.0 4.7
Figure 13 Confidence – secondary schools/colleges (means)25
25 These average ratings have been filtered to only include teachers who stated that they currently teach at each respective level.
8.5
7.4
7.3
6.6
9.3
8.6
0 1 2 3 4 5 6 7 8 9 10
Key Stage 3
Key Stage 4 (GCSE or equiv.)
AS level or equiv.
A level or equiv.
Scotland Third/Fourth Levels (S1 – S3)
Scotland Senior Phase (S4 – S6)
Base Eng/Wal/NI: 537 respondents. Base Sco: 46 respondents

Understanding Computing Education in the UK
May 2017 Page 43
Figure 14 Confidence – secondary schools/colleges in England/Wales/NI (rating distribution)
Figure 15 Confidence – secondary schools/colleges in Scotland (rating distribution)
25 26 4389 89
239
39 19 21 2537 46
53
80 74
141
87
21 19 24
48 32
48
6342
79
95
38 25
4230
44
60
28
67
0
100
200
300
400
500
600
1 2 3 4 5 6 7 8 9 10
Rating out of 10 (X) / Number of respondents (Y)
Key Stage 3 Key Stage 4 AS level A level
0 0 05 3
8
28
1 2
5 11
17
9
0
5
10
15
20
25
30
35
40
1 2 3 4 5 6 7 8 9 10
Rating out of 10 (X) / Number of respondents (Y)
S1 to S3 S4 to S6

Understanding Computing Education in the UK
May 2017 Page 44
Table 9 Confidence – secondary schools/colleges (by respondent category)
Key Stage/ Level
All CAS Engaged
Non-CAS Engaged
HoD/ Subject Lead for Computing
Other Teachers
Highest Qual - Computer Science
Highest Qual - Other Maths and Science
Highest Qual - All Other Disciplines
Key Stage 3 8.5 8.9 8.5 8.7 8.3 9.1 8.3 8.3
Key Stage 4 7.4 7.7 7.3 7.9 6.4 8.1 7.1 7.1
AS level or equivalent 7.3 7.2 7.3 7.4 7.2 7.7 7.2 6.9
A level or equivalent 6.6 6.6 6.6 6.9 6.1 7.1 6.4 6.2
Scotland S1 – S3 9.3 10.0 9.2 9.0 9.5 9.3 9.3 9.4
Scotland S4 – S6 8.6 9.0 8.6 8.5 8.7 8.6 8.5 8.9
For England, analysis of surveyed secondary/college teachers by each of the four teacher profiles (cf.
section 3.1.3) reveals a similar pattern in terms of confidence to primary schools. Advocates are the
most confident in delivering the curriculum, the Less Engaged group of teachers are the least
confident, with Critics and Supporters falling in the middle.
Key Stage/ Level
Group 1 – Advocates
Group 2 – Supporters
Group 3 – Critics
Group 4 – Less Engaged
Key Stage 3 9.1 7.8 8.5 6.6
Key Stage 4 8.7 5.8 6.0 4.3
AS level or equivalent 7.4 3.5 5.0 2.8
A level or equivalent 6.9 3.3 4.2 2.7
Those teachers providing a rating of 6 or below were asked to explain their reasons. Many of these
teachers feel that they lack sufficient theoretical and technical knowledge of computing (including
aspects of programming and coding). Heads of department/subject leads in primary and secondary
schools tended to express these concerns with respect to other teaching staff in their school who
also have responsibility for delivering the subject.
In primary schools this issue is exacerbated by competing subject demands, whilst secondary
teachers feel that the size of the skills gaps between teaching ICT and teaching computer science
“has been underestimated”. Some teachers remarked in the survey that there isn’t enough training
to teach the subject and that they don’t have enough time in the working day for computing-related
CPD.

Understanding Computing Education in the UK
May 2017 Page 45
A number of unique challenges face computing in the early years of secondary school (Key Stage 3 in
England and Wales). Firstly there is the impact of time-tabling, with computing having to compete
with a variety of other subjects, often with non-specialist teachers stepping in at this level. Secondly,
discussion group and case study participants described how some students can enter Year 7 having
had a good grounding in computing at primary school, but their interest and enthusiasm can be
easily undone if the secondary school doesn’t have effective teachers and adequate infrastructure.
In another scenario, several other participants described how the knowledge and capability of
students starting secondary school can be highly variable, reflecting disparities in computing
education across feeder primary schools. Teaching computing can therefore be more difficult at this
level where students have such different starting points.
“The discipline is completely new to me. It's like a linguist having to teach a different language but
with no resources or preparation time.”
Head of ICT and Computer Science, Secondary School
3.2.2 Confidence in delivering specific aspects of Computing Education
Figures 16 and 17 rank specific aspects of computing education for which schools are most to least
confident. The top three highest rated aspects mainly relate to safety and the use (rather than
programming) of technology. Less confident areas among primary schools include debugging,
working with various forms of input and output, and working with variables. For secondary schools,
less confident areas include designing and developing modular programs, as well as using sequence,
selection and iteration in two programming languages.
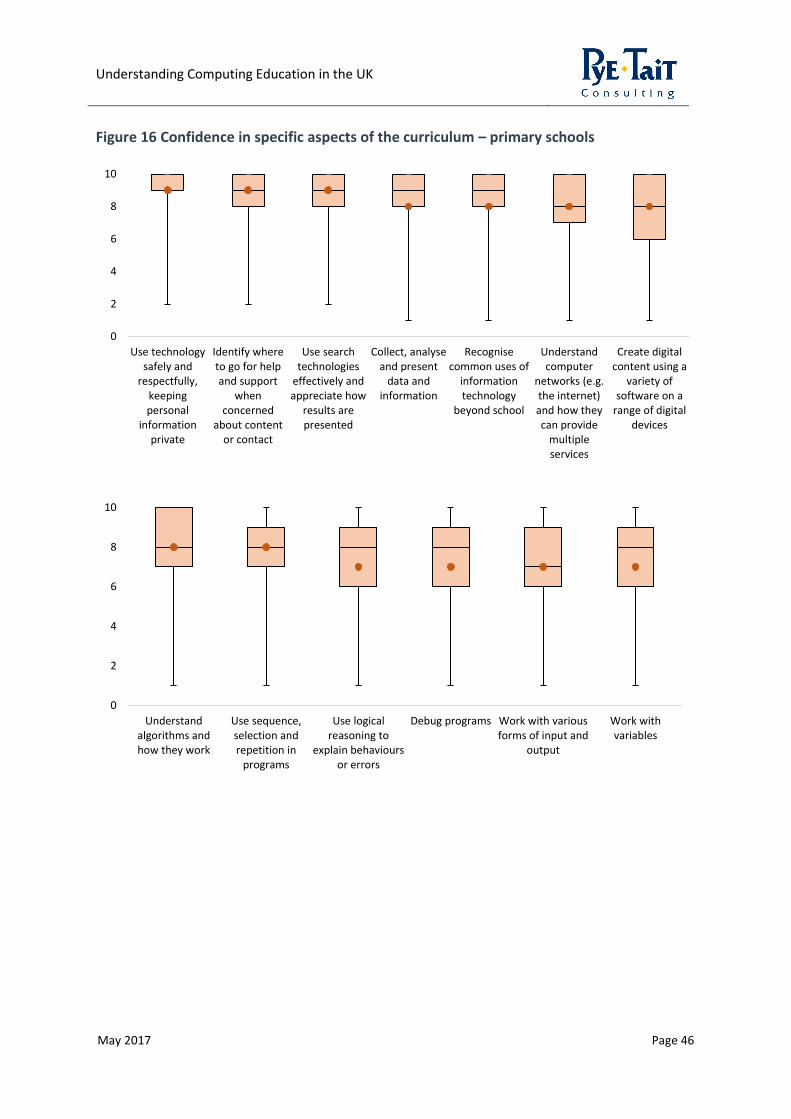
Understanding Computing Education in the UK
May 2017 Page 46
Figure 16 Confidence in specific aspects of the curriculum – primary schools
0
2
4
6
8
10
Use technologysafely and
respectfully,keepingpersonal
informationprivate
Identify whereto go for helpand support
whenconcerned
about contentor contact
Use searchtechnologies
effectively andappreciate how
results arepresented
Collect, analyseand present
data andinformation
Recognisecommon uses of
informationtechnology
beyond school
Understandcomputer
networks (e.g.the internet)and how theycan provide
multipleservices
Create digitalcontent using a
variety ofsoftware on a
range of digitaldevices
0
2
4
6
8
10
Understandalgorithms andhow they work
Use sequence,selection andrepetition in
programs
Use logicalreasoning to
explain behavioursor errors
Debug programs Work with variousforms of input and
output
Work withvariables

Understanding Computing Education in the UK
May 2017 Page 47
Figure 17 Confidence in in specific aspects of the curriculum – secondary schools/colleges
0
2
4
6
8
10
Use technologysafely, responsibly
and securely,including
protecting onlineidentity and
privacy
Understand thehardware and
softwarecomponents in
computer systems
Create digitalcontent for a given
audience
Carry out simpleoperations usingbinary numbers
Break downcomplex problemsinto smaller parts(decomposition)
Use variables indifferent roles
0
2
4
6
8
10
Understand simpleBoolean logic for
use inprogramming
Understand howinstructions are
stored andexecuted within acomputer system
Identify patternsand similarities
with how previousproblems have
been solved
Undertake creativeprojects that
involve selectingand using multiple
applications
Understanddifferent types of
algorithms andhow they work
Understand anduse functions andprocedures (sub-
routines)
0
2
4
6
8
10
Use input andoutput
functionality of aprogramming
language, includingsaving to file
Understand anduse data structures
beyond a simplevariable, for
example an arrayor list
Identifycomputationalabstractions in
order to discountunnecessaryinformation
Use logicalreasoning to
compare the utilityof different
algorithms forproblems
Use sequence,selection and
iteration in twodifferent
programminglanguages
Design and developmodular programs

Understanding Computing Education in the UK
May 2017 Page 48
3.2.3 Improving Confidence in the Future
Surveyed teachers were asked what, if anything, would help to improve their confidence in teaching
computing. The most common request among primary and secondary schools was for more training.
Specific suggestions include more courses and other forms of guidance so that teachers can:
• Improve their subject knowledge and understanding (including comprehensive technical
training and greater exposure to programming and coding);
• Explore how to make the most of opportunities in the computing curriculum, including
sharing practical ideas for delivering engaging lessons, best practice and proven methods for
teaching programming;
• Better understand the performance benchmarks for GCSE/A level computing qualifications,
including how these map to grades so that students can be better informed about their
grade potential;
• Identify how to get the most out of different student ability groups in the same class; and
• Be able to teach complex theory, particularly at A level.
Teachers desire more CPD opportunities, in particular the time to read around the subject and
practise their programming and coding skills, develop pedagogical approaches and assessment
materials, design lesson plans and Schemes of Work. In addition, they would welcome more
collaboration opportunities to help improve knowledge, for example with subject specialists,
industry experts and computer science graduates. Many teachers are also calling for more access to
free and high quality teaching and assessment resources and better equipment.
Several secondary teachers mentioned that greater consistency is needed between awarding
organisations. Linked to this, a respondent in the Cardiff discussion group discussed in the context of
project work how one exam board places greater focus on running and testing a finished product,
whist another favours a portfolio-style assessment with screen prints, which are arguably “easier to
bluff”.
3.3 Qualifications, Experience and CPD
3.3.1 Qualifications
For England, the Department for Education publishes data on the percentage of secondary school
teachers holding their highest level qualification in a relevant subject to the one they teach. The list
Understanding Computing Education in the UK
May 2017 Page 49
of subjects (as at November 2015) does not specifically reference ‘computer science’ but data are
provided below for subjects closely linked to computing:
• Combined/General Science: 78% qualified in a related subject;
• Other Sciences: 74% qualified in a related subject;
• Business/Economics: 64% qualified in a related subject;
• Mathematics: 45% qualified in a related subject;
• ICT: 29% qualified in a related subject26.
Data from the survey of schools and colleges provides more detail about the qualifications of
teachers with at least some responsibility for computing education at both primary and secondary
levels.
The vast majority of surveyed teachers are qualified at least to Batchelor’s Degree level or equivalent
in any subject (94% in primary and 98% in secondary schools/colleges). Just under half hold a
qualification beyond a Batchelor’s degree, with 2% of secondary teachers holding a doctoral
qualification.
Teachers were asked in which discipline(s) they hold their highest level qualification. As teachers
could select more than one answer, the results show the percentage share of total responses, i.e.
from most to least mentioned.
The most commonly cited highest qualification held by primary computing teachers is ‘Education’
(typically referring to their PGCE) which takes a 41% share of responses. However, teachers are
generally qualified in a range of disciplines, be it STEM, humanities or arts-related (Figure 18)27.
26 Department for Education (June 2016) School Workforce in England – November 2016 27 Highest level qualifications classified by primary school respondents as ‘Other’ included Archaeology, Childhood Studies/Early Years, English, Geography, Music, Politics, Psychology and Theology.
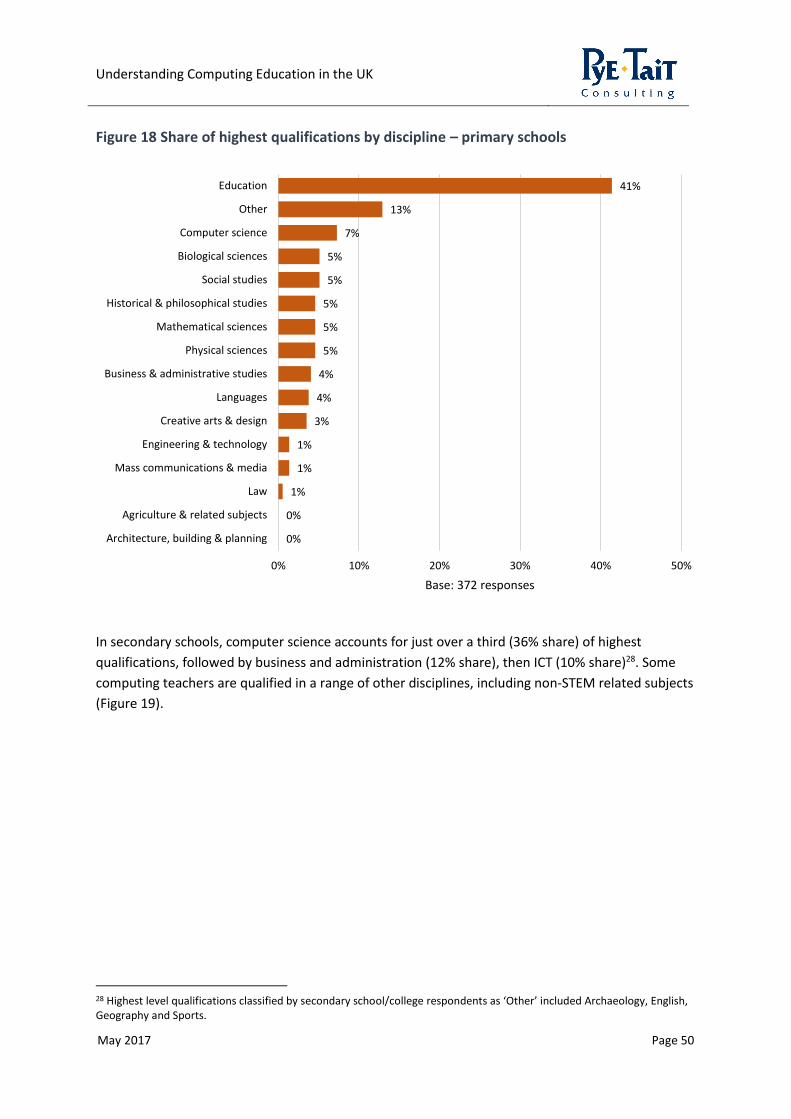
Understanding Computing Education in the UK
May 2017 Page 50
Figure 18 Share of highest qualifications by discipline – primary schools
In secondary schools, computer science accounts for just over a third (36% share) of highest
qualifications, followed by business and administration (12% share), then ICT (10% share)28. Some
computing teachers are qualified in a range of other disciplines, including non-STEM related subjects
(Figure 19).
28 Highest level qualifications classified by secondary school/college respondents as ‘Other’ included Archaeology, English, Geography and Sports.
41%
13%
7%
5%
5%
5%
5%
5%
4%
4%
3%
1%
1%
1%
0%
0%
0% 10% 20% 30% 40% 50%
Education
Other
Computer science
Biological sciences
Social studies
Historical & philosophical studies
Mathematical sciences
Physical sciences
Business & administrative studies
Languages
Creative arts & design
Engineering & technology
Mass communications & media
Law
Agriculture & related subjects
Architecture, building & planning
Base: 372 responses

Understanding Computing Education in the UK
May 2017 Page 51
Figure 19 Share of highest qualifications by discipline – secondary schools/colleges
As explained in more detail in section 3.1.1, teachers at secondary level in Scotland are required to
be qualified in their chosen subject. Table 10 breaks down teachers’ highest qualification discipline
by nation, which reveals that computer science and mathematical sciences account for a
comparatively larger share in Scotland than is the case in England, Wales and Northern Ireland.
While the Department for Education produces national data on the highest ‘post A level’
qualification discipline of secondary teachers in England, the data are not directly comparable to the
survey. The closest matches include 29% of ICT teachers holding a qualification (degree or higher) in
the same subject, and 74% of ‘Other science’ teachers holding a qualification (degree or higher) in
the same subject29.
29 Department for Education (2016) School workforce in England – November 2015 (Table 12)
36%
12%
10%
7%
6%
6%
6%
4%
3%
3%
2%
2%
2%
1%
0%
0%
0%
0% 5% 10% 15% 20% 25% 30% 35% 40% 45% 50%
Computer science
Business & administrative studies
ICT (including Business with ICT)
Education
Other
Mathematical sciences
Engineering & technology
Physical sciences
Creative arts & design
Mass communications & media
Historical & philosophical studies
Social studies
Biological sciences
Languages
Law
Architecture, building & planning
Agriculture & related subjects
Base: 717 responses
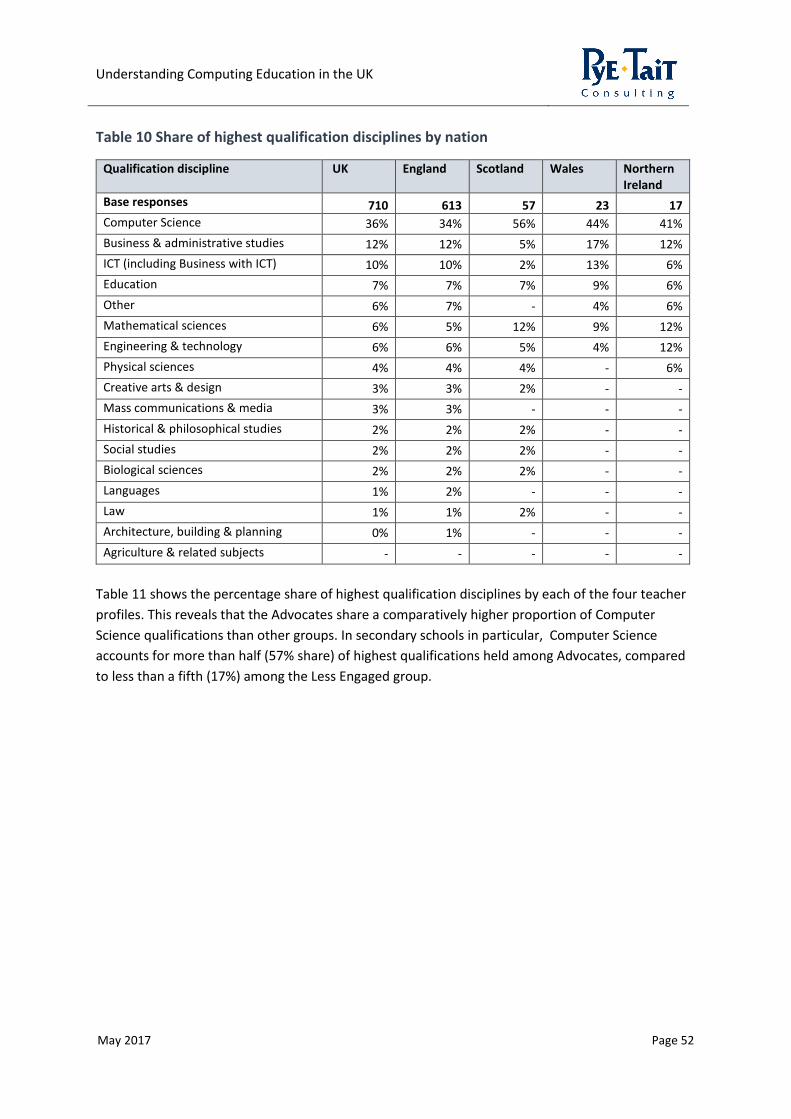
Understanding Computing Education in the UK
May 2017 Page 52
Table 10 Share of highest qualification disciplines by nation
Qualification discipline UK England Scotland Wales Northern Ireland
Base responses 710 613 57 23 17
Computer Science 36% 34% 56% 44% 41%
Business & administrative studies 12% 12% 5% 17% 12%
ICT (including Business with ICT) 10% 10% 2% 13% 6%
Education 7% 7% 7% 9% 6%
Other 6% 7% - 4% 6%
Mathematical sciences 6% 5% 12% 9% 12%
Engineering & technology 6% 6% 5% 4% 12%
Physical sciences 4% 4% 4% - 6%
Creative arts & design 3% 3% 2% - -
Mass communications & media 3% 3% - - -
Historical & philosophical studies 2% 2% 2% - -
Social studies 2% 2% 2% - -
Biological sciences 2% 2% 2% - -
Languages 1% 2% - - -
Law 1% 1% 2% - -
Architecture, building & planning 0% 1% - - -
Agriculture & related subjects - - - - -
Table 11 shows the percentage share of highest qualification disciplines by each of the four teacher
profiles. This reveals that the Advocates share a comparatively higher proportion of Computer
Science qualifications than other groups. In secondary schools in particular, Computer Science
accounts for more than half (57% share) of highest qualifications held among Advocates, compared
to less than a fifth (17%) among the Less Engaged group.

Understanding Computing Education in the UK
May 2017 Page 53
Table 11 Share of highest qualification disciplines by teacher profile
Discipline Group 1 – Advocates
Group 2 – Supporters
Group 3 – Critics
Group 4 – Less Engaged
Primary
Computer Science 15% - - 3%
Other maths and science disciplines 19% 12% 22% 24%
All other disciplines 66% 88% 78% 72%
Secondary
Computer Science 57% 33% 39% 17%
Other maths and science disciplines 19% 22% 19% 5%
All other disciplines 25% 44% 41% 79%
3.3.2 Experience
Almost two thirds of surveyed computing teachers (60% of primary teachers and 65% of secondary
teachers) have been in the profession for more than 10 years. A small minority (7% of primary
teachers and 10% of secondary teachers) joined the profession in the last two years.
Those respondents that had been teaching for less than six years were asked what they were doing
directly prior to joining the profession. The results (Figure 20) reveal that in primary schools, more
than half of these teachers (53%) were in education and working towards a qualification. In
secondary schools, the picture is more varied, with 42% having worked in industry and 33% having
been in education.

Understanding Computing Education in the UK
May 2017 Page 54
Figure 20 Position prior to teaching
3.3.3 CPD
The survey asked teachers for the total number of hours they had individually spent on computing-
related Continuing Professional Development (CPD) during 2015-16, along with further details about
the nature of those activities30.
• There are wide variations in the amount and nature of CPD undertaken;
• The most common answer was zero hours (28% of primary teachers and 26% of secondary
teachers);
• In primary schools, an average of 11 CPD hours were undertaken in 2015/16, of which more
than half (6 hours) were undertaken in surveyed teachers’ own time.
• In secondary schools/colleges, an average of 27 CPD hours were undertaken in 2015/16, and
almost all (22 hours) were undertaken in surveyed teachers’ own time. This indicates a lack
of time in the school day and potentially meaning that teachers with many commitments
outside of work could face difficulties fitting this in.
30 In order to understand what teachers classify as CPD, the survey did not provide a hard and fast definition of this term,
nor did it specify how teachers should define the working day versus their “own time”.
13%
27%
53%
7%
42%
20%
33%
4%
0% 20% 40% 60%
Worked in industry – computing role
Worked in industry – non computing role
In education (working towards ownqualification)
Other
Base: Primaries (88 respondents) and Secondaries (118 respondents)
Primaryschools
Secondaryschools

Understanding Computing Education in the UK
May 2017 Page 55
Figures 21 and 22 show the percentage of surveyed teachers reporting CPD using bandings for total
CPD hours. The distributions reveal the variation in amounts of activity undertaken in both primary
and secondary schools.
Figure 21 CPD banded hours in 2015/16 – primary schools
Figure 22 CPD banded hours in 2015/16 – secondary schools
29%
34%
16%
7%10%
2% 1% 1% 0%0%
5%
10%
15%
20%
25%
30%
35%
40%
0 hours 1 to 9hours
10 to 19hours
20 to 24hours
25 to 49hours
50 to 99hours
100 to149
hours
150 to249
hours
250+hours
% respondents
Base: 340 respondents
26%
17%14%
9%
14%12%
5%
2% 1%
0%
5%
10%
15%
20%
25%
30%
0 hours 1 to 9hours
10 to 19hours
20 to 24hours
25 to 49hours
50 to 99hours
100 to149
hours
150 to249
hours
250+hours
% teachers
Base: 599 respondents
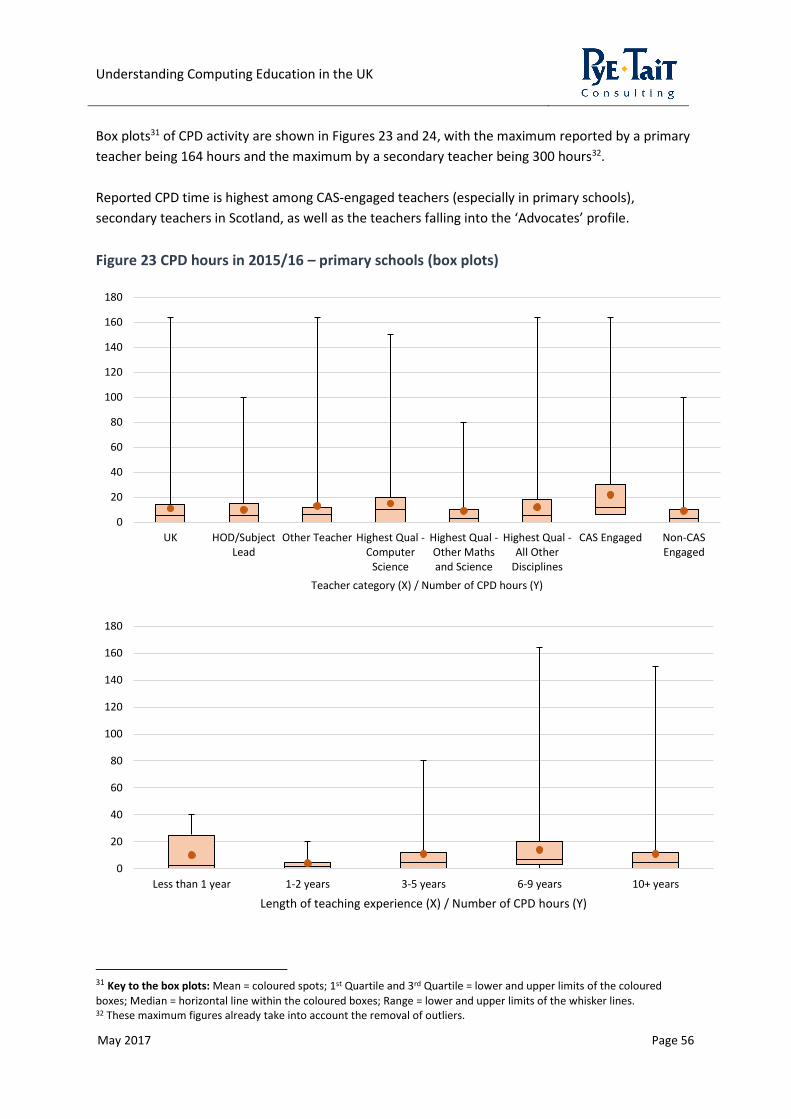
Understanding Computing Education in the UK
May 2017 Page 56
Box plots31 of CPD activity are shown in Figures 23 and 24, with the maximum reported by a primary
teacher being 164 hours and the maximum by a secondary teacher being 300 hours32.
Reported CPD time is highest among CAS-engaged teachers (especially in primary schools),
secondary teachers in Scotland, as well as the teachers falling into the ‘Advocates’ profile.
Figure 23 CPD hours in 2015/16 – primary schools (box plots)
31 Key to the box plots: Mean = coloured spots; 1st Quartile and 3rd Quartile = lower and upper limits of the coloured
boxes; Median = horizontal line within the coloured boxes; Range = lower and upper limits of the whisker lines. 32 These maximum figures already take into account the removal of outliers.
0
20
40
60
80
100
120
140
160
180
UK HOD/SubjectLead
Other Teacher Highest Qual -Computer
Science
Highest Qual -Other Mathsand Science
Highest Qual -All Other
Disciplines
CAS Engaged Non-CASEngaged
Teacher category (X) / Number of CPD hours (Y)
0
20
40
60
80
100
120
140
160
180
Less than 1 year 1-2 years 3-5 years 6-9 years 10+ years
Length of teaching experience (X) / Number of CPD hours (Y)

Understanding Computing Education in the UK
May 2017 Page 57
Figure 24 CPD hours in 2015/16 – secondary schools/colleges (box plots)
0
20
40
60
80
100
120
140
160
180
Advocates Supporters Sceptics Less Engaged
Profile (X) / Number of CPD hours (Y)
0
50
100
150
200
250
300
350
UK England Scotland Wales Northern Ireland
Nation (X) / Number of CPD hours (Y)
0
50
100
150
200
250
300
350
HOD/SubjectLead
Other Teacher Highest Qual -Computer
Science
Highest Qual -Other Mathsand Science
Highest Qual -All Other
Disciplines
CAS Engaged Non-CASEngaged
Teacher category (X) / Number of CPD hours (Y)
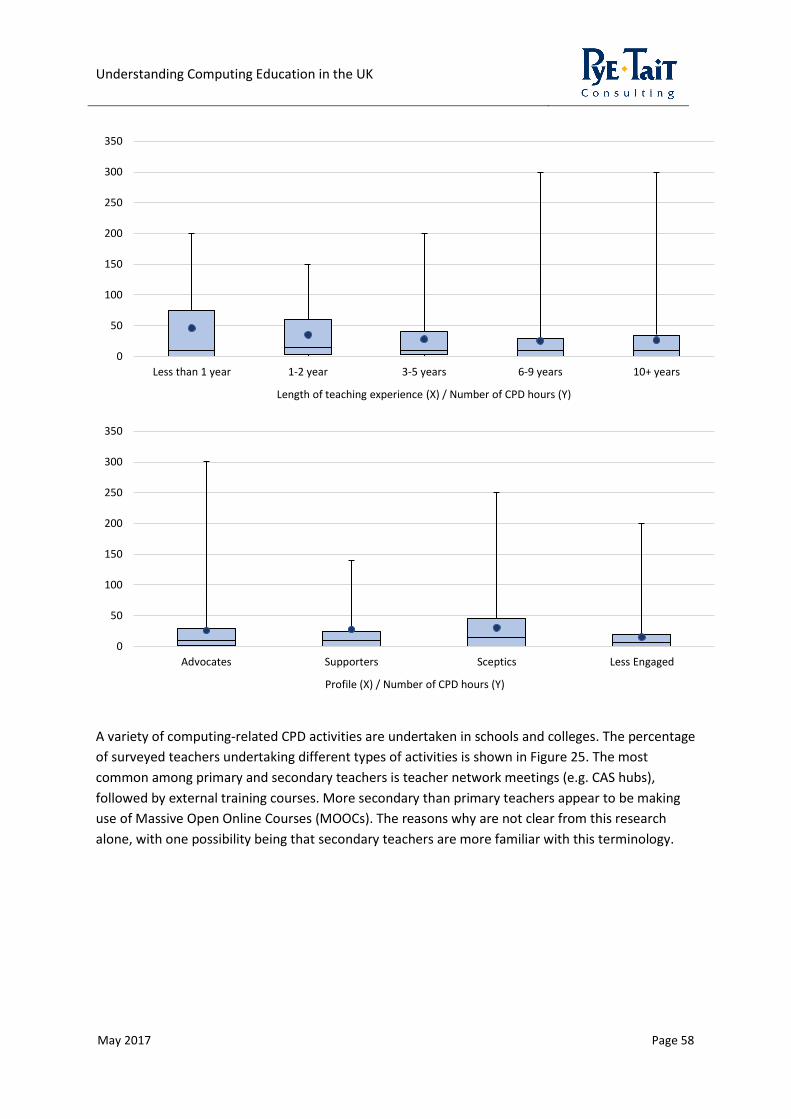
Understanding Computing Education in the UK
May 2017 Page 58
A variety of computing-related CPD activities are undertaken in schools and colleges. The percentage
of surveyed teachers undertaking different types of activities is shown in Figure 25. The most
common among primary and secondary teachers is teacher network meetings (e.g. CAS hubs),
followed by external training courses. More secondary than primary teachers appear to be making
use of Massive Open Online Courses (MOOCs). The reasons why are not clear from this research
alone, with one possibility being that secondary teachers are more familiar with this terminology.
0
50
100
150
200
250
300
350
Less than 1 year 1-2 year 3-5 years 6-9 years 10+ years
Length of teaching experience (X) / Number of CPD hours (Y)
0
50
100
150
200
250
300
350
Advocates Supporters Sceptics Less Engaged
Profile (X) / Number of CPD hours (Y)

Understanding Computing Education in the UK
May 2017 Page 59
Figure 25 Types of CPD activity
“I strive to keep up with technological developments and this is one area that takes a lot of time and
is constantly changing, so it’s no easy task.”
Computing Coordinator, Primary School
Table 12 shows the percentage of surveyed teachers (primary and secondary) that have been
involved in CAS-related CPD across the four teacher profiles. This reveals that Advocates have been
most involved in CAS-related CPD, whilst in primary schools particularly, the Less Engaged group
have had less involvement in CAS-related CPD.
Table 12 CAS Engagement by teacher profiles
Level Group 1 – Advocates
Group 2 – Supporters
Group 3 – Critics
Group 4 – Less Engaged
Primary 28% 10% 13% 7%
Secondary 20% 17% 16% 16%
52%
43%
35%
23%
22%
13%
9%
8%
7%
6%
5%
1%
53%
47%
27%
6%
24%
16%
8%
13%
11%
30%
25%
4%
0% 20% 40% 60%
Teacher network meetings (e.g. CAS Hub)
External training courses
External conferences
CAS Barefoot workshops
Webinars
Lesson observations
Peer review
CAS toolkits (e.g. Quickstart)
CAS Master Teacher training
Massive Open Online Courses (MOOCs)
Other
BCS toolkits
Base: Primary (221 respondents) and Secondary (420 respondents)
Primary schools
Secondary schools

Understanding Computing Education in the UK
May 2017 Page 60
3.4 Chapter Summary
Analysis of teachers’ understanding of computational thinking (on a scale from 1 ‘no understanding’
to 10 ‘complete’), reveals that more than half of primary teachers (52%) and three quarters of
secondary teachers (75%) surveyed gave a rating of 8 or higher. The observed distribution among
primary teachers spans the full 1 to 10 range, is generally mixed and roughly exponential among
secondary teachers. This indicates wide variations in levels of teacher understanding and it is a
statistically significant finding that teachers who hold their highest qualification in Computer Science
have a better understanding of computational thinking than those qualified in another discipline.
Secondly, analysis of schools’ favourability towards the new computing curriculum (on a scale from 1
‘not at all’ to 10 ‘completely’) reveals varying teacher attitudes. Almost two third of primary teachers
(65%) compared with less than half of secondary respondents (38%) surveyed gave a rating of 8 or
higher. The observed distribution of ratings given by secondary schools/colleges is more dispersed
than primary schools.
By cross-tabulating how teachers rated their understanding and favourability, it has been possible to
derive four teacher profiles. These are summarised as follows:
Advocates group: Strong understanding of computational thinking and high favourability towards the computing curriculum.
Supporters group: Comparatively less understanding of computational thinking but high favourability towards the computing curriculum.
Critics group: Strong understanding of computational thinking but comparatively low favourability towards the computing curriculum.
Less Engaged group: Comparatively less understanding of computational thinking and comparatively low favourability towards the computing curriculum.
Those teachers favourable to the new curriculum described the importance of computing education
keeping up with the pace of industry and technological change. They added that computational
thinking is a vital cross-curricula skill and that the reformed computing qualifications are more
interesting, creative and challenging than traditional ICT, which is viewed as somewhat vague and
monotonous by comparison.
A key concern from those teachers less favourable to the new computing curriculum, particularly in
secondary schools/colleges, is that the balance of content is weighted too heavily towards computer
science and that vital and fundamental ICT skills are at risk of being side-lined. There is also some
concern that the new curriculum has been implemented in England without sufficient regard to who
would teach it and the potential amount of additional knowledge/upskilling that may be required by
teachers.
Understanding Computing Education in the UK
May 2017 Page 61
On a scale from 1 ‘not at all confident’ to 10 ‘completely confident’, teachers rated their confidence
in delivering the curriculum at each distinct Key Stage/level. Levels of confidence are lower among
surveyed secondary schools than primary schools, and there is a drop in the mean confidence rating
across each successive level of secondary education, from 8.5 at Key Stage 3, down to 6.6 at A
level/equivalent. Looking across the four teacher profiles, Advocates are the most confident in
delivering the curriculum, while the Less Engaged group of teachers are the least confident.
Analysis of confidence levels relating to specific aspects of curriculum delivery reveals that schools
are more confident in relation to some aspects than others. To improve levels of confidence, schools
are calling for more training to improve their subject knowledge, make the most of curriculum
opportunities, better understand qualification grade boundaries, identify how to get the most out of
mixed ability classes, and be able to teach more complex aspects of computing theory.
Looking at the highest level qualifications held by teachers with at least some responsibility for
computing education, the survey has identified a range of background disciplines, be it in STEM
subjects, humanities or the arts. Looking across the four profiles, Advocates share a comparatively
higher proportion of Computer Science qualifications than the other groups.
Finally, the survey examined the total number of hours spent by teachers on computing-related CPD
during 2015-16, along with further details about the nature of those activities. The most common
answer was zero hours (28% of primary teachers and 26% of secondary teachers) however there are
wide variations in the amount and nature of CPD undertaken. The most common is teacher network
meetings (e.g. CAS hubs), followed by external training courses. Looking across the four profiles,
Advocates have been the most involved in CAS-related CPD.
Understanding Computing Education in the UK
May 2017 Page 62
4. Teaching and Assessment Approaches
The research has revealed that computing education opens the door to a variety of creative
approaches to teaching, as well cross-curricular links with other subjects. Support from senior
leadership teams is considered important, as is the rich array of educational resources that can help
to make computing engaging and interesting for learners. A range of practices (including examples of
obstacles faced) are explored below, along with approaches to assessment.
4.1 Pedagogy
A range of pedagogical approaches are used by teachers, for example:
• Direct explanation of concepts and theory;
• Use of worksheets that enable students to execute codes in programmes, e.g. making
animated characters perform a particular action;
• Extended tinkering, e.g. as part of class competitions to be the first to programme a robot to
throw a ball to a set distance/direction;
• Project based work such as designing web content and working with audio-visual
technology; and
• ‘Unplugged’ activities so that students can learn computational thinking without needing
hardware.
Unplugged activities require imagination but can be cost-effective, especially when there may not be
enough hardware for every student. In one case study primary school, teachers set activities for
pupils to find instructions where logic processes needed to be followed, for example the steps
needed to successfully operate a fire extinguisher.
“There are amazing things you can do with very little.”
Computing Subject Leader, Primary school
An especially successful approach in computing is ‘trial and error’, which involves embedding the
mind-set among students that making mistakes is OK, moreover that this is necessary to working
through a logic problem. One way teachers do this, especially for the younger year groups, is to talk
about certain activities as ‘games’, which helps to make learning more engaging.

Understanding Computing Education in the UK
May 2017 Page 63
Another common approach is ‘copy coding’, where the teacher explains a concept/scenario and
students replicate instructions, usually to reach a single solution. This can sometimes involve
spotting and debugging a deliberately inserted error. Assessment of this approach tends to focus on
how far students got with the activity, how many attempts it took, and speed of completion.
Primary school participants in the discussion groups and case studies described how they engage
pupils by relating work to popular cultural identities, such as animating characters from the films
Star Wars and Frozen. One secondary teacher advocated having a bank of different types of
programmes available for use in class, which can be selected depending on whether students are
more artistically or mathematically minded, in order to make the subject as appealing as possible.
The case study visits found that particular approaches tend to suit some students better than others,
depending on how they prefer to learn. One of the Year 10 girls at a secondary school said she
prefers it when the teacher spends more time explaining things in detail before the practical work
begins, however a Year 9 boy said that he doesn’t like to spend too long on the theory and prefers
“having a go”.
“There’s an element of trial and error. If the students are already enthusiastic about programming I
give them an individual project and they get on with it. For the rest of them I direct my attention to
explaining the concept, whilst all the time walking around the room to see how they are getting on
with it on the computer.”
Head of Computer Science, Secondary School
More detailed research would be needed to examine the relative effectiveness of different
pedagogical approaches in practice and how well these engage students and help them to think
independently.
4.2 Cross-Curricular Links
Computing offers a number of cross-curricula links. In one of the case study primary schools, a
teacher had the idea of creating a floor mat designed with local landmarks, with pupils learning
about their local area by programming a bee bot33 to navigate its way between different points.
In a secondary school, a year 10 pupil described how computing “changes the way you think”, which
has helped her to break down and tackle complex problems in maths. A secondary teacher at the
London discussion group described how the concept of ‘debugging’ can be applied to word editing
and therefore developed through English lessons.
In secondary schools, forging links with other departments can be constrained by time and a
misperception that the computing curriculum is too narrow. Schools also mentioned facing
33 A bee bot is a programmable floor robot in the shape of a bee. It has a simple layout of function button (forward, rotate left, rotate right, stop etc.) teaching control, directional language and programming to younger children.
Understanding Computing Education in the UK
May 2017 Page 64
resistance from other departments, be it due to competing pressures or a lack of understanding
about computing education, thus missing out on potential cross-curricular opportunities.
“The new computing curriculum uses and applies maths skills and helps to develop children's online
safety awareness. This is very important in today's society.”
Computing teacher, Primary school
“As a science teacher I believe the role of computing needs to be better recognised as a science.”
Computing teacher, Secondary school
4.3 Access to Teaching Support
4.3.1 Senior Leadership Teams
In several of the discussion groups, teachers emphasised how the buy-in and attitude of senior
leadership teams to computing can make a big difference to the culture in the school, attitude of all
staff towards computing, and the level of investment in professional development and other
resources.
In some primary schools, the focus appears to be very much on core subjects such as maths and
English, whereas in others, computing can be given greater priority where the head teacher
considers it a valuable subject for young people to learn. Participants at the Cardiff workshop
explained that computing gets side-lined where senior leaders believe there to be other subjects
most likely to generate the best student grade performance, rather than investing in the subject for
the longer term.
In Belfast it was noted that the ‘image’ of Computer Science can be a barrier, for example where the
subject is perceived by senior leaders as ‘specialist’ rather than ‘mainstream’. It was also argued at
the discussion group that teachers and parents may be more likely to encourage students to follow
an alternative and “easier” subject where they stand the chance of getting a higher grade that will
help them progress to university.
At the Plymouth discussion group, one participant explained how senior leaders should be
recognising where teachers of other subjects could be particularly successful in delivering
computing, particularly where they have relevant industry experience or have shown enthusiasm for
the subject. It appears that this does not always happen, with one report of a teacher having left her
position because she wanted to teach the subject but wasn’t given the chance.

Understanding Computing Education in the UK
May 2017 Page 65
4.3.2 External Organisations and Resources
The research revealed anecdotal evidence of an exponential growth in the amount of teaching
resources following the introduction of the new curriculum in England, with many commercial
organisations and suppliers now tapping into the schools market. This can make it difficult for
teachers to know what to select and trust, with examples given of hugely expensive packages which
have turned out to be disappointing. Some schools have found it useful to partner with one another
to share resources, with examples given in the Edinburgh discussion group of universities supporting
schools, for example by providing exemplar lesson materials or running tutorials for students.
Survey respondents were asked to list the three most beneficial organisations or resources that they
have drawn on to improve the effectiveness of computing education in their schools. The resulting
lists are shown in Table 13 (primary) and Table 14 (secondary)34. Entries are ranked by percentage
share of total responses and the top 10 in each list are shaded.
Table 13 Most beneficial supporting organisations and resources – primary schools
Barefoot 17.7% Google 1.0%
Computing At School (CAS) 15.3% Lego Education 1.0%
Scratch 11.4% Thinkyouknow 1.0%
Rising Stars 6.5% 2Simple 0.7%
Purple Mash 5.3% BT 0.7%
Code.org 2.9% Code for Life 0.7%
Espresso 2.9% Education City 0.7%
Code Club 2.7% Future Learn 0.7%
Switched On Computing 2.7% Twitter 0.7%
Hour of Code 2.4% 3BM 0.5%
Raspberry Pi 1.9% BETT Show 0.5%
Twinkl 1.7% Computer Science Unplugged 0.5%
BBC 1.5% DASCO 0.5%
CEOP 1.5% Discovery Coding 0.5%
Code It 1.5% Glow Scotland35 0.5%
Phil Bagge resources 1.5% Icompute 0.5%
National STEM Centre 1.5% Kodu 0.5%
Tablets 1.5% Microsoft 0.5%
Apple 1.2% NAACE 0.5%
LGFL 1.2% Openzone CLC 0.5%
Common Sense Media 1.0% Simon Haughton 0.5%
DB Primary 1.0% YouTube 0.5%
34 To delimit the number of entries, an organisation/resource qualifies for inclusion in these lists if mentioned by at least two respondents. 35 Mentioned by four Scotland-based teachers only.

Understanding Computing Education in the UK
May 2017 Page 66
Table 14 Most beneficial supporting organisations and resources – secondary schools
Computing At School 36.5% Google 0.6%
OCR 5.2% Khan Academy 0.6%
TES 5.2% CS4FN 0.5%
Teach ICT 4.1% Edge Hill 0.5%
PG Online 3.4% Scholar 0.5%
Facebook Groups 3.3% WJEC 0.5%
BBC (Micro:bit/Bitesize) 3.1% Codio 0.3%
Zig Zag 2.1% MIT 0.3%
Code Academy 1.8% Nichola Wilkin 0.3%
Raspberry Pi 1.7% Pixl 0.3%
Cambridge Resources 1.6% Southampton University 0.3%
National STEM centre 1.5% University of Warwick 0.3%
Scratch 1.4% Adobe 0.2%
YouTube 1.3% Arduino 0.2%
AQA 1.1% Axsied 0.2%
BCS, The Chartered Institute for IT, 1.1% Barefoot 0.2%
Python 1.1% Compute-IT 0.2%
W3Schools 1.1% Computerphile 0.2%
Code Academy 1.0% Dynamic Learning 0.2%
Code.org 1.0% Exampro 0.2%
Craig and Dave 1.0% Future Learn 0.2%
Hodder Education 1.0% Glow Scotland36 0.2%
Hour of Code 1.0% Grok Learning 0.2%
Alan O'Donohoe/EXA Foundation 0.9% Kodu 0.2%
Computer Science UK 0.9% Kings College London 0.2%
Exam Boards (generic) 0.9% Minecraft 0.2%
CompEdNet 0.8% MMU 0.2%
Pearson Edexcel 0.7% Queen Mary's University London 0.2%
Microsoft 0.7% Repl.it 0.2%
Plan C 0.7% Royal Society of Edinburgh (RSE) 0.2%
Stack Exchange/Overflow 0.7% Sheffield Hallam University 0.2%
Techno Camps 0.7% SWAT 0.2%
AOK Learning 0.6% Teaching London Computing 0.2%
Code Club 0.6% theteacher.info 0.2%
“CAS has been a God-send to me… The people at CAS are educators, so everything is pitched at the
right level. That’s why their lesson plans and activities are so effective.”
Head of Computing, Secondary school
36 Mentioned by two Scotland-based teachers only.

Understanding Computing Education in the UK
May 2017 Page 67
Other types of support have included working with local cluster groups of schools (including
resource sharing between primary and secondary schools), attending teacher networking meetings
and computing conferences, as well as meetings and seminars organised by local authorities,
awarding organisations and STEM Centres. Some schools have also engaged directly with subject
specialists at local colleges and universities, and made links with industry to facilitate work taster
days and arrange for employer talks in the school.
Secondary schools were asked a further question to gauge how much they depend on help and
support provided by volunteer experts. The majority (86%) are not reliant on this type of support
(Figure 26).
Figure 26 Reliance on help and support from volunteer experts – secondary schools/colleges
4.3.3 Online Groups and Forums
Just under a third of primary schools (27%) and almost of half of secondary schools (47%) are reliant
on help and support provided by online groups and forums to deliver computing. This is especially
the case among CAS engaged respondents, suggesting they may have a greater awareness of online
support channels and confidence in knowing what to trust (Figures 27 and 28).
The fact that such a large proportion of schools do not rely on this kind of online support suggests
that they either consider themselves to be already proficient (where this may or may not always be
the case), prefer to use other types of resources, or feel unable to access online support for
whatever reason.
8%
8%
8%
8%
8%
10%
86%
85%
86%
85%
88%
100%
90%
6%
7%
6%
7%
4%
0% 20% 40% 60% 80% 100%
All
CAS Engaged
Non-CAS Engaged
England
Scotland
Wales
Northern Ireland
Base: 371 respondents
Very/quite reliant Not very/not at all reliant Don't know

Understanding Computing Education in the UK
May 2017 Page 68
Figure 27 Reliance on help and support from online sources – primary schools
Figure 28 Reliance on help and support from online sources – secondary schools/colleges
27%
43%
23%
25%
31%
56%
47%
58%
58%
53%
17%
10%
19%
18%
17%
0% 20% 40% 60% 80% 100%
All
CAS Engaged
Non-CAS Engaged
Head Teacher/Subject Lead
Other Teacher of Computing
Base: 335 respondents
Very/quite reliant Not very/not at all reliant Don't know
47%
57%
45%
48%
46%
48%
46%
33%
54%
47%
40%
48%
48%
45%
47%
52%
61%
15%
6%
3%
7%
5%
9%
6%
2%
6%
31%
0% 20% 40% 60% 80% 100%
All
CAS Engaged
Non-CAS Engaged
HoD/Subject Lead for Computing
Other Teachers
England
Scotland
Wales
Northern Ireland
Base: 581 respondents
Very/quite reliant Not very/not at all reliant Don't know
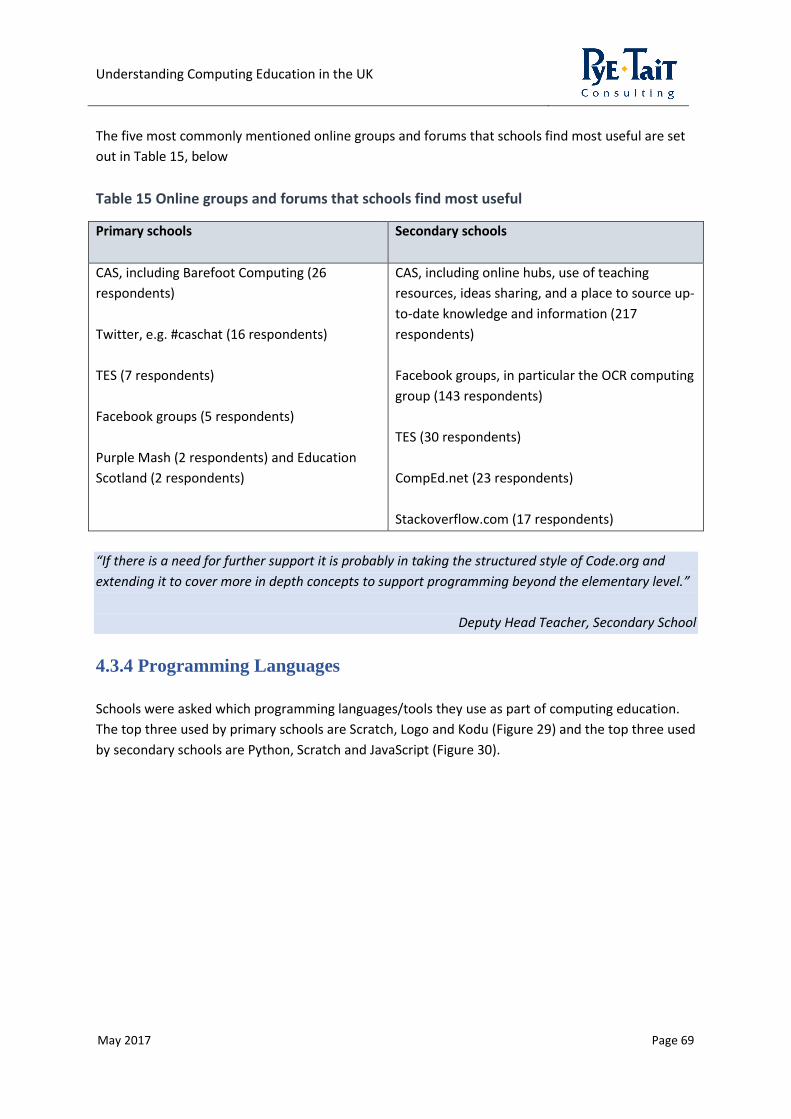
Understanding Computing Education in the UK
May 2017 Page 69
The five most commonly mentioned online groups and forums that schools find most useful are set
out in Table 15, below
Table 15 Online groups and forums that schools find most useful
Primary schools Secondary schools
CAS, including Barefoot Computing (26
respondents)
Twitter, e.g. #caschat (16 respondents)
TES (7 respondents)
Facebook groups (5 respondents)
Purple Mash (2 respondents) and Education
Scotland (2 respondents)
CAS, including online hubs, use of teaching
resources, ideas sharing, and a place to source up-
to-date knowledge and information (217
respondents)
Facebook groups, in particular the OCR computing
group (143 respondents)
TES (30 respondents)
CompEd.net (23 respondents)
Stackoverflow.com (17 respondents)
“If there is a need for further support it is probably in taking the structured style of Code.org and
extending it to cover more in depth concepts to support programming beyond the elementary level.”
Deputy Head Teacher, Secondary School
4.3.4 Programming Languages
Schools were asked which programming languages/tools they use as part of computing education.
The top three used by primary schools are Scratch, Logo and Kodu (Figure 29) and the top three used
by secondary schools are Python, Scratch and JavaScript (Figure 30).

Understanding Computing Education in the UK
May 2017 Page 70
Figure 29 Programming languages – primary schools
38%
17%
15%
7%
4%
4%
3%
3%
3%
2%
2%
1%
1%
1%
0%
0%
0%
0%
0%
0%
0%
0% 10% 20% 30% 40%
Scratch
Logo
Kodu
Python
Other
Blockly
JavaScript
Microsoft TypeScript
Espresso
Purple Mash
Java
Swift
Touch Develop
Visual Basic
Alice
C-languages (C, C#. C++)
Greenfoot
Small Basic
Pascal
PHP
Ruby
Base: 174 responses

Understanding Computing Education in the UK
May 2017 Page 71
Figure 30 Programming languages – secondary schools/colleges
4.4 Assessment
In the discussion groups, primary schools described how the absence of a formal assessment regime
gives teachers the freedom to experiment with the subject and try new things, which they value
strongly.
In secondary schools, there is mixed evidence of formative and summative assessment approaches,
for example some schools assess computational ‘behaviours’ such as problem solving on an on-going
21%
19%
10%
8%
6%
5%
5%
4%
4%
4%
4%
3%
3%
2%
1%
1%
1%
1%
0%
0%
0% 10% 20% 30%
Python
Scratch
JavaScript
Kodu
Visual Basic
Logo
Small Basic
C-languages (C, C#. C++)
PHP
Other
Java
Blockly
Touch Develop
Greenfoot
Alice
HTML
Pascal
Swift
Microsoft TypeScript
Ruby
Base: 1,508 responses

Understanding Computing Education in the UK
May 2017 Page 72
basis, whilst others prefer to use a ‘tick-box’ approach to monitor the completion of specific topics –
with the latter tending to be more common.
Key Stage 3 reportedly allows more flexibility in assessment, with several examples of teachers
explaining a concept and setting a task at the start of a lesson, followed by students undertaking
computer-based work, saving their progress in an electronic folder, and then being awarded a mark
based on their progress.
In Plymouth there was some discussion around written versus oral assessments, notably that a
verbal explanation of how a student would solve a problem is not necessarily less valuable than a
written one, such as annotating screen shots. It was argued that in the world of work, oral
explanations and demonstrations are an important skill; furthermore that this might better suit
those students who have a great problem solving mind but find it more difficult to articulate their
reasoning on paper.
GCSE and A level Computer Science specifications attracted some criticism through the survey and
discussion groups for being difficult to interpret and containing too much content, which can lead to
the syllabus being rushed and corners cut. In Birmingham, participants referred to the sheer volume
of content being partly responsible for ICT elements being “squeezed out”, and a participant in
Belfast commented that “the complexity and volume far exceeds any other GCSE” and that “it’s
almost at A level standard”.
Several teachers mentioned receiving insufficient guidance from awarding organisations around
performance benchmarks and grade boundaries, and criticised the controlled assessments for taking
up too much time, with teachers describing these assessment approaches as “soul destroying” and
“nightmarish”.
“There’s no way we’ll get through the GCSE in time for the summer exams”.
Computing teacher, Secondary school
4.5 Chapter Summary
The research has revealed that a variety of pedagogical approaches are used by computing teachers.
These include direct explanation of concepts and theory; use of worksheets that enable students to
execute codes in programmes; extended tinkering (e.g. as part of class competitions); project based
work; and ‘unplugged’ activities whereby students learn computational thinking in creative ways
without needing access to hardware. An especially successful approach in computing is ‘trial and
error’, which involves embedding the mind-set among students that making mistakes is an
important part of solving a logic problem.

Understanding Computing Education in the UK
May 2017 Page 73
Computing also offers cross-curricula links, for example computational thinking appears to be
helping some pupils in their approach to solving problems in maths and can be used to tackle word
editing and structuring poetry in English.
In terms of support available for computing teachers, a key theme raised in the discussion groups is
that the buy-in and attitude of senior leadership teams to computing can make a big difference to
the attitude of staff towards computing and the level of investment in professional development and
other subject-specific resources.
Schools draw on support from a wide range of external organisations and resources, with the top
three among surveyed primary schools being Barefoot, CAS and Scratch. In surveyed secondary
schools/colleges, CAS resources account for more than a third (37%) of all external resources used.
Due to reports of an exponential rise in the number of teaching materials and resources coming to
market since the changes to the curriculum, teachers report finding it difficult to know what to
select and trust.
A minority of surveyed schools (27% of primary schools and 47% of secondary schools/colleges) say
they are reliant on help and support provided by online groups and forums to deliver computing.
This finding suggests that the majority either consider themselves to be already proficient, prefer to
use other types of resources, or feel unable to access online support for whatever reason.
Finally, the topic of assessment was covered in the discussion groups, with primary schools
describing how the absence of a formal assessment regime for computing gives teachers the
freedom to experiment with the subject and try new things, which they value strongly. In secondary
schools, there is mixed evidence of formative and summative assessment approaches, for example
some schools assess computational ‘behaviours’ such as problem solving on an on-going basis, whilst
others prefer to use a ‘tick-box’ approach to monitor the completion of specific topics. GCSE and A
level Computer Science specifications attracted some criticism through the survey and discussion
groups for being difficult to interpret, containing too much content (which can lead to the syllabus
being rushed and corners cut), and being supported by insufficient guidance from awarding
organisations, particularly around performance benchmarks and grade boundaries.

Understanding Computing Education in the UK
May 2017 Page 74
5. The Learning Environment
The way computing education is coordinated in schools provides an indication of how highly the
subject is prioritised among others. This section examines timetables hours, specialist and non-
specialist teachers (including shared subject responsibilities), budgets allocated to computing, trends
in investment (financial and non-financial), as well as the adequacy of physical resources and
teaching space. It goes on to explore how computing is delivered beyond the classroom, including
the types and frequency of extra-curricular activities.
5.1 Timetabled Hours
For surveyed primary schools in England, Wales and Scotland37, the most common (modal) amount
of computing education undertaken by each pupil in 2015/16 was one hour per week. This ranges
from zero hours (mentioned by seven schools in England and one in Scotland) to four hours
(mentioned by one Voluntary Controlled school in England and one local authority school in
Scotland).
In secondary schools/colleges in England, Wales and Northern Ireland, the most common answer for
each year of Key Stage 3 was also one hour per week. This ranges from zero hours (25 schools) to
three hours (23 schools). A total of four surveyed schools reported no computing education at all at
Key Stage 3 (i.e. Years 7, 8 or 9).
The most common answer at GCSE was three hours and at A level five hours per week. These modal
answers appear higher than expected and should be treated with some caution. It is not clear
whether some schools may have reported more than one subject together, for example where
students have been taking both ICT and Computer Science, or other computing-related qualifications
alongside a core GCSE/A level. For these reasons further analysis has not be conducted on these
results.
In Scotland, the most commonly reported number of hours was one hour per week at levels S1 and
S2, rising to two hours at S3, then increasing to four hours at S4 and five hours at levels S5 and S6.
5.2 Specialist and Non-Specialist Teachers
Table 16 shows the average number of full time equivalent (FTE) staff with at least some
responsibility for delivering computing education per surveyed school.
37 There are insufficient data to report timetabled hours for primary schools in Northern Ireland.

Understanding Computing Education in the UK
May 2017 Page 75
In primary schools, aspects of computing are delivered by general class teachers as part of the wider
curriculum. That said, the primary school case studies and some discussion group conversations
revealed how the presence of one or more specialist teachers can be especially helpful, for example:
identifying and selecting teaching resources, acquiring equipment, spreading enthusiasm,
encouraging other staff to participate in CPD, as well as building links such as with other schools and
industry.
Secondary schools and colleges appear to have a mix of specialist and non-specialist teachers
delivering the subject. This was observed in one of the case study schools, where two maths
teachers had been temporarily deployed to deliver computing alongside two other specialist
computing teachers.
Table 16 Average FTE staff per school with at least some responsibility for computing education
Teaching responsibility
Primary schools Secondary schools/colleges
Specialist computing teachers (i.e.
computing is the only subject they teach)
0.5 2.0
Other teachers (i.e. general class teachers
in primary schools and teachers of other
subjects in secondary schools)
10.0 2.0
Non-teaching staff member (e.g.
technician/maintenance staff)
1.0 2.0
Total
11.5
(of which 10.5 are teachers)
6
(of which 4 are teachers)
Drilling into these results in more detail, the majority of surveyed primary schools (84%) have a
designated lead teacher of computing education. Of these lead teachers, more than half (54%) also
have responsibility for leading at least one other subject area, most commonly Maths, Design and
Technology and/or the Sciences. The mix of subject responsibilities among lead computing teaches
in primary schools is shown in Figure 3138.
38 Responses to this question classified as ‘Other’ include: Head teacher, Music, PSHE, Religious Education, and Special Educational Needs.

Understanding Computing Education in the UK
May 2017 Page 76
Figure 31 Mix of subjects managed by lead computing teachers – primary schools
The majority of surveyed secondary schools (88%) have a dedicated department that specifically
teaches computing education. In the remaining cases computing is taught as part of another faculty,
most commonly combined with business studies, technology or maths.
Of the non-specialist computing teachers in secondary schools, the mix of other subjects taught is
shown in Figure 32. The results suggest that schools are drawing on a range of other subject
teachers to deliver computing, with the most common being Business Studies, Maths, and Design
and Technology, but also including subjects as diverse as Humanities, Languages and PE39.
39 Responses to this question classified as ‘Other’ include: Citizenship, Economics, Health and Social Care, Law, PSHE, Psychology Travel and Tourism, as well as Special Educational Needs and cover for a primary school.
46%
9%
9%
9%
7%
7%
7%
5%
1%
0%
0% 20% 40% 60%
Not leading on any other subjects – computing only
Maths
Other
Design and Technology
Sciences
Arts (including English)
Physical Education
Humanities
Languages
Business Studies
Base: 174 responses

Understanding Computing Education in the UK
May 2017 Page 77
Figure 32 Mix of other subjects taught by computing teachers – secondary schools/colleges
Many surveyed teachers and discussion group participants expressed concern about an apparent
“expectation” or “inevitability” that computing is taught by non-specialists, particularly given how
the curriculum in England was introduced so quickly. In some cases these views were given by
teachers who were themselves relatively confident about teaching the subject, but appeared to be
making a wider observation about other teachers in their school. A number of ICT teachers made the
point in the survey that they have struggled to get to grips with the new curriculum.
In Newcastle it was mentioned that students in Year 9 (preparing to make their GCSE choices) risk
being put off taking the GCSE by non-specialist teachers who don’t have the same level of
enthusiasm and passion as subject specialists.
“We’ve had teachers in tears because they couldn’t grasp the basics of what the kids are supposed to
be learning in primary school.”
Computing teacher, Secondary school
5.3 Investment
5.3.1 Budget allocated to computing
Surveyed secondary schools/colleges were asked to provide their total budget allocated to
computing education in the 2015/16 academic year. Using this information it is possible to
determine the average available budget per student.
23%
16%
12%
12%
11%
9%
9%
5%
3%
0% 10% 20% 30%
Business Studies
Maths
Design and Technology
Other
Sciences
Arts & Media (inc. English)
Humanities
Languages
Physical Education
Base: 811 responses
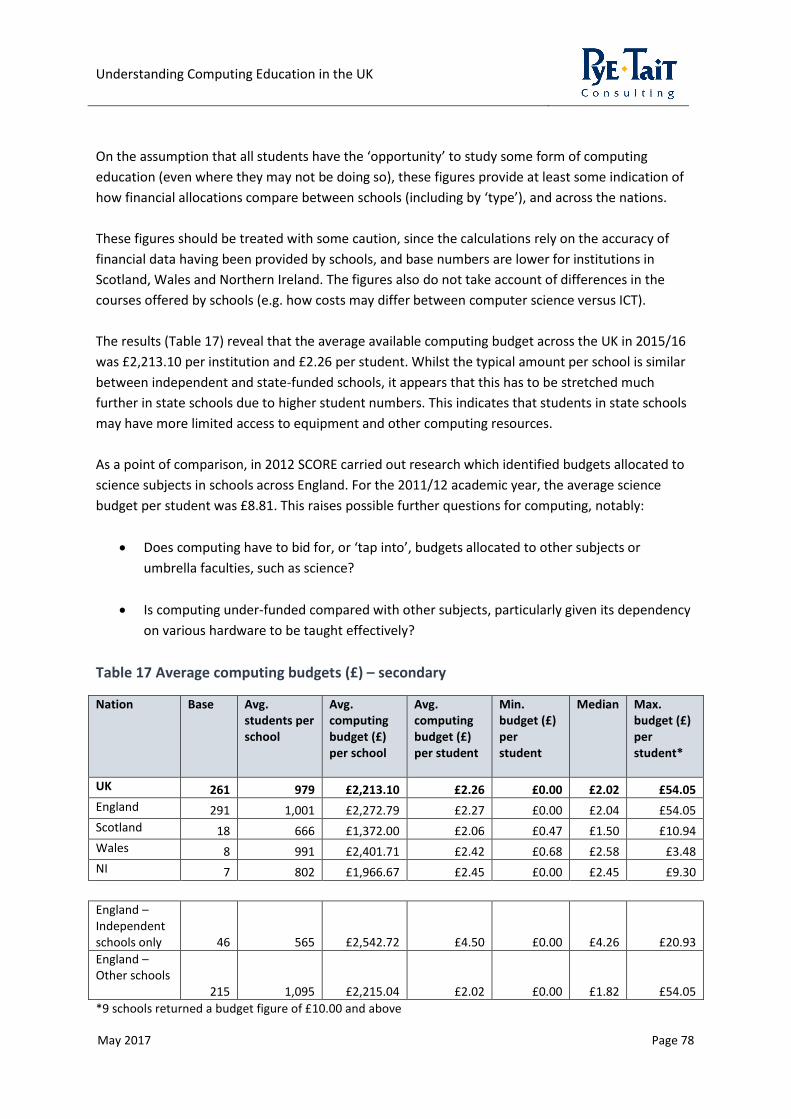
Understanding Computing Education in the UK
May 2017 Page 78
On the assumption that all students have the ‘opportunity’ to study some form of computing
education (even where they may not be doing so), these figures provide at least some indication of
how financial allocations compare between schools (including by ‘type’), and across the nations.
These figures should be treated with some caution, since the calculations rely on the accuracy of
financial data having been provided by schools, and base numbers are lower for institutions in
Scotland, Wales and Northern Ireland. The figures also do not take account of differences in the
courses offered by schools (e.g. how costs may differ between computer science versus ICT).
The results (Table 17) reveal that the average available computing budget across the UK in 2015/16
was £2,213.10 per institution and £2.26 per student. Whilst the typical amount per school is similar
between independent and state-funded schools, it appears that this has to be stretched much
further in state schools due to higher student numbers. This indicates that students in state schools
may have more limited access to equipment and other computing resources.
As a point of comparison, in 2012 SCORE carried out research which identified budgets allocated to
science subjects in schools across England. For the 2011/12 academic year, the average science
budget per student was £8.81. This raises possible further questions for computing, notably:
• Does computing have to bid for, or ‘tap into’, budgets allocated to other subjects or
umbrella faculties, such as science?
• Is computing under-funded compared with other subjects, particularly given its dependency
on various hardware to be taught effectively?
Table 17 Average computing budgets (£) – secondary
Nation Base Avg. students per school
Avg. computing budget (£) per school
Avg. computing budget (£) per student
Min. budget (£) per student
Median Max. budget (£) per student*
UK 261 979 £2,213.10 £2.26 £0.00 £2.02 £54.05
England 291 1,001 £2,272.79 £2.27 £0.00 £2.04 £54.05
Scotland 18 666 £1,372.00 £2.06 £0.47 £1.50 £10.94
Wales 8 991 £2,401.71 £2.42 £0.68 £2.58 £3.48
NI 7 802 £1,966.67 £2.45 £0.00 £2.45 £9.30
England – Independent schools only 46
565 £2,542.72 £4.50 £0.00 £4.26 £20.93
England – Other schools 215 1,095 £2,215.04 £2.02 £0.00 £1.82 £54.05
*9 schools returned a budget figure of £10.00 and above
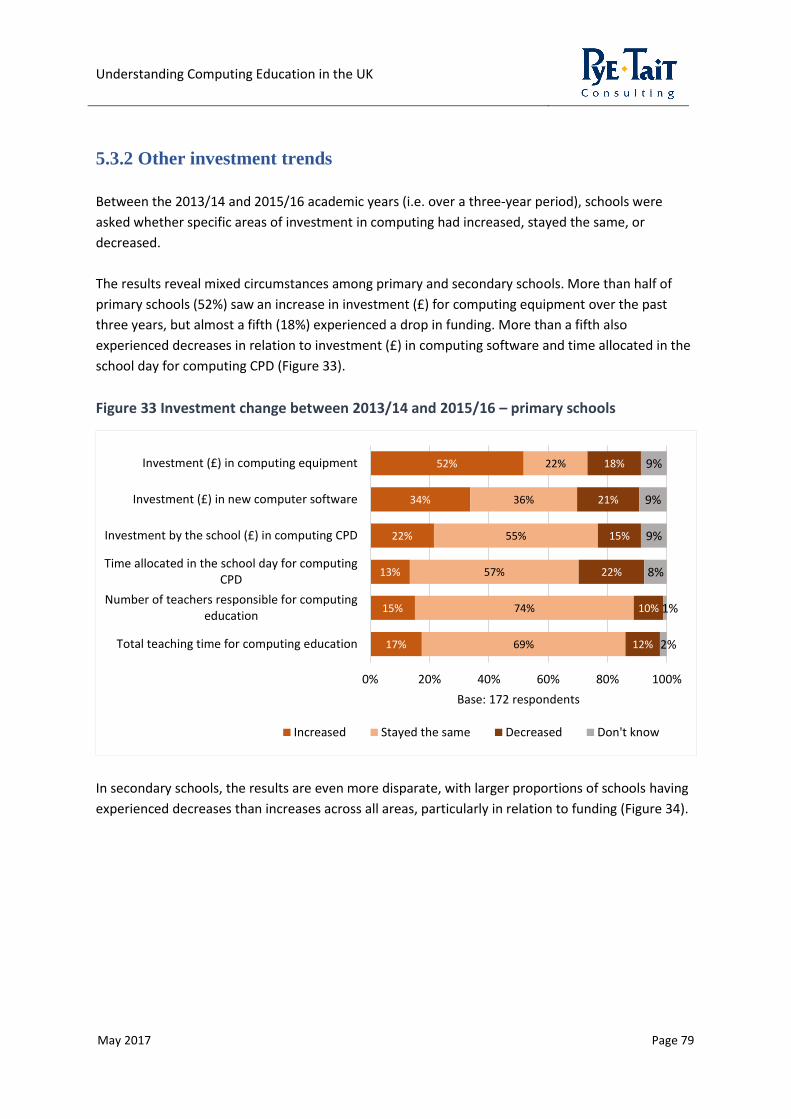
Understanding Computing Education in the UK
May 2017 Page 79
5.3.2 Other investment trends
Between the 2013/14 and 2015/16 academic years (i.e. over a three-year period), schools were
asked whether specific areas of investment in computing had increased, stayed the same, or
decreased.
The results reveal mixed circumstances among primary and secondary schools. More than half of
primary schools (52%) saw an increase in investment (£) for computing equipment over the past
three years, but almost a fifth (18%) experienced a drop in funding. More than a fifth also
experienced decreases in relation to investment (£) in computing software and time allocated in the
school day for computing CPD (Figure 33).
Figure 33 Investment change between 2013/14 and 2015/16 – primary schools
In secondary schools, the results are even more disparate, with larger proportions of schools having
experienced decreases than increases across all areas, particularly in relation to funding (Figure 34).
52%
34%
22%
13%
15%
17%
22%
36%
55%
57%
74%
69%
18%
21%
15%
22%
10%
12%
9%
9%
9%
8%
1%
2%
0% 20% 40% 60% 80% 100%
Investment (£) in computing equipment
Investment (£) in new computer software
Investment by the school (£) in computing CPD
Time allocated in the school day for computingCPD
Number of teachers responsible for computingeducation
Total teaching time for computing education
Base: 172 respondents
Increased Stayed the same Decreased Don't know

Understanding Computing Education in the UK
May 2017 Page 80
Figure 34 Investment change between 2013/14 and 2015/16 – secondary schools/colleges
“There’s no training. The whole curriculum has changed and ICT teachers are teaching full days then
going home to learn coding, alone and under pressure.”
Head of ICT, Secondary school
5.4 Physical Capacity
5.4.1 Impact of Rising Student Numbers
Annual national increases in student numbers are likely to put increasing pressure on class sizes,
teaching space and potentially the numbers of teachers who need to be available and equipped to
deliver effective computing education in the future. In England for example, total primary school
pupils rose by 11% (465,000) in the ten years from 2006 to 201640, which will have a knock-on
impact on secondary schools in years to come.
40 Department for Education (2016) Schools, pupils and their characteristics, January 2016. Table 2a.
7%
16%
10%
15%
11%
24%
22%
37%
32%
35%
47%
45%
49%
46%
49%
43%
44%
30%
37%
26%
30%
7%
10%
11%
8%
8%
2%
2%
0% 20% 40% 60% 80% 100%
Budget (£, apart from salaries) allocated tocomputing
Investment (£) in computing equipment
Investment (£) in new computer software
Investment by the school (£) in computing CPD
Time allocated in the school day for computingCPD
Number of teachers responsible for computingeducation
Total teaching time for computing education
Base: 327 respondents
Increased Stayed the same Decreased Don't know

Understanding Computing Education in the UK
May 2017 Page 81
5.4.2 Suitability of Physical Resources
Computing education depends on a range of technologies such as computers, tablets, multimedia
devices, microcontrollers and robotics, with examples including the BBC micro:bit41, Raspberry Pi42,
Arduino43 and Bee bot44. It also depends on teaching spaces that allow a blend of online and offline
learning and good internet connectivity.
On a scale from 1 ‘very poor’ to 10 ‘excellent’, surveyed teachers were asked to rate the suitability of
their equipment and other physical resources for enabling students to meet the requirements of the
computing curriculum.
Average ratings are reasonably favourable, and very similar among primary schools (6.7 out of 10)
and secondary schools/colleges (6.9 out of 10), although the distribution of ratings shows mixed
perceptions/experiences. Specifically, 36% of primary teachers rated the suitability of physical
resources at 8 or above, whilst a quarter (25%) gave a rating of 5 or below. In secondary schools,
almost half of respondents (47%) rated physical resources at 8 or above, whilst just over a quarter
(26%) gave a rating of 5 or below (Figures 35 to 38).
Figure 35 Perceived suitability of physical resources – primary schools (means)
41 In March 2016, the BBC issued one million BBC micro:bit controllers free to year 7 students in England and Wales, S1 students in Scotland and year 8 students in Northern Ireland. The pocket-sized code-able computer allows young people to programme anything they want, from simple games to smart watches and even fitness trackers. 42 The Raspberry Pi is a credit-card sized computer that plugs into a monitor and keyboard and can be used in electronics projects and to help learn programming 43 The Arduino is a microcontroller for making things that can sense and control the physical world. It reads inputs like switches and sensors to create outputs, such as flashing lights, sounds and moving motors. The creative possibilities are extensive, for example it could be used to build an electric toothbrush or a 3D printer. 44 A bee bot is a programmable floor robot in the shape of a bee. It has a simple layout of function button (forward, rotate left, rotate right, stop etc.) teaching control, directional language and programming to younger children.
6.7
7.0
6.6
6.6
6.7
0 1 2 3 4 5 6 7 8 9 10
All
CAS Engaged
Non-CAS Engaged
Head Teacher/Subject Lead
Other Teacher of Computing
Base: 341 respondents

Understanding Computing Education in the UK
May 2017 Page 82
Figure 36 Perceived suitability of physical resources – primary schools (rating distribution)
Figure 37 Perceived suitability of physical resources – secondary schools/colleges (means)
3% 2%
5% 4%
11%
15%
25%
21%
9%
6%
0%
5%
10%
15%
20%
25%
30%
1 2 3 4 5 6 7 8 9 10
6.9
7.2
6.9
7.1
6.7
7.0
6.7
7.4
6.1
0 2 4 6 8 10
All
CAS Engaged
Non-CAS Engaged
HoD/Subject Lead for Computing
Other Teachers
England
Scotland
Wales
Northern Ireland
Base: 598 respondents
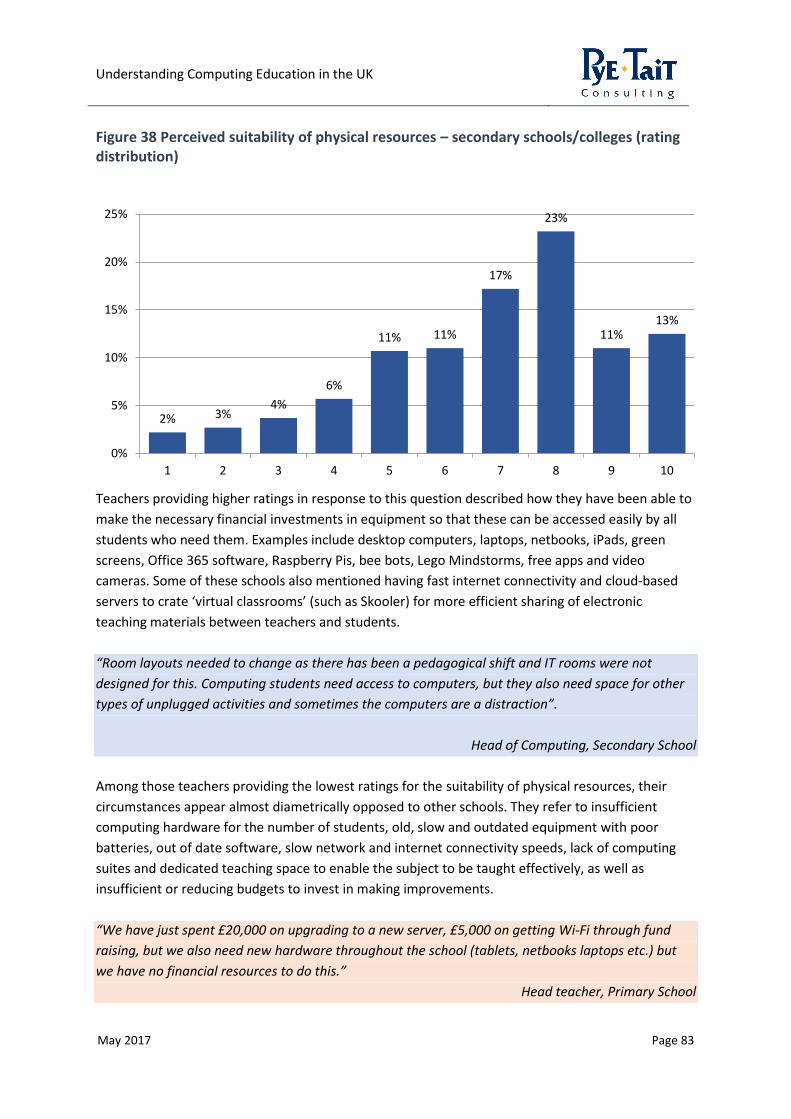
Understanding Computing Education in the UK
May 2017 Page 83
Figure 38 Perceived suitability of physical resources – secondary schools/colleges (rating distribution)
Teachers providing higher ratings in response to this question described how they have been able to
make the necessary financial investments in equipment so that these can be accessed easily by all
students who need them. Examples include desktop computers, laptops, netbooks, iPads, green
screens, Office 365 software, Raspberry Pis, bee bots, Lego Mindstorms, free apps and video
cameras. Some of these schools also mentioned having fast internet connectivity and cloud-based
servers to crate ‘virtual classrooms’ (such as Skooler) for more efficient sharing of electronic
teaching materials between teachers and students.
“Room layouts needed to change as there has been a pedagogical shift and IT rooms were not
designed for this. Computing students need access to computers, but they also need space for other
types of unplugged activities and sometimes the computers are a distraction”.
Head of Computing, Secondary School
Among those teachers providing the lowest ratings for the suitability of physical resources, their
circumstances appear almost diametrically opposed to other schools. They refer to insufficient
computing hardware for the number of students, old, slow and outdated equipment with poor
batteries, out of date software, slow network and internet connectivity speeds, lack of computing
suites and dedicated teaching space to enable the subject to be taught effectively, as well as
insufficient or reducing budgets to invest in making improvements.
“We have just spent £20,000 on upgrading to a new server, £5,000 on getting Wi-Fi through fund
raising, but we also need new hardware throughout the school (tablets, netbooks laptops etc.) but
we have no financial resources to do this.”
Head teacher, Primary School
2% 3%4%
6%
11% 11%
17%
23%
11%13%
0%
5%
10%
15%
20%
25%
1 2 3 4 5 6 7 8 9 10

Understanding Computing Education in the UK
May 2017 Page 84
5.5 Extra-Curricular Computing Activities
Extra-curricular computing activities refers to those undertaken outside the normal course of study,
such as informal activities at lunchtimes or after school.
Of the total student population in surveyed schools, 11% of primary pupils and 3% of secondary
students participated in extra-curricular computing activities in 2015/16.
In the same year, extra-curricular computing activities were offered by more than half (62%) of
surveyed primary schools and more than three quarters (77%) of secondary schools. National
breakdowns are shown in Figure 39.
Figure 39 Proportion of schools offering extra-curricular computing – secondary schools/colleges
A breakdown of the types and frequencies of different types of extra-curricular computing activities
are set out in Tables 18 and 19. The lists are ordered from most to least cited.
The most common types of activities are computing clubs (e.g. code clubs), in most cases held
weekly. Other activities tend to take place less regularly and may be limited to particular year groups
and specific groups of students, such as annual work taster visits to help students think about their
GCSE subject choices. Examples from two of the case study schools include an annual year 9 trip to
the offices of The Guardian newspaper in London to practice HTML coding, as well as the Sky
Academy in Livingston.
77%
78%
52%
100%
90%
21%
21%
44%
0%
10%
2%
2%
4%
0% 20% 40% 60% 80% 100%
All
England
Scotland
Wales
Northern Ireland
Base: 371 respondents
Yes No Don't know

Understanding Computing Education in the UK
May 2017 Page 85
Table 18 Frequency of extra-curricular computing activities – primary schools
Activity type (and Base respondents)
Daily/ twice weekly
Weekly Twice monthly
Monthly Every 2-3 months
Every 4-6 months
Annually
Computing clubs/code clubs (93) 10% 80% - 2% 4% 2% 2%
Visits to other computing-related events (40) - - - - 5% 18% 78%
Cross-curricular projects (33) - 6% - 9% 18% 15% 52%
Guest talks in school (28) - - - - 4% 11% 86%
Entrants to computational thinking challenges (23) - 4% - 9% - 4% 83%
Visits to industry (20) - - - - - 5% 95%
Whole school ‘super learning days’ (20) - - - - 15% 5% 80%
University Ambassador Schemes (11) 9% 9% - 9% 9% 9% 55%
Table 19 Frequency of extra-curricular computing activities – secondary schools/colleges
Activity type (and Base respondents)
Daily/ twice weekly
Weekly Twice monthly
Monthly Every 2-3 months
Every 4-6 months
Annually
Computing clubs/code clubs (259) 22% 71% 3% 1% 2% 1% 1%
Visits to other computing-related events/exhibitions (131) - - - - 14% 15% 72%
Entrants to computational thinking challenges (120) 1% 1% 1% 2% 5% 17% 74%
Visits to industry (120) - - - 3% 8% 15% 74%
Guest talks in school (119) - - 2% 2% 8% 30% 58%
Cross-curricular projects (96) 1% 13% 2% 4% 15% 15% 51%
University Ambassador Schemes (64) - 2% - - 13% 17% 69%
Whole school ‘super learning days’ (55) - - - - 6% 6% 89%
Based on the findings in this section, there are indications that extra-curricular computing
opportunities in schools may be less prevalent than for other subjects such as science. A survey of
180 schools undertaken by Ofsted in 2013 found that extra-curricular science activities took place, to
a greater or lesser degree, in every school inspected. The resulting report commented that, at their
best, these activities complemented learning by extending students’ experiences with extra

Understanding Computing Education in the UK
May 2017 Page 86
experiments, projects, and visits to settings that used science. The latter allowed students a chance
to meet professional scientists who explained their enthusiasm for science and gave students a
sense of the fascinating breadth and depth of science in action. At a minimum, all schools were
found to provided additional revision classes for students who had fallen short of expectations, or
additional teaching time out of hours when school managers had not assigned sufficient timetabled
lessons for a particular course45.
5.6 Chapter Summary
Among surveyed schools, the most commonly reported amount of computing education undertaken
by each pupil in England, Wales and Scotland46 in 2015/16 was one hour per week. This ranges from
zero hours (eight schools) to four hours (three schools). In secondary schools/colleges, the most
common answer for each year of Key Stage 3 (S3/S4 in Scotland) was also one hour per week.
In primary schools, aspects of computing are delivered by general class teachers as part of the wider
curriculum. Secondary schools and colleges appear to have a mix of specialist and non-specialist
teachers delivering the subject. Figures for the average FTE staff per surveyed school who have at
least some responsibility for delivering computing education are shown in Table 16.
The majority of surveyed secondary schools (88%) have a dedicated department that specifically
teaches computing education. In the remaining cases computing is taught as part of another faculty,
most commonly combined with business studies, technology or maths. Schools appear to be
drawing on a range of other subject teachers to deliver computing, with the most common being
Business Studies, Maths, and Design and Technology, but also including subjects as diverse as
Humanities, Languages and PE.
Based on the results of the survey, the average available computing budget across the UK in 2015/16
was £2,213.10 per institution and £2.26 per student. Whilst the typical amount per school is similar
between independent and state-funded schools, it appears that this has to be stretched much
further in state schools due to higher student numbers. As a point of comparison, in 2012 SCORE
carried out research which identified budgets allocated to science subjects in schools across England.
For the 2011/12 academic year, the average science budget per student was £8.81.
Between the 2013/14 and 2015/16 academic years (i.e. over a three-year period), schools were
asked whether specific areas of investment in computing (financial and non-financial), had
increased, stayed the same, or decreased. The results reveal mixed circumstances in primary and
secondary schools, with detailed results shown in Figures 33 and 34.
On a scale from 1 ‘very poor’ to 10 ‘excellent’, surveyed schools were asked to rate the suitability of
their existing equipment and other physical resources for enabling students to meet the
45 Ofsted (2013) Maintaining curiosity: A survey into science education in schools 46 There are insufficient data to report timetabled hours for primary schools in Northern Ireland.

Understanding Computing Education in the UK
May 2017 Page 87
requirements of the computing curriculum. Average ratings are very similar among primary schools
(6.7 out of 10) and secondary schools/colleges (6.9 out of 10). The distribution of ratings across the
whole spectrum reveals mixed experiences. The minority of teachers providing the lowest ratings
refer to insufficient computing hardware, old, slow and outdated equipment with poor batteries, out
of date software, slow network and internet connectivity speeds, lack of computing suites and
dedicated teaching space to enable the subject to be taught effectively, as well as insufficient or
reducing budgets to invest in making improvements.
Finally, extra-curricular computing activities were offered by more than half (62%) of surveyed
primary schools and more than three quarters of (77%) of secondary schools in 2015/16. The most
common are computing clubs (e.g. code clubs), in most cases held weekly. Other activities tend to
take place less regularly and may be limited to particular year groups and specific groups of
students, such as annual work taster visits.

Understanding Computing Education in the UK
May 2017 Page 88
6. Widening Access
This section discusses the extent to which computing education appeals to girls and other groups,
including less able students.
6.1 Girls in Computing
6.1.1 Gender Mix at GCSE and A level47
By way of national context, in 2015/16 girls accounted for just over half (51%) of total GCSE entrants
(all subjects) in England.
Entrants to GCSE ICT courses (now being phased out) comprised a 41% share of female entrants in
2015/16. GCSE Computer Science courses by comparison have historically attracted a smaller
proportion of girls, but there are signs that this is increasing (from 15% in 2013/14 to 20% in
2015/16).
At A level, ICT qualifications attracted a 34% share of female entrants in 2015/16. This compares
with a 9% share for A level Computer Science, just a slight increase on 8% the year before.
The survey of secondary schools identified the gender mix of students working towards any form of
non-compulsory computing qualification from Year 10 (England and Wales) and from level S4
(Scotland) in 2015/16. The results reveal that less than a third (29%) of Year 10 and S4 entrants were
girls, along with a slightly lower proportion (20%) of Year 12 and S6 entrants48.
6.1.2 Increasing Participation among Girls
According to teachers, computing is less appealing for girls than boys at secondary level, where
parental and peer pressure, along with gender stereotyping, can influence their attitudes. The
subject is still considered to be ‘geeky’, but some schools are working to try to inspire more girls to
take computing at GCSE.
“I’ve been careful to avoid a focus on computer gaming, which can put girls off as this is considered
to be a ‘boys’ domain.”
Computing teacher, Secondary school
47 Data for England in this section has been sourced from the Department for Education (January 2017) SFR03/17: GCSE and equivalent results in England 2015/16 (Revised). Data for Scotland have been sourced from SQA (December 2016) Attainment Statistics. 48 Insufficient survey data available for Northern Ireland to report gender breakdowns.

Understanding Computing Education in the UK
May 2017 Page 89
Several participants observed that girls tend to be particularly strong on computing theory, often
taking a comparatively more patient and logical approach to problem solving, but tend to be more
likely to perceive programming errors as a ‘failure’, rather than as part of the process.
A small minority of primary schools (6%) and almost a fifth of secondary schools (18%) responding to
the survey, reported having allocated additional resources or approaches intended to increase the
participation of girls in extra-curricular computing activities.
Examples of activities include:
• Running bespoke extra-curricular activities,, such as Code Clubs for Girls (CC4G), Lego
leagues, industry trips, inviting female speakers from the computing industry into schools,
and hosting a ‘women in engineering’ day;
• Encouraging girls to consider taking computing as a subject option at GCSE where they might
otherwise not do so, for example by using marketing materials that showcase women in
technology- related jobs, and through one-to-one career talks; and
• Championing important historical female figures from the field of computing.
One of the case study secondary schools described how they make cross-curricula links to embed
computer science in other subjects that girls at the school particularly enjoy, such as computer-
based fashion design as part of Design and Technology, as well as in music composition. Another
case study secondary school draws on its female computing staff as effective role models for girls
looking to take the subject.
Discussions with primary age children as part of this research found some girls to be equally, if not
even more excited about the subject than boys. As the new curriculum is so new at this age group,
addressing the gender imbalance and stereotypical attitudes to computing and computer science is
likely be a long term journey of cultural change.
6.2 Improving Access for All
In 2016 the Government introduced ‘Progress 8’ for measuring the performance of schools in
England. This measure rewards schools for students who match or exceed their expected rate of
progress from the end of Key Stage 2 in primary school, to the completion of their GCSEs. Subjects at
GCSE are divided into three main categories or ‘buckets’ with different weightings, with the middle
bucket including Computer Science (Figure 40).
Participants in the discussion groups were asked what kind of impact the Government’s introduction
of the ‘Progress 8’ performance measure has had on the development of computing in schools. The

Understanding Computing Education in the UK
May 2017 Page 90
general consensus is that the measure has brought GCSE Computer Science “to the fore” for many
schools, and will have contributed to increasing numbers of entrants.
Figure 40 Progress 8 measure in England
Wider concerns raised by teachers are that the academic nature of computing, particularly the
higher order computational thinking skills and sensitivity of syntax, mean that some of the
computing curriculum in secondary schools could be harder to access for students with certain
learning difficulties. Having said that, a discussion group participant in Belfast gave an example of a
primary school pupil who was autistic being “the best programmer in the school”, indicating that
computing can help to give confidence to certain groups of students who might struggle with other
subject areas. A small minority of respondents also referred to computing being less likely to engage
students from low income families who may not have computing equipment at home.
A number of suggestions were received through the survey and discussion groups for widening
student access to computing. These include:
• Promoting and celebrating unique facets of the subject, notably the experimental elements
and that making mistakes is a good thing rather than a point of failure;
• Tackling misconceptions among parents that their children are already good at computing
where they are simply “users” of the technology;
• Linking computing education to the world of work, to inspire students from the earliest
possible age (ideally at primary level) how they can use these skills later in life;
• Identifying ways of engaging students of all ability levels, for example by involving the most
able students in activities such as lesson planning and helping others, whilst ensuring that
computing lessons are fun and engaging for all students, including contexts that they can
relate to and understand;
• Offering enrichment activities for a greater variety of inspiring content, such as lunchtime
clubs and visits to industry (one of the case study secondary schools has involved A level

Understanding Computing Education in the UK
May 2017 Page 91
Computer Science students as facilitators of robot clubs to encourage wider involvement
from the younger year groups); and
• Involving parents in computing lessons, particularly those who have jobs relating to
computing.
6.3 Chapter Summary
Looking at total students embarking on non-compulsory computing-related qualifications in 2015/16
(Year 10/level S4), less than a third of students in surveyed secondary schools (29%) were girls. The
proportion is slightly lower (20%) among Year 12/S6 entrants49.
At secondary level, computing is considered to be less appealing for girls than boys due to factors
such as parental and peer pressure, along with gender stereotyping. Some schools are working to
inspire more girls to take computing at GCSE, for example via dedicated Code Clubs for girls.
Some concerns have been raised by surveyed teachers that the academic nature of computing,
particularly the higher order computational thinking skills and sensitivity of syntax, mean that some
aspects of the curriculum in secondary schools could be harder to access for students with certain
learning difficulties.
Suggestions for widening access to computing for all students include promoting and celebrating
unique facets of the subject (e.g. that making mistakes is a good thing rather than a point of failure);
engaging with parents to tackle misconceptions about computing and also to involve them in
learning and careers education where they have a computing job role; providing better linkages
between computing education and the world of work; and identifying creative ways of engaging
students of all ability levels in computing.
49 Insufficient survey data available for Northern Ireland to report gender breakdowns.
Understanding Computing Education in the UK
May 2017 Page 92
7. Key Findings
1. The new computing curriculum in England is generally welcomed by teachers participating in
the research, although schools/colleges appear to be on a long term journey to developing and
delivering effective learning. This is especially the case given that some schools have not yet
fully ‘transitioned’ from offering GCSE/A level ICT to equivalent qualifications in Computer
Science, and evidence that the subject is being delivered in some schools by a combination of
specialist and non-specialist teachers.
Among those teachers who have at least some responsibility for delivering computing education,
the extent of their understanding of computational thinking is varied, particularly in primary
schools (Figures 2 and 3). In England, the survey has also identified mixed levels of favourability
to the new computing curriculum, with secondary schools/college teachers especially dispersed
in their views (Figures 6 and 7).
Many teachers recognise that the types of computational thinking, coding and programing skills
offered through a more computer-science focused curriculum are vital for the needs of industry
in an increasingly digital world. There is also some caution and resistance, not only around a
desire to ensure traditional ICT skills are not lost, but that more and better support, training and
CPD is needed to ensure that all teachers responsible for delivering the subject have the
knowledge, skills and resources to do so effectively (section 3.1.2). An emerging point from the
discussion groups is that senior leaderships teams’ buy-in to computing education is a vital lever
to unlocking investment (both financial and non-financial) in developing schools’ facilities,
teaching knowledge and overall engagement with the subject (section 4.3.1).
In accounting for current variations in teachers’ levels of understanding, favourability and
confidence, it is important to take into account the current period of ‘transition’ in computing
qualifications at GCSE and A level, with ICT qualifications still being taught in some, but not all
schools, ahead of being phased out by summer 2018 (section 2).
2. There is evidence of a shortage of suitably skilled and qualified computing teachers,
particularly in secondary schools, with the risk that this situation could worsen in the future if
additional support is not put in place.
In secondary schools/colleges, there is evidence that computing education is being taught by
specialist and non-specialist teachers, with some of the latter drawn from subjects as diverse as
English and PE (section 5.2). This could affect the consistency and quality of learning given that
the level of confidence among teachers holding their highest qualification in a non-computing
discipline is lower than that of teachers holding their highest qualification in computer science –
a statistically significant finding (Table 9).
Understanding Computing Education in the UK
May 2017 Page 93
Two scenarios could lead to an increase in the number of schools needing to recruit additional
computing teachers in the future. Firstly, an 11% recorded increase in the number of primary
school pupils in England over the past ten years50 will have a knock on impact on secondary
school numbers going forward (section 5.4.1). Secondly, those schools still holding on to GCSE
ICT qualifications will need to have an alternative offer in place for Year 10 students from
September 2017.
3. Teachers believe that the new computing curriculum in England has been introduced with
insufficient guidance around whom would teach the subject and how training, CPD and other
guidance for teachers could take place.
A small minority of surveyed primary teachers (7%) and just over a third of surveyed secondary
school computing teachers (36%) hold a degree in computer science (section 3.3.1). Concerns
have been raised through the open survey questions and discussion groups that teachers lack
the time to invest in CPD and training. This is backed up by the most commonly reported
number of CPD hours being zero among primary and secondary teachers who have at least some
responsibility for teaching the subject (section 3.3.3), and evidence of falling levels of confidence
among teachers through the year groups, especially in secondary schools (Figure 13).
To improve their confidence, teachers have asked for more courses and other forms of guidance
so they can improve their subject knowledge and make the most of curriculum opportunities.
Teachers call for more structured training courses that they can attend in the school day without
having to travel a considerable distance, including content to develop their subject knowledge,
programming know-how, awareness of available resources, and as a forum for sharing good
practice and ideas.
Additionally, a range of teaching resources that have come to market in recent years from a
range of publishers, makes it difficult for teachers to know which resources offer best value, and
how to link these to the curriculum. This can lead to schools investing significant money on
resource packs and they may not be aware how effective these are in relation to other materials
(section 4.3.2).
4. Variations in computing budgets and the suitability of physical resources and infrastructure in
schools points to disparities in the opportunities for teaching and learning computing.
Among surveyed secondary schools, the average computing budget per available student in the
UK in 2015/16 was £2, (and ranged from nil where there was no computing teaching
undertaken, to a maximum of £50). Furthermore, evidence suggests that independent schools in
England are able to allocate more funds per student than state-funded schools. As a point of
comparison, previous research carried out by SCORE identified that the average science budget
per student was £9 in 2011/12 (section 5.3.1).
50 Department for Education (2016) Schools, pupils and their characteristics, January 2016. Table 2a.

Understanding Computing Education in the UK
May 2017 Page 94
There are mixed scenarios as to whether financial investment, human resources and CPD time
for computing have either increased, deceased or remained the same over the past three years,
with more secondary schools reporting investment decreases than increases (section 5.3.2).
Schools’ ratings of the suitability of existing physical resources also reveal mixed experiences and
span the full scale from 1 ‘very poor’ to 1o ‘excellent’ (Figures 34 and 35). While some schools
described having sufficient amounts of high quality equipment such as laptops, tablets and
robotics, others reported that they don’t have enough or that their equipment is old, not in good
working order, and generally unfit to give students the best possible learning opportunities
(section 5.4.2).
5. Following its introduction, some teachers remain concerned the new computing curriculum in
England risks placing too much emphasis on computer science at the expense of ICT and digital
literacy being marginalised.
The content of the new computing curriculum and GCSE/A level Computer Science specifications
has polarised opinions among schools. The majority are generally favourable to computer
science, however, a minority are concerned that ICT skills – considered by respondents as vital
for life and work – risk being side-lined in favour of computer science which they see as
relatively niche (section 3.1.2)
6. Variations in the abilities of computing students entering secondary school appears to be
affected by current disparities in the level of understanding, favourability and confidence in
computing education among feeder primary schools.
In the discussion groups and as part of the case study visits teachers described seeing mixed
levels of prior exposure to computing education among students who enter their first year of
secondary school. This is partly due to disparities in the amount and quality of computing
education across feeder primary schools, with some first year students having had no prior
experience at all. These inconsistencies make it more difficult for teachers to meet the needs of
mixed ability classes, with the potential risk that less well-practised students get left behind, and
the most able students are not sufficiently stretched.
Conversely, where students have had strong exposure to computing education at primary level,
their enthusiasm may be dampened where secondary schools are not adequately equipped for
the subject (in terms of both knowledge and infrastructure) – section 3.2.1.
7. Participation in computing education appears to be improving among girls, but some schools
are being more proactive than others in widening access and broadening the appeal of the
subject to different groups of learners.
National trends point to rising numbers of girls in GCSE and A level Computer Science courses,
and there is evidence from the survey and discussion groups that some schools are undertaking
activities and measures to better engage girls in computing, such as girls-only coding clubs.
Understanding Computing Education in the UK
May 2017 Page 95
Engaging girls in computing appears to be easier in primary schools, with the challenge being to
keep them engaged as they get older and are subject to greater influence by parental and peer
pressure (section 6.1.1).
More widely, there is a concern from teachers that computational thinking, as well as the added
rigour of the recently reformed GCSE and A level qualifications in Computer Science, is too
challenging for less able students, including those with learning difficulties. These teachers feel
that the withdrawal of ICT means the less able students may not get any exposure to
technology-related learning that they currently find accessible.
8. Finally, there are some excellent examples from the discussion groups and case studies of
transferrable best practice from schools that have successfully embedded computing
education to date, including computer science.
Stand-out schools described having benefited from a supportive senior leadership team, strong
investment in physical resources and new teaching materials, as well as a mutually supportive
approach between teachers to professional development, knowledge and ideas sharing. These
successful adopters of computing education, especially in England and Scotland, have taken a
forward looking and creative approach to embrace the opportunities of the increased focus on
computational thinking and computer science from their respective curricula.
The most favourable and enthusiastic schools have identified that the complexities of the
subject mean that teachers and students can learn from one another. Additionally, by tapping
into national events, competitions and leagues, and by forging other external links, these schools
are creating their own enhanced learning and extra-curricular activities.
This research has obtained first hand evidence of students being engaged, enthused and
delighted by what they are learning in computing. Examples include understanding that “getting
something wrong” is OK and can move them one step closer to a sense of fulfilment when the
project they’re working on eventually obeys the desired commands.
By building partnerships with industry and academia, schools described how they have unlocked
new learning opportunities for students, such as work taster days, sponsored competitions,
guest talks, mentoring and to co-develop lesson ideas. The case studies have revealed positive
examples of educational institutions at different levels working together, for example computer
science university undergraduates supporting secondary schools, as well as secondary school
students visiting primary schools to raise awareness around issues such as promoting online
safety.
Recommendations are not included within this report. These have been developed separately by
The Royal Society based on the findings from all three separately delivered Work Packages.
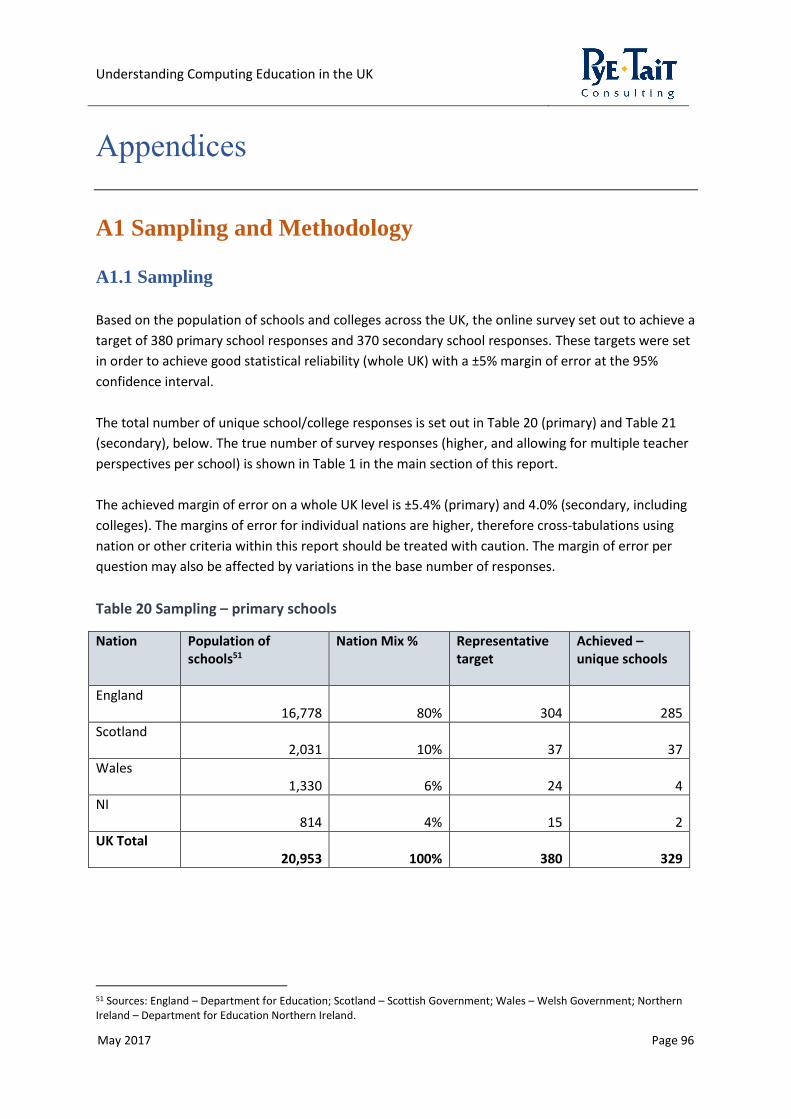
Understanding Computing Education in the UK
May 2017 Page 96
Appendices
A1 Sampling and Methodology
A1.1 Sampling
Based on the population of schools and colleges across the UK, the online survey set out to achieve a
target of 380 primary school responses and 370 secondary school responses. These targets were set
in order to achieve good statistical reliability (whole UK) with a ±5% margin of error at the 95%
confidence interval.
The total number of unique school/college responses is set out in Table 20 (primary) and Table 21
(secondary), below. The true number of survey responses (higher, and allowing for multiple teacher
perspectives per school) is shown in Table 1 in the main section of this report.
The achieved margin of error on a whole UK level is ±5.4% (primary) and 4.0% (secondary, including
colleges). The margins of error for individual nations are higher, therefore cross-tabulations using
nation or other criteria within this report should be treated with caution. The margin of error per
question may also be affected by variations in the base number of responses.
Table 20 Sampling – primary schools
Nation Population of schools51
Nation Mix %
Representative target
Achieved – unique schools
England 16,778 80% 304 285
Scotland 2,031 10% 37 37
Wales 1,330 6% 24 4
NI 814 4% 15 2
UK Total 20,953 100% 380 329
51 Sources: England – Department for Education; Scotland – Scottish Government; Wales – Welsh Government; Northern Ireland – Department for Education Northern Ireland.

Understanding Computing Education in the UK
May 2017 Page 97
Table 21 Sampling – secondary schools/colleges
Nation Population of schools52
Population of colleges53
Total % mix
Rep. target Achieved – unique institutions
England 5,34154
332 5,673 87% 350 490
Scotland 359
22 385 5% 24 44
Wales 207
15 222 3% 14 16
NI 202
6 208 3% 13 12
UK Total 6,109
379 6,488 100% 400 562
A1.2 Survey
Two questionnaires (aimed at primary and secondary/college teachers, respectively), were
developed by Pye Tait Consulting in conjunction with The Royal Society and members of the
Computing Education Project Advisory Group.
In primary schools, one survey response was requested from either the Head teacher or subject lead
for computing education, and in secondary schools one survey response from the Head of
Department/subject-lead for computing education. Many school-wide questions were only asked of
these job roles, therefore only one set of answers was required per institution.
Responses were also invited from all other teachers with responsibility for delivering computing
education. By selecting this job role in the survey, respondents were presented with only the
relevant sections of the survey which asked for data relevant to themselves, including their own
views and perceptions.
A definition of the generic term ‘computing education’ was made clear in the survey, i.e. that this
referred to the curriculum in the respondent’s home nation. This included Computing (England), the
Curriculum for Excellence: Technologies (Scotland), ICT (Wales), and Using ICT (Northern Ireland).
Similarly, references to ‘computing teachers’ referred to all individuals with responsibility for
teaching this area of the curriculum in the school.
The surveys were hosted online and were open for responses from 31st October 2016 to 23rd
December 2016.
52 Sources: England – Department for Education; Scotland – Scottish Government; Wales – Welsh Government; Northern Ireland – Department for Education Northern Ireland. 53 Source: Association of Colleges (AoC). 54 Includes state-funded schools, pupil referral units and independent schools.

Understanding Computing Education in the UK
May 2017 Page 98
A1.3 Minimising the risk of respondent self-selection
For the survey of schools, respondent self-selection refers to the risk of schools who are more
favourable to computing (in particular computer science) being more predisposed to submit a
response. Such a scenario could lead to a more favourable set of results than might reflect the
teacher population, or risks certain issues or challenges faced by schools being downplayed.
Measures taken to minimise this risk were as follows:
• The start of the online survey contained the following prominently displayed message: “This
survey is aimed at all computing/ICT teachers in UK secondary schools/colleges. It is vital that
we understand teachers’ current levels of confidence, knowledge and skills for delivering
computing education. This will ensure that the case for future support is based on a full and
honest picture”.
• Survey invitation e-mails (including two further reminder emails) were sent to a random
sample of schools across the UK (15,821 primary schools and 3,992 secondary schools).
• The survey was promoted through various organisations, such as via newsletters aimed at
schools, as well as through social media, including Twitter, Facebook and LinkedIn.
• The survey questionnaire contained a number of open question boxes for respondents to
explain their responses to rating scale questions, describe challenges faced, as well as what
(if anything) could be improved in the future. These responses have been thoroughly
analysed and a balanced account of the arguments presented in the report.
• The eight small discussion groups provided a further opportunity for teachers to discuss and
debate computing education, with particular prompts around what works well and what
could be better.
Consideration was given to weighting the survey results to be nationally representative in terms of
computing teachers that hold their highest qualification in either computing or a different discipline.
This was ultimately discounted since national data relating to teacher qualifications does not (at
least, yet) fully reflect the change in emphasis from traditional ICT to a more computer science-
based curriculum. It would therefore not have been appropriate to mirror the proportion of ICT
teachers qualified in ICT within the weightings of this survey.
A1.4 Case Studies
As part of the survey, schools were asked if they would be willing to participate in a follow-up case
study visit. The purpose of undertaking case study visits was to understand and be able to share best
practice approaches to computing education in individual settings, as well as the journey undertaken
to delivering the curriculum, including any obstacles overcome.

Understanding Computing Education in the UK
May 2017 Page 99
A total of eight case study visits were undertaken with schools. These were focused in England and
Scotland only, reflecting the greater focus on computer science that has needed to be introduced in
those countries in line with curriculum requirements in recent years.
The profile of participating case study schools included:
• England (2 x all-through schools, 2 x primary schools and 2 x secondary schools)
• Scotland (1 x primary school and 1 x secondary school)
Case study schools were based in different geographical regions and included a mix of state-funded
and independent schools, including one all girls’ secondary school.
The resulting written case studies have been produced separately to this report.
A1.5 Small Discussion Groups
A total of eight small discussion groups were facilitated by Pye Tait Consulting to explore aspects of
the research in greater depth with primary and secondary/college participants. Five discussion
groups were held in different cities in England (Birmingham, London, Manchester, Newcastle and
Plymouth), as well as one each in Scotland (Edinburgh), Wales (Cardiff) and Northern Ireland
(Belfast), respectively. The discussion groups attracted a combined total of 32 participants.
A2 Survey Respondent Profile
Tables 22-30 provide additional information about the characteristics of survey respondents in
primary and secondary schools/colleges.
Table 22 Nation
Nation
Primary respondents Secondary respondents
UK (All respondents) 341 604
England 297 526
Scotland 38 46
Wales 4 18
Northern Ireland 2 14

Understanding Computing Education in the UK
May 2017 Page 100
Table 23 Job Role
Job Role
Primary respondents Secondary respondents
Head teacher or subject lead for computing education 175 373
Teacher with responsibility for delivering computing education 156 221
Other job role 10 10
Table 24 Subject of Highest Qualification (Teachers)
Subject of Highest Qualification (Teachers)
Primary respondents Secondary respondents
Computer Science
27 256
Other Maths and Science Disciplines (not
including Computer Science) 48 93
All Other Disciplines (not including Computer
Science) 183 192
Table 25 CAS Engagement Status
CAS Engagement Status
Primary respondents Secondary respondents
CAS engaged teachers 67 99
Non-CAS engaged teachers 274 505
Table 26 Length of time teaching
Job Role
Primary respondents Secondary respondents
Less than 1 year 5 18
1-2 years 16 40
3-5 years 67 61
6-9 years 63 92
10+ years 187 390
Table 27 Mode of Employment
Mode of Employment Primary Secondary
Full time 291 539
Part time 50 56

Understanding Computing Education in the UK
May 2017 Page 101
Table 28 Region of England
Region
Primary respondents Secondary respondents
East of England 33 41
East Midlands 18 29
London 39 71
North East 27 37
North West 24 70
South East 70 114
South West 30 72
West Midlands 27 49
Yorkshire and the Humber 29 43
Table 29 School Type (England) - Primary schools
School Type
Primary respondents
Community School (includes Special) 133
Academy (includes Converter/Sponsor-led/Special) 59
Voluntary Aided School 35
Other Independent School (includes Special) 25
Voluntary Controlled School 25
Other 5
Foundation School (includes Special) 13
Free School (includes Special) 2
Non-maintained Special School 0
Pupil Referral Unit 0
Secure Unit 0
• Scotland: 38 x Local Authority Schools;
• Wales: 4 x Maintained Community Schools;
• Northern Ireland: 2 x Primary Schools.

Understanding Computing Education in the UK
May 2017 Page 102
Table 30 School Type (England) - Secondary schools/colleges
School Type (England) Secondary respondents
Academy (includes Converter/Sponsor-led/Special) 283
Community School (includes Special) 85
Other Independent School (includes Special) 69
Foundation School (includes Special) 21
Voluntary Aided School 15
Free School (includes Special) 12
Further Education 13
Other 4
Voluntary Controlled School 10
Sixth Form Centre 9
Pupil Referral Unit 3
Non-maintained Special School 1
University Technical College 1
Secure Unit 0
Special Post 16 Institution 0
Studio School 0
• Scotland: 41 x Local Authority Schools; 4 x Independent Schools; 1 x College;
• Wales: 15 x Maintained Community Schools; 2 x Independent Schools; 1 x Maintained – Voluntary
Aided;
• Northern Ireland: 12 x Grammar Schools; 2 x Secondary Schools.

Understanding Computing Education in the UK
May 2017 Page 103
A3 NPD Data Table
This table should be read in conjunction with section 2.1.
Table 31 Computing-related qualifications and student entries (full NPD data for surveyed schools) 55
Qualification Category Base survey respondents (not mutually exclusive)
% respondents Total NPD entries
% mix of entries by category
BCS Level 2 ECDL Certificate in IT Application Skills (QCF)
Computer Appreciation/ Introduction
154 54% 9080 20%
OCR Level 1/2 Cambridge National Certificate 77 27% 3553 8%
BTEC Diploma Level 3 120 42% 1442 3%
Certificate for IT User Skills in Open Systems and Enterprise (QCF) 8 3% 598 1%
OCR Cambridge Technical Introductory Diploma at Level 3 34 12% 426 1%
BTEC Certificate Level 3 38 13% 337 1%
OCR Cambridge Technical Certificate at Level 3 28 10% 327 1%
BTEC L1/L2 First Certificate 3 1% 34 0%
Certificate in IT User Skills (Open Systems and Enterprise) (ITQ) 8 3% 27 0%
OCR Cambridge Technical Extended Diploma at Level 3 1 0% 15 0%
OCR Cambridge Technical Diploma at Level 3 3 1% 14 0%
BTEC Certificate Level 1 1 0% 5 0%
OCR Cambridge Technical Subsidiary Diploma at Level 3 1 0% 2 0%
Total N/A N/A 15860 36%
GCSE Full Course ICT ICT
168 59% 8017 18%
GCE AS level ICT 100 35% 1638 4%
GCE A level ICT 86 30% 803 2%
Cambridge International Certificate Level 1/Level 2 ICT 11 4% 263 1%
Total N/A N/A 10721 24%
55 Schools/colleges in England only 2015/16.

Understanding Computing Education in the UK
May 2017 Page 104
Qualification Category Base survey Respondents (not mutually exclusive)
% respondents Total NPD entries
% mix of entries by category
GCSE Full Course Computer Studies/Computing
Computer Studies/ Computing
258 91% 7214 16%
GCE AS level Computer Studies/Computing 132 46% 1734 4%
GCE A level Computer Studies/Computing 108 38% 749 2%
Cambridge International Certificate Level 1/Level 2 Computer Studies/Computing 5 2% 98 0%
IBO Higher level component 1 0% 7 0%
IBO Higher level component 1 0% 4 0%
Total N/A N/A 9806 22%
CERT.IN DIG.APPS.LEVEL 2 Applied ICT
29 10% 1546 3%
Certificate In Digital Applications Level 2 29 10% 1546 3%
Edexcel Level 2 Certificate in Digital Applications 29 10% 1546 3%
Applied GCE AS ICT 53 19% 639 1%
Applied GCE Single ICT 39 14% 312 1%
Applied GCE AS Double ICT 1 0% 13 0%
Applied GCS Double ICT 1 0% 8 0%
Total N/A N/A 5610 13%
BTEC First Award L1/2 - Band C - P-D*
Computer Architecture/ Systems
30 11% 1368 3%
NCFE Level 2 Certificate in Computer Technology 1 0% 84 0%
Total N/A N/A 1452 3%
GCSE Full Course Office Technology Office Technology
35 12% 1158 3%
Total N/A N/A 1158 3%
VRQ Level 3 Systems/ Network Management
1 0% 1 0%
Total
N/A N/A 1 0%

Understanding Computing Education in the UK
May 2017 Page 105
A4 Reference Guide to School Ages and Years
The matrix below sets out the key stages, levels and year groups that operate in schools across each
of the four UK nations.
The scope of this research did not include pupils in the 4-5 age bracket, for whom the computing
curricula do not generally apply.
Table 32 School key stages, levels and years (UK)
Typical Age Key Stage (England and Wales)
Year (England and Wales)
Level (Scotland)
Year (Scotland)
Year (Northern Ireland)
4-5
N/A Reception First P1 Year 1
5-6
1 Year 1 P2 Year 2
6-7
Year 2 P3 Year 3
7-8
2 Year 3 Second P4 Year 4
8-9
Year 4 P5 Year 5
9-10
Year 5 P6 Year 6
10-11
Year 6 P7 Year 7
11-12
3 Year 7 Third/Fourth S1 Year 8
12-13
Year 8 S2 Year 9
13-14
Year 9 S3 Year 10
14-15
4 Year 10 Senior Phase S4 Year 11
15-16
Year 11 S5 Year 12
16-17
5 Year 12 S6 Year 13
17-18
Year 13 Year 14

Understanding Computing Education in the UK
May 2017 Page 106
A5 Statistical Tests The tables in this section represent the results of statistical tests carried out to support certain statements contained within the report. Tables A to L each feature the variables that are the subjects of test, the type of test that was used and the results. Tests were carried out against results from both the primary school survey and the secondary school/colleges survey. To begin with, detailed Chi Squared tests were carried out on the variables to investigate whether the data were independent (i.e. the variables differ from one another), or whether there was a relationship. Where the Chi Squared result is significant (p < 0.05), the null hypothesis, that there is no relationship between the variables, can be rejected. In certain cases, as is usual with such surveys, low-count cells have been encountered. This is entirely normal given that certain responses (for example a rating of 1 on a 1-10 rating scale) will inevitably attract low numbers of respondents. However, the reader is cautioned that, where there are high proportions of low-count cells, and taking into account the precise question under consideration, the resulting significance levels should be used with care. Following on from the Chi Squared tests, where an ordinal scaled variable was analysed together with a nominal scaled variable, pair-wise Mann-Whitney U-Tests were performed. Where there were more than two groups of Independent Variables, a Kruskal Wallis test was carried out initially to investigate if there were any statistical differences between the variables. Further Mann Whitney U tests were then carried out if the Kruskal Wallis highlighted a significance, in order to establish further details concerning the significance. The significance (p) level, was set to 0.05 for all tests. Results are described as significant where the p value is less than 0.05, and marginally significant when the p level is between 0.05 and 0.10. Results with p > 0.10 are interpreted as not significant. Where the Kruskal Wallis test was performed, the Bonferroni correction was applied altering the p level (stated in the tables).

Understanding Computing Education in the UK
May 2017 Page 107
A number of independent variables were chosen for the tests (Table A).
Table A: Independent variables and their characteristics for the tests
Variable name Characteristics
CAS teacher engagement Nominal scale with two options (CAS engaged, Non-CAS engaged)
Teacher type Nominal scale with three options (Head of Department/Subject lead, Teacher, Other)
Highest qualification held (discipline) Nominal scale with three options (Computer science, Other maths/science, All other disciplines)
Length of time in the teaching profession Nominal scale with 5 options (Less than 1 year, 1-2 years, 3-5 years, 6-9 years, 10+ years)
For all dependent variables, the scales, answer options, and categories used for the analysis are shown in Table B.
Table B: Dependent variables and their characteristics for the tests
Variable name Scale and range Answer options Categories used for analysis
How well did you understand the concept of computational thinking prior to completing this questionnaire?
Ordinal scale of 1 to 10. From 1 “no understanding” to 10 “complete and full understanding”.
All are included
How favourable are you towards the new computing education curriculum in England?
Ordinal scale of 1 to 10 . From 1 “not at all” to 10 “completely”.
All are included
How confident are you at delivering your current computing education curriculum at the following stages/levels?
Ordinal scale of 1 to 10 with 2 options for Primary (Key Stage 1, Key Stage 2) and 5 options for secondary (KS3, KS4, AS, A level, S2-4, S5-7).
From 1 “not at all confident” to 10 “extremely confident”.
All are included

Understanding Computing Education in the UK
May 2017 Page 108
Table C: PRIMARY SCHOOLS – Chi Squared results for all four independent variables and three dependent variables
Survey question/dependent variable
Statistical Test Results Cautionary notes
How well did you understand the concept of computational thinking prior to completing this questionnaire?
By CAS engagement (CAS, non-CAS).
P < 0.001; significant at the 1% level meaning there is a very strong relationship between the variables.
6 cells (30.0%) have expected count less than 5
By teacher type (HOD/Subject lead, teacher, Other).
P = .150; non-significant at the level of 10% meaning there is evidence of no relationship between the variables.
15 cells (50.0%) have expected count less than 5
By highest qualification (Computer Science, Other maths/science, All other disciplines).
There is evidence of a relationship, significant at the 1% level meaning there is a very strong relationship between the variables.
56.7% of cells have an expected value of less than 5
By length of time in teaching profession (Less than 1 year, 1-2 years, 3-5years, 6-9 years, 10+ years).
P=0.533; non-significant. The test is inconclusive at the 10% level. There is evidence of no relationship.
32 cells (64.0%) have expected count less than 5
How favourable are you towards the new computing education curriculum in England?
By CAS engagement (CAS, non-CAS).
P < 0.01; significant at the 1% level meaning there is a very strong relationship between the variables.
9 cells (45.0%) have expected count less than 5
By teacher type (HOD/Subject lead, teacher, Other).
P = 0.634; non-significant. The test is inconclusive at the 10% level. There is evidence of no relationship.
18 cells (60.0%) have expected count less than 5
By highest qualification (Computer Science, Other maths/science, All other disciplines).
The test is inconclusive at the 10% level. There is evidence of no relationship.
50.0% of cells have an expected value of less than 5

Understanding Computing Education in the UK
May 2017 Page 109
By length of time in teaching profession (Less than 1 year, 1-2 years, 3-5years, 6-9 years, 10+ years).
P= 0.346; non-significant. The test is inconclusive at the 10% level. There is evidence of no relationship.
34 cells (68.0%) have expected count less than 5
How confident are you at delivering your current computing education curriculum at the following stages/levels?
By CAS engagement (CAS, non-CAS).
Key Stage 1- P = .368; non-significant. The test is inconclusive at the 10% level. There is evidence of no relationship. Key Stage 2 – P < 0.05; There is evidence of a relationship, significant at the 5% level meaning there is a strong relationship between the variables.
Key Stage 1 - 6 cells (30.0%) have expected count less than 5 Key Stage 2 - 6 cells (30.0%) have expected count less than 5
By Teacher type (HOD/Subject lead, teacher, Other).
Key Stage 1 – P = .975; non-significant. The test is inconclusive. There is evidence of no relationship. Key Stage 2 – P = .987; non-significant. The test is inconclusive. There is evidence of no relationship.
Key Stage 1 - 16 cells (53.3%) have expected count less than 5 Key Stage 2 - 17 cells (56.7%) have expected count less than 5
By highest qualification (Computer Science, Other maths/science, All other disciplines).
Key Stage 1 – The test is inconclusive at the 10% level. There is evidence of no relationship. Key Stage 2 – There is evidence of a relationship, significant at the 1% level meaning there is a very strong relationship between the variables.
Key Stage 1 - 63.3% of cells have an expected value of less than 5. Key Stage 2 - 66.7% of cells have an expected value of less than 5.
By length of time in teaching profession (Less than 1 year, 1-2 years, 3-5years, 6-9 years, 10+ years).
Key Stage 1 – P = .814; non-significant; The test is inconclusive at the 10% level. There is evidence of no relationship. Key Stage 2 – P = .861; non-significant; The test is inconclusive at the 10% level. There is evidence of no relationship.
Key Stage 1 - 31 cells (62.0%) have expected count less than 5 Key Stage 2 - 32 cells (64.0%) have expected count less than 5

Understanding Computing Education in the UK
May 2017 Page 110
Table D: PRIMARY SCHOOLS – Differences by CAS engagement with respect to three dependent variables
By survey question (variable) Statistical Test Results
How well did you understand the concept of computational thinking prior to completing this questionnaire?
Mann Whitney U-Test, comparison of CAS engaged and non CAS engaged.
u = 5152.5; p < 0.001; significant
How favourable are you towards the new computing education curriculum in England?
Mann Whitney U-Test, comparison of CAS engaged and non CAS engaged.
u = 4695; p < 0.001; significant
How confident are you at delivering your current computing education curriculum at the following stages/levels?
Mann Whitney U-Test, comparison of CAS engaged and non CAS engaged.
KS1 - u = 5634; p = 0.021; significant KS2 – u = 4849.5; p < 0.001; significant
Table E: PRIMARY SCHOOLS – Differences by teacher type with respect to three survey questions/dependent variables
By survey question (variable) Statistical Test Results
How well did you understand the concept of computational thinking prior to completing this questionnaire?
Kruskal Wallis Test, comparison of HOD/Subject lead, Teacher, Other.
P = .043; significant (Bonferroni correction applied p = .016)
Mann Whitney U-Test, comparison of HOD/Subject lead and Teacher.
u = 13364.5; p = 0.879; non-significant
Mann Whitney U-Test, comparison of Teacher and Other.
u = 405.5; p = .010; significant
Mann Whitney U-Test, comparison of HOD/Subject lead and Other.
u = 485; p = .018; marginally significant
How favourable are you towards the new computing education curriculum in England?
Kruskal Wallis Test, comparison of HOD/Subject lead, Teacher, Other.
P = .143; non-significant

Understanding Computing Education in the UK
May 2017 Page 111
Mann Whitney U-Test, comparison of HOD/Subject lead and Teacher.
U = 9550; p = .266; non-significant
How confident are you at delivering your current computing education curriculum at the following stages/levels?
Kruskal Wallis Test, comparison of HOD/Subject lead, Teacher, Other.
Key Stage 1 – P = .583; non-significant Key Stage 2 – P = .995; non-significant
Mann Whitney U-Test, comparison of HOD/Subject lead and Teacher.
Key Stage 1 u = 9481.5; p = .686; non-significant Key Stage 2 u = 10238.5; p = .921; non-significant
Table F: PRIMARY SCHOOLS – Differences by highest qualification held with respect to three dependent variables
By survey question (variable) Statistical Test Results
How well did you understand the concept of computational thinking prior to completing this questionnaire?
Mann Whitney U-Test, comparison of computer science and NOT computer science.
U = 1282.5; p < 0.001; significant
Mann Whitney U-Test, comparison of Other maths/science and NOT Other maths/science.
U = 1282.5; p = .730; non-significant
Mann Whitney U-Test, comparison of All other disciplines and NO other disciplines.
U = 3703; p < 0.05; significant
How favourable are you towards the new computing education curriculum in England?
Mann Whitney U-Test, comparison of computer science and NOT computer science.
U = 1173.5; p = .001; significant
Mann Whitney U-Test, comparison of Other maths/science and NOT Other maths/science.
U = 2885.5; p = .149; non-significant
Mann Whitney U-Test, comparison of All other disciplines and NO other disciplines.
U = 3328; p = .226; non-significant

Understanding Computing Education in the UK
May 2017 Page 112
How confident are you at delivering your current computing education curriculum at the following stages/levels?
Mann Whitney U-Test, comparison of computer science and NOT computer science.
Key Stage 1 – u = 1348; p < 0.05; significant Key Stage 2 – u = 733.5; p <0.001; significant
Mann Whitney U-Test, comparison of Other maths/science and NOT Other maths/science.
Key Stage 1 – u = 2882.5; p = .253; non-significant Key Stage 2 – u = 3232; p = .620; non-significant
Mann Whitney U-Test, comparison of All other disciplines and NO other disciplines.
Key Stage 1 – u = 2721.5; p <0.05; significant Key Stage 2 – u = 2749.5; p <0.05; significant
Table G: PRIMARY SCHOOLS – Differences by length of time in the profession with respect to three dependent variables
By survey question (variable) Statistical Test Results
How well did you understand the concept of computational thinking prior to completing this questionnaire?
Kruskal Wallis Test, comparison of less than 1 year, 1-2 years, 3-5 years, 6-9 years, 10+ years.
P = .975; non-significant
How favourable are you towards the new computing education curriculum in England?
Kruskal Wallis Test, comparison of less than 1 year, 1-2 years, 3-5 years, 6-9 years, 10+ years.
P = .869; non-significant
How confident are you at delivering your current computing education curriculum at the following stages/levels?
Kruskal Wallis Test, comparison of less than 1 year, 1-2 years, 3-5 years, 6-9 years, 10+ years.
KS1 = .292; non-significant KS2 = .568; non-significant

Understanding Computing Education in the UK
May 2017 Page 113
Table H: SECONDARY SCHOOLS – Chi Squared results for by all four independent variables and three dependent variables
Survey question/dependent variable Statistical Test Results Cautionary notes
How well did you understand the concept of computational thinking prior to completing this questionnaire?
By CAS engagement (CAS, non-CAS).
P = .174; non-significant at the level of 10% meaning there is evidence of no relationship between the variables.
5 cells (25.0%) have expected count less than 5
By teacher type (HOD/Subject lead, teacher, Other).
P = .1; non-significant at the level of 10% meaning there is evidence of no relationship between the variables.
16 cells (53.3%) have expected count less than 5
By highest qualification (Computer Science, Other maths/science, All other disciplines).
There is evidence of a relationship, significant at the 1% level meaning there is a very strong relationship between the variables.
36.7% of cells have an expected value of less than 5
By length of time in teaching profession (Less than 1 year, 1-2 years, 3-5years, 6-9 years, 10+ years).
P=0.163; non-significant. The test is inconclusive at the 10% level. There is evidence of no relationship.
28 cells (56.0%) have expected count less than 5
How favourable are you towards the new computing education curriculum in England?
By CAS engagement (CAS, non-CAS).
P = .089; Marginally significant meaning there is some relationship between the variables.
1 cells (5.0%) have expected count less than 5
By teacher type (HOD/Subject lead, teacher, Other).
P < 0.05; significant. There is evidence of a relationship, significant at the 5% level meaning there is a strong relationship between the variables.
10 cells (33.3%) have expected count less than 5
By highest qualification (Computer Science, Other maths/science, All other disciplines).
There is evidence of a relationship, significant at the 1% level meaning there is a very strong relationship between the variables.
13.3% of cells have an expected value of less than 5
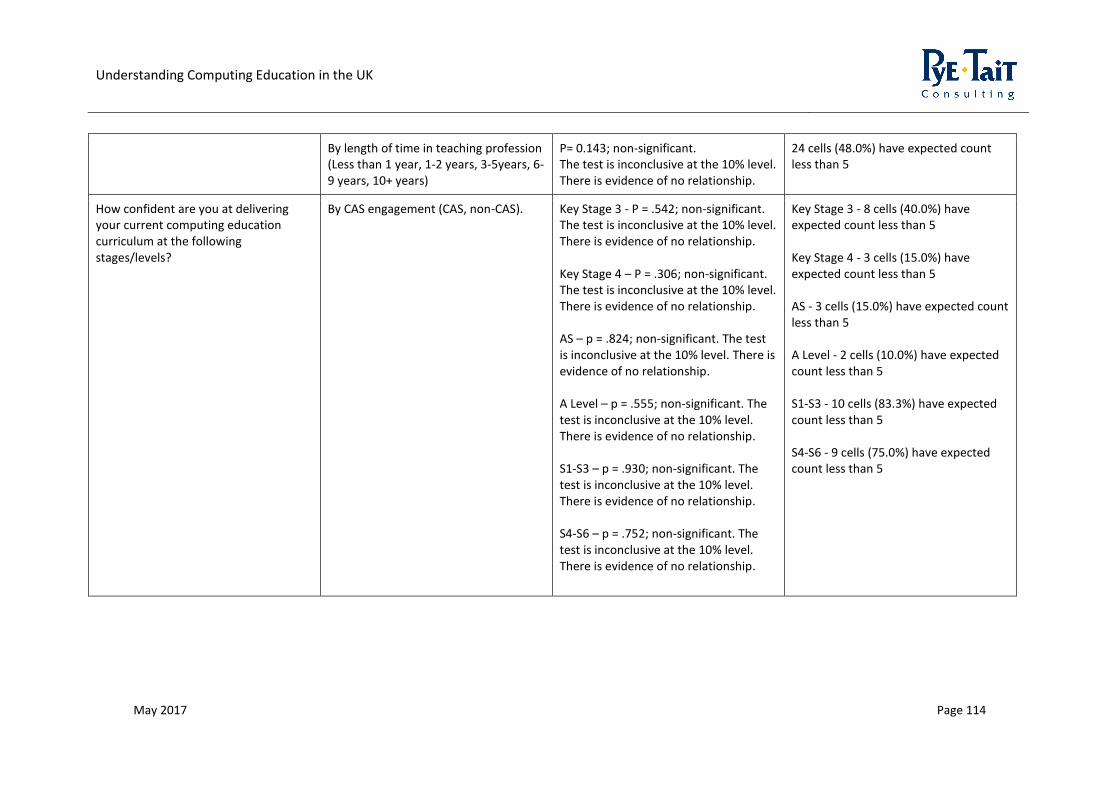
Understanding Computing Education in the UK
May 2017 Page 114
By length of time in teaching profession (Less than 1 year, 1-2 years, 3-5years, 6-9 years, 10+ years)
P= 0.143; non-significant. The test is inconclusive at the 10% level. There is evidence of no relationship.
24 cells (48.0%) have expected count less than 5
How confident are you at delivering your current computing education curriculum at the following stages/levels?
By CAS engagement (CAS, non-CAS).
Key Stage 3 - P = .542; non-significant. The test is inconclusive at the 10% level. There is evidence of no relationship. Key Stage 4 – P = .306; non-significant. The test is inconclusive at the 10% level. There is evidence of no relationship. AS – p = .824; non-significant. The test is inconclusive at the 10% level. There is evidence of no relationship. A Level – p = .555; non-significant. The test is inconclusive at the 10% level. There is evidence of no relationship. S1-S3 – p = .930; non-significant. The test is inconclusive at the 10% level. There is evidence of no relationship. S4-S6 – p = .752; non-significant. The test is inconclusive at the 10% level. There is evidence of no relationship.
Key Stage 3 - 8 cells (40.0%) have expected count less than 5 Key Stage 4 - 3 cells (15.0%) have expected count less than 5 AS - 3 cells (15.0%) have expected count less than 5 A Level - 2 cells (10.0%) have expected count less than 5 S1-S3 - 10 cells (83.3%) have expected count less than 5 S4-S6 - 9 cells (75.0%) have expected count less than 5

Understanding Computing Education in the UK
May 2017 Page 115
By teacher type (HOD/Subject lead, teacher, Other).
Key Stage 3- P < 0.05; significant. There is evidence of a relationship, significant at the 5% level meaning there is a strong relationship between the variables. Key Stage 4 – P < .001; significant. There is evidence of a relationship, significant at the 1% level meaning there is a very strong relationship between the variables. AS – p = .083; marginally significant. There is some evidence of a relationship. A Level – P < .0.5; significant. There is evidence of a relationship, significant at the 5% level meaning there is a very strong relationship between the variables. S1-S3 – P < .0.001; significant. There is evidence of a relationship, significant at the 1% level meaning there is a very strong relationship between the variables. S4-S6 – P < .0.001; significant. There is evidence of a relationship, significant at the 1% level meaning there is a very strong relationship between the variables.
Key Stage 3 - 17 cells (56.7%) have expected count less than 5 Key Stage 4 - 10 cells (33.3%) have expected count less than 5 AS - 10 cells (33.3%) have expected count less than 5 A Level - 10 cells (33.3%) have expected count less than 5 S1-S3 - 16 cells (88.9%) have expected count less than 5 S4-S6 - 15 cells (83.3%) have expected count less than 5

Understanding Computing Education in the UK
May 2017 Page 116
By highest qualification (Computer Science, Other maths/science, All other disciplines).
Key Stage 3- There is evidence of a relationship, significant at the 1% level meaning there is a very strong relationship between the variables. Key Stage 4 – There is evidence of a relationship, significant at the 1% level meaning there is a very strong relationship between the variables. AS – There is evidence of a relationship, significant at the 1% level meaning there is a very strong relationship between the variables. A Level – There is evidence of a relationship, significant at the 1% level meaning there is a very strong relationship between the variables. S1-S3 - There is evidence of a relationship, significant at the 5% level meaning there is a strong relationship between the variables. S4-S6 – There is evidence of a relationship, significant at the 10% level meaning there is a relationship between the variables.
Key Stage 3 - 46.7% of cells have an expected value of less than 5 Key Stage 4 - 10.0% of cells have an expected value of less than 5. AS - 13.3% of cells have an expected value of less than 5 A Level - 10.0% of cells have an expected value of less than 5. S1-S3 - 53.3% of cells have an expected value of less than 5 S4-S6 - 50.0% of cells have an expected value of less than 5

Understanding Computing Education in the UK
May 2017 Page 117
By length of time in teaching profession (Less than 1 year, 1-2 years, 3-5years, 6-9 years, 10+ years).
Key Stage 3 - P = .818; non-significant. The test is inconclusive at the 10% level. There is evidence of no relationship. Key Stage 4 – P = .183; non-significant. The test is inconclusive at the 10% level. There is evidence of no relationship. AS – p < 0.05; significant. There is evidence of a relationship, significant at the 5% level meaning there is a strong relationship between the variables. A Level – p = .067; marginally significant. There is some evidence of a relationship. S1-S3 – p = .953; non-significant. The test is inconclusive at the 10% level. There is evidence of no relationship. S4-S6 – p = .939; non-significant. The test is inconclusive at the 10% level. There is evidence of no relationship.
Key Stage 3 - 32 cells (64.0%) have expected count less than 5 Key Stage 4 - 26 cells (52.0%) have expected count less than 5 AS - 27 cells (54.0%) have expected count less than 5 A Level - 30 cells (60.0%) have expected count less than 5 S1-S3 - 28 cells (93.3%) have expected count less than 5 S4-S6 - 27 cells (90.0%) have expected count less than 5

Understanding Computing Education in the UK
May 2017 Page 118
Table I: SECONDARY SCHOOLS – Differences by CAS engagement with respect to three dependent variables
By survey question (variable) Statistical Test Results
How well did you understand the concept of computational thinking prior to completing this questionnaire?
Mann Whitney U-Test, comparison of CAS engaged and non CAS engaged.
u = 24115.5; p = 0.853; non- significant
How favourable are you towards the new computing education curriculum in England?
Mann Whitney U-Test, comparison of CAS engaged and non CAS engaged.
u = 18504.5; p = 0.220; non-significant
How confident are you at delivering your current computing education curriculum at the following stages/levels?
Mann Whitney U-Test, comparison of CAS engaged and non CAS engaged.
Key Stage 3 - u = 18705; p = 0.103; non-significant Key Stage 4 – u = 18342.5; p = 0.126; non-significant AS – u = 14620.5; p = .358; non-significant A Level – u = 14679.5, p = .428; non-significant S1-S3 – u = 26, p = .269; non-significant S4-S6 – u = 34, p = 606; non-significant
Table J: SECONDARY SCHOOLS – Differences by teacher type with respect to three dependent variables
By survey question (variable) Statistical Test Results
How well did you understand the concept of computational thinking prior to completing this questionnaire?
Kruskal Wallis Test, comparison of HOD/Subject lead, Teacher, Other.
P = .054; marginally significant (Bonferroni correction applied p = .016)
Mann Whitney U-Test, comparison of HOD/Subject lead and Teacher.
u = 37124.5; p = 0.059; non-significant when Bonferroni correction is applied.
How favourable are you towards the new computing education curriculum in England?
Mann Whitney U-Test, comparison of HOD/Subject lead and Teacher.
U = 23698.5; p < 0.001; significant
How confident are you at delivering your current computing education curriculum at the following
Mann Whitney U-Test, comparison of HOD/Subject lead and Teacher.
Key Stage 3 - u = 28009.5; p < 0.05; significant Key Stage 4 - u = 22572; p < 0.001; significant

Understanding Computing Education in the UK
May 2017 Page 119
stages/levels? AS - u = 20721; p = .001; significant A Level - u = 19349; p < 0.001; significant
S1-S3 – u = 192; p = .127; non-significant S4-S6 – u = 215; p = .538; non-significant
Table K: SECONDARY SCHOOLS – Differences by highest qualification held with respect to three dependent variables
By survey question (variable) Statistical Test Results
How well did you understand the concept of computational thinking prior to completing this questionnaire?
Mann Whitney U-Test, comparison of computer science and NOT computer science.
U = 24503; p < 0.001; significant
Mann Whitney U-Test, comparison of Other maths/science and NOT Other maths/science.
U = 19905.5; p = .644; non-significant
Mann Whitney U-Test, comparison of All other disciplines and NO other disciplines.
U = 3703; p < 0.001; significant
How favourable are you towards the new computing education curriculum in England?
Mann Whitney U-Test, comparison of computer science and NOT computer science.
U = 19524.5; p < .001; significant
Mann Whitney U-Test, comparison of Other maths/science and NOT Other maths/science.
U = 14131; p = .370; non-significant
Mann Whitney U-Test, comparison of All other disciplines and NO other disciplines.
U = 17270; p < .001; significant
How confident are you at delivering your current computing education curriculum at the following stages/levels?
Mann Whitney U-Test, comparison of computer science and NOT computer science.
Key Stage 3 - u = 2020.5; p < .001; significant Key Stage 4 – u = 18791; p < .001; significant AS – u = 13571.5; p < .001; significant A Level – u = 13256; p < .001; significant
S1-S3 – u = 152.5, p = .240; non-significant

Understanding Computing Education in the UK
May 2017 Page 120
S4-S6 – u = 137.5, p = .263; non-significant
Mann Whitney U-Test, comparison of Other maths/science and NOT Other maths/science.
KS3 - u = 14617; p = .208; non-significant KS4 – u = 15219.5; p = .463; non-significant AS – u = 10527; p = .147; non-significant A Level – u = 10775.5; p = .269; non-significant S1-S3 – u = 138, p = .837; non-significant S4-S6 – u = 116, p = .731; non-significant
S1-S3 – u = 138, p = .837; non-significant S4-S6 – u = 116, p = .731; non-significant
Mann Whitney U-Test, comparison of All other disciplines and NO other disciplines.
Key Stage 3 - u = 16838.5; p < .001; significant Key Stage 4 – u = 16154.5; p < .001; significant AS – u = 10099.5; p < .001; significant A Level – u = 10232.5; p < .001; significant S1-S3 – u = 34.5, p < .05; significant S4-S6 – u = 49.5, p = .213; non-significant
S1-S3 – u = 34.5, p < .05; significant S4-S6 – u = 49.5, p = .213; non-significant

Understanding Computing Education in the UK
May 2017 Page 121
Table L: SECONDARY SCHOOLS – Differences by length of time in the profession with respect to three dependent variables
By survey question (variable) Statistical Test Results
How well did you understand the concept of computational thinking prior to completing this questionnaire?
Kruskal Wallis Test, comparison of less than 1 year, 1-2 years, 3-5 years, 6-9 years, 10+ years.
P = .102; non-significant
How favourable are you towards the new computing education curriculum in England?
Kruskal Wallis Test, comparison of less than 1 year, 1-2 years, 3-5 years, 6-9 years, 10+ years.
P = .011; significant (applying Bonferroni correction p = .01)
Mann Whitney U-Test, comparison of less than 1 year and 1-2 years.
P < .045; non-significant with Bonferroni correction
Mann Whitney U-Test, comparison of less than 1 year and 3-5 years.
P < .005; significant
Mann Whitney U-Test, comparison of less than 1 year and 6-9 years.
P = .001; significant
Mann Whitney U-Test, comparison of less than 1 year and 10+ years.
P = .001; significant
Mann Whitney U-Test, comparison of 1-2 years and 3-5 years.
P = .215; non-significant
Mann Whitney U-Test, comparison of 1-2 years and 6-9 years.
P = .105; non-significant
Mann Whitney U-Test, comparison of 1-2 years and 10+ years.
P = .156; non-significant
Mann Whitney U-Test, comparison of 3-5 years and 6-9 years.
P = .724; non- significant
Mann Whitney U-Test, comparison of 3-5 years and 10+ P = .894; non-significant

Understanding Computing Education in the UK
May 2017 Page 122
years.
Mann Whitney U-Test, comparison of 6-9 years and 10+ years.
P = .559; non-significant
How confident are you at delivering your current computing education curriculum at the following stages/levels?
Kruskal Wallis Test, comparison of less than 1 year, 1-2 years, 3-5 years, 6-9 years, 10+ years.
KS3 – p = .057; marginally significant KS4 – p = .066; marginally significant AS – p < .081; marginally significant A Level – p = .031; significant S1-S3 – p = .719; non-significant S4-S6 – p = .351; non-significant (applying Bonferroni correction p = .01)
Mann Whitney U-Test, comparison of less than 1 year and 1-2 years.
Key Stage 3 – u = 223; p = .187; non-significant Key Stage 4 – u = 273; p = .432; non-significant AS – u = 278.5; p = 832; non-significant A Level – u = 253; p = .570; non-significant
Mann Whitney U-Test, comparison of less than 1 year and 3-5 years.
Key Stage 3 – u = 337; p < .032; non-significant when applying Bonferroni correction Key Stage 4 – u = 448.5; p = .569; non-significant AS – u = 360; p = .403; non-significant A Level – u = 346.5; p = .354; non-significant
Mann Whitney U-Test, comparison of less than 1 year and 6-9 years.
Key Stage 3 – u = 682.5; p = .889; non-significant Key Stage 4 – u = 565; p = .242; non-significant AS – u = 484.5; p = .204; non-significant A Level – u = 454.5; p = .128; non-significant
Mann Whitney U-Test, comparison of less than 1 year and 10+ years.
Key Stage 3 – u = 2517.5; p = .303; non-significant Key Stage 4 – u = 2871.5; p = .931; non-significant AS – u = 2471; p = .975; non-significant A Level – u = 2465; p = .943; non-significant

Understanding Computing Education in the UK
May 2017 Page 123
Mann Whitney U-Test, comparison of 1-2 years and 3-5 years.
Key Stage 3 – u = 910.5; p = 362; non-significant Key Stage 4 – u = 1035.5; p = .772; non-significant AS – u = 604; p = <.032; non-significant when applying Bonferroni correction A Level – u = 691.5; p = .331; non-significant
Mann Whitney U-Test, comparison of 1-2 years and 6-9 years.
Key Stage 3 – u = 1206.5; p = .156; non-significant Key Stage 4 – u = 1397.5; p = .554; non-significant AS – u = 887.5; p = .027; non-significant when applying Bonferroni correction A Level – u = 923.5; p = .098; non-significant
Mann Whitney U-Test, comparison of 1-2 years and 10+ years.
Key Stage 3 – u = 5637; p = .496; non-significant Key Stage 4 – u = 5464; p = .166; non-significant AS – u = 4796.5; p = .745; non-significant A Level – u = 4434; p = .431; non-significant
Mann Whitney U-Test, comparison of 3-5 years and 6-9 years.
KS3 – u = 1782.5; p = .008; significant KS4 – u = 2162; p = .420; non-significant AS – u = 1628.5; p = .549; non-significant A Level – u = 1542; p = .444; non-significant
Mann Whitney U-Test, comparison of 3-5 years and 10+ years.
Key Stage 3 – u = 8352; p = .033; non-significant when applying Bonferroni correction Key Stage 4 – u = 8851.5; p = .183; non-significant AS – u = 6233.5; p = .146; non-significant A Level –u = 5987.5; p = .096; non-significant
Mann Whitney U-Test, comparison of 6-9 years and 10+ years.
Key Stage 3 – u = 12823; p = .168; non-significant Key Stage 4 – u = 11276.5; p = .008; significant AS – u = 8513.5; p = .018; marginally significant when applying Bonferroni correction A Level – u = 7973; p = .003; significant