Embed Size (px)
Citation preview

DRIVINGNEWFRONTIERSFORSUSTAINABLEGROWTH
2015
CONSOLIDATEDANNUALFINANCIALSTATEMENTS

Country of incorporation and domicile SouthAfrica
Company registration number 1993/004149/30
Directors SMacozoma#(Chairman,effective1March2015)
BMabuza#(Chairmanresigned28February2015)
RMorar#
JLamola#
BLuthuli#
CMabude#
PMabelane#(resigned31December2014)
KMoroka#
TRamano#(resigned28February2015)
DBotha#
MMabela#(appointed1March2015)
SSimelane#(appointed1March2015)
MMatlou#(appointed1March2015)
BMaseko*
MManyama*
Registered office TheMaples
RiverwoodsOfficePark
24JohnsonRoad
Bedfordview
2008
Postal address POBox75480
Gardenview
2047
Bankers StandardBank
Nedbank
Auditors Auditor-GeneralSouthAfrica
Secretary NKekana
# Non-executivedirector* Executivedirector
GENERAL INFORMATION
CONTENTS
Statement of financial position 12Statement of comprehensive income 13Statement of changes in equity 14Statement of cash flows 16
Notes to the consolidated annual financial statements
1. Basis of preparation and accounting policies
18
2. New standards and interpretations 183. Segmental information 21
A. Managing EBITDAA.1 Revenue 24A.2 Other income 25A.3 Employee costs 26A.4 Other operating expenses 26B. AssetsB.1 Investment property 27B.2 Property and equipment 28
C. Debt and cash managementC.1 Interest-bearing borrowings 34C.2 Net finance income and expenses 36C.3 Derivative financial instruments and
hedging information37
D. Managing working capitalD.1 Trade and other receivables 38D.2 Cash and cash equivalents 40D.3 Trade and other payables 40D.4 Cash generated from operations 41D.5 Tax paid 42D.6 Other non-current assets 42
E. InvestmentsE.1 Subsidiaries 42E.2 Joint arrangements 43E.3 Investments in associates 44E.4 Commitments 47
The reports and statements set out below comprise the consolidated annual financial statements presented to the shareholders:
Report of the Board Audit and Risk Committee 2
Directors’ responsibilities and approval 3
Company Secretary’s certification 4
Report of the auditor-general to Parliament on Airports Company South Africa SOC Limited 5
Directors’ report 10
F. Financial instrumentsF.1 Financial instruments 48F.2 Financial risk management 50
G. OtherG.1 Intangible assets 54G.2 Deferred tax liability 55G.3 Retirement benefits 56G.4 Investments 58G.5 Share capital 58G.6 Other reserves 58G.7 Deferred income 59G.8 Provisions 59G.9 Taxation 60G.10 Earnings per share 61G.11 Related parties 62G.12 Events after the reporting period 64G.13 Irregular expenditure 64G.14 Fruitless and wasteful expenditure 65G.15 Prior period errors 66G.16 Change in estimate 68G.17 Contingencies 68
Annexure 1: Reconciliation of Regulatory asset base (RAB) to IFRS asset carrying amount
69
These consolidated annual financial statements were prepared under the supervision of the Chief Financial Officer: Maureen Manyama CA(SA).
These consolidated annual financial statements have been audited in compliance with the applicable requirements of the Companies Act 71 of 2008.
CONSOLIDATED ANNUAL FINANCIAL
STATEMENTS 20151

AIRPORTS COMPANY SOUTH AFRICA2
REPORT OF THE BOARD AUDIT AND RISK COMMITTEEFor the year ended 31 March 2015
The Board Audit and Risk Committee (“Committee”) of the Airports Company South Africa consists of four non-
executive directors. The skills and competencies of the members are outlined on pages 138 to 141 of the integrated
report. The Committee operated under terms of reference which is approved by the Board. The Committee has
carried out its duties as per the Companies Act and the Public Finance Management Act, including the special
mandates that are assigned by the Board from time to time.
The Committee reports that it has discharged its responsibilities as it relates to the following, namely review of:
• The Group’s policies and procedures for detecting and preventing fraud.
• The effectiveness of the Group’s policies, systems and procedures.
• The controls over significant financial and operational risks.
• Any other matters referred to it by the Board of Directors.
• The Group’s compliance with significant legal and regulatory provisions.
• The significant reported cases of employee conflicts of interest, misconduct or fraud, or any other unethical activity by employees and or Group.
• The internal audit charter to ensure internal audit function discharges its responsibilities with independence and objectivity and in accordance with the International Standards for The Professional Practice of Internal Auditing (Standards).
• The effectiveness and adequacy of the Internal Audit department and adequacy of its annual work plan.
• Considered whether the independence, objectives, organisation, resourcing plans, financial budgets, audit plans and standing of internal audit function provide adequate support to enable the Committee to meet its objectives.
• The results of the work performed by the internal audit function in relation to financial reporting, corporate governance, risk areas, internal control, significant investigation and management response.
• The independence and objectivity of external auditors.
• The external auditor’s findings and reports submitted to management.
• The accounting and auditing concerns identified by internal and external auditors.
• The adequacy, reliability and accuracy of financial information provided by management and other users of such information.
• The integrated report and consolidated annual financial statements, performance and prospects of the Group and recommendation for approval to the Board of Directors.
The Committee is of the opinion that the internal financial controls are adequate to ensure that the financial records
may be relied upon in the preparation of the consolidated annual financial statements, and accountability for assets
and liabilities is maintained. The conclusion has been reached based on the discussions and explanations obtained
from management, external and internal auditors based on the results of their audits.
No significant matters relating to the material breakdown of internal controls have come to the attention of the
Committee, other than those reported in the directors’ report. The Committee is satisfied that the accounting
policies adopted in the preparation of the consolidated annual financial statements are appropriate, and that the
judgements and estimates made in their preparation are reasonable and prudent.
The Committee reviewed the ‘going concern’ of the Company and is satisfied that the adoption of the going concern
premise in the preparation of the consolidated annual financial statements is appropriate.
We therefore recommend that the consolidated annual financial statements, as submitted, be approved.
On behalf of the Board Audit and Risk Committee.
B Luthuli
Chairman
31 July 2015

DIRECTORS’ RESPONSIBILITIES AND APPROVALFor the year ended 31 March 2015
The directors are required in terms of the Companies Act No. 71 of 2008, Treasury Regulations and the Public Finance
Management Act No. 1 of 1999 as amended (PFMA), to maintain adequate accounting records and are responsible
for the content and integrity of the consolidated annual financial statements and related financial information
included in this report. It is their responsibility to ensure that the consolidated annual financial statements fairly
present the state of affairs of the group as at the end of the financial year and the results of its operations and
cash flows for the period then ended, in conformity with International Financial Reporting Standards (IFRS). The
external auditors are engaged to express an independent opinion on the consolidated annual financial statements.
The consolidated annual financial statements are prepared in accordance with International Financial Reporting
Standards (IFRS), and are based upon appropriate accounting policies consistently applied and supported by
reasonable and prudent judgements and estimates.
The directors acknowledge that they are ultimately responsible for the system of internal financial control
established by the group and place considerable importance on maintaining a strong control environment. To enable
the directors to meet these responsibilities, the Board sets standards for internal control aimed at reducing the risk of
error or loss in a cost effective manner. The standards include the proper delegation of responsibilities within a clearly
defined framework, effective accounting procedures and adequate segregation of duties to ensure an acceptable
level of risk. These controls are monitored throughout the group and all employees are required to maintain
the highest ethical standards in ensuring the group’s business is conducted in a manner that in all reasonable
circumstances is above reproach. The focus of risk management in the group is on identifying, assessing, managing
and monitoring all known forms of risk across the group. While operating risk cannot be fully eliminated, the group
endeavours to minimise it by ensuring that appropriate infrastructure, controls, systems and ethical behaviour are
applied and managed within predetermined procedures and constraints.
The directors are of the opinion, based on the information and explanations given by management that the system
of internal control provides reasonable assurance that the financial records may be relied on for the preparation of
the consolidated annual financial statements. However, any system of internal financial control can provide only
reasonable, and not absolute, assurance against material misstatement or loss.
The consolidated annual financial statements have been prepared on the basis of accounting policies applicable to a
going concern. This basis presumes that funds will be available to finance future operations and that the realisation
of assets and settlement of liabilities, contingent obligations and commitments will occur in the ordinary course
of business.
The external auditors are responsible for independently auditing and reporting on the group’s consolidated annual
financial statements. The consolidated annual financial statements have been examined by the group’s external
auditors and their report is presented on pages 5 to 9.
The consolidated annual financial statements set out on pages 12 to 68, which have been prepared on the going
concern basis, were approved by the Board of Directors on 31 July 2015 and were signed on its behalf by:
S Macozoma R Morar
Chairman Deputy Chairman
31 July 2015 31 July 2015
CONSOLIDATED ANNUAL FINANCIAL
STATEMENTS 20153

AIRPORTS COMPANY SOUTH AFRICA4
COMPANY SECRETARY’S CERTIFICATIONFor the year ended 31 March 2015
DECLARATION BY THE GROUP SECRETARY IN RESPECT OF SECTION 88(2)(e) OF THE COMPANIES ACT
In terms of section 88(2)(e) of the Companies Act, No. 71 of 2008, as amended, I certify that the group has lodged
with the Commissioner all such returns as are required of a state owned company in terms of the Companies Act
and that all such returns are true, correct and up to date.
In terms of section 8(1) of the Airports Company Act, No. 44 of 1993, I certify that, for the financial year ended
31 March 2015, Airports Company South Africa SOC Limited has lodged, with the Minister of Transport, the
consolidated annual financial statements in respect of the preceding financial year.
N Kekana
Company Secretary
31 July 2015

Report of the auditor-general to Parliament on Airports Company South Africa SOC Limited
Report on the consolidated and separate financial statements
Introduction
1. I have audited the consolidated and separate financial statements of the Airports Company South Africa SOC
Limited and its subsidiaries set out on pages 12 to 68, which comprise the consolidated and separate statement
of financial position as at 31 March 2015, the consolidated and separate statement of comprehensive income,
statement of changes in equity and statement of cash flows for the year then ended, as well as the notes,
comprising a summary of significant accounting policies and other explanatory information.
The board of directors’ responsibility for the consolidated and separate financial statements
2. The board of directors, which constitutes the accounting authority is responsible for the preparation and fair
presentation of these consolidated and separate financial statements in accordance with International Financial
Reporting Standards (IFRS) and the requirements of the Public Finance Management Act of South Africa, 1999
(Act No. 1 of 1999) (PFMA) and the Companies Act of South Africa, 2008 (Act No. 71 of 2008), and for such
internal control as the accounting authority determines is necessary to enable the preparation of consolidated
and separate financial statements that are free from material misstatement, whether due to fraud or error.
Auditor-general’s responsibility
3. My responsibility is to express an opinion on these consolidated and separate financial statements based on my
audit. I conducted my audit in accordance with International Standards on Auditing. Those standards require
that I comply with ethical requirements, and plan and perform the audit to obtain reasonable assurance about
whether the consolidated and separate financial statements are free from material misstatement.
4. An audit involves performing procedures to obtain audit evidence about the amounts and disclosures in the
consolidated and separate financial statements. The procedures selected depend on the auditor’s judgement,
including the assessment of the risks of material misstatement of the consolidated and separate financial
statements, whether due to fraud or error. In making those risk assessments, the auditor considers internal control
relevant to the entity’s preparation and fair presentation of the consolidated and separate financial statements in
order to design audit procedures that are appropriate in the circumstances, but not for the purpose of expressing an
opinion on the effectiveness of the entity’s internal control. An audit also includes evaluating the appropriateness
of accounting policies used and the reasonableness of accounting estimates made by management, as well as
evaluating the overall presentation of the consolidated and separate financial statements.
5. I believe that the audit evidence I have obtained is sufficient and appropriate to provide a basis for my audit opinion.
Opinion
6. In my opinion, the consolidated and separate financial statements present fairly, in all material respects, the
financial position of the Airports Company South Africa SOC Limited and its subsidiaries as at 31 March 2015
and their financial performance and cash flows for the year then ended, in accordance with IFRS and the
requirements of the PFMA and Companies Act.
Additional matters
7. I draw attention to the matters below. My opinion is not modified in respect of these matters.
Prior year audited by a predecessor auditor
8. The financial statements of the prior year were audited by a predecessor auditor in terms of section 4(3) of the
Public Audit Act on 31 July 2014.
CONSOLIDATED ANNUAL FINANCIAL
STATEMENTS 20155

AIRPORTS COMPANY SOUTH AFRICA6
Report of the auditor-general to Parliament on Airports Company South Africa SOC Limited (Continued)
Unaudited supplementary schedules
9. The supplementary information set out on page 69 (annexure 1) does not form part of the financial statements
and is presented as additional information. I have not audited this schedule and, accordingly, I do not express
an opinion thereon
Other reports required by the Companies Act
10. As part of my audit of the financial statements for the year ended 31 March 2015, I have read the directors’
report, the audit committee’s report and the company secretary’s certificate for the purpose of identifying
whether there are material inconsistencies between these reports and the audited financial statements.
These reports are the responsibility of the respective preparers. Based on reading these reports I have not
identified material inconsistencies between the reports and the audited financial statements. I have not audited
the reports and accordingly do not express an opinion on them.
Report on other legal and regulatory requirements
11. In accordance with the Public Audit Act of South Africa, 2004 (Act No. 25 of 2004) (PAA) and the general
notice issued in terms thereof, I have a responsibility to report findings on the reported performance information
against predetermined objectives for selected objectives presented in the annual performance report, non-
compliance with legislation and internal control. The objective of my tests was to identify reportable findings as
described under each subheading but not to gather evidence to express assurance on these matters. Accordingly,
I do not express an opinion or conclusion on these matters.
Predetermined objectives
12. I performed procedures to obtain evidence about the usefulness and reliability of the reported performance
information for the following selected objectives presented in the annual performance report of the public entity
for the year ended 31 March 2015:
• Deliver long term profitability on page 32 of the integrated report
• Control funding and cost of borrowing on page 32 of the integrated report
• Entrench and deepen partner relationship on page 33 of the integrated report
• Deliver exceptional passenger services on page 33 of the integrated report
• Enhance returns (Identify and secure new business) on page 34 of the integrated report
• Continually re-engineer and align business operations and processes on page 34 of the integrated report
• Inclusive infrastructure capacity planning and development on page 35 of the integrated report
• Leverage IT for competitive advantage on page 35 of the integrated report
• Good governance on page 36 of the integrated report.
13. I evaluated the reported performance information against the overall criteria of usefulness and reliability.
14. I evaluated the usefulness of the reported performance information to determine whether it was presented
in accordance with the National Treasury’s annual reporting principles and whether the reported performance
was consistent with the planned objectives. I further performed tests to determine whether indicators and
targets were well defined, verifiable, specific, measurable, time bound and relevant, as required by the National
Treasury’s Framework for managing programme performance information (FMPPI).
15. I assessed the reliability of the reported performance information to determine whether it was valid, accurate
and complete.

16. The material findings in respect of the selected objectives are as follows:
Objective: Entrench and deepen partner relationship
Usefulness of reported performance information
17. Performance indicators should be well defined by having clear definitions so that data can be collected consistently
and is easy to understand and use, as required by the FMPPI. 100% of the indicators were not well defined.
Objective: Enhance returns (Identify and secure new business)Usefulness of reported performance information
18. Performance indicators should be well defined by having clear definitions so that data can be collected consistently
and is easy to understand and use, as required by the FMPPI. 50% of the indicators were not well defined.
Reliability of reported performance information
19. The FMPPI requires auditees to have appropriate systems to collect, collate, verify and store performance
information to ensure valid, accurate and complete reporting of actual achievements against planned objectives,
indicators and targets. 50% of the targets were not reliable when compared to the source information
or evidence provided. This was due to the indicators not being consistent with the reported performance
information.
Objective: Continually re-engineer and align business operations and processesReliability of reported performance information
20. The FMPPI requires auditees to have appropriate systems to collect, collate, verify and store performance
information to ensure valid, accurate and complete reporting of actual achievements against planned objectives,
indicators and targets. Adequate and reliable corroborating evidence could not be provided for 50% of the
targets to assess the reliability of the reported performance information. The system used to record the safety
and security incidents is live and does not provide historical data. The auditee’s records did not permit the
application of alternative audit procedures.
Objective: Inclusive infrastructure capacity planning and developmentUsefulness of reported performance information
21. Performance indicators should be well defined by having clear definitions so that data can be collected
consistently and is easy to understand and use, as required by the FMPPI. 100% of the indicators were not well
defined.
Objective: Good governance
Usefulness of reported performance information
22. Performance indicators should be well defined by having clear definitions so that data can be collected
consistently and is easy to understand and use, as required by the FMPPI. 100% of the indicators were not well
defined.
23. I did not identify any material findings on the usefulness and reliability of the reported performance information
for the following objectives:
• Deliver long term profitability
• Control funding and cost of borrowing
• Deliver exceptional passenger services
• Leverage IT for competitive advantage
CONSOLIDATED ANNUAL FINANCIAL
STATEMENTS 20157

AIRPORTS COMPANY SOUTH AFRICA8
Report of the auditor-general to Parliament on Airports Company South Africa SOC Limited (Continued)
Additional matters
24. I draw attention to the following matters:
Achievement of planned targets
25. Refer to the annual performance report on pages 32 to 39 for information on the achievement of the planned
targets for the year. This information should be considered in the context of the material findings on the
usefulness and reliability of the reported performance information for the selected objectives reported in
paragraphs 17 to 22 of this report.
Adjustment of material misstatements
26. I identified material misstatements in the annual performance report submitted for auditing on the reported
performance information of Good governance, Inclusive infrastructure capacity planning and development and
Leverage IT for competitive advantage. As management subsequently corrected the misstatements I did not
raise any material findings on the reliability of the reported performance information.
Compliance with legislation
27. I performed procedures to obtain evidence that the public entity had complied with applicable legislation
regarding financial matters, financial management and other related matters. My findings on material non-
compliance with specific matters in key legislation, as set out in the general notice issued in terms of the PAA,
are as follows:
Strategic planning and performance management
28. The corporate plan does not cover the affairs of the subsidiaries in accordance with section 52 (b) of the PFMA
and practice note 4 of 2009-10 issued by the National Treasury.
Financial statements, performance and annual reports
29. The financial statements submitted for auditing were not prepared in accordance with the prescribed financial
reporting framework as required by section 55(1)-(b) of the PFMA and section 29(1)-(a) of the Companies Act.
Material misstatements pertaining to investment properties, fair value adjustment, capital commitments, future
lease income, future lease payments and deferred taxation identified by the auditors in the submitted financial
statements were subsequently corrected resulting in the financial statements receiving an unqualified audit
opinion.
Expenditure management
30. The accounting authority did not take effective steps to prevent irregular expenditure and fruitless and wasteful
expenditure, as required by section 51(1)-(b)-(ii) of the PFMA.
Procurement and contract management
31. Certain goods, works or services were not procured through a procurement process which is fair, equitable,
transparent and competitive as required by section 51(1)-(a)-(iii) of the PFMA.
32. The procurement system did not comply with the requirements of a fair SCM (Supply chain management)
system as per section 51(1)-(a)-(iii) of the PFMA, in that:
• some invitations for competitive bidding were not advertised for a minimum period as prescribed in the
SCM policy
33. Certain contracts and quotations were awarded to suppliers whose tax matters had not been declared by the
South African Revenue Services to be in order as required by the Preferential Procurement Regulation 14.

Internal control
34. I considered internal control relevant to my audit of the financial statements, annual performance report
and compliance with legislation. The matters reported below are limited to the significant internal control
deficiencies that resulted in the findings on the annual performance report and the findings on non-compliance
with legislation included in this report.
Leadership
35. The corporate plan was developed within the balance score card framework instead of the National Treasury’s
FMPPI.
36. The corporate plan was not adequately reviewed to ensure that the reported performance information is aligned
to the targets.
37. The subsidiary governance framework was developed and approved after the corporate plan had been approved
by the executive authority.
Financial and performance management
38. SCM officials were not adequately trained on the implementation of the SCM policy and the relevant laws and
regulations.
39. Insufficient monitoring controls by management over the procurement and contract management process.
40. The previous SCM policy was not aligned to the Preferential Procurement Regulations and the updated policy
became effective on 1 September 2014.
41. Lack of effective controls to prevent and detect non-compliance with laws and regulations in the procurement and contract management environment.
42. Annual financial statements were not adequately reviewed to ensure compliance with the reporting framework before submission for audit.
Pretoria
31 July 2015
CONSOLIDATED ANNUAL FINANCIAL
STATEMENTS 20159

AIRPORTS COMPANY SOUTH AFRICA10
GENERAL INFORMATION
The directors have pleasure in submitting their report on the consolidated annual financial statements of Airports
Company South Africa SOC Limited for the year ended 31 March 2015.
The Company was established in terms of the Airports Company Act, No. 44 of 1993 as amended and the Companies
Act, No. 71 of 2008 as amended.
NATURE OF BUSINESS
The principal activities of the Company are the acquisition, establishment, development, provision, maintenance,
management, control and operation of airports or part of any airport or any facilities or services that are normally
performed at an airport.
There have been no material changes to the nature of the Group’s business from prior years.
REVIEW OF OPERATIONS
Revenue for the Group amounted to R7.8 billion (2014: R7.1 billion), including non-aeronautical revenue of
R2.8 billion (2014: R2.6 billion).
Profit before income tax for the Group amounted to R2.3 billion (2014: R2.3 billion).
The profit for the year for the Group was R1.6 billion (2014: R1.7 billion) after taxation expense of R716 million
(2014: R591 million).
DIVIDENDS
The Board of Directors has approved an ordinary dividend of R274 million for the 2015 financial year (2014:
R300 million).
CAPITAL EXPENDITURE
During the year R826 million (2014: R928 million) was spent on capital expenditure relating to improvements,
expansions and replacements by the Group. (Refer to notes B1, B2 and G1 for more details).
SHARE CAPITAL
There were no changes to the authorised and issued share capital of the company and the Group during the
financial year.
GOING CONCERN
The consolidated annual financial statements have been prepared on the basis of accounting policies applicable to a
going concern. This basis presumes that funds will be available to finance future operations and that the realisation
of assets and settlement of liabilities, contingent obligations and commitments will occur in the ordinary course
of business.
SUBSIDIARIES, JOINT VENTURES AND ASSOCIATES
The Group has a 100% interest in ACSA Global Ltd, a management company incorporated in Mauritius. The
investment has been accounted for as a subsidiary.
Airports Company South Africa SOC Limited holds a 100% interest in JIA Piazza (Pty) Ltd. The investment has been
accounted for as a subsidiary.
Airports Company South Africa SOC Limited holds a 100% interest in Precinct 2A (Pty) Ltd. The investment has
been accounted for as a subsidiary.
ACSA Global Ltd holds a 10% interest in the Mumbai International Airport concession (MIAL). ACSA Global Ltd is
registered in Mauritius. The investment has been accounted for as an associate.
DIRECTORS’ REPORTFor the year ended 31 March 2015

The Group has a 50% interest in Airport Logistics Property Holdings (Pty) Ltd, which is a joint venture between the company and The Bidvest Group Ltd. The investment has been accounted for as a joint venture using the equity method of accounting.
Airports Company South Africa SOC Ltd has a 40% interest in the La Mercy JV Property Investments (Pty) Ltd, a property holding, development and letting company. The investment has been accounted for as an associate.
Airports Company South Africa SOC Ltd holds a 10% interest in Aeroporto de Guarulhos Participações S.A. Aeroporto de Guarulhos Participações S.A. is registered in Brazil. The investment has been accounted for as an associate.
Details of the assets, liabilities, revenues and expenses of the joint ventures and associates that are included in the consolidated statement of comprehensive income and the consolidated statement of financial position are set out in notes E1, E2 and E3 of the consolidated annual financial statements.
The Group’s accounts include the consolidation of the Airports Management Share Incentive Scheme Company (Pty) Ltd and Lexshell 342 Investment Holdings (Pty) Ltd. These companies are consolidated in terms of International Financial Reporting Standards. The Group consolidates these entities as it is exposed to significant risks that are associated with loans extended to the entities to acquire shares of the company.
DIRECTORS AND SECRETARYDetails of the Directors and Secretary of the company are given on pages 138 to 141 of the integrated report.
INTERESTS OF DIRECTORS AND OFFICERSNo contracts were entered into in which Directors and officers of the company had an interest and which affect the business of the Group. The Directors had no interest in any third party or company responsible for managing any of the business activities of the Group. The emoluments of directors are determined by the shareholders. No long-term service contracts exist between Directors and the Group. (Directors emoluments can be found in note G11.)
INFORMATION REQUIRED IN TERMS OF THE PUBLIC FINANCE MANAGEMENT ACTIn terms of the materiality framework agreed with the shareholder and as per section 55(2)(b)(i) and (ii) of the PFMA, any losses due to criminal conduct or irregular or fruitless and wasteful expenditure that individually (or collectively where items are closely related) exceed R60 million, must be disclosed separately, including any criminal or disciplinary steps taken as a consequence of such losses or irregular or fruitless and wasteful expenditure.
Fruitless and wasteful expenditure of R13 million (2014: R1.7 million) in relation to:
1 losses in relation to cancelled tenders;
2 non-compliance to the Treasury Risk Management Policy Framework and the ACSA SCM Policy and Procedure Manual, (ie by not properly managing the foreign exchange risk by taking a forward cover); and
3 Competition Commission penalty – price-fixing in the market for the supply of parking bays to car rental companies at O.R. Tambo International Airport and Gautrain stations.
Irregular expenditure of R171 million (2014: R140 million). The figure for the 2014 financial year has been adjusted to reflect incidents that led to irregular expenditure identified in the current financial year, but the expenditure was incurred in the previous financial year. (Refer to note G.13 for more details.)
The irregular expenditure incidents relate to contravention of the supply chain management policy and the Preferential Procurement Policy Framework Act (PPPFA) and regulations.
The Directors ensure that management has controls in place to monitor and report on this type of expenditure on a regular basis. This information is considered and presented to the Executive Committee (Exco) and the Audit and Risk Committee for review on a quarterly basis.
Management has controls in place to monitor and report on this type of expenditure on a regular basis. This
information is considered and presented to Exco and the Audit and Risk Committee for review on a quarterly basis.
CONSOLIDATED ANNUAL FINANCIAL
STATEMENTS 201511

AIRPORTS COMPANY SOUTH AFRICA12
GROUP COMPANY
Figures in Rand thousand Note 2015 2014 2013 2015 2014 2013
ASSETSNon-current assetsProperty and equipment B.2 19 142 498 19 711 503 20 173 192 19 105 318 19 675 933 20 145 391Investment property B.1 3 693 480 3 275 949 2 991 127 3 371 332 2 923 205 2 610 053Intangible assets G.1 55 657 110 608 150 480 55 657 110 608 150 465Investments in subsidiaries E.1 – – – 785 586 790 006 782 750Investments in joint ventures E.2 127 942 107 383 85 078 – – –Investments in associates E.3 1 348 026 1 422 739 932 832 296 056 293 327 112 273Other non-current assets D.6 145 850 228 714 270 096 145 850 228 714 270 096
24 513 453 24 856 896 24 602 805 23 759 799 24 021 793 24 071 028
Current assetsInventories 1 391 1 180 6 222 – – –Derivative financial instruments C.3 701 – 11 215 701 – 11 215Current tax receivable 4 980 461 614 – – –Trade and other receivables D.1 1 183 312 942 765 928 599 1 172 113 935 034 919 267Investments G.4 515 899 1 073 569 1 204 998 515 899 1 073 569 1 204 998Cash and cash equivalents D.2 1 226 566 1 014 508 1 254 120 1 198 914 973 461 1 204 173
2 932 849 3 032 483 3 405 768 2 887 627 2 982 064 3 339 653
Total assets 27 446 302 27 889 379 28 008 573 26 647 426 27 003 857 27 410 681
EQUITY AND LIABILITIESEquityShare capital – Ordinary G.5 500 000 500 000 500 000 500 000 500 000 500 000Share premium G.5 250 000 250 000 250 000 250 000 250 000 250 000Treasury share reserve (44 024) (44 024) (44 024) – – –Other reserves G.6 67 887 (77 467) (204 355) 163 709 119 831 62 212Retained income 13 221 663 11 951 507 10 336 978 12 480 596 11 002 535 9 563 973
13 995 526 12 580 016 10 838 599 13 394 305 11 892 366 10 376 185
LiabilitiesNon-current liabilitiesDerivative financial instruments C.3 50 719 48 081 226 551 50 719 48 081 226 551Retirement benefit obligation G.3 30 831 34 858 186 484 30 831 34 858 186 484Deferred income G.7 62 859 69 614 72 249 62 859 69 614 72 249Deferred tax liability G.2 1 129 701 1 125 960 956 461 952 230 948 680 847 440Interest-bearing borrowings C.1 10 036 846 11 125 401 11 880 638 10 036 846 11 125 401 11 880 910
11 310 956 12 403 914 13 322 383 11 133 485 12 226 634 13 213 634
Current liabilitiesDerivative financial instruments C.3 24 304 51 601 45 383 24 304 51 601 45 383 Current tax payable 61 999 68 644 20 437 61 999 67 938 20 437Trade and other payables D.3 725 658 758 599 833 876 706 974 740 213 808 919Deferred income G.7 3 339 2 731 2 699 3 339 2 731 2 699Provisions G.8 184 816 177 365 103 500 184 816 177 365 103 500Interest-bearing borrowings C.1 1 139 704 1 846 509 2 841 696 1 138 204 1 845 009 2 839 924
2 139 820 2 905 449 3 847 591 2 119 636 2 884 857 3 820 862
Total liabilities 13 450 776 15 309 363 17 169 974 13 253 121 15 111 491 17 034 496
Total equity and liabilities 27 446 302 27 889 379 28 008 573 26 647 426 27 003 857 27 410 681
STATEMENT OF FINANCIAL POSITIONAs at 31 March 2015

GROUP COMPANY
Restated Restated
Figures in Rand thousand Note 2015 2014 2015 2014
Revenue A.1 7 761 209 7 126 961 7 611 704 6 981 504
Other income A.2 365 426 257 856 405 908 286 050
Employee costs A.3 (1 066 166) (992 804) (1 041 677) (967 268)
Operating expenses A.4 (1 876 360) (1 744 984) (1 813 804) (1 676 035)
Earnings before interest, tax, depreciation and amortisation 5 184 109 4 647 029 5 162 131 4 624 251
Depreciation, amortisation and impairments B.2& G.1 (1 393 491) (1 412 665) (1 388 753) (1 408 391)
(Loss)/Profit from equity accounted investments E.2 & E.3 (155 446) 228 582 – –
Finance income C.2 87 098 64 702 141 352 120 619
Finance costs C.2 (1 313 554) (1 380 960) (1 313 554) (1 380 960)
(Losses)/Gains on remeasurement and disposal of financial instruments C.2 (126 043) 156 454 (126 043) 156 454
Profit before taxation 2 282 673 2 303 142 2 475 133 2 111 973
Taxation G.9 (716 094) (590 688) (717 072) (554 304)
Profit for the year 1 566 579 1 712 454 1 758 061 1 557 669
Other comprehensive income
Items that will not be reclassified to profit or loss:
Actuarial gain 1 453 43 987 1 453 43 987
Gains and losses on property revaluation – 20 710 – 20 710
Income tax relating to items that will not be reclassified (407) (18 111) (407) (18 111)
Total items that will not be reclassified to profit or loss 1 046 46 586 1 046 46 586
Items that may be reclassified to profit or loss
Exchange differences on translating foreign operations 130 583 86 380 – –
Effects of cash flow hedges 59 490 15 323 59 490 15 323
Income tax relating to items that may be reclassified (45 763) (21 401) (16 657) (4 290)
Total items that may be reclassified to profit or loss 144 310 80 302 42 833 11 033
Other comprehensive income for the year net of taxation 145 356 126 888 43 879 57 619
Total comprehensive income for the year 1 711 935 1 839 342 1 801 940 1 615 288
Earnings per share
Per share information
Basic earnings per share (cents) G.10 317.10 346.62 351.61 311.53
Diluted earnings per share (cents) G.10 317.10 346.62 351.61 311.53
STATEMENT OF COMPREHENSIVE INCOMEFor the year ended 31 March 2015
CONSOLIDATED ANNUAL FINANCIAL
STATEMENTS 201513

AIRPORTS COMPANY SOUTH AFRICA14
STATEMENT OF CHANGES IN EQUITYFor the year ended 31 March 2015
Figures in Rand thousandShare
capitalShare
premiumTreasure
share reserveOther
reservesRetained
incomeTotal
equity
GROUP
Balance at 1 April 2013 – previously reported 500 000 250 000 (44 024) (204 355) 10 437 027 10 938 648
Adjustments – prior period error – – – – (100 049) (100 049)
Balance at 1 April 2013 – restated 500 000 250 000 (44 024) (204 355) 10 336 978 10 838 599
Profit for the year – restated – – – – 1 712 454 1 712 454
Other comprehensive income:
Actuarial losses on defined benefit post-retirement medical aid liability, net of tax – – – 31 675 – 31 675
Gain on revaluation of investment property, net of tax – – – 14 911 – 14 911
Foreign currency translation differences, net of tax – – – 69 269 – 69 269
Cash flow hedge reserve on derivative financial instruments, net of tax – – – 11 033 – 11 033
Dividends declared – – – – (97 925) (97 925)
Balance at 1 April 2014 – restated 500 000 250 000 (44 024) (77 467) 11 951 507 12 580 016
Balance at 1 April 2014 – previously reported 500 000 250 000 (44 024) (77 467) 12 021 612 12 650 121
Adjustments – prior period error (70 105) (70 105)
Profit for the year – – – – 1 566 579 1 566 579
Other comprehensive income:
Actuarial losses on defined benefit post-retirement medical aid liability, net of tax – – – 1 046 – 1 046
Foreign currency translation differences, net of tax – – – 101 476 – 101 476
Cash flow hedge reserve on derivative financial instruments, net of tax – – – 42 832 – 42 832
Dividends declared – – – – (296 423) (296 423)
Total other comprehensive income – – – 145 354 (296 423) (151 069)
Balance at 31 March 2015 500 000 250 000 (44 024) 67 887 13 221 663 13 995 526
Note G.5 G.5 G.6

Figures in Rand thousandShare
capitalShare
premiumOther
reservesRetained
incomeTotal
equity
COMPANY
Balance at 1 April 2013 – previously reported 500 000 250 000 (83 928) 9 487 940 10 154 012
Adjustments – prior period error – – 146 140 76 033 222 173
Balance at 1 April 2013 – restated 500 000 250 000 62 212 9 563 973 10 376 185
Profit for the year – restated – – – 1 557 669 1 557 669
Other comprehensive income:
Actuarial losses on defined benefit post-retirement medical aid liability, net of tax – – 31 675 – 31 675
Gain on revaluation of investment property, net of tax – – 14 911 – 14 911
Cash flow hedge reserve on derivative financial instruments, net of tax – – 11 033 – 11 033
Dividends declared – – – (99 107) (99 107)
Balance at 1 April 2014 – restated 500 000 250 000 119 831 11 022 535 11 892 366
Balance at 1 April 2014 – previously reported 500 000 250 000 (26 309) 10 953 801 11 677 492
Adjustments – prior period error 146 140 68 734 214 874
Profit for the year – – – 1 758 061 1 758 061
Other comprehensive income:
Actuarial losses on defined benefit post-retirement medical aid liability, net of tax – – 1 046 – 1 046
Cash flow hedge reserve on derivative financial instruments, net of tax – – 42 832 – 42 832
Dividends declared – – – (300 000) (300 000)
Total other comprehensive income – 43 878 (300 000) (256 122)
Balance at 31 March 2015 500 000 250 000 163 709 12 480 596 13 394 305
Note G.5 G.5 G.6
CONSOLIDATED ANNUAL FINANCIAL
STATEMENTS 201515

AIRPORTS COMPANY SOUTH AFRICA16
STATEMENT OF CASH FLOWSFor the year ended 31 March 2015
GROUP COMPANY
Figures in Rand thousand Note 2015 2014 2015 2014
Cash flows from operating activities
Cash receipts from customers 7 520 089 7 164 160 7 383 937 7 016 853
Cash paid to suppliers and employees (2 932 651) (2 760 003) (2 855 013) (2 665 689)
Cash generated from operations D.4 4 587 438 4 404 157 4 528 924 4 351 164
Interest income C.2 87 098 64 702 141 352 120 619
Tax paid D.5 (743 235) (429 223) (736 527) (428 044)
Net cash from operating activities 3 931 301 4 039 636 3 933 749 4 043 739
Cash flows from investing activities
Purchase of property and equipment (758 334) (863 322) (751 807) (851 270)
Sale of property and equipment 4 231 2 087 4 231 2 088
Purchase of investment property B.1 (49 094) (16 106) (49 094) (16 106)
Purchase of other intangible assets G.1 (18 564) (48 573) (18 564) (48 573)
Loans to group companies (advanced)/repaid (2 729) – 1 691 (7 256)
Decrease in short-term investments 557 670 131 429 557 670 131 429
Investments in associates E.3 – (181 054) – (181 054)
Net cash from investing activities (266 820) (975 539) (255 873) (970 742)
Cash flows from financing activities
Interest-bearing borrowings repaid (1 948 809) (1 889 951) (1 948 809) (1 889 951)
Financial instruments held for trading (140 356) (76 761) (140 356) (76 761)
Dividends paid (296 819) (97 528) (296 819) (97 528)
Interest paid (1 066 439) (1 239 469) (1 066 439) (1 239 469)
Net cash from financing activities (3 452 423) (3 303 709) (3 452 423) (3 303 709)
Total cash movements for the year 212 058 (239 612) 225 453 (230 712)
Cash at the beginning of the year 1 014 508 1 254 120 973 461 1 204 173
Total cash at the end of the year D.2 1 226 566 1 014 508 1 198 914 973 461

King Shaka International Airport
NOTES TO THE CONSOLIDATED ANNUAL FINANCIAL STATEMENTSFOR THE YEAR ENDED 31 MARCH 2015
CONSOLIDATED ANNUAL FINANCIAL
STATEMENTS 201517

AIRPORTS COMPANY SOUTH AFRICA18
1. BASIS OF PREPARATION AND ACCOUNTING POLICIES
1.1 BASIS OF PREPARATION
The consolidated annual financial statements have been prepared in accordance with International
Financial Reporting Standards (IFRS), the Companies Act, No. 71 of 2008, as amended, and the
requirements of the Public Finance Management Act No. 1 of 1999, as amended. The consolidated annual
financial statements have been prepared on the historical cost basis, except for investment property and
derivative financial instruments that are carried at fair value, and are presented in South African Rand.
1.2 ESTIMATES AND ASSUMPTIONS
In preparing the consolidated annual financial statements, management is required to make estimates
and assumptions that affect the amounts represented in the consolidated annual financial statements
and related disclosures. Use of available information and the application of judgement are inherent in
the formation of estimates. Actual results in the future could differ from these estimates which may be
material to the consolidated annual financial statements. The significant judgements have been disclosed
in the applicable notes. These include:
• Accounting for investment in associate – note E.3
• Fair value of financial instruments – note C.3
• Post-retirement medical aid obligation – note G.3
• Fair value of investment property – note B.1
• Useful lives and residual values of assets – note B.2
• Contingencies – note G.17
2. NEW STANDARDS AND INTERPRETATIONS
2.1 STANDARDS AND INTERPRETATIONS EFFECTIVE AND ADOPTED IN THE CURRENT YEAR
There were a number of new standards and interpretations effective and adopted in the current year;
none of these are considered to have a material impact on the Group.
2.2 STANDARDS AND INTERPRETATIONS NOT YET EFFECTIVE
There are a number of new standards and amendments which will only be effective after the 2015 year
end. None of these are expected to have a significant impact on the group, except for IFRS 15 ‘Revenue
from contracts with customers’, IFRS 14 ‘Regulatory deferral accounts’ and IFRS 9 ‘Financial instruments’.
NOTES TO THE CONSOLIDATED ANNUAL FINANCIAL STATEMENTSFor the year ended 31 March 2015
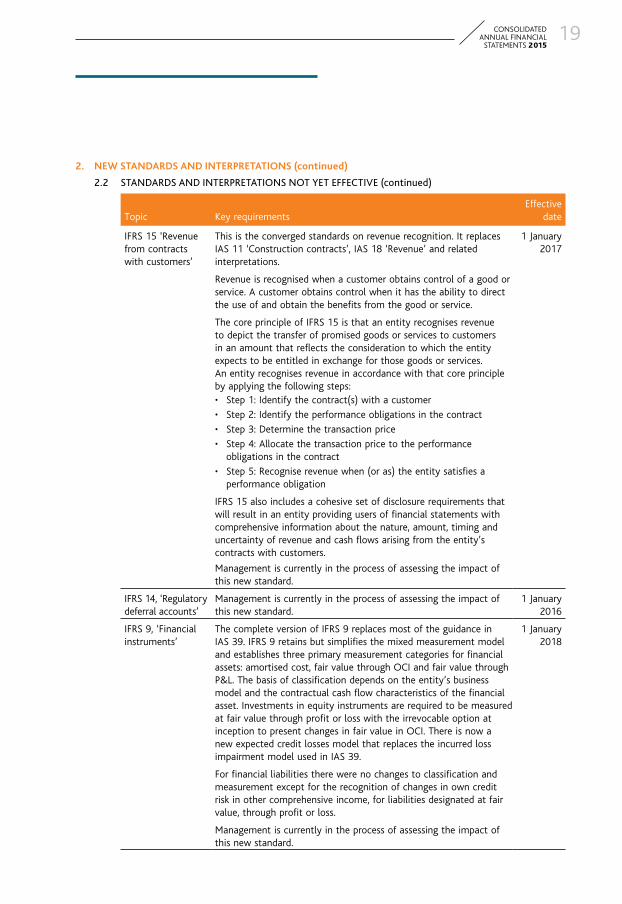
2. NEW STANDARDS AND INTERPRETATIONS (continued)
2.2 STANDARDS AND INTERPRETATIONS NOT YET EFFECTIVE (continued)
Topic Key requirementsEffective
date
IFRS 15 ‘Revenue from contracts with customers’
This is the converged standards on revenue recognition. It replaces IAS 11 ‘Construction contracts’, IAS 18 ‘Revenue’ and related interpretations.
1 January 2017
Revenue is recognised when a customer obtains control of a good or service. A customer obtains control when it has the ability to direct the use of and obtain the benefits from the good or service.
The core principle of IFRS 15 is that an entity recognises revenue to depict the transfer of promised goods or services to customers in an amount that reflects the consideration to which the entity expects to be entitled in exchange for those goods or services. An entity recognises revenue in accordance with that core principle by applying the following steps:• Step 1: Identify the contract(s) with a customer
• Step 2: Identify the performance obligations in the contract
• Step 3: Determine the transaction price
• Step 4: Allocate the transaction price to the performance obligations in the contract
• Step 5: Recognise revenue when (or as) the entity satisfies a performance obligation
IFRS 15 also includes a cohesive set of disclosure requirements that will result in an entity providing users of financial statements with comprehensive information about the nature, amount, timing and uncertainty of revenue and cash flows arising from the entity’s contracts with customers.
Management is currently in the process of assessing the impact of this new standard.
IFRS 14, ‘Regulatory deferral accounts’
Management is currently in the process of assessing the impact of this new standard.
1 January 2016
IFRS 9, ‘Financial instruments’
The complete version of IFRS 9 replaces most of the guidance in IAS 39. IFRS 9 retains but simplifies the mixed measurement model and establishes three primary measurement categories for financial assets: amortised cost, fair value through OCI and fair value through P&L. The basis of classification depends on the entity’s business model and the contractual cash flow characteristics of the financial asset. Investments in equity instruments are required to be measured at fair value through profit or loss with the irrevocable option at inception to present changes in fair value in OCI. There is now a new expected credit losses model that replaces the incurred loss impairment model used in IAS 39.
1 January 2018
For financial liabilities there were no changes to classification and measurement except for the recognition of changes in own credit risk in other comprehensive income, for liabilities designated at fair value, through profit or loss.
Management is currently in the process of assessing the impact of this new standard.
CONSOLIDATED ANNUAL FINANCIAL
STATEMENTS 201519
AIRPORTS COMPANY SOUTH AFRICA20
2. NEW STANDARDS AND INTERPRETATIONS (continued)
2.3 ACCOUNTING POLICIES
The most significant accounting policies have been moved next to the relevant notes in the consolidated
annual financial statements. The remainder of the accounting policies not relating to a specific note are
dealt with here. All accounting policies are consistent with the previous period.
2.4 FOREIGN CURRENCY2.4.1 Foreign operations
The assets and liabilities of foreign operations, including fair value adjustments arising on
acquisition, are translated to South African Rand at closing rate. The income and expenses of
foreign operations are translated at the dates of the transactions using an average rate.
Differences arising upon the translation of the foreign operation into South African Rand are
recognised directly in other comprehensive income and are recognised in the statement of changes
in equity as part of the foreign currency translation reserve account.
2.4.2 Foreign currency transactions and balances
Transactions in foreign currencies are translated to the respective functional currencies of the
Group entities at exchange rates at the dates of the transactions. Monetary assets and liabilities
are retranslated at year end at the closing rate (exchange rate at year end). Non-monetary assets
and liabilities are measured at historical cost are not retranslated at year end, while non-monetary
assets and liabilities measured at fair value are retranslated at the exchange rate at the date that
the fair value was determined. Foreign currency differences arising on translation are recognised
in profit and loss.
2.5 IMPAIRMENT OF NON-FINANCIAL ASSETS
The carrying amounts of property and equipment, and intangible assets are reviewed at each reporting
date to determine whether there is an indication of impairment. If any such indication exists, then the
asset’s recoverable amount is estimated.
The recoverable amount of an asset or cash-generating unit is the greater of its value in use and its fair
value less costs to sell. In assessing value in use, the estimated future cash flows are discounted to their
present value using a pre-tax discount rate that reflects current market assessments of the time value of
money and the risks specific to the asset. Assets are grouped together into the smallest groups of assets
that generate cash inflows from continuing use that are largely independent of the cash inflows of other
assets or groups of assets (the ‘cash-generating unit’).
An impairment loss is recognised if the carrying amount of an asset exceeds its recoverable amount.
NOTES TO THE CONSOLIDATED ANNUAL FINANCIAL STATEMENTS (CONTINUED)For the year ended 31 March 2015

3. SEGMENTAL INFORMATION
The Group’s reported operating segments are based on reports reviewed by the Executive Committee (EXCO)
to make strategic decisions. Five reportable segments were identified namely:
• O.R. Tambo International
• Cape Town International
• King Shaka International
• Regional Airports
• Corporate and Other
The Regional Airports segment comprises the smaller airports in South Africa which the group manages.
Information regarding the operations of each reportable segment is included below. EXCO assesses the
performance of the operating segments as a measure of earnings before interest, taxation, depreciation and
amortisation expense (EBITDA).
The group calculates EBITDA as follows:
Profit/(loss) before tax
Add Interest expense
Less Interest income
Add Depreciation, amortisation and any impairment
Less Income from equity accounted investments.
ITEMS NOT ALLOCATED TO SEGMENTS
Tax, derivative financial instruments and interest-bearing liabilities have not been allocated to operating
segments as these are managed centrally.
Similarly interest income and expenditure are not allocated to operating segments as they are driven largely by
the corporate division, which manages the cash requirements of the company. Corporate overhead expenses
are not allocated to the reportable segments.
CONSOLIDATED ANNUAL FINANCIAL
STATEMENTS 201521

AIRPORTS COMPANY SOUTH AFRICA22
3. SEGMENTAL INFORMATION (continued)
O.R. Tambo International Cape Town International King Shaka International Regional Airports Corporate and Other Elimination Total
Figures in
Rand thousand 2015 2014 2015 2014 2015 2014 2015 2014 2015 2014 2015 2014 2015 2014
Revenue
Aeronautical 3 237 638 3 025 212 978 880 882 667 423 121 394 413 286 260 257 009 – – – – 4 925 899 4 559 301
– landing fees 1 244 189 1 161 118 322 873 289 038 130 653 122 513 103 783 90 616 – – – – 1 801 498 1 663 285
– passenger service charges 1 954 179 1 826 612 637 140 576 293 281 466 262 154 179 400 163 375 – – – – 3 052 185 2 828 434
– aircraft parking 39 270 37 482 18 867 17 336 11 002 9 746 3 077 3 018 – – – – 72 216 67 582
Non-aeronautical 1 723 992 1 553 381 536 537 485 272 244 539 233 241 145 244 197 892 233 364 139 665 (48 366) (41 791) 2 835 310 2 567 660
– advertising 97 876 84 188 51 806 41 511 31 999 31 083 12 586 12 206 – – – – 194 267 168 988
– retail 820 301 728 011 141 598 131 242 40 550 40 633 8 168 9 083 – – – – 1 010 617 908 969
– parking 265 940 259 673 137 096 125 930 74 441 70 214 29 092 26 601 – – – – 506 569 482 418
– car hire 61 152 50 889 61 235 58 857 31 504 29 591 36 235 33 970 – – – – 190 126 173 307
– property rental 387 796 348 714 104 275 96 090 36 423 33 193 42 989 96 504 61 799 – (48 366) (41 791) 584 916 532 710
– recoveries 65 446 63 359 34 466 27 554 15 713 13 982 11 844 10 967 – – – – 127 469 115 862
– hotel operations – – – – – – – – 124 669 114 814 – – 124 669 114 814
– other 25 481 18 547 6 061 4 088 13 909 14 545 4 330 8 561 46 896 24 851 – – 96 677 70 592
Total revenue 4 961 630 4 578 593 1 515 417 1 367 939 667 660 627 654 431 504 454 901 233 364 139 665 (48 366) (41 791) 7 761 209 7 126 961
EBITDA 3 893 757 3 781 786 1 002 931 954 025 314 859 407 630 192 038 (532 970) (219 476) 36 558 – – 5 184 109 4 647 029
Reportable total assets 23 625 958 17 531 481 6 765 909 5 214 892 4 101 288 3 778 433 3 254 636 597 640 (9 579 092) 1 585 934 (722 397) (819 001) 27 446 302 27 889 379
Depreciation and amortisation 492 579 534 321 243 110 242 495 398 441 396 329 178 686 146 567 80 675 92 953 – – 1 393 491 1 412 665
Trade receivables (credit risk) 623 759 489 606 176 810 156 329 82 417 89 334 70 902 65 176 76 954 56 771 – – 1 030 842 857 216
Below is the reconciliation of the segmental information to that presented in the statement of financial position
and statement of comprehensive income.
Figures in Rand thousand 2015 2014
Reportable segment assets are reconciled to total assets as follows:
Segment assets for reportable segments 37 345 764 27 122 446
Corporate and other segment assets (9 899 462) 766 933
Total assets per statement of financial position 27 446 302 27 889 379
NOTES TO THE CONSOLIDATED ANNUAL FINANCIAL STATEMENTS (CONTINUED)For the year ended 31 March 2015

3. SEGMENTAL INFORMATION (continued)
O.R. Tambo International Cape Town International King Shaka International Regional Airports Corporate and Other Elimination Total
Figures in
Rand thousand 2015 2014 2015 2014 2015 2014 2015 2014 2015 2014 2015 2014 2015 2014
Revenue
Aeronautical 3 237 638 3 025 212 978 880 882 667 423 121 394 413 286 260 257 009 – – – – 4 925 899 4 559 301
– landing fees 1 244 189 1 161 118 322 873 289 038 130 653 122 513 103 783 90 616 – – – – 1 801 498 1 663 285
– passenger service charges 1 954 179 1 826 612 637 140 576 293 281 466 262 154 179 400 163 375 – – – – 3 052 185 2 828 434
– aircraft parking 39 270 37 482 18 867 17 336 11 002 9 746 3 077 3 018 – – – – 72 216 67 582
Non-aeronautical 1 723 992 1 553 381 536 537 485 272 244 539 233 241 145 244 197 892 233 364 139 665 (48 366) (41 791) 2 835 310 2 567 660
– advertising 97 876 84 188 51 806 41 511 31 999 31 083 12 586 12 206 – – – – 194 267 168 988
– retail 820 301 728 011 141 598 131 242 40 550 40 633 8 168 9 083 – – – – 1 010 617 908 969
– parking 265 940 259 673 137 096 125 930 74 441 70 214 29 092 26 601 – – – – 506 569 482 418
– car hire 61 152 50 889 61 235 58 857 31 504 29 591 36 235 33 970 – – – – 190 126 173 307
– property rental 387 796 348 714 104 275 96 090 36 423 33 193 42 989 96 504 61 799 – (48 366) (41 791) 584 916 532 710
– recoveries 65 446 63 359 34 466 27 554 15 713 13 982 11 844 10 967 – – – – 127 469 115 862
– hotel operations – – – – – – – – 124 669 114 814 – – 124 669 114 814
– other 25 481 18 547 6 061 4 088 13 909 14 545 4 330 8 561 46 896 24 851 – – 96 677 70 592
Total revenue 4 961 630 4 578 593 1 515 417 1 367 939 667 660 627 654 431 504 454 901 233 364 139 665 (48 366) (41 791) 7 761 209 7 126 961
EBITDA 3 893 757 3 781 786 1 002 931 954 025 314 859 407 630 192 038 (532 970) (219 476) 36 558 – – 5 184 109 4 647 029
Reportable total assets 23 625 958 17 531 481 6 765 909 5 214 892 4 101 288 3 778 433 3 254 636 597 640 (9 579 092) 1 585 934 (722 397) (819 001) 27 446 302 27 889 379
Depreciation and amortisation 492 579 534 321 243 110 242 495 398 441 396 329 178 686 146 567 80 675 92 953 – – 1 393 491 1 412 665
Trade receivables (credit risk) 623 759 489 606 176 810 156 329 82 417 89 334 70 902 65 176 76 954 56 771 – – 1 030 842 857 216
CONSOLIDATED ANNUAL FINANCIAL
STATEMENTS 201523

AIRPORTS COMPANY SOUTH AFRICA24
A. MANAGING EBITDA
A.1 REVENUEAccounting policy
The Group and Company earn revenue from aeronautical and non-aeronautical goods and services:
Aeronautical revenue
Aeronautical revenue is recognised when the services are provided to the customer.
Type of revenue Determination
Landing fees Using regulated tariffs for aircraft landings based on the maximum take-
off weight of landing aircrafts for each landing.
Passenger service charges Using regulated tariffs for each departing passenger at an airport of
departure.
Aircraft parking On regulated tariffs for each aircraft parked for over four hours, based
on the maximum take-off weight of aircraft parking per 24-hour period.
Non-aeronautical revenue
Non-aeronautical revenue is recognised when services are provided to the customer.
Type of revenue Determination Examples
Advertising Based on the higher of a minimum guaranteed rental or a percentage of turnover.
Rental of advertising space to concessionaires.
Retail Based on the higher of a minimum guaranteed rental or a percentage of turnover.
Rental of retail space to concessionaires.
Parking Based on time-based tariffs. Providing short- and long-term parking facilities.
Car hire Rental is based on the higher of a minimum guaranteed rental or a percentage of turnover.
Concession fees and the rental of space and kiosks to car hire companies.
Property rental Based on medium- and long-term rental agreements with tenants.
Rentals of office, air lounges, aviation fuel depots, warehousing, logistics facilities, hotels and filling stations.
Hotel operations Accommodation income is recognised at the date the guests are invoiced.
Invoice value of accommodation and sale of food and beverages.
Recoveries Recoveries include water, electricity and other utility charges recovered from tenants.
Water and electricity invoices.
NOTES TO THE CONSOLIDATED ANNUAL FINANCIAL STATEMENTS (CONTINUED)For the year ended 31 March 2015

A. MANAGING EBITDA (continued)
A.1 REVENUE (continued)
GROUP COMPANY
Figures in Rand thousand 2015 2014 2015 2014
Aeronautical
Landing fees 1 801 498 1 663 286 1 801 498 1 663 286
Passenger service charges 3 052 185 2 828 434 3 052 185 2 828 434
Aircraft parking 72 216 67 581 72 216 67 581
4 925 899 4 559 301 4 925 899 4 559 301
Non-aeronautical
Advertising 194 267 168 988 194 267 168 988
Retail 1 010 619 908 970 1 010 619 908 970
Parking 506 569 482 418 506 569 482 418
Car hire 190 126 173 306 190 126 173 306
Property rental 584 914 532 710 571 483 511 779
Hotel operations 124 669 114 814 – –
Recoveries1 127 469 115 863 127 469 115 863
Other2 96 677 70 591 85 272 60 879
2 835 310 2 567 660 2 685 805 2 422 203
7 761 209 7 126 961 7 611 704 6 981 504
1 Recoveries include water, electricity and other utility charges recovered from tenants.
2 Other includes permits and airports management services.
At the balance sheet date, the Group has contracted with tenants for the following future minimum cash
lease payments in respect of advertising, retail and property leases:
GROUP COMPANY
Figures in Rand thousand 2015 2014 2015 2014
Contractual future cash lease payments (unrecognised) 5 526 745 3 937 668 5 526 745 3 937 668
Within one year 1 270 705 1 449 599 1 270 705 1 449 599
Two to five years 3 608 907 1 985 179 3 608 907 1 985 179
After five years 647 133 502 890 647 133 502 890
A.2 OTHER INCOME
GROUP COMPANY
Figures in Rand thousand 2015 2014 2015 2014
Profit on disposal of assets 5 277 1 311 5 277 1 311
Fair value gains on investment property 360 722 248 007 391 318 276 337
Other (573) 8 538 9 313 8 402
365 426 257 856 405 908 286 050
CONSOLIDATED ANNUAL FINANCIAL
STATEMENTS 201525

AIRPORTS COMPANY SOUTH AFRICA26
A. MANAGING EBITDA (continued)
A.3 EMPLOYEE COSTS
GROUP COMPANY
Figures in Rand thousand 2015 2014 2015 2014
Basic 822 968 733 360 798 479 707 824
Performance bonus 112 870 120 000 112 870 120 000
Medical aid – company contributions 54 651 48 896 54 651 48 896
Pension benefits 75 677 90 548 75 677 90 548
1 066 166 992 804 1 041 677 967 268
A.4 OTHER OPERATING EXPENSES
GROUP COMPANY
Figures in Rand thousand 2015 2014 2015 2014
Repairs and maintenance 300 073 269 752 295 522 264 777
Security 220 816 199 941 218 561 199 024
Electricity and water 272 302 262 337 263 213 253 501
Auditors remuneration 6 864 7 273 5 924 6 959
Operating lease expense* 28 733 26 958 28 308 26 958
Impairment of trade and other receivables 31 634 8 500 31 010 7 659
Information systems expenses 123 589 106 910 121 805 106 910
Rates and taxes 247 626 217 938 237 820 209 415
Cleaning 111 483 98 188 110 664 97 979
Marketing 68 957 70 116 67 642 66 300
Managerial technical and other fees 110 917 120 111 110 090 112 540
Travel – local 32 464 29 780 31 399 29 780
Travel – oversees 10 857 9 895 10 771 9 554
Insurance 43 958 39 637 43 771 39 637
Administration 87 374 75 062 68 440 68 694
Training 34 268 32 218 34 163 32 218
Consumables 35 765 53 284 25 252 36 996
Socio-economic and enterprise development 52 803 56 394 52 803 56 394
Telephone and fax 17 783 14 749 17 698 14 397
Recruitment expenses 11 314 13 872 11 314 13 872
Legal expenses 24 848 14 968 24 852 14 968
Other expenses 1 932 17 101 2 782 7 503
1 876 360 1 744 984 1 813 804 1 676 035
* At the reporting date, the Group has outstanding commitments under non-cancellable operating leases for future minimum lease payments:
GROUP AND COMPANY
Figures in Rand thousand 2015 2014
Contractual future cash lease payments (unrecognised) 78 897 38 218
Within one year 20 098 10 189
One to two years 21 422 –
Two to five years 37 377 28 029
After five years – –
NOTES TO THE CONSOLIDATED ANNUAL FINANCIAL STATEMENTS (CONTINUED)For the year ended 31 March 2015

B. ASSETS
B.1 INVESTMENT PROPERTY
Accounting policy
Investment property comprises a number of commercial properties that are leased to third parties.
Investment property is carried at fair value, determined annually using discounted cash flow projections.
Changes in fair values are recorded as other income.
Significant judgement, estimate and source of estimation uncertainty
The discounted cash flow analysis valuation technique, uses transactions observable in the market at the
reporting date. The Group and Company use their judgement to select a variety of methods and makes
assumptions relating to market yields, escalation rates and key valuation inputs that are mainly based on
market conditions existing at each reporting date.
Reconciliation of Investment property
GROUP
Figures in Rand thousand 2015 2014 2013
Balance at 1 April 2014 3 275 949 2 991 127 2 696 172
Improvements/Additions 49 094 16 106 7 763
Change in fair value
– Recognised in statement of comprehensive income (note A.2) 360 722 248 006 219 889
– Recognised in other comprehensive income* – 20 710 67 303
Reclassification from property and equipment 7 715 –
Balance at 31 March 2015 3 693 480 3 275 949 2 991 127
Reconciliation of Investment property
COMPANY
Figures in Rand thousand 2015 2014 2013
Balance at 1 April 2014 2 923 205 2 610 053 1 959 582
Prior period error (note G.15) 320 685
Improvements/Additions 49 094 16 106 7 763
Change in fair value
– Recognised in statement of comprehensive income (note A.2) 391 318 276 336 254 720
– Recognised in other comprehensive income* – 20 710 67 303
Reclassification from property and equipment 7 715 – –
Balance at 31 March 2015 3 371 332 2 923 205 2 610 053
* Fair value changes recognised in other comprehensive income relate to properties that were previously classified as owner-occupied.
CONSOLIDATED ANNUAL FINANCIAL
STATEMENTS 201527
AIRPORTS COMPANY SOUTH AFRICA28
B. ASSETS (continued)
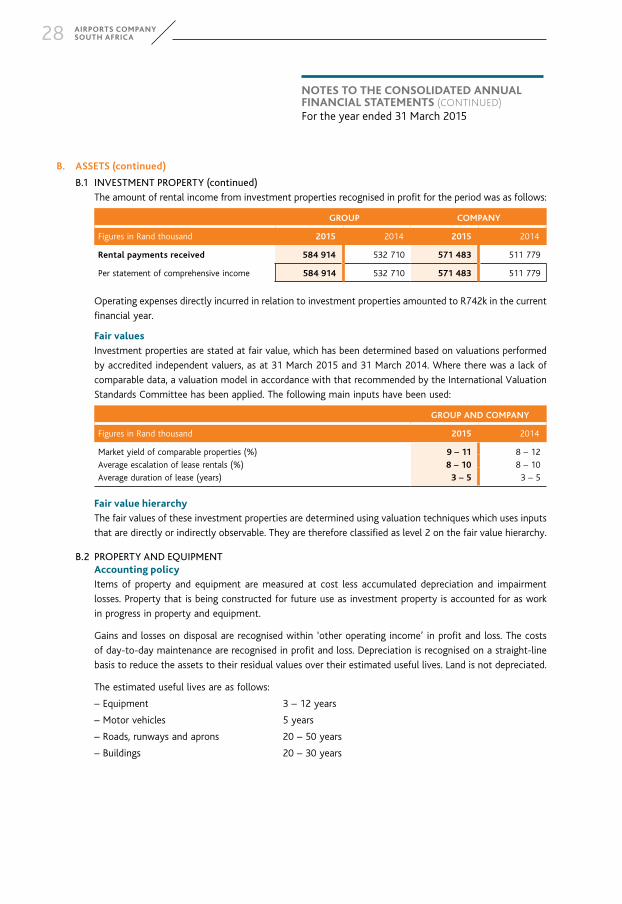
B.1 INVESTMENT PROPERTY (continued)
The amount of rental income from investment properties recognised in profit for the period was as follows:
GROUP COMPANY
Figures in Rand thousand 2015 2014 2015 2014
Rental payments received 584 914 532 710 571 483 511 779
Per statement of comprehensive income 584 914 532 710 571 483 511 779
Operating expenses directly incurred in relation to investment properties amounted to R742k in the current
financial year.
Fair values
Investment properties are stated at fair value, which has been determined based on valuations performed
by accredited independent valuers, as at 31 March 2015 and 31 March 2014. Where there was a lack of
comparable data, a valuation model in accordance with that recommended by the International Valuation
Standards Committee has been applied. The following main inputs have been used:
GROUP AND COMPANY
Figures in Rand thousand 2015 2014
Market yield of comparable properties (%) 9 – 11 8 – 12
Average escalation of lease rentals (%) 8 – 10 8 – 10
Average duration of lease (years) 3 – 5 3 – 5
Fair value hierarchy
The fair values of these investment properties are determined using valuation techniques which uses inputs
that are directly or indirectly observable. They are therefore classified as level 2 on the fair value hierarchy.
B.2 PROPERTY AND EQUIPMENTAccounting policy
Items of property and equipment are measured at cost less accumulated depreciation and impairment
losses. Property that is being constructed for future use as investment property is accounted for as work
in progress in property and equipment.
Gains and losses on disposal are recognised within ‘other operating income’ in profit and loss. The costs
of day-to-day maintenance are recognised in profit and loss. Depreciation is recognised on a straight-line
basis to reduce the assets to their residual values over their estimated useful lives. Land is not depreciated.
The estimated useful lives are as follows:
– Equipment 3 – 12 years
– Motor vehicles 5 years
– Roads, runways and aprons 20 – 50 years
– Buildings 20 – 30 years
NOTES TO THE CONSOLIDATED ANNUAL FINANCIAL STATEMENTS (CONTINUED)For the year ended 31 March 2015

Impairment
The carrying amounts of property and equipment, and intangible assets are reviewed at each reporting date
to determine whether there is an indication of impairment. If any such indication exists, then the asset’s
recoverable amount is estimated.
The recoverable amount of an asset or cash-generating unit is the greater unit of its value in use and its
fair value less costs to sell. In assessing value in use, the estimate cash flows are discounted to their present
value using a pre-tax discount rate that reflects current market assessments of the time value of money and
the risks specific to the asset. Assets are grouped together into the smallest groups of assets that generate
cash inflows from continuing use that are largely independent of the cash inflows of other assets or groups
of assets (the ‘cash-generating unit’).
An impairment loss is recognised if the carrying amount of the asset exceeds its recoverable amount.
Impairment losses are recognised in profit and loss. Impairment losses recognised in respect of cash-
generating units are allocated to reduce the carrying amount of the assets in the unit (group of units) on
a pro rata basis.
CONSOLIDATED ANNUAL FINANCIAL
STATEMENTS 201529

AIRPORTS COMPANY SOUTH AFRICA30
B. ASSETS (continued)
B.2 PROPERTY AND EQUIPMENT (continued)
GROUP
2015 2014 2013
Figures in Rand thousand CostAccumulated depreciation
Carrying value Cost
Accumulated depreciation
Carrying value Cost
Accumulated depreciation
Carrying value
Land 742 777 – 742 777 742 777 – 742 777 742 777 – 742 777
Buildings 13 371 778 (3 823 690) 9 548 088 13 237 428 (3 259 519) 9 977 909 13 103 200 (2 697 553) 10 405 647
Equipment 4 380 752 (3 368 576) 1 012 176 4 196 118 (2 995 823) 1 200 295 3 793 557 (2 598 527) 1 195 030
Motor vehicles 346 367 (178 361) 168 006 259 527 (165 753) 93 774 253 956 (145 383) 108 573
Roads, runways and aprons 8 649 357 (2 182 630) 6 466 727 8 355 589 (1 843 470) 6 512 119 7 836 461 (1 522 939) 6 313 522
Work in progress 1 204 724 – 1 204 724 1 184 629 – 1 184 629 1 407 643 – 1 407 643
Total 28 695 755 (9 553 257) 19 142 498 27 976 068 (8 264 565) 19 711 503 27 137 594 (6 964 402) 20 173 192
COMPANY
2015 2014 2013
Figures in Rand thousand CostAccumulated depreciation
Carrying value Cost
Accumulated depreciation
Carrying value Cost
Accumulated depreciation
Carrying value
Land 742 777 – 742 777 742 777 – 742 777 742 777 – 742 777
Buildings 13 363 498 (3 819 225) 9 544 273 13 229 148 (3 255 328) 9 973 820 13 093 123 (2 692 533) 10 400 590
Equipment 4 347 527 (3 368 565) 978 962 4 164 777 (2 995 812) 1 168 965 3 759 112 (2 586 675) 1 172 437
Motor vehicles 346 367 (178 361) 168 006 259 527 (165 753) 93 774 253 956 (145 383) 108 573
Roads, runways and aprons 8 649 357 (2 182 630) 6 466 727 8 355 589 (1 843 470) 6 512 119 7 836 461 (1 522 939) 6 313 522
Work in progress 1 204 573 – 1 204 573 1 184 478 – 1 184 478 1 407 492 – 1 407 492
Total 28 654 099 (9 548 781) 19 105 318 27 936 296 (8 260 363) 19 675 933 27 092 921 (6 947 530) 20 145 391
NOTES TO THE CONSOLIDATED ANNUAL FINANCIAL STATEMENTS (CONTINUED)For the year ended 31 March 2015

B. ASSETS (continued)
B.2 PROPERTY AND EQUIPMENT (continued)
GROUP
2015 2014 2013
Figures in Rand thousand CostAccumulated depreciation
Carrying value Cost
Accumulated depreciation
Carrying value Cost
Accumulated depreciation
Carrying value
Land 742 777 – 742 777 742 777 – 742 777 742 777 – 742 777
Buildings 13 371 778 (3 823 690) 9 548 088 13 237 428 (3 259 519) 9 977 909 13 103 200 (2 697 553) 10 405 647
Equipment 4 380 752 (3 368 576) 1 012 176 4 196 118 (2 995 823) 1 200 295 3 793 557 (2 598 527) 1 195 030
Motor vehicles 346 367 (178 361) 168 006 259 527 (165 753) 93 774 253 956 (145 383) 108 573
Roads, runways and aprons 8 649 357 (2 182 630) 6 466 727 8 355 589 (1 843 470) 6 512 119 7 836 461 (1 522 939) 6 313 522
Work in progress 1 204 724 – 1 204 724 1 184 629 – 1 184 629 1 407 643 – 1 407 643
Total 28 695 755 (9 553 257) 19 142 498 27 976 068 (8 264 565) 19 711 503 27 137 594 (6 964 402) 20 173 192
COMPANY
2015 2014 2013
Figures in Rand thousand CostAccumulated depreciation
Carrying value Cost
Accumulated depreciation
Carrying value Cost
Accumulated depreciation
Carrying value
Land 742 777 – 742 777 742 777 – 742 777 742 777 – 742 777
Buildings 13 363 498 (3 819 225) 9 544 273 13 229 148 (3 255 328) 9 973 820 13 093 123 (2 692 533) 10 400 590
Equipment 4 347 527 (3 368 565) 978 962 4 164 777 (2 995 812) 1 168 965 3 759 112 (2 586 675) 1 172 437
Motor vehicles 346 367 (178 361) 168 006 259 527 (165 753) 93 774 253 956 (145 383) 108 573
Roads, runways and aprons 8 649 357 (2 182 630) 6 466 727 8 355 589 (1 843 470) 6 512 119 7 836 461 (1 522 939) 6 313 522
Work in progress 1 204 573 – 1 204 573 1 184 478 – 1 184 478 1 407 492 – 1 407 492
Total 28 654 099 (9 548 781) 19 105 318 27 936 296 (8 260 363) 19 675 933 27 092 921 (6 947 530) 20 145 391
CONSOLIDATED ANNUAL FINANCIAL
STATEMENTS 201531

AIRPORTS COMPANY SOUTH AFRICA32
B. ASSETS (continued)
B.2 PROPERTY AND EQUIPMENT (continued)
GROUP
Figures in Rand thousand Land Buildings Equipment Motor vehicles
Roads, runways
and aprons Work in progress Total
Opening balance at 1 April 2012 727 963 10 930 728 1 543 035 108 526 6 426 455 888 050 20 624 757
Additions – 26 467 159 446 21 810 – 737 203 944 926
Disposals (12) – (39) – – – (51)
Transfers 14 826 11 002 22 987 – 168 795 (217 610) –
Depreciation – (562 550) (530 399) (21 763) (281 728) – (1 396 440)
Opening balance at 1 April 2013 742 777 10 405 647 1 195 030 108 573 6 313 522 1 407 643 20 173 192
Additions – 2 040 117 846 6 578 74 081 662 777 863 322
Disposals – (27) – (710) (39) – (776)
Transfers – 133 557 304 756 3 202 444 276 (885 791) –
Depreciation – (563 308) (417 337) (23 869) (319 721) – (1 324 235)
Closing balance at 31 March 2014 742 777 9 977 909 1 200 295 93 774 6 512 119 1 184 629 19 711 503
Additions – 42 614 76 661 60 052 57 437 522 161 758 925
Disposals – (2) (187) (50) – – (239)
Reclassification to investment property – (2 978) – – (4 737) – (7 715)
Transfers – 95 739 119 564 44 984 241 779 (502 066) –
Depreciation – (565 194) (384 157) (30 754) (339 871) – (1 319 976)
Closing balance at 31 March 2015 742 777 9 548 088 1 012 176 168 006 6 466 727 1 204 724 19 142 498
COMPANY
Figures in Rand thousand Land Buildings Equipment Motor vehicles
Roads, runways
and aprons Work in progress Total
Opening balance at 1 April 2012 727 963 10 929 872 1 522 202 108 526 6 426 455 887 898 20 602 916
Additions – 26 465 154 133 21 787 – 737 204 939 589
Disposals (12) – – – – – (12)
Transfers 14 826 11 002 22 987 – 168 795 (217 610) –
Reclassification to investment property – (4 372) – – – – (4 372)
Depreciation – (562 377) (526 885) (21 740) (281 728) – (1 392 730)
Opening balance at 1 April 2013 742 777 10 400 590 1 172 437 108 573 6 313 522 1 407 492 20 145 391
Additions – 2 040 105 289 6 578 74 081 663 291 851 279
Disposals – (27) – (710) (39) – (776)
Transfers – 134 071 304 756 3 202 444 276 (886 305) –
Depreciation – (562 854) (413 517) (23 869) (319 721) – (1 319 961)
Closing balance at 31 March 2014 742 777 9 973 820 1 168 965 93 774 6 512 119 1 184 478 19 675 933
Additions – 42 614 70 134 60 052 57 437 522 161 752 398
Disposals – (2) (8) (50) – – (60)
Reclassification to investment property – (2 978) – – (4 737) (7 715)
Transfers – 95 739 119 564 44 984 241 779 (502 066) –
Depreciation – (564 920) (379 693) (30 754) (339 871) – (1 315 238)
Closing balance at 31 March 2015 742 777 9 544 273 978 962 168 006 6 466 727 1 204 573 19 105 318
NOTES TO THE CONSOLIDATED ANNUAL FINANCIAL STATEMENTS (CONTINUED)For the year ended 31 March 2015

B. ASSETS (continued)
B.2 PROPERTY AND EQUIPMENT (continued)
GROUP
Figures in Rand thousand Land Buildings Equipment Motor vehicles
Roads, runways
and aprons Work in progress Total
Opening balance at 1 April 2012 727 963 10 930 728 1 543 035 108 526 6 426 455 888 050 20 624 757
Additions – 26 467 159 446 21 810 – 737 203 944 926
Disposals (12) – (39) – – – (51)
Transfers 14 826 11 002 22 987 – 168 795 (217 610) –
Depreciation – (562 550) (530 399) (21 763) (281 728) – (1 396 440)
Opening balance at 1 April 2013 742 777 10 405 647 1 195 030 108 573 6 313 522 1 407 643 20 173 192
Additions – 2 040 117 846 6 578 74 081 662 777 863 322
Disposals – (27) – (710) (39) – (776)
Transfers – 133 557 304 756 3 202 444 276 (885 791) –
Depreciation – (563 308) (417 337) (23 869) (319 721) – (1 324 235)
Closing balance at 31 March 2014 742 777 9 977 909 1 200 295 93 774 6 512 119 1 184 629 19 711 503
Additions – 42 614 76 661 60 052 57 437 522 161 758 925
Disposals – (2) (187) (50) – – (239)
Reclassification to investment property – (2 978) – – (4 737) – (7 715)
Transfers – 95 739 119 564 44 984 241 779 (502 066) –
Depreciation – (565 194) (384 157) (30 754) (339 871) – (1 319 976)
Closing balance at 31 March 2015 742 777 9 548 088 1 012 176 168 006 6 466 727 1 204 724 19 142 498
COMPANY
Figures in Rand thousand Land Buildings Equipment Motor vehicles
Roads, runways
and aprons Work in progress Total
Opening balance at 1 April 2012 727 963 10 929 872 1 522 202 108 526 6 426 455 887 898 20 602 916
Additions – 26 465 154 133 21 787 – 737 204 939 589
Disposals (12) – – – – – (12)
Transfers 14 826 11 002 22 987 – 168 795 (217 610) –
Reclassification to investment property – (4 372) – – – – (4 372)
Depreciation – (562 377) (526 885) (21 740) (281 728) – (1 392 730)
Opening balance at 1 April 2013 742 777 10 400 590 1 172 437 108 573 6 313 522 1 407 492 20 145 391
Additions – 2 040 105 289 6 578 74 081 663 291 851 279
Disposals – (27) – (710) (39) – (776)
Transfers – 134 071 304 756 3 202 444 276 (886 305) –
Depreciation – (562 854) (413 517) (23 869) (319 721) – (1 319 961)
Closing balance at 31 March 2014 742 777 9 973 820 1 168 965 93 774 6 512 119 1 184 478 19 675 933
Additions – 42 614 70 134 60 052 57 437 522 161 752 398
Disposals – (2) (8) (50) – – (60)
Reclassification to investment property – (2 978) – – (4 737) (7 715)
Transfers – 95 739 119 564 44 984 241 779 (502 066) –
Depreciation – (564 920) (379 693) (30 754) (339 871) – (1 315 238)
Closing balance at 31 March 2015 742 777 9 544 273 978 962 168 006 6 466 727 1 204 573 19 105 318
CONSOLIDATED ANNUAL FINANCIAL
STATEMENTS 201533

AIRPORTS COMPANY SOUTH AFRICA34
C. DEBT AND CASH MANAGEMENT
C.1 INTEREST-BEARING BORROWINGS
GROUP
2015 2014
Figures in Rand thousand Carrying value Fair value Carrying value Fair value
Unsecured
Long-term bonds 7 549 286 8 785 677 8 239 364 8 867 641
Nedbank Bullet Loan 750 000 818 535 1 751 643 1 921 170
Infrastructure finance 166 422 183 485 185 526 202 386
Southern Sun Hotel Interests (Pty) Ltd 1 500 1 500 1 500 1 500
L’Agence Francaise de Developpement (AFD) 764 829 840 491 850 069 928 018
L’Agence Francaise de Developpement (AFD1) 1 944 513 2 206 133 1 943 808 2 172 109
11 176 550 12 835 821 12 971 910 14 092 824
COMPANY
2015 2014
Figures in Rand thousand Carrying value Fair value Carrying value Fair value
Unsecured
Long-term bonds 7 549 286 8 785 677 8 239 364 8 867 641
Nedbank Bullet Loan 750 000 818 535 1 751 643 1 921 170
Infrastructure finance 166 422 183 485 185 526 202 386
L’Agence Francaise de Developpement (AFD) 764 829 840 491 850 069 928 018
L’Agence Francaise de Developpement (AFD1) 1 944 513 2 206 133 1 943 808 2 172 109
11 175 050 12 834 321 12 970 410 14 091 324
NOTES TO THE CONSOLIDATED ANNUAL FINANCIAL STATEMENTS (CONTINUED)For the year ended 31 March 2015

C. DEBT AND CASH MANAGEMENT (continued)
C.1 INTEREST-BEARING BORROWINGS (continued)
Term and debt repayment schedule
GROUP
2015 2014
Interest rate Maturity dateCarrying value
R’000Carrying value
R’000
Long-term bonds Nominal amount
AIR03U R500 million JIBAR-linked Oct 2014 – 506 569
AIR03 R606 million 10.88% Mar 2016 635 990 1 734 607
AIR01 R2 billion 8.85% Mar 2019 2 002 649 2 002 093
AIR02 R1.712 billion 11.30% Apr 2023 1 829 041 1 831 075
AIRL01 R1.191 billion Inflation-linked Apr 2028 1 755 992 1 640 184
AIR04U R500 million 11.59% Oct 2029 524 836 524 836
AIR04 R544 million 9.25% May 2024 560 959 –
AIR05 R232 million 10.00% May 2030 239 819 –
7 549 286 8 239 364
Long-term loans
Southern Sun Hotel Interests (Pty) Ltd 2% N/A 1 500 1 500
Nedbank Bullet Loan JIBAR-linked Sep 2020 750 000 1 751 643
L’Agence Francaise de Developpement (AFD) 10.35% Nov 2023 764 829 850 069
L’Agence Francaise de Developpement (AFD1) 10.55% Jan 2026 1 944 513 1 943 808
Infrastructure Finance Corporation Limited (INCA) JIBAR-linked Nov 2023 166 422 185 526
3 627 264 4 732 546
11 176 550 12 971 910
The table below analyses the Group’s interest-bearing borrowings in terms of their maturities. The amounts
disclosed below are the contractual undiscounted cash outflows:
Figures in Rand thousand
Carrying amount
Contractual cash flows
6 months or less
Between 6 – 12
monthsBetween
1 – 2 yearsBetween
2 – 5 yearsMore than
5 years
2015 11 176 550 13 064 417 552 200 586 003 1 289 149 3 619 625 7 017 440
2014 12 971 910 19 155 510 1 143 320 703 188 1 533 049 3 702 856 12 073 097
The cash to meet these maturities will be obtained from operating activities and reserves.
CONSOLIDATED ANNUAL FINANCIAL
STATEMENTS 201535

AIRPORTS COMPANY SOUTH AFRICA36
C. DEBT AND CASH MANAGEMENT (continued)
C.1 INTEREST-BEARING BORROWINGS (continued)
COMPANY
The company information is similar to that of the group except for the loan from Southern Sun Hotel
Interests (Pty) Ltd.
COMPANY
Figures in Rand thousand 2015 2014
Total borrowings of Group 11 176 550 12 971 910
Southern Sun Hotel Interests (Pty) Ltd (1 500) (1 500)
Total borrowings of Company 11 175 050 12 970 410
C.2 NET FINANCE INCOME AND EXPENSE
Accounting policy
Finance income comprises of interest income on funds invested and is recognised using the effective
interest method in profit and loss.
Finance expenses comprise of interest expense on borrowings and are recognised using the effective interest
method in profit and loss.
Borrowing costs that are directly attributable to the acquisition, construction or production of qualifying
assets, are capitalised to the cost of those assets, until such time as the assets are substantially ready for
their intended use. Investment income earned on the temporary investment of specific borrowings, pending
their expenditure on qualifying assets, is deducted from the borrowing costs eligible for capitalisation.
All other borrowing costs are recognised as an expense in the period in which they are incurred.
GROUP COMPANY
Figures in Rand thousand 2015 2014 2015 2014
Interest received 87 098 64 702 141 352 120 619
Finance income 87 098 64 702 141 352 120 619
Finance costs (1 313 554) (1 380 960) (1 313 554) (1 380 960)
(Losses)/Gains on remeasurement and disposal of trading financial instruments* (126 043) 156 454 (126 043) 156 454
Total finance expense (1 439 597) (1 224 506) (1 439 597) (1 224 506)
Net finance expense (1 352 499) (1 159 804) (1 298 245) (1 103 887)
* Interest rate swaps
NOTES TO THE CONSOLIDATED ANNUAL FINANCIAL STATEMENTS (CONTINUED)For the year ended 31 March 2015

C. DEBT AND CASH MANAGEMENT (continued)
C.3 DERIVATIVE FINANCIAL INSTRUMENTS AND HEDGING INFORMATION
Accounting policy
The Group and Company hold interest rate swaps to hedge its interest rate risk arising from its borrowings.
These instruments are recognised initially at fair value (transaction costs are recognised in profit and loss).
Subsequent to initial recognition, the method of recognising the resulting gain or loss depends on whether
the derivative is designated as a hedging instrument, and if so, the nature of the item being hedged.
The Group and Company documents at the inception of the transaction the relationship between hedging
instruments and hedged items, as well as its risk management objectives and strategy for undertaking
various hedging transactions. The Group and Company also documents its assessment, both at hedge
inception and on an ongoing basis, of whether the derivatives that are used in hedging transactions are
highly effective in offsetting changes in cash flows of hedged items.
The effective portion of changes in the fair value of derivatives is recognised in other comprehensive
income. The gain or loss relating to the ineffective portion is recognised immediately within ‘Gains/losses
on remeasurement and disposal of financial instruments’.
Amounts accumulated in equity are reclassified to profit or loss in the periods when the hedged item
affects profit or loss.
The following information relates to derivative financial instruments included in the consolidated annual
financial statements:
GROUP AND COMPANY
2015 2014
Figures in Rand thousand Assets Liabilities Assets Liabilities
Interest rate swaps – cash flow hedges – 75 023 – 99 682
Forward foreign exchange contracts – held for trading 701 – – –
701 75 023 – 99 682
Current 701 24 304 – 51 601
Non-current – 50 719 – 48 081
701 75 023 – 99 682
Interest rate swaps – cash flow hedge
The Group entered into interest rate swap contracts relating to the Nedbank Bullet Loan and the INCA
loan in order to fix the interest rate on these loans.
Under the interest rate swap contracts, the Group and Company agree with other parties to exchange, at
specified quarterly and semi-annual intervals, the difference between fixed rates and floating rate interest
amounts that are calculated by reference to the agreed notional principal amounts.
The ineffective portion recognised in profit or loss that arises from cash flow hedges amounts to a gain of
R59.5 million (2014: R15.3 million) for both the Group and Company.
CONSOLIDATED ANNUAL FINANCIAL
STATEMENTS 201537

AIRPORTS COMPANY SOUTH AFRICA38
C. DEBT AND CASH MANAGEMENT (continued)
C.3 DERIVATIVE FINANCIAL INSTRUMENTS AND HEDGING INFORMATION (continued)
The notional principal amounts of the outstanding derivative contracts were as follows (figures in Rand
thousand):
Interest rate swaps Receive PayNotional amount Fair value
2015 2014 2015 2014
30 September 2020 3 month JIBAR
+ 1.92% 10.980% 750 000 1 750 000 (63 050) (90 477)
30 November 2023 3 month JIBAR
+ 1.90% 10.980% 250 000 250 000 (11 973) (9 059)
(75 023) (99 536)
The table below analyses the Group and Company’s derivative financial instruments in terms of their
maturities. The amounts disclosed are the contractual undiscounted cash flows:
Figures in Rand thousand
Carrying amount
Contractual cash flows
6 months or less
Between 6 – 12
monthsBetween
1 – 2 yearsBetween
2 – 5 yearsMore than
5 years
2015 75 023 75 023 13 450 10 853 16 633 30 561 3 526
2014 99 682 99 536 30 056 21 390 26 255 13 258 8 569
D. MANAGING WORKING CAPITAL
D.1 TRADE AND OTHER RECEIVABLES
GROUP COMPANY
Figures in Rand thousand 2015 2014 2015 2014
Trade receivables 971 304 807 369 961 149 799 617
Impairment of trade receivables (87 547) (56 795) (87 547) (56 795)
Loan to joint venture/associate 59 538 49 847 59 538 49 847
Loans and receivables 943 295 800 421 933 140 792 669
Taxation receivable 140 – – –
Prepayment 15 544 1 789 15 182 1 789
Insurance rent-a-captive receivable* 97 624 87 394 97 624 87 394
Lease receivables 112 182 43 597 112 167 43 577
Other receivables 14 527 9 564 14 000 9 605
1 183 312 942 765 1 172 113 935 034
* The contingency policies are underwritten by Guardrisk and Centriq. The amount receivable represents the balance of the special experience account. The special experience account is payable on demand. Refer to note D.6 ‘Investments’ for more details on the Group’s investment in the cell captive fund.
The average credit period is 38 days (2014: 33 days). Trade receivables are carried at cost which normally
approximates their fair value due to short-term maturity thereof. No interest is charged on trade receivables.
An adjustment for impairment of receivables has been made for estimated irrecoverable amounts.
Loans to joint ventures and associates bear no interest and have no fixed repayment terms.
NOTES TO THE CONSOLIDATED ANNUAL FINANCIAL STATEMENTS (CONTINUED)For the year ended 31 March 2015

D. MANAGING WORKING CAPITAL (continued)
D.1 TRADE AND OTHER RECEIVABLES (continued)
The maximum exposure to credit risk for trade receivables at the reporting date before the impairment
provision, guarantees and deposits held by type of customer was:
GROUP COMPANY
Figures in Rand thousand 2015 2014 2015 2014
Aeronautical 744 347 604 608 744 347 604 608
Commercial 192 493 155 116 192 493 155 116
Other 94 002 97 492 83 847 89 740
1 030 842 857 216 1 020 687 849 464
2015
GROUP COMPANY
Figures in Rand thousandTrade and other
receivablesAllowance for
impairmentTrade and other
receivablesAllowance for
impairment
Not past due 713 445 – 702 374 –
Past due 0 – 30 days 194 318 – 194 318 –
Past due 31 – 60 days 7 548 – 7 548 –
Past due 61 – 90 days 115 531 (87 547) 116 447 (87 547)
Total trade and other receivables 1 030 842 (87 547) 1 020 687 (87 547)
2014
GROUP COMPANY
Figures in Rand thousandTrade and other
receivablesAllowance for
impairmentTrade and other
receivablesAllowance for
impairment
Not past due 604 714 – 596 962 –
Past due 0 – 30 days 113 463 – 113 463 –
Past due 31 – 60 days 30 075 – 30 075 –
Past due 61 – 90 days 108 964 (56 795) 108 964 (56 795)
Total trade and other receivables 857 216 (56 795) 849 464 (56 795)
Impairment
The movement in the allowance for impairment in respect of trade receivables during the year was
as follows:
GROUP COMPANY
Figures in Rand thousand 2015 2014 2015 2014
Balance at 1 April 2014 56 795 215 769 56 795 215 702
Increase/(Decrease) in allowance 30 752 7 309 30 752 7 376
Bad debts written-off – (166 283) – (166 283)
Balance at 31 March 2015 87 547 56 795 87 547 56 795
CONSOLIDATED ANNUAL FINANCIAL
STATEMENTS 201539

AIRPORTS COMPANY SOUTH AFRICA40
D. MANAGING WORKING CAPITAL (continued)
D.1 TRADE AND OTHER RECEIVABLES (continued)
Credit quality of financial instruments
The credit quality of financial assets that are neither past due nor impaired can be assessed by reference to
historical information about the customer. Before accepting any new customer, the Group and Company
use an external credit scoring system to assess the potential customer’s credit quality and defines credit
limits by customer. Limits and scoring attributed to customers are reviewed periodically. 60% of the
trade receivables that are neither past due nor impaired were recovered within one month after the
reporting date. Of the trade receivables balance, for both the Group and Company, at the end of the year,
R137 million (2014: R181 million) is due from one significant client, the Group and Company’s largest.
There are no other customers who represent more than 10% of the total balance of trade receivables.
As at 31 March 2015, the Group and Company had no significant concentration of credit risk (2014: Nil).
The allowance account in respect of trade receivables is used to record impairment losses unless the Group
and Company is satisfied that no recovery of the amounts owing is possible; at that point the amounts
considered irrecoverable and are written off against the allowance account.
The Group and Company believe that, based on historic default rates, no other impairment allowance in
respect of trade receivables not past due 90 days is required.
D.2 CASH AND CASH EQUIVALENTS
Cash and cash equivalents consist of:
GROUP COMPANY
Figures in Rand thousand 2015 2014 2015 2014
Cash on hand 75 75 75 75
Bank balances 920 568 795 654 900 566 754 607
Money markets 305 923 218 779 298 273 218 779
1 226 566 1 014 508 1 198 914 973 461
The Group and Company’s exposure to interest rate risk and a sensitivity analysis for financial assets and
liabilities are disclosed in note F.2.
D.3 TRADE AND OTHER PAYABLES
GROUP COMPANY
Figures in Rand thousand 2015 2014 2015 2014
Trade payables 506 167 567 868 497 969 552 587
VAT 55 384 54 159 55 136 52 929
Bonuses payable 11 393 9 816 10 467 9 262
Leave payable 49 918 44 404 48 782 44 404
Deposits received 81 543 64 579 77 558 63 271
Other payables* 21 253 17 773 17 062 17 760
725 658 758 599 706 974 740 213
* Other payables includes lease payables and overtime accruals.
The Group and Company’s exposure to liquidity risk related to trade and other payables is disclosed in
the following table.
NOTES TO THE CONSOLIDATED ANNUAL FINANCIAL STATEMENTS (CONTINUED)For the year ended 31 March 2015

D. MANAGING WORKING CAPITAL (continued)
D.3 TRADE AND OTHER PAYABLES (continued)
The table below analyses the Group and Company’s trade and other payables in terms of their maturities.
The amounts disclosed are the contractual undiscounted cash outflows:
GROUP
Figures in Rand thousand
Carrying amount
Contractual cash flows
6 months or less
Between 6 – 12
monthsBetween
1 – 2 yearsBetween
2 – 5 yearsMore than
5 years
2015 725 658 725 658 725 658 – – – –
2014 758 599 758 599 758 599 – – – –
COMPANY
Figures in Rand thousand
Carrying amount
Contractual cash flows
6 months or less
Between 6 – 12
monthsBetween
1 – 2 yearsBetween
2 – 5 yearsMore than
5 years
2015 706 974 706 974 706 974 – – – –
2014 740 213 740 213 740 213 – – – –
D.4 CASH GENERATED FROM OPERATIONS
GROUP COMPANY
Figures in Rand thousand 2015 2014 2015 2014
Profit before taxation 2 282 673 2 303 142 2 475 133 2 111 973
Adjustments for:
Depreciation and amortisation 1 393 491 1 412 665 1 388 753 1 408 391
Impairment of trade and other receivables 31 634 8 500 31 010 7 659
Profit on sale of assets (5 277) (1 311) (5 277) (1 311)
(Loss)/Income from equity accounted investments 155 446 (228 582) – –
Interest received – investment (87 098) (64 702) (141 352) (120 619)
Finance costs 1 313 554 1 380 960 1 313 554 1 380 960
Movements in retirement benefit assets and liabilities (2 574) (95 846) (2 593) (95 846)
Movements in provisions 7 451 73 865 7 451 73 865
Deferred income (6 147) (2 603) (6 147) (2 603)
Unrealised fair value gains and losses (285 804) (330 455) (309 966) (360 589)
4 797 349 4 455 633 4 750 566 4 401 880
Changes in working capital:
Inventories (211) 5 042 – –
Other non-current assets 82 864 41 414 82 864 41 414
Trade and other receivables (272 181) (22 666) (268 089) (23 629)
Trade and other payables (20 383) (75 266) (36 417) (68 501)
4 587 438 4 404 157 4 528 924 4 351 164
CONSOLIDATED ANNUAL FINANCIAL
STATEMENTS 201541

AIRPORTS COMPANY SOUTH AFRICA42
D. MANAGING WORKING CAPITAL (continued)
D.5 TAX PAID
GROUP COMPANY
Figures in Rand thousand 2015 2014 2015 2014
Balance at beginning of the year (68 183) (19 823) (67 938) (20 437)
Current tax for the year recognised in profit or loss (732 071) (477 583) (730 588) (475 545)
Balance at end of the year 57 019 68 183 61 999 67 938
(743 235) (429 223) (736 527) (428 044)
D.6 OTHER NON-CURRENT ASSETS
GROUP COMPANY
Figures in Rand thousand 2015 2014 2015 2014
Lease receivable non-current portion 127 725 210 617 127 725 210 617
Investments# 18 125 18 097 18 125 18 097
145 850 228 714 145 850 228 714
# Investments relate to the acquisition made by the company of 100% shareholding in a cell captive with Guardrisk Life Ltd in September 2003 to fund its obligation arising from 2002, whereby the company agreed to increase the minimum pension payout to employees. Guardrisk performs a half-yearly review per individual covered to establish the present value of the company’s obligation on the prescribed valuation basis (as approved by Guardrisk Life Statutory Actuaries) in order to assess the company’s commitment as per the assets and expressed liabilities and ensure sufficient life funds are transferred to the non-distributable reserves.
E. INVESTMENTS
E.1 SUBSIDIARIES
Accounting policy
Subsidiaries are all entities (including structured entities) over which the Company has control.
The Company uses the acquisition method of accounting to account for business combinations. The
consideration transferred for the acquisition of a subsidiary is the fair values of the assets transferred,
the liabilities incurred and the equity interests issued by the Company. The consideration transferred
includes the fair value of any asset or liability resulting from a contingent consideration arrangement.
Acquisition-related costs are expensed as incurred. Identifiable assets acquired and liabilities and contingent
liabilities assumed in a business combination are measured initially at their fair values at the acquisition
date. The Company recognises any non-controlling interest in the acquiree either at fair value or at the
non-controlling interest’s proportionate share of the acquiree’s net assets.
The Company’s investments in subsidiaries are carried at cost, net of accumulated impairment losses.
The Company treats transactions with non-controlling interests that do not result in a loss of control, as
equity transactions. Gains or losses on disposals to non-controlling interests are also recorded in equity.
NOTES TO THE CONSOLIDATED ANNUAL FINANCIAL STATEMENTS (CONTINUED)For the year ended 31 March 2015

E. INVESTMENTS (continued)
E.1 SUBSIDIARIES (continued)
COMPANY
Figures in Rand thousand 2015 2014
Indebtedness 785 586 790 006
Total interest in subsidiaries 785 586 790 006
Directors’ valuation 785 586 790 006
Aggregate after tax (losses)/profits of subsidiary companies (109 885) 124 863
Details of the company’s subsidiaries at 31 March 2015 are indicated below. All subsidiaries are incorporated
in South Africa except for ACSA Global Ltd which is incorporated in Mauritius.
Principal activity Interest held Indebtedness
2015 2014 2015 2014
Subsidiaries
OSI Airport Systems (Pty) Ltd Dormant 51% 51% – –
Precinct 2A (Pty) Ltd Property owning 100% 100% 640 904 634 410
JIA Piazza Park (Pty) Ltd Hotel operations 100% 100% – –
ACSA Global Ltd Management company 100% 100% 81 494 93 099
722 398 727 509
Special purpose entities#
Lexshell 342 Investment Holdings (Pty) Ltd
Employee share option plan –% –% 34 137 33 462
Airport Management Scheme Incentive Scheme Company (Pty) Ltd
Employee share option plan –% –% 29 051 29 035
63 188 62 497
785 586 790 006
# The Company’s accounts include the consolidation of the Airport Management Share Incentive Scheme Company Proprietary Limited and Lexshell 342 Investment Holdings Proprietary Limited. Although the Airport Management Share Incentive Scheme Company Proprietary Limited is wholly owned by the Airport Management Share Incentive Scheme Trust and Lexshell 342 Investment Holdings Proprietary Limited is wholly owned by the ACSA Kagano Trust, in terms of IFRS 10. The group consolidates these entities as it is exposed to significant risks that are associated with loans extended to entities to acquire shares of the company.
E.2 JOINT ARRANGEMENTS
Accounting policy
The Group holds a 50% interest in Airports Logistics Property Holdings (Pty) Ltd. It has been classified
as a joint venture due to the decisions about the relevant activities requiring unanimous consent of the
parties sharing control.
The Group accounts for its investment in the joint venture using the equity method of accounting. The
equity method of accounting results in the Group’s income statement reflecting its share of the entity’s
profit or loss after tax, the statement of comprehensive income recording the Group’s share of the
comprehensive income of the entity, while the Group’s statement of financial position records the Group’s
share of the net assets of the entity plus any goodwill that arose on purchase.
CONSOLIDATED ANNUAL FINANCIAL
STATEMENTS 201543

AIRPORTS COMPANY SOUTH AFRICA44
E. INVESTMENTS (continued)
E.2 JOINT ARRANGEMENTS (continued)
Accounting policy (continued)
Upon acquiring a new investment in a joint venture the Group will recognise the investment initially at the
amount it paid for the investment (which includes the amount paid for goodwill).
Distributions (dividends) received from the entities reduce the carrying amount of the investment. If the
entity incurs losses, the Group will only recognise these losses until the carrying amount of the investment
reaches zero, unless the Group has incurred obligations or made payments on behalf of the entity.
The following represents the Group’s share of assets, liabilities, revenue and expenses of the joint venture:
Figures in Rand thousand
Airport Logistics Property
Holdings (Pty) Ltd*
Opening balance at 1 April 2013 85 078
Share of profits 22 305
Closing balance at 31 March 2014 107 383
Share of profits 20 559
Closing balance at 31 March 2015 127 942
GROUP
Figures in Rand thousand 2015 2014
Summarised statement of comprehensive income
Revenue 30 344 64 201
Profit/(Loss) for the period 20 559 22 305
Total comprehensive income 20 559 22 305
Summarised statement of financial position
Non-current assets 415 400 373 700
Current assets 49 660 62 125
Non-current liabilities 208 708 219 892
Current liabilities 470 1 167
Total net assets 255 882 214 766
Interest in joint venture at % ownership 127 942 107 383
E.3 INVESTMENTS IN ASSOCIATES
Accounting policy
The Group and Company account for its investments in associates using the equity method of accounting
(refer to the investment in joint ventures accounting policy for more detail).
Significant judgement, estimates and sources of estimation uncertainty
The Group and Company’s 10% shareholding in the Mumbai International Airport Limited through ACSA
Global Limited and 10% shareholding in Aeroporto de Guarulhos Participacoes S.A. have been accounted
for using the equity method as the Group and Company believe that they have the ability (and power)
to participate in the financial and operating policy decisions of the entities, which gives the Group and
Company significant influence over them.
NOTES TO THE CONSOLIDATED ANNUAL FINANCIAL STATEMENTS (CONTINUED)For the year ended 31 March 2015

E. INVESTMENTS (continued)
E.3 INVESTMENTS IN ASSOCIATES (continued)
Investment in Mumbai International Airport Private Limited
The Group and Company have a 10% equity interest, through ACSA Global Limited, in the 30-year
concession (with an option for a further 30 years) to modernise the Chhatrapati Shivaji International
Airport in Mumbai. Airports Company South Africa is an integral investor in the project, as well as being
the designated airport operator.
Aeroporto de Guarulhos Participações S.A.
The Group and Company have a 10% equity interest, in the 20-year concession to modernise the Guarulhos
International Airport. Airports Company South Africa is an integral investor in the project, as well as being
the designated airport operator for a five-year period.
La Mercy Joint Venture Company (Proprietary) Limited (Dube Trade Port)
Airports Company South Africa and the Dube Trade Port Company Limited (LMJVC) has 40% and
60% interest in La Mercy Joint Venture Company (Proprietary) Limited respectively. This joint venture
arrangement objective is to commercially enable land holdings in excess of 848 hectares. The vast majority
of the land is zoned undetermined and the objective is to rezone and service the properties to unlock
development opportunities.
Name of company
% ownership interestCarrying amount
(Company)Country of
incorporation
2015 2014 2015 2014
Direct associates
La Mercy JV Property Investments (Pty) Ltd 40% 40% 38 173 35 444 South Africa
Aeroporto de Guarulhos Participações S.A. 10% 10% 257 883 257 883 Brazil
296 056 293 327
Indirect associates
Mumbai International Airport Private Limited 10% 10% – – India
* The investment in Mumbai International Airport Private Limited is held through a 100% owned subsidiary of the Group, ACSA Global.
Guarantees issued
Equity guarantee – an Airport Operator guarantee has been issued by ACSA Global Ltd to Mumbai
International Airport Private Ltd for an amount of INR3 billion (R580 million; 2014: R529 million). This
guarantee is limited to ACSA Global’s performance fee of USD1.2 million (2014: USD1.2 million).
CONSOLIDATED ANNUAL FINANCIAL
STATEMENTS 201545

AIRPORTS COMPANY SOUTH AFRICA46
E. INVESTMENTS (continued)
E.3 INVESTMENTS IN ASSOCIATES (continued)
Reconciliation of movement in investments in associates – Group
Figures in Rand thousand
La Mercy JV Property
Investments (Pty) Ltd
Mumbai International
Airport Private Ltd
Aeroporto de Guarulhos
Participações S.A. Total
Investment at 1 April 2013 155 700 708 711 68 421 932 832
Acquisitions – – 181 054 181 054
Share of profit 509 146 580 59 188 206 277
Share of OCI – (84 571) 187 147 102 576
Investment at 31 March 2014 156 209 770 720 495 810 1 422 739
Share of profit/(loss) 83 178 (81 104) (178 079) (176 005)
Share of OCI – 201 342 (100 050) 101 292
Investment at 31 March 2015 239 387 890 958 217 681 1 348 026
Summarised financial information of associates for 2015
Figures in Rand thousand
La Mercy JV Property
Investments(Pty) Ltd
Mumbai International
Airport Private Ltd
Aeroporto de Guarulhos
Participações S.A Total
Summarised statement of comprehensive income
Revenue 248 689 2 274 254 13 285 811 15 808 754
Profit/(Loss) for the period 207 945 (811 040) (1 780 788) (2 383 883)
Total comprehensive income 207 945 (811 040) (1 780 788) (2 383 883)
Summarised statement of financial position
Non-current assets 326 854 28 136 328 59 409 182 87 872 364
Current assets 301 135 3 306 409 1 804 935 5 412 479
Non-current liabilities – 20 756 789 52 311 973 73 068 762
Current liabilities 29 523 1 799 274 5 289 215 7 118 012
Total net assets 598 466 8 886 674 3 612 929 13 098 069
Interest in associate at % ownership 239 387 888 674 361 293 1 489 354
Translation differences – 2 284 (143 612) (141 328)
Investment in associate 239 387 890 958 217 681 1 348 026
NOTES TO THE CONSOLIDATED ANNUAL FINANCIAL STATEMENTS (CONTINUED)For the year ended 31 March 2015
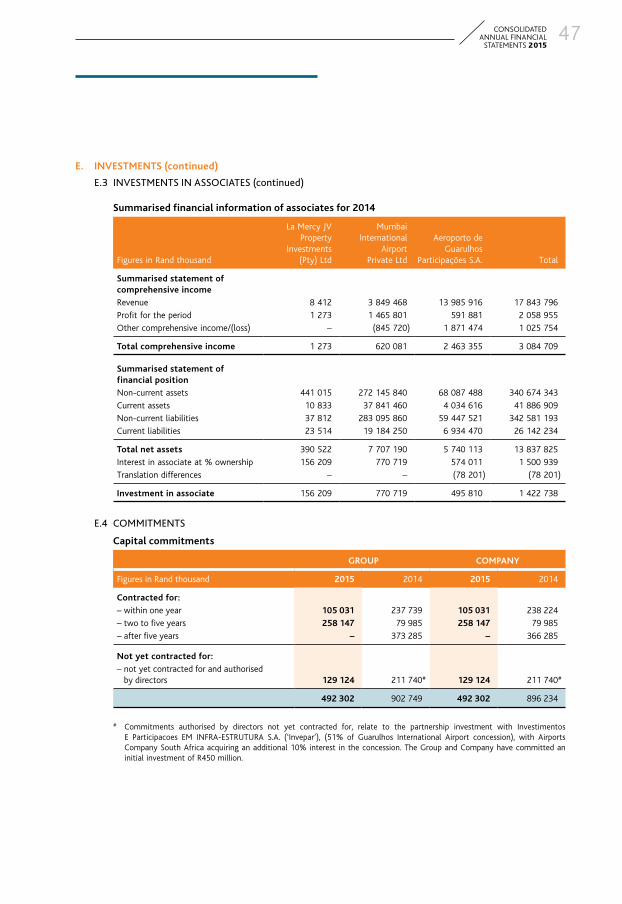
E. INVESTMENTS (continued)
E.3 INVESTMENTS IN ASSOCIATES (continued)
Summarised financial information of associates for 2014
Figures in Rand thousand
La Mercy JV Property
Investments(Pty) Ltd
Mumbai International
Airport Private Ltd
Aeroporto de Guarulhos
Participações S.A. Total
Summarised statement of comprehensive income
Revenue 8 412 3 849 468 13 985 916 17 843 796
Profit for the period 1 273 1 465 801 591 881 2 058 955
Other comprehensive income/(loss) – (845 720) 1 871 474 1 025 754
Total comprehensive income 1 273 620 081 2 463 355 3 084 709
Summarised statement of financial position
Non-current assets 441 015 272 145 840 68 087 488 340 674 343
Current assets 10 833 37 841 460 4 034 616 41 886 909
Non-current liabilities 37 812 283 095 860 59 447 521 342 581 193
Current liabilities 23 514 19 184 250 6 934 470 26 142 234
Total net assets 390 522 7 707 190 5 740 113 13 837 825
Interest in associate at % ownership 156 209 770 719 574 011 1 500 939
Translation differences – – (78 201) (78 201)
Investment in associate 156 209 770 719 495 810 1 422 738
E.4 COMMITMENTS
Capital commitments
GROUP COMPANY
Figures in Rand thousand 2015 2014 2015 2014
Contracted for:
– within one year 105 031 237 739 105 031 238 224
– two to five years 258 147 79 985 258 147 79 985
– after five years – 373 285 – 366 285
Not yet contracted for:
– not yet contracted for and authorised by directors 129 124 211 740# 129 124 211 740#
492 302 902 749 492 302 896 234
# Commitments authorised by directors not yet contracted for, relate to the partnership investment with Investimentos E Participacoes EM INFRA-ESTRUTURA S.A. (‘Invepar’), (51% of Guarulhos International Airport concession), with Airports Company South Africa acquiring an additional 10% interest in the concession. The Group and Company have committed an initial investment of R450 million.
CONSOLIDATED ANNUAL FINANCIAL
STATEMENTS 201547

AIRPORTS COMPANY SOUTH AFRICA48
F. FINANCIAL INSTRUMENTS AND FINANCIAL INSTRUMENT RISK MANAGEMENT
F.1 FINANCIAL INSTRUMENTSF.1.1 Classification
The Group holds the following categories of financial assets and financial liabilities:
Financial assets
Loans and receivables
Note(s) 2015 2014
Investment in associates E.3 1 348 026 1 422 739
Other non-current assets D.6 145 850 228 714
Derivative financial instruments C.3 701 –
Trade and other receivables D.1 1 183 312 942 765
Investments G.4 515 899 1 073 569
Cash and cash equivalents D.2 1 226 566 1 014 508
4 420 354 4 682 295
Financial liabilities
Financial liabilities at fair value through profit or loss
Note(s) 2015 2014
Interest-bearing borrowings C.1 11 176 550 12 971 910
Derivative financial instruments C.3 75 023 99 682
Trade and other payables D.3 725 657 758 599
11 977 230 13 830 191
The Company holds the following categories of financial assets and financial liabilities:
Financial assets
Loans and receivables
Note(s) 2015 2014
Investments in subsidiaries E.1 785 586 790 006
Investment in associates E.3 296 056 293 327
Other non-current assets D.6 145 850 228 714
Derivative financial instruments C.3 701 –
Trade and other receivables D.1 1 172 113 935 034
Investments G.4 515 899 1 073 569
Cash and cash equivalents D.2 1 198 914 973 461
4 115 119 4 294 111
Financial liabilities
Financial liabilities at fair value through
profit or loss
Note(s) 2015 2014
Interest-bearing borrowings C.1 11 175 050 12 970 410
Derivative financial instruments C.3 75 023 99 682
Trade and other payables D.3 706 973 740 213
11 957 046 13 810 305
NOTES TO THE CONSOLIDATED ANNUAL FINANCIAL STATEMENTS (CONTINUED)For the year ended 31 March 2015

F. FINANCIAL INSTRUMENTS AND FINANCIAL INSTRUMENT RISK MANAGEMENT (continued)
F.1 FINANCIAL INSTRUMENTS (continued)F.1.2 Initial recognition and measurement
The Group and Company initially record both financial assets and financial liabilities at fair value.
Where transaction costs are incurred they are recognised as part of the initial cost of the financial
instrument as the group does not have any financial instruments classified as fair value through
profit or loss.
F.1.3 Subsequent measurement
All of the Group and Company’s financial assets are categorised as ‘loans and receivables’ and are
therefore subsequently measured at amortised cost. Amortised cost is the basis of moving the
initial amount of the financial instrument (fair value of the instrument) to the maturity value of
the instrument on a systematic basis using a fixed interest rate (effective interest rate) taking into
account repayment dates and initial premiums or discounts. The carrying amount of amortised cost
financial assets is adjusted for impairments.
The majority of the Group and Company’s financial liabilities are classified as ‘financial liabilities at
amortised cost’ and are therefore subsequently measured at amortised cost. The derivative financial
instruments are, however, classified as ‘financial liabilities at fair value through profit or loss’ and are
subsequently measured at their fair values. Fair value is the amount for which a liability could be
settled between knowledgeable willing parties in an arm’s length transaction.
F.1.4 Impairment of financial assets
Financial assets are reviewed for impairment whenever events or changes in circumstances indicate
the carrying amount may not be recoverable. Impairment is normally determined based on a realistic
assessment of future cash flows discounted using the original effective interest rate compared
with contractual amounts. For amounts due to the group, significant financial difficulties of the
debtor, probability that the debtor will enter bankruptcy and default of payments are all considered
indicators of impairment. Impairment losses are recognised in profit or loss.
Individually significant financial assets are tested for impairment on an individual basis. The remaining
financial assets are assessed collectively in groups that share similar credit risk characteristics.
An impairment loss is reviewed if the reversal can be related objectively to an event occurring after
the impairment loss was recognised. For financial assets measured at amortised cost, the reversal is
recognised in profit and loss.
F.1.5 Fair value measurement
The fair value of financial instruments may require some judgement or may be derived from readily
available sources. The degree of judgement involved is reflected in the fair value measurements
section below, although this does not necessarily indicate that the fair value is more or less likely to
be realised.
Financial assets
The Group and Company’s financial assets are all classified as ‘loans and receivables’ and are
carried at amortised cost. Due to their short-term natures the carrying values of the financial assets
approximate their fair values.
CONSOLIDATED ANNUAL FINANCIAL
STATEMENTS 201549
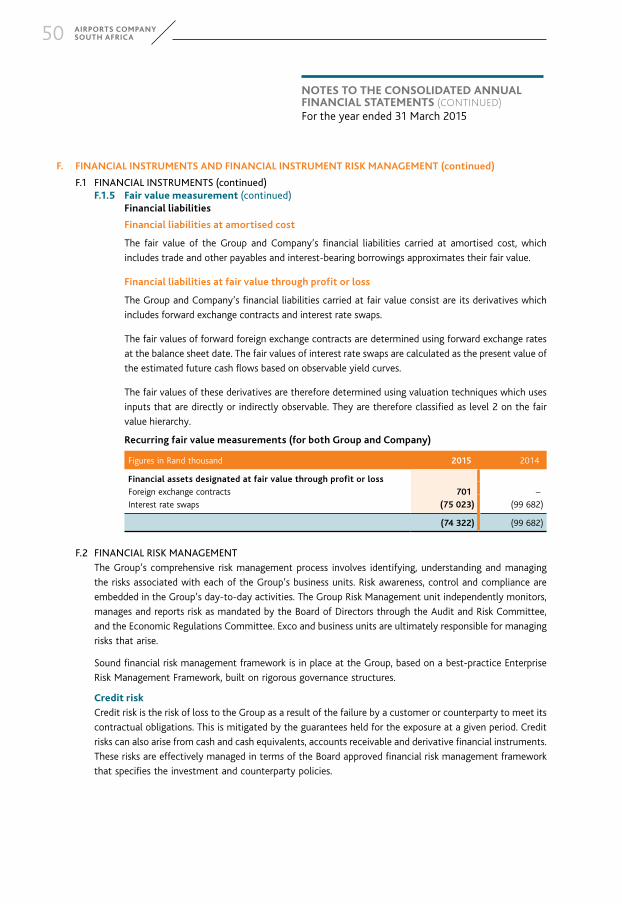
AIRPORTS COMPANY SOUTH AFRICA50
F. FINANCIAL INSTRUMENTS AND FINANCIAL INSTRUMENT RISK MANAGEMENT (continued)
F.1 FINANCIAL INSTRUMENTS (continued)F.1.5 Fair value measurement (continued)
Financial liabilities
Financial liabilities at amortised cost
The fair value of the Group and Company’s financial liabilities carried at amortised cost, which
includes trade and other payables and interest-bearing borrowings approximates their fair value.
Financial liabilities at fair value through profit or loss
The Group and Company’s financial liabilities carried at fair value consist are its derivatives which
includes forward exchange contracts and interest rate swaps.
The fair values of forward foreign exchange contracts are determined using forward exchange rates
at the balance sheet date. The fair values of interest rate swaps are calculated as the present value of
the estimated future cash flows based on observable yield curves.
The fair values of these derivatives are therefore determined using valuation techniques which uses
inputs that are directly or indirectly observable. They are therefore classified as level 2 on the fair
value hierarchy.
Recurring fair value measurements (for both Group and Company)
Figures in Rand thousand 2015 2014
Financial assets designated at fair value through profit or loss
Foreign exchange contracts 701 –
Interest rate swaps (75 023) (99 682)
(74 322) (99 682)
F.2 FINANCIAL RISK MANAGEMENT
The Group’s comprehensive risk management process involves identifying, understanding and managing
the risks associated with each of the Group’s business units. Risk awareness, control and compliance are
embedded in the Group’s day-to-day activities. The Group Risk Management unit independently monitors,
manages and reports risk as mandated by the Board of Directors through the Audit and Risk Committee,
and the Economic Regulations Committee. Exco and business units are ultimately responsible for managing
risks that arise.
Sound financial risk management framework is in place at the Group, based on a best-practice Enterprise
Risk Management Framework, built on rigorous governance structures.
Credit risk
Credit risk is the risk of loss to the Group as a result of the failure by a customer or counterparty to meet its
contractual obligations. This is mitigated by the guarantees held for the exposure at a given period. Credit
risks can also arise from cash and cash equivalents, accounts receivable and derivative financial instruments.
These risks are effectively managed in terms of the Board approved financial risk management framework
that specifies the investment and counterparty policies.
NOTES TO THE CONSOLIDATED ANNUAL FINANCIAL STATEMENTS (CONTINUED)For the year ended 31 March 2015

F. FINANCIAL INSTRUMENTS AND FINANCIAL INSTRUMENT RISK MANAGEMENT (continued)
F.2 FINANCIAL RISK MANAGEMENT (continued)
Trade and other receivables
The Group’s exposure is influenced mainly by the individual characteristics of each customer. The
demographics of the Group’s customer base, including the default rate of the industry and country in
which customers operate, has less of an influence on credit risk. Approximately 29% (2014: 23%) of the
Group’s aeronautical revenue is attributable to transactions with a single customer. The main concentration
of credit risk is in the Johannesburg region, which approximates 65% (2014: 61%) of the trade receivables
of the Group.
Each new customer is analysed individually for creditworthiness before the Group’s standard payment
terms and conditions are offered. The Group’s review includes external ratings, where available, and in
some cases bank references. Credit limits are established for each customer, which represents the maximum
open amount, and these limits are reviewed on an ongoing basis. Customers that fail to meet the Group’s
benchmark creditworthiness may transact with the Group only on a prepayment/cash basis.
More than 60% of the Group’s customers have been transacting with the Group for over 15 years, and
losses have occurred infrequently. In monitoring customer credit risk, customers are grouped according
to their credit characteristics, including whether they are an individual or legal entity, whether they
are aeronautical, commercial or retail customer, geographic location, industry, aging profile, maturity
and existence of previous financial difficulties. Customers that are graded as ‘high risk’ are placed on a
restricted customer list, and future transactions are made on a prepayment basis with approval of the
Credit Committee. Customers are considered to be ‘high risk’ when they have not met the credit terms as
stipulated in their trading contracts.
Investments, cash and cash equivalents
In complying with the Treasury Regulation, the Group’s Financial Risk Management Framework limits the
Group to investments in “A” short-term rated instruments or “AAA” rated instruments and counterparts.
For banks and financial institutions, only independently rated parties with a minimum rating of A- are
accepted with respect to cash and cash equivalents.
Market risk
Market risk is the risk that the Group’s earnings or capital, or its ability to meet business objectives, will
be adversely affected by changes in the level or volatility of market rates or prices such as interest rates,
foreign exchange rates and commodity prices.
Interest rate risk
The Group’s interest rate risk arises from its borrowings. The Group’s is to maintain a mix of fixed to floating
rate debt within the Board-approved parameters.
As at 31 March 2015, the Group’s fixed to floating rate profile after hedging, on net debt was 76%
(2014: 69%) fixed.
At the reporting date, the interest profile of the Group’s interest-bearing financial instruments was:
Carrying amount
Fixed-rate instruments Variable-rate instruments Total
2015 2014 2015 2014 2015 2014
Interest-bearing borrowings 8 504 136 8 887 988 2 672 414 4 083 922 11 176 550 12 971 910
76% 69% 24% 31%
CONSOLIDATED ANNUAL FINANCIAL
STATEMENTS 201551

AIRPORTS COMPANY SOUTH AFRICA52
F. FINANCIAL INSTRUMENTS AND FINANCIAL INSTRUMENT RISK MANAGEMENT (continued)
F.2 FINANCIAL RISK MANAGEMENT (continued)
Tariff risk
Aeronautical revenues contributing 63% (2014: 64%) of the Group’s revenue is regulated by an
independent economic regulator using a price cap methodology. The regulated tariff is linked to the CPI
index. A change in CPI has a positive or a negative impact on the revenue earned by the Group. However,
the Group is allowed to adjust the difference between actual and forecast CPI in future tariffs. The tariff
is determined for a five-year period every three years with a two-year overlap. The Board has approved a
regulatory strategy which seeks to proactively influence the regulatory approach in line with best practice.
In this regard, the Group proactively manages the economic regulatory risk while balancing the interests
of both the Group and the customers.
Price risk
The Group is exposed to price risk on the Stanlib Income Fund, which is based on quoted prices.
A 5% increase in the quote price of the Stanlib Income Fund as at 31 March 2015 would have had the
effect of increasing profit for the period by R26 million (2014: R53 million).
Foreign exchange risk
The Group has two foreign investments that give rise to limited exposure to foreign currency risk, arising
primarily with respect to the Brazilian Real and Indian Rupee. All foreign debt instruments are issued in
Rand and the Group also uses foreign exchange contracts to hedge material expenditure once the project
or purchase cash flows are certain – refer to note C3.
In order to manage risks from fluctuations in currency rates, the Group makes use of forward exchange
contracts to manage exposure to fluctuations in foreign currency rates on importation of equipment.
The Group’s exposure to foreign currency risks was as follows, based on notional amounts:
2015 2014
Figures in thousands of Dollars USD USD
Trade receivables 7 095 267
Cash and cash equivalents 1 180 1 224
Trade payables (205) (359)
Foreign exchange contracts 2 000 (5 000)
Gross balance sheet exposure 10 070 (3 868)
2015 2014
Figures in thousands of Euros EUR EUR
Foreign exchange contracts 620 –
Gross balance sheet exposure 620 –
Average rate Reporting spot rate
2015 2014 2015 2014
The following significant exchange rates applied during the year:
EURO 13.994 14.959 13.111 N/A
USD 11.050 10.724 12.092 10.569
INR 0.016 0.178 0.160 0.177
BRS 4.492 4.658 3.7133 4.664
NOTES TO THE CONSOLIDATED ANNUAL FINANCIAL STATEMENTS (CONTINUED)For the year ended 31 March 2015

F. FINANCIAL INSTRUMENTS AND FINANCIAL INSTRUMENT RISK MANAGEMENT (continued)
F.2 FINANCIAL RISK MANAGEMENT (continued)Sensitivity analysis
A 10% weakening of the Rand against the following currencies at 31 March would have increased/
(decreased) equity, and profit and loss by the amounts shown below. This analysis assumes that all other
variables, in particular interest rates, remain constant. The analysis is performed on the same basis for 2014.
Equity Profit or loss
Figures in Rand thousand 2015 2014 2015 2014
USD (87 029) (46 974) (4 893) (12 897)
INR (80 789) (38 944) (16 514) (5 173)
BRS (9 567) (247 515) (115 289) (52 198)
(177 385) (333 433) (136 696) (70 268)
A 10% strengthening of the Rand against the above currencies at 31 March would have had the equal but
opposite effect on the above currencies to the amounts shown above, on the basis that all other variables
remain constant.
Liquidity risk
Liquidity risk is the risk of not being able to generate sufficient cash to honour financial commitments. From
a Group’s perspective, this would include the Group not being able to advance funds for capital expenditure,
redeem and service loans, finance operational costs and service unanticipated financial commitments.
The objective of the Financial Risk Management Framework is to ensure continuity of funding and flexibility,
ensuring debt maturities are spread over a range of dates to manage refinancing risks. The Group is not
exposed to excessive refinancing risk in any one year.
As at 31 March 2015, the Group had facilities of R4.25 billion and (2014: R5.5 billion), of which R2.3 billion
has been utilised for both years.
Facility amount
Figures in Rand thousand 2015 2014
Total facilities 4 250 000 5 500 000
Utilised facilities (2 250 000) (2 250 000)
Total unutilised 2 000 000 3 250 000
Uncommitted facilities represent undrawn lines of credit where the bank has an agreement with the Group
entity to make available an amount (up to the maximum specified) in loans on demand from the Group.
The Group is under no obligation to actually take out a loan at any particular time. Committed facilities
are those lines of credit where the Group and the bank have clearly defined terms and conditions which
bind the bank to lend the Group up to the amounts stated in the agreement.
Please refer to the following notes for details on the Group and Company’s financial liabilities in terms of
their maturities:
Unsecured borrowings – note C.1
Trade and other payables – note D.3
Derivative financial instruments – note C.3
CONSOLIDATED ANNUAL FINANCIAL
STATEMENTS 201553

AIRPORTS COMPANY SOUTH AFRICA54
F. FINANCIAL INSTRUMENTS AND FINANCIAL INSTRUMENT RISK MANAGEMENT (continued)
F.2 FINANCIAL RISK MANAGEMENT (continued)
Capital risk management
The Group’s capital management strategy is designed to ensure that the Group is adequately capitalised
in a manner consistent with the Group’s risk profile, economic regulatory requirements and maintaining
an investment rating level.
The Group monitors capital adequacy through the gearing ratio, as represented by net interest-bearing
debt to total capital. Net debt is calculated as total interest-bearing borrowings (including ‘current and
non-current borrowings’ as shown in the balance sheet) less cash and cash equivalents plus short-term
investments. Total capital is calculated as ‘equity’ as shown in the consolidated balance sheet, plus net debt.
The Group’s maximum gearing ratio is up to 60% (2014: up to 60%). The gearing ratio is determined by
the Treasury department and approved by ACSA’s Board. The objective is to minimise the weighted average
cost of debt. The gearing ratios as at 31 March 2015 and 2014 were as follows:
GROUP COMPANY
Figures in Rand thousand 2015 2014 2015 2014
Total borrowings 11 176 550 12 971 910 11 175 050 12 970 410
Less: cash and cash equivalents plus short-term investments (1 742 465) (2 088 077) (1 714 813) (2 047 030)
Net debt 9 434 085 10 883 833 9 460 237 10 923 380
Total equity 13 995 526 12 580 016 13 394 305 11 892 366
Total capital 23 429 611 23 463 849 22 854 542 22 815 746
Gearing ratio (net debt divided by total capital) (%) 40 46 41 48
G. OTHER
G.1 INTANGIBLE ASSETSAccounting policy
Intangible assets comprise of computer software and are measured initially at cost and are carried at cost
less accumulated amortisation and impairment losses.
Amortisation is provided to write down the computer software on a straight line basis to its residual value
over three to five years.
GROUP AND COMPANY
2015 2014
Figures in Rand thousand Cost
Accumulated depreciation
Carrying value Cost
Accumulated depreciation
Carrying value
Computer software 603 627 (547 970) 55 657 585 063 (474 455) 110 608
Amortisation expense of R73 million (2014: R88 million) has been included in the statement of
comprehensive income. No disposals of computer software were made during 2015 (2014: R15 thousand)
has been disposed of in the current year. Additions of R19 million (2014: R49 million) have been made in
the current year.
NOTES TO THE CONSOLIDATED ANNUAL FINANCIAL STATEMENTS (CONTINUED)For the year ended 31 March 2015

G. OTHER (continued)
G.2 DEFERRED TAX LIABILITYAccounting policy
Deferred tax assets and liabilities represent amounts of tax that will become recoverable and payable in
future accounting periods. They generally arise as a result of temporary differences, where the time at which
profits and losses are recognised for tax purposes differs from the time at which the relevant transaction is
recorded in the accounts. A deferred tax asset represents a tax reduction that is expected to arise in a future
period. A deferred tax liability represents taxes which will become payable in a future period as a result of
a current or an earlier transaction. In respect of deferred tax assets, the group only recognises a deferred
tax asset when the availability of future profits necessary to support the deferred tax asset is probable.
GROUP COMPANY
Figures in Rand thousand 2015 2014 2015 2014
Deferred tax liability
Property and equipment 353 329 634 595 353 329 478 980
Investment property 640 628 401 364 606 471 464 296
Intangible assets 6 768 18 838 6 768 18 838
Lease receivables 67 170 71 174 67 170 71 174
Investments in associates 186 362 90 447 5 850 5 850
Impairment of trade and other receivables (18 385) (11 927) (18 385) (11 927)
Other assets (33 190) 5 067 3 469 5 067
Prepayments 3 853 106 3 853 106
Provisions (56 023) (55 793) (55 485) (55 793)
Derivative financial instruments (20 810) (27 911) (20 810) (27 911)
1 129 701 1 125 960 952 230 948 680
The deferred tax liability relate to income tax in the same jurisdiction, and the law allows net settlement.
Reconciliation of deferred tax liability
GROUP COMPANY
Figures in Rand thousand 2015 2014 2015 2014
At beginning of year 1 125 960 943 625 948 680 814 286
Movements during the year:
Prior period error (note G.15) – 12 535 – 33 153
Change in estimate (note G.16) (36 447) – – –
– recognised in the statement of comprehensive income (15 977) 113 482 (13 516) 78 835
– recognised directly in other comprehensive income 56 165 56 318 17 066 22 406
1 129 701 1 125 960 952 230 948 680
Deferred tax liabilities expected to be recovered after more than 12 months 1 181 871 1 193 574 1 003 862 1 016 294
Deferred tax liabilities expected to be recovered within the next 12 months (52 170) (67 614) (51 632) (67 614)
1 129 701 1 125 960 952 230 948 680
CONSOLIDATED ANNUAL FINANCIAL
STATEMENTS 201555

AIRPORTS COMPANY SOUTH AFRICA56
G. OTHER (continued)
G.3 RETIREMENT BENEFITS
GROUP AND COMPANY
Figures in Rand thousand 2015 2014
Post-retirement medical benefit – defined benefit plan 12 515 16 699
Life fund – defined contribution plan 18 316 18 159
Total retirement benefit obligation 30 831 34 858
Post-retirement medical benefit
The company makes contributions to a defined benefit plan that provides medical benefits to employees
upon retirement. The employees eligible for the post retirement benefit are those who were in employment
at 1 August 2007. The plan entitles retired employees to receive a reimbursement of certain medical costs.
The following is a reconciliation of the present value of the defined benefit plan:
GROUP AND COMPANY
Figures in Rand thousand 2015 2014
Present value of liability at 1 April 2014 16 698 168 514
Actuarial gains (1 611) (44 177)
Settlement – (127 485)
Benefits paid (982) (1 763)
Change in valuation basis 312 (11 635)
Net expense recognised in profit and loss 1 837 33 244
Present value of liability at 31 March 2015 16 254 16 698
Less: fair value of plan assets at 31 March 2015* 3 739 –
Net present value of plan liability at 31 March 2015 12 515 16 698
* An insured annuity policy was purchased from Sanlam Life, in the Company’s name, to fund the contribution subsidies paid to current pensioners. The policies will pay a level amount each month to the relevant medical schemes on behalf of the Company, for as long as the pensioners and/or the pensioners’ spouses are still alive. The insured annuity policy can only be used to fund medical aid contributions, and is not available as an asset to the Company’s creditors.
The Company has also set aside an amount of R12.8 million (as at 31 March 2015) as a funding vehicle.
As this amount is not protected against its creditors, it has not been included as a Plan asset but rather as
cash and cash equivalents in note D.2.
Net expense recognised in profit or loss
GROUP AND COMPANY
Figures in Rand thousand 2015 2014
Current service cost 317 19 072
Interest cost 1 520 14 172
1 837 33 244
NOTES TO THE CONSOLIDATED ANNUAL FINANCIAL STATEMENTS (CONTINUED)For the year ended 31 March 2015

G. OTHER (continued)
G.3 RETIREMENT BENEFITS (continued)
Expense recognised in other comprehensive income
GROUP AND COMPANY
Figures in Rand thousand 2015 2014
Balance at 1 April 2014 (27 964) (71 957)
Actuarial gain recognised during the year 1 611 43 993
Balance at 31 March 2015 (26 353) (27 964)
Principal assumptions at the reporting date
GROUP AND COMPANY
Figures in Rand thousand 2015 2014
Discount rates used (%) 8.20 9.10
Healthcare cost inflation (%) 7.50 8.10
Average retirement age (years) 60 60
The assumptions used by actuaries are the best estimates chosen from a range of possible actuarial
assumptions which, due to the timescale covered, may not necessarily be borne out in practice.
Assumed healthcare cost trend rates have a significant effect on the amounts recognised. A one percentage
point change in assumed healthcare cost trend would have the following effects:
GROUP AND COMPANY
1% increase 1% decrease
Figures in Rand thousand 2015 2014 2015 2014
Effect on the aggregate current service and interest cost (311) (324) 247 259
Interest cost (2 728) (2 689) 2 205 2 186
(3 039) (3 013) 2 452 2 445
Expected contributions to post-employment benefit plans for the year ended 31 March 2016 are
R3.4 million.
Life Fund
GROUP AND COMPANY
Figures in Rand thousand 2015 2014
Balance at 1 April 2014 18 159 17 970
Actuarial loss recognised during the year 157 189
Balance at 31 March 2015 18 316 18 159
The company acquired a 100% shareholding in a cell captive with Guardrisk Life Ltd in September 2003 to
fund its obligation arising from 2002, whereby the company agreed to increase the minimum pension pay-
out to employees. Guardrisk performs a half yearly review per individual covered to establish the present
value of the company’s obligation on the prescribed valuation basis (as approved by Guardrisk Life Statutory
Actuaries) in order to assess the company’s commitment as per the assets and expressed liabilities and
ensure sufficient life funds are transferred to the non-distributable reserves.
CONSOLIDATED ANNUAL FINANCIAL
STATEMENTS 201557

AIRPORTS COMPANY SOUTH AFRICA58
G. OTHER (continued)
G.4 INVESTMENTS
GROUP AND COMPANY
Figures in Rand thousand 2015 2014
Current investments
Stanlib Income Fund 515 899 1 073 569
515 899 1 073 569
G.5 SHARE CAPITAL
Authorised – Group and Company
1 000 000 000 Ordinary shares of R1 par value each
Issued – Group and Company
Figures in Rand thousand 2015 2014
Ordinary 500 000 500 000
Share premium 250 000 250 000
750 000 750 000
G.6 OTHER RESERVES
GROUP
Figures in Rand thousand Total Fair value
Foreign currency
translation reserve
Actuarial losses
Balance at 1 April 2013 (204 355) (32 118) (120 428) (51 809)
Actuarial losses, net of tax 31 675 – – 31 675
Gain on revaluation of investment property 14 911 14 911 – –
Loss on remeasurement of financial instruments 11 033 11 033 – –
Foreign currency translation differences, net of tax 69 269 – 69 269 –
Balance at 31 March 2014 (77 467) (6 174) (51 159) (20 134)
Actuarial losses, net of tax 1 046 – – 1 046
Loss on remeasurement of financial instruments 42 832 42 832 – –
Foreign currency translation differences, net of tax 101 476 – 101 476 –
Balance at 31 March 2015 67 887 36 658 50 317 (19 088)
NOTES TO THE CONSOLIDATED ANNUAL FINANCIAL STATEMENTS (CONTINUED)For the year ended 31 March 2015

G. OTHER (continued)
G.6 OTHER RESERVES (continued)
COMPANY
Figures in Rand thousand Total Fair valueActuarial
losses
Balance at 1 April 2013 (83 928) (32 119) (51 809)
Restatement – prior period 146 140 146 140
Actuarial losses, net of tax 31 675 – 31 675
Gain on revaluation of investment property 14 911 14 911 –
Loss on remeasurement of financial instruments 11 033 11 033 –
Balance at 31 March 2014 119 831 139 965 (20 134)
Actuarial losses, net of tax 1 046 – 1 046
Loss on remeasurement of financial instruments 42 832 42 832 –
Balance at 31 March 2015 163 709 182 797 (19 088)
G.7 DEFERRED INCOME
Deferred income is made up of the following balances (for both Group and Company):
Figures in Rand thousand 2015 2014
Dube Trade Port rentals 27 060 28 149
Gautrain development 10 457 11 147
Government grants 28 628 32 982
Other 53 67
66 198 72 345
Gautrain Development relates to a grant received by the group in the 2009 financial year from the Gautrain
operator. Assets belonging to the Group, located at the O.R. Tambo International Airport’s central terminal
building are being used by the Gautrain operator. The assets will become the property of the Group at the
end of the 34-year term of the agreement with the operator.
Government grants
The Group and Company have been awarded a government grant. The grant of R35.1 million was received
in the 2010 financial year. The grant was used for the construction of the road within the Cape Town
International Airport precinct.
G.8 PROVISIONS
Accounting policy
A provision is recognised when the Group and Company has a present legal or constructive obligation
and it is probable that an outflow of economic benefits will be required to settle the obligation. Currently
the Group and Company provide for staff incentive bonuses. The provision for bonuses is payable within
three months of finalisation of the audited consolidated annual financial statements.
CONSOLIDATED ANNUAL FINANCIAL
STATEMENTS 201559
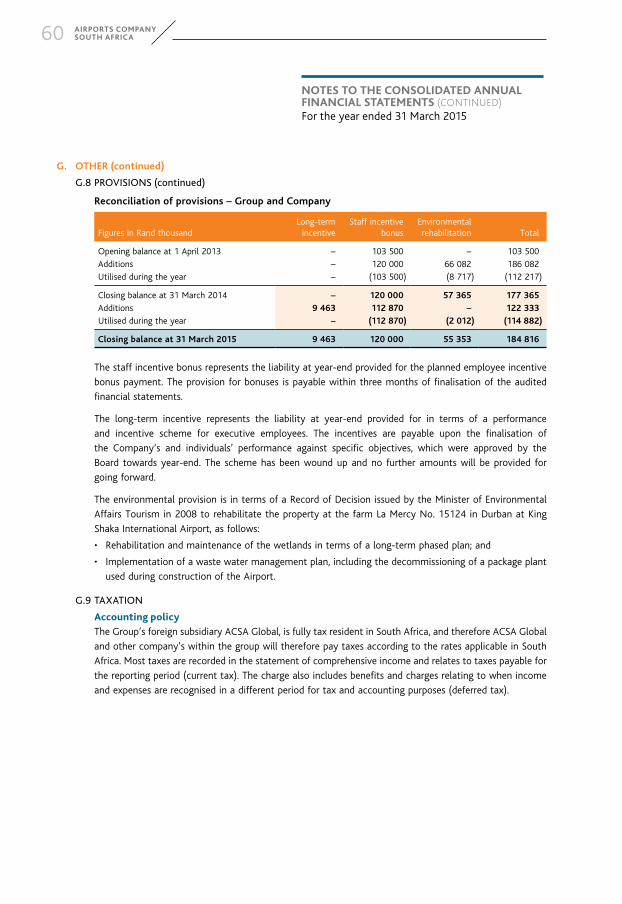
AIRPORTS COMPANY SOUTH AFRICA60
G. OTHER (continued)
G.8 PROVISIONS (continued)
Reconciliation of provisions – Group and Company
Figures in Rand thousandLong-term incentive
Staff incentive bonus
Environmental rehabilitation Total
Opening balance at 1 April 2013 – 103 500 – 103 500
Additions – 120 000 66 082 186 082
Utilised during the year – (103 500) (8 717) (112 217)
Closing balance at 31 March 2014 – 120 000 57 365 177 365
Additions 9 463 112 870 – 122 333
Utilised during the year – (112 870) (2 012) (114 882)
Closing balance at 31 March 2015 9 463 120 000 55 353 184 816
The staff incentive bonus represents the liability at year-end provided for the planned employee incentive
bonus payment. The provision for bonuses is payable within three months of finalisation of the audited
financial statements.
The long-term incentive represents the liability at year-end provided for in terms of a performance
and incentive scheme for executive employees. The incentives are payable upon the finalisation of
the Company’s and individuals’ performance against specific objectives, which were approved by the
Board towards year-end. The scheme has been wound up and no further amounts will be provided for
going forward.
The environmental provision is in terms of a Record of Decision issued by the Minister of Environmental
Affairs Tourism in 2008 to rehabilitate the property at the farm La Mercy No. 15124 in Durban at King
Shaka International Airport, as follows:
• Rehabilitation and maintenance of the wetlands in terms of a long-term phased plan; and
• Implementation of a waste water management plan, including the decommissioning of a package plant
used during construction of the Airport.
G.9 TAXATION
Accounting policy
The Group’s foreign subsidiary ACSA Global, is fully tax resident in South Africa, and therefore ACSA Global
and other company’s within the group will therefore pay taxes according to the rates applicable in South
Africa. Most taxes are recorded in the statement of comprehensive income and relates to taxes payable for
the reporting period (current tax). The charge also includes benefits and charges relating to when income
and expenses are recognised in a different period for tax and accounting purposes (deferred tax).
NOTES TO THE CONSOLIDATED ANNUAL FINANCIAL STATEMENTS (CONTINUED)For the year ended 31 March 2015

G. OTHER (continued)
G.9 TAXATION (continued)
Major components of the tax expense (income)
GROUP COMPANY
Figures in Rand thousand 2015 2014 2015 2014
Current
Current year 709 110 498 057 707 627 496 019
Prior period 22 961 (20 474) 22 961 (20 474)
732 071 477 583 730 588 475 545
Deferred
Current year (15 977) 113 105 (13 516) 78 759
716 094 590 688 717 072 554 304
Reconciliation of the tax expense
Reconciliation between applicable tax rate and average effective tax rate.
GROUP COMPANY
Figures in % 2015 2014 2015 2014
Applicable tax rate 28.00 28.00 28.00 28.00
Non-deductible expenses 0.14 0.07 0.12 0.26
Resolution on certain tax positions – – – –
CGT tax differential – (3.89) – (2.97)
Prior year adjustments 0.90 (0.98) 0.93 (0.98)
Other 2.33 2.45 (0.08) 1.94
31.37 25.65 28.97 26.25
The CGT rate differential is attributable to the taxes on the equity accounted profits.
G.10 EARNINGS PER SHARE AND DIVIDEND PER SHARE (GROUP ONLY)
Accounting policy
Basic earnings per share
Earnings per share is calculated using the weighted average number of ordinary shares in issue during the
period and is based on the net profit attributable to ordinary shareholders. For the purpose of calculating
earnings per share, treasury shares are deducted from the number of ordinary shares in issue.
Diluted earnings per share
Diluted EPS is calculated by adjusting the earnings and number of shares for the effects of dilutive options
and other dilutive potential ordinary shares. The effects of anti-dilutive potential ordinary shares are
ignored in calculating diluted EPS.
Diluted EPS is calculated by adjusting the earnings and number of shares for the effects of dilutive options
and other dilutive potential ordinary shares.
CONSOLIDATED ANNUAL FINANCIAL
STATEMENTS 201561

AIRPORTS COMPANY SOUTH AFRICA62
G. OTHER (continued)
G.10 EARNINGS PER SHARE AND DIVIDEND PER SHARE (GROUP ONLY) (continued)
Dividends per share
Dividends per share is calculated by using the total dividends paid out over an entire year (including
interim dividends but not including special dividends) divided by the number of outstanding ordinary
shares issued.
Figures in Rand thousand 2015 2014
Earnings per share
Total comprehensive income attributable to shareholders 1 566 579 1 712 454
Weighted average number of ordinary shares in issue 494 038 494 038
Basic earnings per share (c per share) 317.10 346.62
Dividend per share
Final dividend declared 296 423 97 925
Weighted average number of ordinary shares in issue 494 038 494 038
Dividend per share (c per share) 60.00 19.82
G.11 RELATED PARTIES
Airports Company South Africa Ltd is one of the 21 Schedule 2 major public entities in terms of the Public
Finance Management Act (Act No. 1 of 1999 as amended) and therefore falls within the national sphere
of government. As a consequence, Airports Company South Africa SOC Ltd has a significant number of
related parties that are public entities. In addition, the company has a related party relationship with its
subsidiaries, associates and with its directors and executive officers (key management). Unless specifically
disclosed, these transactions are concluded on an arm’s length basis and the Group and Company are
able to transact with any entity.
Related party transactions
Services rendered Services received Amounts due from Amounts due to
Figures in Rand thousand 2015 2014 2015 2014 2015 2014 2015 2014
National departments 32 110 35 140 5 321 278 2 312 1 364 – (48)
Constitutional institutions – – 93 35 – – – (32)
Major public entities 2 216 721 2 118 499 77 357 68 051 314 595 250 835 (157) (694)
Other national public entities 18 629 17 865 446 302 404 072 1 479 1 543 (2 339) (16 550)
Subsidiaries and joint ventures 105 943 44 480 – – 844 943 839 853 (3 577) –
NOTES TO THE CONSOLIDATED ANNUAL FINANCIAL STATEMENTS (CONTINUED)For the year ended 31 March 2015

G. OTHER (continued)
G.11 RELATED PARTIES (continued)
Remuneration
All executive directors and executive management are eligible for an annual performance bonus payment
linked to appropriate targets. During the current year, a liability for incentive bonus of R9 million
(2013: Rnill) was raised in terms of the performance management system for executive directors and
executive management. The structure of the individual bonus plans and awards is decided by the Board
through the Remuneration and Nomination Committee.
Executive
Salary Other benefits* Total
Figures in Rand thousand 2015 2014 2015 2014 2015 2014
B Maseko1 3 404 2 947 1 636 3 386 5 040 6 333
M Manyama2 2 749 2 149 1 593 233 4 342 2 382
6 153 5 096 3 229 3 619 9 382 8 715
1 Appointed 15 May 2013.
2 Appointed 1 April 2013.
* Other benefits comprise of retirement, medical benefits and cash bonuses.
Non-executive
Directors’ fees
Figures in Rand thousand Appointment date Resignation date 2015 2014
S Macozoma (Chairman, effective
1 March 2015) 1 March 2012 393 426
B Mabuza (resigned Chairman) 1 March 2012 28 February 2015 739 746
R Morar 1 January 2012 437 483
D Botha (fees payable to the PIC) 1 August 2013 471 285
BP Mabelane 1 August 2012 31 December 2014 247 212
T Ramano 1 March 2012 28 February 2015 357 358
J Lamola 1 December 2012 410 463
K Moroka 1 December 2012 260 325
B Luthuli 1 December 2012 333 335
C Mabude 1 December 2012 452 464
E Masilela 1 January 2012 31 July 2013 – 112
4 099 4 209
CONSOLIDATED ANNUAL FINANCIAL
STATEMENTS 201563

AIRPORTS COMPANY SOUTH AFRICA64
G. OTHER (continued)
G.11 RELATED PARTIES (continued)
Prescribed officers
Emoluments Other benefits* Total
Figures in Rand thousand 2015 2014 2015 2014 2015 2014
DA Cloete 2 020 1 659 986 2 043 3 006 3 702
PM du Plessis 1 992 1 688 818 2 026 2 810 3 714
H Jeena 2 251 1 917 973 2 268 3 224 4 185
TS Mekgoe 2 594 1 679 912 991 3 506 2 670
B Mbomvu (appointed
1 September 2013) 2 071 1 027 533 139 2 604 1 166
T Delomoney 1 873 1 567 943 1 677 2 816 3 244
JR Neville 160 2 130 939 2 368 1 099 4 498
G Vracar 35 1 488 734 1 583 769 3 071
YE Schoeman 1 758 1 496 823 968 2 581 2 464
A Vermeulen 2 274 1 608 929 1 226 3 203 2 834
S Mmakau (Chief information officer, appointed 1 October 2014) 1 000 – 7 – 1 007 –
B Pityi (General manager: O.R. Tambo International Airport, appointed 1 August 2014) 1 300 – – – 1 300 –
R Shinners (Group executive: Corporate Affairs, appointed 2 February 2015) 333 – – – 333 –
19 661 16 259 8 597 15 289 28 258 31 548
* Other benefits comprise of retirement, medical benefits and cash bonuses.
G.12 EVENTS AFTER THE REPORTING PERIOD
Equity injections (Aeroporto de Guarulhos Participações S.A.)
The group has made a further equity injection to the amount of R41.1 million to the Brazil investment
on 7 May 2015.
G.13 IRREGULAR EXPENDITURE
Irregular expenditure, defined in section 1 of the Public Finance Management Act (PFMA), 1999 as
“expenditure other than unauthorised expenditure, incurred in contravention of or that is not in
accordance with a requirement of any applicable legislation, including-
(a) this Act; or
(b) the State Tender Board Act, 1968 (Act No. 86 of 1968), or any regulations made in terms of that
Act; or
(c) any provincial legislation providing for procurement procedures in that provincial government.
NOTES TO THE CONSOLIDATED ANNUAL FINANCIAL STATEMENTS (CONTINUED)For the year ended 31 March 2015

G. OTHER (continued)
G.13 IRREGULAR EXPENDITURE (continued)
GROUP AND COMPANY
Figures in Rand thousand 2015 2014
Opening balance 140 906 32 832
Add: irregular expenditure – adjustment – 58 811
Add: irregular expenditure – current year 171 220 82 095
Less: amounts not recoverable (not condoned) – (32 832)
Irregular expenditure awaiting condonation 312 126 140 906
Current year 171 220 82 095
Prior years 82 095 –
Irregular expenditure – adjustment 58 811 58 811
Total 312 126 140 906
Details of irregular expenditure
Current year
The irregular expenditure identified in the current year relates to various incidents reported. These
incidents relate to contravention of the Supply Chain management policy and the Preferential
Procurement Policy Framework Act (PPPFA) and Regulations.
Prior year
R82 million in respect of goods and services whereby invoices were dated prior to the purchase order
dates. The matter is currently under investigation.
Irregular expenditure adjustment
The amount of R58 million relates to incidents that lead to irregular expenditure identified in the current
financial year, but the expenditure was incurred in the prior years. The prior opening balance has been
adjusted to reflect this amount.
G.14 FRUITLESS AND WASTEFUL EXPENDITURE
Section 1 of the PFMA defines fruitless and wasteful expenditure as “expenditure which was made in vain
and would have been avoided had reasonable care been exercised”.
Group and Company
Figures in Rand thousand 2015 2014
Opening balance 1 718 13 625
Add: fruitless and wasteful expenditure – current year 11 396 547
Add: fruitless and wasteful expenditure – adjustment – 1 171
Less: amounts recovered/written-off – (13 625)
Fruitless and wasteful expenditure not yet closed (awaiting appropriate action) 13 114 1 718
Current year 11 396 547
Prior years 547 –
Add: fruitless and wasteful expenditure – adjustment 1 171 1 171
Total 13 114 1 718
CONSOLIDATED ANNUAL FINANCIAL
STATEMENTS 201565

AIRPORTS COMPANY SOUTH AFRICA66
G. OTHER (continued)
G.14 FRUITLESS AND WASTEFUL EXPENDITURE (continued)
Details of fruitless and wasteful expenditure
Current year
The fruitless and wasteful expenditure identified in the current year relates to seven incidents reported.
These mainly related to;
1 losses in relation to cancelled tenders;
2 non-compliance to the Treasury Risk Management Policy Framework and the ACSA SCM Policy and
Procedure Manual, (ie by not properly managing the foreign exchange risk by taking a forward cover);
and
3 Competition Commission penalty – price-fixing in the market for the supply of parking bays to car
rental companies at O.R. Tambo International Airport and Gautrain stations.
Prior year
R0.5 million in respect of not returning and/or demanding a refund on non-functional equipment.
A disciplinary hearing was held and a final written warning issued to the employee in question.
Forfeiture of deposit of R0.05 million for conferencing facilities due to cancellation of booking.
The R1.1 million relates to interest on the underpayment of provisional tax.
G.15 PRIOR PERIOD ERRORS
G.15.1 Depreciation
In the 2015 financial year, it was discovered that the financial accounting system was not
correctly configured to pro-rate depreciation and amortisation on assets acquired during the
course of the current and prior financial years. The restatement indicated below has been done
to correct that error. The system configuration has since been corrected during April 2015.
The correction of this prior period error affects both the Group’s and Company’s results, and
has been applied retrospectively.
G.15.2 Deferred tax
Deferred tax relating to equity accounted earnings for associates and Joint ventures had been
omitted from the Group consolidation, resulting in an understatement of the deferred tax
expense and liability.
The correction of this prior period error affects both only Group’s results, and has been applied
retrospectively.
G.15.3 Investment properties
One of the Company’s investment properties at O.R. Tambo International Airport was incorrectly
classified as property and equipment.
The correction of this prior period error affects only the Company’s results, and has been applied
retrospectively.
NOTES TO THE CONSOLIDATED ANNUAL FINANCIAL STATEMENTS (CONTINUED)For the year ended 31 March 2015

G. OTHER (continued)
G.15 PRIOR PERIOD ERRORS (continued)
G.15.3 Investment properties (continued)
The prior year adjustments for both depreciation and deferred tax is outlined on the table below:
GROUP COMPANY
Figures in Rand thousand 2014 2013 2014 2013
Depreciation
Previously stated 1 402 510 1 411 433 1 398 510 1 407 473
Restatement due to error 10 155 9 526 10 155 9 526
Restatement due to investment properties – – (274) (274)
Restated amount 1 412 665 1 420 959 1 408 391 1 416 725
Retained earnings
Previously stated 12 055 313 10 437 027 10 930 489 9 487 940
Restatement due to depreciation error (70 104) (62 789) (70 104) (62 794)
Restatement due to investment properties – – 162 150 138 827
Restatement due to associates (33 702) (37 260) – –
Restated amount 11 951 507 10 336 978 11 022 535 9 563 973
Deferred tax liability
Previously stated 1 119 446 943 926 913 011 814 286
Restatement due to depreciation (27 263) (24 419) (27 263) (24 419)
Restatement due to error – associates 33 777 36 954 – –
Restatement due to error – investment properties – – 62 932 57 573
Restated amount 1 125 960 956 461 948 680 847 440
Income tax expense
Previously stated 597 086 649 970 551 864 654 928
Tax effect of restatements (6 398) 22 208 2 440 (2 591)
Restated amount 590 688 672 178 554 304 652 337
Investment properties
Previously stated 3 275 949 2 991 127 2 547 959 2 263 137
Restated – – 375 246 346 916
3 275 949 2 991 127 2 923 205 2 610 053
CONSOLIDATED ANNUAL FINANCIAL
STATEMENTS 201567

AIRPORTS COMPANY SOUTH AFRICA68
G. OTHER (continued)
G.16 CHANGE IN ESTIMATE
The results of Airports Company South Africa Global Limited, a 100% owned subsidiary of the Group,
were finalised after those of the Group in the financial years up to and including 31 March 2013. As a
result, the effects of finalisations of that entity’s results were not consolidated in the relevant year. The
effect of this has been adjusted for prospectively in the 2015 consolidated annual financial statements,
as a change in estimate, as the prior year consolidated annual financial statements were prepared using
information that was available at the time.
The effect of the change in estimate had an impact on the following line items:
GROUP
Figures in Rand thousand 2015
Deferred tax expense 39 741
Other income (9 904)
Operating expenses (620)
Impact on profit before tax 29 217
Foreign currency translation reserve (27 715)
Income tax liabilities (4 796)
Deferred tax liabilities 3 294
Impact on net assets (29 217)
G.17 CONTINGENCIES
Contingent assets
An amount of R15 million for penalties is currently being disputed by a customer with Airports Company
South Africa. The recoverability of the amount is more likely to occur than not to occur pending the
outcome of negotiations with the customer, and at the date of this report it was not resolved. Legal
proceedings have been instituted against the customer.
Contingent liabilities
Nedbank has provided guarantees of R14.6 million to Airports Company South Africa SOC Limited.
Contingencies relating to interests in joint ventures
There are no contingencies relating to interests in joint ventures.
NOTES TO THE CONSOLIDATED ANNUAL FINANCIAL STATEMENTS (CONTINUED)For the year ended 31 March 2015

ANNEXURE 1Reconciliation of Regulatory asset base (RAB) to IFRS asset carrying amount
The property and equipment values used by the Regulator in determining the tariffs which the group may charge for
aeronautical services are not based on IFRS principles, and as such are lower due to different recognition principles
such as opportunity cost of assets, work-in-progress and some historical disallowances. This however does not give
rise to the property and equipment items being impaired due to the permanent nature of those differences not
having a material impact on returns.
2015 2014
Figures in Rand thousandCost/
fair valueAccumulated depreciation
Carrying amount
Cost/fair value
Accumulated depreciation
Carrying amount
Property and equipment 28 695 755 (9 553 257) 19 142 498 27 976 068 (8 264 565) 19 711 503
Investment property 3 693 480 – 3 693 480 3 275 949 – 3 275 949
Intangible assets 603 627 (547 970) 55 657 585 063 (474 455) 110 608
Total IFRS carrying amount 32 992 862 (10 101 227) 22 891 635 31 837 080 (8 739 020) 23 098 060
Regulatory asset base (RAB)
IFRS restatement of specialised assets (2 558 366) 1 244 000 (1 314 366) (2 642 990) 1 088 000 (1 554 990)
Work in progress exclusion (1 205 000) – (1 205 000) (1 185 000) – (1 185 000)
Disallowed capex (1 076 000) 297 000 (779 000) (1 076 000) 234 000 (842 000)
Revaluation of investment properties exclusion (1 939 000) – (1 939 000) (1 494 000) – (1 494 000)
Dube Tradeport sale of land 540 000 – 540 000 540 000 – 540 000
Restatement – – – 98 000 98 000
Total adjustments for RAB (6 238 366) 1 541 000 (4 697 366) (5 857 990) 1 420 000 (4 437 990)
Regulatory asset base 26 754 496 (8 560 227) 18 194 269 25 979 090 (7 319 020) 18 660 070
CONSOLIDATED ANNUAL FINANCIAL
STATEMENTS 201569

AIRPORTS COMPANY SOUTH AFRICA70
NOTES

CONSOLIDATED ANNUAL FINANCIAL
STATEMENTS 2015

AIRPORTS COMPANY SOUTH AFRICA72
NOTES

1 0 4 3

www.airports.co.za