Embed Size (px)
Citation preview

AFRL-RX-WP-JA-2014-0232
CHARACTERIZATION OF DEGRADATION USING
REFLECTANCE SPECTROSCOPY (POSTPRINT)
A. K. Criner
University of Dayton Research Institute
A. J. Cherry
Southwestern Ohio Council for Higher Education
T. D. Katter
Universal Technologies Corporation
A. T. Cooney
AFRL/RXCA
AUGUST 2013
Interim Report
Distribution A. Approved for public release; distribution unlimited.
See additional restrictions described on inside pages
STINFO COPY
© 2014 AIP Publishing LLC
AIR FORCE RESEARCH LABORATORY
MATERIALS AND MANUFACTURING DIRECTORATE
WRIGHT-PATTERSON AIR FORCE BASE, OH 45433-7750
AIR FORCE MATERIEL COMMAND
UNITED STATES AIR FORCE

NOTICE AND SIGNATURE PAGE
Using Government drawings, specifications, or other data included in this document for any
purpose other than Government procurement does not in any way obligate the U.S. Government.
The fact that the Government formulated or supplied the drawings, specifications, or other data
does not license the holder or any other person or corporation; or convey any rights or
permission to manufacture, use, or sell any patented invention that may relate to them.
Copies may be obtained from the Defense Technical Information Center (DTIC)
(http://www.dtic.mil).
AFRL-RX-WP-JA-2014-0232 HAS BEEN REVIEWED AND IS APPROVED FOR
PUBLICATION IN ACCORDANCE WITH ASSIGNED DISTRIBUTION STATEMENT.
//Signature// //Signature//
JOHN T. WELTER, Project Engineer STEPHAN M. RUSS, Chief
Materials State Awareness & Supportability Branch Materials State Awareness & Supportability Branch
Structural Materials Division Structural Materials Division
//Signature//
ROBERT T. MARSHALL, Deputy Chief
Structural Materials Division
Materials and Manufacturing Directorate
This report is published in the interest of scientific and technical information exchange, and its
publication does not constitute the Government’s approval or disapproval of its ideas or findings.

REPORT DOCUMENTATION PAGE Form Approved
OMB No. 074-0188 Public reporting burden for this collection of information is estimated to average 1 hour per response, including the time for reviewing instructions, searching existing data sources, gathering and maintaining the data needed, and completing and reviewing this collection of information. Send comments regarding this burden estimate or any other aspect of this collection of information, including suggestions for reducing this burden to Defense, Washington Headquarters Services, Directorate for Information Operations and Reports, 1215 Jefferson Davis Highway, Suite 1204, Arlington, VA 22202-4302. Respondents should be aware that notwithstanding any other provision of law, no person shall be subject to any penalty for failing to comply with a collection of information if it dows not display a currently valid OMB control number. PLEASE DO NOT RETURN YOUR FORM TO THE ABOVE ADDRESS.
1. REPORT DATE (DD-MM-YYYY)
August 2013 2. REPORT TYPE
Interim 3. DATES COVERED (From – To)
25 June 2009 – 21 July 2013
4. TITLE AND SUBTITLE
CHARACTERIZATION OF DEGRADATION USING REFLECTANCE
SPECTROSCOPY (POSTPRINT)
5a. CONTRACT NUMBER
FA8650-09-D-5224-0001 5b. GRANT NUMBER
5c. PROGRAM ELEMENT NUMBER
62102F
6. AUTHOR(S)
(see back) 5d. PROJECT NUMBER
4347 5e. TASK NUMBER
5f. WORK UNIT NUMBER
X0SU
7. PERFORMING ORGANIZATION NAME(S) AND ADDRESS(ES)
(see back)
8. PERFORMING ORGANIZATION REPORT NUMBER
9. SPONSORING / MONITORING AGENCY NAME(S) AND ADDRESS(ES)
Air Force Research Laboratory
Materials and Manufacturing Directorate
Wright Patterson Air Force Base, OH 45433-7750
Air Force Materiel Command
United States Air Force
10. SPONSOR/MONITOR’S ACRONYM(S)
AFRL/RXCA
11. SPONSOR/MONITOR’S REPORT NUMBER(S)
AFRL-RX-WP-JA-2014-0232
12. DISTRIBUTION / AVAILABILITY STATEMENT
Distribution A. Approved for public release; distribution unlimited. This report contains color. 13. SUPPLEMENTARY NOTES
Journal article published in AIP Conf. Proc. 1581, 1594-1602 (2014) © 2014 AIP Publishing LLC 978-7354-1211-8.
The U.S. Government is joint author of the work and has the right to use, modify, reproduce, release, perform, display
or disclose the work. The final publication is available at doi: 10.1063/1.4865014. If authorized, also see also
AFRL-RX-WP-TR-2014-0218. 14. ABSTRACT
A semi-classical model of the reflectance of a complex material is modeled. Model selection techniques using this
reflectance model are developed to detect molecular vibration modes measured using infrared spectroscopy. An
inverse problem methodology is then used to ascertain the underlying vibrational modes associated with varying
concentrations of different chemical species. These two techniques are developed to characterize the extent of
material degradation through the detection of spectra associated with the chemical processes underlying the
degradation process. These methods are validated using data from samples of ceramic matrix composites. The
samples considered were exposed to varying amounts of thermal treatment to ascertain the effectiveness of these
methods to detect degradation.
15. SUBJECT TERMS
resolution, eddy current, mechanical, permanent magnet 16. SECURITY CLASSIFICATION OF: 17. LIMITATION
OF ABSTRACT
SAR
18. NUMBER OF PAGES
13
19a. NAME OF RESPONSIBLE PERSON (Monitor)
John T. Welter a. REPORT Unclassified
b. ABSTRACT Unclassified
c. THIS PAGE
Unclassified 19b. TELEPHONE NUBER (include area code)
(937) 255-9798
Standard Form 298 (Rev. 2-89) Prescribed by ANSI Std. Z39-18

REPORT DOCUMENTATION PAGE Cont’d
6. AUTHOR(S)
A. K. Criner
University of Dayton Research Institute
A. J. Cherry
Southwestern Ohio Council for Higher Education
T. D. Katter
Universal Technologies Corporation
A. T. Cooney
AFRL/RXCA
7. PERFORMING ORGANIZATION NAME(S) AND ADDRESS(ES)
University of Dayton Research Institute
Structural Integrity Division
300 College Park Drive
Dayton OH 45469
Southwestern Ohio Council for Higher Education
Dayton, OH 45420
Universal Technologies Corporation
Dayton, OH 45432
AFRL/RXCA
Air Force Research Laboratory
Materials and Manufacturing Directorate
Wright-Patterson Air Force Base, OH 45433-7750
Standard Form 298 (Rev. 8-98)
Prescribed by ANSI Std. Z39-18

Characterization of Degradation Using ReflectanceSpectroscopy
A. K. Criner∗, A.J. Cherry†, A.T. Cooney,∗∗ and T.D. Katter‡
∗University of Dayton Research Institute, Dayton, OH 45469, USA†Southwestern Ohio Council for Higher Education, Dayton, OH 45420, USA
∗∗Materials State Awareness & Supportability Branch, Air Force Research Laboratory, WPAFB 45433, USA‡Universal Technologies Corporation, Dayton, OH 45432, USA
Abstract. A semi-classical model of the reflectance of a complex material is modeled. Model selection techniques usingthis reflectance model are developed to detect molecular vibration modes measured using infrared spectroscopy. An inverseproblem methodology is then used to ascertain the underlying vibrational modes associated with varying concentrations ofdifferent chemical species. These two techniques are developed to characterize the extent of material degradation through thedetection of spectra associated with the chemical processes underlying the degradation process. These methods are validatedusing data from samples of ceramic matrix composites. The samples considered were exposed to varying amounts of thermaltreatment to ascertain the effectiveness of these methods to detect degradation.
Keywords: Reflectance Spectroscopy, Optical Constants, Fourier Infrared Spectroscopy, Data Analysis
INTRODUCTION
Evaluation of ceramic matrix composites is the main motivation for this study, however, we hope that these methodsor methods like these could eventually be applied to other materials. Degradation due to oxidation takes place inceramic matrix composite before an actual damage occurs. This degradation causes these materials to become brittlewhich leads to catastrophic failure.
Ceramic matrix composite have a multiscale geometry which causes exact modeling of the components to benonviable. The mesoscale structure includes tows which are woven into cross plies through the matrix; this is on the1 mm scale. The tows are composed of fiber bundles which are on the scale of 100 μm. An approximate descriptionis depicted in Figure 1. The degradation that we are concerned with occurs at the scale of the individual fibers (∼10nm), see Figure 2. For nondestructive evaluation applications, the exact geometry is not available a priori, would betoo computationally intensive to include in models, and is not of primary interest. Models of very different forms canbe deduced from various and assorted assumptions though none of these can expected to be exact [1]. In our analysis,we used model selection results to make data driven choices between two models that we used to analyze the data.
A further complication in this problem is related to nature of the degradation that we seek to characterize. At hightemperatures, air causes the formation of oxides in ceramic matrix composites. This oxidation at small levels (beforeit is observable by most other methods) causes the material to be brittle [2]. The degradation can be observed bytransmission electron microscopy and electron energy loss spectroscopy [3]. These methods are not capable of in fieldinspection so we seek a method that could be performed in field. Fourier transform infrared (FTIR) devices have beendeveloped with in field inspection capabilities [4].
Spectroscopy is a very common technique in many fields. It is a ubiquitous tool in control processes in thefood production, medicine and petroleum production, to name a few [4]. It is also used in detection in chemistryand astronomy [5]. Many of the fields consider applications where Beer’s law applies which allows the data to betransformed to a linear model. In these cases, all the techniques for linear models may be applied such as PCA andPLS [6, 7]. These techniques can be used for data from nonlinear models however the results will not correspond to aphysically meaningful quantity which is our goal. To obtain inference about small chemical changes, we use an inverseproblem model based approach on the data that we collected.
40th Annual Review of Progress in Quantitative Nondestructive EvaluationAIP Conf. Proc. 1581, 1594-1602 (2014); doi: 10.1063/1.4865014
© 2014 AIP Publishing LLC 978-7354-1211-8/$30.00
1594 This article is copyrighted as indicated in the article. Reuse of AIP content is subject to the terms at: http://scitation.aip.org/termsconditions. Downloaded to IP:
132.174.255.176 On: Fri, 09 Jan 2015 14:20:08
1 Distribution A. Approved for public release; distribution unlimited.

FIGURE 1. An example diagram of the multiscale geometry of ceramic matrix composites.
SiC fiber
BN
matrix
SiO2
Air
40 nm
Air
FIGURE 2. Diagram of the degradation.
EXPERIMENTAL DESCRIPTION
IR spectroscopy was performed on silicon nitride carbon based CMC samples before and after heat treatment. MIRmeasurements were made using a Bruker Vertex 80v FTIR attached to a Harrick Omni-Spec probe. The probe madesurface contact where 45-degree reflection measurements were collected and compared to a mirror reference. Thesamples were 15.7 x 1.3 x 0.2 cm in dimension. Each sample was divided along its length into 11 blocks of equal area.Prior to measuring a sample, reference intensity data was obtained, and then an intensity measurement was collectedin the approximate center of each of the 11 blocks. This procedure was considered one trial, and was repeated for thesecond and third trials. The reflectance data was calculated as the ratio of the intensity measurement from the sampleto the intensity measurement of the reference.
1595 This article is copyrighted as indicated in the article. Reuse of AIP content is subject to the terms at: http://scitation.aip.org/termsconditions. Downloaded to IP:
132.174.255.176 On: Fri, 09 Jan 2015 14:20:08
2 Distribution A. Approved for public release; distribution unlimited.
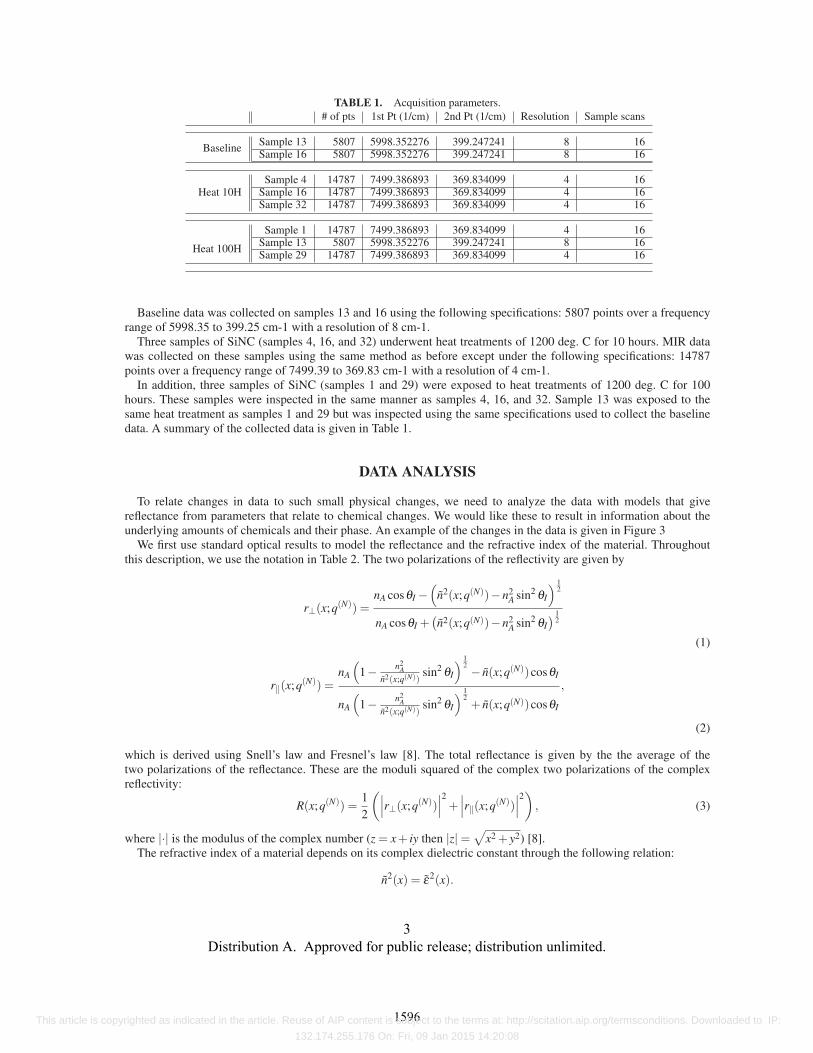
TABLE 1. Acquisition parameters.
# of pts 1st Pt (1/cm) 2nd Pt (1/cm) Resolution Sample scans
BaselineSample 13 5807 5998.352276 399.247241 8 16Sample 16 5807 5998.352276 399.247241 8 16
Heat 10HSample 4 14787 7499.386893 369.834099 4 16
Sample 16 14787 7499.386893 369.834099 4 16Sample 32 14787 7499.386893 369.834099 4 16
Heat 100H
Sample 1 14787 7499.386893 369.834099 4 16Sample 13 5807 5998.352276 399.247241 8 16Sample 29 14787 7499.386893 369.834099 4 16
Baseline data was collected on samples 13 and 16 using the following specifications: 5807 points over a frequencyrange of 5998.35 to 399.25 cm-1 with a resolution of 8 cm-1.
Three samples of SiNC (samples 4, 16, and 32) underwent heat treatments of 1200 deg. C for 10 hours. MIR datawas collected on these samples using the same method as before except under the following specifications: 14787points over a frequency range of 7499.39 to 369.83 cm-1 with a resolution of 4 cm-1.
In addition, three samples of SiNC (samples 1 and 29) were exposed to heat treatments of 1200 deg. C for 100hours. These samples were inspected in the same manner as samples 4, 16, and 32. Sample 13 was exposed to thesame heat treatment as samples 1 and 29 but was inspected using the same specifications used to collect the baselinedata. A summary of the collected data is given in Table 1.
DATA ANALYSIS
To relate changes in data to such small physical changes, we need to analyze the data with models that givereflectance from parameters that relate to chemical changes. We would like these to result in information about theunderlying amounts of chemicals and their phase. An example of the changes in the data is given in Figure 3
We first use standard optical results to model the reflectance and the refractive index of the material. Throughoutthis description, we use the notation in Table 2. The two polarizations of the reflectivity are given by
r⊥(x;q(N)) =nA cosθI −
(n2(x;q(N))−n2
A sin2 θI
) 12
nA cosθI +(n2(x;q(N))−n2
A sin2 θI) 1
2
(1)
r‖(x;q(N)) =nA
(1− n2
An2(x;q(N))
sin2 θI
) 12 − n(x;q(N))cosθI
nA
(1− n2
An2(x;q(N))
sin2 θI
) 12+ n(x;q(N))cosθI
,
(2)
which is derived using Snell’s law and Fresnel’s law [8]. The total reflectance is given by the the average of thetwo polarizations of the reflectance. These are the moduli squared of the complex two polarizations of the complexreflectivity:
R(x;q(N)) =1
2
(∣∣∣r⊥(x;q(N))∣∣∣2 +
∣∣∣r‖(x;q(N))∣∣∣2), (3)
where |·| is the modulus of the complex number (z = x+ iy then |z|=√
x2 + y2) [8].The refractive index of a material depends on its complex dielectric constant through the following relation:
n2(x) = ε2(x).
1596 This article is copyrighted as indicated in the article. Reuse of AIP content is subject to the terms at: http://scitation.aip.org/termsconditions. Downloaded to IP:
132.174.255.176 On: Fri, 09 Jan 2015 14:20:08
3 Distribution A. Approved for public release; distribution unlimited.

600 700 800 900 1000 1100 1200 1300 14000
0.1
0.2
0.3
0.4
x cm−1
Reflecta
nce
data
Example Data
0 H10 H100 H
FIGURE 3. Example data from randomly selected data sets.
TABLE 2. Notation.Symbol Parameter Value
θI Incident angle of beam 45 degrees
nA Refractive index of surroundings 1
x Wave number Dependent variable, varies from 400−1400 cm−1
ε Dielectric constant or permittivity (complex number) Varies with wave number
n Refractive index of material (complex number) Depends on εR⊥ Perpendicular polarization reflectance Depends on n, Snell/Fresnel
R‖ Parallel polarization reflectance Depends on n, Snell/Fresnel
R Total Reflectance Average of R⊥ and R‖
We model the dielectric constant as a function which is based on assumptions about molecular motions. There havebeen many models proposed for the dielectric constant which vary regarding form, and number of variables. We willfocus on models that use springs (or oscillators) to model molecular vibrations. We will denote ε(x) the complexdielectric function with real and imaginary parts ε1 and ε2, respectively,
ε(x) = ε1(x)+ iε2(x). (4)
The dielectric constant has dependent variable wave number x cm−1. The classical oscillator model is given by
ε(x) = ε∞ +N
∑j=1
A j
(ω2j − x2)− iΓ jx
, (5)
where N is the number of oscillators, ω j is the resonant frequency, Γ j is the broadening, and A j is the product of thestrength and the number of molecules of that oscillator type. This is known as the Lorentz model in dispersion analysis
1597 This article is copyrighted as indicated in the article. Reuse of AIP content is subject to the terms at: http://scitation.aip.org/termsconditions. Downloaded to IP:
132.174.255.176 On: Fri, 09 Jan 2015 14:20:08
4 Distribution A. Approved for public release; distribution unlimited.
and is most appropriate for crystalline systems where the environment is the same for oscillators of the same kind [9].Efimov proposed a model where the resonant frequency is normally distributed and broadening is the same for all theoscillators [1]. When the standard deviation is much larger than the broadening, this model can be approximated by
ε2(x) =N
∑j=1
A j√2πΔω j
e− 1
2
(x−ω0 j
Δω j
)2
(6)
ε1(x) = ε∞ +H.T.ε2(x),
where H.T. refers to the Hilbert transform [10, 9].We analyzed our data sets with these two models. For N ∈ {1,2,3, . . .20}, we estimated the parameters in the above
models by minimizing the residual sum of squares. We used Aikake information criterion to choose between Lorentzand Gaussian models. For almost all data sets and oscillator numbers, the curve fit was better for the Gauss model thanthe Lorentz model. We present the results for Gaussian model in the remainder of this manuscript [11].
RESULTS
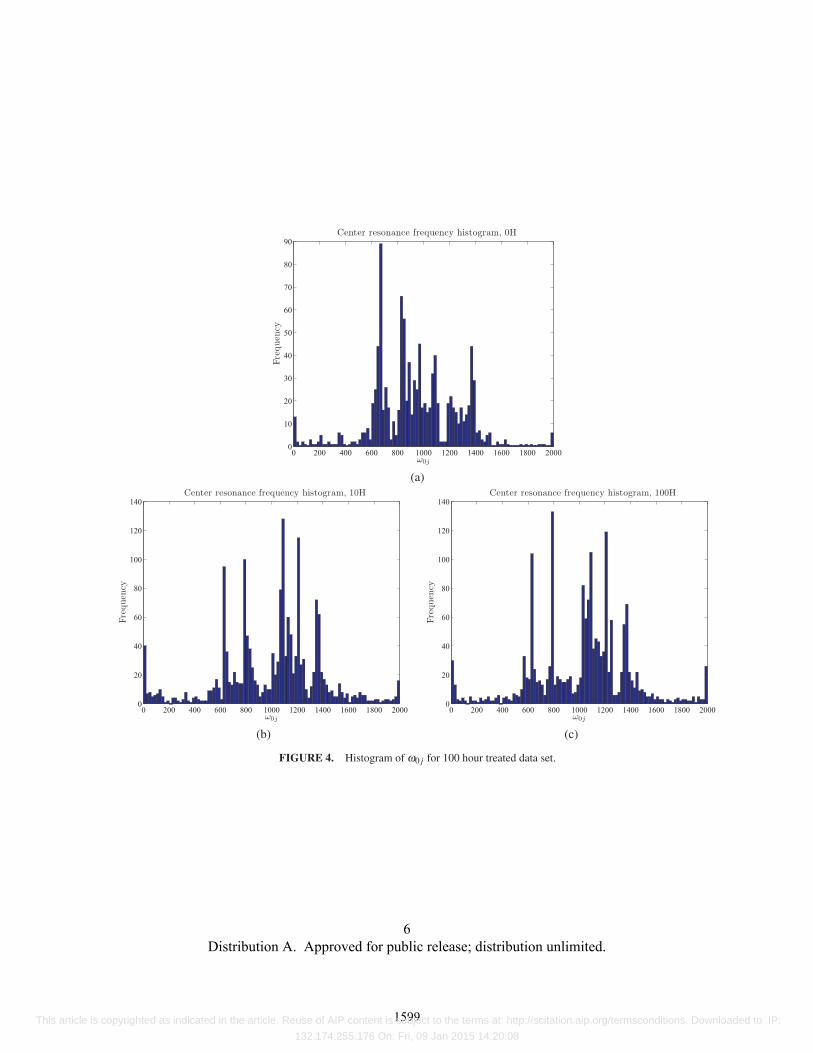
The models that we chose do not appear to fit the data especially well. Indications of this were observed in poorfits of the curves, many local minima which caused the minimization of the residual sum of squares to be difficult (weused implicit filtering [12]), and the large variation in parameter fits across (a) samples, (b) locations and (c) trials. Wehave presented histograms of the estimated parameters in Figures 4-6 (a)-(c). There is a large variation of the estimatedparameters for all of the estimated parameters. Often in spectroscopy, the estimated resonant frequencies (ω0 j’s) areused to identify chemical species and the amplitudes (A j’s) are used to determine the amount. In Figures 4 (a)-(c), wesee that there are regions of concentration of resonant frequencies but exactly how many there are is not discernible.There does appear to be a change in resonant frequency between the baseline samples (in Figure 4(a)), and the treatedsamples. The randomness of these make the exact differences difficult to discern and impossible to relate to exactchemical phases. There is a large variation in the estimates of the parameters A j and Δω j though there are less regionsof high concentrations as in the estimates of ω0 j.
FUTURE WORK
The results of the our data analysis did indicate differences between the different treatment levels. The apparentrandomness of the estimates themselves hindered interpretation of these changes. There could be several causes ofthis issue. We could be fitting model discrepancy with extra oscillators. We will first try to relax the assumption thatΓ j >> Δω j that we made in going from the Efimov model to the Gaussian model (6) (as in [9]). This model has beenvalidated for different kinds of glass which leads us to believe it will fit our data better and give us easier to interpretresults.
ACKNOWLEDGMENTS
The authors would like to thank their colleagues for discussion and guidance. This work was funded by the US AirForce through the following grants FA8650-09-D-5224 and FA8650-09-2-5800.
1598 This article is copyrighted as indicated in the article. Reuse of AIP content is subject to the terms at: http://scitation.aip.org/termsconditions. Downloaded to IP:
132.174.255.176 On: Fri, 09 Jan 2015 14:20:08
5 Distribution A. Approved for public release; distribution unlimited.
0 200 400 600 800 1000 1200 1400 1600 1800 20000
10
20
30
40
50
60
70
80
90Center resonance frequency histogram, 0H
Fre
quency
ω0j
(a)
0 200 400 600 800 1000 1200 1400 1600 1800 20000
20
40
60
80
100
120
140
ω0j
Fre
quency
Center resonance frequency histogram, 10H
0 200 400 600 800 1000 1200 1400 1600 1800 20000
20
40
60
80
100
120
140
ω0j
Fre
quency
Center resonance frequency histogram, 100H
(b) (c)
FIGURE 4. Histogram of ω0 j for 100 hour treated data set.
1599 This article is copyrighted as indicated in the article. Reuse of AIP content is subject to the terms at: http://scitation.aip.org/termsconditions. Downloaded to IP:
132.174.255.176 On: Fri, 09 Jan 2015 14:20:08
6 Distribution A. Approved for public release; distribution unlimited.

−10 −9 −8 −7 −6 −5 −4 −3 −2 −1 0 1 20
20
40
60
80
100
120
log10
Aj
Fre
quency
Amplitude histogram, 0H
(a)
−8 −7 −6 −5 −4 −3 −2 −1 0 1 2 3 40
10
20
30
40
50
60
70
80
90
100
log10
Aj
Fre
quency
Amplitude histogram, 10H
−10 −9 −8 −7 −6 −5 −4 −3 −2 −1 0 1 2 3 40
20
40
60
80
100
120
log10
Aj
Fre
quency
Amplitude histogram, 100H
(b) (c)
FIGURE 5. Histogram of log10 A j for 100 hour treated data set.
1600 This article is copyrighted as indicated in the article. Reuse of AIP content is subject to the terms at: http://scitation.aip.org/termsconditions. Downloaded to IP:
132.174.255.176 On: Fri, 09 Jan 2015 14:20:08
7 Distribution A. Approved for public release; distribution unlimited.

0.5 0.75 1 1.25 1.5 1.75 2 2.25 2.5 2.75 3 3.25 3.50
10
20
30
40
50
60
log10
Δωj
Fre
quency
Standard deviation histogram, 0H
(a)
0.5 0.75 1 1.25 1.5 1.75 2 2.25 2.5 2.75 3 3.25 3.50
50
100
150
200
250
log10
Δωj
Fre
quency
Standard deviation histogram, 10H
0.5 1 1.5 2 2.5 3 3.50
50
100
150
200
250
log10
Δωj
Fre
quency
Standard deviation histogram, 100H
(b) (c)
FIGURE 6. Histogram of Δω j for 100 hour treated data set.
1601 This article is copyrighted as indicated in the article. Reuse of AIP content is subject to the terms at: http://scitation.aip.org/termsconditions. Downloaded to IP:
132.174.255.176 On: Fri, 09 Jan 2015 14:20:08
8 Distribution A. Approved for public release; distribution unlimited.

REFERENCES
1. A. Efimov, Optical Constants of Inorganic Glasses, Laser and Optical Science and Technology Series, CRC Press, 1995.2. F. E. Heredia, J. C. McNulty, F. W. Zok, and A. G. Evans, Journal of the American Ceramic Society 78, 2097–2100 (1995).3. B. W. Sheldon, E. Y. Sun, S. R. Nutt, and J. J. Brennan, Journal of the American Ceramic Society 79, 539–543 (1996).4. R. Mukhopadhyay, Analytical Chemistry 76, 369–A (2004).5. P. Griffiths, and J. A. De Haseth, Fourier transform infrared spectrometry, vol. 171, John Wiley & Sons, 2007.6. L. Norgaard, A. Saudland, J. Wagner, J. Nielsen, L. Munck, and S. Engelsen, Applied Spectroscopy 54, 413–419 (2000).7. Analytica Chimica Acta 635, 45 – 52 (2009).8. D. Griffiths, Introduction to Electrodynamics, Prentice-Hall, Inc, 1999, 3rd edn.9. S. A. MacDonald, C. R. Schardt, D. J. Masiello, and J. H. Simmons, Journal of non-crystalline solids 275, 72–82 (2000).10. C. Keefe, Journal of molecular spectroscopy 205, 261–268 (2001).11. H. Akaike, Automatic Control, IEEE Transactions on 19, 716 – 723 (1974).12. C. Kelley, Implicit Filtering, Software, Environments and Tools, Society for Industrial and Applied Mathematics, 2011.
1602 This article is copyrighted as indicated in the article. Reuse of AIP content is subject to the terms at: http://scitation.aip.org/termsconditions. Downloaded to IP:
132.174.255.176 On: Fri, 09 Jan 2015 14:20:08
9 Distribution A. Approved for public release; distribution unlimited.