Embed Size (px)
Citation preview
Q3 ‘19 Presentation to Investors and Analysts
PRESENTATION OUTLINE
3
7
10
14
18

OVERVIEW
Core Values
Excellence
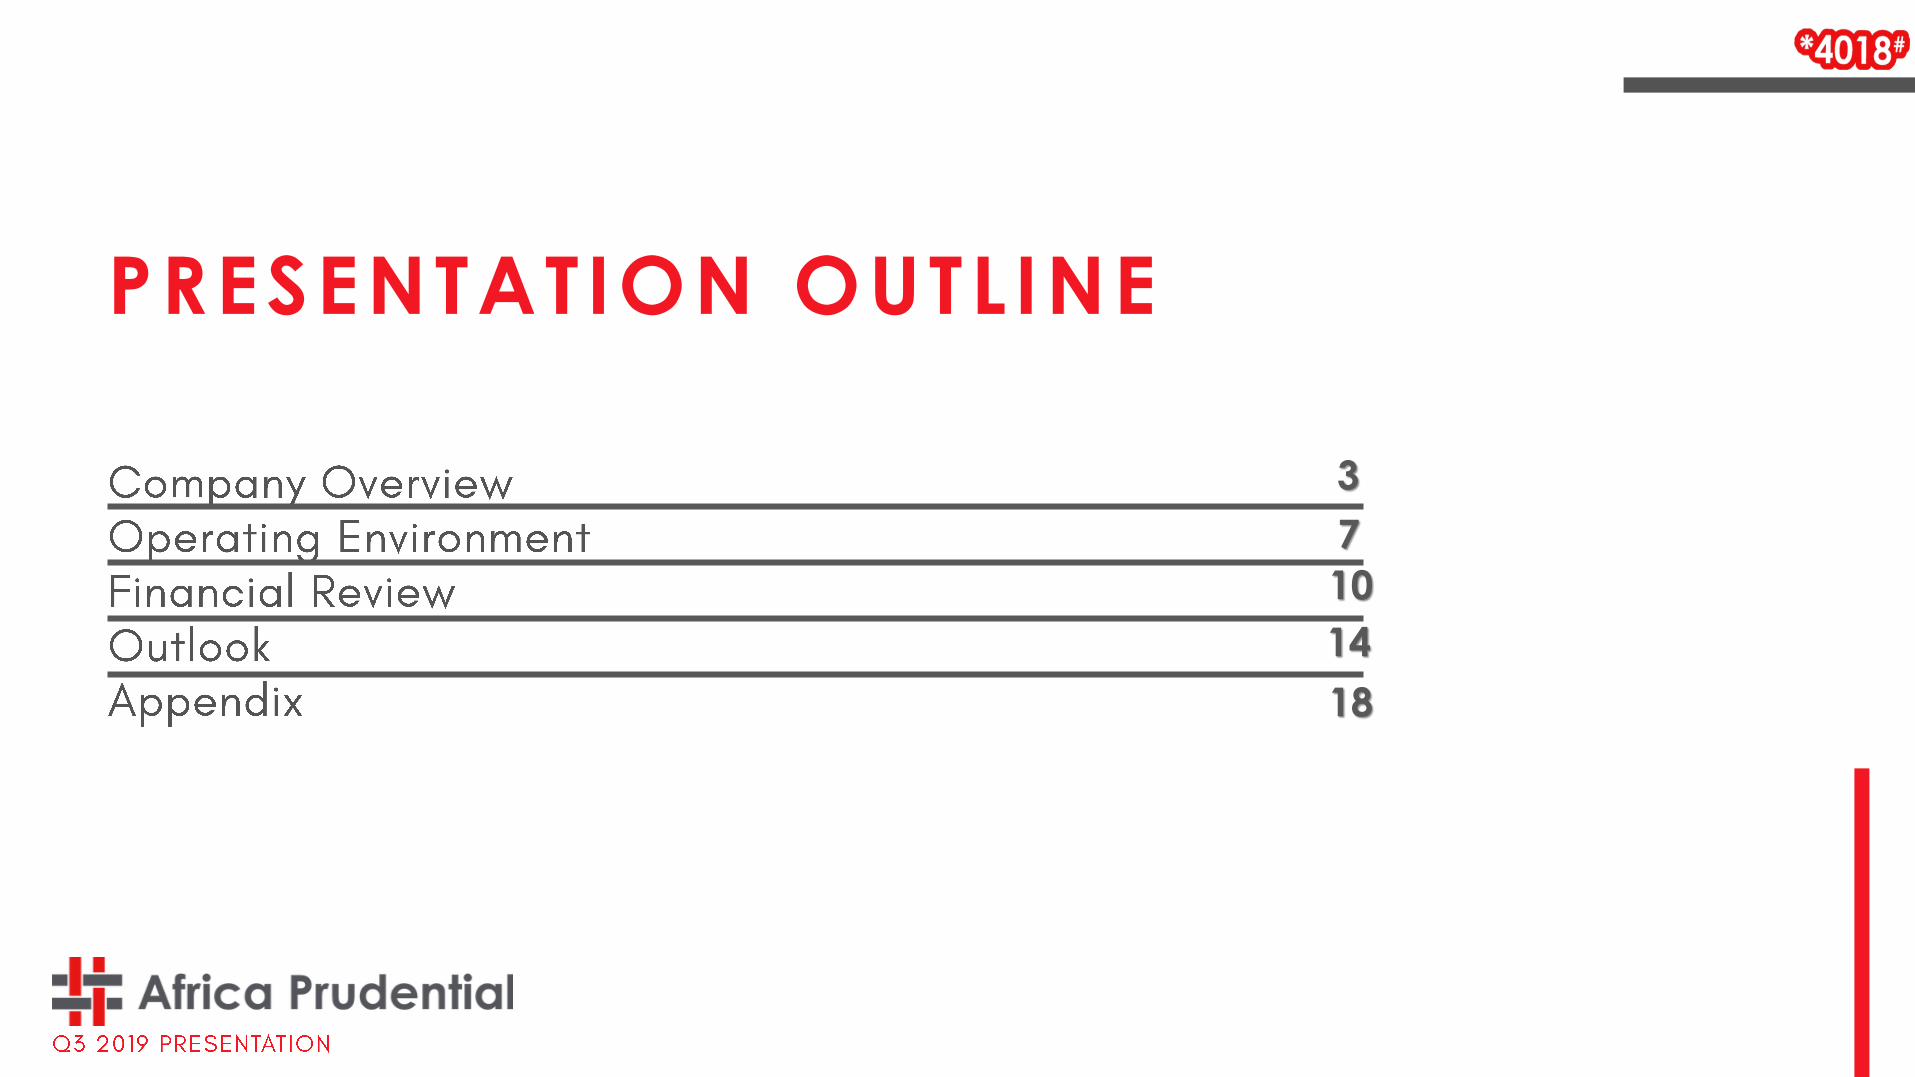
AFRICA PRUDENTIAL IS LEADING THE TRANSFORMATIVE CHANGE IN THE REGISTRAR INDUSTRY…
The first and only listed registrar on NSE
Market Capitalisation of N 7.8 Billion
No. 1 in technology and innovation among
corporate registrars
Over 80 clients base
Over 40 years share registration
experience
Specialized in qualitative,
customer care service delivery
4
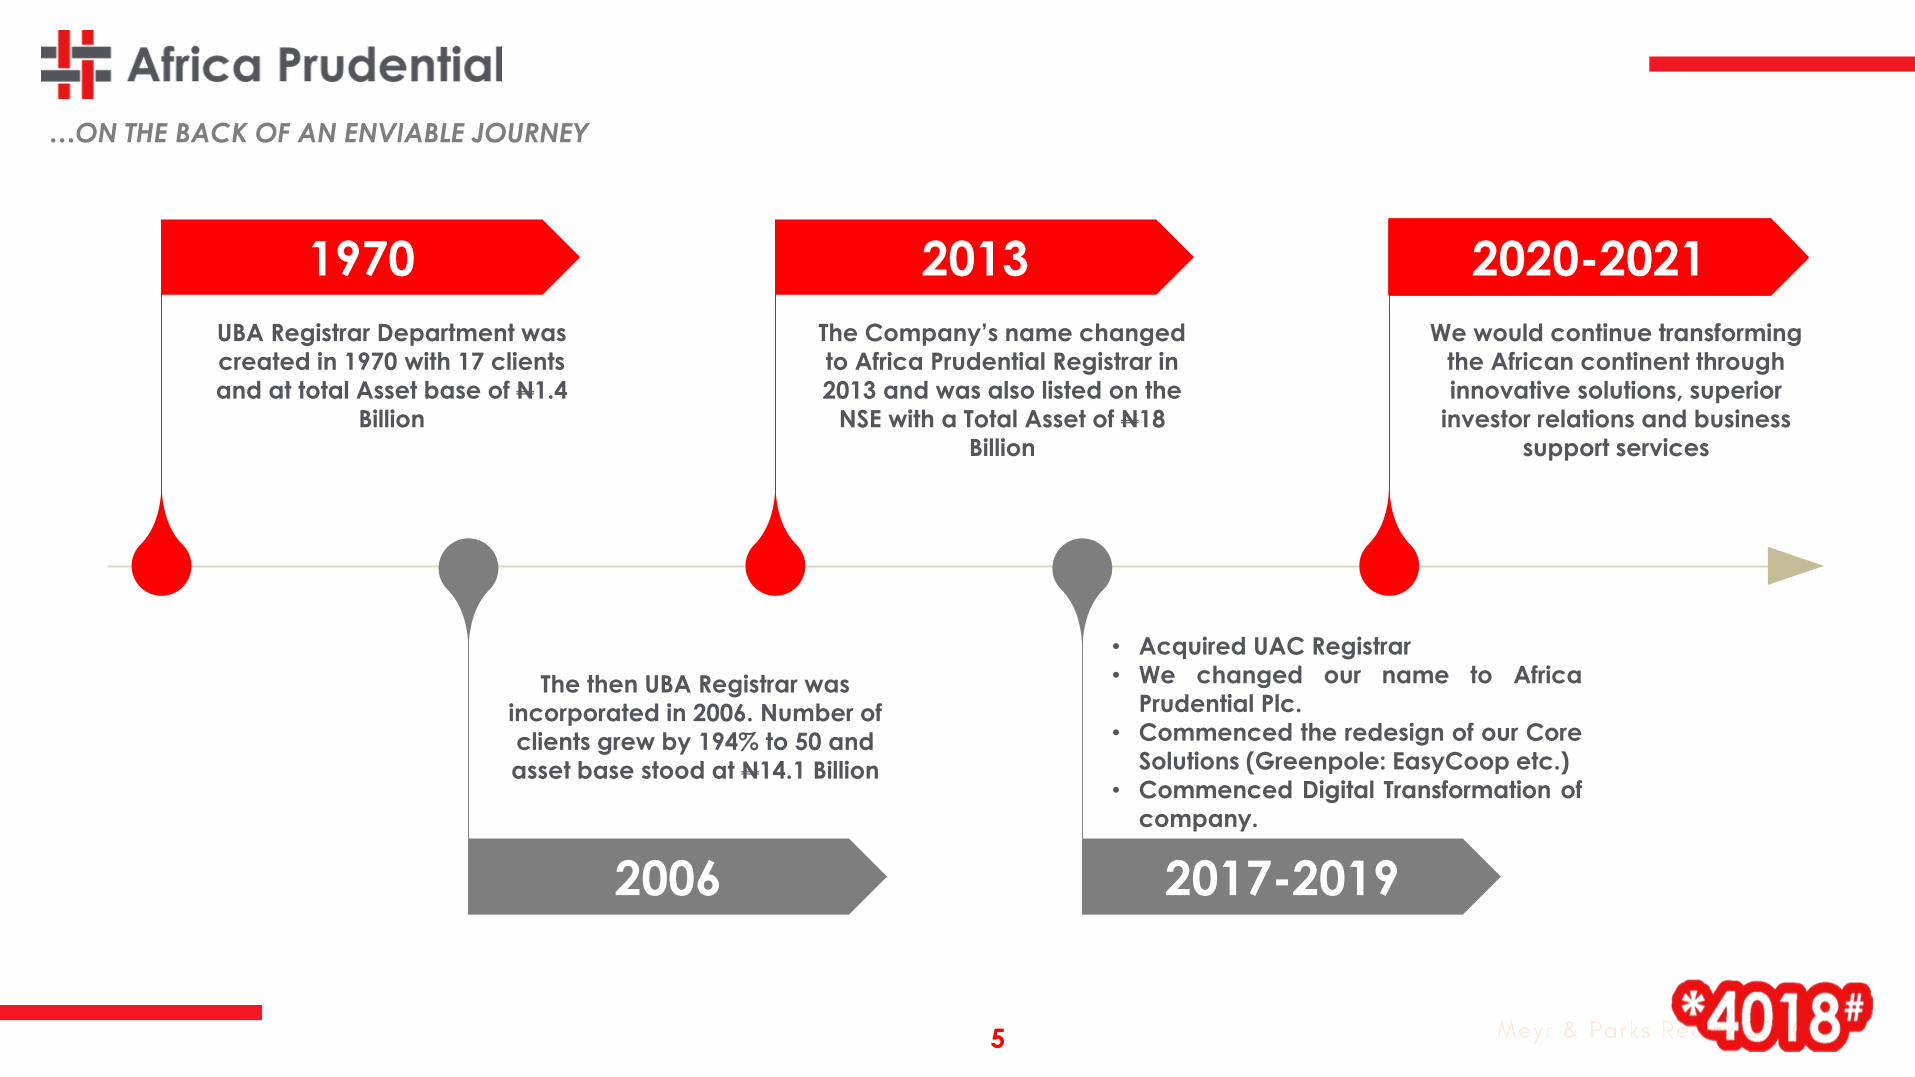
1970 2013 2020-2021
2006 2017-2019
UBA Registrar Department was
created in 1970 with 17 clients
and at total Asset base of N1.4
Billion
The Company’s name changed
to Africa Prudential Registrar in
2013 and was also listed on the
NSE with a Total Asset of N18
Billion
We would continue transforming
the African continent through
innovative solutions, superior
investor relations and business
support services
The then UBA Registrar was
incorporated in 2006. Number of
clients grew by 194% to 50 and
asset base stood at N14.1 Billion
• Acquired UAC Registrar
• We changed our name to Africa
Prudential Plc.
• Commenced the redesign of our Core
Solutions (Greenpole: EasyCoop etc.)
• Commenced Digital Transformation of
company.
…ON THE BACK OF AN ENVIABLE JOURNEY
5

SYNERGY WITH INDUSTRY
STAKEHOLDER• We place premium on relationship;
• We are attuned to symbiotic relationship
founded on mutual respect with industry
stakeholders, regulators and other Capital
Market Operators.
STRATEGIC LOCATION• Africa Prudential Plc is strategically located
in Lagos, Port-Harcourt and Abuja.
• As such we are within the hub of the core
activities moving the economy.
DURABLE EXPOSURE• With experience spanning three decades,
we have had faced tough times and
numerous economic turbulence.
• These experiences have helped us
anticipate and predict our environment
with precision.
EXPERIENCE OF MANAGEMENT
TEAM• Individually, each management staff
member has an average of 15 years in our
industry.
• As such we have an in-depth understanding
of our industry.
TECHNOLOGICAL SUPPORT• Our activities are geared towards infusing
technology with share registration business.
• To this end, our processes are technology-
driven for effective and efficient service
delivery.
• We currently boast of the latest state-of-the
art facility in share registration and investor
services industry.
…WE SEEK TO LEVERAGE ON OUR STRENGTH TO BECOME THE REGISTRAR OF CHOICE
6
OPERATING
ENVIRONMENT
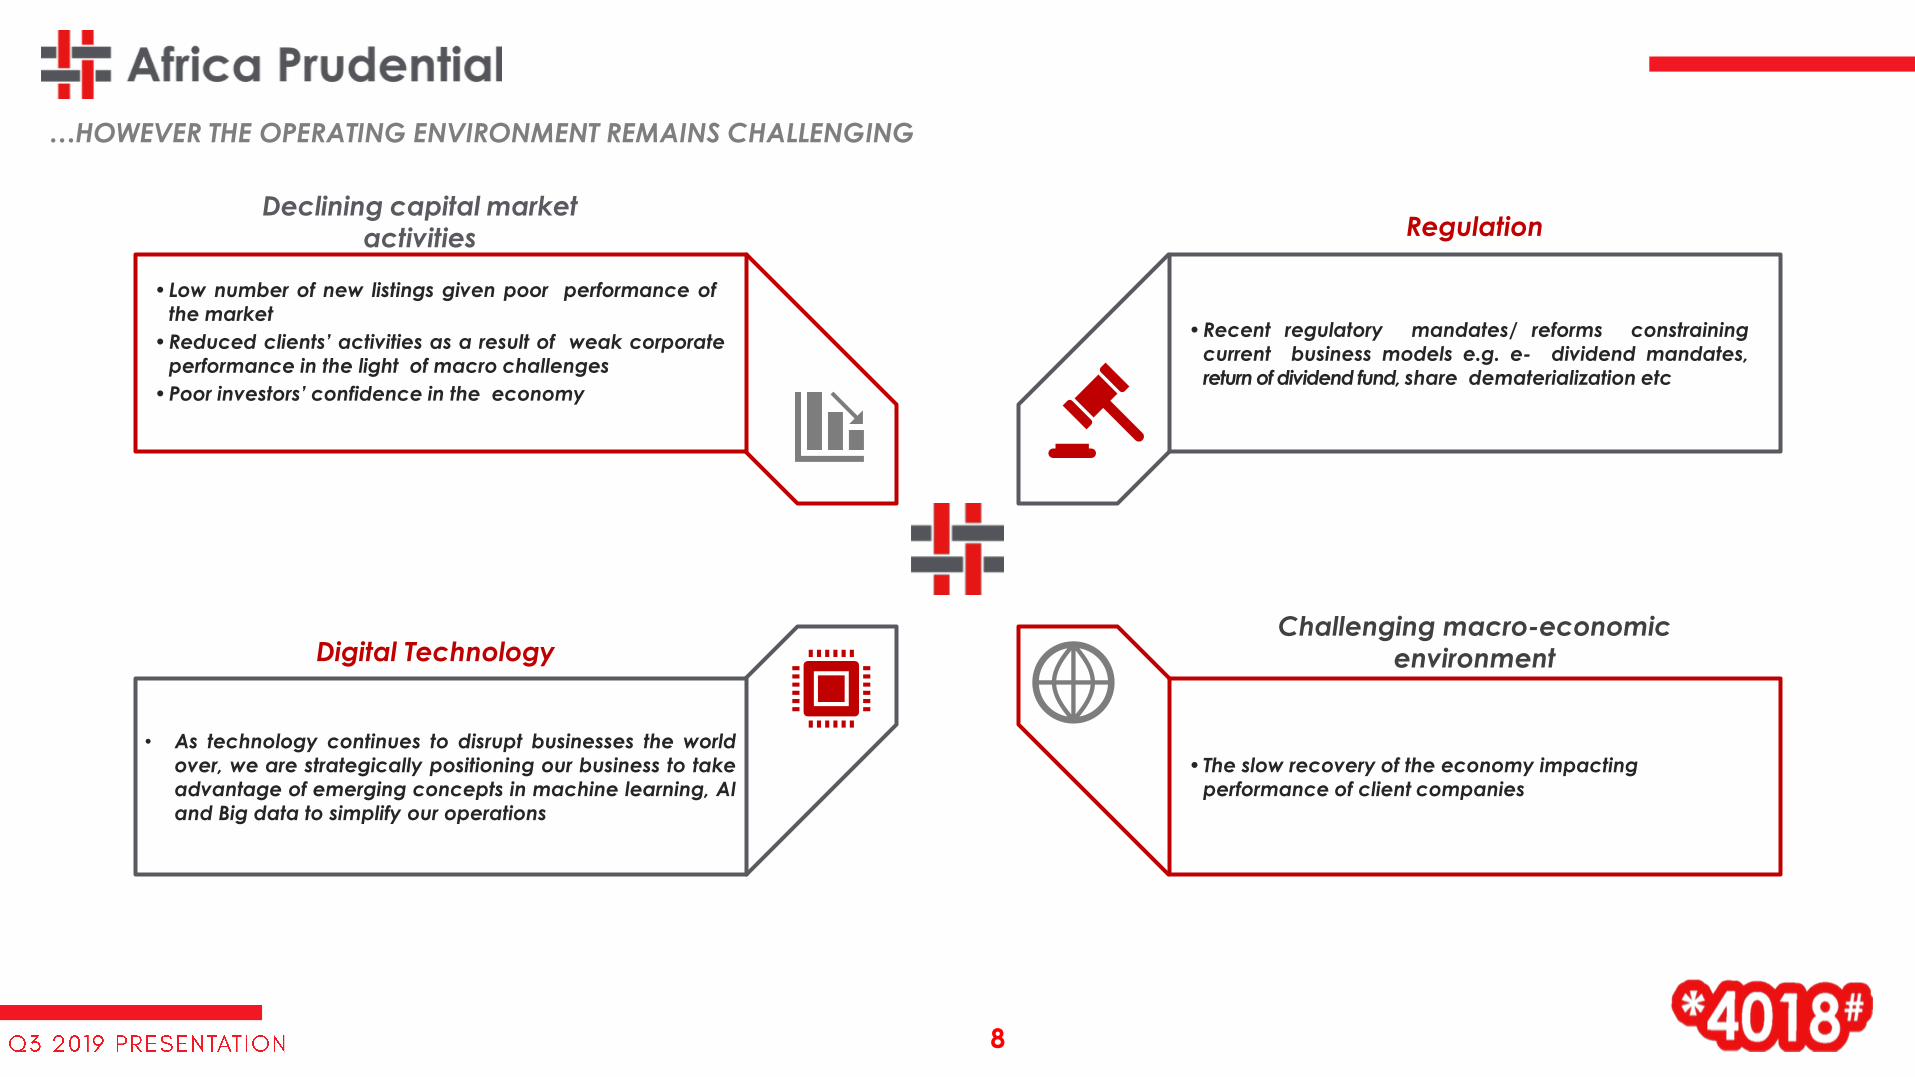
•Low number of new listings given poor performance of
the market
•Reduced clients’ activities as a result of weak corporate
performance in the light of macro challenges
•Poor investors’ confidence in the economy
•Recent regulatory mandates/ reforms constraining
current business models e.g. e- dividend mandates,
return of dividend fund, share dematerialization etc
• As technology continues to disrupt businesses the world
over, we are strategically positioning our business to take
advantage of emerging concepts in machine learning, AI
and Big data to simplify our operations
• The slow recovery of the economy impacting
performance of client companies
Declining capital market activities
Digital Technology
Regulation
Challenging macro-economic
environment
…HOWEVER THE OPERATING ENVIRONMENT REMAINS CHALLENGING
8
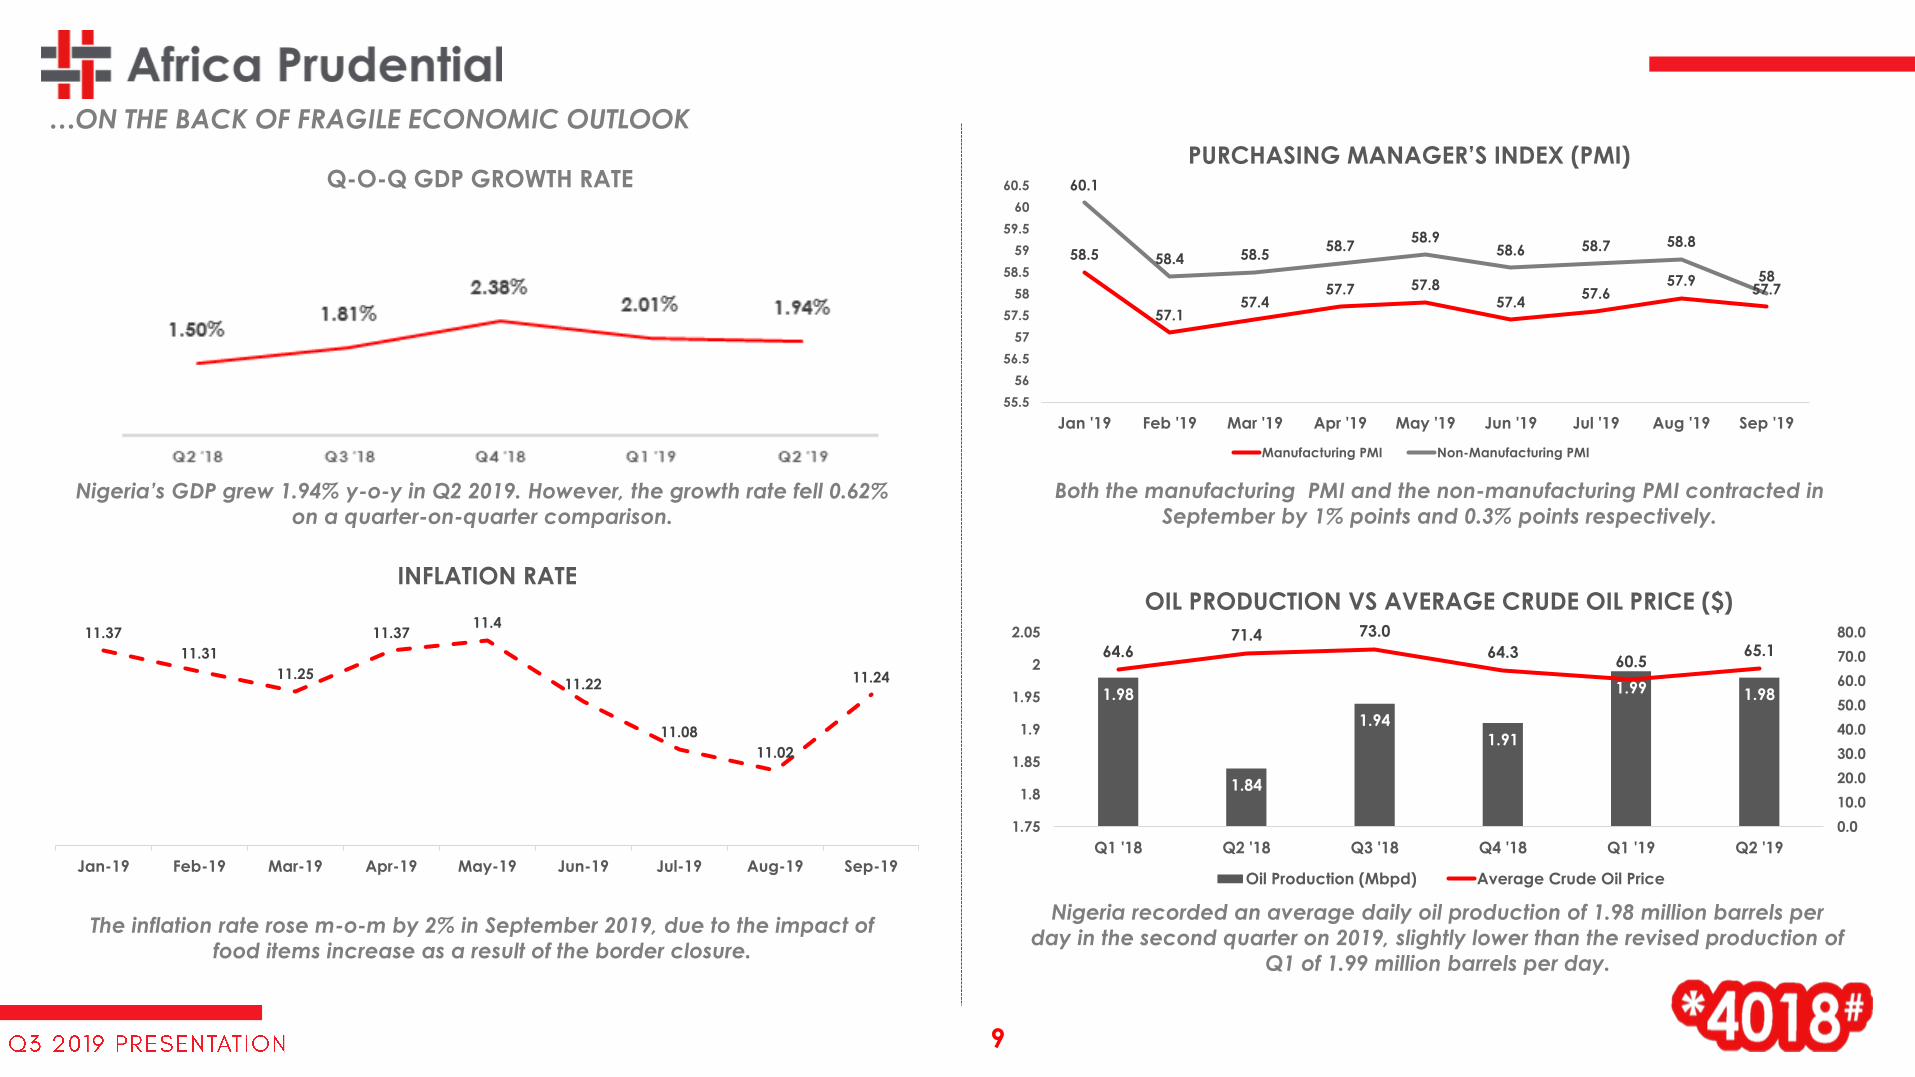
Nigeria’s GDP grew 1.94% y-o-y in Q2 2019. However, the growth rate fell 0.62%
on a quarter-on-quarter comparison.
The inflation rate rose m-o-m by 2% in September 2019, due to the impact of
food items increase as a result of the border closure.
Nigeria recorded an average daily oil production of 1.98 million barrels per
day in the second quarter on 2019, slightly lower than the revised production of
Q1 of 1.99 million barrels per day.
11.37
11.31
11.25
11.3711.4
11.22
11.08
11.02
11.24
Jan-19 Feb-19 Mar-19 Apr-19 May-19 Jun-19 Jul-19 Aug-19 Sep-19
INFLATION RATE
Both the manufacturing PMI and the non-manufacturing PMI contracted in
September by 1% points and 0.3% points respectively.
…ON THE BACK OF FRAGILE ECONOMIC OUTLOOK
58.5
57.157.4
57.7 57.857.4
57.657.9
57.7
60.1
58.4 58.558.7
58.958.6 58.7 58.8
58
55.5
56
56.5
57
57.5
58
58.5
59
59.5
60
60.5
Jan '19 Feb '19 Mar '19 Apr '19 May '19 Jun '19 Jul '19 Aug '19 Sep '19
PURCHASING MANAGER’S INDEX (PMI)
Manufacturing PMI Non-Manufacturing PMI
Q-O-Q GDP GROWTH RATE
1.98
1.84
1.94
1.91
1.99 1.98
64.671.4 73.0
64.360.5
65.1
0.0
10.0
20.0
30.0
40.0
50.0
60.0
70.0
80.0
1.75
1.8
1.85
1.9
1.95
2
2.05
Q1 '18 Q2 '18 Q3 '18 Q4 '18 Q1 '19 Q2 '19
OIL PRODUCTION VS AVERAGE CRUDE OIL PRICE ($)
Oil Production (Mbpd) Average Crude Oil Price
9

FINANCIAL
REVIEW
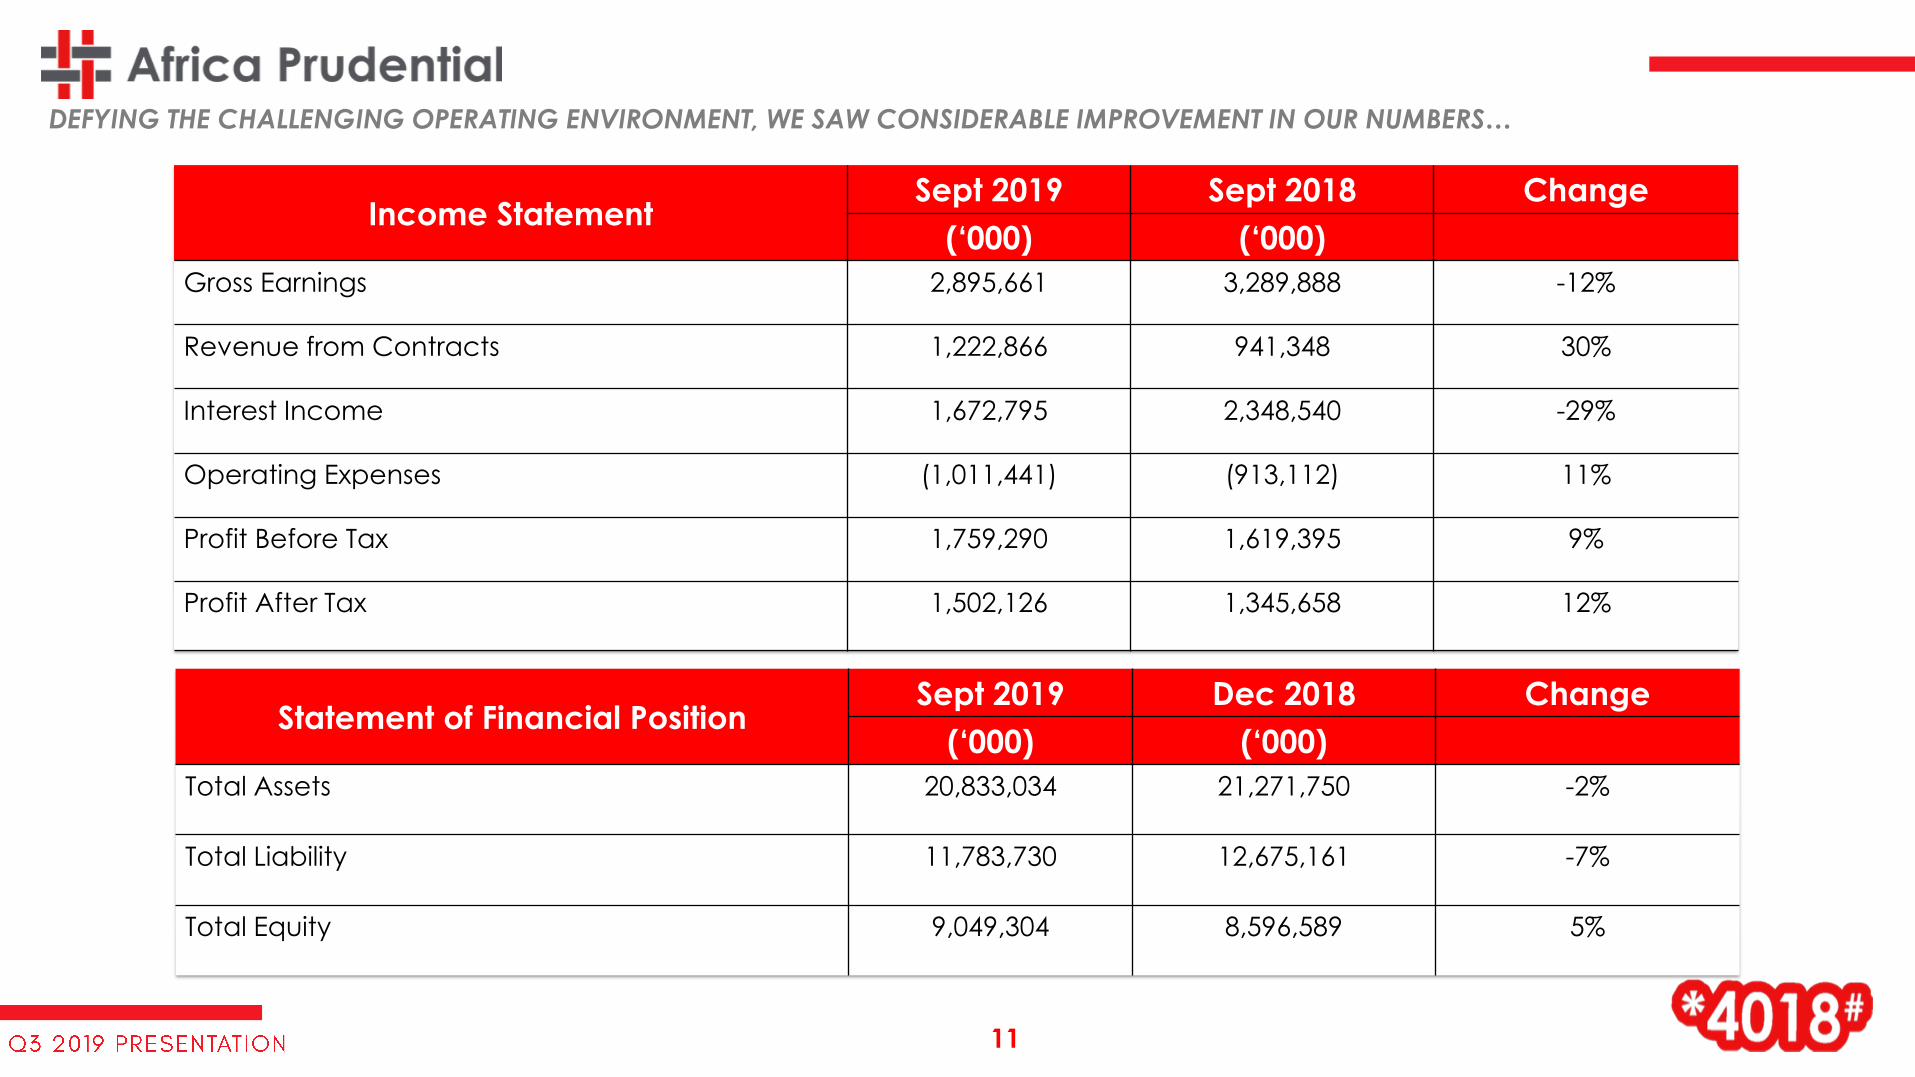
Income StatementSept 2019 Sept 2018 Change
(‘000) (‘000)
Gross Earnings 2,895,661 3,289,888 -12%
Revenue from Contracts 1,222,866 941,348 30%
Interest Income 1,672,795 2,348,540 -29%
Operating Expenses (1,011,441) (913,112) 11%
Profit Before Tax 1,759,290 1,619,395 9%
Profit After Tax 1,502,126 1,345,658 12%
Statement of Financial PositionSept 2019 Dec 2018 Change
(‘000) (‘000)
Total Assets 20,833,034 21,271,750 -2%
Total Liability 11,783,730 12,675,161 -7%
Total Equity 9,049,304 8,596,589 5%
DEFYING THE CHALLENGING OPERATING ENVIRONMENT, WE SAW CONSIDERABLE IMPROVEMENT IN OUR NUMBERS…
11
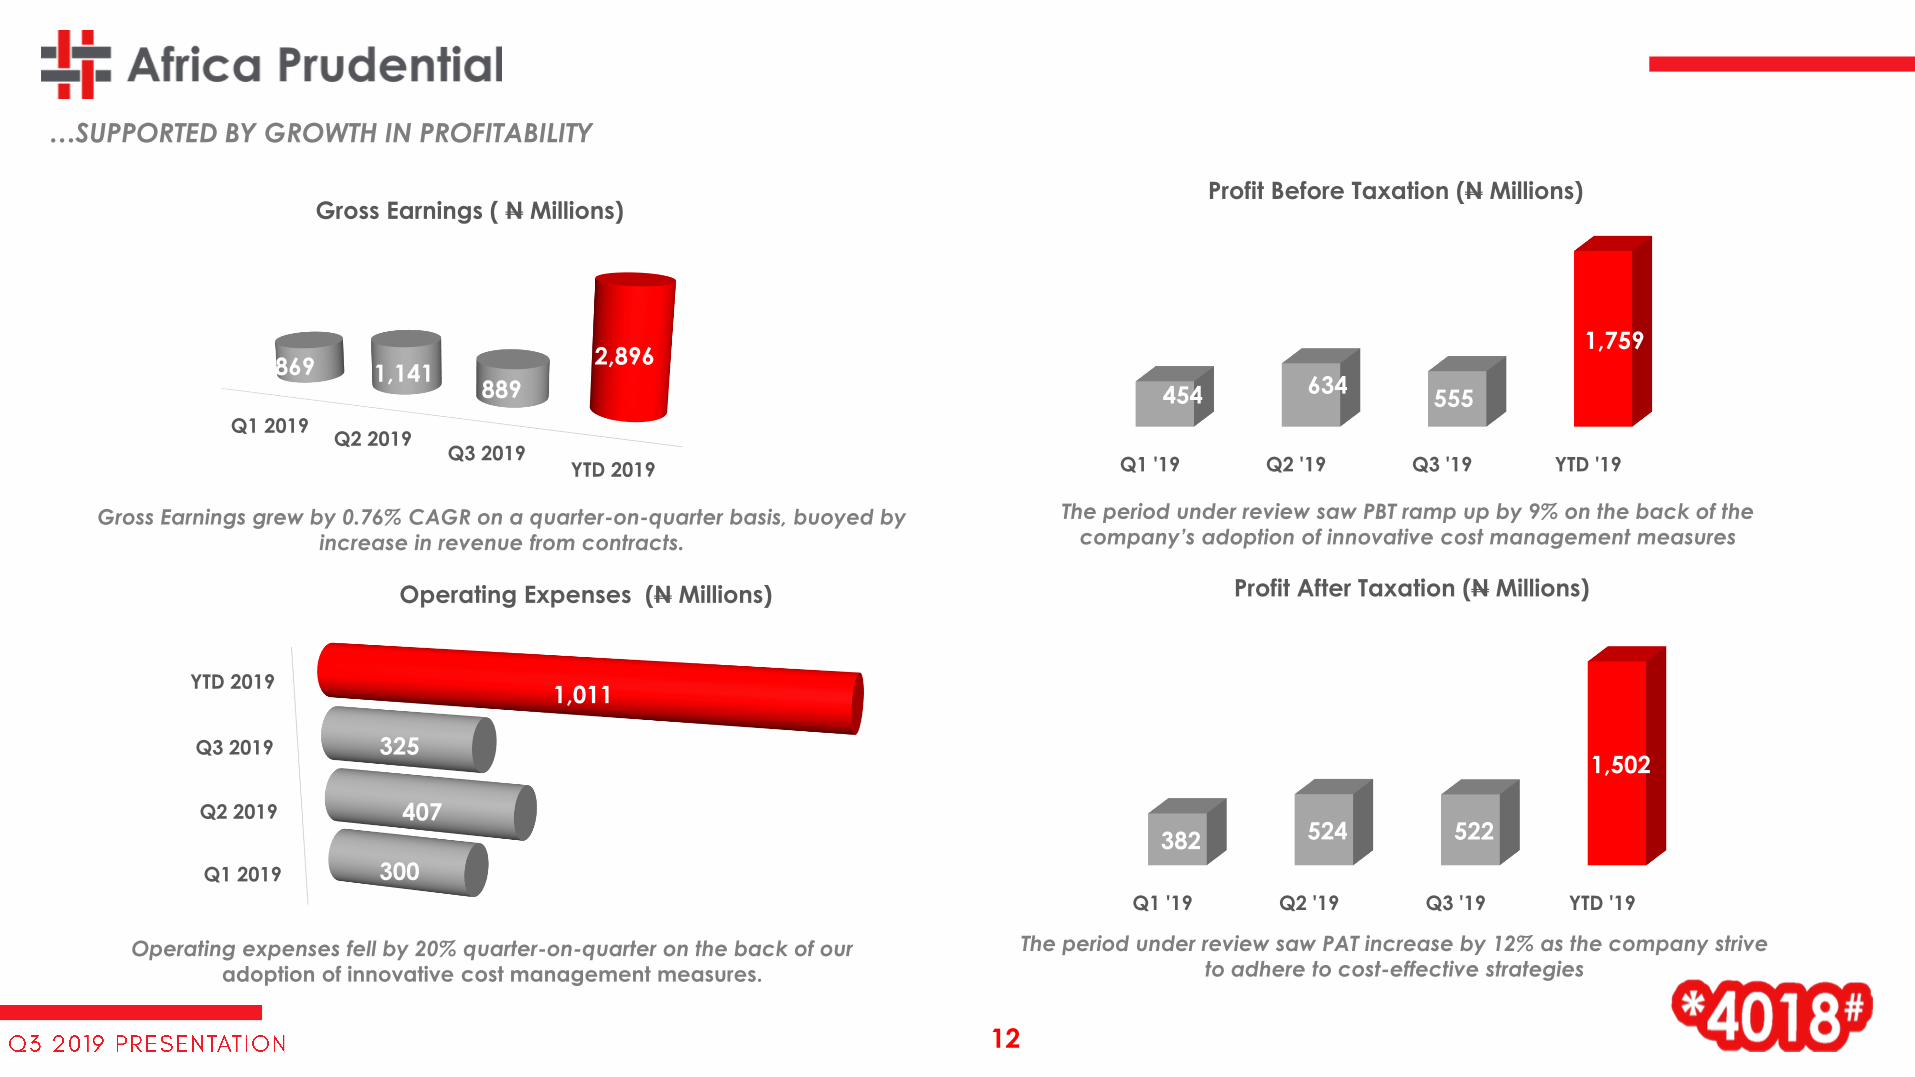
The period under review saw PBT ramp up by 9% on the back of the
company’s adoption of innovative cost management measures
Q1 2019Q2 2019
Q3 2019YTD 2019
869 1,141889
2,896
Gross Earnings ( N Millions)
Gross Earnings grew by 0.76% CAGR on a quarter-on-quarter basis, buoyed by
increase in revenue from contracts.
Q1 2019
Q2 2019
Q3 2019
YTD 2019
300
407
325
1,011
Operating Expenses (N Millions)
Operating expenses fell by 20% quarter-on-quarter on the back of our
adoption of innovative cost management measures.
…SUPPORTED BY GROWTH IN PROFITABILITY
Q1 '19 Q2 '19 Q3 '19 YTD '19
454 634 555
1,759
Profit Before Taxation (N Millions)
Q1 '19 Q2 '19 Q3 '19 YTD '19
382 524 522
1,502
Profit After Taxation (N Millions)
The period under review saw PAT increase by 12% as the company strive
to adhere to cost-effective strategies
12
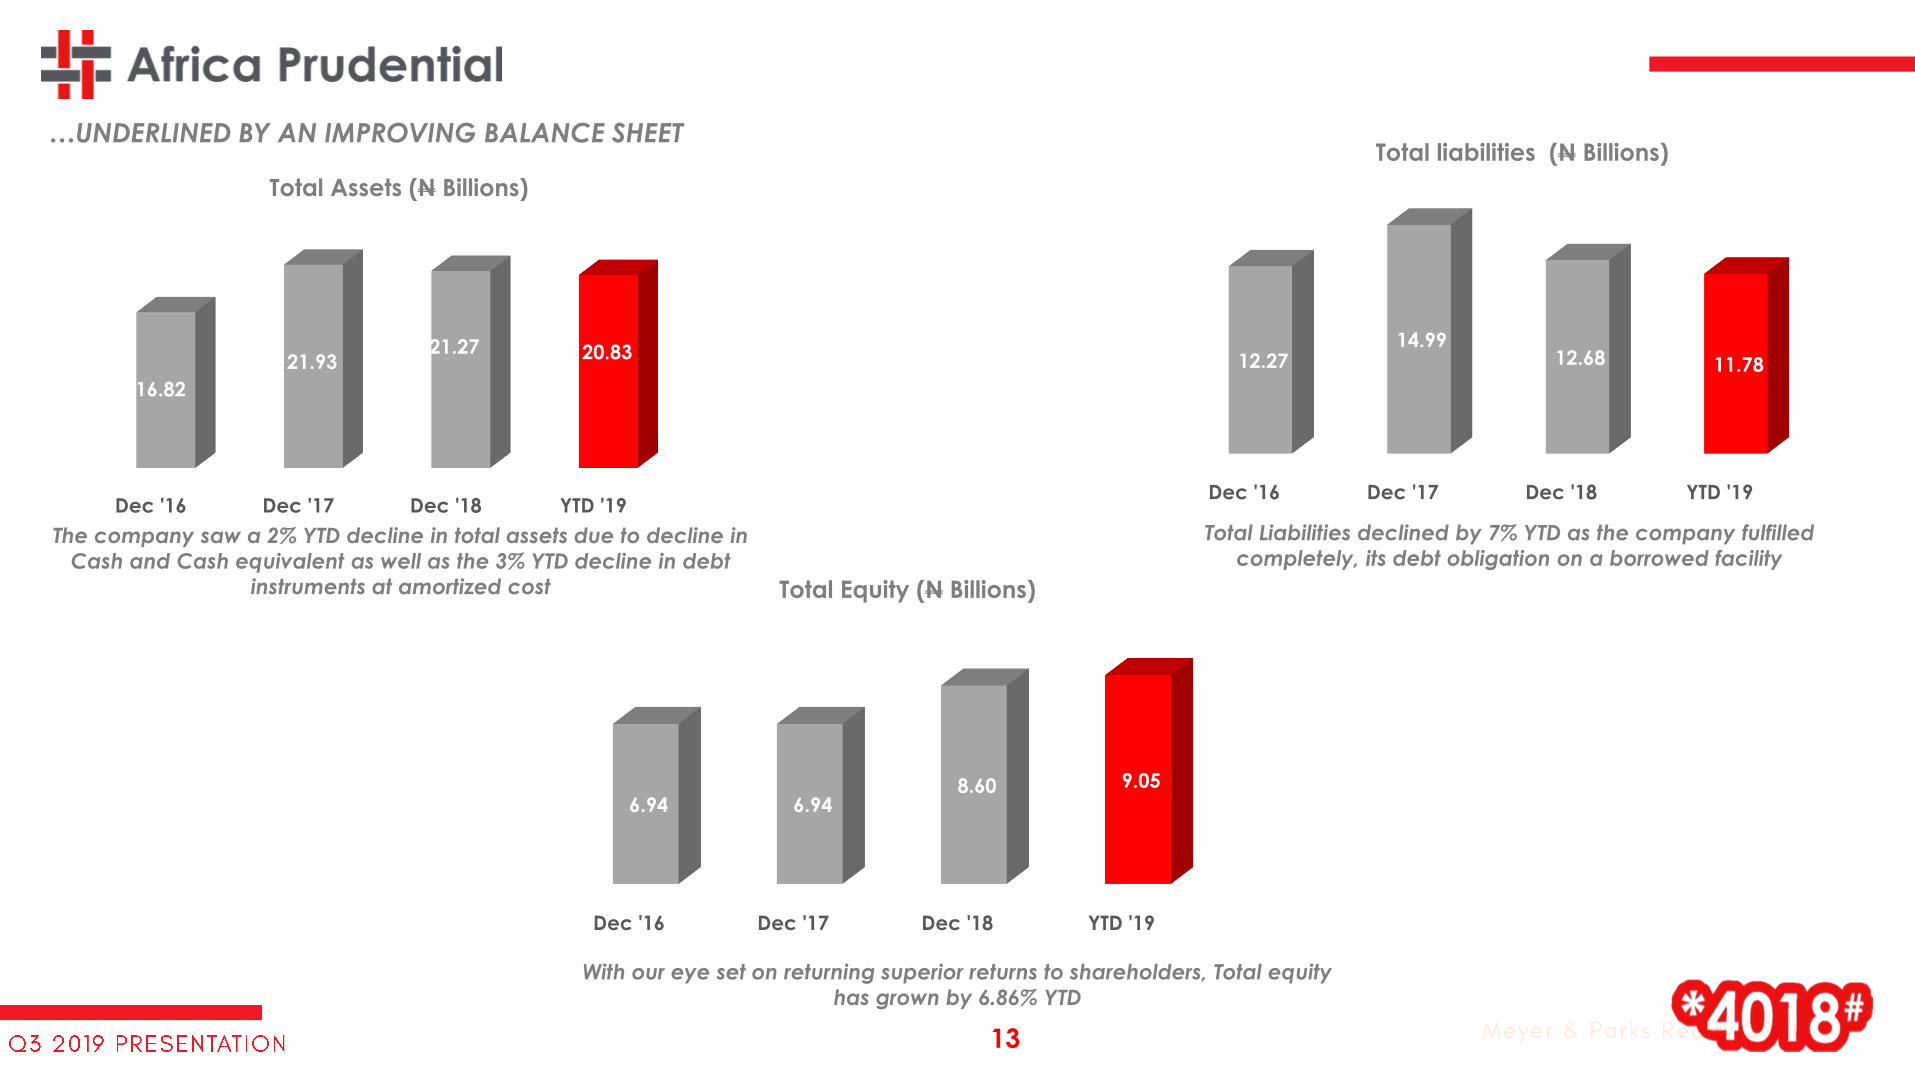
With our eye set on returning superior returns to shareholders, Total equity
has grown by 6.86% YTD
The company saw a 2% YTD decline in total assets due to decline in
Cash and Cash equivalent as well as the 3% YTD decline in debt
instruments at amortized cost
Dec '16 Dec '17 Dec '18 YTD '19
16.82
21.93 21.27 20.83
Total Assets (N Billions)
Dec '16 Dec '17 Dec '18 YTD '19
12.27 14.99
12.68 11.78
Total liabilities (N Billions)
Dec '16 Dec '17 Dec '18 YTD '19
6.94 6.94 8.60 9.05
Total Equity (N Billions)
Total Liabilities declined by 7% YTD as the company fulfilled
completely, its debt obligation on a borrowed facility
…UNDERLINED BY AN IMPROVING BALANCE SHEET
13

OUTLOOK
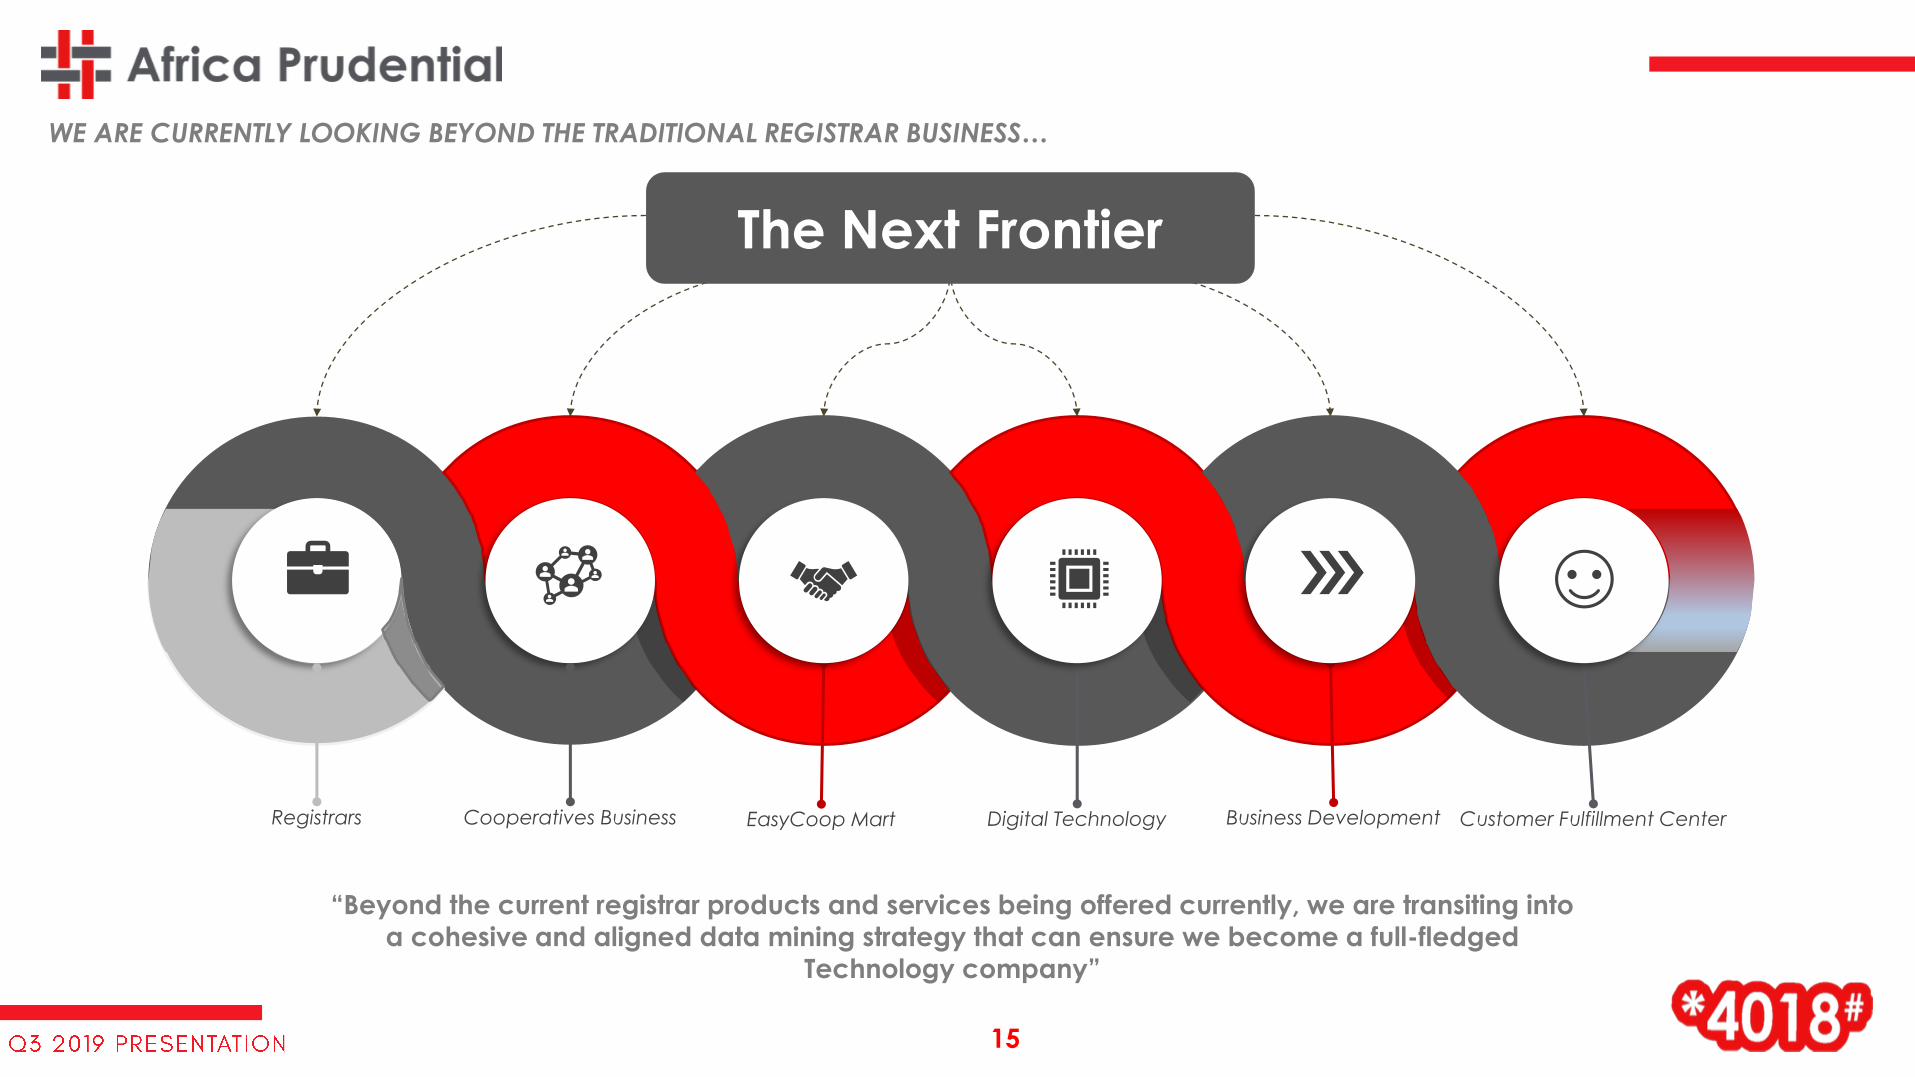
The Next Frontier
Registrars Cooperatives Business EasyCoop Mart Digital Technology Business Development Customer Fulfillment Center
“Beyond the current registrar products and services being offered currently, we are transiting into
a cohesive and aligned data mining strategy that can ensure we become a full-fledged
Technology company”
WE ARE CURRENTLY LOOKING BEYOND THE TRADITIONAL REGISTRAR BUSINESS…
15
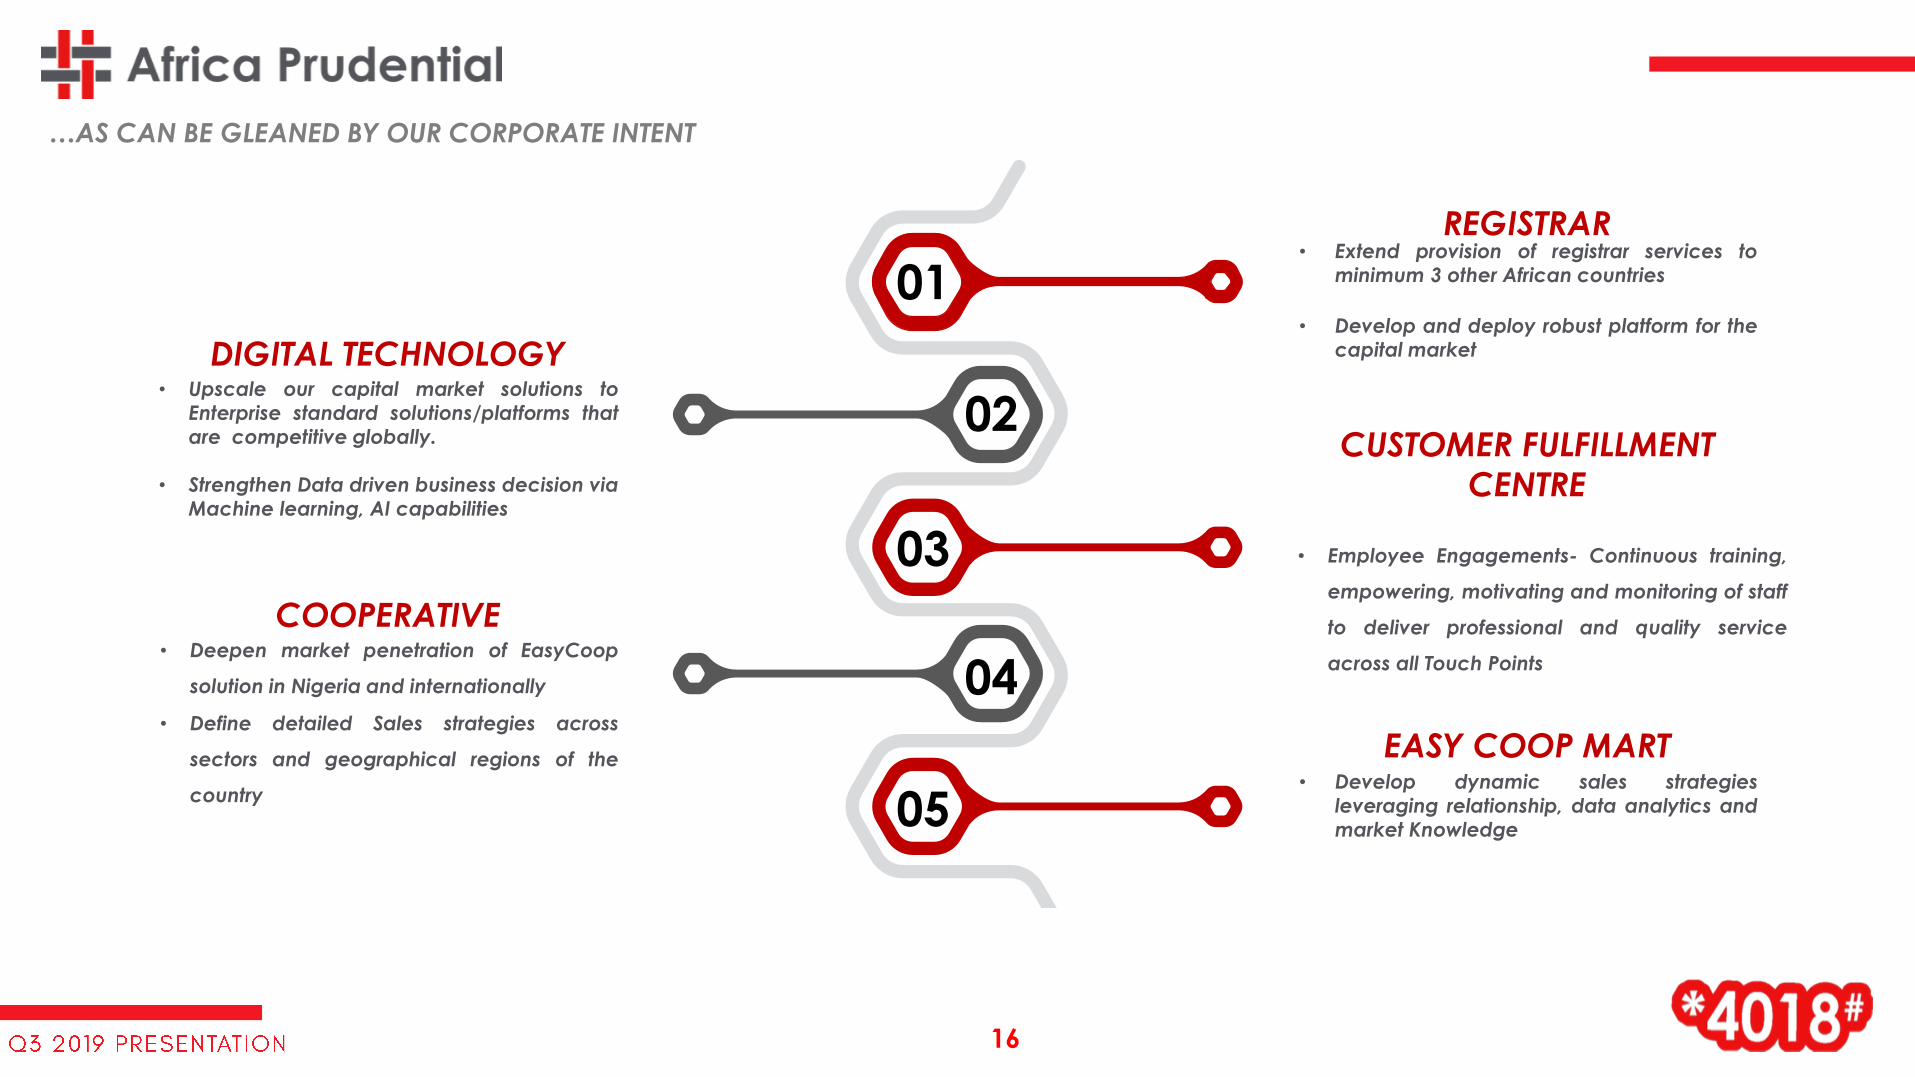
REGISTRAR• Extend provision of registrar services to
minimum 3 other African countries
• Develop and deploy robust platform for the
capital marketDIGITAL TECHNOLOGY• Upscale our capital market solutions to
Enterprise standard solutions/platforms that
are competitive globally.
• Strengthen Data driven business decision via
Machine learning, AI capabilities
CUSTOMER FULFILLMENT
CENTRE
• Employee Engagements- Continuous training,
empowering, motivating and monitoring of staff
to deliver professional and quality service
across all Touch Points
EASY COOP MART• Develop dynamic sales strategies
leveraging relationship, data analytics and
market Knowledge
COOPERATIVE• Deepen market penetration of EasyCoop
solution in Nigeria and internationally
• Define detailed Sales strategies across
sectors and geographical regions of the
country
01
02
03
04
05
…AS CAN BE GLEANED BY OUR CORPORATE INTENT
16
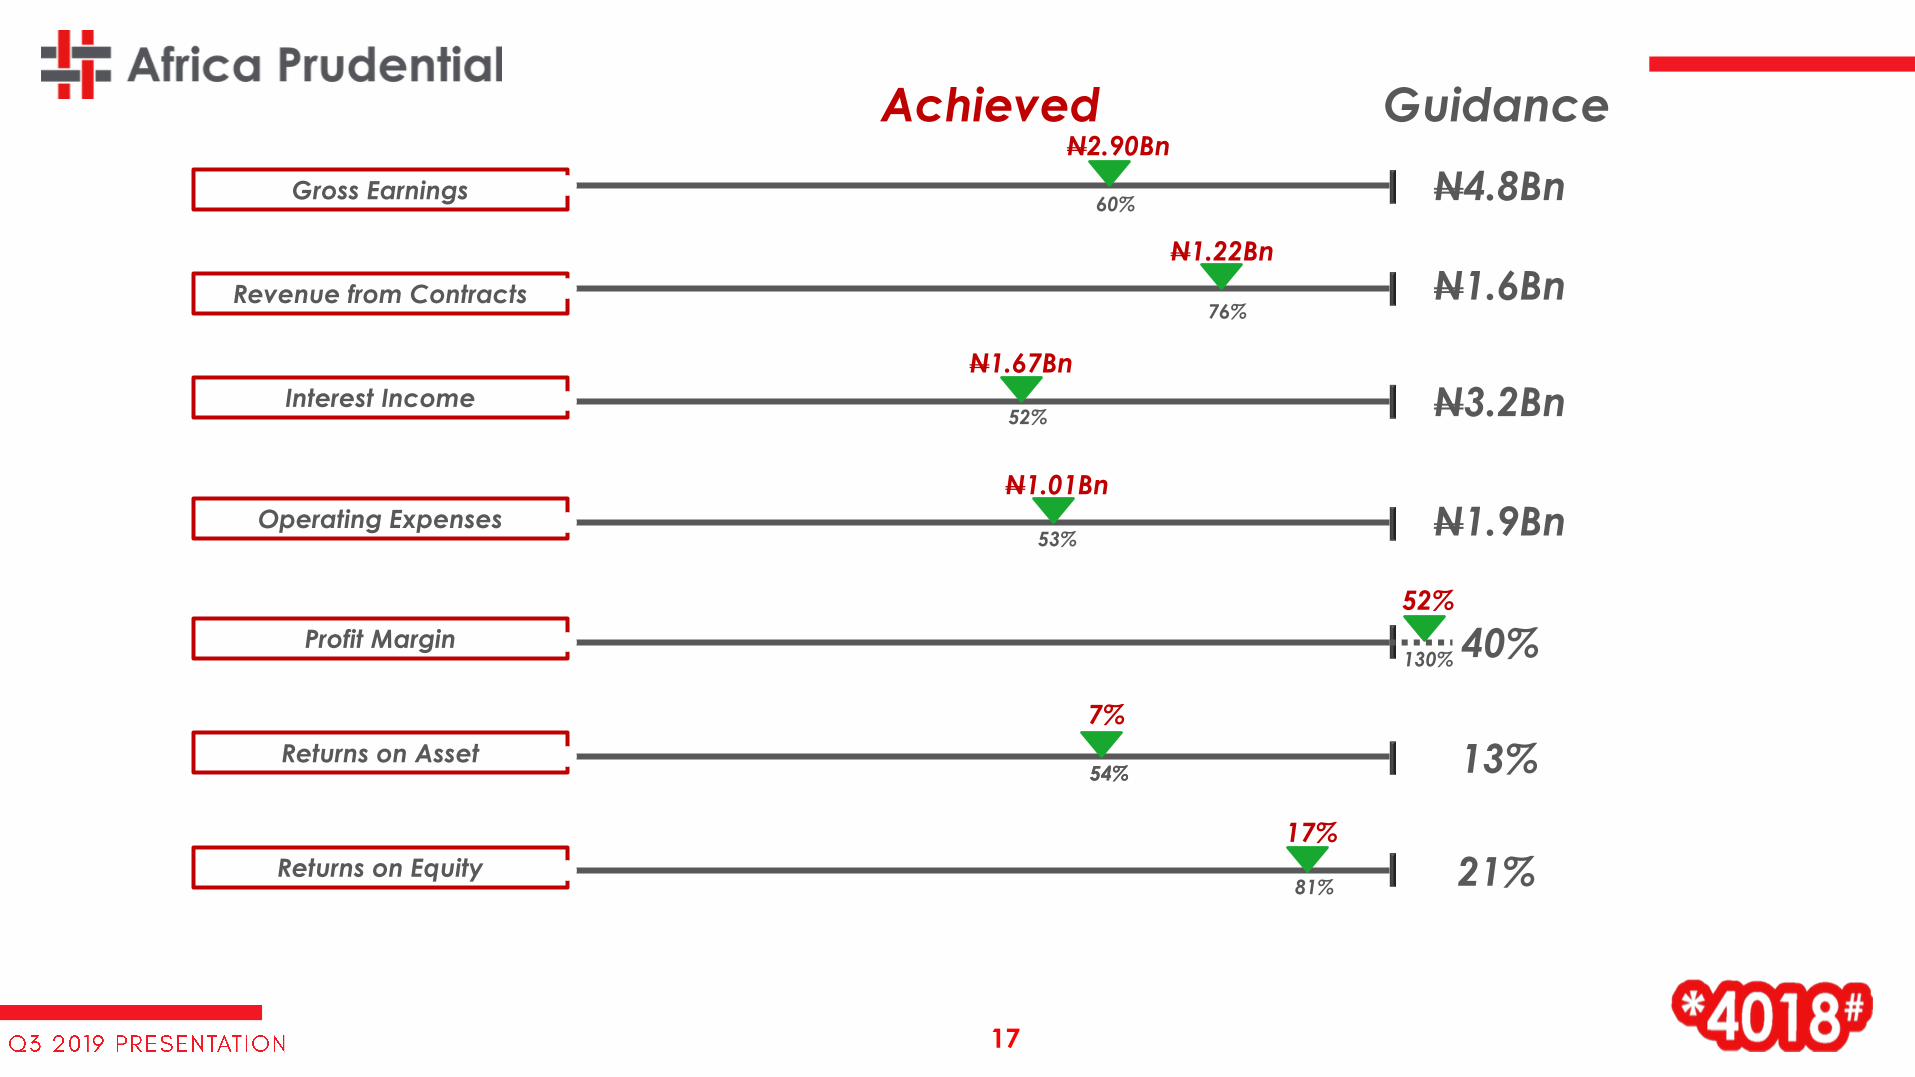
Gross Earnings
Revenue from Contracts
Interest Income
Operating Expenses
Profit Margin
Returns on Asset
Returns on Equity
N4.8Bn
N1.6Bn
N3.2Bn
N1.9Bn
40%
13%
21%
N2.90Bn
60%
N1.22Bn
76%
N1.67Bn
52%
GuidanceAchieved
53%
N1.01Bn
52%
130%
7%
54%
17%
54%
81%
17
APPENDIX
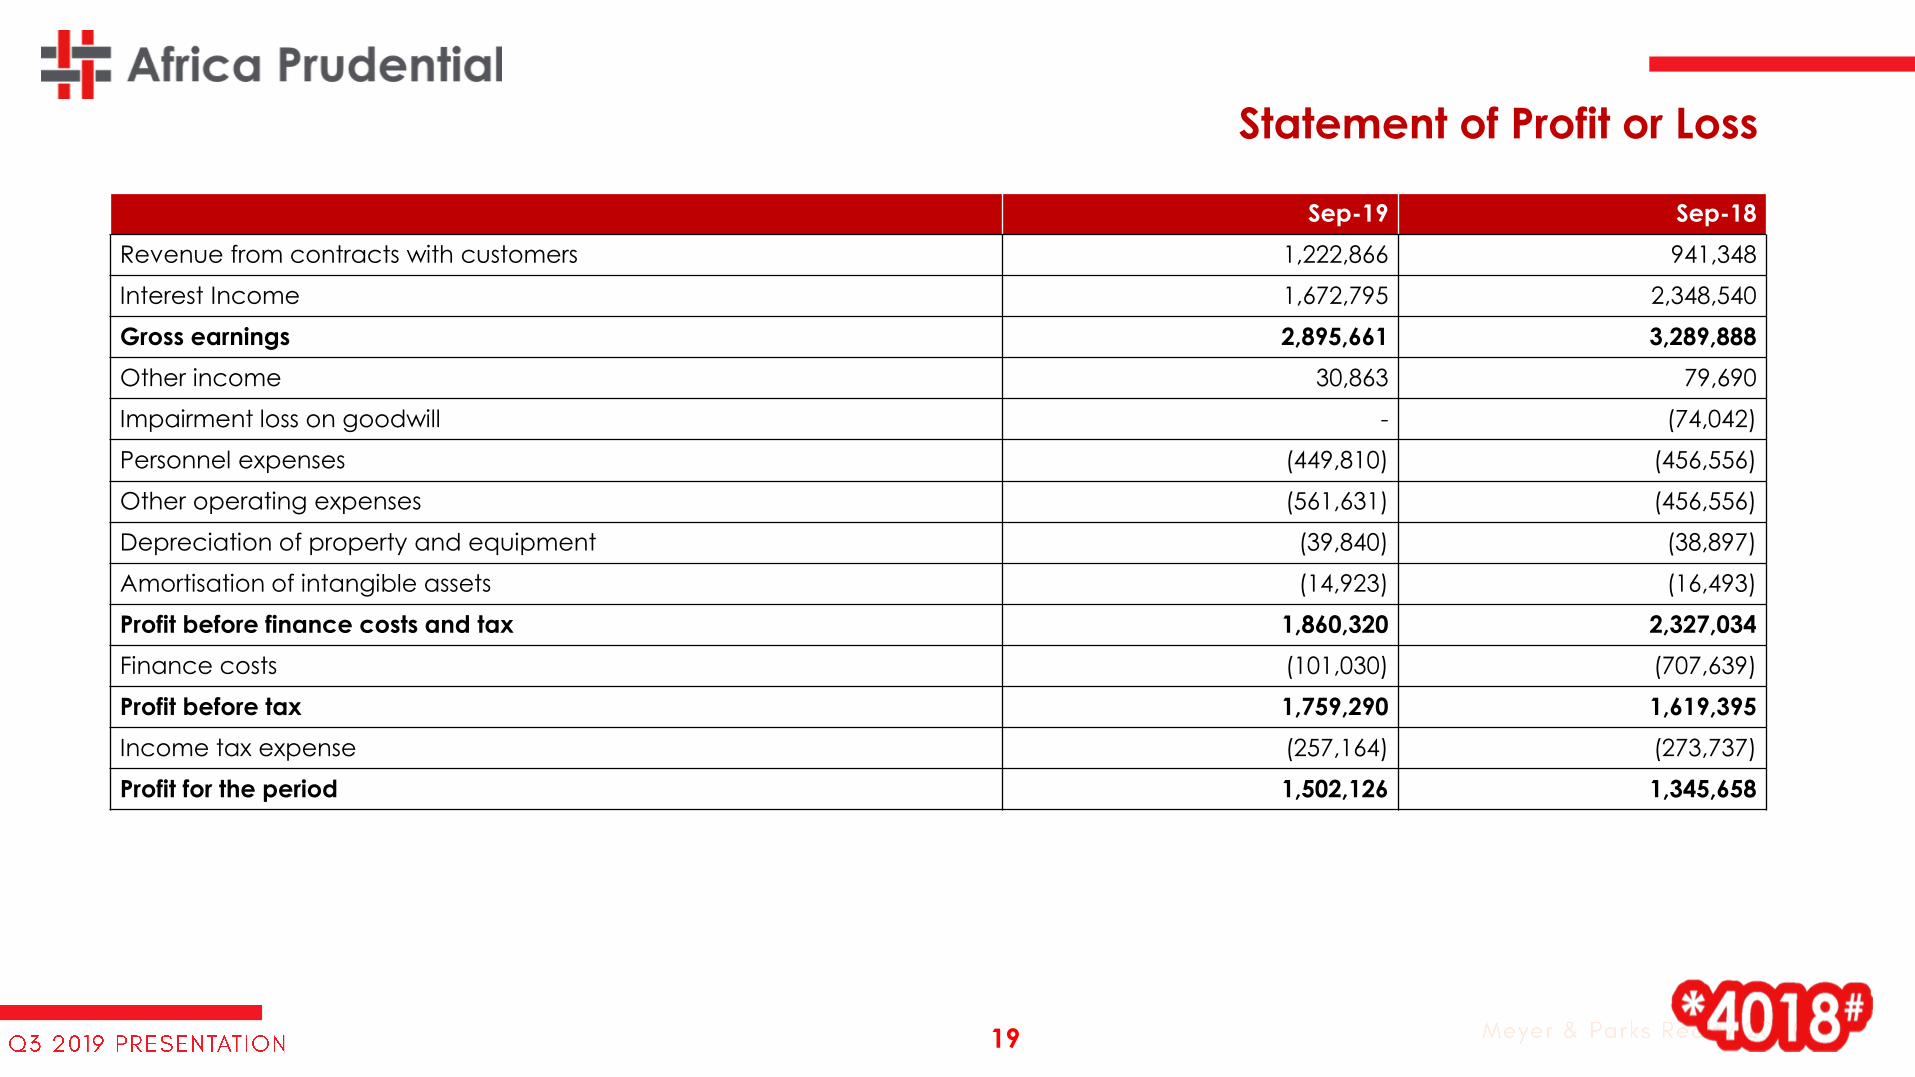
Statement of Profit or Loss
Sep-19 Sep-18
Revenue from contracts with customers 1,222,866 941,348
Interest Income 1,672,795 2,348,540
Gross earnings 2,895,661 3,289,888
Other income 30,863 79,690
Impairment loss on goodwill - (74,042)
Personnel expenses (449,810) (456,556)
Other operating expenses (561,631) (456,556)
Depreciation of property and equipment (39,840) (38,897)
Amortisation of intangible assets (14,923) (16,493)
Profit before finance costs and tax 1,860,320 2,327,034
Finance costs (101,030) (707,639)
Profit before tax 1,759,290 1,619,395
Income tax expense (257,164) (273,737)
Profit for the period 1,502,126 1,345,658
19
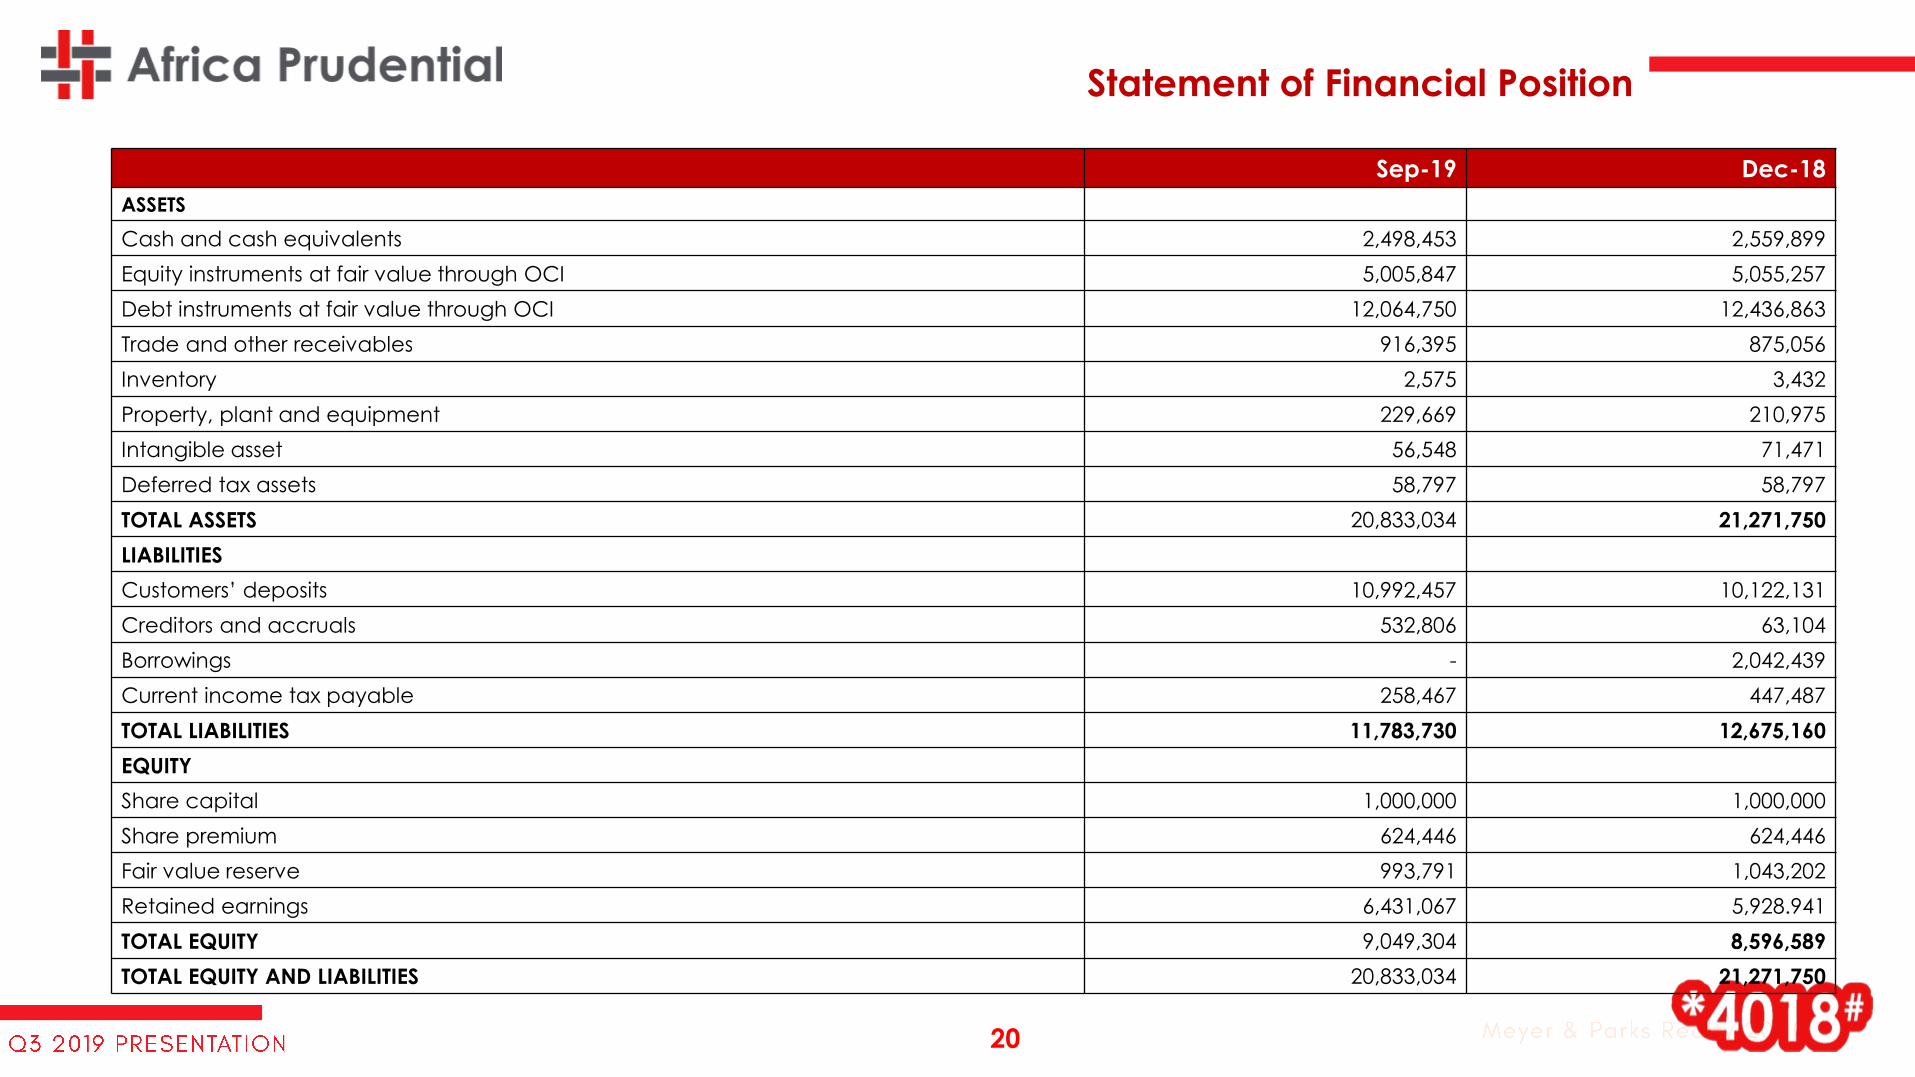
Sep-19 Dec-18
ASSETS
Cash and cash equivalents 2,498,453 2,559,899
Equity instruments at fair value through OCI 5,005,847 5,055,257
Debt instruments at fair value through OCI 12,064,750 12,436,863
Trade and other receivables 916,395 875,056
Inventory 2,575 3,432
Property, plant and equipment 229,669 210,975
Intangible asset 56,548 71,471
Deferred tax assets 58,797 58,797
TOTAL ASSETS 20,833,034 21,271,750
LIABILITIES
Customers’ deposits 10,992,457 10,122,131
Creditors and accruals 532,806 63,104
Borrowings - 2,042,439
Current income tax payable 258,467 447,487
TOTAL LIABILITIES 11,783,730 12,675,160
EQUITY
Share capital 1,000,000 1,000,000
Share premium 624,446 624,446
Fair value reserve 993,791 1,043,202
Retained earnings 6,431,067 5,928.941
TOTAL EQUITY 9,049,304 8,596,589
TOTAL EQUITY AND LIABILITIES 20,833,034 21,271,750
Statement of Financial Position
20


![Investors & Analysts Presentation [Company Update]](https://img.pdfslide.us/doc/110x75/577c7c231a28abe0549972fe/investors-analysts-presentation-company-update.jpg)


![Analysts Presentation [Company Update]](https://img.pdfslide.us/doc/110x75/577cb48b1a28aba7118c80cd/analysts-presentation-company-update.jpg)