Embed Size (px)
Citation preview
African S
tatistical Journal / Journal statistique africain
FONDS AFRICAIN DE DEVELOPPEMEN
T
AFRICAN DEVELOPMENT FUND
BA
NQUE
AFRICAINE DE DEVELOPPEMENT
© ADB/BAD, 2007 – Statistics Department • Département des statistiquesTemporary Relocation Agency (TRA) – Agence Temporaire de Relocalisation (ATR)13 Avenue du GhanaBP. 323, 1002 Tunis Belvedère Tunis, Tunisia / TunisieTel: (+216) 71 103 216Fax: (+216) 71 103 743 Email: [email protected] / Internet: http://[email protected]
Volume 4 – M
ay / Mai 2007
African Statistical Journal Journal statistique africain
Volume 4 – May / Mai 2007African Development Bank Group
Groupe de la Banque africaine de développement
International Comparison Program for Africa:Towards Economic Convergence Measurement
Construction and Civil Engineering Work:Designing a Time-Space Index
Estimating National Annual Average Prices within the ICP-Africa Framework: Back to Surveys
Détermination des parités de pouvoir d’achat élémentairesdans le cadre du PCI-Afrique : la méthode CPD
Comparative Consumption and Price Levels in African Countries:First Results of the International Comparison Program for Africa
Consommation et niveaux des prix dans les pays africains :premiers résultats du Programme
de comparaison internationale pour l’Afrique
Nouveaux défis en statistiques agricoles :initiatives de la FAO
Analysing Data from Participatory On-farm Trials
Invigorating the Celebrations of the African Statistics Day : LessonsLearned from the 2006 Edition
Mentoring Young Statisticians:Facilitating the Acquisition of Important Career Skills

Designations employed in this publication do not imply the expression of any opinion on the part of the African Development Bank or the Editorial Board concerning the legal status of any country or territory, or the delimitation of its frontiers. The African Development Bank ac-cepts no responsibility whatsoever for any consequences of its use.
Les dénominations employées dans cette publication n’impliquent, de la part de la Banque africaine de développement ou du comité de rédaction, aucune prise de position quant au statut juridique ou au tracé des frontières des pays. La Banque africaine de développement se dégage de toute responsabilité de l’utilisation qui pourra être faite de ces données.
Design/Layout by Phoenix Design AidPrinting by Scanprint, DenmarkISO 14001 certified and EMAS-approved
Editorial Board Chairpersons / Présidents du comité de rédaction
1. Dr. Charles Leyeka Lufumpa Director, Statistics Department African Development Bank Group, Tunis, Tunisia
2. Prof. Ben Kiregyera International Statistical Consultant and Chairman, Board of Directors, Uganda Bureau of Statistics Kampala, Uganda
Editorial Board Members / Membres du comité de rédaction
3. Prof. H.B.S. Kandeh UNDP Statistics Advisor, Sudan (formerly Statistician General, Statistics Sierra Leone)
4. Mr. Koffi N’Guessan Director, ENSEA, Abidjan, Cote d’Ivoire
5. Dr. Parin Kurji Head of Biometry Department, University of Nairobi, Kenya
6. Dr. Dimitri Sanga United Nations Economic Commission for Africa, Ethiopia
7. Prof. Rosalia Katapa Head of Statistics Depatment, University of Dar es Salam, Tanzania
8. Mr. Naman Keita Food and Agriculture Organization of the United Nations, Rome, Italy
9. Prof. James P. M Ntozi Makerere University, Uganda (formerly Director, ISAE)
10. Mr. Martin Balepa Directeur Général, Afristat, Mali

The African Statistical Journal, Volume 4, May 2007 �

Le Journal statistique africain, numéro 4, mai 20072 Le Journal statistique africain, numéro 4, mai 20072
Table des matières
Editorial
1. Programmedecomparaisoninternationalepourl’Afrique:Verslamesuredelaconvergenceéconomique...............................................9
Michel Mouyelo-Katoula, Adalbert Nshimyumuremyi, BAD, Tunis Tunisie
2. Constructionettravauxdegéniecivil:Elaborationd’unindicetemps-espace....................................................................................15
Michel Mouyelo-Katoula, Adalbert Nshimyumuremyi, BAD, Tunis Tunisie
3. EstimationdesprixmoyensannuelsdanslecadreduPCI-Afrique:Retourauxenquêtes........................................................................35
Mathieu B. Djayeola, Michel Mouyelo-Katoula, BAD, Tunis Tunisie4. Déterminationdesparitésdepouvoird’achatélémentairesdansle
cadreduPCI-Afrique:LaméthodeCPD........................................45 Folly A. D. Adjogou, Mathieu B. Djayeola, BAD, Tunis Tunisie5. Consommationetniveauxdesprixdanslespaysafricains:Premiers
résultatsduProgrammedecomparaisoninternationalepourl’Afrique..........................................................................................69
6. Nouveauxdéfisenstatistiquesagricoles:initiativesdelaFAO.........71 Haluk Kasnakoglu, Hiek Som, David Marshall, Naman Keita, Frank
Schmitt, Kafkas Caprazli, François Fonteneau, FAO, Rome, Italie7. Analysedesdonnéesdesessaisparticipatifsenmilieuréel................89 Richard Coe, ICRAF, Nairobi, Kenya8. Améliorerlescélébrationsdelajournéeafricainedelastatistique:
Leçonsapprisesdescélébrationsde2006.......................................113 Miekael Menberu, Dimitri Sanga, CEA, Addis Abeba, Ethiopie9. Mentoratdesjeunesstatisticiens:faciliterletransfertdes
connaissancespourledéveloppementdelacarrière........................123 Lehana Thabane, Marroon Thabane, Charles Harry Goldsmith,
McMaster University, CanadaLigne éditoriale ............................................................................. 139Notes aux auteurs ......................................................................... 142Remerciements .............................................................................. 145Faits saillants du premier semestre 2007 ....................................... 157• RésolutionsdelaconférencedelaCEAdesministresenchargedes
finances,duplanetdudéveloppementéconomique......................157• L’importance des statistiques en tant que base pour une politique
efficace en Afrique,Discours de Son Excellence Paul Kagame, Président de la République Rwandaise, lors du 2e Symposium Africain sur le Dével-oppement Statistique, Kigali, 15 Janvier 2007..................................167
Evénements en vue ........................................................................ 172

The African Statistical Journal, Volume 4, May 2007 �
Contents
Editorial
1. InternationalComparisonProgramforAfrica:TowardsEconomicConvergenceMeasurement...............................................................9
Michel Mouyelo-Katoula, Adalbert Nshimyumuremyi, AfDB, Tunis Tu-nisia
2. ConstructionandCivilEngineeringWork:DesigningaTime-SpaceIndex...............................................................................................15
Michel Mouyelo-Katoula, Adalbert Nshimyumuremyi, AfDB, Tunis Tu-nisia
3. EstimatingNationalAnnualAveragePriceswithintheICP-AfricaFramework:BacktoSurveys..........................................................35
Mathieu B. Djayeola & Michel Mouyelo-Katoula, AfDB, Tunis Tunisia4. ElementaryPurchasingPowerParitiesComputationWithintheICP-
AfricaFramework:CPDMethod..................................................45 Folly A. D. Adjogou, Mathieu B. Djayeola, AfDB, Tunis Tunisia5. ComparativeConsumptionandPriceLevelsinAfricanCountries:
FirstResultsoftheInternationalComparisonProgramforAfrica....676. NewChallengesinAgricultureStatistics:FAOInitiatives..............71 Haluk Kasnakoglu, Hiek Som, David Marshall, Naman Keita, Frank
Schmitt, Kafkas Caprazli, François Fonteneau, FAO, Roma, Italy7. AnalysingDatafromParticipatoryOn-farmTrials..........................89 Richard Coe, ICRAF, Nairobi, Kenya8. InvigoratingtheCelebrationsoftheAfricanStatisticsDay:Lessons
Learnedfromthe2006Edition.....................................................113 Miekael Menberu, Dimitri Sanga, ECA, Addis Ababa, Ethiopia9. MentoringYoungStatisticians:FacilitatingtheAcquisitionofImpor-
tantCareerSkills...........................................................................123 Lehana Thabane, Marroon Thabane and Charles Harry Goldsmith,
McMaster University, CanadaEditorial Policy ............................................................................. 138
Notes to Authors ........................................................................... 140
Acknowledgements ...................................................................... 144
Highlights of the First Half of 2007 ............................................. 147
• Resolutionsofthe2007ECAConferenceofAfricanMinistersofFinance,PlanningandEconomicDevelopment............................147
• The Importance of Statistics as a Basis for Effective Policy-making in Africa,Speech by His Excellency Paul Kagame, President of the Repub-lic of Rwanda, at the 2nd Africa Symposium on Statistical Development, Kigali, 15 January 2007.................................................................167
Upcoming Events .......................................................................... 172

Le Journal statistique africain, numéro 4, mai 20074 Le Journal statistique africain, numéro 4, mai 20074
Editorial
Nous souhaitons la bienvenue aux lecteurs du volume 4 du Journal etremercions tous les lecteurs qui nous ont envoyédes commentaires surlevolume3.Cevolumemetl’accentsurlecycle2005duProgrammedeComparaisonInternationale(PCI)dontlamiseenœuvreenAfriqueaétécoordonnéepar laBanqueAfricainededéveloppement (BAD).Lepro-grammePCI-Afriqueaapportéunegrandecontributionaurenforcementdescapacitésauniveaudesstatistiqueséconomiquesenparticulieretaudéveloppementdelastatistiqued’unefaçongénérale.
DepluscevolumeconsacreunarticlespécialàlaJournéeafricainedelastatistiquequiestcélébréele18novembredechaqueannéedepuislesan-nées1990.Leslecteurssesouviendrontquelesministresafricainsrespon-sablesdelaplanificationéconomiqueetdudéveloppementontadoptélePland’actiond’Addis-AbebapourledéveloppementstatistiqueenAfriquedanslesannées90danslebutdeconjurerledéclindelaproductionsta-tistiqueenAfrique.Ceplanaconsacré le18novembrecommeJournéeafricainedelastatistiqueàcélébrerchaqueannée“pouraméliorerlaprisedeconsciencepubliquesurlerôleimportantquelastatistiquejouedanstouslesaspectsdelaviesocialeetéconomique”.Danslepassé,lescélé-brationsdecejourontétéintermittentesetgénéralementinsatisfaisantes.Cependant,lescélébrationsdel’année2006ontétémarquéesparuneaug-mentationremarquabledesactivitésyrelatives.Nouspublionsunarticlesurcescélébrationsetlesleçonstiréesdecetteexpérience.
Unévénement clédudeuxième semestre2007est le2èmeSymposiumafricainsurledéveloppementstatistiquequiaétéorganiséavecsuccèsàKigali,Rwanda,enjanvier2007.LesymposiumaétéofficiellementouvertparSonExcellencePaulKagame,présidentdelaRépubliqueRwandaise,quiapartagésonpointdevuesurl’importancedelastatistiquecommebased’unepolitiqueefficaceenAfrique.NouspublionscediscoursaveclapermissiondesorganisateursduSymposium.
Laconférence2007desministresde laCEAenchargedesfinances,duplanetde l’économie,organiséeàAddisAbebadu2au3avril2007,aaussifourniuneautreoccasiondeplaidoyerenfaveurdelastatistique.LespremiersrésultatsduPCIontétéprésentésauxréunionsscientifiquesdelaconférenceetlesministresontréaffirméleurgrandsoutienaurenforce-mentdescapacitésstatistiquesenAfrique.Lesrésolutionsdelaconférencedesministressontpubliéesdans leprésentvolumeàtitred’informationgénérale.

The African Statistical Journal, Volume 4, May 2007 �
Enfin,nousvoudrionsféliciterlaCommunautéEconomiquedesEtatsdel’Afriquedel’Ouest(CEDEAO)d’avoirrelevéleprofildelastatistiqueàlaCommissionentransformantl’unitéstatistiqueenunDépartementdelarechercheetdelastatistiqueàpartentière.
Dr.CharlesLeyekaLufumpa ProfesseurBenKiregyeraCo-PrésidentduComitéderédaction Co-PrésidentduComitéderédactionDirecteurduDépartementStatistique PrésidentduConseild’AdministrationGroupedelaBanqueafricaine BureaudesStatistiquesdel’OugandadedéveloppementTunis,Tunisie Kampala,Ouganda

Le Journal statistique africain, numéro 4, mai 2007� Le Journal statistique africain, numéro 4, mai 2007�
Editorial
WewelcomereaderstoVolume4oftheJournalandthankallthosereaderswhosentuscommentsonVolume3.Thisvolumehasaspecialfocusonthe2005roundoftheInternationalComparisonProgram(ICP)whoseimplementationinAfricahasbeencoordinatedbytheAfricanDevelop-mentBank(AfDB).TheICP-Africaprogramhasmadeagreatcontribu-tiontocapacitybuildingineconomicstatisticsinparticularandstatisticaldevelopmentingeneral.
Furthermore,thecurrentvolumefeaturesaspecialarticlerelatingtoAf-ricanStatisticsDaywhichhasbeencelebratedon18thNovemberofeachyearsincethe1990s.ReaderswouldrecallthatAfricanMinistersresponsi-bleforEconomicPlanningandDevelopmentadoptedtheAddisAbabaPlanofActionforStatisticalDevelopmentinAfrica(AAPA)inthe1990sinanefforttoreversethedeclineinstatisticalproductioninAfrica.ThePlansetasidethe18thofNovemberasAfrican Statistics Daytobecelebratedeachyearinorderto“increase public awareness about the important role statistics play in all aspects of social and economic life”.Inthepast,celebrationsofthisdayhavebyandlargebeenintermittentandgenerallyunsatisfactory.However,2006witnessed anupsurge in activities tomarkAfrican StatisticsDay.Wearepublishingapaperonthesecelebrationsandlessonslearnt.
Akeyhighpointinthefirsthalfof2007hasbeenthesecondAfricaSym-posiumonStatisticalDevelopmentwhichwassuccessfullyheldinKigali,Rwanda inJanuary2007.ThesymposiumwasofficiallyopenedbyHisExcellencyPaulKagame,PresidentoftheRepublicofRwanda,whosharedhisthoughtsontheimportanceofstatisticsasabasisforeffectivepolicy-makinginAfrica.Withpermissionofthesymposiumorganizers,wearepublishingthespeech.
The 2007 ECA Conference of African Ministers of Finance, PlanningandEconomicDevelopmentheldinAddisAbabafrom2-3April,2007providedyetanotherhighpointforstatisticaladvocacy.ThefirstICPre-sultsweredisseminatedatthescientificmeetingsoftheconferenceandtheMinistersreaffirmedtheirstrongsupportforbuildingstatisticalcapacityinAfrica.The MinisterialResolutions are published in this volume forgeneralinformation.
The African Statistical Journal, Volume 4, May 2007 7
Finally,wewouldliketotakethisopportunitytocongratulatetheEco-nomicCommunityofWestAfricanStates(ECOWAS)CommissionforraisingtheprofileofstatisticsattheCommissionbyupgradingthestatis-ticsfunctionintoafullyfledgedResearchandStatisticsDepartment.
Dr.CharlesLeyekaLufumpa ProfessorBenKiregyeraCo-Chair Co-ChairEditorialBoard EditorialBoardDirector,StatisticsDepartment Chairman,BoardofDirectorsAfricanDevelopmentBankGroup UgandaBureauofStatisticsTunis,Tunisia Kampala,Uganda

Le Journal statistique africain, numéro 4, mai 2007�
Michel Mouyelo-Katoula and Adalbert Nshimyumuremyi
Le Journal statistique africain, numéro 4, mai 2007�

The African Statistical Journal, Volume 4, May 2007 �
Summary:The purpose of this paper is to highlight the main advantages that can be de-rived from the International Comparison Program for Africa (ICP-Africa), in terms of its contribution to statistical harmonization in the areas of price and national accounts statistics, in the context of monitoring economic convergence processes in the Africa region.
Key words:ICP, convergence, prices, national accounts, harmonization.
Résumé:Cet article met en relief les principaux avantages qui peuvent être tirés de la mise en œuvre du Programme de comparaison internationale pour l’Afrique (PCI-Afrique), en tant que contribution à l’harmonisation des statistiques de prix et de comptabilité nationale, dans le cadre des processus de suivi de la convergence économique de la région Afrique.
Mots clés: PCI, convergence, prix, comptes nationaux, harmonisation.
1. Introduction
AfricancountriesarestrivingtowardstheformationoftheAfricanEco-nomicCommunity(AEC).TheAfricanDevelopmentBank(AfDB),theAfricanUnion(AU),andtheUnitedNationsEconomicCommissionforAfrica (ECA) are working together on a regional integration agenda topromotepoliciesandprogramsthatwould:(i)speeduptheformationoftheAEC,(ii)promoteintra-Africantrade,(iii)harmonizeandcoordinatepoliciesandprogramsinRegionalEconomicCommunities(RECs),and(iv)promoteanddevelopinfrastructurepoliciesandprograms.Inordertoassess the economicand social integrationprocesswithin their zone,theseeconomicandmonetaryunionsneedconvergenceandsurveillance
International Comparison Program for Africa – Towards Economic Convergence Measurement.
Michel Mouyelo-Katoula2 and Adalbert Nshimyumuremyi�
1Theviewsexpressedinthispaperarethoseoftheauthorsanddonotnecessarilyrepre-sentthoseoftheAfricanDevelopmentBank.
2Manager,StatisticalCapacityBuildingDivision,AfDB,Tunis,Tunisia3ICPPrincipalStatistician,StatisticalCapacityBuildingDivision,AfDB,Tunis,Tunisia.

Le Journal statistique africain, numéro 4, mai 2007�0
Michel Mouyelo-Katoula and Adalbert Nshimyumuremyi
Le Journal statistique africain, numéro 4, mai 2007�0
statistical indicators, including indicators of population, external trade,publicfinance,prices,income,employmentandnationalaccounts.Toin-creasethecomparabilityoftheseindicatorsacrosscountries,someunionshavecreatedstatisticalunitsaimedatstrengtheningtheharmonizationofnational statistics and building sustainable capacities in member states.However,thequalityofstatisticalinformationinthemajorityofAfricancountriesremainspoorandneedsimprovement.Lackofstatisticalcapac-ity–asmanifestedintheinadequacyofhumanandfinancialresourcestoplansurveys,collect,processanddisseminatedatainatimelymanner–isoneofthekeyconstraintsfacingthemanyAfricancountriestoday.
Inrecognitionofthischallenge,theAfDBhaslaunchedamajorstatisticalcapacitybuildingprogramaimedataddressingtheseproblemsthroughtheprovisionoffinancialandtechnicalsupportundertheframeworkoftheInternationalComparisonProgramforAfrica(ICP-Africa).TheICPisaglobalstatisticalinitiativeestablishedtoproduceinternationallycompara-blepriceandexpenditurelevelstofacilitatecross-countrycomparisonsofGrossDomesticProduct(GDP)anditssub-aggregatesinrealtermsandfreeofpriceandexchangeratedistortions.
ThepurposeofthispaperistohighlightthemainadvantagesthatcanbederivedfromtheICP-Africa,intermsofitscontributiontostatisticalharmonizationintheareasofpriceandnationalaccountsstatistics.
2. Background - African Monetary Cooperation
TheAfricanMonetaryCooperationProgram(AMCP)involvesadoptionof collective policymeasures to achieve a harmonizedmonetary systemandcommonmanagementinstitution.Itenvisagestheharmonizationofthemonetarycooperationprogramsofthevarioussub-regionalgroupingsasbuildingblockswiththeultimateaimofevolvingintoasinglemonetaryzonebytheyear2021withacommoncurrencyandacommonCentralBankatthecontinentallevel.
Theachievementofmacroeconomicstabilityandconvergenceinkeymacr-oeconomicaggregatesisanecessaryconditionforthecreationofamonetaryunion.Thus,therehasalwaysbeentheneedtoadoptconvergencecriteriainordertominimizewithinatimeperiod,thedegreeofdivergenceamongtheeconomiesofcountriesintendingtoundertakemonetaryandeconomiccooperation.AcommonfeatureinmonetarycooperationprogramsofthevariousregionalgroupingsinAfricaistherequirementformembercoun-triestocomplywithasetofmacroeconomicconvergencecriteria.

The African Statistical Journal, Volume 4, May 2007 ��
International Comparison Program for Africa – Towards Economic Convergence measurement
Given the importance of macroeconomic convergence, the measures toachievetheobjectiveoftheAfricanMonetaryCooperationProgramwouldinclude, the adjustment of exchange rate of member countries to theirequilibriumlevels,eventual liberalizationofcurrentandcapitalaccounttransactions, adoptionofharmonizedexchange rate system,harmoniza-tionofceilingoncentralbanks’credittogovernmentinordertoensurefiscalpolicyharmonizationandtheadoptionofmarket-orientedapproachtotheconductofmonetarypolicy.
Buildingontheprogresssofarachievedinthevarioussub-regionalgroup-ings,allcountriesshouldattainthefollowingPrimaryandSecondarycri-teriabeforethelaunchingoftheAfricanMonetaryUnion.
PrimaryCriteria• Overallbudgetdeficit/GDPratio(excludinggrants)oflessthan3per
cent.• Inflationrateoflessthan3percent.• MinimizationofCentralBankfinancingofbudgetdeficit.• External reservesof equal toormore than sixmonthsof importsof
goodsandservices.
SecondaryCriteria• Domesticfiscalreceipts/GDPratioofequaltoormorethan20%.• Salarymass/totaldomesticfiscalreceiptsratiooflessthan35%.• Realexchangeratestabilitytobemaintainedbyeachcountry.• Thesouringofminimumof20%governmentinvestmentcapitalfrom
fiscalreceipts.• Interestrates-Themaintenanceofpositiverealinterestrates.
3. Leveraging on ICP-Africa for GDP and price related criteria
3.1 Major requirement: statistical harmonization
GDPandinflationrelatedindicatorsrequirerelevantstatisticalsystemstobeharmonizedatsub-regionalandregionallevels,intermsof:• Proposing common definitions of indicators to be used to monitor
convergencecriteria;• Underscoringthescopeoftheindicators,theirmaincomponentsorthe
indicatorstheyarederivedfrom,theirmaincomponents,statusaswellasdesiredfrequency;

Le Journal statistique africain, numéro 4, mai 2007�2
Michel Mouyelo-Katoula and Adalbert Nshimyumuremyi
Le Journal statistique africain, numéro 4, mai 2007�2
• Determining the statistical framework which would ensure datacomparability;and
• ProvidingguidelinesforfutureactivitiesinordertosetupaharmonisedstatisticalsysteminAfrica.
3.2 Selected advantages of the ICP-Africa approach
Given the nature and features of the ICP-Africa, it is envisaged that itshouldbeusedbyallAfricancountries,theAfDBandallitsotherpartnersintheregionasthereferenceframeworkfortheharmonizationofGDPandpricestatisticsandthetimelygenerationofrelevantindicatorsforallAfricancountries.
ICP price survey activities are conducted for all main uses of GDP:(i)householdconsumption;(ii)Equipmentgoods;(iii)Constructionandcivil engineering; and (iv)Nonmarket services relating toGovernmentconsumption.
ICPhouseholdpricesurveyshaveanationwidescopeinmostofthecoun-tries,coveringallregions/provincesineachparticipatingcountry.Thegeo-graphicalstratificationprovidesfortheurban/ruraldichotomytobetakenintoconsiderationintheidentificationoflocationswherepricesarecol-lected.Outletsinurbanandruralareaswereselectedtoadequatelyaddresspovertyissues.WhilebuildingontheexistingCPIswhereverpossible,theICPsurveysbroadenthescopeofCPIpricecollections.Thesamplesofoutletsarelarger,includingallpossiblecategoriesofpointsofsalespatron-izedbyconsumers.Thebasketsofgoodsandservicesrepresentallcatego-riesofhouseholdconsumptionasdefinedbyinternationalclassificationofindividualconsumptionbypurpose.
Inthisregard,AfDBdevelopedtheICP-Africaclassificationthatservedas thebasis for theselectionanddescriptionof itemstobepriced.TheAfDBandparticipatingcountriesdevelopedStructuredProductDescrip-tions(SPDs)anddefinedabout3,000productsamongwhich853wereretainedforactualpricinginthecontextoftheprogram.
PricecollectionforGrossFixedCapitalformationisnotyetpartofcoun-tries’routinestatisticalactivities.Countriesareexpectedtotakeadvantageof the implementationof theprogramtosetupapermanentsystemofsurveyingequipmentgoodsandconstructionandcivilengineeringworks,usingmethodsdevelopedbytheWorldBankandtheAfDB.
The African Statistical Journal, Volume 4, May 2007 ��
International Comparison Program for Africa – Towards Economic Convergence measurement
Surveysonequipmentgoodstakeplaceinallmajorcitiesor,dependingonthestructureofthenationalmarketforsuchitems,restrictedtocapitalcities.SPDsandasampleofabout500itemstobepricedweredesignedbytheWorldBankandreviewedbytheAfDBandthecountries.
Pricedataforconstructionandcivilengineeringworksareobtainedfromarchitects; contractors and quantity surveyors using a method of SPD-basedbasketofconstructioncomponents(BOCC).34constructioncom-ponentsrepresentingthemajorcategoriesoftheconstructionandcivilen-gineeringsectorweredefined,comprehensivelydescribedandsubmittedtothecountriesforpricingbytheirconstructionspecialists.
NationalAccountsactivitiesconstitutethebackboneoftheprogram,astheimmediateobjectiveoftheprogramistofacilitatecross-countrycom-parisonsofrealincome,usingPPP-deflatedGDPexpenditures.Giventhepoorqualityofnationalaccountsinmostcountries,dueemphasisisputontheneedforallparticipatingcountriestoshifttotheimplementationofthe1993SystemofNationalAccounts(SNA1993)andimprovethecompilationoftheirGDPs.
4. Issues to be addressed in the harmonization process
Fourtypesofissuesaretobeconsiderediftheharmonizationprocessistobeimplementedeffectively:• General issues to be considered – require a common definition of
inflation, covering all GDP components, to be agreed across thecountries, the same GDP classification to be used (the ICP-Africaclassificationwassuccessfullyusedby48Africancountries),andacleardistinctiontobemadebetweenbasicheadingsintheclassificationforwhichpriceindicescanbecomputeddirectlyfromsurveyedpricesandotherbasicheadingswhichreferencepriceindiceswillberequired.
• Issuespertainingtopricestatistics–pointtotheneedto:(i)re-affirmgeneralprinciplesofitemselectionandleveragingonrelevantmethodsused in the ICP-Africa such as the structured product descriptionmethod(SPD);(ii)ensureeffectiveoutletsamplingandproduct-outletmapping;(iii)usetheICPmethodofbasketsofconstruction;(iv)buildon existing ICP survey manuals and country’s survey frameworks;(v) improve data quality by applying ICP quality control packages(SEMPER,SEMPERTIMELINE,ELFA);(vi)establishasystemofmeasurementofregionalinflationwhereweightingfactorswillbePPP-adjusted;and(vii)strivingtowardsCPI-ICPintegration.
Le Journal statistique africain, numéro 4, mai 2007�4
Michel Mouyelo-Katoula and Adalbert Nshimyumuremyi
Le Journal statistique africain, numéro 4, mai 2007�4
• IssuesrelatedtoNationalAccounts–arecenteredontheimplementationof the1993SNAwhichneedstobe improvedby: (i)extendingtheproduction boundary and addressing the non-observed economy;(ii) assessing each country’s implementation of the system using theSNA1993compliancecheck-list;and(iii)acknowledgingNPISHsinNationalAccounts.
5. Conclusion
Theavailabilityofcomprehensive,timelyandaccuratestatisticalinforma-tioniscrucialforeffectivenationaldevelopmentpolicymaking,decisiontakingaswellasforestablishingandmonitoringeconomicconvergenceprocesses.Intermsofconvergencecriteria,Africancountrieswillbeex-pectedtomeetGDPrelatedcriteriaandhavesustainablepriceperform-ance and their annual average inflation rate should not exceed a giventhresholddeterminedinrelationtobest-performingcountriesintermsofpricestability.Thisrequiresapermanentstatisticalmonitoringsystemtobeputinplace,whichcanbuildonrelevanteffortsbeingmadeatsub-re-gionallevel,aswellasonlessonslearnedfromtheInternationalCompari-sonprogramforAfrica.
References
Oyedije,T.(2000),Policies for regional integration in Africa,Economicre-searchpapersN°62,AfricanDevelopmentBank;
Michel Mouyelo-Katoula (2006), Statistical Capacity Building in Africa – Towards Economic Convergence,Paperpresentedat theMeetingof theAssociationofAfricanCentralBanks,Nairobi,Kenya,April3-7,2006
Commission of the European Communities (Eurostat), InternationalMonetaryFund,OrganisationforEconomicCooperationandDevelop-ment, United Nations,World Bank, System of National Accounts, 1993(Brussels/Luxembourg,NewYork,Paris,Washington,1993)
CommissionoftheEuropeanCommunities(Eurostat),OrganisationforEconomicCooperationandDevelopment,Eurostat/OECD PPP Methodo-logical Manual (Eurostatwebsite<http://forum.europa.eu.int/Public/irc/dsis/palojpi/library?l=/methodological_papers/ppp_manual&vm=detailed&sb=Title>,2006)

The African Statistical Journal, Volume 4, May 2007 ��
Summary:Pricing in the construction sector is resource intensive compared to many other sectors. In most of the countries participating in the ICP, prices collection for the program has been largely disconnected with the regular price collection processes aiming at producing inter-temporal price indices. Inter-temporal price indices for the construction sector are often calculated using a basket of construction material and labor prices. This approach doesn’t permit to take into account the inter-temporal fluctuations of productivity nor to address correctly the prob-lem linked to the trade-off between labor and equipment tradeoff. This article presents the Basket of Construction Components (BOCC) approach that was developed with a view to eradicate both these problems. The BOCC approach provides a much simpler and better defined price comparison tool that can help to drastically reduce the resources and the expertise required for price data col-lection. Due to its simplicity, it is plausible that the basket can be adapted to be used in national inter-temporal price comparisons.
Key words: Price indices, basket of construction components approach, ICP
Résumé :La collecte des prix dans le secteur de la construction requiert des moyens im-portants comparativement à plusieurs autres secteurs. Dans la plupart des pays participant au PCI, la collecte des prix a été en grande partie déconnectée du processus de collecte régulier des prix nécessaires au calcul des indices des prix temporels. Les indices temporels des prix pour le secteur de la construction sont souvent calculés en utilisant des prix correspondant à un panier de maté-riaux de construction et de travail. Cette approche ne permet pas de prendre en compte les fluctuations de productivité dans le temps, ni de traiter correctement le problème lié à la distinction entre le travail et les équipements. Cet article présente l’approche du panier de composantes de construction (BOCC) qui a été développé afin de répondre à ces deux problèmes. L’approche BOCC fournit un outil de comparaison des prix beaucoup plus simple et mieux défini qui peut aider à réduire de façon significative les ressources et l’expertise exigées pour la
Construction and Civil Engineering Work: Designing a Time-Space Index
Michel Mouyelo-Katoula2 and Adalbert Nshimyumuremyi�
1Theviewsexpressedinthispaperarethoseoftheauthorsanddonotnecessarilyrepre-sentthoseoftheAfricanDevelopmentBank.
2Manager,StatisticalCapacityBuildingDivision,AfDB,Tunis,TunisiaManager3ICPPrincipalStatistician,StatisticalCapacityBuildingDivision,AfDB,Tunis,Tunisia.

Le Journal statistique africain, numéro 4, mai 2007��
Michel Mouyelo-Katoula and Adalbert Nshimyumuremyi
Le Journal statistique africain, numéro 4, mai 2007��
collecte des prix. Sa simplicité permet d’adapter le panier à des comparaisons temporelles des prix au niveau national
Mots clé s: Indices des prix, approche du panier de composants de construc-tion, PCI
1. Introduction
TheInternationalComparisonProgram(ICP)isaglobalstatisticalinitia-tiveaimedatproducingestimatesofpricelevels,expenditurevalues,andpurchasingpowerparities(PPPs)thatallowforcross-countrycomparisonsofpricelevels,andeconomicaggregatesinrealterms.TheAfricacompo-nentoftheprogramismanagedandcoordinatedbytheAfricanDevelop-mentBank(AfDB)andiscommonlyreferredtoasICP-Africa.
Tasks involved in the ICP-Africa include: (i) compiling GDP aggre-gatesincompliancewiththe1993SystemofNationalAccounts(SNA);(ii)disaggregatingGDPintodetailedcategoriesforwhichexpenditureandpricedatacanbeobtained;(iii)conductingnation-widepricesurveysforsamplesofitemsrepresentingallmaincomponentsofGDP;(iv)comput-ingpriceratiosforidentical/comparableitemsacrosscountries/space,thusgeneratingelementaryPPPs;and(v)aggregatingelementaryPPPsforallGDPcomponents.
AsanimportantGDPcomponent,GrossFixedCapitalFormation(GFCF)isdivided intoMachineryandEquipment,andConstructionandCivilEngineeringforwhichspecificdatacollectionexercisesarebeingconduct-edbycountriesparticipatingintheICP-Africa.
Pricingintheconstructionsectorisresourceintensivecomparedtomanyothersectors.Thepricingofthecomponentsinvolvedinaconstructionproject requires expertise that isnotnormallyavailablewithinNationalStatisticsOffices(NSO).Theexpertisethatisrequiredincludesafamili-aritywith theusualmeansandmethodsof the sectoraswell asexperi-encewithrecentevolutionoftheconstructioncosts.Thiskindofexpertisemust be mobilized by the NSOs (typically on a consulting basis) fromconstruction,engineering,orarchitecturalcompaniesorGovernmentde-partments.
Giventhatthelevelofeffortrequired,andtherelatedcostofthateffort,isdirectlylinkedtothenumberandthecomplexityoftheconstruction
The African Statistical Journal, Volume 4, May 2007 �7
Construction and Civil Engineering: designing a time-space index
components to be priced, there is a need to focus on a relatively shortlist of components.These selected componentsmight be representativeandcomparablewithregardstomeansandmethods,andcanbebroadlyillustrativeofthemajorcapital-intensivesystemsintheconstructedfacili-ties.Inthisregard,theBasketofConstructionComponents(BOCC)ap-proachwasdevelopedwithaviewofreachingthisobjective.
InSeptember2004,theTechnicalAdvisoryGroup(TAG)fortheInter-nationalComparisonProgram(ICP)recommendedtheuseoftheBasketofConstructionComponents (BOCC)approach forprice comparisonsin theconstruction sector.This recommendationwasbasedondetailedstudiesthatwereconductedundertheaegisoftheAfDBandWorldBankbetween2002and2004.
TheBOCCapproachwasformalizedinaseriesofthreereportsthatwereproducedandsubmittedtotheAfDBandtheWorldBank.(WalshandSawhney, 2002, 2004, 2005).The first report entitled “An Implemen-tation Framework for the Basket of Construction Components Ap-proach” provides the theoretical and conceptual underpinnings for theBOCCmethod.Thesecondreportentitled“Process for Implementation of the Basket of Construction Components Approach” highlights andexplainsthehierarchicalstructureoftheBOCCapproach.KeydefinitionsoftheBOCCconceptsarealsoprovidedinthisreport.Thethirdreportentitled“Identification of Construction Systems and Components for the BOCC Approach”providesalistofConstructioncomponentsintheformofStandardProductDescriptions(SPD).ThereportservesasabasicguidelineforthecompleteimplementationoftheBOCCapproachatthenationallevel.
Thisarticlesynthesizesthecontentsofthesethreereports,firstasaguide-line for the ICPnational coordinators and second as a tool for furtherimprovingnationalpricedatacollection intheconstructionsector.TheAfDBiscurrentlypreparingatechnicalcomplementtothisworkinor-dertoaddressthequestionoftheinter-temporalcomparisonsundertheBOCCapproach.
2. The complexity of comparisons in the construction sector
The complex and variable nature of the construction sector makes it adifficultsectortointegrateintostandardizedeconometricsystemsandinmanywayscanbetermedasa“comparisonresistant”sector.Theconstruc-tionindustryconsistsofafragmentedarrayofcontractors,subcontractors,
Le Journal statistique africain, numéro 4, mai 2007��
Michel Mouyelo-Katoula and Adalbert Nshimyumuremyi
Le Journal statistique africain, numéro 4, mai 2007��
andsuppliers.Theconstructionindustrysupplychainisextremelycom-plexastherearenoformalizedindustrystructuresthatrepresentallofitsstakeholders.Itsprimaryoutputisaseriesofprojects,eachresultinginauniquelyconstructedfacility.Theindustryistypifiedbytemporary,con-tract-drivenrelationshipsbetweentheparticipantsofagivenproject,andthisconditionmakessatisfactorycharacterizationandcollectionofnation-alstatisticsverydifficulttoachieve.Thelifecycleandtimelineofconstruc-tionprojectsfurthercomplicatescollectionofpricesandtheirrelationshiptoexpendituresinnationalaccounts.Itiscommontofindconstructionprojectswithdurationrangingfromafewmonthstoseveralyears.Fur-thermore,theindustrydoesnotreally“exist”withinagivennationasallprojectsatsomepointintheirsupplychainsformaterials,equipment,orlabor,reachoutintotheinterconnectedglobalindustry.
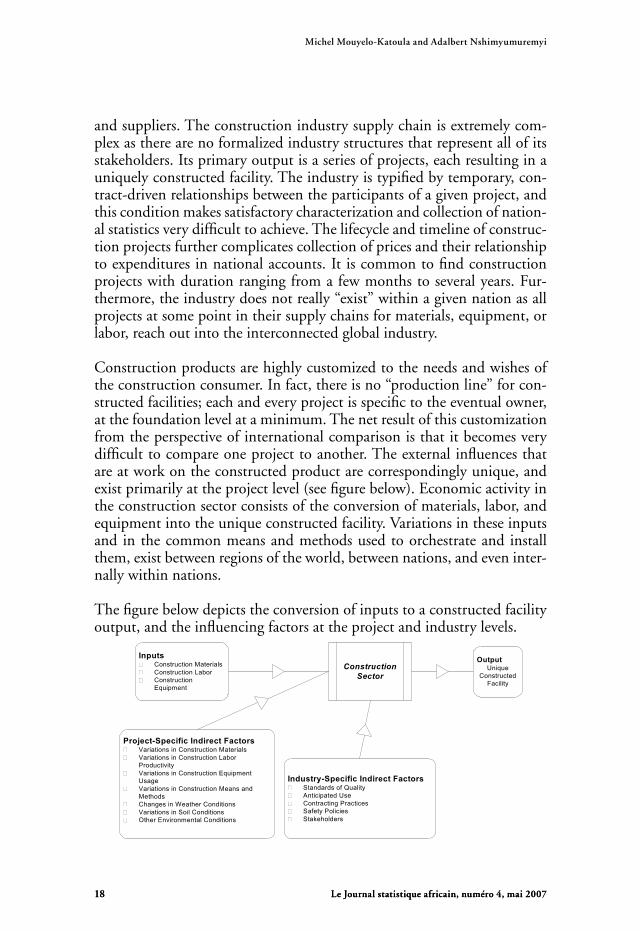
Constructionproductsarehighlycustomizedtotheneedsandwishesoftheconstructionconsumer.Infact,thereisno“productionline”forcon-structedfacilities;eachandeveryprojectisspecifictotheeventualowner,atthefoundationlevelataminimum.Thenetresultofthiscustomizationfromtheperspectiveofinternationalcomparisonisthatitbecomesverydifficulttocompareoneprojecttoanother.Theexternalinfluencesthatareatworkontheconstructedproductarecorrespondinglyunique,andexistprimarilyattheprojectlevel(seefigurebelow).Economicactivityintheconstructionsectorconsistsoftheconversionofmaterials,labor,andequipmentintotheuniqueconstructedfacility.Variationsintheseinputsand inthecommonmeansandmethodsusedtoorchestrateand installthem,existbetweenregionsoftheworld,betweennations,andeveninter-nallywithinnations.
Thefigurebelowdepictstheconversionofinputstoaconstructedfacilityoutput,andtheinfluencingfactorsattheprojectandindustrylevels.
ConstructionSector
InputsConstruction MaterialsConstruction LaborConstructionEquipment
OutputUnique
ConstructedFacility
Project-Specific Indirect FactorsVariations in Construction MaterialsVariations in Construction LaborProductivityVariations in Construction EquipmentUsageVariations in Construction Means andMethodsChanges in Weather ConditionsVariations in Soil ConditionsOther Environmental Conditions
Industry-Specific Indirect FactorsStandards of QualityAnticipated UseContracting PracticesSafety PoliciesStakeholders

The African Statistical Journal, Volume 4, May 2007 ��
Construction and Civil Engineering: designing a time-space index
Because these factorsnever combine inquite the sameway twice, eachconstructedfacilityisunique.Thecostofaconstructionprojectisdirectlyinfluencedbytheselectionofmeansandmethodsofputtingmaterialsinplace,thematerialsthemselves,andthelaborandequipmentratesinuseatthattimeandplace.However,thereareanumberofindirectinfluencesthataffectthesechoices.Anumberoftheseindirectfactorsarerepresentedinthefigureabove,termed“indirect”herebecausetheymodifytheselec-tionofmaterials,equipment,labor,ormethods,butdonotappearonthebillsofquantitiesthemselves.Becauseconstructionoutputsareinherentlydifficulttocompare,thisstudywasconceivedandconductedtofurtherdevelopconceptsforthenecessarypricecomparisonsintheconstructionsector.
3. The different methods used for price comparisons in the con-struction sector
Spatialcomparisonofconstructionsectorpricingcanbeperformedusinganumberofapproaches.Inabroadsensetheseapproachescanfallunderoneofthefollowingthreecategories:
1. Pricing a basket of standard (hypothetical) construction projects :ThisapproachhasbeenusedforthepastroundsofICPcomparisons.Thecruxofthisapproachistoaskcountriestopriceusingtheunitpriceapproachanumberofstandardconstructionprojects.Theinstrumentusedinthepricingeffort iscalledthebillofquantities (BOQ).BOQsforstandardresidential,non-residentialandcivilengineeringprojectsareusedforpricecollection.
2. Pricing a basket of construction inputs—material, labor, and equipment : Thisapproachisprimarilyusedfortemporalconstructionindicesdevelopedbycountriesorregions.Suchusemakesthemethodappealing,atleastatfirstblush,asitcarriesthesuggestionthattemporalcomparisons already available might be fit within the framework ofspatialcomparisonandaugmenttheutilityofbothtypesofcomparison.Thisapproachrequiresonlythatonemonitorsthepricesforgoodsand/orservicesincludedinthebasket,andcomparethemtopricesatsomeothertime(or,inthecaseofPPP,atsomeotherplace).
3. Pricing a basket of construction components : This approachresembles the basket of construction inputs approach in that itrevolves around the concept of pricing a fixed set of items. As thename suggests the basket that is used for price comparison consists

Le Journal statistique africain, numéro 4, mai 200720
Michel Mouyelo-Katoula and Adalbert Nshimyumuremyi
Le Journal statistique africain, numéro 4, mai 200720
of construction components. Construction components are tangibleunitsofaconstructionprojectthatconsumeinputssuchasmaterial,labor,andequipment.Inhierarchicaltermsconstructioncomponentslie somewhere between the construction inputs and constructionprojects.
Traditionallypricecalculationsfortheconstructionsector intheframe-workoftheICParerealizedbygeneratingestimatedcostsfor20standardconstructionprojects,forwhichbillsofquantities(BOQ)andspecifica-tionshavebeendeveloped.Accordingtotheproceduresthatwereestab-lished by Eurostat in the early stage of the ICP, each bill of quantitiesrequirespriceestimationfor10to20chapters,eachconsistingof100to1000individualconstructionitems.The1993ICProundwasconductedusingthisparticularmethodandsignificantconcernsaroseregardingtheresources needed to collect these price data. Subsequently the standardprojectmethod (SPM)wasmodified.A“reducedbillofquantities”ap-proachwasset-up,inwhichmanyoftheindividualitemswereeliminated.However, a substantial number of prices still remained to be gathered.Thereistodayastrongconcernthatthelevelofeffortsandofresourcesrequiredforthisprocessmayhamperthedevelopment,andeventhecon-tinuedundertaking,ofpricecomparisonsintheconstructionsector.
SomepartnersoftheICPprogramhavealsocasttheirdoubtsontheac-curacyofthedatacollectedandonthecredibilityofthepriceestimationprocessintheconstructionsector.
Inadditionthepriceestimationattheconstructionprojectlevelhasmanypitfalls.Manyauthorshavepointedoutthattherecanbeaverywiderangeinprojectcostestimates,andthattheseestimatescancompareverypoorlytotheactualcostoftheconstructionprojects.Theprimarypredictorofestimateaccuracyis theeffortexpendedtoproducetheestimate,whichraisesobviousconcernsabouttheICPgiventhedisparateresourcesamongNSO’s.
Giventhatthelevelofeffortrequired,andtherelatedcostofthateffort,isdirectlylinkedtothenumberandthecomplexityofthecomponentstobepriced,thereisaneedtofocusonarelativelyshortlistofcomponents.These selected components might be representative and comparable inregardstomeansandmethods,andwhichcanbebroadlyillustrativeofthemajorcapital-intensivesystemsintheconstructedfacilities.TheBOCCapproachisaimedatreachingthisobjective.

The African Statistical Journal, Volume 4, May 2007 2�
Construction and Civil Engineering: designing a time-space index
4. The BBOC approach in 2005 ICP round
Theconstructionsectorcanbedividedinto3categoriesofworksreferredto as “basic headings”. These are: residential buildings, non-residentialbuildings,andcivilengineeringworks.CodesattachedtoeachcategoryrelatetotheICP-Africaclassification.
502Construction
502.1 ResidentialBuildings
502.2 Non-ResidentialBuildings
502.3 Civil EngineeringWorks
One-family and multi-familydwellings, detached, semi-detached and terracedhouses
All non-residential farmbuildings; all industrialbuildings; office buildings;buildings for health,educational, cultural andreligious purposes
Roads, streets, andhighways; railroads; harbors;airports; canals andwaterways; pipelines for gas,water and sewer systems;telephone and telegraphssystems; electricitytransmission infrastructure;oil wells, gas wells, mineshafts, dams, dikes etc.
TheBOCCapproachbuildsonthreemainconcepts:project,systemandcomponent.
Aprojectistheentiretyofaconstructionenterprise,resultinginarelative-lywelldefinedfacilityforessentiallyasinglepurpose.Examplesincludetheconstructionofabuilding,theconstructionofacampusofbuildingsmore-or-lesssimultaneously,ortheconstructionofasectionofroadwayincludinginterchanges,bridges,anddrainageappurtenances.
Asystemisasetofrelatedcomponentswithinaprojectthatsatisfyagivenfunction.Forexample,thestructuralsystemwithinabuildingisintendedtodenotethatsetofcomponentsthatservethepurposeofsupportingthebuilding,andwouldincludefoundations,columns,beams,girders,head-ers,andsoon.Itwouldnotincludetheheatingandventilationequipmentornon-structuralexteriorcladding.Systemsaredefinedasshowninthefollowingtables:

Le Journal statistique africain, numéro 4, mai 200722
Michel Mouyelo-Katoula and Adalbert Nshimyumuremyi
Le Journal statistique africain, numéro 4, mai 200722
ConstructionSystemsfortheResidentialSub-sector
System Name System Explanation
Site-work Constructioncomponentsrelatedtositepreparationofaresidentialconstructionproject
Substructure Structuralcomponentsandrelatedworkitemsbelowthegroundsurfacethatarepartofaresidentialcon-structionproject.Thesecomponentsareload-bearingandtransferalltheloadsfromthesuperstructuretothegroundbelow
Superstructure Structuralcomponentsandrelatedworkitemsabovethegroundsurfacethatarepartofaresidentialcon-structionproject.Thesecomponentsareload-bearingandprovideresistancetoliveanddeadloadonthebuilding
ExteriorShell/BuildingEnve-lope
Constructioncomponentsthatformtheexteriorshellofaresidentialconstructionproject.Theyarenon-load-bearingmembersthatrestuponthesuper-structureofthebuilding
InteriorPartitions Allinteriorwallsandopeninginthebuilding
InteriorandExteriorFinishes Allconstructioncomponentsinplaceforthepurposeofsatisfyingacosmeticfunction,includingforexam-plepaintorplaster.
MechanicalandPlumbing Allconstructioncomponentsrelatedtoprovidingclimatecontrolorwaterservicessuchasheatingandcoolingsystems,hotandcoldwatersystems,firefightingsystemsetc.
Electrical Allconstructioncomponentsrelatedtodistributionofalternatingcurrentanddirectcurrentincludingelectricalfixturesforaresidentialconstructionproject

The African Statistical Journal, Volume 4, May 2007 2�
Construction and Civil Engineering: designing a time-space index
ConstructionSystemsfortheNon-ResidentialSub-sector
System Name System Explanation
Site-work Constructioncomponentsrelatedtositepreparationofanon-residentialconstructionproject
Substructure Structuralcomponentsandrelatedworkitemsbelowthegroundsurfacethatarepartofanon-residentialconstructionproject.Thesecomponentsareload-bearingandtransferalltheloadsfromthesuperstruc-turetothegroundbelow
Superstructure Structuralcomponentsandrelatedworkitemsabovethegroundsurfacethatarepartofanon-residentialconstructionproject.Thesecomponentsareload-bearingandprovideresistanceofalltypesofliveanddeadloadonthebuilding
ExteriorShell/BuildingEnve-lope
Constructioncomponentsthatformtheexteriorshellofaresidentialconstructionproject.Theyarenon-load-bearingmembersthatrestuponthesuper-structureofthebuilding
InteriorPartitions Allinteriorwallsandopeninginthebuilding
InteriorandExteriorFinishes Allconstructioncomponentsinplaceforthepurposeofsatisfyingacosmeticfunction,includingforexam-plepaintorplaster
MechanicalandPlumbing Allconstructioncomponentsrelatedtoprovidingclimatecontrolorwaterservicessuchasheatingandcoolingsystems,hotandcoldwatersystems,firefightingsystemsetc.
Electrical Allconstructioncomponentsrelatedtodistributionofalternatingcurrentanddirectcurrentincludingelectricalfixturesforanon-residentialconstructionproject
ConstructionSystemsfortheCivilEngineeringWorksSub-sector
System Name System Explanation
Site-work Constructioncomponentsrelatedtositeprepa-rationofacivilengineeringprojectincludingearthwork,earthmoving,andsurfacetreatmentssuchsidewalksandpavements
Substructure Structuralcomponentsandrelatedworkitemsbelowthegroundsurfacethatarepartofacivilengineeringproject.Thesecomponentsareload-bearingandtransferalltheloadsfromthesuperstructuretothegroundbelow

Le Journal statistique africain, numéro 4, mai 200724
Michel Mouyelo-Katoula and Adalbert Nshimyumuremyi
Le Journal statistique africain, numéro 4, mai 200724
System Name System Explanation
Superstructure Structuralcomponentsandrelatedworkitemsabovethegroundsurfacethatarepartofacivilengineeringproject.Thesecomponentsareload-bearingandprovideresistancetoliveanddeadloads
MechanicalEquipment Equipmentinstalledoncivilengineeringprojectssuchaspumps,turbines,boilers,airhandlingequipment,coolingtowers,vesselsetc.includingallconnectingpipesandvalves.Mechanicalin-cludesutilitysystems(steam,compressedair,andrefrigeration),processsystems(rotatingpumps,compressors,agitators,filters,etc.)specialvesseldesign(tanks,pressurevessels),etc.
ElectricalEquipment Equipmentinstalledoncivilengineeringprojectsforpowerdistributionsystems,substations,powerdistributionpanels,motorcontrolcenters,lighting,communications,etc.
UndergroundUtility Anyundergroundline,systemorfacilityusedforproducing,storing,conveying,transmitting,ordis-tributingcommunicationortelecommunication,electricity,gas,petroleumandpetroleumprod-ucts,coalslurry,hazardousliquids,waterunderpressure,steam,orsanitarysewage.Theseincludewires,ducts,fiberopticcable,conduits,pipes,sew-ers,andcablesandtheirconnectedappurtenancesinstalledbeneaththesurfaceoftheground
Acomponentisacombinationofmaterialsintheirfinalintendedloca-tionwhichcanbeclearlyidentifiedtoasimplepurposewithintheproject;thebuildingblocksofasystem.Forexample,acolumnisacomponent.Acomponentwillingeneralconsistofsomematerialsmanipulatedinsomeway,transportedtoafinallocationattheprojectsite,andconnectedtoothercomponentswithlaborandequipmentasappropriatetomeansandmethodsemployedinagivencountry.
Therelationshipbetweenprojects,systems,andcomponentsisillustratedinthefigurebelow.Inthisfigureahypotheticalprojectisshownconsistingof three systems.Each system is furtherbrokendown into its constitu-entcomponents;witheachcomponentmadeupofmaterial, laborandequipment.Inessence,thistaxonomysupportsahierarchicaldecomposi-tionoftheprojectintosmaller“chunks”.Thecostcontributionofeachcomponenttothetotalsystemandprojectcostscanthenbedeveloped,usingstandardconstructioncostestimatingandaccountingprinciples,by

The African Statistical Journal, Volume 4, May 2007 2�
Construction and Civil Engineering: designing a time-space index
rollingupalongthebranchesofthetree.Costsforanygivencomponentcanbedevelopedfromtheunitcostsofmaterials(includinganynecessaryconsumables)andtheexpectedquantityofmaterialstocreatethatcom-ponent,laborratesandlaborfactors,andequipmentratesandfactors.Ex-pertsspecializedintheestimationofconstructioncostsaregenerallyveryskilledandexperiencedinmakingthesecalculations.Asimilarbreakdowncouldbeconductedforanyofthesystemsinaproject,ofcourse.
Project
System-1 System-2 System-3
Component-3Component-1
Component-7Component-6Component-5Component-4
Component-9Component-8 Component-10
Material Labor Equipment
Breakdown not shown due to space limitation
Component-2
The fundamental conceptual basis of the BOCC is to measure relativepricesattheleveloftheconstructioncomponent.Aconstructioncompo-nentisaproductionunitthatcanbefullydefinedasaportionofacom-pleteconstructionproject.Theconstructioncomponentthusfallsbetweenaconstructionproject(e.g.,acompletestructure)andaconstructionworkitem(e.g.apieceofreinforcingsteel).Theconstructioncomponentcanbethoughtofasanaggregationofseveralconstructionworkitems,includ-ingthematerialactuallyputinplace,thelaborandequipmentrequiredto accomplish that task, and any consumables that might be required(e.g.formwork,blades,orwastelumber).Becausethelabor,equipment,andconsumablesaredirectlyincludedintheprice,theconstructioncom-ponentalsoinherentlyaccommodatesdifferencesinproductivity,thela-borequipment tradeoff, anddifferences inmeansandmethodsof con-struction.
Pricingoftheconstructioncomponentsisintendedtoincludethepriceofthegooditself,anyconsumablesrequiredintheconstructionprocess,andthecostofthelabororequipmentrequiredtoinstallit.Thepricecouldbefurtheradjustedtoincludeappropriatemarkups(taxes,fees,profit,etc.).

Le Journal statistique africain, numéro 4, mai 20072�
Michel Mouyelo-Katoula and Adalbert Nshimyumuremyi
Le Journal statistique africain, numéro 4, mai 20072�
Theadvisabilityofandmethodsforinclusionofmarkupsdependtosomeextentonthemethodsusedinthenationalaccounts.
Toensurethatallcountriespricethesameconstructioncomponents,34specific formshavebeenprovidedwhichneedtobecompletedbyeachcountry.EachformrelatestotheStructuredProductDescription(SPD)ofaparticularcomponent.
Eachformisidentifiedbythecodeandnameofthecomponent(Example:5.02.00.0.01AggregateBase). It contains3 sections - (a)Source Infor-mation,(b)Quantityanddetails,(c)Pricinginformationwhichmustbecompletedcarefully.Anyadditionalcommentshasalsotobeprovided.All34formshavetobecompleted.Theseformsarecompletedatthecountrylevel.
5. Expenditure weights in the BOCC approach
Somecomponentscanbeappropriatetomorethanoneconstructionba-sic heading (sub-sector).The Civil EngineeringWorks sub-sector posesspecificproblemsasitincludesawidearrayofpossibleprojects.Thissub-sectorequallyincorporatesasmalldrainageenhancementproject,withavalueequivalenttoafewthousanddollars,andanenormousdamorair-portwithavalueofseveralbillioneuros.Findingcommonbuildingblocksforbothoftheseprojectsisnoteasy.Ofcourse,thisproblemwouldariseforanysystemofmeasurement,butforthissectorsomecommonelementsmaystillbe identifiable.Earthworkisnearlyalwaysapartofcivilengi-neeringworks,asisconcreteplacement.Additionalcivilengineeringre-latedcomponentssuchassitepreparation,haulage,massconcrete,asphaltconcrete,andutility/drainageworksrepresentsystemsofcivilengineeringworksthatarealmostincludedineveryprojects.
System of weights
TheBOCCapproachusesthreetypesofweights:
W1,fortheaggregationattheleveloftheconstructionsub-sectors,i.e.fortheresidential,non-residentialandcivilengineeringbaskets,
W2,fortheaggregationatthelevelofthesystems,
W3,atthelevelofthecomponentsfortheinclusionoflaborproductivityandofthelabor/equipmenttradeoff.

The African Statistical Journal, Volume 4, May 2007 27
Construction and Civil Engineering: designing a time-space index
Thesethreelevelsofaggregationareshowninthetablebelow.
Material Labor Equipment
Breakdown not shown due to space limitation
System-1System-2
Residential BOCC
System-3
Basket
Civil BOCCNon-Residential BOCC
Construction
W1
W2
W3
Component-1 Component-2 Component-3 Component-4 Component-5 Component-6 Component-7 Component-8 Component-9 Component-10
TheweightsW3aredesignedwithin theBOCCapproachandarenotrequiredtobeidentifiedexplicitly.
Procedure for Calculating W2
Nationalexpertshavetoreviewthelistingofthesystemsfortheresiden-tial,non-residential,andcivilengineeringsub-sectors.Theyreviewpricinginformationonongoingprojectsforthethreesub-sectorsandtabulatethepercentagecontributionsofthesystems.
TheprocedureforcalculatingW2involvesthefollowingsteps:
Step 1:SelectionofBillsofQuantities.
Theexpertsretrievesamplesofbillsofquantities(BoQ)relatedtocon-structionprojectsthatweredesignedin2005aswellasthosedesignedin2006.TheseBoQsarerequestedfromarchitects,contractorsorfromtheMinistryofwork.
Thesamplesmustrelatetothefollowingprojects:

Le Journal statistique africain, numéro 4, mai 20072�
Michel Mouyelo-Katoula and Adalbert Nshimyumuremyi
Le Journal statistique africain, numéro 4, mai 20072�
Forresidentialbuildings
o Single-familyresidences o Bungalows o Apartmentbuildingsandthelike,
Fornon-residentialbuildings
o Farmbuildings o Officebuildings o Buildingsforheathpurpose(e.g.hospitalward) o Buildingsforeducationalpurpose(e.g.aprimaryschool) o Buildings for cultural or religious purpose (e.g. a church or a
mosque)
Forcivilengineeringworks
o Metalledroads o Farmtrack o Lateritetrack o Bridge o Waterandsewersystems o Telecommunicationstructures
Itisrecommendedthatatleast2categoriesofprojectsbeselectedundereachsub-sector.Forinstance,underresidentialbuilding,single-familyres-idencesandapartmentbuildingscouldbeselected.Undercivilengineer-ingworks,metalledroads,lateritetracksandbridgescouldbeincludedinthesamples.CategoriesincludedintheselectionofBoQsmustreflecttheconstructionmarketinthecountry(oratleastinthecapitalcityandsomeothermajortowns),intermsoftherepresentativityofrelevantconstruc-tionprojects.
Foreachcategory,thereisaneedtouseasmanyprojectBoQsaspossible.Forexample,forsingle-familyresidences,3(ormore)typesofvillasofdif-ferentsizesandcostscanbeselected.
Thereisnoneedtogeneratenewdataforthisprocess;rather,thedatacol-lectionrequiredconsistsofthecollectionofcostdataforpastprojects.
Step 2:MappingBoQintoconstructionsystems
The African Statistical Journal, Volume 4, May 2007 2�
Construction and Civil Engineering: designing a time-space index
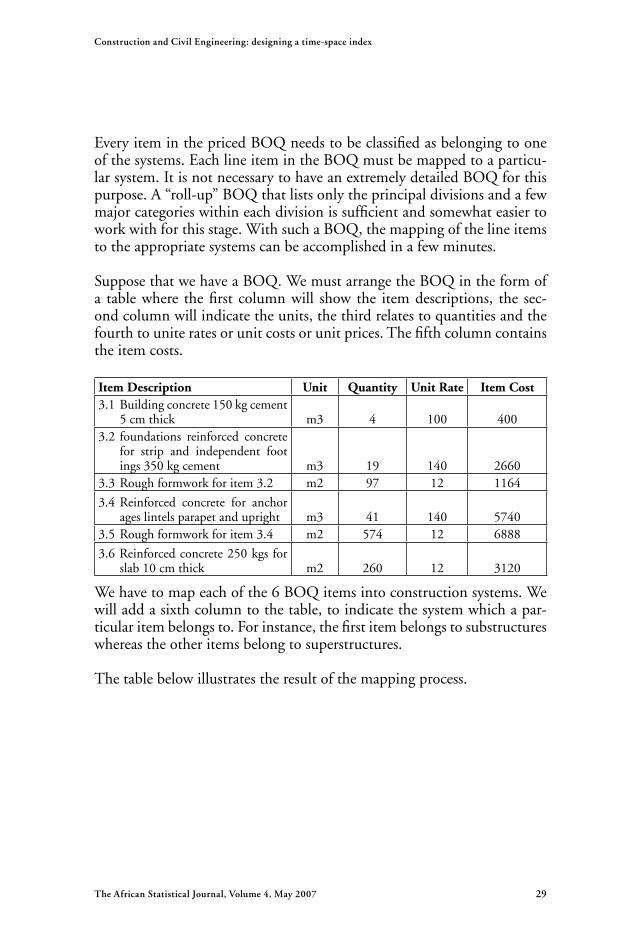
EveryiteminthepricedBOQneedstobeclassifiedasbelongingtooneofthesystems.EachlineitemintheBOQmustbemappedtoaparticu-larsystem.ItisnotnecessarytohaveanextremelydetailedBOQforthispurpose.A“roll-up”BOQthatlistsonlytheprincipaldivisionsandafewmajorcategorieswithineachdivisionissufficientandsomewhateasiertoworkwithforthisstage.WithsuchaBOQ,themappingofthelineitemstotheappropriatesystemscanbeaccomplishedinafewminutes.
SupposethatwehaveaBOQ.WemustarrangetheBOQintheformofa tablewhere thefirst columnwill showthe itemdescriptions, the sec-ondcolumnwillindicatetheunits,thethirdrelatestoquantitiesandthefourthtouniteratesorunitcostsorunitprices.Thefifthcolumncontainstheitemcosts.
Item Description Unit Quantity Unit Rate Item Cost3.1Buildingconcrete150kgcement 5cmthick m3 4 100 4003.2 foundations reinforced concrete for strip and independent foot ings350kgcement m3 19 140 26603.3Roughformworkforitem3.2 m2 97 12 1164
3.4Reinforced concrete for anchor ageslintelsparapetandupright m3 41 140 57403.5Roughformworkforitem3.4 m2 574 12 6888
3.6Reinforcedconcrete250kgsfor slab10cmthick m2 260 12 3120
Wehavetomapeachofthe6BOQitemsintoconstructionsystems.Wewilladdasixthcolumntothetable,toindicatethesystemwhichapar-ticularitembelongsto.Forinstance,thefirstitembelongstosubstructureswhereastheotheritemsbelongtosuperstructures.
Thetablebelowillustratestheresultofthemappingprocess.

Le Journal statistique africain, numéro 4, mai 2007�0
Michel Mouyelo-Katoula and Adalbert Nshimyumuremyi
Le Journal statistique africain, numéro 4, mai 2007�0
Item Description Unit Quantity Unit Rate
Item Cost
System Identification
3.1Building concrete 150 kg cement5cmthick
m3 4 100 400 Substructure
3.2foundations reinforced con crete for strip and independ entfootings350kgcement
m3 19 140 2660 Superstructure
3.3 Rough formwork for item3.2
m2 97 12 1164 Superstructure
3.4 Reinforced concrete for an chorages lintels parapet and upright
m3 41 140 5740 Superstructure
3.5 Rough formwork for item3.4
m2 574 12 6888 Superstructure
3.6Reinforcedconcrete250kgs forslab10cmthick
m2 260 12 3120 Superstructure
Step 3:AggregationofBOQcostsbysystems
Atthisstage,costsshowninthefifthcolumnmustbeaggregatedbysys-tem,sothatthetotalcostforeachsystemcontainedintheprojectcanbeestimated.Forexample,thetotalcostforsubstructuresisequalto400intheexampleaboveasonlyoneBOQitembelongstosubstructures.Thetotalcostforsuperstructuresisequalto19572(i.e.2660+1164+5740+6888+3120).
Intheexampleabove,theprojectcostbysystemisasfollows:
Systems Total costSubstructure 400
Superstructure 19572
Thisprocessisrepeatedforallsystemsineachofthethreebaskets.
6. Conclusion
InformationonconstructionandcivilengineeringhasaparticularinteresttoAfrica,particularlyinviewofitscriticallinktoinfrastructuredevelop-ment,akeyareaofemphasisintheNewPartnershipforAfrica’sDevelop-ment (NEPAD).PPPsandprice level indicators ingeneral, and relateddataonconstructioncostsandexpenditureinparticular,provideextremely

The African Statistical Journal, Volume 4, May 2007 ��
Construction and Civil Engineering: designing a time-space index
usefulinformationaboutthemacroeconomicenvironmentwithinwhichinvestmentistakingplace.
HoweverinmostofthecountriesparticipatingintheICP,pricescollec-tionfortheprogramhavebeenlargelydisconnectedwiththeregularpricecollectionprocessesaimingatproducinginter-temporalpriceindices.In-ter-temporalpriceindicesfortheconstructionsectorareoftencalculatedusingabasketof constructionmaterial and laborprices.This approachdoesn’tpermittotakeintoaccounttheinter-temporalfluctuationsofpro-ductivitynordoesitaddresscorrectlytheproblemlinkedtothetrade-offbetweenlaborandequipment.Thereisthereforeaneedforamethodthatcouldpossiblyeradicateboththeseproblems.
TheBOCCapproachprovidesamuchsimplerandbetterdefinedpricecomparisontoolthatcanhelptodrasticallyreducetheresourcesandtheexpertiserequiredforpricedatacollection.Duetoitssimplicity,itisplau-siblethatthebasketcanbeadaptedtobeusedinnationalinter-temporalpricecomparisons.ThesetwofeaturestogetherwillalsofurtherthegoalofmakingtheICPmoresustainable.
Becauseitislessresourceintensivetoprice,theproposedbasketcaneasilybeusedtogeneratemultipleobservations.ByusingtheBOCCapproach,theNSOscancollectpricesfortheconstructionsectoratalargernumberoflocationswithintheircountryincludingbothurbanandrurallocations,andatseveraltimesoverthecourseofayear.
DuetothedesignfeaturesofBOCCitcanalsopotentiallyimpactthena-tionalaccountingproceduresusedfortheconstructionsectorinacountry.Theaccountingproceduresusedbynational accounts in ICPcountriesfor the construction sector show large variations. Probably most coun-triesbasetheirestimatesonbuildingpermits,publicworksbudgets,andsome ad hoc valuation of non-permit buildings and private non-build-ingprojects.ItislikelythattheBOCCapproachcouldimproveexistingvaluationmethodsandtherebyimprovetheaccountingproceduresfortheconstructionsectorwithinthenationalaccounts.
TheBOCCapproachcanprovidesomeguidanceincomparingothercom-parisonresistantsectors,suchastherentalhousingsector.Thecomparisonintherentalhousingsectorisoftencomplicatedduetotheimportanceofgovernmentprograms(suchassubsidies)andlimitedavailabilityofrentalhousinginsomeareas.Onesuggestedimprovementistousethe“quan-tity”approachinwhichthevolumeofhousingisderivedbymultiplying

Le Journal statistique africain, numéro 4, mai 2007�2
Michel Mouyelo-Katoula and Adalbert Nshimyumuremyi
Le Journal statistique africain, numéro 4, mai 2007�2
thequantityindicatorandthequalityindicator.TheBOCCapproachforresidential sectorhasenoughflexibility tobeappliedforvariousstudiesrelatedtohousing.
References
Dubner,M.,andMcKenzie,R.(2002)“Construction Industry Purchasing Power Parities Obtaining Comparable Prices.”ConferenceontheInterna-tionalComparisonProgramme.AustralianBureauofStatistics.Washing-ton,D.C.
Heston,A. (1999) “ESCAP Comparisons of Real Gross Domestic Product and Purchasing Power Parities, 1993”UnitedNations,Bangkok,1999.
OECD(2001)“Source and Methods: Construction Price Indices”.
Stapel, S. (2002) “The EuroStat Construction Price Survey: History, Cur-rent Methodology and New Ways for the Future”,WorldBankReport,June2002.
UnitedNations(1992)Handbook of International Comparison Program.
Walsh,K.D.andSawhney,A.(2002)“International Comparison of Cost for the Construction Sector: Toward a Conceptual Model for Purchasing Power Parity”,WorldBankReport,June2002.
Walsh,K.D.andSawhney,A.(2004),An Implementation Framework for the Basket of Construction Components Approach, African DevelopmentBankandWorldBankConsultantsReport,June2004.
Walsh, K.D. and Sawhney, A. (2004), Process for Implementation of the Basket of Construction Components Approach,AfricanDevelopmentBankandWorldBankConsultantsReport.
Walsh,K.D.andSawhney,A.(2005),Identification of Construction Systems and Components for the BOCC Approach,AfricanDevelopmentBankandWorldBankConsultantsReport,February2005.

The African Statistical Journal, Volume 4, May 2007 ��
Construction and Civil Engineering: designing a time-space index
Ward,M. (2003)“Pricing Construction Projects Using Prototype Models,”paperpresentedtothe1stRegionalMeetingontheInternationalCom-parison Program in Western Asia, 24-27 June 2003, Beirut, Lebanon,available at www.escwa.org.lb/icp/activities/regional/24-27june/papers.htm(lastaccessed8July2004).
WorldBank(2006),ICP 2003-2006 Handbook.

Le Journal statistique africain, numéro 4, mai 2007�4
Michel Mouyelo-Katoula and Adalbert Nshimyumuremyi
Le Journal statistique africain, numéro 4, mai 2007�4
The African Statistical Journal, Volume 4, May 2007 ��
Summary: In most African countries participating in the 2005 ICP round, the collection of prices of goods and services consumed by households covered only the last 6 months of the reference year 2005. But national coverage and data collection during the entire period of the reference year 2005 are necessary to comply with the PPPs calculation requirements. If these conditions are not met then some adjustments are needed to come up with sound estimates of annual national average prices.This article proposes a survey data validation approach towards the estimates of 2005 annual averages for the ICP-Africa participating countries. It sug-gests that intra-country data validation activities are conducted to a final stage in the participating countries. It concentrates exclusively on price survey and so frees survey averages prices of any inflation-type time dimension in spatial analysis context. It ensures the integrity of survey data for countries that under-took price collection throughout the year 2005.
Key words: International comparison - price survey - data validation
Résumé:Dans la plupart des pays africains participant au cycle 2005 du PCI, la collecte des prix des biens et services consommés par les ménages s’est déroulée unique-ment sur les 6 derniers mois de l’année de référence 2005. Mais la couver-ture nationale et la collecte de données durant la période entière de l’année de référence 2005 sont des conditions nécessaires pour se conformer aux exigences de calcul des PPA. Si ces conditions ne sont pas réunies, alors quelques ajuste-ments sont nécessaires pour obtenir des estimations des prix moyens nationaux annuels cohérentes.
Cet article propose une approche de validation de données d’enquêtes condui-sant à l’estimation de moyennes relatives à l’année 2005 pour les pays partici-pants au PCI-Afrique. Elle suggère que des activités de validation de données intra-pays soient menées à une étape finale dans les pays participants. Elle porte exclusivement sur l’enquête prix et évite ainsi l’interférence de l’inflation résult-ant de la dimension temporelle dans l’analyse spatiale sur les prix moyens. Elle privilégie les données d’enquêtes pour les pays qui ont effectué la collecte tout au long de l’année 2005.
Estimating national annual average prices in the ICP-Africa context: Back to surveys
Mathieu B. Djayeola & Michel Mouyelo-Katoula�
1ICP-AfricaiscoordinatedbyMr.Mouyelo-KatoulaMichel.Mr.DjayeolaB.Mathieuplayedakeyroleintheimplementationofdataqualityinitiatives.

Le Journal statistique africain, numéro 4, mai 2007��
Mathieu B. Djayeola & Michel Mouyelo-Katoula
Le Journal statistique africain, numéro 4, mai 2007��
Mots clés: Comparaison internationale - enquête prix - validation de don-nées
1. Background
TheInternationalComparisonProgram(ICP)isaglobalstatisticalinitia-tiveestablishedin1970toproduceinternationallycomparablepriceandexpenditurelevelstofacilitatecross-countrycomparisonsofGDPanditssub-aggregatesinrealtermsandfreeofpriceandexchangeratedistortions.Fromaninitialnumberoftencountriesthatparticipatedintheprogramin1970, the ICPhasgrown intoaworldwideprogramwith some140countriesparticipatingworldwide.
TheAfricanRegion launched ICPfieldoperationswith threecountriesnamelyEgypt,Mauritius andZimbabwe starting collecting commoditypricesinJanuary2005.SomecountriesbegantheirfieldoperationinMaythesameyearwhiletheremainderstartedinJune-July.
EarlierinJune2005,acknowledgingtheimportanceofanintra-countrypricedatavalidationtool,theAfDBbasedICP-Africaregionalofficede-velopedthefirstversionoftheSemper2ValidationSoftwareandprovidedit to the countries to crosscheck theirfielddatabeforeonward submis-sion.
Box 1 Quaranta Tables
“TheQuarantatablesarequalitycontroltoolsused(…)toidentifyandcorrectoutliersinpricedataprovidedbycountriesparticipatingintheProgram.NamedaftertheircreatorVincenzoQuarantaofNationalIn-stituteofStatistics,Italy,theQuarantatablesaredesignedtoprovideanindicationofconsistencywithrespecttobasicheadings,andtoprovideananalysisofthevariabilityofsurveyedprices,betweenitemsandacrosscountries.BoththeEurostatandtheOECDusetheQuarantatablesintheirPPPprogram”.
Source: World Bank: ICP News Vol 2, No. 2, April 2005
2TheSemperValidationSoftwareisauser-friendlyapplicationtoassistcountriesintheirpricesurveydatavalidationactivities.

The African Statistical Journal, Volume 4, May 2007 �7
Estimating national annual average prices in the ICP-Africa context: Back to surveys
InDecember2005,buildingonmorethansixmonthofdatacollection,theneed formonthly time series analysiswas emphasizedbyanumberof participating countries. In response, the African Development BankappendedtheSemperwithaTimeLineprocedure.Usingcannedtrendsanalysis – far from any inflation analysis – theTime Line set a frame-workforspatialandtimedataanalysisthusprovidingatimedimensiontoQuarantabasedanalysis.
Thispaperproposesasurveydatavalidationapproachtowardstheesti-matesof2005annualaveragesfortheparticipatingcountries.Itensurestheintegrityofsurveydataforcountriesthatundertookpricecollectionthroughouttheyear2005.
2. Objectives
Theanalysisofpricespatialindicesinthecontextofinternationallyhet-erogeneousconsumerpriceindicespointstotheneedtoaddresscriticalissuesrelatedtopricevariabilityandconsistencyovertimeandspace.Thetechnological context in which the ICP-Africa was conducted requiredthedevelopmentofad-hocapplicationscomprisingspecificdatacapture,structure,andstatisticalvalidationmodules.Afewtechnicalconstraintsneededtobeaddressedwithrespecttotheamountofdatatobehandled.
3. Analyzing spatial data with inflation-type indicators
AccordingtotheliteratureandempiricalICPwork,theanalysisofICPdatawithaninflationfactorusuallyshowssemanticproblemsrelatedtothenatureofICPindicesbeingspatialandinternationalinoppositiontotheuseoftemporalindicesforinflationmeasurementinapurelynationaleconomiccontext3.Withexperience,otherapproacheswereproposedintermsofconsideringICPpricesintheiroriginalessence,consideringthatevenifthepriceswerecollectedonamonthlybasis,theyaremeanttobeusedforspatialanalysis.
The2005-2007roundofICPdatacollectionhasdemonstratedthatwhentheproductlistislongandinvolvesagroupofcountrieswithheterogene-ouseconomicsituations4,pricevariationistheruleandnottheexception.Thiscallsforasoundmethodologyofpriceaveraging.3C.f.forexampleAlanHestonandRobertE.LipseyinInternationalandInterareaComparisonofIncome,Output,andPrices,NationalBureauofEconomicResearchattheUniversityofChicago,ChicagoandLondon,1999.
4Thesurveycovered853productsclusteredin113basicheadingsandpriceswerecollectedinacontinuumofsuchdifferenteconomicandculturalenvironmentlikeinTunisia,SouthAfrica,SenegalandEthiopia,andfortycountriesbetween.

Le Journal statistique africain, numéro 4, mai 2007��
Mathieu B. Djayeola & Michel Mouyelo-Katoula
Le Journal statistique africain, numéro 4, mai 2007��
TheproposeddatavalidationprocessincludesanumberofstepsthatneedtobeconductedwithcareasthecurrentroundofdatacollectionwasmademainlyprocessedunderMicrosoftExcelenvironmentwhichislimitedintermsofnumberofrecordsthatcanbeprocessedsimultaneously.
4. Major technological constraints
Intra-country data validation in the African context is based on onemonthly spreadsheet containing all records from field surveys.There isa limitation of about 65,000 records that can be processed on a singlespreadsheet underExcel 2003 and earlier versions.Available computersalso showed some limitation in termsofmemorywhen thenumber ofrecordstobeprocessedusingtheSemperapproachismorethan30,000.These technical constraints suggest that data collected by the countriesshouldbereorganizedforeffectiveprocessing.
Allcountrydatacollectedin2005and2006havetobecombinedintoasingledatabaseandprocessedwiththesamemeansaswheneachcountrywasvalidatingdataonamonthlybasis.Concerningthescopeofdatatobeanalyzed,theminimumnumberofmonthlyrecordsforthisroundisabout3,000andthemaximumisabove40,000withanaveragearound11,000.Allinall,fivemillionrecordsareincludedinthedatabase.
Forqualitypurposes,thetreatmentofsuchalargedatabaserequiresastepbystepapproachtostrictlycomplywithdatabaseintegrityanddatapres-ervationateachstage.
Experiencefromselectedcountriesrangingfromthelowesttothehigh-estintermsofpricequotationssuggeststhatittakesadaytomanagetheresultingdatabase.Asconcernsthedurationofthedatavalidationprocess,itdependsonthespeedofcarryingoutmonthlytimeseries,andquarterlydataanalysis.Allinall,oneweekofworkwouldbeenoughatthecountryleveltogenerateaworkablepricedatabase.
5. The proposed approach
Theproposedapproachconsistsoffivesteps:(1)describingthemethod-ology for reorganizing the data validation process, (2) determining thestorageplatform,(3)definingthebestproceduresfordata integrityandtrace-ability,(4)undertakingthedatavalidationprocess,and(5)settingaclosureruletoensurethatnodatawaslostduringthedatahandlingproc-ess.Thesestepsaredescribedinthefollowingsections.

The African Statistical Journal, Volume 4, May 2007 ��
Estimating national annual average prices in the ICP-Africa context: Back to surveys
5.1. The methodology
Theoriginalconfigurationofpricedatacollectedbycountries followeda cube presentation with rows representing the products, columns themonthsanddepthforpricequotations.Eachmonth(Dimension1),pricequotations from surveyed outlets (Dimension 2) were analyzed againstthecorrespondinginformationfromothermonths,asfarasaparticularproduct(Dimension3)isconcerned.Amonthlyaveragepricewasthencalculatedperproduct:thepriceisinacubicgraphicrepresentedbythesethreedimensions.
Outlet ∆
Quotatio
ns(*)
Months
Pro
du
cts
* * * * * * *
* * * * *
* * * * * * * *
Pro
du
cts
Outlet ∆ Quotations
Graph 1
(*) In the ICP context, the price is function of the product, the place where it is sold, the time of data collection and the condition of the transaction. The symbol ∆materializes this level of complexity.
tl∆
ot
∆
: ICP-Africa survey databases –From cubic to matrix representation
∆
In theproposed structure, all the twelvemonthlydatabases aremergedintooneannualdatabase.Foreachproduct(Dimension1),alloutletpricequotations(Dimension2)forthewholeyeararecheckedagainstonean-other,andannualaveragecanbeeasilycomputed.
Theapproachisholisticinthesensethatitdealswiththeentireproductlist,withallmonthsandalloutlets.Itensuresdataintegritywhilecomply-ingwithstatisticalprinciplessuchasspatialandtimerepresentativity,andalso,itisfreeofnonsurveyinferences.
5.2. A holistic platform
TheproposedplatformisbasedontheextensionoftheCountryDatacon-cept5 used by the countries during the field operations.The main idea
5TheCountryDatafileprovidesthestandardizedstructureforpricecollectiondatabaseatthecountrylevel.Itcontainsinformationontheproductdescription,thequantity,theprice,theoutlet,andthepricecollectioncenteridentification.ItservesasinputtotheSemperValidationSoftware.

Le Journal statistique africain, numéro 4, mai 200740
Mathieu B. Djayeola & Michel Mouyelo-Katoula
Le Journal statistique africain, numéro 4, mai 200740
is tocreateasuperCountryDatacontainingallpricequotationsfromaparticularcountry.If for logisticalreasons(memory,diskspace,andfilecapacityetc.),more thanonefile isneeded,apartitionedCountryDatacanbecreated.
Ideally,tolaunchtheprocess,atwelve-spreadsheetCountryDatafilemustbe crated for eachcountry.Each sheet refers toonemonth.Of course,countrieswithmorethantwelvemonthsofdatacollectionwouldneedalargernumberofsheets.
Thisapproachcanbeextendedtoaregionalprocessaimedatcreatingaregionaldatabase.
5.3. Data integrity and trace-ability
Therecordscodingstructureusedbythecountriesisasequentialseriesoffivedigitsindexrangingfrom00002tomerely50000inacountrywithaveryhighnumberofquotations.Itissuggestedthatforeachmonth,thecodeshouldbeprocessedbyaddingafour-digitprefix.Thefirstdigit(5for2005and6for2006)identifiestheyearofdatacollection.Thecodealsoincludesamonthidentifierintheformofathree-digitsub-codesuchasAPRforApril.Whateverlanguageisusedfordatacollection,thefol-lowingarethemonthlyidentifiertobeused:JAN-FEB-MAR-APR-MAY-JUN-JUL-AUG-SEP-OCT-NOV-DEC.
ThelastpartinthestringistheoriginalfivedigitsindexintheCountry-Datafile.Theresultingnine-positionstringrangesfrom5JAN00002to6JUN50000foreachcountry.
5.4. Data validation
Thedatabasecanbesafelysortedbyproductcategories.Aback-upoftheCountryDatafileiscriticalatthisverystage.Thereasonisthatherestartnon reversible data management processes. Sorting procedures are usu-allybasedon the fastestprocess to reorder records indatabasesand thesubsequentalgorithmsdonotprovideroomforrevertingtotheoriginaldatabaseincaseofneed.Itistheresponsibilityofthedatamanagertoen-surethereversibility.Forthis,oneofthemostcommonoptionsisagoodindexingsystemsuchastheonedescribedinstage3above.
Oncethedatabaseissorted,itisproposedtosplititinasmanyportionsas necessary for onward validation. Each portion can relate to bunches

The African Statistical Journal, Volume 4, May 2007 4�
Estimating national annual average prices in the ICP-Africa context: Back to surveys
oftenbasicheadings:001–010,011–020,021–030,…090–113.Inthehypothesisoftwelvemonthsofdatacollection,dependingonthecountryspecifics,thenewCountryDatafilewillhavebetweenoneandtenspreadsheets.
Atthispoint,itisimportanttohighlightafeatureoftheSemperValida-tionSoftwarenotyetfullyappliedbythecountries.ThesoftwaretreatsonlytheactivesheetoftheCountryDatafile,thismeansthatifpricequo-tationscoverseveralsheets,theusercanimplementthevalidationoneachindividualspreadsheet.
Thisprocessensures that the resultingCountryDatafile is cleanofanyunnecessaryaspectandbringsbacktothespatialobjectiveofICP.Oncethisissecured,onecansplitthedatabaseinasmanypartsasrequired.Forinstance,2005datacanbeseparatedfrom2006.
Itisalsosuggestedtosetathresholdforpricevariationinthedatabase.ThemostlyusedindicatorsforvariationanalysisintheSempercontextaretheOutlierindicator6intheSemperoutputfile(ValidationBook)andthecoefficientofvariationwhichscalestheStandardDeviationtoapercent-ageofaproductaverageprice.
ItisfurthersuggestedthatnoValidationBookshouldcontainanyOutlierindicatorbeyond500inabsoluteterms.ThisisinlinewithICPpracticeandleadstoareasonablelevelofcoefficientofvariation.Inparticular,itavoidscaseswherecommasaremisplacedormisprintsuchas1500insteadof150or15000–theseareknownas“zero”typingmistakes.
5.5. Closing mechanism
Theusermayneed to verify thatnodatawas lost during thedatabasereorganization process.This is important for data integrity and qualitypurposesasdatabasehandlingisariskyprocessunlessitissurroundedbytightverificationprocedures.Selectedindicatorscanbeusedinthisregard.Twoofthemarelistedbelow:
6TheOutlierIndicatorintheSemperValidationsoftwareisamixofcentraltenden-ciesanddispersionindicatorscombingtheMean,theMinimum,theMaximum,andtheStandardDeviation.Itproducesanindexnumberashighasapricedivergesfromtheaverageoftheproductandisscaledbytenstoalertontheobservedarithmeticdistance.

Le Journal statistique africain, numéro 4, mai 200742
Mathieu B. Djayeola & Michel Mouyelo-Katoula
Le Journal statistique africain, numéro 4, mai 200742
(1)thenumberofrecordsbeforeandafterrunningthisprocess,and
(2)thepricelevelsobtainedinnationalcurrencyatthebeginningand attheendoftheprocess.
Estimatedaveragepricesneedtobeindividuallycheckedagainsttheknownpricelevelforeachproductontheitemlist.
Inadditiontothis,alistoftasksaimingatcompletingthevalidationproc-essatthenationallevelisproposedinthefollowingsection.
5.6. A quick checklist of proposed tasks
Thechecklistincludesthefollowingtasks:
a. Have a single Excel file containing all monthly country data - eachsheetcontainingonemonthofdata-andre-codetherecords accordingly.Keepacleancopyofthisfile.
b. Sortthedatabasebyproductcodetobringallpricequotationsfora particularproducttogether.
c. Create a dedicated database for product groups – a cluster will include5to10basicheadings,butnotmorethan30,000records persheet.
d. Checktheintegrityoftheresultingfilebyensuringthatthenumber ofrecordsisthesameasbeforethebeginningoftheprocess.Make surethatacopyoftheinitialfilewassecuredbeforestartingthedata\ validationprocess.
e. Validate the data in the resulting country data file following the sameruleaswasdoneduringdatacollectionactivities.
Conclusion
Howsuitableisittousesixmonthsdatacollectionforannualaveragingpurposes?Thisquestioncertainlygoesbeyondthetimedimensionand,apartfromthefactthatin2005,pricesweremainlysurveyedinthesecondhalfoftheyear,wecouldexpressittheotherwayround:Howsuitableisittousesurveydatatoestimateactualunknownvalues?
The African Statistical Journal, Volume 4, May 2007 4�
Estimating national annual average prices in the ICP-Africa context: Back to surveys
InthepastICProundsandalsoinotherregionsforthecurrentICPround,surveyactivitieswerecarriedoutonlyduringfewmonthsinselectedareas(quarterly,onesurveyoverthreemonths,onlyincapitalcities,inmajorcities,etc.).Therobustnessofmethodologyandexperienceshowedthatundercontrolledconditions,thissamplingapproachdoesnotaffectthequalityofthePPPs.
In theAfrican ICPexercise, allparticipatingcountrieshave surveydataforatleasttwelvemonthsbutthesemonthswerespreadovertwocalendaryears.ItisalsoestablishedthatallparticipatingcountrieshaveCPIdataforbasiccategoriesforwhichICPresultswillbepublished.
Toputmoreemphasisonsurveydata,asimpleback-castmethodologyformissingmonthsin2005istoadjustthecorresponding2006surveydatawith2006/2005CPIindices.Eachmonthlydatabasewouldthereforebeadjustedaccordingly.
References
AfricanDevelopmentBank.(2005).Training of Field Supervisors and Price Data Collectors, A Trainer’s Guide,ADB,Tunis,Tunisia,1-77
AlanH.andRobertE.L.(1999).International and Interarea Comparison of Income, Output, and Prices, National Bureau of Economic Research,UniversityofChicago,ChicagoandLondon,1-530.
Astin,J.(2004).ICP2004Operational Manual, What National Coordina-tors Need To Know,Canterbury,UK,48-50.
DjayeolaB.M.&RittenauR.(2006).Experiencingthe Semper Validation Software: Genuine African solutions for data validation within the Interna-tional Comparison Program.TheAfricanStatisticalJournal,Tunis,Tunisia,32p.
Eurostat-OECD(2005).PPP Methodological manual - Annex IV Quaranta editing procedure,Luxembourg,Luxembourg,1-6
Rittenau,R.(2005).The quality of data in ICP-Africa,ADB,Tunis,Tuni-sia,1-6
Le Journal statistique africain, numéro 4, mai 200744
Mathieu B. Djayeola & Michel Mouyelo-Katoula
Le Journal statistique africain, numéro 4, mai 200744
Sergeev,S.(2003).Description of the VBA program for the computation of the EKS-PPP at the basic heading level and the ”Quaranta” tables,Vienna,Austria,1-27.
WorldBank(2005).ICP News: An e-newsletter for the International Com-parison Program,Volume2,No.2-April2005,Washington,USA,1-5.

The African Statistical Journal, Volume 4, May 2007 4�
Détermination des parités de pouvoir d’achat élémentaires dans le cadre du PCI-Afrique: La méthode CPD
Folly A. D. Adjogou et Mathieu B. Djayeola�
Résumé :Les parités de pouvoir d’achat (PPA) sont destinées aux comparaisons
transnationales d’agrégats économiques tels que le Produit intérieur brut ou ses emplois. Si l’ interprétation économique des PPA est relativement simple, leur estimation requiert la maîtrise de procédures plutôt complexes, et le recours à la programmation économétrique dans un environnement informatique. Cet article présente de façon détaillée l’une des méthodes de calcul des PPA appelée méthode du Country Product Dummy (CPD). Trente ans après ses premières ébauches, dans un souci de vulgarisation à grande échelle, cet article expose sous forme matricielle les étapes méthodologiques du CPD afin de faciliter son opérationnalisation.
Mots clés : Parité de pouvoir d’achat, CPD, Programme de comparaison internationale
Summary: Purchasing power parities (PPP) are intended for inter-country comparisons of economic aggregates such as Gross domestic product or its components. While the economic interpretation of the PPPs is relatively easy, their estimate requires mastering rather complex procedures, including econometric modelling in a data-processing environment. This article presents in a detailed way one of the PPP computation methods called Country Product Dummy (CPD) method. Thirty years after its first implementation, this paper shows its various meth-odological stages in a matrix form to facilitate its utilization.
Key words: Parité de pouvoir d’achat, CPD, Programme de comparaison internationale
1IngénieursStatisticiensEconomistesassistantsderechercheàlaBAD:([email protected])et([email protected]).

Le Journal statistique africain, numéro 4, mai 20074�
Folly A. D. Adjogou et Mathieu B. Djayeola
1. Introduction
La méthode Country Product Dummy (CPD), développée en 1973par l’Economiste Robert Summers est une procédure de régressionéconométriqueutiliséepourcalculerdesParitésdepouvoird’achat(PPA).Dansleurformelaplussimple,lesParitésdepouvoird’achatsontdesprixrelatifs, ou autrement dit, des rapports de prix en monnaies nationalesd’unmêmebienou servicedansdifférentspays.LesPPA sontutiliséesessentiellement par les organisations internationales, les instances gou-vernementales, lesuniversités, les institutsderechercheetautresacteurssocio-économiquescommeinstrumentpourlarechercheéconomiqueetl’analysepolitiquedanslescomparaisonsinternationales.DanslecadreduProgrammedecomparaisoninternationalepourl’Afrique(PCI-Afrique)quiestmisenœuvreentantquepartieintégrantedupro-grammeglobalduPCI2003,laméthodeCPDestutiliséepourestimerlesPPAauniveaudespositionsélémentaires2.CepapierexploreuneprésentationmatricielleduCPDtelqu’utiliséparlePCI-Afrique.Lesnotionsexposéesontpermisdedévelopperuneapplica-tionVisualBasicquigénèrelesParitésdepouvoird’achat.
2. Quelques méthodes de calcul de PPA
LaméthodeCPDaétéutiliséedanslespremièresphasesduProgrammede comparaison internationale, principalement comme un outil pourl’agrégationdesdonnéesdeprixendessousduniveaudespositionsélé-mentaires.DansdesphasesplusrécentesdestravauxduPCI,laméthodeElteto-Koves-Szulc(EKS),aremplacélaCPDentantqueprocédurederemplissagedesdonnéesdeprixmanquants.Onnotecependantunregaind’intérêtdanslaméthodeCPDdepuislesrécentstravauxdePrasadaRao(1995)3.UncertainnombredepropriétésdelaméthodeduCPDonteneffetétépasséesenrevueparRao(2001,2002)4enl’occurrence,laCPDpondéréeaétéutiliséepourobteniruncertainnombredeméthodesal-ternativespourlescomparaisonsmultilatérales.Diewert(2002)5montre
2Positionélémentaire:Regroupementhomogènedeproduitsouservicesayantsdescaractéristiquescommunes
3Rao,D.S.Prasada(1995),“OntheEquivalenceoftheGeneralizedCountry-Product-Dummy(CPD)MethodandtheRao-SystemforMultilateralComparisons”
4D.S.Prasada(2001),“WeightedEKSandGeneralisedCPDMethodsforAggregationatBasicHeadingLevelandaboveBasicHeadingLevel”
5HedonicRegressions:AReviewofSomeUnresolvedIssues
The African Statistical Journal, Volume 4, May 2007 47
Détermination des parités de pouvoir d’achat élémentaires dans le cadre du PCI-Afrique: La méthode CPD
commentdenouvellesspécificationsetdenouvellespondérationspeuventêtre utilisées dans le cadre de la CPD pour tirer des formules connuesd’indices de prix. Diewert (2003, 2004)6 a également examiné les pro-priétés variéesde laméthodeduCPDdans le cadrede la comparaisonentrerégions.
Eneffet,lechoixdelaméthoded’agrégationpourconstruirelesPPAestdébattudepuisdeuxdécennies.Lespremièresétudessurlethèmedescom-paraisonsinternationales,tellesquel’étudepionnièredeKravis,HestonetSummers(1982),ontfourniunlargeéventaildeméthodesd’agrégation.Untravailderéférencede l’OCDEetEurostatacomparé lesméthodesde Geary-Khamis (GK) et de Elteto-Koves-Szulc (EKS). L’agrégations’effectueaprèsqu’onacalculé lamoyennedes indicesdesprixpourlesbiensetservicesdebasepourobtenirdesparitésnonpondéréespourdespetitsgroupesdeproduitshomogènes.Ilfautensuitepondéreretagrégerlesparitésnonpondéréess’appliquantauxgroupesdeproduitspourobte-nirdesPPAetdesvaleurs réellespourchaquecatégoriededépensesenremontant jusqu’au niveau du PIB total. Les deux méthodes diffèrentsensiblement. La méthode EKS considère que les pays sont un ensem-bled’entitésindépendantes:chaquepaysreçoitunpoidsidentique.DanslaméthodeEKS,onobtientlesprixenminimisantlesdifférencesentred’unepart,lesPPAbinairesauniveaumultilatéral,etd’autrepartlesPPAbinairesbilatérales.LesPPAdelaméthodeEKSnesontguèredifférentesdesPPAquiauraientpuêtreobtenuessichaquecoupledepaysavaitétécomparé individuellement.LaméthodeGKconsidèreque lespays fontpartied’ungroupe.ChaquepaysreçoitunepondérationreprésentantsapartdanslePIBtotaletlesprixquisontcalculéssontreprésentatifsplusgénéralementdugroupe.Lesdeuxméthodesprésententdesavantagesetdesinconvénients:• Pour des pays possédant des structures des prix très différentes de
moyenne, l’approcheGKproduitdesestimationsdesvolumes (etduPIBparhabitant)plusélevéesquecellesquiauraientétécalculéessionavaiteurecoursàdesprixplusspécifiquesaupays.Cettesurestimationestparticulièrementimportantelorsqu’oncomparedespaysprésentantde fortes différences de niveau de revenu. Toutefois, les résultats del’approcheGKsatisfontaucritèred’additivité,cequiimpliquequelavaleurréelledesagrégatsestégaleàlasommedelavaleurréelledeses
6Diewert,E.W.(2004)“OntheStochasticApproachtoLinkingRegionsintheICP”

Le Journal statistique africain, numéro 4, mai 20074�
Folly A. D. Adjogou et Mathieu B. Djayeola
composantes.C’estunatoutdanslaperspectivedescomptesnationaux,carcelapermetdecomparerlesstructuresdeprixetdevolumed’unpaysàl’autre.
• La méthode EKS produit des résultats qui reflètent davantage lescaractéristiquesdesprixdechaquepays.Onobtientainsidesestimationsdu PIB par habitant relativement semblables à celles résultant del’utilisationdeprixspécifiques.Cependant,sesrésultatsnesatisfontpasaucritèred’additivité.
LaméthodeCPDconstitueunealternativeintéressanteauxindicesdeprixstandardutilisésdanslescomparaisonsinternationales.Dufaitqu’ellere-posesurdestechniqueséconométriques,elleconfèreauxutilisateursunecommoditéquileurpermetd’exploiterplusefficacementlesdonnéesdeprixnotammentdansletraitementdesdonnéesmanquantes.Au-delàdecettesuccincteprésentationdelaméthodeCPD,cetravailrevêtuncara-ctèrepurementpédagogique.
L’accentquiestmisicisurlaprésentationmatricielleapourbutd’éluciderlesgrandesétapesdelatechniqueafind’enpermettreunemiseenœuvrerapideetefficace.Eneffet,l’intérêtmajeurdutravailconsisteàmettreàladispositiondesstatisticiensdesprixetorganismesinternationauxainsiqu’auxécolesdeformationdestatisticiensenAfrique,unoutildidactiquesimpleetconcispouvantconduireàdesprogrammationsinformatiquesdelaméthodeCPDselonlelangagedepréférence.
3. La matrice générale des prix
3.1 La matrice initiale des prix
Lamatricegénéraledesprixest constituéedesdonnéesdeprixmoyensannuelsdisponiblespourl’ensembledespaysetpourtouslesproduits.Ils’agitd’unematricequidisposeencolonneslespaysparticipantauPro-grammeetenlignes,touslesproduitsidentifiésparpositionsélémentaires.SoitFlenombretotaldeproduitsetGlenombredepaysparticipantauProgramme.Aprèsl’identificationdupaysdebase,lamatricedesdonnéesPseprésentedelafaçonsuivante:

The African Statistical Journal, Volume 4, May 2007 4�
Détermination des parités de pouvoir d’achat élémentaires dans le cadre du PCI-Afrique: La méthode CPD
1 2
1
2
G
F
P =
...
...
3.2 La matrice des prix renseignés
L’étapesuivanteconsisteàéliminer lesproduitspourlesquelsaucundespaysn’afournideprix.SoitNlenouveaunombredeproduitsrenseignés,doncdelignespourlamatriceP.LanouvellereprésentationmatricielleestindiquéeparlamatriceQsuivante:
1 2
1
2
G
Q
N
=
...
...
4. La matrice des prix par position élémentaire
4.1 La matrice de base des prix par position élémentaire
LamatricegénéraledesprixQprésentelesrelevésdeprixdesNproduitsdanstouslesGpays.Cesproduitssontregroupésendifférentespositionsélémentaires.Soitxunepositionélémentaire.L’ondésigneparn
xlenom-
bredeproduitsappartenantàx.LamatriceP(x)ci-dessousprésentelesdonnéesdeprixrelativesàx.ElleestdéterminantepourlecalculdesPPA

Le Journal statistique africain, numéro 4, mai 2007�0
Folly A. D. Adjogou et Mathieu B. Djayeola
pourlapositionélémentairex.End’autretermes,chaquepositionélémen-tairexasamatricedeprixP(x).
1 2
1
( ) 2
x
G
P x
n
=
...
...
4.2 La matrice finale des prix renseignés par position élémentaireIlpeutarriverqu’unpays,parmilesGpaysdedépart,nedisposederelevésdeprixpouraucundesproduitsdelapositionélémentairex.Danscecas,cepaysestretirédelasuitedesopérationsmatriciellesafférentesàlaposi-tionélémentairex7.Soitpxlenombredepaysdisposantdedonnéespourlesproduitsrelatifsàx.LamatriceP(x)esttransforméeenunenouvellematriceP*(x)quiseprésentesouslaformesuivante:
1 21
* ( ) 2
x
x
p
P x
n
=
...
...
C’est cette matrice P*(x) qui fera l’objet des prochaines opérationsrelatives à la position élémentaire x. On peut l’appeler “matricerécapitulativedex’’.
7Eneffect,cepaysestmomentanémentexcluetsaPPAparrapportaupaysdebaseseraconsidéréecomme“indisponible”.MaisgrâceàlapropriétédelaméthodeCPDquiestbaséesurunmodèleetprésentéeenSectionVI,cepaysseraréintégréplustardetsaPPApourraêtreestimée
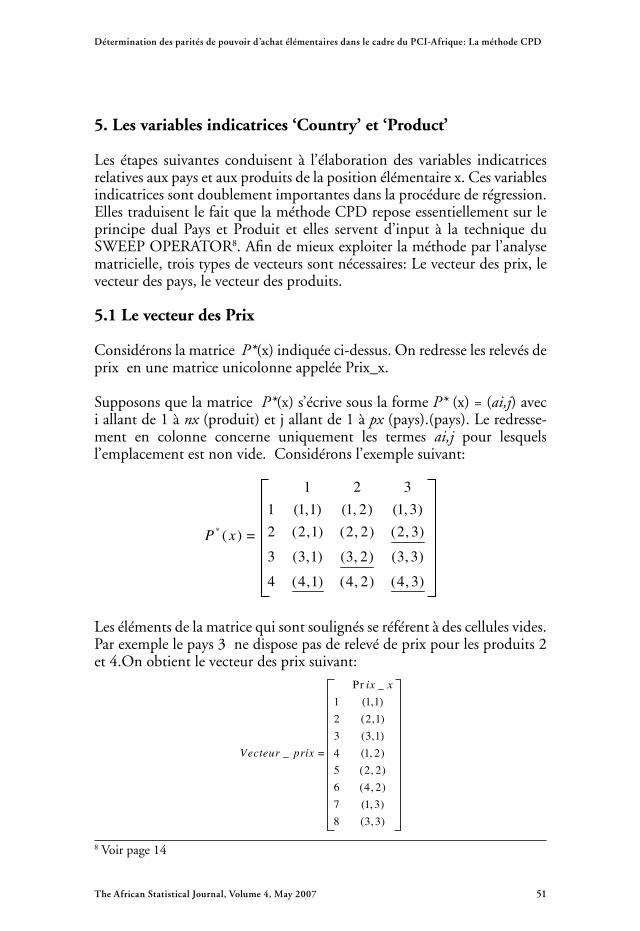
The African Statistical Journal, Volume 4, May 2007 ��
Détermination des parités de pouvoir d’achat élémentaires dans le cadre du PCI-Afrique: La méthode CPD
5. Les variables indicatrices ‘Country’ et ‘Product’
Les étapes suivantes conduisent à l’élaborationdes variables indicatricesrelativesauxpaysetauxproduitsdelapositionélémentairex.Cesvariablesindicatricessontdoublementimportantesdanslaprocédurederégression.EllestraduisentlefaitquelaméthodeCPDreposeessentiellementsurleprincipedualPays etProduit et elles serventd’input à la techniqueduSWEEPOPERATOR8.Afindemieuxexploiterlaméthodeparl’analysematricielle,troistypesdevecteurssontnécessaires:Levecteurdesprix,levecteurdespays,levecteurdesproduits.
5.1 Le vecteur des Prix
ConsidéronslamatriceP*(x)indiquéeci-dessus.OnredresselesrelevésdeprixenunematriceunicolonneappeléePrix_x.
SupposonsquelamatriceP*(x)s’écrivesouslaformeP*(x)=(ai,j)aveciallantde1ànx (produit)etjallantde1àpx (pays).(pays).Leredresse-ment en colonne concerne uniquement les termes ai,j pour lesquelsl’emplacementestnonvide.Considéronsl’exemplesuivant:
*
1 2 3
1 (1,1) (1, 2) (1, 3)
2 (2,1) (2, 2) (2, 3)( )
3 (3,1) (3, 2) (3, 3)
4 (4,1) (4, 2) (4, 3)
P x =
Lesélémentsdelamatricequisontsoulignésseréférentàdescellulesvides.Parexemplelepays3nedisposepasderelevédeprixpourlesproduits2et4.Onobtientlevecteurdesprixsuivant:
Pr _1 (1,1)2 (2,1)3 (3,1)
_ 4 (1, 2)5 (2, 2)6 (4, 2)7 (1, 3)8 (3, 3)
ix x
Vecteur prix =
8Voirpage14

Le Journal statistique africain, numéro 4, mai 2007�2
Folly A. D. Adjogou et Mathieu B. Djayeola
Ilfautsignalerqueleredressementencolonneaétéeffectuécolonneparcolonneenparcourantàlasuite,touteslescolonnesdelamatriceP *(x).Sileredressementesteffectuéligneparligne,lastructureduvecteurdesprixserachangéeetl’onobtiendraitlevecteursuivant:
Pr _1 (1,1)2 (1, 2)3 (1, 3)
_ 4 (2,1)5 (2, 2)6 (3,1)7 (3, 3)8 (4, 2)
ix x
Vecteur prix =
Cechangementdanslastructureduvecteurdesprixmodifielesstructuresdu vecteur des pays, du vecteur des produits et de la matrice des indi-catricesqui sontobtenusàpartirde ladispositiondesélémentsdans levecteurdesprix.Maiscecin’aaucunimpactsurlesrésultatsdelarégres-sionetdoncsurl’estimationdesParitésdepouvoird’achat.Eneffet,cechangementdedispositiondesélémentsduvecteurdesprixaurasimple-mentpourconséquencedemodifierlespositionsdesrelevésdeprix.Parexemple,leprixduproduit3danslepays1estconsidérécommele6èmerelevédeprixdanslepremiercasetle3èmedanslesecondcas.Maiscecin’occulteenrienl’informationfondamentalequiest:ceprixestceluidubien3danslepays1etsoncoûtestconnu.
Defaçongénérale,soitfxlenombrederelevésdeprixpourlaposition
élémentaire x, c’est-à-dire le nombre de cellules contenant des prix. Levecteurcolonnedesprixseprésentedelafaçonsuivante:
Pr _
1
_ 2
x
ix x
Vecteur prix
f
=
...

The African Statistical Journal, Volume 4, May 2007 ��
Détermination des parités de pouvoir d’achat élémentaires dans le cadre du PCI-Afrique: La méthode CPD
5.2 Le vecteur des pays
Pourchacundesprixdanslacolonnedesprix,onrecherchelepayscor-respondant.OnobtientlamatriceunicolonnePays_x.Defaçongénérale,elleseprésentecommesuit:
P _
1
_ 2
x
ays x
Vecteur pays
f
=
...
L’applicationestfaitesurl’exempleprécédent.Onobtientcommevecteurdespays,levecteursuivant:
P _1 12 13 1
_ 4 25 26 27 38 3
ays x
Vecteur pays =
5.3 Le vecteur des produits
Pourchacundesprixdanslacolonnedesprix,onidentifieleproduitcor-respondant.OnobtientlamatriceunicolonneProduit_x.Laformegéné-raledecettematriceunicolonneestlasuivante:

Le Journal statistique africain, numéro 4, mai 2007�4
Folly A. D. Adjogou et Mathieu B. Djayeola
Pr _1
_ 2
x
oduit x
Vecteur produit
f
=
...Lorsqu’onappliquecettetechniqueàl’exempleprécédent,onobtientlareprésentationsuivante:
Pr _1 12 23 3
_ 4 15 26 47 18 3
oduit x
Vecteur produit =
Lasuitedel’opérationconsisteàconstruireunematricedesvariablesindi-catricesquiopérationnaliseleprocessus.
5.4 La matrice des Indicatrices
Apartirdesmatricesunicolonnes(vecteurs)Pays_xetProduit_xconstru-ites,oncréelesvariablesindicatricesCountry_ietProduct_javeciallantde1àn
xetjallantde1àp
x.
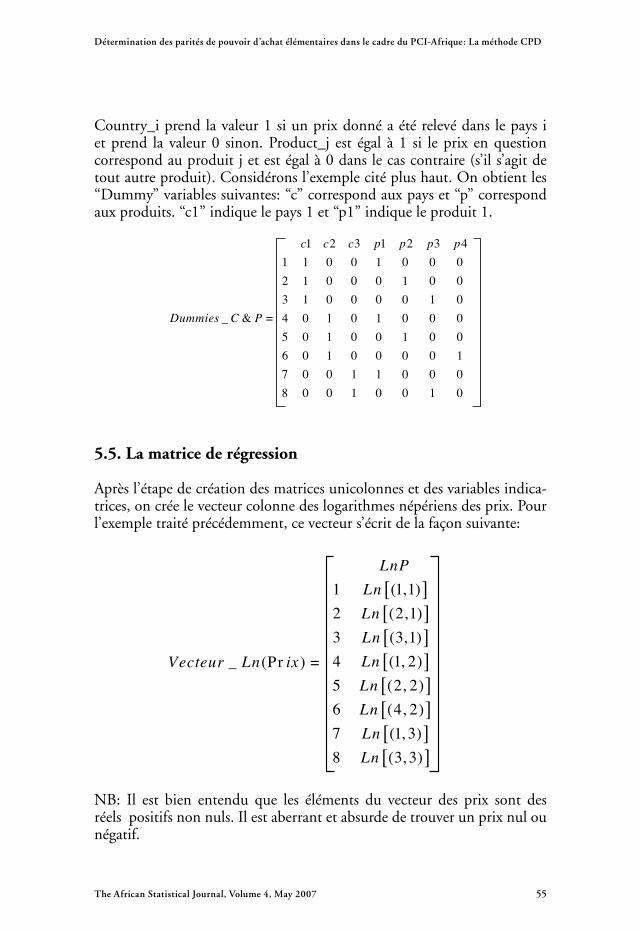
The African Statistical Journal, Volume 4, May 2007 ��
Détermination des parités de pouvoir d’achat élémentaires dans le cadre du PCI-Afrique: La méthode CPD
Country_iprendlavaleur1siunprixdonnéaétérelevédanslepaysietprend lavaleur0 sinon.Product_j est égal à1 si leprixenquestioncorrespondauproduitjetestégalà0danslecascontraire(s’ils’agitdetoutautreproduit).Considéronsl’exemplecitéplushaut.Onobtientles“Dummy”variablessuivantes:“c”correspondauxpayset“p”correspondauxproduits.“c1”indiquelepays1et“p1”indiqueleproduit1.
1 2 3 1 2 3 41 1 0 0 1 0 0 02 1 0 0 0 1 0 03 1 0 0 0 0 1 0
_ & 4 0 1 0 1 0 0 05 0 1 0 0 1 0 06 0 1 0 0 0 0 17 0 0 1 1 0 0 08 0 0 1 0 0 1 0
c c c p p p p
Dummies C P =
5.5. La matrice de régression
Aprèsl’étapedecréationdesmatricesunicolonnesetdesvariablesindica-trices,oncréelevecteurcolonnedeslogarithmesnépériensdesprix.Pourl’exempletraitéprécédemment,cevecteurs’écritdelafaçonsuivante:
[ ][ ][ ][ ][ ][ ][ ][ ]
1 (1,1)2 (2,1)3 (3,1)4 (1, 2)_ (Pr )5 (2, 2)6 (4, 2)7 (1, 3)8 (3, 3)
LnP
Ln
Ln
Ln
LnVecteur Ln ix
Ln
Ln
Ln
Ln
=
NB: Il est bien entendu que les éléments du vecteur des prix sont desréelspositifsnonnuls.Ilestaberrantetabsurdedetrouverunprixnulounégatif.
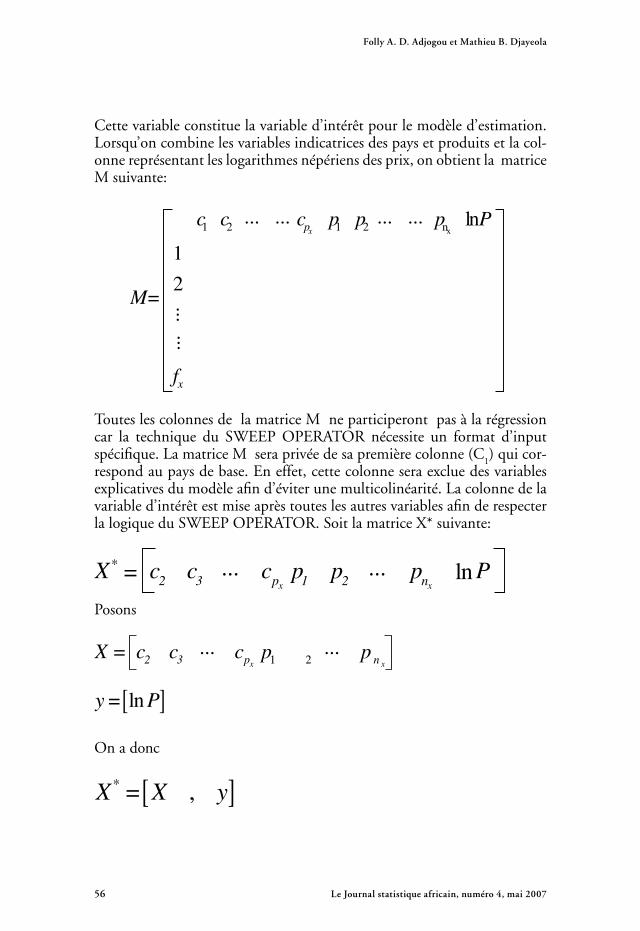
Le Journal statistique africain, numéro 4, mai 2007��
Folly A. D. Adjogou et Mathieu B. Djayeola
Cettevariableconstituelavariabled’intérêtpourlemodèled’estimation.Lorsqu’oncombinelesvariablesindicatricesdespaysetproduitsetlacol-onnereprésentantleslogarithmesnépériensdesprix,onobtientlamatriceMsuivante: ...
1 2 1 2 ln
1
2
xx np
x
c c c p p p P
M
f
=
... ... ... ...
......
TouteslescolonnesdelamatriceMneparticiperontpasàlarégressioncar la technique du SWEEP OPERATOR nécessite un format d’inputspécifique.LamatriceMseraprivéedesapremièrecolonne(C
1)quicor-
respondaupaysdebase.Eneffet,cettecolonneseraexcluedesvariablesexplicativesdumodèleafind’éviterunemulticolinéarité.Lacolonnedelavariabled’intérêtestmiseaprèstouteslesautresvariablesafinderespecterlalogiqueduSWEEPOPERATOR.SoitlamatriceX*suivante:
*2 3 1 2 ln
xx npX c c c p p p P= ... ...Posons
2 3 1 2 xx npX c c c p p= ... ...
[ ]lny P=
Onadonc
[ ]* ,X X y=

The African Statistical Journal, Volume 4, May 2007 �7
Détermination des parités de pouvoir d’achat élémentaires dans le cadre du PCI-Afrique: La méthode CPD
6. La régression
Laméthoded’estimationutiliséeestleSWEEPOPERATOR.LeSWEEPOPERATOR est un algorithme développé par Beaton en 1964. Il estconçupourdescalculsderégressionéconométrique.Soitunerégressiond’unevariabled’intérêtzsurunematriceAdesvariablesexplicatives.LeSWEEPOPERATORconsisteendestransformationssurdesélémentsdelamatriceS=( A* ´A*)oùA*=[A , z]
Dans lecasduCPD,onprocèdeaucalculde lamatriceS=( X*´X*). IlfautrappelerqueX*=[X , y]oùyestlavariabled’intérêtln_PrixetXreprésentelesvariablesexplicativesdéfiniesparlesvariablesindicatrices“Country”et“Product”.Ilnes’agitpasd’unerégressiondelavariableysurXétantdonnéqu’ilexisteunecolinéaritéentrelesPj.Maisl’onsousentendunmodèlesanstermeconstant.C’estlamatriceSquiconstituelamatriceInputauSWEEPOPERATOR.LamatriceSs’écrit:
' '' '
X X X yS
y X y y=
Après les transformationsmatriciellesduSWEEPOPERATOR,onob-tient lamatriceDdontonrécupère lescoefficientsde la régression.Eneffet,lemodèlederégressionpeuts’écriresouslaforme:
2 1
lnx xp n
i i j ji j
P ac b= =
= +∑ ∑ p
Lescoefficientsaietbjconstituentlesparamètresàestimer.aimesurelelogarithmeespéréduratiodeprixPji/Pj1
.Exp(ai)estdonclaParitédepouvoird’achatestiméedupaysiparrapportaupaysdebase9.Ainsi,lescoefficientsdel’estimationconstituentleslogarithmesnépériensdesPar-itésdepouvoird’achat.Levecteur
1
10ˆ( ' )
ˆX X
DRSSβ
β
−−=
delamatriceDestcomposédesnx+px–1paramètresestimésetses(px –1)termesconstituentlescoef-ficientsderégressionrelatifsauxvariablesindicatrices‘Country’.
1
10ˆ( ' )
ˆX X
DRSSβ
β
−−=
9VoirAnnexe10RSSconstitueleResidualSumofSquareset
1
10ˆ( ' )
ˆX X
DRSSβ
β
−−=
estlamatricedescoefficientsdel’estimation

Le Journal statistique africain, numéro 4, mai 2007��
Folly A. D. Adjogou et Mathieu B. Djayeola
Cette expression de la matrice D montre que le SWEEP OPERATORprocède, en réalité, à une estimation des paramètres du modèle par laméthode des moindres carrés ordinaires (MCO). L’on suppose que leshypothèsesd’applicationd’uneméthodeMCOsontremplieset surtoutque l’hypothèsedestationnaritépour lavariabledépendantedumodèleestvalide.
La Parité de pouvoir d’achat pour un pays C est obtenue en calculantl’exponentielle du coefficient de régression correspondant à la variableindicatriceexplicativerelativeaupaysC.
6.1 Interprétation économique
La méthode CPD représente une simple approche par la régressionéconométriquepour expliquer lesniveauxdeprixdesbiens et servicesdans différents pays. De façon fondamentale, la méthode postule quele prix observé Pij d’un bien i dans un pays j est le produit de troiscomposantes:• laParitédepouvoird’achatPPAjouleniveaugénéraldesprix(exprimés
enmonnaiesnationales)dupaysjparrapportauxautrespays,• leniveaudeprixP
idubieniparrapportauxautresbienset
• untermed’erreurVij.
Laformuledebasepeutêtreécritesouslaforme:
Pij = P P A j * Pi * Vij
Sousformelogarithmique,laréécrituredonne:
( ) ( ) ( ) ( )ij j i ij
j i ij
Ln P Ln PPA Ln P Ln Vα β μ
= + += + +
oùaj = LnPPAj , Bi = LnPi et µij = LnVij.C’estpourestimerlesparamètresaietBjqu’intervientl’introductiondesvariablesindicatrices‘Country’et‘Product’danslemodèle.
Lesparitésdepouvoird’achat(PPA)sontdestauxpermettantdeconvertirlesprixdansunemonnaiecommunetoutenéliminantlesdifférencesdepouvoird’achatentremonnaies.End’autrestermes,leurutilisationper-metd’éliminerl’effetdesdifférencesdeniveaudesprixentrepayslorsdelaconversion.

The African Statistical Journal, Volume 4, May 2007 ��
Détermination des parités de pouvoir d’achat élémentaires dans le cadre du PCI-Afrique: La méthode CPD
6.2 Estimation de données manquantes
LaméthodeCPDaétéconçueàlabasepourtraiterdesdonnéesdeprixmanquantesdanslecadredelacomparaisoninternationale.Letraitementestbasésurlescaractéristiquesdupaysparrapportauxautrespaysoùleprixduproduitestdisponible.Eneffet,enthéorieilexistedeuxniveauxd’estimationdedonnéesmanquantes:1. Estimationdesprixmoyensmanquantsdesproduitsàl’intérieurd’une
positionélémentaire.Elleestfondéesurlemodèleetpossèdel’avantagedefournirdesprixmoyensestimésenphaseaveclaparitéélémentairedéjàobtenue.
2. Estimation des parités élémentaires manquantes dues à l’absence dedonnéespourcertainspaysdanslespositionsélémentaires.
Ladeuxième estimation “relance”dans la comparaisonglobale, lespays“exclus”danslasectionII.2).Surunebasepurementéconométrique,leCPDestutilisépourestimerdesParitésdepouvoird’achatdansunpaysauniveaudepositionsélémentairespourlesquellesl’informationdisponiblen’estpasassezsuffisantepourcalculerdirectementlesPPA.Ainsi,lesPPAdisponibles(parpositionélémentaireetparpays)déterminentlavariabled’intérêtdumodèle.LeprincipefondamentalduCPDquiestladualitéPays-ProduitdevientunedualitéPays-Positionélémentaire.
Laparitédepouvoird’achatmanquanted’unpaysipourunepositionélé-mentairekestobtenuecommeproduitdesexponentiellesdescoefficientsestiméscorrespondantsauxvariablesindicatricesrelativesaupaysietàlapositionk.Lemodèles’écritsouslaforme:
2 1ln
P M
ik i i k ki k
ppa ac b pe= =
= +∑ ∑PdésignelenombredepaysetM,lenombredepositionsélémentaires.cicorrespondaupaysietpekcorrespondàlapositionélémentairek.Pourunpaysietrelativementàlapositionélémentairek,ona:ci=1;pek=1etdonc:Inppaik=ai+bkd’oùppaik=exp(ai+bk)=exp(ai)*exp(bk).
7. Application avec Visual Basic
Dans le cadre du PCI-Afrique, le calcul des Parités de pouvoir d’achatau niveau des positions élémentaires a nécessité la mise au point d’une

Le Journal statistique africain, numéro 4, mai 2007�0
Folly A. D. Adjogou et Mathieu B. Djayeola
applicationutilisantlaméthodeCountryProductDummy.Ils’agitd’unprogramme écrit sous le langage Visual Basic d’Excel et qui parcourtles grandes étapesde laméthodeCPD jusqu’à lagénérationdesParitésde pouvoir d’achat des pays participants au PCI-Afrique. L’interface del’applicationseprésentecommesuit:
Figure 1:Maquettedel’applicationdansVisualBasic
Onconsidèrelamatriceinitialedesprix(P)surlafeuillededémarrage.duclasseurExcelcontenantl’application.Audépart,lacolonneBestlaisséevidesurlafeuille.Leprogrammeestexécutéàpartirdelafeuilledelance-ment.
• L’étape 1 consiste à définir le pays de base pour le calcul des PPA.Lorsqu’unpaysestchoisi,‘sesdonnées’sontautomatiquementreportéesdanslacolonneB.End’autrestermes,lacolonneBcontientdésormaislesdonnées relativesaupaysde référence.Onpasseensuiteà l’étaped’initialisation.
• Auniveau du bouton 2,leprogrammelitlesdonnéessurlesprix,parproduitetparpaysetsupprimeleslignesentièrementvidesparproduit.On obtient donc la matrice des prix renseignés Q sur une nouvellefeuille:‘delta’.Onpasseàl’étapeCPDMETHOD
• Le bouton 7 constitue le cœur du programme. A cette étape, leprogrammeinvitel’opérateuràindiquerlespositionsélémentaires(1à155)dontilsouhaitecalculerlesPPA.Pourchaquepositionélémentairex, le programme retient à partir de la feuille ‘delta’ uniquement les

The African Statistical Journal, Volume 4, May 2007 ��
Détermination des parités de pouvoir d’achat élémentaires dans le cadre du PCI-Afrique: La méthode CPD
produits relatifs à cette positionélémentaire. Il recopieensuitecettematriceP(x) surune feuille ‘Posi_x’. Sur cette feuille, leprogrammegénère la matrice P*(x), les vecteurs des prix, pays et produits. Unenouvellefeuille‘Pour_x’estcrééesurlaquelleleprogrammecalculelamatricedesindicatrices,lamatricederégressionetlesvaleursestiméesdesParitésdepouvoird’achat.Onpasseensuiteàl’étapeRESULTS.
• L’étape 4correspondà laprésentationdesrésultats.Eneffet lesPPAsont affichées sur la feuille ‘RESULTS’ du classeur pour toutes lespositionsélémentairesspécifiéesetpourl’ensembledespays.LeboutonEXITpermetdemettrefinauprogramme.
Al’aidedecetteapplication,lesPPApeuventainsiêtredisponiblespourtoutesles155positionsélémentaires.
8. Conclusion
Parmi lesméthodesusuellesd’estimationdesPPA, laméthodeCPDestappréciéepourlefaitqu’ellereposesurdesoutilséconométriques.Ilestd’ailleursrecommandéparleGroupeconsultatiftechniqueduPCIpourlecalculdesPPAauniveaudespositionsélémentaires.
LemodèleélémentaireduCPDpeutêtreétendupourinclured’autresfac-teurscommedescaractéristiquesqualitativesduproduit:parexempleest-ceunproduitreprésentatifounonreprésentatifdanslepaysdelacollecte?Enajoutantlavariabledereprésentativité,lemodèleobtenuestdénomméméthodeCountryProductRepresentativityDummy(CPRD)etpermetégalementdecalculerlesPPAdansunerégiondonnée.
LECPRDfourniraitdemeilleursrésultatsparrapportàlaméthodeCPDlorsque l’information sur la représentativité des produits est disponible,fiableetcomplète.Etmêmedanscecas,ilvautmieuxs’entenirauCPDlorsque,globalementlesproduitssontéqui-caractéristiques.
Références bibliographiques
1. Adam,A.(2004).EstimationoftheCountryProductDummy(CPD)equations,PaperpresentedattheRegionalworkshopofICP-AfricainYaoundé,Cameroon2005;
2. Beaton, A.E., The Use of Special Matrix Operators in StatisticalCalculus(Ed.D.thesis,HarvardUniversity,1964.ReprintedasResearchBulleting64-51,EducationalTestingService,Princeton,NewJersey).

Le Journal statistique africain, numéro 4, mai 2007�2
Folly A. D. Adjogou et Mathieu B. Djayeola
3 Diewert,E.W. (2002).WeightedCountryProductDummyVariableRegressionsandIndexNumberFormulaemimeographed,DepartmentofEconomics,UniversityofBritishColumbia,Vancouver.
4. Diewert,E.W.(2004).OntheStochasticApproachtoLinkingRegionsin the ICP. Paper prepared for the DECDG of the World Bank,WashingtonDC.
5. Noumon, C. N. Maxime (2006). Elaboration d’une méthoded’estimation des prix des enquêtes du Programme de comparaisoninternationalenonrelevésaucoursdupremiersemestre2005.RapportdestageBAD/ENSEA.
6. Rao, D.S. Prasada (2004). The Country-Product-Dummy Method:A Stochastic Approach to the Computation of Purchasing Powerparities in the ICP. Paper presented at the SSHRC Conference onIndexNumbersandProductivityMeasurement,June30-July3,2004,Vancouver,Canada.
7. Schreyer,Paul&Pilat,Dirk.(2001).Mesurer laproductivité.Revueéconomiquedel’OCDEn°33,2001/II.
8. TheICPNewsletter.(Juin2006).Volume3,Numero2.
9. WorldBank(2005),ICPHandbook.Chapter10:TheestimationofPPPsforbasicheadings,Rev1.
Annexe: Quelques notions générales sur la méthode CPD)
LeCPD(CountryDummyProduct)estuneméthoded’estimationpourlecalculdesindicesspatiauxdeprix,etdesParitésdepouvoird’achat(PPA),danslecadreduProgrammedecomparaisoninternationale(PCI).
Lemodèledecetteméthodepeutêtreperçucommelamodélisationd’uncertainnombred’influences:l’influencedespaysquifournissentunees-timationdesPPA,et l’effetdechacundesproduitsqui fournissentuneestimationdesprixinternationauxpourleproduitconcerné.
Soitpncleprixd’unproduitndansunpaysc (n = 1, 2, ...N ; c = 1, 2, ..., C).Lemodèlestatistiquedebaseàl’originedelaCPDpeutêtredécritparl’équation:

The African Statistical Journal, Volume 4, May 2007 ��
Détermination des parités de pouvoir d’achat élémentaires dans le cadre du PCI-Afrique: La méthode CPD
pnc=acbn µnc(n=1, 2 ..., N ; c=1, 2, ..., C) [1]
bnestl’effetduproduitn;a
cestl’effetdupaysc,etµ
ncestuneffetrésiduel.
Lemodèlepostulequecesperturbationssontlognormalementdistribuéesavec1n(µ
nc) B(0,σ2).Soussaformelogarithmique, lemodèleest
linéaireets’écrit:
(ln ) ln ln =
nc c n
c n
E p a bα γ
= ++ [2]
Leparamètreacs’interprètecommeleniveaugénéraldesprixdanslepayscrelativementauxprixdanslesautrespaysconcernésparlacomparaison;ilestgénéralementexpriméparrapportàunpaysdebase;acreprésentedanscecas,laPPAdupaysc,exprimantlenombred’unitésmonétairesdupaysc,ayantlemêmepouvoird’achatqu’uneunitémonétairedupaysdebase.DanscecaslaPPAdupayscestdonnéepar:PPAc=exp(ac)
LemodèledebaseduCPDpeutêtreexprimécommeuneéquationderégressionpourchaqueprixobservécorrespondantàunproduitndanslepaysc.Ilestexpriméparl’équation[2]etpeutêtreréécritdelamanièresuivante:
*
1 1ln ln ln
C N
ij ij j j i i ijj i
y p a D b D ε= =
= = + +∑ ∑
*
1 1
C N
j j i i ijj i
D Dα γ ε= =
+ += ∑ ∑ [3]
pijest leprixdu i emeproduitdans le j emepays;*
1 1ln ln ln
C N
ij ij j j i i ijj i
y p a D b D ε= =
= = + +∑ ∑
*
1 1
C N
j j i i ijj i
D Dα γ ε= =
+ += ∑ ∑
estuntermed’erreuraléatoire;(Dj)j =1,....,cet(Di)i =1,....,Nsontdeuxensemblesdevariablesindica-trices.Chaquepaysconcernéparlacomparaison,hormislepaysdebase,est représentéparunevariable indicatriceD,etchaqueproduitrelatifàunepositionélémentaireestreprésentéparunevariableindicatriceD*.L’équation[2]peutsemettresouslaforme:
[4]avec et ;les valeursdes indicatrices étantdéterminéespar les observations ij.Enempilantlesncobservations(pour i = 1, ..., N et j = 1, ..., C),onobtientl’écriturematricielledumodèle:

Le Journal statistique africain, numéro 4, mai 2007�4
Folly A. D. Adjogou et Mathieu B. Djayeola
[5]
Cetteéquationestunmodèlede régressiongénérale avecNCobserva-tionset(N + C − 1)variablesexplicatives.DepluslamatriceXestderangN + C − 1.Sousl’hypothèsequelesperturbationssontidentiquementetindépendammentdistribuées,lemeilleurestimateursansbiaisdeß,etlamatricedecovarianceassociéesontdonnéspar:
Etantdonnécesexpressions,onmontreque:
1
21
1 1 1
21ˆˆ ln ln ou exp( ) et ( )
NNNij
j ij i j j ji i i
pp p a Var
pNαα
= =
= − = = =∑ ∏ ˆN
α σ
Ainsi, en plus de l’estimation des paramètres inconnus, l’approche parla régression fournit également une estimation des écarts types pourtous les coefficients. En utilisant les résidus d’estimation pour chaque
; j = 1, ..., C et i = 1, ..., N) et l’hypothèse selonlaquelleles*
1 1ln ln ln
C N
ij ij j j i i ijj i
y p a D b D ε= =
= = + +∑ ∑
*
1 1
C N
j j i i ijj i
D Dα γ ε= =
+ += ∑ ∑
sontindépendantsetidentiquementdistribuésdemoyennenulleetdevarianceσ2,unestimateurdeσ2estdonnépar:
1 12ˆ( 1)( 1
C N
ijj i
N C
εσ = ==
− −
∑∑)
L’estimateur estunestimateursansbiaisdecetsavarianceestdonnée
par:2 2ˆ ˆ( )jEstVarN
α σ=
Déduction des estimations des PPA:EtantdonnéquelaPPAdupaysc, estune fonctionnon linéairede
cdonnéepar c il est
d’usage, en pratique, de déduire un estimateur de PPAc en utilisant la
formule:
[6]
Puisd’estimersavariancepar:
= [7]
The African Statistical Journal, Volume 4, May 2007 ��
Détermination des parités de pouvoir d’achat élémentaires dans le cadre du PCI-Afrique: La méthode CPD
Ilfautnotercependantquel’estimateurdansl’équation[6]n’estpasunestimateursansbiais(ESB),etlavarianceestiméedansl’équation[7]n’estqu’uneapproximation.
UnedeslimitesdelaméthodeCPDestqu’ellen’estplusvalideenprésenced’autocorrélationspatialedanslesrésidus,maisceproblèmeserésoutfac-ilementparl’utilisationd’unematriced’autocorrélation.

Le Journal statistique africain, numéro 4, mai 2007��
Levels in African Countries: First Results of the International Comparison Program for Africa
The African Statistical Journal, Volume 4, May 2007 �7
Comparative Consumption and Price Levels in African Countries: First Results of the International Comparison Program for Africa
The African Development Bank Group (AfDB) has published the firstof two main ICP reports to provide details of purchasing power parity(PPP)adjusted realGDPexpenditures,PPP indices, andprice level in-dices(PLIs)forcountriesparticipatingintheInternationalComparisonProgramforAfrica(ICP-Africa).Theresultshavebeengeneratedforthe48participatingAfricancountries.
Theresultscoverfinalhouseholdconsumptionexpenditurebutdonotin-cludeexpenditureonhousingservices.ThesewillbeincludedinthesecondpublicationtobereleasedbyDecember2007.Thesecondpublicationwillalsoincludeinformationongrossfixedcapitalformationandconsump-tionexpendituresbygovernmentandnon-profitinstitutionswhichiscur-rentlybeingcollectedinthecountries.Informationfromseveralcountriesforwhomonlypartialdataarecurrentlyavailablewillbeincludedtoo.
DuetothemultilateralnatureofPPPandrealexpenditureestimates,theinclusionofadditionalprice,expenditureandcountrydatawillmostlikelyalterthefinalresultsinrespectofexistingpricelevelindices,expenditurepatternsandtherankingofcountries.Consequently,theresultsshowninthispublicationaresubjecttorevisionandshouldberegardedasprelimi-nary.
All real expenditure results are expressed in termsof anotionalAfricanregionalcurrency(AFRIC).Thisisdoneintentionallytoavoidthesem-blance of favoring one particular African currency.The results of ICPcomparisonsshould,however,notbeaffectedbythechoiceofcurrencyusedintheircomputation.
OneofthekeyfindingsrelatestotheobserveddifferenceineachcountrybetweentheofficialexchangerateofthecurrenciesandtheirPPPequiva-lents–reflectinginawaytheextentofcurrencyundervaluationorover-valuation.Thenominalexpendituresreflectbothpricelevelsandvolumesof goods and services.The real expenditure levels, which are the moreappropriatemeasures touse for internationalcomparisons,areobtainedbydeflatingthenominalvaluesusingthePPPs.Thus,thePPP-adjustedGDPexpendituresareexpressedatthesamesetofinternationalpricessothatcomparisonsbetweencountriesreflectonlydifferencesinthevolumeofgoodsandservicesandfreeofpriceandexchangeratedistortions.
Le Journal statistique africain, numéro 4, mai 2007��
Levels in African Countries: First Results of the International Comparison Program for Africa
TheICPresultsshowthatoutofthe48Africancountriessurveyed,only7hadpercapitahouseholdexpenditurelevelsabove1,000andmostinfacthadpercapitaexpenditurelevelsoflessthan500.
TheeffectofusingPPPs(themoreappropriatecurrencyconverter)ratherthanexchangeratesisverysubstantialformanycountries.Forexample,using PPPs shows that per capita household expenditure in Ethiopia isnearlytwiceashighaswhennominalexchangeratesareused.ForGabon,ontheotherhand,usingPPPsreducespercapitaexpenditurebyaboutathirdcomparedwiththenominalestimates.
TheICPresultsarecriticalforpolicymanagementanddecisionmakingatbothnationalandinternationallevels.Besidestheirusefulnessforfacili-tatingcross-countrycomparisonofGDPandrelatedaggregates, there-sultsareusefulforcomparingregionalpovertyincidencesandforpovertyanalysisacrosscountriesandacrossregionswithinthesamecountry.ThePPPadjusted$1perdaypovertylineisalsousedasathresholdforpovertymeasurement.ICPinformationcanalsofacilitatetheprocessofharmoniz-ingeconomicpoliciesacrosscountriesthusfosteringregionalintegration.ICPdatacanbeusedforanalysisofacountry’scomparativeadvantageandhencefacilitatepolicydecisionsrelatingtoinvestmentandtrade.Informa-tiongeneratedonwagedifferentialsandcostofproductioningeneralcanbeusedfordecisionsonwheretoinvest.
InviewoftheimportanceofICPdatafordevelopmentpolicymanage-ment, it is important that the Bank and African countries sustain ICPactivitiesbeyondthecurrentround.Inparticular, itwouldbenecessaryforcountriestomakeICPactivitiesintegralpartoftheirregularactivitieswithaspecifiedresourceenvelope.Theinternationalcommunity,ontheotherhand,shouldensurethatcountryeffortsareadequatelysupportedinordertomaintainthecredibilityoftheprocessandtheresults.ThereportcanbeconsultedontheBank’swebsite:www.afdb.org.
The African Statistical Journal, Volume 4, May 2007 ��
Consommation et niveaux des prix dans les pays africainsPremiers résultats du Programme de comparaison internationale pour l’Afrique
LeGroupedelaBanqueafricainededéveloppementvientdepublier lepremierdocumentd’unesériededeuxpublicationssurlesdépensesréellesduproduitintérieurbrut(PIB)déflatéesparlesparitésdepouvoird’achat(PPA)d’unepart,etd’autrepart,lesPPAetlesindicesdeniveaudesprix(INP)despaysparticipantauProgrammedecomparaisoninternationalepour l’Afrique (PCI-Afrique). Les résultats calculés concernent 48 paysafricains.
Lesrésultatsportentsurlesdépensesfinalesdeconsommationdesménageshorslesservicesdelogement.Cesservicesserontinclusdansladeuxièmepublicationdontlaparutionestprévued’iciàdécembre2007.Ladeux-ièmepublicationcomprendraaussilaformationbruteducapitalfixe,lesdépensesdeconsommationdesadministrationspubliquesetdesinstitu-tionssansbut lucratifauservicedesménages,dont lesdonnéessontencoursdecollectedanslespays.L’ensembledesdonnéessurlespaysdontuniquementdesinformationspartiellessontactuellementdisponiblesse-rontinclusesaussidanscettepublication.
EnraisonducaractèremultilatéraldesPPAetdesdonnéessurlesdépensesréelles,l’incorporationdedonnéesadditionnellessurlesprix,lesdépensesetlespays,changeraprobablementlesrésultatsdéfinitifsrelatifsauxindi-cesdeniveaudesprix,àlastructuredesdépensesetauclassementdespays.Parconséquent,lesrésultatsdecettepublicationsontsujetsàd’éventuellesrévisionsetdoiventêtreconsidéréscommepréliminaires.
Touteslesdépensesréellesprésentéesdanscedocumentsontexpriméesendevisedénommée“Monnaieafricained’intégrationrégionale(AFRIC)”.Ceci est fait àdessein,pour éviterdedonner l’illusionde favoriserunequelconquemonnaieafricaine.Lesrésultatsdelacomparaisonsont,danstouslescas,invariantsparrapportàlamonnaieutiliséedanslescalculs.
L’undesprincipauxrésultatspourchaquepaysconcerneladifférenceob-servéeentreletauxdechangeofficieldesamonnaieetlaPPAcorrespon-dante–quireflètedansunecertainemesurel’ampleurdelasous-estima-tionoudelasurestimationdecettemonnaie.Lesdépensesnominalessontcomposéesàlafoisdesniveauxdeprixetdesvolumesdesbiensetservices.Lesniveauxdedépensesréelles,entantquemesureslesplusappropriéespourlescomparaisonsinternationales,sontobtenuesendéflatantlesva-leursnominalesparlesPPA.Ainsi,lesdépensesduPIBdéflatéesparles

Le Journal statistique africain, numéro 4, mai 200770
Premiers résultats du Programme de comparaison internationale pour l’Afrique
PPAsontexpriméesàpartird’unmêmeensembledeprixinternationauxdesortequelescomparaisonsentrelespaysreflètentuniquementlesdif-férencesenvolumedebiensetservicestoutenéliminantleseffetsdeprixetlesdistorsionsdestauxdechange.
LesrésultatsduPCImontrentquesurles48paysenquêtés,seuls7ontdesniveauxdedépensesdesménagesparhabitantaudessusde1000AFRICetlaplupartendessousde500.
L’utilisationdesPPA,(convertisseurdedevisesplusapproprié)plutôtquelestauxdechange,auneffetsubstantielpourbeaucoupdepays.Parex-emple,enEthiopie,ontrouvequ’unedépensedeconsommationréelleparhabitantestpresqueledoubledecelleobtenueavecletauxdechange.AuGabonparcontre,l’utilisationdesPPAréduitde1/3lesdépensesnomi-nalesparhabitant.
LesrésultatsduPCIsont,parailleurs,utilespourlagestiondespolitiquesetlaprisededécisionauxniveauxnationaletinternational.EnplusdeleurutilisationdanslacomparaisoninterpaysdesPIBetleursprincipauxagré-gats,cesrésultatspeuventserviràlacomparaisonrégionaledel’incidencedelapauvretéetàl’analysedelapauvretéaussibienentrepaysqu’entrelesrégionsd’unmêmepays.Leseuildepauvretéde1dollardesE.U.déflatéparlesPPAsertaussideseuildemesuredelapauvreté.Enoutre,lesin-formationsduPCIcontribuentàfaciliterleprocessusd’harmonisationdespolitiqueséconomiquesàtravers lespaysetfavorisentainsi l’intégrationrégionale.LesdonnéesduProgrammesontégalementutilespourévaluerl’avantagecomparatifd’unpaysetfaciliterainsilesprisesdedécisionsurleschoixd’investissementetdecommerce.Lesrésultatssurlesdifférentielsdesalairesetlescoûtsdeproductionengénéralpeuventêtreutiliséspourlesdécisionsrelativesauxlieuxd’investissement.
Compte tenu de l’importance des données du PCI pour la gestion despolitiquesdedéveloppement,ilestimpératifquelaBanqueetlespaysafri-cainssoutiennentlesactivitésduProgrammeau-delàdeceprésentround.Enparticulier,ilseraitindispensablepourlespaysd’intégrerlesactivitésduPCIdans leurs travauxréguliersetde leuralloueruneenveloppederessourcesspécifique.D’autrepart,lacommunautéinternationaledevraits’assurerqueleseffortsdespayssoientconvenablementsoutenusenvuedemaintenirlacrédibilitéduprocessusetdesrésultats.LerapportpeutêtreconsultésurlesitewebdelaBanque:www.afdb.org.
The African Statistical Journal, Volume 4, May 2007 7�
Nouveaux défis en statistiques agricoles: initiatives de la FAO
Haluk Kasnakoglu, Hiek Som, David Marshall, Naman Keita, Frank Schmitt, Kafkas Caprazli, François Fonteneau�
Résumé :Dans un contexte marqué par une demande en information statistique toujours croissante et plus diversifiée, la Division de la Statistique de la FAO poursuit ses efforts afin de renforcer durablement les capacités des pays à produire et utiliser des statistiques agricoles de qualité. Ainsi, la FAO poursuit son plaidoyer en faveur de la mise en place de systèmes nationaux intégrés. Cette approche per-met une utilisation optimale des ressources disponibles en considérant le système statistique national dans son ensemble et en y intégrant les statistiques agricoles au sein d’un cadre institutionnel clair. Forte de son expérience, la FAO propose aussi de revoir la stratégie pour l’organisation des recensements agricoles, dans le cadre plus large des systèmes statistiques intégrés. L’approche modulaire du recensement agricole, la collecte de données au niveau communautaire et la coordination avec le recensement de la population sont les innovations majeu-res du nouveau Programme mondial du recensement de l’agriculture pour les années 2006-2015. La FAO travaille également à la modernisation de son système FAOSTAT, afin de répondre aux exigences de qualité de ses utilisateurs. Le nouveau système, basé sur un cadre conceptuel rénové, fournit des outils à jour pour estimer et analyser les données, ainsi qu’un système centralisé intégré de metadonnées. Enfin, la FAO développe un cadre à destination des pays, CountrySTAT, qui répond à leurs besoins en matière de système d’information permettant l’harmonisation et la diffusion des statistiques agricoles.
Mots clés : statistiques agricoles, système statistique intégré, recensement de l’agriculture, base de données, FAOSTAT, CountrySTAT, FAO
Summary: In a context marked by increasing demand for more diversified statistical data, FAO Statistics Division continues its efforts to develop countries capacities for producing and using quality agriculture statistics. Thus, FAO continues its advocacy for establishing integrated national systems. This approach allows an optimal use of available resources by considering the national statistical sys-tem as a whole and integrating the agricultural statistics within a coherent institutional framework. Based on its sound experience, FAO also proposes to
1LesauteurssontfonctionnairesdelaDivisiondelaStatistiquedelaFAO(Rome,Italie)respectivement:Directeur,Chefdeservice,Statisticienprincipal,Statisticienprincipal,ManagerFAOSTAT,ManagerCountrySTAT,Statisticien.

Le Journal statistique africain, numéro 4, mai 200772
Haluk Kasnakoglu, Hiek Som, David Marshall, Naman Keita, Frank Schmitt, Kafkas Caprazli, François Fonteneau
re-examine the strategy for agricultural censuses organization, within broader framework of the integrated statistical systems. Agriculture census modular ap-proach, data collection at community level and coordination with population census are the major innovations of the new agriculture census global Program for the period 2006-2015. To meet the users quality requirements, FAO also works on its FAOSTAT system modernization. The new system, based on a renovated conceptual framework, provides up to date tools to estimate and ana-lyze data, as well as an integrated centralized metadata system. Lastly, FAO is designing countries framework, named CountrySTAT, an information system allowing agriculture statistics harmonization and dissemination.
Key words:agriculture statistics, integrated statistical system, agriculture cen-sus, databases, FAOSTAT, CountrySTAT, FAO
1. Introduction
Lesdeuxdernièresdécenniesontétémarquéesparuneaméliorationsen-siblede laproductiondestatistiquesagricolesdans lespaysendévelop-pement.Lademandeeninformationstatistiquedequalitévaquantàelletoujourscroissante,tantàl’échelonnationalqu’international.Cesdeman-des sont de plus en plus diversifiées, notamment avec l’effort porté cesdernièresannéessurlaréductiondelapauvreté,laluttecontrel’insécuritéalimentaireetlesuividesobjectifsdumillénairepourledéveloppement.Lasituationvaried’unpaysàl’autre,maisdeslacunes,voirdegravesca-rences, subsistentmalgré les efforts consentis.Certainspays se trouventdans une situation paradoxale où des données sont produites mais peuutilisées,souventenraisond’uneanalysestatistiqueprécaire,d’unediffu-sioninexistanteoutoutsimplementparcequ’ellesnerépondentpasauxbesoinsdesutilisateurs.Dotésdemoyenshumainsetfinancierssuffisants,lessystèmesdestatistiquesagricolesontpourtantprouvéqu’ilsétaientca-pablesdeproduirelesrésultatsquel’onattendaitd’eux.
Dans ce contexte, la Division de la Statistique de la FAO poursuit seseffortsafinderenforcerdurablementlescapacitésdespaysàproduireetutiliser des statistiques agricoles de qualité. Ainsi, la FAO poursuit sonplaidoyer en faveurde lamise enplacede systèmesnationaux intégrés.Fortedesonexpérience,elleproposeaussiderevoirlastratégiepourl’or-ganisationdesrecensementsagricoles,danslecadrepluslargedessystèmesstatistiquesintégrés.LaFAOtravailleàlamodernisationdesonsystèmeFAOSTAT,afinderépondreauxexigencesdequalitédesesutilisateurs.Enfin,elledéveloppeuncadreàdestinationdespays,CountrySTAT,qui

The African Statistical Journal, Volume 4, May 2007 7�
Nouveaux défis en statistiques agricoles : initiatives de la FAO
répondà leursbesoins enmatièrede systèmed’informationpermettantl’harmonisationet ladiffusiondes statistiques agricoles.L’objectifde cepapierestdeprésenteretdéveloppercesquatreinitiativesmajeuresdelaFAO,quirépondentdirectementauxprioritésdesesEtatsMembres.
2. Les systèmes intégrés de statistiques agricoles
2.1 Qu’est-ce qu’un système intégré de statistiques agricoles?
Unsystèmeintégrédestatistiqueestunsystèmedanslequellesopérationsdeproductiondestatistiquessonteffectuéesdefaçonconcertéeetcoor-donnée.Chaqueopérationdeproduction(collecte,analyse,diffusion)estconçuecommeunélémentdusystèmestatistiquedanssonensemble.
Lesdifférentescomposantesd’untelsystèmeproduisentdesrésultatsquis’inscriventdansunensemblecohérentetcomplémentaire,ensoutienàlaprisededécisiondanslessecteursdel’alimentation,del’agricultureetdudéveloppementrural.
2.2 Avantages d’un système intégré de statistiques agricoles
Parmilesavantagesd’unsystèmeintégrédestatistiquesagricoles,onpeutsoulignerlespointssuivants:• Il permet de planifier et de concevoir un programme de statistique
complet etdétaillé, enévitant lesdoubles emploisou ladiffusiondestatistiquescontradictoires,toutengarantissantuneutilisationefficienteetrationnelledesressourcesstatistiquesdisponibles;
• Il permet de garantir la compatibilité des concepts, des définitionset des classifications utilisés dans les différentes activités statistiques,ce qui facilite l’interprétation et l’analyse des données provenant dedifférentessources;
• Ilpermetderestreindretouteslesopérationsdecollectedestatistiques(comme le recensementde l’agriculture) àunensemblede rubriquescohérentes et faciles à gérer, sachant que d’autres données connexespeuventêtrefourniespard’autressources,sousuneformecomparable.
2.3 Quelques outils d’intégration
LaFAOrecommandel’adoptiond’uncadreinstitutionneladaptéetsou-tenuparuneinfrastructurelégale.Uncadrelégalcohérentetdéfinissantclairement le rôle des différentes institutions qui interviennent dans la

Le Journal statistique africain, numéro 4, mai 200774
Haluk Kasnakoglu, Hiek Som, David Marshall, Naman Keita, Frank Schmitt, Kafkas Caprazli, François Fonteneau
production des statistiques de l’alimentation et de l’agriculture permetd’assurer une meilleure complémentarité des activités et de minimiserlesduplications.
L’élaborationd’uneStratégieNationaledeDéveloppementdelaStatisti-que(SNDS)couvrantl’ensembledessecteursdusystèmenationalconsti-tueunprocessusessentielpourassurerl’intégrationdusystèmedestatisti-quesagricoles.LaSNDSfaciliteaussil’intégrationdesstatistiquesagricolesdanslesystèmenationaldestatistique.
L’intégration au niveau des données primaires peut être réalisée grâce àl’utilisationdecertainsoutilstechniques,notamment:• Utilisationd’unitésstatistiquescommunes(exploitationagricole)pour
lesenquêtesetrecensementsagricoles;• Utilisationd’unéchantillonmaîtrepourlesdifférentesenquêtes;• Utilisation de nomenclatures et classifications communes pour les
différentesenquêtes;• Choix des classes et catégories identiques pour la présentation des
résultatsdedifférentesenquêtespermettantlacomparabilité.
Auniveaudesdonnéessecondaires,laFAOaconçuuncadrestatistiquecohérent qui facilite l’intégration et la diffusion des données provenantdedifférentes sources (FAOSTATauniveauglobaletCountrySTATauniveaupays).Cecadre repose sur l’utilisationdes systèmesdeclassifica-tionsinternationales,l’emploideméthodologiesstatistiquesadaptéesetladocumentationdesmétadonnées.
2.4 Système intégré et programme pluriannuel de recensements et d’enquêtes agricoles
Un système intégréde statistiques agricoles s’appuie surunprogrammepluriannuel d’activités statistiques dont l’objectif est de répondre à lademandeeninformations.
Danslecadredusystèmeintégré,lerecensementdel’agriculturejoueunrôlecapitalcarilpermetdecollecterauprèsdesexploitationsagricoleslesdonnéesquipeuventêtreutiliséespourconstruiredesbasesde sondageadaptéesauxenquêtesagricolesparsondage,quiluisontcomplémentaires.L’approcheintégréepermetdeplanifieretréaliseraveclameilleureeffica-citéunprogrammed’enquêtesagricoles.
The African Statistical Journal, Volume 4, May 2007 7�
Nouveaux défis en statistiques agricoles : initiatives de la FAO
Unprogrammed’enquêtesagricolesdegrandeampleur (avec l’exploita-tion agricole comme unité statistique de base) comprend des enquêtespériodiques sur laproduction agricole etdes enquêtes approfondies surdeséléments telsque lescoûtsdeproductionet l’emploidutemps.Lesenquêtessurl’alimentationetl’agriculture,dontl’unitéstatistiquedebasen’estpasl’exploitationagricole(lesenquêtessurlaconsommationalimen-taire, les revenus et les dépenses, la population active rurale, la sécuritéalimentairedesménages,etc.)sontunesourcededonnéesimportantesurl’agriculture.Ellescouvrentgénéralementtouslesménagesruraux.Enfincertaines enquêtes liées à l’agriculture couvrent des types d’unités com-plètementdifférents–parexempleuneenquêtesurlesétablissementsdeservicesagricoles.
Lesdonnéescollectéeslorsdesdifférentesenquêtessontsouventinterdé-pendantesetcouvrentgénéralementdiversthèmesconnexes.Parexemple,dansuneenquêteagricole,ilestintéressantderapprocherlesdonnéessurl’aquaculturedesdonnéessurlaterre,lesculturesetl’élevage,etd’exami-nerlesapportsenmaind’œuvreetd’autrespratiquesagricoles.Certainesquestions,relativesaugenreouàlasécuritéalimentairedesménages,sonttransversalesdansdiversesenquêtes.
Lacomplexitédel’agricultureetdesproblématiquesassociéesàl’alimenta-tionplaideenfaveurdel’approcheintégréepourlesystèmestatistique.
2.5 Système intégré et développement statistique dans les pays
Laplanificationetlamiseenœuvred’unsystèmeintégrédestatistiquesagricolesnécessitentuneorganisationefficace,unpersonnelqualifiéauxdiversniveauxetdescréditsassuréssuruncertainnombred’années.L’ef-ficacitédel’organisationnécessiteuneétroitecollaborationentrelespro-ducteursetlesutilisateursdesstatistiquesagricoles.Lesdiversesactivitésstatistiquesnerelevantpastoutesnécessairementdelamêmeadministra-tion(leservicestatistiquenationalestsouventchargédurecensementdel’agriculture, alorsque les enquêtes annuelles sur laproduction agricolesonteffectuéesparleministèreconcerné),ilestprimordiald’établirunecoordinationeffectiveentre lesdiverses institutionsafindegarantiruneproductionstatistiquequirépondeauxbesoinsexprimés,malgrélesrigidi-tésinstitutionnellesrémanentes.
Denombreuxpayssontpénalisésparunepénuriedepersonnelstatistiquequalifiéet /oupar lemanquedemoyensfinanciers,et il leur faudradutempspourmettreenplaceunsystèmeintégrédestatistiquesagricoles.La
Le Journal statistique africain, numéro 4, mai 20077�
Haluk Kasnakoglu, Hiek Som, David Marshall, Naman Keita, Frank Schmitt, Kafkas Caprazli, François Fonteneau
FAOrecommandequetousleseffortsdedéveloppementstatistiqueaientpourobjectifàlongtermedefournirunfluxpermanentdedonnéesfiablesetàjourintéressanttouslesaspectsdel’alimentation,del’agricultureetdudéveloppementrural.
3. Le programme mondial de recensement de l’agriculture 2010
3.1 Les grandes lignes du Programme mondial du recensement de l’agriculture
LaFAOvientdelancerleneuvièmeProgrammemondialdurecensementde l’agriculture (programmede2010)afind’aider lespaysàplanifiereteffectuer leur recensementnationalde l’agriculturequiaura lieudurantunedes annéesde ladécennie2006-2015.Un recensementagricole estuneopérationstatistiquedecollecte, traitementetdiffusiondedonnéessurlastructuredusecteuragricolecouvrantlatotalité,ouunegrandepar-tie,dupays.Jusqu’ici,lesrecensementsdel’agricultureontprincipalementétéaxés sur lacollectededonnées structurellesconcernant lesunitésdeproduction agricole (exploitations). Le programme de 2010 a la mêmeorientationmaisproposedes innovationsmajeures,notammentpar sonapprochemodulaireetlacollectedestatistiquescommunautaires.
Pourleprogrammede2010,l’accentaétémissurl’élaborationdurecen-sementdel’agriculturedanslecadreglobaldusystèmeintégréderecen-sements etd’enquêtes agricoles.Ce systèmepeut être considéré commeconstituédedeux éléments: i) le recensementde l’agriculturequi est lenoyaudusystème;etii)leprogrammed’enquêtesagricolesparsondage.Lerecensementlui-mêmes’articuleautourd’unmoduledebaseetdemo-dulescomplémentairesoptionnels,cequiconstituelanouvelleapprochemodulaire.Lesdonnées fondamentales sont recueilliesdans le cadredumoduledebase,paruninventairecompletdetouteslesexploitationsagri-coles,alorsque lesdonnées structurellesplusdétaillées sont rassembléesparéchantillonnagedanslecadredesmodulescomplémentaires.
3.2 Changements par rapport aux précédents programmes de recensement de l’agriculture
Leprogrammede2010aétéélaboréentenantcomptedel’expériencedespaysavecleprogrammede2000,etd’uneévaluationdesnouveauxbesoinsetdeschangementsàapporterauxrubriques,comptetenudel’évolutiondesprati-quesagricoles.Lesprincipalesnouveautésduprogramme2010sontrésuméesci-dessous. D’autres améliorations d’ordre méthodologique ont par ailleurs

The African Statistical Journal, Volume 4, May 2007 77
Nouveaux défis en statistiques agricoles : initiatives de la FAO
été apportées: changements spécifiques concernant les unités statistiques, lecontenudesdonnées,lesconcepts,lesdéfinitionsoulesclassifications.
L’approche modulairePouraiderlespaysàrépondreàlademandeenfournissantunepluslargegammededonnéesàpartirdurecensementdel’agriculture,toutenmini-misantlecoûtdel’opération,laFAOrecommandel’adoptiond’uneap-prochemodulairecomprenant:• Unmoduledebasedurecensement, reposant surundénombrement
exhaustif,quifourniraunéventailrestreintderubriquesstructurellesclés,essentiellespourlaformulationdespolitiquesnationales,pourlescomparaisonsinternationales,pourlaconstitutiondebasesdesondageetpourl’analysedesdonnéesventiléesparzonesgéographiquesouenfonctiond’autrescritères.Lemoduledebaseestanalogueaurecensementtraditionneldel’agriculture,maisilcontientunegammederubriquesbeaucoupplusrestreinte;
• Unouplusieursmodulescomplémentairesdurecensement,effectuésparsondage,àréalisersimultanémentouimmédiatementaprèslemoduledebasepour fournirdesdonnées structurellesplusdétailléesoudesdonnéesquine sontpasnécessairesauniveaudespluspetitesunitésadministratives. Pour les modules complémentaires du recensement,l’échantillonserasélectionnéàpartirdesbasesdesondageextraitesdumoduledebase.
LaFAOrecommandeunelistede16rubriquespourlemoduledebase,constituantl’ensembleminimaldedonnéesrecommandépourlerecense-mentdel’agriculture.Lespayspeuventinsérerd’autresrubriquesdebasepour fournir les données additionnelles requises oupour constituerdesbasesdesondagepourlesmodulescomplémentairesdurecensementoupourleprogrammed’enquêtesagricoles.Parexemple,siuneenquêteap-profondiesurlesengraisdoitêtreréalisée,onpeutajouteraumoduledebaseunerubriquecomplémentairesurl’utilisationdesengraispourfacili-terlasélectiondel’échantillonnécessairepourcetteenquête.
LaFAOfournitaussiunelistede89rubriquesquelespayspeuventen-visagerd’incluredanslesmodulescomplémentairesdurecensement.Lespays ne sont pas censés effectuer tous les modules complémentaires durecensementoucollecterdesdonnéessurles89rubriquescomplémentai-res.Chacunconduiraunouplusieursmodulescomplémentaires,selonsesbesoins.Parexemple,unpaysdanslequell’irrigationetl’élevagetiennentuneplaceimportantepourraiteffectuerlemoduledebase,plusdeuxmo-dulescomplémentairessurl’irrigationetl’élevage.

Le Journal statistique africain, numéro 4, mai 20077�
Haluk Kasnakoglu, Hiek Som, David Marshall, Naman Keita, Frank Schmitt, Kafkas Caprazli, François Fonteneau
Les données au niveau communautaire Enplusdesdonnées collectées auniveaudes exploitations, il est égale-mentprévuderecueillirdesdonnéesrelativesauxinfrastructuresauprèsdescommunautés,cequiestimportantdansbeaucoupdepays.Lesdon-nées au niveau communautaire (village ou commune) peuvent servir àexaminerl’infrastructureetlesservicesdisponiblespourlesexploitationsetaideràformuler,exécuteretévaluerdesprojetscommunautaires.Desdonnéesindiquantsilacommunautéestsujetteauxcatastrophesnaturellesouauxpénuriesvivrièressaisonnièrespeuventégalementêtreutilespouruneanalysedelasécuritéalimentaire.Lacollectedesdonnéesauniveaucommunautaire peut englober des données concernant l’agriculture quineseraientpasrecueilliesauprèsdesexploitations,commel’étenduedesterrescommunautaires.Étantdonnélafortedemandededonnéesdeni-veaucommunautaire,unecomposantecommunautaireaétéinclusedansleprogramme2010etlespayssontinvitésàintégrercettecomposanteenfonctiondesconditionslocalesetdesdonnéesnécessaires.
L’intégration des recensements de l’agriculture et de la populationL’accentestégalementmissurl’intégrationdesrecensementsdel’agricul-tureetdelapopulation.Lesrecensementsnationauxsontdesinitiativesdegrandeenvergureextrêmementcoûteuses.Ilexistedenombreuxpointscommunsentrelerecensementdelapopulationetdulogementetlere-censementdel’agriculture.C’estpourquoilaFAOcollaboreétroitementaveclaDivisiondesstatistiquesdesNationsUniespourtrouverlemoyenderenforcerlesliensentrecesdeuxactivitésafind’épargnersurlescoûtsetd’accroîtrel’utilitédesdonnées.Cespointscommunssontlessuivants:• Utilisationdeconcepts,définitionsetclassementscommuns;• Partagedeladocumentation;• Utilisation du recensement démographique comme cadre pour le
recensementagricole;• Utilisationdesdonnéesrelativesàl’agricultureprovenantdurecensement
démographique;• Recueil de données complémentaires sur l’agriculture dans le
recensementdémographique;• Intégrationdesdonnéesprovenantdesdeuxrecensements;• Conduite des deux recensements comme une opération de terrain
conjointe.
Le programme 2010 souligne qu’il importe, dès les premiers stades duprocessusdeplanificationdesopérations,dechercherlemoyendecoor-

The African Statistical Journal, Volume 4, May 2007 7�
Nouveaux défis en statistiques agricoles : initiatives de la FAO
donnerlesdifférentesactivitésnationalesetdelesprendreencomptedansl’élaborationdesplansstatistiquesnationaux.Lespaysdevrontprendrelesmesuresadministrativesnécessairespourassureruneétroitecollaborationentreleséquipeschargéesdurecensementetveilleràexploitertouteslespossibilitésdecoordination.
Elargissement de l’objectif et de la portée du recensement de l’agricultureEtant donné que certains pays souhaiteront probablement recueillir unpluslargeéventaildedonnéesqueparlepassé,deuxoptionssontpropo-sées:i)effectuerunrecensementdel’aquaculture,encombinaisonaveclerecensementdel’agriculture;etii)fournirdesdonnéescomplémentairessurl’agriculture,concernantdesménagesquinesontpasdesproducteursagricoles mais qui interviennent d’une manière ou d’une autre dans cesecteur,parexemplesurlesménagesquiviventenzoneruraleouquitirentleurrevenud’unemploidansl’agriculture.Detellesenquêtespeuventêtremenéesaprèslerecensementproprementdit.
4. Le nouveau système FAOSTAT
4.1 Une modernisation attendue
FAOSTAT est un produit bien connu au sein des agences des NationsUnies,ainsiquedanslesmilieuxstatistiquesetuniversitaires.Lesconcep-teurs de politiques, les décideurs et beaucoup d’autres acteurs, tant auniveaunationalqu’international, en sont lesutilisateursprincipaux.Onestimequ’unquartdesvisitesauxpageswebdelaFAOontpourobjectifderechercherdesdonnéesstatistiques.
L’environnementdetraitementdeFAOSTATestopérationneldepuisplusd’unedécennie.Cesdernièresannées,seslimitationstechniquesetfonc-tionnellessontdevenuesplusévidentes,notammentenraisondesattentescroissantesdesutilisateurs.LaFAOtravailleactuellementàlamodernisa-tiondeFAOSTAT.Lenouveausystèmefournitdesoutilsàjourpourcom-piler,valider,estimeretanalyserlesdonnées,ainsiqu’unsystèmecentraliséintégrédemetadonnéesstatistiques.Lesystèmeestfondésurdesmétho-dologiesstatistiquesréviséesetunedémarchequalitéquiestappliquéedefaçon systématique etuniforme.Le système fournit égalementunaccèsamélioréauxdonnéespourl’utilisateur.Unevued’ensembledesfluxdedonnéesdanslesystèmeFAOSTAT(voirleschéma1),depuislesdonnéesnationalesjusqu’auxutilisateursfinaux,montrelaportéedelamodernisa-tiondeFAOSTAT.

Le Journal statistique africain, numéro 4, mai 2007�0
Haluk Kasnakoglu, Hiek Som, David Marshall, Naman Keita, Frank Schmitt, Kafkas Caprazli, François Fonteneau
Schéma 1.FluxdedonnéesauseindusystèmeFAOSTAT
Pays FAOSTAT Data Warehouse – Utilisateurs internes FAO Utilisateurs exterieurs
Collecte des données
PublicationsQuestionnaires
Internet
Editingdes donn es
Cadres statistiques
AgroalimentaireEconomie
PrixCommerceRessources
Intr
anet
FA
OS
TA
T
Inte
rnet
FA
OS
TA
TS
ite
web
Suivi de la qualité et des flux de données
Produits
Annuaires
Methodologies Concepts et définitionsdes données Classifications
Symboles et unités Notes explicatives
é
Cadres statistiques
AgroalimentaireEconomie
PrixCommerce
Suivi de la qualité et des flux de données
Validation
CDsDVDs
Validation
Qualité des
4.2 Le module central et les modules satellites
LenouveausystèmeFAOSTATs’articuleautourd’unmodulecentraletdemodulessatellites.Cemodèlefournituneapprochesouplepuisqu’ilsuffitderelierlesmodulessatellitesaumodulecentraletentreeuxafindeper-mettrel’intégrationetl’échangededonnées.Lemodulecentralcontientlesmetadonnéesstatistiquesstandardpourfacilitercetteintégration.Tou-teslesdonnéesstatistiquesdumodulecentralemploientlesdéfinitionsetlesclassificationsstandard.
4.3 Le cadre conceptuel de l’intégration
Lescadresméthodologiquesintégrésportentsurlesdomainesprincipauxdel’agricultureetl’agroalimentaire(production,utilisation,commerceetconsommation);desressources(disponibilité,utilisationetcommercedesfacteursdeproduction);del’économie(facteursdeproduction,prixdesfacteursdeproduction,production,prixdelaproduction);desprix(prixdesfacteursdeproduction,prixdelaproduction,prixducommerce);ducommerce(importations,exportations).Lescadresméthodologiquesinté-gréscomprenentlesdonnéesconsolidéesdumodulecentraldeFAOSTAT(voirleschéma2).

The African Statistical Journal, Volume 4, May 2007 ��
Nouveaux défis en statistiques agricoles : initiatives de la FAO
Figure 2.LescadresméthodologiquesdumodulecentraldeFAOSTAT
Commerce
Ressources
Agriculture etagroalimentaire
Prix
Prix commerce
Prix intrants
Prix production
Consommation
Production
Facteurs de production
Commerce
Econ
om
ie
4.4 Méthodologies statistiques
Les méthodologies statistiques les plus pertinentes ont été développées,testées,validéespardespairsetmisesenœuvrepourestimer,calibrer,équi-librer,etainsiproduireunensemblededonnéescohérentpourchacundesdomainesstatistiquesdeFAOSTAT.Cesméthodologiesstatistiquessontaussiemployéespourproduiredesdonnéespourlaprochainegénérationd’indicateurs statistiques clés. L’approche suivie emploie des techniquesrobustesd’estimationparticulièrementadaptéespourlessituationsoùlesdonnéesdisponiblessontlimitées.
4.5 Metadonnées
La disponibilité de metadonnées structurées, complètes et centraliséesestunecaractéristiquenouvelledeFAOSTAT.Lesystèmedegestiondesmetadonnéesfournitlesprocéduresetlesmécanismespouréviterlesdu-plicationsdans la collecte et lagestiondesmetadonnées,pour résoudrelesincohérences,etpourpermettrelalargediffusiondecesinformations.FAOSTATcoopèreavecl’initiatived’Echange de données statistiques et de metadonnées(SDMX).
4.6 Classifications
L’anciennelistedesproduitsagricolesdeFAOSTATservaitlesbesoinsspé-cifiques des statistiques de production agricole. Cette liste, initialementbasée sur la classification standard internationaledu commerce (SITC),

Le Journal statistique africain, numéro 4, mai 2007�2
Haluk Kasnakoglu, Hiek Som, David Marshall, Naman Keita, Frank Schmitt, Kafkas Caprazli, François Fonteneau
avaitétéadaptéeaucasparcasparlaFAO.Uneréuniond’expertssurlesclassificationspourl’agriculture,organiséeenaoût2004,arecommandéquelesproduitsdeFAOSTATsoientclassésselonlesclassificationsinter-nationalesenvigueur.AinsiunenouvellelistebaséesurleSystèmeharmo-nisé(HS)aétédéveloppée.PuisquelesliensentrelesclassificationsHS,CPC(Classificationdesproduitscentrale),SITCetleslistesdeFAOSTATsontexplicites, il estdésormaispossibledecomparerCPCet la listedeFAOSTATenpassantparHS,quifournitl’ossaturedeCPC.
4.7 Qualité des données
LenouveausystèmeFAOSTATpermettradesuivreetd’évaluerlaqualitédes données à toutes les étapes de leur flux international (depuis le paysjusqu’à ladiffusionpar laFAO).L’aspect fondamentalde cette approcheestqu’ellesefocalisesurlestroisétapesduprocessusstatistique(quandladonnéeentredanslebureaunational,quandellesortdubureaunational,etquandelleestdiffuséeparlaFAO).Ensuivantlaqualitédesdonnéesàcestroispointsclés,ilestpossibled’évaluerlavaleurajoutéeparchaqueétapeduprocessusetd’enévaluerlaperformance.Desindicateursdequalitédesdonnéessontencoursd’identificationpourchacunedecesétapes.
4.8 Diffusion
LesproduitsdérivésdeFAOSTAT(publications:annuaires,cd)sontac-tualisésdanslecadredelaredéfinitiondelastratégiedediffusion.Cettestratégiesefocalisesurlesbesoinsdesutilisateurs,lesnouvellesfonctionna-litésdusystèmestatistique,lesnouvellestechnologiesetlesévolutionsgé-néralesdansledomainedeladiffusiond’informations.L’améliorationdespossibilitésoffertesparleportaildeFAOSTATpermettraauxutilisateursd’effectueruntravailanalytiqueplusapprofondi.Enparticulier,lesutilisa-teurstrouverontuneinterfaceaméliorée,aveclapossibilitédevisualiserlesdonnéesoudelestéléchargerdansdifférentsformatspouruneutilisationultérieuredansleprogrammedeleurchoix.
5. Le système CountrySTAT
5.1 Qu’est-ce que CountrySTAT?
CountrySTATestcadreetunsystèmed’informationstatistiquenationalsurl’alimentationetl’agriculture.CountrySTATfavorisel’harmonisationdesdonnéesetdesmetadonnéesnationales, favorise leuranalyseetsou-tientainsi laprisededécisionpolitique.Lesystème,basésur l’Internet,

The African Statistical Journal, Volume 4, May 2007 ��
Nouveaux défis en statistiques agricoles : initiatives de la FAO
a été testé en 2005 dans les institutions statistiques du Kirghizstan, duKenyaetduGhana.
CountrySTATviseàrenforcerlacapacitédespaysàstockeretdiffuserlesdonnéesqu’ilscollectentetproduisent.CountrySTATestunsystèmeju-meaudeFAOSTAT.Pardéfinition,FAOSTATetCountrySTATévoluentensembledanslasynchronisationcomplètedeleursprincipessurl’organi-sationetlaclassificationdesdonnéesetmetadonnées.
5.2 Le cadre de CountrySTAT
L’organisationdesdonnéesdanslesystèmeCountrySTATcorrespondaucadreanalytiquedumodulecentraletdesmodulessatellites,partagéavecFAOSTAT.Ceciestd’ailleurslabaseduliensémantiqueentreCountryS-TATetFAOSTAT.Lemodulecentralsetrouvedansl’interfacewebsouslasection“ModulecentraldeCountrySTAT”.Danscemodulecentral,lestableauxstatistiquessontorganisésparthèmes.TouslesmodulescentrauxdessystèmesCountrySTATenactivitépartagentcettemêmestructure,cequifaciliteladiffusionetlacomparabilité.Enplusdumodulecentral,lespaysontlapossibilitésouslasection“CountrySTAT–détails”d’organiserleursdonnéesàdesniveauxplusdétaillés(découpageadministratif,pério-dicité),ainsiquesurd’autresthématiques.Cesmodulessatellitesprésen-tant lesdonnéesdétailléesetspécialiséessontorganisésdansunsystèmededossiersthématiquesajustablesauxbesoinsdupays.Ilfautnoterqu’unmêmetableaustatistiquepeutêtreassociéàplusieursdossiersthématiques,aussibiendumodulecentralqued’unmodulesatellite.
5.3 Le système CountrySTAT
Production dynamique de tableaux statistiquesL’utilisateurpeutchoisirletableauquil’intéressedansundossierthéma-tique.Dansunefenêtrededialogue, ilsélectionnepourchaquevariablelesvaleursqui l’intéressentetexécutesarequêtesur labasededonnées.LerésultatdesarequêteesttraitéparPX-Web,lemoteursous-jacentdusystèmeCountrySTAT,etestaffichésousformedetableauxquipeuventêtreprésentésselonsesbesoinsanalytiquesousespréférences(utilisationdemodèlestypes,transpositiondestableaux,etc.).Lesystèmepermetéga-lementdevisualiserdestableauxprédéfinisparl’administrateur.
Diagrammes analytiquesLestableauxstatistiquesrésultantd’unerequêtepeuventêtrevisualiséssousforme graphique en utilisant une fonction intégrée à CountrySTAT. Les

Le Journal statistique africain, numéro 4, mai 2007�4
Haluk Kasnakoglu, Hiek Som, David Marshall, Naman Keita, Frank Schmitt, Kafkas Caprazli, François Fonteneau
optionspossibles incluent:barresverticalesethorizontales, lignes, secteurs,points,pyramides,radar,histogramme,barresempilées,etc.Chaquediagram-mepeutensuiteêtreretouchéetréutilisédansunautrelogicielapproprié.
CartesLorsquelesdonnéessontspatialiséesetassociéesauxrégions,districtsouautreszonesdupays,lestableauxstatistiquespeuventêtrecartographiés.Lafabricationdecartesàuneseulecouched’informationestainsifaciledansCountrySTAT.Chaquecartepeutensuiteêtreretouchéeetréutiliséedansunautrelogicielapproprié.
Echange de données et metadonnéesLes tableaux statistiques résultantd’une requête sont générés en formatHTML. Ils sont facilement convertibles dans tous les formatsusuels etspécifiquesd’échange:MSExcel,CSV,PC-Axis.Lestableauxquisontté-léchargéscontiennentexactement lesvecteurschoisisdans l’ordredéter-minéparl’utilisateur,cequis’avèretrèsutilepourrestructurerdegrandstableaux multidimensionnels, en particulier lorsque l’administrateur dusystèmedécided’exploiterlapossibilitédecréerdestableauxavec16varia-bles!L’intégralitédesdonnéesetdesmetadonnéesdutableaudemandéesttéléchargeable,quelquesoitleformatsouhaité.L’intégralitédesdonnéesetmetadonnéesd’unthèmepeutêtretéléchargéeenemployantleformatXML/SDMX,quiestunfichierstatiquepréparépar lesadministrateursdusystème.SDMXestunfichierXMLvalidépourleDTD(définitiondutypededonnées)commedéfiniparl’initiativeSDMX(Echangededon-néesetmetadonnéesstatistiques).
Metadonnées intégréesCountrySTAT est basé sur le système PC-Axis, qui utilise des tableauxmultidimensionnels. Les metadonnées font partie intégrale de ces ta-bleaux,quireprennentlesmêmesclassificationsetsystèmesdecodagequeFAOSTAT.CountrySTATpermetl’utilisationdeslanguesnationales,oul’agrégationdesrubriquesselonlesprioritéslocales.Lorsquecelaestpossi-ble,lescodagesetappellationsgéographiquessontceuxdelaclassificationGAUL,sinonilssontconformesàceuxemployésdanslesclassificationsnationalesetutilisésdansFAOSTAT.
Extensibilité du systèmeL’extensibilitédeCountrySTATaétéexaminéeàdeuxniveaux:• Extensibilitéd’untableau:untableausimulantlesdonnéescommerciales
de184payssur40anspour120produits(883,200données,chacuneavec8chiffres)aétéproduiteetmanipuléeenquelquesfractionsdeseconde
The African Statistical Journal, Volume 4, May 2007 ��
Nouveaux défis en statistiques agricoles : initiatives de la FAO
surunordinateurportable.Laperformanced’exécutionsurunserveurdevraitêtreencoreplusrapide.Lefacteurlimitantdansl’affichageestlacréationdelagrilledutableauparlenavigateurInternet;
• Extensibilité des structures de la matrice: 2,000 tableaux ont étéproduits etplacésdansdifférentesdossiers thématiques.La structuredenavigationentrecestableauxaétécrééeenmoinsd’uneminuteparl’opérateurdusystème.
5.4 Partenariats pour CountrySTAT
L’objectifdeCountrySTATestderépondreauxbesoinsdesproducteursetdesutilisateursnationaux,notammentlespoliticiensetleschercheurs,enemployantlesméthodologiesstatistiquesdeFAOSTAT.LaFAOainstalléavecsuccèsdesprototypesdesystèmesCountrySTATenpartenariataveclesinstitutionsstatistiquesnationauxduKirghizstan,duKenyaetduGha-na.Cesétudespilotesontétémenéesdanslesconditionsréellesdespaysoùlesecteurprimaireestd’importancecapitaletantpourleursécuritéali-mentairequepourleurdéveloppement.Cesétudesconfirmentqueleca-drestatistique,latechnologieutiliséeetl’approcheemployéeconviennentpoursatisfairelesbesoinsdesinstitutionsstatistiquesnationales,commelesbesoinsdeFAOSTAT.Lesdonnéesetlesmetadonnéessontconsultéesetéchangéesfacilement, lesclassificationset lessystèmesdecodificationsontadaptablesà l’environnement technologiqueemployé,et ladurabi-litédessystèmesmisenplacepeutêtreespérée.Plusde15paysettroisorganismesrégionauxontdéjàdemandéuneadaptationdeCountrySTATpourleursinstitutionsstatistiques.Àpartirdecetteannée2006,grâceàlamobilisationdefinancementsdesgouvernementsetdesbailleursinterna-tionaux,l’expansiondeCountrySTATs’accélère.
LaDivisiondelaStatistiquedelaFAOsetientàladispositiondesesEtatsMembrespourlesaideràrépondredefaçonappropriéeauxdéfisauxquelsilssontconfrontés.Pourcefaire,ellechercheàbâtirdespartenariatsaveceux,aveclesautresinstitutionsstatistiquesinternationalesetlesdonateursafind’engageruncerclevertueuxdeproductionetd’utilisationdestatistiquesagricoles.Ladurabilitédecesystèmerevienttoujoursauxdécideursnationaux,ycomprislesresponsablesstatistiques,quisontlesseulsàpouvoirgarantirlapérennitéd’unsystèmequirépondevéritablementàleurspréoccupations.

Le Journal statistique africain, numéro 4, mai 2007��
Haluk Kasnakoglu, Hiek Som, David Marshall, Naman Keita, Frank Schmitt, Kafkas Caprazli, François Fonteneau
Références bibliographiques
D.J. Casley and D.A. Lury, Data Collection in Developing Countries,1976.
EUROSTAT,Quality work and quality Assurance within Statistics,DGINSConferenceinStockholm,1999
FoodandAgriculturalOrganizationof theUnitedNations,Un système intégré de recensements et d’enquêtes agricoles. Volume 1 Programme Mondial de recensement de l’agriculture 2010.CollectionDéveloppementStatistiqueNo11,2005
FoodandAgriculturalOrganizationoftheUnitedNations,Programme du recensement mondial de l’agriculture 2000.CollectionDéveloppementStatistiqueNo5,1995
FoodandAgriculturalOrganizationof theUnitedNations,Conducting agricultural censuses and surveys, Collection Statistical DevelopementNo6,1996
FoodandAgriculturalOrganizationoftheUnitedNations,Kasnakoglu,FAOSTAT and CountrySTAT: Integrated Global and National Food and Agriculture Statistical Databases,April2006
FoodandAgriculturalOrganizationoftheUnitedNations,Les statistiques de l’alimentation et de l’agriculture dans le cadre d’un système national d’ information,CollectionDéveloppementStatistiqueNo1,1986
FoodandAgriculturalOrganizationof theUnitedNations,Zarkovich,Quality of statistical data,1966
FoodandAgriculturalOrganizationoftheUnitedNations,Report of the 2005 Session of the FAO International Advisory Group on Agricultural Statistics,2005
FoodandAgriculturalOrganizationoftheUnitedNations,Modernization of FAOSTAT - An Update, 2002, ‘http://www.fao.org/DOCREP/MEETING/004/Y6298e.htm’
Food and Agriculture Organization of the United Nations (2003),FAOSTATStatisticalDatabase,‘http://apps.fao.org/’

The African Statistical Journal, Volume 4, May 2007 �7
Nouveaux défis en statistiques agricoles : initiatives de la FAO
FoodandAgriculturalOrganizationoftheUnitedNations,Presentations - Informal Expert Consultation on CountrySTAT,17to19March2003,‘http://www.fao.org/es/ess/meetings/cy_stat_p.asp’
FoodandAgriculturalOrganizationoftheUnitedNations,Final Report - Informal Expert Consultation on CountrySTAT,2003,‘http://www.fao.org/es/ess/meetings/fin_rep.asp’
Food and Agricultural Organization of the United Nations, FAOSTAT Project,2004,‘http://www.fao.org/faostat/’
FoodandAgriculturalOrganizationoftheUnitedNations,H.KasnakogluandR.Mayo,FAO Statistical Data Quality Framework: A multi-layered approach to monitoring and assessment,ConferenceonDataQualityforInternationalOrganizations,Wiesbaden,Germany,27-28May2004,‘http://unstats.un.org/unsd/acc’
FoodandAgriculturalOrganizationoftheUnitedNations,CountrySTAT,2004,‘http://www.fao.org/faostat/countrystat_en.asp’
FoodandAgriculturalOrganizationoftheUnitedNations,K.Caprazli,Report on the implementation of CountrySTAT in pilot countries,‘http://www.fao.org/es/ESS/meetings/download/afcas2005/papers/AFCAS_05_6_5.pdf ’
Golan,A.,Judge,G.andMiller,D.,Maximum Entropy Econometrics: Robust Estimation with Limited Data,NewYork:JohnWiley&SonsInc
Heckelei,T.,Mittelhammer,R.,Britz,W.(2005),A Bayesian Alternative to Generalized Cross Entropy, Solutions for Underdetermined Models,Paperpresentedatthe89thEAAESeminar,February3-5,Parma,Italy
Hodrick, R.J. & E.C. Prescott (1997), Postwar U.S. Business Cycles: An Empirical Investigation,JournalofMoney,Credit,andBanking,29,1–16

Le Journal statistique africain, numéro 4, mai 2007��
Richard Coe�

The African Statistical Journal, Volume 4, May 2007 ��
Analysing Data from Participatory On-farm Trials
Richard Coe �
Summary: Researchers carrying out participatory on-farm trials, particularly variety selec-tion trials, often have difficulty analyzing the resulting data. The irregularity of designs means that some of the standard tools based on analysis of variance are not appropriate. In this paper some simple extensions to analysis of vari-ance, using general linear models and linear mixed models, are shown to facili-tate insightful analysis of these awkward designs.
Key words: Variety selection trials, analysis of variance
Résumé:Les chercheurs effectuant des essais participatifs en milieu réels, en particulier des essais de sélection variétale, éprouvent souvent des difficultés à analyser les données qui en résultent. Le manque de régularité dans les dispositifs expéri-mentaux fait que certains des outils standards basés sur l’analyse de variance ne sont pas appropriés. Dans cet article, il est présenté des prolongements simples de l’analyse de variance, en utilisant les modèles linéaires simples et des modèles mixtes pour permettre une analyse plus appropriée des dispositifs expérimen-taux compliqués.
Mots clés: Essais de sélection variétale, analyse de la variance
1. Introduction
Datafromon-farmtrialsisofmanytypes,fromcropyieldsmeasuredonin-dividualplotstothereportedconsensusofparticipantsatagroupmeeting.Anysetofdatathatincludesmultipleobservationswhicharenotallidenticalwillrequiresomesortofstatisticalanalysisinordertosummarisethecommonpatterns.Choiceofappropriateanalysismethodsdependson:1. Theobjectivesoftheanalysis.2. The design (who compared what treatments or varieties under
whichconditions).3. Thetypeofmeasurementstaken.
1ICRAF,Nairobi,Email:[email protected]

Le Journal statistique africain, numéro 4, mai 2007�0
Richard Coe�
InSection2ofthispaperIdiscussdifferingstylesandobjectivesofanaly-sis.Aformalapproach,similartothatcommonlycarriedout,forexample,oncropyieldsmeasuredinaclassicalvarietytrialusinganalysisofvarianceandreportingvarietymeans,hasaroleinanalysisofsomeparticipatorytrials.Theirregularityofdesignsoftenmeansthatthewell-knownmeth-odsmaybeinappropriate.InSection4Ishowhowsomeextensionstotheusualmethodscanbeused.Manyresearchersreportthatresultsfromon-farmtrialsarehighlyvariable.Section5showshowsomeofthisvaria-tionmaybeinterpretedtogainfurtherinsights,particularlyintodifferingresponsesindifferentsituations,orGxEinteraction.ExamplesusedtoillustratethemethodsareintroducedinSection3.Themethodsdescribedinthispaperareappropriateforresponsesmeasuredonacontinuousscale,suchasacropyields.Analysisofresponsesrecordedasscoresorranksarethesubjectofacompanionpaper(Coe2007).
Themethodsdescribedinthispaperarenotnewnordescribedindepth.TechnicaldescriptionscanbefoundinnumerouspublicationsincludingKemptonandFox(1997)andHildebrandandRussell(1998).2. Approaches to Analysis
Anassumptionofthispaperisthatparticipationandthesystematiccol-lection,analysisandinterpretationofdataarenotcontradictoryactivities.Amongsomepractitionersthereisabeliefthatadoptionofaparticipatoryparadigmremovestheneedfor,orevenmakesitimpossiblefor,researcherstocollectandanalysedata.Thepurposeofparticipationisseenasempow-ermentoflocalpeople,whichisinconsistentwithresearchersconductingactivitiesthatmeettheirownobjectives.Howevermanyresearchersrec-ognisethatgeneralisableconclusions,ofrelevancebeyondtheimmediateparticipants,arestillnecessary,andthatpartofthisresearchmustbethecollectionandinterpretationofdata.CoeandFranzel(2000)summarisetheresearchdesignprinciplesthatmuststillbefollowediftheresearchistoleadtovalidinferences.
Aparticipatoryapproachdoes,however,haveimplicationsforthecollec-tion,analysisandpresentationofdata.Datacollectionisdiscussedelse-where.Analysiscanbeforand,tosomeextentby,differentparticipants,eachofwhomwillhavetheirowninterestsandobjectives.Inthecaseofparticipatorycropbreedingtrials,participantsmightincludefarmers,re-searchers,extensionstaffandregionalplanners.Whileafarmerisinterestedinmakingdecisionsaboutvarietiestoselectfortheirownfarm,aregionalplannermightbeinterestedinaverageperformancesandaresearcherin

The African Statistical Journal, Volume 4, May 2007 ��
Analysing data from participatory on-farm trials
reasonsforheterogeneousresponses.Eachwillrequireadifferenttypeofanalysis.Astheresearcherisoftenalsothefacilitatorofthewholeprocessitistheresearcher’sresponsibilitytoensureeachparticipanthasthedatatheyneedinaformatthatisuseful.
Itisparticularlyimportantforaresearchertomakedataandresultsavail-abletofarmers.Thereareatleast3reasons1. Farmersaresupposedtobebeneficiariesoftheactivities,andcanonly
benefitifinformationgetsbacktothem.2. Giving farmers results is a courtesy as they have made the research
possiblethoughtheirinvolvement.3. Farmerscanprovideconsiderableinsightsintotheanalysisandresults.It
isverycommontohearthecomplaintthat‘datafromon-farmtrialsareveryvariable’.Thisvariationispartoftherealworld,andunderstandingitscausesshouldbeanobjectiveoftheresearch.Suchanunderstandingwill eventually lead to improved farmer decision making. Farmersunderstandsomeofthereasonsforthevariationandtheirinsightscanoftenprovideaframeworkorhypothesesforanalysis.
When plant breeders did classical, on station experiments, the analysisdoneoftenfollowedastandardpattern–forexampleanalysisofvariancefollowedbytabulationofmeansandapplicationof‘meansseparationpro-cedures’.Oftenlittleattentionwaspaidtoexploratoryanalysis,designedtodetectthemainpatternsandsurprisingobservations.Norwasmuchef-fortmadeatimaginativepresentationofresults–researchersknewhowtoreadthetablesandtheyweretheintendedaudience.Whenparticipatoryapproachesgainedpopularity,analystsmadeattemptstofindinterestingandinformativepresentationsofdata,buttendedtoforgetaboutformalanalysisandhencesometimesreachedinvalidconclusions.
Ofcoursebothapproachestoanalysisareneededandreinforceeachother.Graphicalandexploratorymethodshowtheimportantresults,revealoddobservationsandunexpectedpatterns.Formalmethodsallowmeasuresofprecisiontobeattachedtoresultsandallowextractionofestimatesfromcomplexdatastructures.Wecannotsaythateitherapproachisbetter-bothareneededindifferingroles.InthisdocumentIhaveconcentratedonformalanalysisasrequested.Itisalsoeasiertofindgeneralmethodsandapproachesthatcanbedescribedandappliedinmanysituations.
Presentationandanalysisarenotthesame.Themethodofpresentingre-sultswilldependonthenatureoftheresultandthestorythatistobetoldwiththem,aswellastheaudience.Iamnotawareofanyworkthatshows

Le Journal statistique africain, numéro 4, mai 2007�2
Richard Coe�
thatliteratefarmersfinditeasiertointerpretgraphsthannumericalinfor-mation.Indeeditseemslikelythatasimplenumericaltablemaybemorefamiliarthanaquantitativegraph.
Thestepsinanalysisofanydatasetcanbesummarisedas:1. Definetheanalysisobjectives.Thesedrivetherestoftheanalysis.Itis
impossibletodoagoodanalysisofdatawithoutclearobjectives.Oftenthekeygraphsand tables canbedefinedat this stage, evenwithouthavingresultsyettofillthemin.
2. Prepare the data. Data sets will have to be entered and checked,suitabletransformationsmade(egtodryweightperunitarea),relevantinformationfromdifferentsources(egfarmhouseholddataandplotlevelyields)extractedtothesamefile,andsoon.
3. Exploratoryanddescriptiveanalysis.Theaimistosummarisethemainpatternsandnoticefurtherpatternsthatmayberelevant.
4. Formalstatisticalanalysis.Theaimistoaddmeasuresofprecisionandprovideestimatesfromcomplexsituations
5. Interpretationandpresentation.
Iterationbetweenthestepswillbenecessary.TrainingmaterialsbyCoeetal(2001)providemuchmoreinformationonanalysisofexperiments.
AspreadsheetpackagesuchasExcelisusefulformuchofthedescriptiveanalysis.Flexiblefacilitiesfordataselectionandtransformation,tabulationandgraphicsareuseful.Howeverdedicatedstatisticalsoftwareisneededfortheanalysesdescribedhere.TheycannotbedoneinExcel.Thereareseveralpackageswithroughlyequivalentfacilities.AlltheexamplesgivenuseGenstat(2000)asIfinditoftentheeasiesttounderstand,particularlyasmethodsfordifferentproblemscanbeaddressedwithasimilarsetofcommandsandmostconvenient.SPSSiswidelyusedbysocialscientistsbut is not particularly useful for the analyses described here.There arefurthercommentsonsoftwareattheendofthispaper.
Theexampleresultsinthispaperhavebeencopieddirectlyfromtheoutptproducedbythesoftware.Thesewouldnormallyneedsomeeditingandimprovedpresentationforpublication.
3. Examples
1. Agroforestry of soil fertility in MalawiThisisnotabreedingtrialbutisincludedasthedesignistypicalofmanyparticipatory on farm trials.Three soil fertility strategies are compared

The African Statistical Journal, Volume 4, May 2007 ��
Analysing data from participatory on-farm trials
overanumberofyears:g–mixedintercroppingofmaizeandgliricidias–relayplantingofmaizeandsesbaniac–thecontrolofcontinuousmaize.
41farmerseachcomparedthecontrolwithoneorbothoftheothertreat-ments.Cropyieldistheresponseofinterest.Anumberofcovariatesweremeasuredattheplotorfarmleveltohelpunderstandthereasonsforvari-ationacrossfarms.Intheanalysesbelow,thedatastructure‘name’identi-fiesthefarmers,‘trt’thetreatmentstocompareand‘yield98’istheyieldsresponseofinterest.
2. Maize varieties in ZimbabweThiswasa‘baby’trial.12maizevarietieswerecompared.146farmersin25differentsitestookpart,eachonetesting4ofthe12varieties.Thevari-etiesforeachfarmertotestwerechosenbytheresearcher.Somehouseholdandfieldcovariateswererecorded.
Theactualcropyieldsobtainedwerenotavailableforanalysis,sotheex-ampleshereusesimulatedyielddatabuttheoriginalfielddesign.Intheanalysesbelow,thedatastructure‘FARM’identifiesfarmers,‘ENTRY’thevarietiestocompareand‘simyield’theresponseofinterest.
4. Average treatment effects
Example 1Data
trt Average of yield 98 Count of yield 98
c 1.73 31
g 2.47 39
s 2.50 24
Grand Total 2.23 94
Thestartingpointfortheanalysisshouldbesimpleexplorations,suchasthetableofmeansabovethatgivesthemeanyieldinthe98seasonforeachtreatment,togetherwiththenumberofobservations.
Theformalanalysisaimsgenerallytodotwothings:1. Improve the estimates. In this caseweknow that the treatmentsdo
notalloccuroneachfarmsosomeadjustmentforfarmeffectsmaybeneeded(seeExample2formoreonthis).

Le Journal statistique africain, numéro 4, mai 2007�4
Richard Coe�
2. Provide measures of precision – standard errors and confidenceintervals.
Thisistheroleofanalysisofvarianceandassociatedproceduresin‘regular’designs.Exactlythesameideascanbeusedhere.
Genstatcommandstocompletetheanalysisare:
model yield98fit [p=a;fprob=y] name+trtpredict trt
***** Regression Analysis ***** *** Accumulated analysis of variance *** Change d.f. s.s. m.s. v.r. F pr.+ name 38 168.6518 4.4382 13.39 <.001+ trt 2 15.9187 7.9594 24.01 <.001Residual 53 17.5691 0.3315 Total 93 202.1396 2.1735 Response variate: yield98 Prediction S.e. trt c 1.6386 0.1066 g 2.6235 0.0952 s 2.3677 0.1240
Standarderrorsofdifferences(sed)canalsobefound.Theyare:
sed
g-c 0.145
s-c 0.166
g-s 0.160
Whilethisanalysisiscorrectandtechnicallyefficientitispossiblyalittleopaque!Analternativewhichiseasiertounderstandfollows.
Theresearcher is interested incomparisonof the treatmentsand in thechangeinperformance(egyield)realizablebychangingfromonetreat-menttoanother.Farmersarealsointerestedinthiscomparison,thoughthe criteria for comparison may be different from those of researchers.Experimentsaredesignedtoassessthischange.It isthereforenaturaltoapproachanalysisofthedatabyfocusingonthesechanges.Thestepsare:
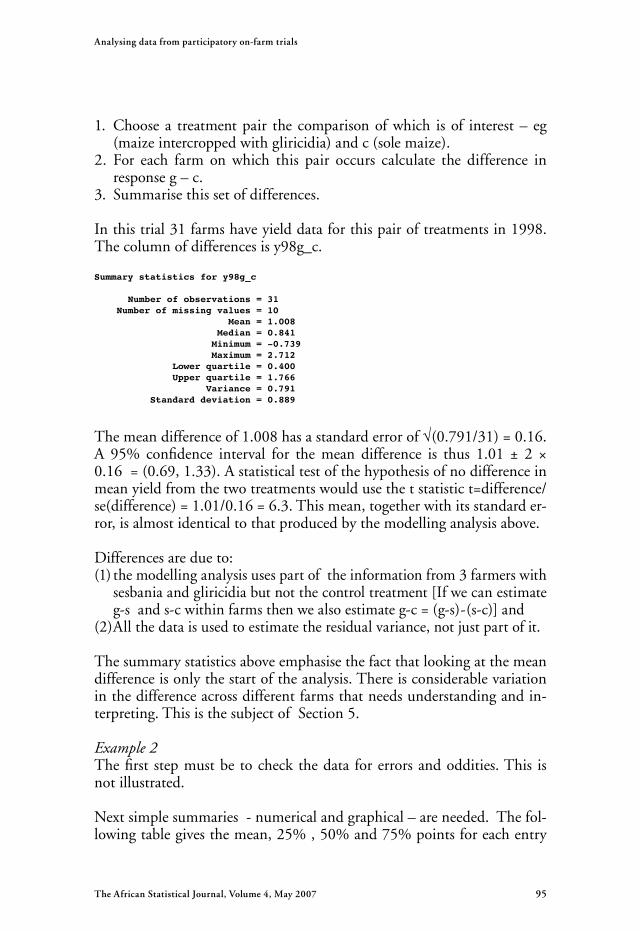
The African Statistical Journal, Volume 4, May 2007 ��
Analysing data from participatory on-farm trials
1. Choosea treatmentpair thecomparisonofwhich isof interest–eg(maizeintercroppedwithgliricidia)andc(solemaize).
2. For each farm on which this pair occurs calculate the difference inresponseg–c.
3. Summarisethissetofdifferences.
Inthistrial31farmshaveyielddataforthispairoftreatmentsin1998.Thecolumnofdifferencesisy98g_c.
Summary statistics for y98g_c Number of observations = 31 Number of missing values = 10 Mean = 1.008 Median = 0.841 Minimum = -0.739 Maximum = 2.712 Lower quartile = 0.400 Upper quartile = 1.766 Variance = 0.791 Standard deviation = 0.889
Themeandifferenceof1.008hasastandarderrorof√(0.791/31)=0.16.A 95% confidence interval for the mean difference is thus 1.01 ± 2 ×0.16=(0.69,1.33).Astatisticaltestofthehypothesisofnodifferenceinmeanyieldfromthetwotreatmentswouldusethetstatistict=difference/se(difference)=1.01/0.16=6.3.Thismean,togetherwithitsstandarder-ror,isalmostidenticaltothatproducedbythemodellinganalysisabove.
Differencesaredueto:(1)themodellinganalysisusespartoftheinformationfrom3farmerswith
sesbaniaandgliricidiabutnotthecontroltreatment[Ifwecanestimateg-sands-cwithinfarmsthenwealsoestimateg-c=(g-s)-(s-c)]and
(2)Allthedataisusedtoestimatetheresidualvariance,notjustpartofit.
Thesummarystatisticsaboveemphasisethefactthatlookingatthemeandifferenceisonlythestartoftheanalysis.Thereisconsiderablevariationinthedifferenceacrossdifferentfarmsthatneedsunderstandingandin-terpreting.ThisisthesubjectofSection5.
Example 2Thefirststepmustbetocheckthedata forerrorsandoddities.This isnotillustrated.
Nextsimplesummaries-numericalandgraphical–areneeded.Thefol-lowingtablegivesthemean,25%,50%and75%pointsforeachentry

Le Journal statistique africain, numéro 4, mai 2007��
Richard Coe�
togetherwiththenumberofplotsfromwhichitiscalculated.NoteExcelisverygoodforthistypeoftabulationbutcannotgivethe%points.
tabulate [class= ENTRY; p=nobs,means,quant; percent=!(25,50,75)] data=simyield Nobservd Mean _25.0% Median _75.0% ENTRY 1 50 1.276 0.679 1.238 1.699 2 47 3.077 2.344 2.909 3.639 3 47 2.713 2.076 2.699 3.521 4 50 3.305 2.416 3.473 4.083 5 49 1.323 0.624 1.138 2.124 6 49 3.371 2.594 3.195 3.792 7 50 1.760 0.973 1.742 2.499 8 49 2.429 1.573 2.362 3.143 9 42 1.436 0.659 1.584 2.202 10 51 3.448 2.708 3.401 4.380 11 50 3.099 2.494 3.165 3.761 12 50 1.597 0.677 1.788 2.206
Similarinformationispresentedgraphicallyinaboxplot:
X 185
X 191
XX 1376
X 175
Thisparticularboxplothashighlightedsomeoutlyingobservationswhichshouldbecheckedforpossibleerrors.
Theseoverallsummariesareunlikelytobeofinteresttofarmersinanyonelocation,butthedatafromtheirneighbourhoodshouldbeveryrelevant.Asimpletableoffarmbyentryforeachsitemaybeausefultoolfordiscus-sionwiththisgroupof8farmers,asithighlightsbothvariationbetweenentriesandthevariationbetweenfarmerswhotestthesamethings.Itislikelythatfarmerscantellyousomethingaboutthereasonsforvariation.Thismayhelpdirectformalanalysis.Forexample,iftheyidentifysomeofthelowyieldsascomingfromplotsknowntobeinfertile,somemeasuresoffertilityshouldbebuiltintotheformalanalysis.Theymayalsobeableto tell you something about the tradeoffs between different assessmentcriteria–forexample,expressingsatisfactionwithavarietywhichisnotthehighestyielderbecauseofsomeotherdesirableproperty.Thedatamayneedconvertingtounitsthatfarmersuseandunderstand.

The African Statistical Journal, Volume 4, May 2007 �7
Analysing data from participatory on-farm trials
SITE 1
Average of simyield
FARM
ENTRY 1 2 3 4 5 6 7 8 Grand Total 1 2.03 1.70 1.86 2 3.39 2.43 2.63 2.82 3 1.51 2.66 2.11 1.81 2.02 4 4.97 3.36 4.01 4.11 5 0.28 0.29 1.55 0.74 0.72 6 3.06 2.35 1.96 2.45 7 0.45 1.82 1.13 8 2.00 2.00 9 0.00 1.77 0.89 10 4.47 3.15 3.81 11 2.06 2.40 1.02 1.83 12 1.40 1.79 0.40 1.20Grand Total 2.01 0.68 3.72 1.72 2.54 2.60 1.89 1.23 2.05
Anyofthesetablescanberearrangedtoclarifyimportantinformation–forexample,sortingbymeanmaymakethetableeasiertoread:
SITE 1
Average of simyield
FARM
ENTRY 1 2 3 4 5 6 7 8 Average 4 4.97 3.36 4.01 4.11 10 4.47 3.15 3.81 2 3.39 2.43 2.63 2.82 6 3.06 2.35 1.96 2.45 3 1.51 2.66 2.11 1.81 2.02 8 2.00 2.00 1 2.03 1.70 1.86 11 2.06 2.40 1.02 1.83 12 1.40 1.79 0.40 1.20 7 0.45 1.82 1.13 9 0.00 1.77 0.89 5 0.28 0.29 1.55 0.74 0.72Average 2.01 0.68 3.72 1.72 2.54 2.60 1.89 1.23 2.05
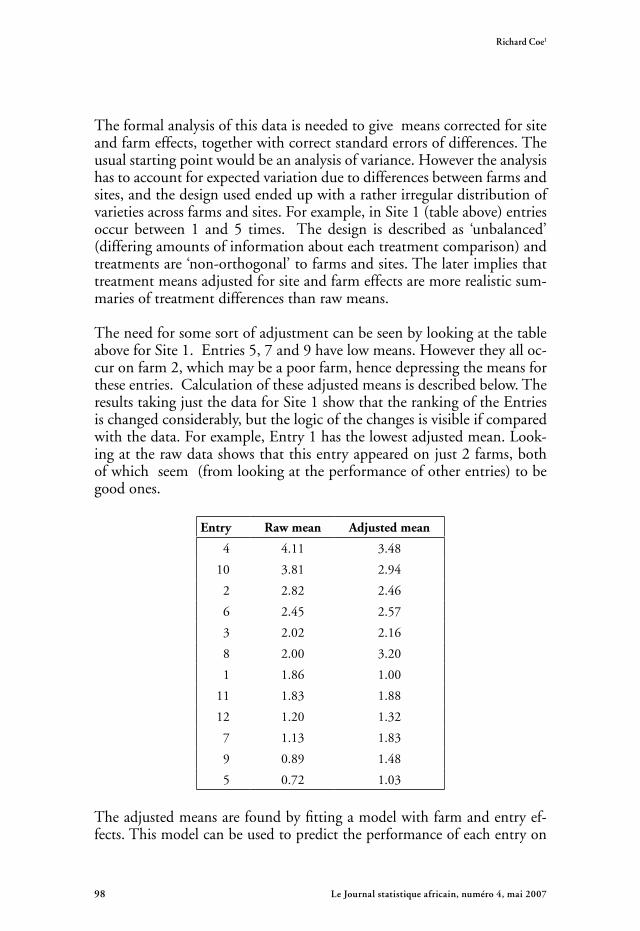
Le Journal statistique africain, numéro 4, mai 2007��
Richard Coe�
Theformalanalysisofthisdataisneededtogivemeanscorrectedforsiteandfarmeffects,togetherwithcorrectstandarderrorsofdifferences.Theusualstartingpointwouldbeananalysisofvariance.Howevertheanalysishastoaccountforexpectedvariationduetodifferencesbetweenfarmsandsites,andthedesignusedendedupwitharatherirregulardistributionofvarietiesacrossfarmsandsites.Forexample,inSite1(tableabove)entriesoccur between 1 and 5 times. The design is described as ‘unbalanced’(differingamountsofinformationabouteachtreatmentcomparison)andtreatmentsare‘non-orthogonal’tofarmsandsites.Thelaterimpliesthattreatmentmeansadjustedforsiteandfarmeffectsaremorerealisticsum-mariesoftreatmentdifferencesthanrawmeans.
TheneedforsomesortofadjustmentcanbeseenbylookingatthetableaboveforSite1.Entries5,7and9havelowmeans.Howevertheyalloc-curonfarm2,whichmaybeapoorfarm,hencedepressingthemeansfortheseentries.Calculationoftheseadjustedmeansisdescribedbelow.TheresultstakingjustthedataforSite1showthattherankingoftheEntriesischangedconsiderably,butthelogicofthechangesisvisibleifcomparedwiththedata.Forexample,Entry1hasthelowestadjustedmean.Look-ingattherawdatashowsthatthisentryappearedonjust2farms,bothofwhichseem(fromlookingattheperformanceofotherentries)tobegoodones.
Entry Raw mean Adjusted mean
4 4.11 3.48
10 3.81 2.94
2 2.82 2.46
6 2.45 2.57
3 2.02 2.16
8 2.00 3.20
1 1.86 1.00
11 1.83 1.88
12 1.20 1.32
7 1.13 1.83
9 0.89 1.48
5 0.72 1.03
Theadjustedmeansarefoundbyfittingamodelwithfarmandentryef-fects.Thismodelcanbeusedtopredicttheperformanceofeachentryon
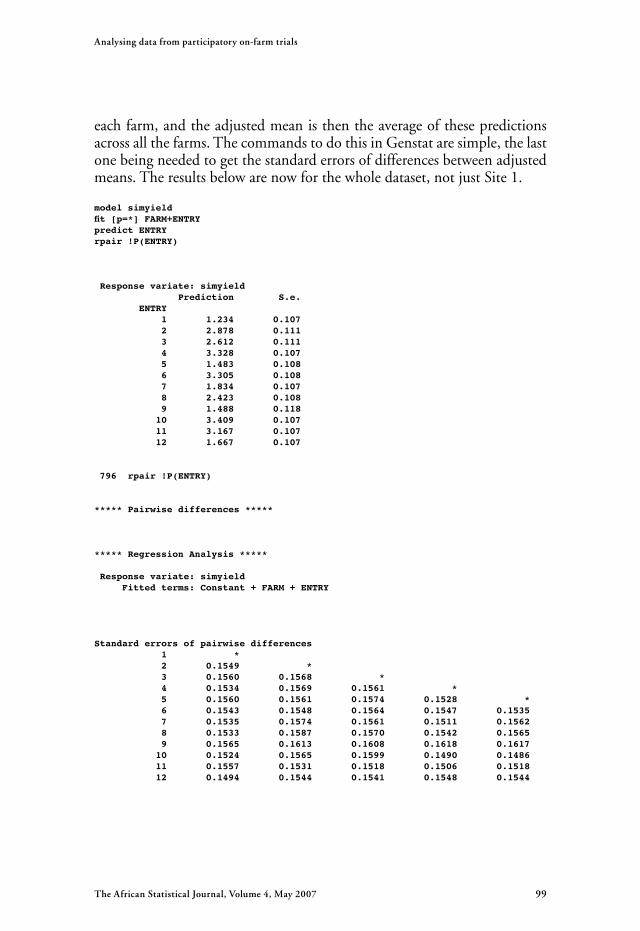
The African Statistical Journal, Volume 4, May 2007 ��
Analysing data from participatory on-farm trials
eachfarm,andtheadjustedmeanisthentheaverageofthesepredictionsacrossallthefarms.ThecommandstodothisinGenstataresimple,thelastonebeingneededtogetthestandarderrorsofdifferencesbetweenadjustedmeans.Theresultsbelowarenowforthewholedataset,notjustSite1.
model simyieldfit [p=*] FARM+ENTRYpredict ENTRYrpair !P(ENTRY)
Response variate: simyield Prediction S.e. ENTRY 1 1.234 0.107 2 2.878 0.111 3 2.612 0.111 4 3.328 0.107 5 1.483 0.108 6 3.305 0.108 7 1.834 0.107 8 2.423 0.108 9 1.488 0.118 10 3.409 0.107 11 3.167 0.107 12 1.667 0.107 796 rpair !P(ENTRY) ***** Pairwise differences ***** ***** Regression Analysis ***** Response variate: simyield Fitted terms: Constant + FARM + ENTRY
Standard errors of pairwise differences 1 * 2 0.1549 * 3 0.1560 0.1568 * 4 0.1534 0.1569 0.1561 * 5 0.1560 0.1561 0.1574 0.1528 * 6 0.1543 0.1548 0.1564 0.1547 0.1535 7 0.1535 0.1574 0.1561 0.1511 0.1562 8 0.1533 0.1587 0.1570 0.1542 0.1565 9 0.1565 0.1613 0.1608 0.1618 0.1617 10 0.1524 0.1565 0.1599 0.1490 0.1486 11 0.1557 0.1531 0.1518 0.1506 0.1518 12 0.1494 0.1544 0.1541 0.1548 0.1544

Le Journal statistique africain, numéro 4, mai 2007�00
Richard Coe�
1 2 3 4 5 6 * 7 0.1538 * 8 0.1550 0.1512 * 9 0.1621 0.1600 0.1612 * 10 0.1536 0.1500 0.1494 0.1639 * 11 0.1516 0.1531 0.1550 0.1643 0.1549 12 0.1524 0.1523 0.1525 0.1605 0.1543 6 7 8 9 10 11 * 12 0.1562 * 11 12
Notethatthesedsarenotallthesame,duetotheirregularityinthedesign.Howevertheyarecloseenoughthatitwouldbesensetoquoteasinglesedof0.16.
Iftheseadjustedmeansarecomparedwiththerawmeansthedifferencesarenotasgreataswhenweanalysedjustonesite.Themeansareaveragesovermore farms, so the effects of ‘good’ and ‘bad’ farmson individualmeanstendtocancelout.
Entry Raw mean Adjusted mean
10 3.45 3.41
6 3.37 3.31
4 3.30 3.33
11 3.10 3.17
2 3.08 2.88
3 2.71 2.61
8 2.43 2.42
7 1.76 1.83
12 1.60 1.67
9 1.44 1.49
5 1.32 1.48
1 1.28 1.23
Inthiscasethemodelcouldalsohavebeenfittedas
model simyieldfit [p=a] SITE/FARM+ENTRY

The African Statistical Journal, Volume 4, May 2007 �0�
Analysing data from participatory on-farm trials
***** Regression Analysis ***** *** Accumulated analysis of variance *** Change d.f. s.s. m.s. v.r.+ SITE 24 189.0435 7.8768 16.57+ SITE.FARM 121 327.6509 2.7079 5.70+ ENTRY 11 289.1360 26.2851 55.28Residual 427 203.0184 0.4755 Total 583 1008.8488 1.7304
Thisanalysisofvariancecanbeinterpretedintheusualway,andshowsthat some of the between farm variation actually occurs between sites.Thatis,farmswithinasitetendtobemoresimilarthanfarmsindifferentsites,asexpected.
Theanalysispresentedaboveisvalid.Howeveritdoesnotcapturealltheinformation in thedataandhides someof the structure.Analternativeapproachistotreatsitesandfarmswithinsitesasiftherewerearandomselectionfromthoseavailableanduseamodelthatdescribesthis.REMLprocedureshandletheseproblemsandareeasytouseinGenstat.
VCOMPONENTS [FIXED=ENTRY] RANDOM=SITE/FARMREML [PRINT=model,components,waldTests,means; PSE=differences] simyield
TheoptionFIXED=ENTRYspecifiesthatwewanttoestimateseparatemeansfor eachof the entries.Theparameter RANDOM=SITE/FARM tellsGenstat thattherearesiteswhichareexpectedtovaryandtherearefarmswithineachsitewhichalsovary.Genstatautomaticallyaddstheplotlevelorresidualvariance,butthiscouldbeputinexplicitlyifthedatasethadanotherfac-torlabelledPLOTbyspecifyingRANDOM=SITE/FARM/PLOT.Theoutputisshownbelow.
Notethatthetrialwasoriginallyplannedwitha‘replicate’beingasetofallthevarieties(spreadacross3farms)with3replicatespersite.Howeverduetolackofavailablelandandsomemistakesthisisnothowthedesignwasimplemented.‘Replicates’thereforedonotcorrespondtoanyphysi-calsourceofvariationintheexperimentsoitdoesnotmakemuchsensetoincludethemintheanalysis.Ontheotherhandbothsitesandfarmscorrespond tophysical layout factors that it is reasonable toexpectwillinfluenceresults,sothesemustbeallowedfor.
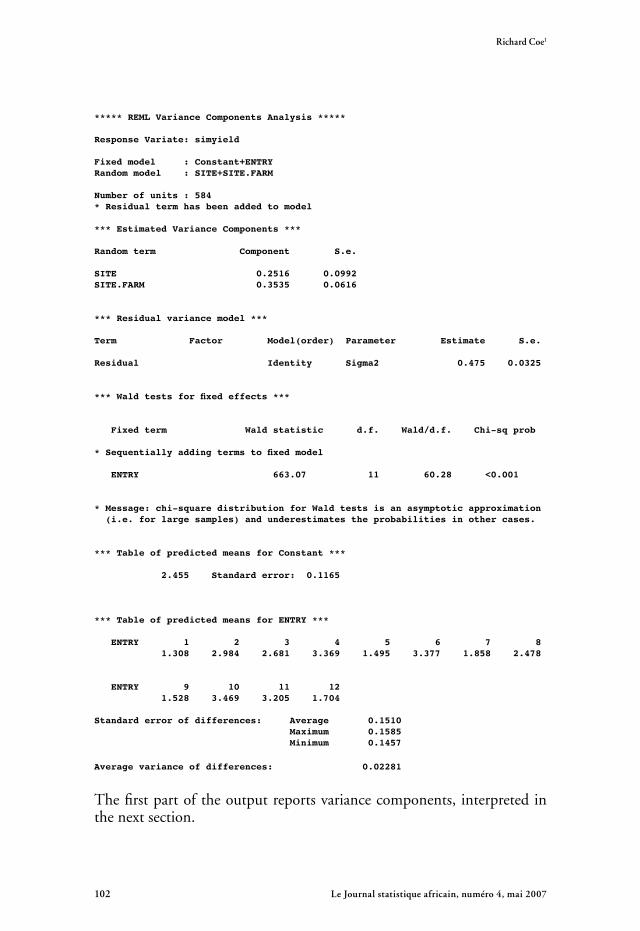
Le Journal statistique africain, numéro 4, mai 2007�02
Richard Coe�
***** REML Variance Components Analysis ***** Response Variate: simyield Fixed model : Constant+ENTRYRandom model : SITE+SITE.FARM Number of units : 584* Residual term has been added to model
*** Estimated Variance Components *** Random term Component S.e. SITE 0.2516 0.0992SITE.FARM 0.3535 0.0616 *** Residual variance model *** Term Factor Model(order) Parameter Estimate S.e. Residual Identity Sigma2 0.475 0.0325
*** Wald tests for fixed effects *** Fixed term Wald statistic d.f. Wald/d.f. Chi-sq prob * Sequentially adding terms to fixed model ENTRY 663.07 11 60.28 <0.001 * Message: chi-square distribution for Wald tests is an asymptotic approximation (i.e. for large samples) and underestimates the probabilities in other cases. *** Table of predicted means for Constant *** 2.455 Standard error: 0.1165 *** Table of predicted means for ENTRY *** ENTRY 1 2 3 4 5 6 7 8 1.308 2.984 2.681 3.369 1.495 3.377 1.858 2.478 ENTRY 9 10 11 12 1.528 3.469 3.205 1.704 Standard error of differences: Average 0.1510 Maximum 0.1585 Minimum 0.1457 Average variance of differences: 0.02281
Thefirstpartoftheoutputreportsvariancecomponents,interpretedinthenextsection.

The African Statistical Journal, Volume 4, May 2007 �0�
Analysing data from participatory on-farm trials
TheWaldtestisequivalenttotheF-testfortreatmenteffectintheusualanova.The ‘highly significant’ effect says that there are real differencessomewherebetweenthese12varietymeans.
Thetableofpredictedmeansgivesmeansforeachentryadjustedforfarmandsiteeffects.Inthiscasemostofthemeansareclosetotheunadjustedmeans.Thiswillnotalwaysbethecase.Theadjustmentsallowforthefactthatsomefarmsarebetter(givehigheraverageyields)thanothers.Entriesthataretestedon‘good’farmswillhavetheirmeansbiasedupwardscom-paredwithentriestestedon‘bad’farms.Inthisdesigneachentryistestedonabout50farms,sothe‘good’and‘bad’farmstendtocancelout.How-everiftherewerefewerfarmsthiswouldnotbethecase.Thesepredictedmeansaretheonesthatshouldbereportedandinterpreted,nottherawmeanspresentedearlier.
Thesedvaluesforcomparingpredictedmeansarenotallequal,soGen-statreportstheminimum,maximumandaverage.Theyarenotequalbe-causedifferentpairsofmeansarecomparedwithdifferentprecision.Forexample,countingshowsthatentries1and2occurtogetherinthesamefarm14times.Treatments9and10onlyoccurtogetheronthesamefarmonly5times.Wewouldthereforeexpectthesedforcomparing1and2tobelowerthanthatforcomparing9and10.Inthiscasetherangeinsedsisnotlarge,sowedonotgofarwrongiftheaverage(or,moreconservatively,themaximum)isused.
Theoutputdoesnotcontaininformationonwhichentriesaredifferentforwhichotherones,justthatoveralltherearesomevarietydifferences.Wehavenotputanyinformationaboutpossibledifferencesbetweenen-triesintotheanalysis,sotheonlypossibilitywouldbeananalysisbasedonignorance,forexampleonethatattachedletterstovarietiesdeemedtobe‘notsignificantlydifferent’fromeachother.Therearebothtechnicalandphilosophicalproblemswiththisapproachanditshouldbeavoided.
Suppose that the entries came from 3 groups, depending on pedigree,asfollows.
Group a b cEntry 1,5,7,9,12 4,10,11 2,3,6,8
ThenwecanlookfordifferencesbetweenandwithingroupsbyreplacingthefixedmodelbyFIXED=GROUP/ENTRY.

Le Journal statistique africain, numéro 4, mai 2007�04
Richard Coe�
*** Wald tests for fixed effects *** Fixed term Wald statistic d.f. Wald/d.f. Chi-sq prob * Sequentially adding terms to fixed model GROUP 602.80 2 301.40 <0.001 GROUP.ENTRY 60.27 9 6.70 <0.001
* Message: chi-square distribution for Wald tests is an asymptotic approximation (i.e. for large samples) and underestimates the probabilities in other cases. *** Table of effects for GROUP *** GROUP a b c 0.000 2.061 1.676 Standard error of differences: Average 0.1506 Maximum 0.1521 Minimum 0.1490
TheWaldtestsshowthereisconsiderablevariationbetweengroupsofen-tries, but still some remaining variation between entries within a group.ThetableofeffectsforGROUPsummarisesthedifferencebetweengroups–entriesinGroupbhavemeansyields2.06higherthanthoseinGroupa.
Comparing approaches InExample1webasedananalysisofthedifferencebetweenyieldsoftwotreatmentseitheronalinearmodeloronthesetofdifferencewithineachfarm.Thetwomethodsgavealmostidenticalresults.Whynotusethedif-ferencemethodintheExample2?Someofthereasonsare:1. Withthe3treatmentsofExample1thereare3pairsoftreatmentsthat
couldbeusedtoformdifferences.Hencewemightrepeattheanalysis3times.Theseanalysesarenotindependentbutthatdoesnotmatter.Howeverwiththe12treatmentsofExample2thereare12×11/2=66pairsthatwecouldchoosetomakedifferences.Analysisofallthesewouldnotonlybetedious,itwouldinvolvealotofrepetitionofthesameinformation(thereareonly11dfin12treatments).Butwhichsubsetofpairsshouldbechosen?
2. Thesetoftreatmentsofanyfarmissmall–only4outof12.Thus,forexample, treatment 1 occurs on 50 farms and treatment 2 on 47, yettheyoccurtogetherononly14.SoifweworkwiththeEntry1-Entry2 difference we would use data from just 14 farms. However there ismuchmoreinformationaboutthetwotreatments.Thisisreflectedinthe

The African Statistical Journal, Volume 4, May 2007 �0�
Analysing data from participatory on-farm trials
differingsedsfromthetwoapproaches.Modellinggaveansedof0.155forEntry1–Entry2andthedifferencemethodgives0.180.Thismayseemasmallchangebutisequivalenttoa42%increaseintrialsize.
3. Otherlimitationsofthedifferencemethodswillbedescribedlater.
Thedifferencebetweentheanalysisthattakesfarmsandsitesas‘fixed’andtheREMLanalysisthattakesthemasrandomliesinwhatitisreasonableto assume about farmand sitedifferences. If they aredifferent,butwecanmakenorealisticassumptionsabout thenatureof thosedifferencesthentheyshouldbetakenas‘fixed’.Thismeanseachsiteorfarmhasitsowncharacteristicmean,unconnectedwithanyother,andthesehavetobeestimated.Theinformationontreatmentdifferencesthencomesfromdifferenceswithineachfarm.Howeverifsitesorfarmscanbethoughtofasarandomsamplefromthesetofpossiblesitesorfarms,andhaveeffectswhichroughlyfollowanormaldistribution,thenweestimatethevarianceofthatnormaldistribution.Thischangestheestimatesofthetreatmentseffects as between-farm and between-site information is recovered.Thesourceofthisinformationcanbeunderstoodasfollows.Ifallfarmsthathadtreatment1hadahighmean,andallthosethathadtreatment2hadalowmean,itisevidencethattreatment1isbetterthantreatment2.Iffarmsreallyarearandomsamplethentreatment1isunlikelytoenduponallthebestfarmsbychance.Hencethereissomeinformationfromthefarmeffectstoaddtoourevidencefortreatment1havingahighermeanthantreatment2.TheREMLmethodcombinesthisinformationwiththewithin-farminformation.Theestimatesoftreatmenteffects,andsedval-uesarethereforemodifiedcomparedwiththeearlierfixedeffectanalysis.Iftheassumptionsoftherandomsiteandfarmeffectsarerealisticthenthisanalysiswillalwaysbemoreefficient.
5. Understanding variation and GxE interaction
Example 2The analysis above has produced estimates of variance componentsasfollows:
component estimate standard errorSITE 0.2516 0.0992FARM 0.3535 0.0616PLOTorresidual 0.4750 0.0325
Whatdothesetellyou?

Le Journal statistique africain, numéro 4, mai 2007�0�
Richard Coe�
Themodelusedtoanalysethedata,asspecifiedintheVCOMPONENTScommand,isyield=mean+siteeffect+farmeffect+varietyeffect+residualTheresidualisthusthedeviationofanindividualplotyieldfromtheaver-ageforthatsite,farmandvariety.Itisalltheunexplainedvariationfromplottoplot,duetolocalenvironmentaleffects(soil,pests),management,measurementerrorandsoon.Thevarianceof0.475says thestandarddeviationofthisplottoplotvariationis√0.475=0.698.Ifthedatahaveroughlyanormaldistributionthenmostobservationsliewithin2stand-arddeviationsofthemean.Thustheplottoplotvariationrepresentsvari-ationofabout±1.4aboutthemeanforafarmgrowingauniformvariety.Thisisatypicallevelofvariationinsuchtrials.
Thefarmvariancecansimilarlybe interpreted. It showshowmuchtheaverageyieldforaverylargenumberofplotsvariesbetweenfarmswithinthesamesite.
Explaining variation – interaction and risk
Example 1InSection4weanalysedExample1bytakingthe31differencesinyieldforg-candlookingattheirmeanandvariation.HereIwanttotakethisanalysisfurther.
Themeandifferenceof1.01tha-1isofcourseofinterestinsomeanalysesandthisisthequantitymostoftenreported,togetherwithaproudstate-mentthatitis‘significantly’greaterthanzero.Howeverforanindividualfarmeritisuninteresting.Afarmer’sdecisiononwhethertousegratherthancwilldependonmanythings,buttheyieldcomponentofthedeci-sionwillbebasedontheyieldincreasetheymightachieveon their farm.Intheabsenceofanyotherinformationthemeanisthebestguessforwhatthismightbe,butthereisofcoursealotofvariationaroundthismean.Thisvariationisanindicationofthelevelofriskofadecisionbasedonthemean.Inthefigurebelowtheriskofobtainingayieldincreaselessthananyspecifiedamountisplotted.Thereisroughlya10%changethata farmerwillachieve loweryieldwithgthancand55%chanceofandincreaselessthan1tha-1.However20%offarmersachieveanincreaseofmorethan2tha-1.Asimplemodelforthevariationisobtainedbyassum-inganormaldistribution,alsoshownonthegraph.Itisnotaparticularlygoodfitbutstillhassomevalue,explainedlater.Notethatifthereweremanymorethan31farmersinthestudywewouldexpectabetter(moreprecise)estimateofthemeandifferencebetweengandcbutwouldnot

The African Statistical Journal, Volume 4, May 2007 �07
Analysing data from participatory on-farm trials
expectareductioninthevariationinthisdifferenceacrossfarms.Morefarmswouldgiveabetterestimateofthechanceofgettinglessyieldwithgthanc,butitwouldstillbearound10%.Knowingwhatdistinguishesa+2tonnefarmerfroma+0tonnefarmeris important,both for the farmer’sdecisionmakingandtheresearcher’sunderstanding.
0
0.2
0.4
0.6
0.8
1
-1 0 1 2 3
g-c (tha-1)
pro
bab
ility
data
model
Anapproachtotheproblemshouldbeclear.Wehaveasetof31differ-encesandwanttoknowwhatdeterminesthem.Hypothesesofpossiblecausesmay come from farmers or researchers.Thehypotheses are thentestedbycollectingsuitabledataandstatisticalanalysis.Supposethattheslopeoftheplotandcecofthesoilarehypothesisedcausesofthevariationinthiscasesowecanexploreevidenceforthatinthedata.Slopeisinthiscaseacategoricalvariable.Aboxplotmaybeuseful–itshowslittleevi-denceofaconsistentdifferenceinthesizeofg-cfordifferentslopecatego-ries.Likewisewecoulduseascatterplotofg-cagainstcec.Thisdoesnotshow a clear relationship but does show some ‘outlying’ points whichcouldbefollowedup.Thefarminthetoprightofthescatter,forexample,used fertilizer, suggesting further ideas for investigation.

Le Journal statistique africain, numéro 4, mai 2007�0�
Richard Coe�
slo
pe
0000
2000
-0.5 0 0.5 1 1.5 2 2.5
g - c
1000
NotethatwhatwearedoinghereisidentifyingGxEinteraction.TheGsarejustthe3treatmentsandtheEsarecharacterisedbyslopeandcec.
A formal statistical analysis would now use usual regression modellingapproachestoquantifyanyeffects.Ify
ijistheyieldonfarmiundertreat-
mentjthenthedifferencesbeinganalysedare
di=y
ig–y
icwithvarianceσ
d2.Thisisthevariationreflectedinthegraph
aboveandinthesimple‘risk‘model.
Aregressionmodeltolookattheeffectofafarmlevelcovariatexwouldthenbe:
di=c+b
gcx
i+e
i
Herebgc is the regressioneffectwhenconsidering theg-cdifferenceande
i
theresidual.Thevarianceoftheresidualisσr2.Thismeasuresthestillunex-
plainedvariationind,ortheriskstillremainingwithknowledgeofthecov-ariate.Again,ifanormaldistributionmodelisacceptablethentheparametersoftheregressionmodel,withσ
r2,allowpredictionsoftheriskofchangesin
yieldinswitchingfromctogconditionalonthevalueofthecovariate.
Theusualanalysisofvariancemodel for thisdata,with treatmentsandfarmsinthedesign,wouldbe:
yij=c+f
i+t
j+e
ijwiththevarianceoftheseresidualsσ2.Thentheg-c
differencesare
di=t
g–t
c+e
ig–e
ic

The African Statistical Journal, Volume 4, May 2007 �0�
Analysing data from participatory on-farm trials
Theconnectionbetweenthe‘analysisofvariance’approachandtheanaly-sis of plotwise differences then becomes clear.The variance of the dif-ferencesσ
d2=2σ2.Theeffectof thecovariatecouldbe included in the
analysisofvariancemodelas
yij=c+f
i+t
j+b
jx
i+e
ij
Thetermbjx
idescribeshowthetreatmenteffectismodifiedonfarmsof
differenttype(iewithdifferentvaluesofthecovariatex).Itisthusatreat-mentbyfarminteraction,andisoftenthebasisofthemostusefulresultsfromanonfarmtrial.Withinformationonsuchinteractionswecanrefinepredictionsandrecommendationsandreducetheriskassociatedwithde-cisionsbasedonthedata.Thecovariatesusefulforthismaybesocialvari-ables(gender,householdsizeetc),biophysicalvariables(soiltype,slopeetc)ormanagementvariables(weeding,plantingtimeetc).
Acommonmisunderstandinginexperimentaldesignisthatfarmxtreat-ment interactioncannotbedetected ifonlya single replicate isplacedoneachfarm.Thetypesoffarmxtreatmentinteractionthatareimpor-tantarethosethatarestructuredinsomewaytoshowconsistentpatternsacrossfarms.Thesecanbeexplainedandpredictedintermsofexplanatoryvariables,andcanbeestimatedfromdesignswithnomorethan1replicateperfarm,asshownhere.Thisdoesnotmeandesignisunimportant.Ifisknownwhichcovariateswillbeofinterestbeforethetrialstartsthenmoreeffectivedesignscanbeused.
Theanalysisaboveidentifiesanddescribeswhathasalwaysbeenknownbybreeders asGxE (genotypex environment) interaction.Theclassical ap-proachtothishasbeena‘complete’trialineachofanumberoflocations,theselocationsrepresentingdifferentenvironments.Onceavarietyxloca-tioninteractionisdetectedanattemptismadetofindwhichaspectsoftheenvironmental variation is responsible for the interaction.The approachusedhereallowsGxEinteractiontobedetectedanddescribedwhenonlyasubsetofthegenotypesaretestedinalargenumberoflocations,eachinanunreplicatedtrial.Itdoesrequirethatthelocationsbecharacterisedbymeasurementofappropriatecovariates.Onereasonfordoingparticipatorybreedingtrials is thatcriticalGxE interaction isdue tovaryingsocialoreconomicenvironment.Forexample,itisoftenhypothesizedthatmenandwomenwillfavourdifferentvarieties,orfarmersassessmentofgenotypeswilldependonlevelofmarketintegration.Thesetypesofinteractioncanbedetectedanddescribedaslongasthedesigncoverssufficientvariationandsuitableindicatorsofthesocialoreconomicvariablesarerecorded.
Le Journal statistique africain, numéro 4, mai 2007��0
Richard Coe�
6. Summary
Thekeypointsfromthispaperare:• Analysisofdatafromparticipatorytrialscanandshoulduseacombination
ofexploratory/descriptivemethodsandformalstatisticalmodelling.• Theanalysismaybecomplicatedbytheirregularlayoutoftheexperiment
andmultiplelayersofvariationintroducedbythehierarchicaldesign.• Approachingtheanalysisbycalculationoftreatmentcontrastsoneach
farmcan simplifymanycomplexproblemsand lead tonew insightsintothedata.Howeveritcanbeinefficientortoorepetitiveiftherearemanytreatments.
• Approachingtheanalysisbyfittingregressionmodelsortheirequivalentwithmultipleerrortermsallowsmanydesignstobeanalysedwithinacommonframework.Howevertheanalysiscanbeopaqueandestimatesnon-intuitive.
• Thetwoapproachescanoftenbemadetobeequivalent• The most useful analysis is often one that concentrates on finding
explanationforvariationintreatmenteffectsacrossfarms.• Variation(atanylevelinthedesign)canbeinterpretedasrisk,notjust
asunexplainednoise.
7. Note on software
Sincetheoriginalversionofthispaperwaspublished5yearsagotherehavebeenimportantchangesinstatisticalsoftwaresuitableforthistypeofanalysis.
Genstat, usedhere to illustratemethods, has beenupdated to the9thEdition.Thebasiccommandsneededtodotheanalysesillustratedhavenotchanged.Allareavailabletousersthroughsimplemenusanddialogueboxes.Somedetailshavechanged.Forexample,thePREDICTcommandwill now give standard errors of differences of predicted means. Moreimportantly,VSNi, thecompanythatproducesGenstat,havemadetheDiscoveryEdition available free to researchers and educators in thede-velopingworld.Detailsareavailablefromhttp://www.vsn-intl.com/prod-ucts/discovery/orhttp://www.worldagroforestrycentre.org/rmg/GDE/in-dex.html.
AsecondsourceofhighqualitystatisticalsoftwarefreetoallisR.Devel-opmentofthisopensourcesoftwarehasbeenbyaconsortiumwithmanycontributors. Details are available and the software can be downloadedfromhttp://cran.r-project.org/

The African Statistical Journal, Volume 4, May 2007 ���
Analysing data from participatory on-farm trials
ItcantakenewusersawhiletolearnthebasicsofR,buttheeffortisrepaidbygivingaccesstoaverywiderangeofstatisticaltools,oftenincludingtheverylatestdevelopmentsinstatisticsmethods.Asastarter,thefollowingcommandswillgivetheanalysesofExample2fromthispaper.
#Read the data, in this case from the clipboard after copying in Excelbaby<-read.table(“clipboard”, header=TRUE, na.strings=”*”)attach(baby)
#Change SITE, FARM and ENTRY to factors as this is not the defaultFARM<-as.factor(FARM.)ENTRY<-as.factor(ENTRY.)SITE<-as.factor(SITE.)
#Fit the fixed effect model and look at resultsfixedmodel<-lm(simyield~FARM+ENTRY)summary(fixedmodel)anova(fixedmodel)
#Calculate and plot the adjusted ENTRY meanslibrary(effects)ENTRY.means<-effect(“ENTRY”, fixedmodel)plot(ENTRY.means)
#Fit the random effects modellibrary(lme4)randommodel<-lmer(simyield~ENTRY-1+(1|SITE)+(1|SITE:FARM)) summary(randommodel)
AcknowledgmentsThispaperwasoriginallypublishedasCoeR(2002)Analyzingdatafromparticipatoryon-farmtrails.18-34inBellonM.R.andJ.Reeves(eds).Quantitativeanalysisofdatafromparticipatorymethodsinplantbreed-ing.Mexico,DF:CIMMYT.WethankCIMMYTforpermissiontore-publishinthisjournal.
Le Journal statistique africain, numéro 4, mai 2007��2
Richard Coe�
8. References
CoeR(2007)Analysingrankingandratingdatafromparticipatoryon-farmtrials.(Thisvolume)
CoeRandFranzelS.(2000)Keepingresearchinparticipatoryresearch.Paper presented at Third International PRGA Conference, Nairobi,6-11November.
CoeR,SternRandAllenE(2001)Analysisofdata fromexperiments.Trainingmaterials.SSC/ICRAF,250pp.
Genstat (2000) Genstat for Windows (5th Edition). Oxford: VSNInternational.
Hildebrand PE and Russell JT (1998). Adaptability analysis.IowaStateU.P.
KemptonRAandFoxPN (1997). Statisticalmethods forplant varietyevaluation.London;ChapmanandHall.
The African Statistical Journal, Volume 4, May 2007 ���
SummaryOne of the effective advocacy mechanisms used in Africa to raise awareness of the importance of statistics in the development process of countries is the cele-bration of the African Statistics Day (ASD). Celebrated every year on the 18th of November, this event was initiated by one of the former subsidiary bodies of the United Nations Economic Commission for Africa (ECA), the Joint Afri-can Conference of Planners, Statisticians, and Demographers. Although it has been celebrated since the nineties, this event has benefited from the renewed interest in the up scaling of statistical capacity building activities on the conti-nent. A survey conducted by the African Centre for Statistics (ACS) of the ECA shows that countries intensively use the material prepared by the ECA for the celebrations of the ASD. They also use the proposed theme with the exception of a few countries that used alternative themes and materials tailored to fit national agendas and circumstances. The majority of countries do involve sta-keholders from the entire National Statistical Systems (NSS) in the celebrations including high-level officials such as vice presidents and ministers. The media are also invited in order to convey the message to the general public. Finally, countries seize the opportunity offered by the ASD to launch forthcoming sta-tistical activities or products namely surveys, censuses, and publications.
Keywords: Advocacy, National Strategies for the Development of Statistics, African Statistics Day,
Résumé L’un des outils de plaidoyer utilisés par la communauté statistique africaine pour sensibiliser les parties prenantes sur l’importance de la statistique dans le processus de développement est la célébration de la journée africaine de la statistique (JAS). Célébrée annuellement le 18 novembre, cet outil de plaidoyer a été initié par l’un des organes subsidiaires de la Commission économique des Nations Unies pour
Invigorating the Celebrations of the African Statistics Day: Lessons Learned from the 2006 Edition
By Miekael Menberu� and Dimitri Sanga2
1Intern,AfricanCentreforStatistics,UnitedNationsEconomicCommissionforAfrica.2ActingDirector,AfricanCentreforStatistics,UnitedNationsEconomicCommissionforAfrica.
Theopinionsexpressedinthispaperareours.TheydonotrepresentthoseoftheUnitedNationsEconomicCommission
Le Journal statistique africain, numéro 4, mai 2007��4
By Dimitri Sanga and Miekael Menberu
l’Afrique (CEA), la conférence conjointe des planificateurs, statisticiens et démo-graphes. Bien que cette journée soit célébrée depuis les années 90, celle-ci a pris de plus en plus d’ampleur avec le temps et notamment lors de la dernière édition suite à une attention plus particulière accordée au renforcement des activités sta-tistiques à l’échelle du continent. En effet, une enquête conduite auprès des pays africains par le Centre Africain pour la Statistique (CAS) de la CEA montre que les pays ont abondamment utilisé le matériel qui leur a été envoyé par ce dernier. Le thème proposé par la CEA a aussi été retenu par la majorité des pays à quelques exceptions près. Certains pays ont, en plus du matériel et du thème proposé, choisi des thèmes et matériels plus adaptés à leurs agendas respectifs et situations particu-lières. La majorité des pays a aussi impliqué les intervenants et parties prenantes de l’ensemble du système statistique national incluant des hauts dignitaires tels que les vice-présidents et les ministres dans les célébrations. De plus, les media ont participé à la plupart des activités. Finalement, plusieurs pays ont profité de l’occa-sion pour lancer ou annoncer quelques évènements statistiques d’envergure comme le lancement des enquêtes et recensements ainsi que d’autres produits statistiques comme les publications.
Mots clés : Plaidoyer, stratégies nationales de développement de la statistique, journée africaine de la statistique
1. Introduction
Itiswidelyrecognizedthatqualitystatisticsare,amongotherthings,need-ed for evidence-basedpolicymaking, planning, and for the trackingofprogresstowardsnationallyandinternationallyagreedupondevelopmentagendas.Africancountrieshavewitnessedanincreaseinthedemandforqualitystatisticsduringthe lastdecadesbecauseof, inter alia, initiativessuch as the Millennium Development Goals (MDGs), poverty reduc-tionstrategies(PRSs),andtheNewPartnershipforAfrica’sDevelopment(NEPAD).Accordingly,African countries are expected todevelop theirstatisticalcapabilitiesinordertosupporttheireconomic,politicalandso-cialdevelopmenteffortsinasustainablemannerandtoensuretheproduc-tionofgoodstatistics forplanning,monitoringprogressandevaluatingtheoutcomesandimpactsofdevelopmentinitiatives.
Despitethewiderecognitionoftheimportanceofstatisticsinaccompa-nyingthedevelopmentagenda,itislikelythatmoreneedstobedonetoadvocateinfavourofelevatingstatisticstothetopoftheinternationalde-velopmentagendaaswellastopromotestatisticalliteracyinAfrica.Advo-catingforstatisticsincludesraisingawarenessoftheirimportanceamongstatisticalproducers,users,andotherstakeholders.Thiscanbeachievedby

The African Statistical Journal, Volume 4, May 2007 ���
Invigorating the Celebrations of the African Statistics Day: Lessons Learned from the 200� Edition
puttingstatisticsfirmlyontonationalagendas,demonstratingtogovern-ment planners, policy makers, managers, administrators, legislators andotherusersthepowerofstatistics,promotingacultureofmakingpolicyanddecisionsbasedonrealevidence,andmobilizingnationalandinterna-tionalresourcesfordevelopingstrongNationalStatisticalSystems(NSS).
TheAfricanStatisticsDay(ASD)hasbeenestablishedasanadvocacytoolaimed at raising awareness of the importance of Statistics in economicand social development in Africa. Celebrated every year on the 18th ofNovember,thiseventwasinitiatedbyoneoftheformersubsidiarybodiesoftheUnitedNationsEconomicCommissionforAfrica(ECA),theJointAfricanConferenceofPlanners,Statisticians,andDemographers.
AlthoughtheASDhasbeencelebratedsincethenineties,the2006editionwitnessedtremendousparticipationofcountriesandstakeholdersacrossthecontinentasaresultofageneralmomentuminthescalingupofsta-tisticalactivitiesintheregion.Severalfactsconfirmthismomentum.ItisworthmentioningthatAfricanMinistersofFinance,PlanningandEcono-micDevelopmenthaverenewedtheirsupportforstatisticaldevelopmentonthecontinentduringtheirlastconferenceheldinOuagadougouinMay2006,andkeyregionalplayershavestronglyresolvedtoputstatisticsattheforefrontoftheirrespectiveagendas.ThecontinenthasalsowitnessedthecreationoftheAfricanCentreforStatistics(ACS)attheECA,anupgradeof the statistical function at the African Development Bank (AfDB) tothelevelofadepartment,andtherenewedinterestoftheAfricanUnionCommission(AUC)inadvocatingforstatisticsatthehighestlevel.
Moreover, the lastmeetingof theForumonAfricanStatisticalDevelo-pment (FASDEV)held inAddisAbaba inFebruary2006endorsed theReferenceRegionalStrategicFrameworkforStatisticalCapacityBuildinginAfrica(RRSF)asaguideforstatisticaldevelopmentontheContinent.OneoftherecommendationsoftheRRSF3istoinvigoratethecelebrationoftheASDandtoconsideritasanimportanteventinthenationaldeve-lopmentagenda.
ThispaperpresentstheresultsofasurveyconductedbytheACStogatherinformationonthecelebrationsofthe2006editionoftheASDbyAfri-
3AfDB,ECA,PARIS21,andTheWorldBank,“TheReferenceRegionalStrategicFrameworkforStatisticalCapacityBuildinginAfrica:BetterStatisticsforImprovedDevelopmentOutcomes,”ECADocumentsPublishingandDistributionUnit(DPU),August2006(Recommendation8).

Le Journal statistique africain, numéro 4, mai 2007���
By Dimitri Sanga and Miekael Menberu
cancountries.ItismeanttoshareexperiencesbetweencountriesonthecelebrationsoftheASDandultimatelytoencouragethosecountriesthathavenotcelebratedtodosousingalreadyexistingmechanismsandtoolsasreportedonbyothercountries.
Thepaperisorganizedasfollows.Aftertheintroduction,thesecondsec-tionpresentstheprocessoftheselectionofthethemeaswellasthema-terialsforwardedtocountriesbytheECAforthecelebrationoftheASD.Thethirdpartgivesanoverviewofthesurveywhilethefourthdealswiththeimportanceofthe2006theme.Thefifthsectionpresentstheresultsofthesurvey.Finally,thelastsectionconcludesthepaper.
2. The Process
Since the inceptionof theASD, theECAhasbeenmandated toyearlyidentifyandproposeathemeforitscelebration.Followingtheselectionofthetheme,itissubmittedtotheAdvisoryBoardinStatisticsinAfrica(ABSA)forendorsement.TheECAthenpreparesaseriesofadvocacyto-ols that are forwarded to countries at least sixweeks before the18th ofNovember.Theseusuallyincludebutarenotlimitedtoanoteexplainingthe importanceof the theme,apressCommuniqué,andaposter tobedistributedforpromotionalpurposes.Althoughitisexpectedthatthece-lebrationsoftheASDbearoundtheproposedtheme,topicstobecoveredmaybespecifictotheagendaoftherespectivecountriesandthematerialtobeusedforadvocacypurposesmayvaryfromcountrytocountry.
Thethemeofthe2006editionoftheASDwas“NationalStrategiesfortheDevelopmentofStatistics:StrategicPlanningattheServiceofDynamicDevelopment.”Forthefirsttimesinceitsinception,thematerialforthecelebrationoftheASDwasavailableinArabicandPortugueseinadditiontoEnglishandFrenchlanguages.Moreover,theECAalsocoordinatedthepreparation of a DVD featuring the UN Under-Secretary General andExecutiveSecretaryoftheECA,Mr.AbdoulieJanneh,theChairmanoftheDevelopmentAssistanceCommitteeoftheOrganizationforEconomicCooperation and Development (DAC/OECD), Mr. Richard Manning,andtheSouthAfricanFinanceMinister,HonourableTrevorManuel,alladvocatingfortheNSDSs.
3. The Survey
TheACSoftheECAdesignedaquestionnaireandforwardedittothe53memberStates inorder tocollect the informationnecessary tocompile
The African Statistical Journal, Volume 4, May 2007 ��7
Invigorating the Celebrations of the African Statistics Day: Lessons Learned from the 200� Edition
Africancountries’experienceswiththecelebrationoftheASD.Theques-tionnairesweresentbyemailandcopiesofboththeFrenchandEnglishversionswerealsodistributedduringtheAfricaSymposiumonStatisticalDevelopmentheldinKigaliinJanuary2007.
Fromthe53memberStates,wereceived41filledquestionnaires,a77%responserate.Thefilledquestionnaireswerecheckedforconsistencyandformissingvaluesaccordingtostandardrules.
4. The 2006 Theme
ThechoiceofthethemeoftheASDissubjecttoalargeconsultationpro-cessinvolvingmajorstakeholdersinstatisticsinAfricaespeciallymemberStates.Thethemehastobeinlinewithmajorstatisticsanddevelopmentrelatedissuesofthecontinent.
The 2006 edition of the ASD was devoted to raising awareness of theimportanceofNSDSasanewbenchmark instatisticalplanningaimedatfacilitatingthedevelopmentofstatisticsinacoordinatedmannerusingmodernmanagementprinciples.
Thereisanimportantfacttoremember.In2004,theconferenceon“Ma-nagingforDevelopmentResults”heldinMarrakech,Morocco,gavebirthtotheMarrakechActionPlanforStatistics(MAPS),andAfricancountriescommittedthemselvestothe“resultsagenda”.The“resultsagenda”callsfor a focus on performance and the achievement of outputs, outcomesand impact. Itunderlines theneed tohaveclearandsystematicmeasu-rementandreportingontheachievementofoutputs,outcomes,andtheimpactofdevelopmentpoliciesandprogramsusingbetterstatistics.AkeyrecommendationoftheMAPSisthateachdevelopingcountrydesignsanNSDSbytheendof2006.Thisrecommendationwasre-emphasisedintheRRSF.
Before the recommendationsof theMAPS, several countries elaboratedplans with various names, including: National Statistical DevelopmentPlans, Statistical Strategic Plans, and Statistical Master Plans. However,themajorityofthepreviousplansfacedmanyconstraintsintheirimple-mentation,includinguncoordinateddonor-drivenprogrammesandpro-jects,whichdidnotoftenmatchcountries’priorities.Thesedistortionscontributedtothenon-sustainabilityoftheprogrammes,andtoasitua-tionwherethemanagementoftheNationalStatisticalOffices(NSOs)hasoftenhadtoworkonanad-hocbasiswithoutpredictableperspectives.

Le Journal statistique africain, numéro 4, mai 2007���
By Dimitri Sanga and Miekael Menberu
ClearlymuchworkstillneedstobedoneacrossthecontinentinordertomeetthegoalssetbytheMAPS.Insummary,byNovember2006onlythree(3)countrieshaveadoptedtheirNSDSandtwenty-eight(28)coun-triesweredesigningtheirNSDS;seventeen(17)countrieshadastatisticalmasterplan,andfive(5)hadnoplanatall4.
Giventhisgloomypicture,the2006ASD’sthemeaimedtoincreasead-vocacyonthisissueandtourgeallAfricancountriestomeetthecommit-mentofdesigningtheirNSDSbytheendof2007.5. Results of the Survey
ThesurveywassenttoallFifty-ThreeAfricancountriesandForty-One,77%,of thecountriesonthecontinent responded.BurkinaFaso,CapeVerde,Chad,Egypt,EquatorialGuinea,Guinea,Lesotho,Libya,Maurita-nia,Nigeria,SaoTomeandPrincipeandSierraLeoneallfailedtorespondtothesurvey.Amongthesurveyrespondents,Thirty-Fiveofthecountries,85%, reported celebrating the2006ASD, and six countries,Comoros,Eritrea,Liberia,Madagascar,TanzaniaandTunisiarespondedasnotha-vingparticipatedinthecelebration.
GiventheimportanceofathemeinorganizingandpublicizingtheASD,countrieswereaskediftheyusedthethemeproposedbytheECA,“Natio-nalStrategiesfortheDevelopmentofStatistics:StrategicPlanningattheServiceofDynamicDevelopment”intheirrespectivecelebrations.Thir-ty-Threecountries,94%ofcountriesthatreportedcelebratingtheASD,respondedthattheyusedtheproposedtheme,theonlyexception,SouthAfrica,reportedusinganalternativethemefortheDay.SouthAfricains-tead decided to use the theme “Promoting Statistical LiteracyThroughAccessibilityandOutreach.”Algeriadidnotrespondastowhetherornotitusedtheproposedthemeoranalternativeone.
WhenaskedwhetherornottheyusedthepromotionalmaterialspreparedbytheECA,suchaspostersandpresscommuniqués,Thirty-Twocountries,91%,answeredyes.Onecountry,Uganda,answerednoinsteadoptingtoprovidepresentationsindisseminationworkshopsinordertoraisepublicawarenessoftheupcomingASD.Twoofthe2006ASDparticipantsprovidednoresponse.Manycountriesalsousedothermeansforpromotingtheevent.Rwandahungbanners, andpublicized theeventon radioand television.Massmediawasutilized inSomalia aswell, in the formof radio and television.Sudan and
4PARIS21assessment.Formoredetails,seewww.paris21.org.

The African Statistical Journal, Volume 4, May 2007 ���
Invigorating the Celebrations of the African Statistics Day: Lessons Learned from the 200� Edition
Zambiaalsoreportedutilizingmedia,andKenyapreparedanewspaperpul-loutpublicizingtheircelebrationoftheASD.Othercountriesdistributedma-terialspublishedbytheirrespectiveNSO’spublicizingtheevent.GhanaheldaseriesoflecturesandGabondistributedT-ShirtsintheirpublicitycampaignasdidZambia.SouthAfricapreparedDVDsoncensuses,postersonstatisticalliteracyinitiativesanddesignedawebsitepromotingthe2006ASD.
Increasingstatisticalcapacitybuildingeffortsonthecontinentrequiresajointeffortbydifferentstakeholderswithincountriesandcannotonlybeanendeavourundertakenbycountries’respectiveNSOs.Inthisvein,weasked countries if other stakeholders, outside of their respective NSOs,wereinvolvedinthecelebrationofthe2006ASD.Thirtycountries,86%oftheASDparticipants,reportedthattherewerestakeholdersoutsideoftheNSOinvolvedinthecelebration,onlythreecountriesrespondedthatnootherstakeholderswereinvolvedandtwocountriesofferednoresponse.AmongthestakeholdersoutsideoftheNSO’sinvolvedinthecelebrationwereotherlineministriesandmembersofthecivilsociety.
Thirtycountries,86%,alsoreportedthatahighrankinggovernmentof-ficialwasinvitedtotheDay.Rwandanotedthattheministeroffinanceand economic planning was invited as well as all directors of planningfromeveryministry.ZimbabweandEthiopiareportedtheattendanceoftheirdeputyministersoffinance.Somaliainvitedmembersofthetran-sitionalfederalgovernment,andGhana’svicepresidentwasinvitedtoitscelebration.Angolainvitedthespeakerofparliamentandtheministerofplanning.Congoalsoinviteditsstateministerforplanning.Judgingbythevarioushighrankinggovernmentofficialsinvitedtotheevent,manyAfricancountriesplacedahighdegreeofimportanceonthecelebration.
Alongwiththevariousgovernmentofficialsinvited,manycountriesalsoreported that members of the press were invited to the events. In fact,Thirty-Twocountries,91%,invitedthepress.Onlyonecountryrespon-dedasnothavinginvitedmembersofthepress,andtwocountriesprovi-dednoresponsetothequestion.Thelargenumberofcountriesthatwel-comedmembersofthepresstothecelebrationisanencouragingsignasthepressplaysavitalroleinconveyingtothegeneralpublictheemphasisthatcountriesareplacingonstatisticalactivities.
Alongwithraisingawarenessofageneralneedfortheelevationofstatis-ticalactivitiesonthenationalagenda,theannualASDalsoservesasanopportunity for countries to announceupcoming surveys, censuses andotherstatisticalactivities.Whencountrieswereaskediftheyusedthecele-

Le Journal statistique africain, numéro 4, mai 2007�20
By Dimitri Sanga and Miekael Menberu
brationofthe2006ASDasanopportunitytoannouncethelaunchingofanupcomingstatisticalactivitylikeacensusorsurvey,twenty-eightcoun-tries,80%,respondedyes.Threecountriesfailedtousethedayassuchaplatform,andonecountrystatedthatnosuchactivitieswereplannedinthenearfuture.
SomeofthebestpracticesinthecelebrationsoftheASDareworthmen-tioning.Ugandadevotesanentireweektothecelebrationsbeyondthere-commendedoneday.In2005,manyAfricancountriesconvergedtoKam-palaforanentirestatisticsweekcelebrationthatincludedseveralstatisticaleventssuchasthemeetingoftheInternationalComparisonProgrammeforAfrica(ICP-Africa)whichcumulatedintheopeningoftheStatisticsHouse, thenewhome for theUgandaBureauofStatistics (UBOS). In2006,AngolaorganizedastatisticsweekduringthefirstweekofDecem-ber.SeveralAfricancountriesandstakeholdersconvergedtoLuandafora number of statistical events including ameeting onorganization andmanagement of NSOs for Southern Africa Development Community(SADC)countries.TheclimaxofthisweekwasthespecialAfricanstatis-ticsdayopenedbythespeakeroftheAngolaparliamentandchairedbytheministerofplanningon7December2007.ThiswasattendedbyhighrankingofficialsfromacrossthecontinentincludingtheUNUnder-Secre-taryGeneralandExecutiveSecretaryoftheECAandtheCommissionerforEconomicAffairsoftheAUC.
6. Conclusion
AlthoughtheASDhasbeencelebratedsincethenineties,the2006edi-tionhaswitnessedanincreasedparticipationofcountriesasaresultofarenewedinterestinstatisticalcapacitybuildingactivitiesonthecontinent.Accordingtothesurvey,countriesmadeextensiveuseofthematerialsandtoolssenttothembytheECAevenifsomeofthemdidn’tlimitthemsel-vestothesematerials.Theproposedthemewasalsousedbythemajorityofcountrieswhileothercountriesusedthemesinlinewiththeirnationalagenda,priorities,andcircumstances.Moreimportantly,thecelebrationswereattendedbystakeholdersfromtheentireNSSincludinghighrankingofficialssuchvice-presidents,ministers,deputyministersetc.denotingtheincreasedimportanceaccordedtostatisticalactivitiesinAfricancountries.MembersofthepresswerealsoinvitedinmostcountriesconveyingtheimportanceoftheDaytothegeneralpublic.Finally,mostoftheNSOsseizedtheopportunityofferedbytheASDtolaunchanumberofstatisti-calactivities(surveys/censuses)orannouncenewproducts.

The African Statistical Journal, Volume 4, May 2007 �2�
Invigorating the Celebrations of the African Statistics Day: Lessons Learned from the 200� Edition
References
AfDB,ECA,PARIS21,andTheWorldBank(2006).TheReferenceRe-gional Strategic Framework for Statistical Capacity Building in Africa:BetterStatisticsforImprovedDevelopmentOutcomes,ECADocumentsPublishingandDistributionUnit(DPU),AddisAbaba:ECA.
PARIS21 (2006). African Statistics Day 2006: Media Review, Paris:OECD.
PARIS21 (2004).Making theCase:NationalStrategy for theDevelop-mentofStatistics,Paris:OECD.
PARIS21(2005).TheRoleofStatisticsinEvidence-basedPolicy-making,Paris:OECD.
OECDetal(2004).ActionPlanonManagingforDevelopmentResults,SecondInternationalroundtable,Marrakech,Morocco.
ECA(2006).ConferenceofMinistersoffinanceandEconomicDevelop-ment:MinisterialStatement,Ouagadougou,BurkinaFaso.
ECA,www.uneca.org/statistics
PARIS21,www.paris21.org

Le Journal statistique africain, numéro 4, mai 2007�22
Lehana Thabane, Marroon Thabane and Charles Harry Goldsmith
Le Journal statistique africain, numéro 4, mai 2007�22
The African Statistical Journal, Volume 4, May 2007 �2�
SummaryStatistics plays a very important role in science and research. The future of statistics as a field depends heavily on the training and mentoring of young statisticians by mature, experienced statisticians. The purpose of this paper is to discuss the role of mentoring in the development of future statisticians. We describe the importance of mentoring young statisticians and strategies that young statisticians can use to select a mentor. Mentoring of young statisticians is a model that can facilitate knowledge transfer and experience sharing for the betterment of statistics and human development. We offer suggestions for ways in which the mentor can and help their mentee acquire important career skills including suggestions for other things that young statisticians can do on their own to enhance career development. We share our experiences on mentoring and offer suggestions that people can use in their mentoring relationships.
Keywords: Mentoring, mentur, mentee, protégé
RésuméLa statistique joue un rôle important en science et dans la recherche. L’avenir de la statistique en tant que discipline dépend en grande partie de la forma-tion de jeunes statisticiens et de leur mentorat par des statisticiens plus âgés et expérimentés. Le but de cet article est de discuter du rôle du mentorat dans le développement des futurs statisticiens. Nous présentons l’importance du mentorat des jeunes statisticiens et des stratégies qu’ils peuvent développer pour se choisir un mentor professionnel. Le mentorat de jeunes statisticiens est un modèle qui peut faciliter le transfert de connaissance et le partage d’expérience pour l’amélioration de la statistique et du développement humain. Nous pro-posons des voies par lesquelles le mentor professionnel peut aider son protégé à acquérir des compétences professionnelles, en suggérant notamment d’autres actions que les jeunes statisticiens peuvent entreprendre par eux-mêmes pour améliorer leur carrière. Nous partageons notre expérience de mentors et présen-tons des suggestions qui peuvent être utilisées par les mentors professionnels dans les conseils destinés à leurs protégés.
Mentoring Young Statisticians: Facilitating the Acquisition of Important Career Skills
Lehana Thabane1, Marroon Thabane2 and Charles Harry Goldsmith3
1AssistantProfessor,DepartmentofClinicalEpidemiology&Biostatistics,McMasterUniversityandCentreforEvaluationofMedicines,StJoseph’sHealthcare,Hamilton,[email protected]
2ResearchAssociate,DivisionofGastroenterology,DepartmentofMedicine,McMasterUniversity,Canada
3EmeritusProfessor,DepartmentofClinicalEpidemiology&Biostatistics,McMasterUniversityandCentreforEvaluationofMedicines,StJoseph’sHealthcare,Hamilton,Canada
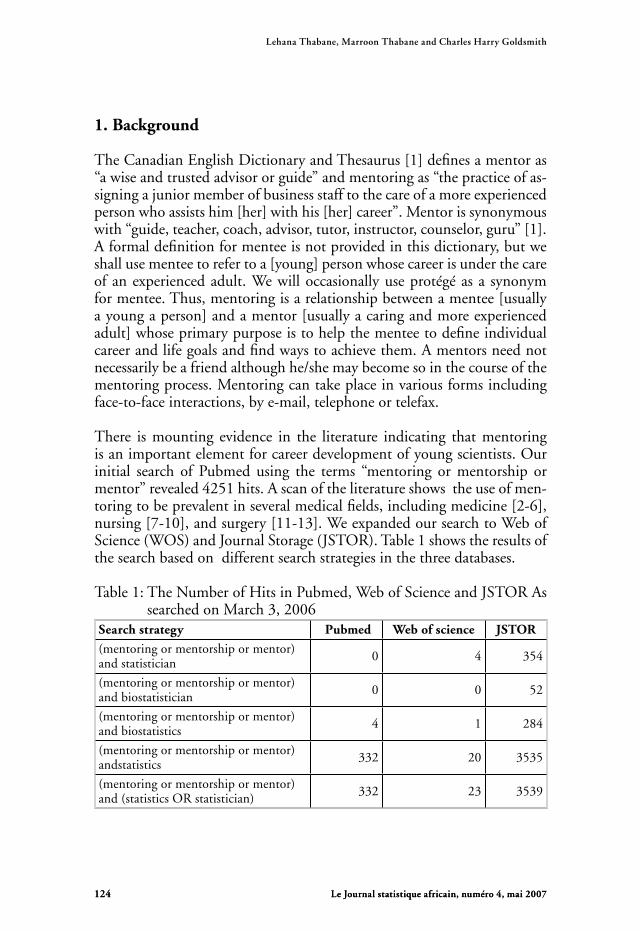
Le Journal statistique africain, numéro 4, mai 2007�24 Le Journal statistique africain, numéro 4, mai 2007�24
1. Background
TheCanadianEnglishDictionaryandThesaurus[1]definesamentoras“awiseandtrustedadvisororguide”andmentoringas“thepracticeofas-signingajuniormemberofbusinessstafftothecareofamoreexperiencedpersonwhoassistshim[her]withhis[her]career”.Mentorissynonymouswith“guide,teacher,coach,advisor,tutor,instructor,counselor,guru”[1].Aformaldefinitionformenteeisnotprovidedinthisdictionary,butweshallusementeetorefertoa[young]personwhosecareerisunderthecareofanexperiencedadult.Wewilloccasionallyuseprotégéasa synonymformentee.Thus,mentoringisarelationshipbetweenamentee[usuallyayoungaperson]andamentor[usuallyacaringandmoreexperiencedadult]whoseprimarypurposeistohelpthementeetodefineindividualcareerandlifegoalsandfindwaystoachievethem.Amentorsneednotnecessarilybeafriendalthoughhe/shemaybecomesointhecourseofthementoringprocess.Mentoringcantakeplaceinvariousformsincludingface-to-faceinteractions,bye-mail,telephoneortelefax.
There ismounting evidence in the literature indicating thatmentoringisanimportantelementforcareerdevelopmentofyoungscientists.Ourinitial search of Pubmed using the terms “mentoring or mentorship ormentor”revealed4251hits.Ascanoftheliteratureshowstheuseofmen-toringtobeprevalentinseveralmedicalfields,includingmedicine[2-6],nursing[7-10],andsurgery[11-13].WeexpandedoursearchtoWebofScience(WOS)andJournalStorage(JSTOR).Table1showstheresultsofthesearchbasedondifferentsearchstrategiesinthethreedatabases.
Table1:TheNumberofHitsinPubmed,WebofScienceandJSTORAssearchedonMarch3,2006
Search strategy Pubmed Web of science jSTOR
(mentoringormentorshipormentor)andstatistician 0 4 354
(mentoringormentorshipormentor)andbiostatistician 0 0 52
(mentoringormentorshipormentor)andbiostatistics 4 1 284
(mentoringormentorshipormentor)andstatistics 332 20 3535
(mentoringormentorshipormentor)and(statisticsORstatistician) 332 23 3539
Lehana Thabane, Marroon Thabane and Charles Harry Goldsmith
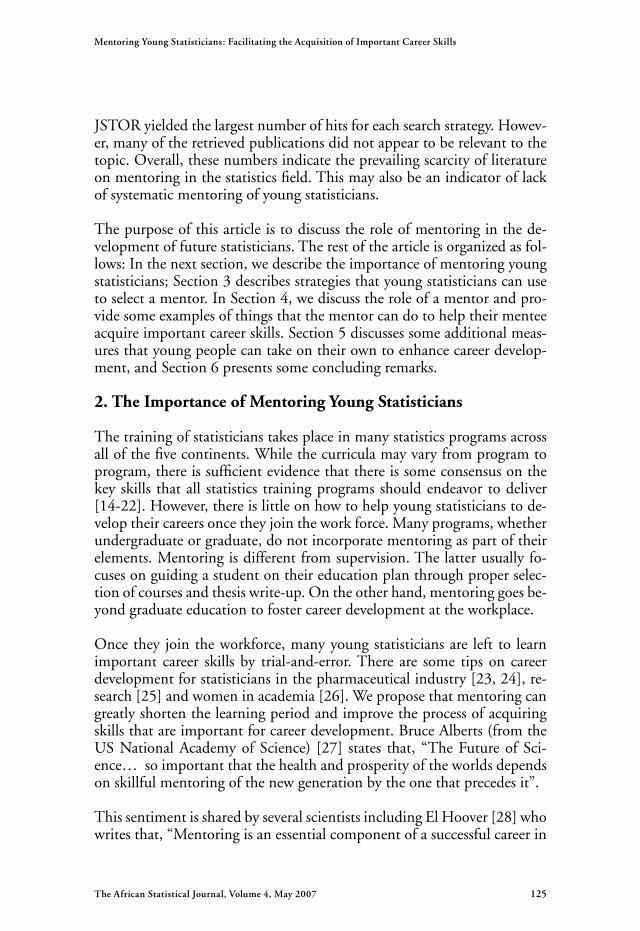
The African Statistical Journal, Volume 4, May 2007 �2�
Mentoring Young Statisticians: Facilitating the Acquisition of Important Career Skills
JSTORyieldedthelargestnumberofhitsforeachsearchstrategy.Howev-er,manyoftheretrievedpublicationsdidnotappeartoberelevanttothetopic.Overall,thesenumbersindicatetheprevailingscarcityofliteratureonmentoringinthestatisticsfield.Thismayalsobeanindicatoroflackofsystematicmentoringofyoungstatisticians.
Thepurposeofthisarticleistodiscusstheroleofmentoringinthede-velopmentoffuturestatisticians.Therestofthearticleisorganizedasfol-lows:Inthenextsection,wedescribetheimportanceofmentoringyoungstatisticians;Section3describesstrategiesthatyoungstatisticianscanusetoselectamentor.InSection4,wediscusstheroleofamentorandpro-videsomeexamplesofthingsthatthementorcandotohelptheirmenteeacquireimportantcareerskills.Section5discussessomeadditionalmeas-uresthatyoungpeoplecantakeontheirowntoenhancecareerdevelop-ment,andSection6presentssomeconcludingremarks.
2. The Importance of Mentoring Young Statisticians
Thetrainingofstatisticianstakesplaceinmanystatisticsprogramsacrossallofthefivecontinents.Whilethecurriculamayvaryfromprogramtoprogram,thereissufficientevidencethatthereissomeconsensusonthekeyskills thatall statistics trainingprogramsshouldendeavortodeliver[14-22].However,thereislittleonhowtohelpyoungstatisticianstode-veloptheircareersoncetheyjointheworkforce.Manyprograms,whetherundergraduateorgraduate,donotincorporatementoringaspartoftheirelements.Mentoringisdifferentfromsupervision.Thelatterusuallyfo-cusesonguidingastudentontheireducationplanthroughproperselec-tionofcoursesandthesiswrite-up.Ontheotherhand,mentoringgoesbe-yondgraduateeducationtofostercareerdevelopmentattheworkplace.Oncethey jointheworkforce,manyyoungstatisticiansare left to learnimportant career skills by trial-and-error.There are some tipson careerdevelopmentforstatisticiansinthepharmaceuticalindustry[23,24],re-search[25]andwomeninacademia[26].Weproposethatmentoringcangreatlyshortenthelearningperiodandimprovetheprocessofacquiringskillsthatareimportantforcareerdevelopment.BruceAlberts(fromtheUSNationalAcademyofScience) [27] states that, “TheFutureofSci-ence…soimportantthatthehealthandprosperityoftheworldsdependsonskillfulmentoringofthenewgenerationbytheonethatprecedesit”.
ThissentimentissharedbyseveralscientistsincludingElHoover[28]whowritesthat,“Mentoringisanessentialcomponentofasuccessfulcareerin

Le Journal statistique africain, numéro 4, mai 2007�2� Le Journal statistique africain, numéro 4, mai 2007�2�
anyprofession…”.SoimportantismentoringthatGarfield[29]describesitasan“ethicalimperativeandpragmaticnecessity”.Thesciencefictionwriter,H.GWells[30],predictedintheearly1900sthat,withdevelop-mentsintechnology,statisticalthinking“willonedaybeasnecessaryforefficientcitizenshipastheabilitytoreadandwrite”.
Asinthepast,todaystatisticscontinuestoplayaveryimportantroleinscienceandresearch,anditisakeyingredientintheadvancementofhu-mandevelopment[31-34].Itis,therefore,crucialthattheyounggenera-tionof statisticians ismentored appropriately tohelp themacquire theskillsneededfortheresponsibilitiestheywilltakeoninthefuture.Inthenextsection,wedescribesometechniquesthatyoungstatisticianscanusetoidentifyindividualsthatcanactasmentorstothem.
3. Identifying a Mentor
Wenowfocusourattentiontothementeeandprovidesomeadviceonhow to select a mentor.We offer no scientific evidence to support ouradviceand/recommendations,butthesearebasedonthepersonalexperi-enceofoneoftheauthors[LehaneThabane]inhismentoringrelationshipwiththethirdauthor[CharlesHerryGoldsmith],andsomeofthemen-teesofbothauthors.Thefollowingstepscanbeusedtoguidetheselectionofamentor:
I Identifyyourcareergoals:Priortoengaginginamentoringrelationship,it is essential to identify one’s career goals. Some can be short-termwhileothersmaybelong-term.Forexample,dependingonthetypeofjobandlevel,youmayidentifygoalsthatrelatetoresearch,teaching(education) or organizational politics. Some young people may finditdifficult to identify specificcareergoalsandthismaybesufficientreasonforonetogetamentor.Ifthisisthecase,thenmovetoStepII.Partofthementor’sroleistohelpthementeeidentifycareergoalsandtofocusonthefeasibilityofthesegoals.Itisimportanttobepragmaticinperformingthisstep:thegoalsshouldbeachievable.
II.Identifyapotentialmentorwhomatchesthegoals identifiedinStepI:Experience andanecdotal evidence suggest thatpeoplewhomakegoodmentorsarethosethatsetouttobecomementors.Therefore,itisimportantthat[thementee]identifysomeonewhohasarealinterestinmentoringyoungpeople.Donothesitatetoaskpotentialmentorsif they are really interested in mentoring. Below are some desirableattributesforamentor[35]:
Lehana Thabane, Marroon Thabane and Charles Harry Goldsmith

The African Statistical Journal, Volume 4, May 2007 �27
Mentoring Young Statisticians: Facilitating the Acquisition of Important Career Skills
a. Competence – a mentor has to be competent in some area of statistics;
b. Respect–(s)heshouldhaverespectofhisorherpeers; c. Power/Influence–(s)heshouldhavepower,particularlyfordealing
withorganizationalpolitics; d. Experience–(s)hemusthaveexperienceintheroleasastatistician,
educatororresearcher; e. PoliticalAcceptance–thisissomewhatrelatedtopower/influence\
and having respect of his or her peers locally or outside the institution;
f. Honesty–amentorshouldbehonestingivingbothpositivefeedback andconstructivecriticism.Thisisessentialinbuildingtrustbetween thementeeandthementor;
g. stablished Record of Mentoring – an ideal mentor would be someonewithanestablishedtrackrecordofworkingsuccessfully\ withyoungstatisticians.However,therearemanyindividualswho\ maycareaboutdevelopingyoungpeoplebutmaynothaveaformal mentoringrelationshipwiththem;and
h. RespectConfidence–Thementorshouldkeepthediscussions to him/herself and not broadcast them to others who may need to evaluatethementeefortenure,promotionorcareerawards.
III.Setupascheduleofregularmeetingswiththementor:Thefirstthemeetingwithmentorsetsthetonefortherelationship.Itisimportanttodocumenttheminutesofthemeetingsforlaterreference.Clarifythegoalsofthementoringrelationship;discussmethodsofcommunication,howtoresolvedisagreementsorconflictswhentheyariseandaskforfeedbackongoalsanddiscussstrategiestoachievethem.Subsequentmeetingsshouldprovidefeedbackontheprogressmadeontasksrelatedto the goals. The discussions may also be on the pros and cons ofdifferentchoicesatdifferenttimesinthementee’scareer.Itisessentialtokeepthecurriculumvitae(CV)up-to-dateintheformatrequiredbytheinstitutionandensurethatitproperlyreflectsaccomplishments.Itisimportanttoacknowledgefeedbackandtheeffortsofthementor.Thementeeshoulddotheirbesttofollowontheadvicethatthementorprovides unless there is a good eason not to, which should then bediscussedopenly.Agoodmentorhasarealinterestintheirmentee’ssuccess.
Both the mentee and the mentor should regularly evaluate therelationshipandlookforwaystomakeitbetter.
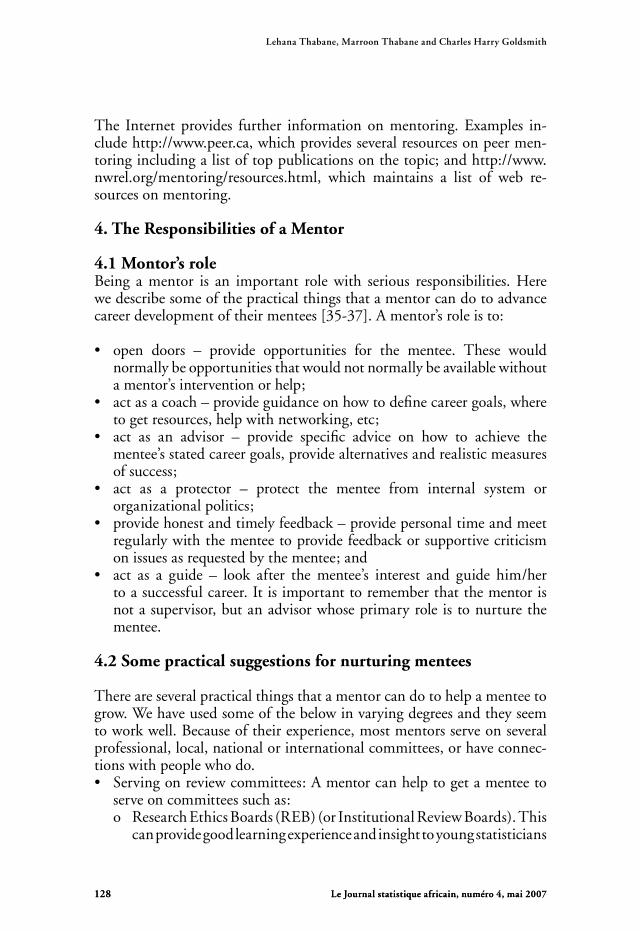
Le Journal statistique africain, numéro 4, mai 2007�2� Le Journal statistique africain, numéro 4, mai 2007�2�
The Internet provides further informationonmentoring.Examples in-cludehttp://www.peer.ca,whichprovidesseveralresourcesonpeermen-toringincludingalistoftoppublicationsonthetopic;andhttp://www.nwrel.org/mentoring/resources.html, which maintains a list of web re-sourcesonmentoring.
4. The Responsibilities of a Mentor
4.1 Montor’s roleBeing a mentor is an important role with serious responsibilities. Herewedescribesomeofthepracticalthingsthatamentorcandotoadvancecareerdevelopmentoftheirmentees[35-37].Amentor’sroleisto:
• open doors – provide opportunities for the mentee. These wouldnormallybeopportunitiesthatwouldnotnormallybeavailablewithoutamentor’sinterventionorhelp;
• actasacoach–provideguidanceonhowtodefinecareergoals,wheretogetresources,helpwithnetworking,etc;
• act as an advisor – provide specific advice on how to achieve thementee’sstatedcareergoals,providealternativesandrealisticmeasuresofsuccess;
• act as a protector – protect the mentee from internal system ororganizationalpolitics;
• providehonestandtimelyfeedback–providepersonaltimeandmeetregularlywiththementeetoprovidefeedbackorsupportivecriticismonissuesasrequestedbythementee;and
• act as a guide – look after the mentee’s interest and guide him/hertoasuccessfulcareer.Itisimportanttorememberthatthementorisnotasupervisor,butanadvisorwhoseprimaryroleistonurturethementee.
4.2 Some practical suggestions for nurturing mentees
Thereareseveralpracticalthingsthatamentorcandotohelpamenteetogrow.Wehaveusedsomeofthebelowinvaryingdegreesandtheyseemtoworkwell.Becauseoftheirexperience,mostmentorsserveonseveralprofessional,local,nationalorinternationalcommittees,orhaveconnec-tionswithpeoplewhodo.• Servingonreviewcommittees:Amentorcanhelptogetamenteeto
serveoncommitteessuchas: o ResearchEthicsBoards(REB)(orInstitutionalReviewBoards).This
canprovidegoodlearningexperienceandinsighttoyoungstatisticians
Lehana Thabane, Marroon Thabane and Charles Harry Goldsmith

The African Statistical Journal, Volume 4, May 2007 �2�
Mentoring Young Statisticians: Facilitating the Acquisition of Important Career Skills
on how to deal with ethics in design and analysis of research studies;o GrantReviewCommittees:Servingonthesecommitteescanprovide
valuableexperienceinresearchdesignandgrantproposalwriting.
Bothoftheseletthementeeknowthetypesofprojectsthatarebeingcon-ductedattheinstitutionaswellashowagrantiswordedtosuccessfullygetthroughthefundinghurdles.
• ReviewingManuscripts:Amentorcanwritetoeditorsofjournalsthatpublishworkinthementee’sareasofresearchinteresttorequestthemtoconsiderthementeeformanuscriptreviewing.Reviewingmanuscriptsisonewaytolearnhowtowritegoodmanuscripts.Ifamenteeisdoingareview(whether it is journalmanuscriptoranREBsubmission),amentorcanprovideblindedexamplesforillustrationstohelphim/hergetstarted.Thementorcanprovidefeedbackonthefirstdraftofthereviewuntilthementeehasacquiredtheskillstoperformreviewsonhim/herown.
• Serving on local administrative committees: This will enable thementeetoservethelocalcommunity.Often,youngpeopleareexcludedfromadministrativecommitteesunderthepretextofinexperience.Itisrecommendedthattheybeintroducedtoservingonthesecommitteesundertheguidanceofamentor.Atfirst,amentorcanbringthemtoattendthecommitteemeetingsasobservers,thenfacilitateforthemtojointhecommitteeiftheyexpressaninteresttoserve.Thisalsoallowsmentees to learnhow the system works faster than if theywerenotinvolved.
• Serving on professional committees: Participation in professionalactivities is alsocrucial forcareerdevelopmentandnetworking.Thementorshouldencouragethementeetogetinvolvedinlocalchapters,sectionsandassociation-levelactivities.
• Provide feedback on presentations and manuscripts: Advancementof presentation skills, whether verbal or written, is one of the mostneglected skills and an important aspect of career development foryoungstatisticians.
o Amentorcanwatchamenteepracticetheiroralpresentationsprior toformalpresentationsatmeetingsorseminars.Thisprovidesan opportunity for feedback and improvement in a friendly environment.
Le Journal statistique africain, numéro 4, mai 2007��0 Le Journal statistique africain, numéro 4, mai 2007��0
o Similarly, a mentor can provide feedback on written work and guidance to appropriate resources for further information. It is importanttokeepalistofresourcesondifferentissuesthatare essential for career advancement. Examples include references on makingpresentations,reviewingapaper,writingathesis,publishing research papers, teaching, research ethics, developing creativity, supervising(graduate)students,mentoring,jobhunting,preparing foraninterview,leadership,management,etc.Theseareimportant issues that every young statistician needs to know about, but are notexposedtosystematicallyduringtheirformaltraining.Appendix 1providesagoodexampleofaresourcelistthatamentorcanuseto guidetheirprotégés.
• Protect the mentee from internal politics: If requested, the mentorsshouldaccompanythementeestomeetingsthatareimportantforthementees’career.Examplesincludeannualmeetingsforcareerrevieworperformanceappraisal.
• Providenetworkingopportunities:Networkingisanessentialpartofcareerdevelopment.Part of thementor’s role is to introducehis/hermenteetodifferentindividualsthatcanhelpthementee’scareer.Forexample,amentorcanintroducethementeetoothermoreexperiencedresearchersthatworkinthesameareasofresearchasthementee.Theselectionofindividualsfornetworkingcanalsobebasedonthecareergoalsofthementee.
5. Suggestions on Things That a Mentee Can Do on Their Own
Mentoring can improve productivity, enhance career development andfacilitateon-the-joblearning.Thesuccessofamentoringrelationshipde-pendsonseveralfactors,includingenhancedcommunicationbetweentheparties,clearmentoringgoals,increasedcommitmenttotherelationship,andasenseofmutualbenefit.However,mentoringcannotguaranteeca-reeradvancement.Thereismuchmorethatamenteeneedstodoontheirowntocomplementtheeffortsofmentorship.
• Read!Read! Andreadsomemore!Readingiskeyinacquiringnewknowledgeandideas.Itisimportantthatmenteesupdateandexpandtheirknowledgebasethroughreadingresourcesrelatedtotheirwork;
• Attend appropriate professional meetings or workshops: It isrecommended that individuals set goals for attending meetings orworkshops,andbeselective inthemeetingsthattheyplantoattend
Lehana Thabane, Marroon Thabane and Charles Harry Goldsmith
The African Statistical Journal, Volume 4, May 2007 ���
Mentoring Young Statisticians: Facilitating the Acquisition of Important Career Skills
eachyear.Forexample,itmaybeimportanttoattendmeetingsonlyifoneplansto:
o giveapresentation; o presentaposter; o attendacontinuingeducationworkshop;or o attendpresentationsbyparticularspeakerswiththeadditionalgoal
ofnetworkingwiththem.
• Attendworkshopsinnon-statisticalareas:Whileitisimportanttoattendworkshopsinstatisticalareaswhereoneneedsimprovement,attendingnon-statistical workshops is also recommended. For example, moststatisticiansworkinmulti-disciplinaryenvironmentswheretheyhavetodealwiththechallengingdynamicsofhumaninteractions.Takingworkshopson[timeorpeople]management,stressmanagement,teambuilding, communication skills, financial management, etc. wouldpreferred to attending a workshop in statistics field with which onealreadyhasfamiliarity.
• Attend or give (inter)departmental seminars/rounds: This providesagoodopportunity fornetworkingandto learnthecultureofotherfieldsorresearchers.Forinstance,ifamenteeworksinhealthresearchwhere(s)heisexpectedtocollaboratewithclinicians,itisdesirabletoattendmedicalrounds/seminarsgivenbyclinicianstolearnmoreaboutwhatis importantintheirfield.Anotherexampleistogiveseminarstousersofstatisticsfromone’soffice.Interactionwithusersenhancesunderstandingbetweenthepartiesandimprovescollaboration.
• Beagoodcitizenandcontributetothedevelopmentofthediscipline:Beingareviewerforgrantingagencies,journals,REBandsoon,isonewaytosupporttheacademicdevelopmentofstatistics.Beconstructiveinthisrole,withoutbelittlingthereceiverofyourcomments.Additionalbenefits of getting involved in these activities include networking,knowledgeimprovementandbetterinsightonmanyfronts.
• Ask for help and direction when you do not know. It is equallyimportanttorealizewhentoaskforhelp.Thiscansaveamentee’stimeandresources.
6. Concluding Remarks
Thefutureofstatisticsdependsheavilyonthetrainingandmentoringofyoungstatisticians.Wecallonexperiencedstatisticianstoincreasetheir(toborrowthewordsofthePremierofWestCape,SouthAfrica,MrRasool[38]atrecentConferenceofCommonwealthStatisticians),“…commit-

Le Journal statistique africain, numéro 4, mai 2007��2 Le Journal statistique africain, numéro 4, mai 2007��2
ment togobeyondwhat isusual…” toenhancecareerdevelopmentofyoung statisticians.We have provided strategies that both mentees andmentorscanusetofacilitatetheirmentoringrelationship.Wehopethatreaderswill find the ideashelpful andpractical.Mentoringof and col-laborationwithyoungstatisticiansisamodelthatcanfacilitateknowledgetransferandexperiencesharingforthebettermentofstatisticsandhumandevelopment.
References1. CanadianEnglishDictionaryandThesaurus.Collins,2004.2. Koopman R.J., Thiedke C.C. Views of Family Medicine
Department Chairs About Mentoring Junior Faculty. Med Teach2005;27(8):7347.
3. LuckhauptS.E.,ChinM.H.,MangioneC.M.,PhillipsR.S.,BellD,Leonard A.C., Tsevat J. Mentorship in Academic General InternalMedicine. Results of a Survey of Mentors. J of Gen Intern Med2005;20(11):1014-8.
4. FarrellS.E.,DigioiaN.M.,BroderickK.B.,CoatesW.C.MentoringforClinician-Educators.AcadEmergMed2004;11(12):1346-50.
5. Marco C.A., Perina D.G. Mentoring in Emergency Medicine:ChallengesandFutureDirections.AcadEmergMed2004;11(12):1329-30.AmJRespirCritCareMed.2006Jan1;173(1):23-31.
6. RockmanP,SalachL,GotlibD,CordM,TurnerT.SharedMentalHealthCare.ModelforSupportingandMentoringFamilyPhysiciansCanFamPhysician2004;50:397-402.
7. GibsonT,HeartfieldM.MentoringforNursesinGeneralPractice:anAustralianStudy.JofInter-profCare2005;19(1):50-62.
8. HillJ.J.,DelFaveroM,Ropers-HuilmanB.TheRoleofMentoringinDevelopingAfricanAmericanNurseLeaders.ResTheoryNursPract2005;19(4):341-56.
9. Tourigny L, Pulich M. A Critical Examination of Formal andInformalMentoringAmongNurses.HealthCareManag(Frederick)2005;24(1):68-76.
10. Block L.M., Claffey C, Korow M.K., McCaffrey R. The Valueof Mentorship Within Nursing Organizations. Nurs Forum2005;40(4):134-40.
11. Singletary S.E. Mentoring Surgeons for the 21st century. Ann ofSurgOncol2005;12(11):848-60.
12. RosserJ.C.Jr,HermanB,GiammariaL.E.Telementoring.SeminarsinLaparoscSurg2003;10(4):209-17.
13. GaissertH.A.,CasaleA.S.,CreswellL.L.,FergusonT.B.Jr,FullertonD.A., Kernstine K.H., McMullan D.M., Ring W.S., Putnam J.B.
Lehana Thabane, Marroon Thabane and Charles Harry Goldsmith

The African Statistical Journal, Volume 4, May 2007 ���
Mentoring Young Statisticians: Facilitating the Acquisition of Important Career Skills
Jr; Society of Thoracic Surgeons Workforce on Clinical Trials.MentoringClinicalTrials inThoracic andCardiovascularSurgery:aNewRolefortheSocietyofThoracicSurgeons.AnnThoracSurg.2004May;77(5):1874-5.
14. Committee on Training of Statisticians for Industry PreparingStatisticians forCareers inIndustry:Reportof theASASectiononStatisticalEducation.AmStatistician.1980;34(2):65-75.
15. TobiH.,KuikD.J.,BezemerP.R.,KetR.TowardsaCurriculumfortheConsultantBiostatistician:IdentificationofCentralDisciplines.StatMed.2001;20:3921-9.
16. Iman RL. New Paradigms for the Statistics Profession. J Am StatAssoc1995;90(429):1-6.
17. Hammond D. The Training of Clinical Trials Statisticians: aClinician’sView.Biometrics.1980;36:679-85.
18. Hogg R.V. Statistical Education: Improvements are Badly Needed.AmStatistician1991;45(4):342-3.
19. FedererW.T.SomeRemarksonStatisticalEducation.AmStatistician1978;32(4):117-21.
20. DeMets D.L., Anbar D, Fairweather W, Louis T.A., O’Neill R.T.Training the Next Generation of Biostatisticians. Am Statistician.1994;48(4):280-4.
21. Watts D.G. A Program for Training Statistical Consultants.Technometrics1970:12(4):737-40.
22. ImanR.L.NewParadigmsfortheStatisticsProfession.JASA1995;90(429):1-6.
23. Chuang-SteinC.On-the-jobTrainingofPharmaceuticalStatisticians.DrugInfJ1996;30:351-7.
24. LissC.L.CareerDevelopmentofStatisticiansinthePharmaceuticalIndustry. Drug Inform Journal2003; (available at http://www.diahome.org/content/Abstract/2003/dij1954.pdf.Lastdateofaccess:March3,2006)
25. AltmanN,BankisD,ChenP,DuffyD,HardwickJ,LegerC,OwenA, Stukel T. Meeting the Needs of New Statistical Researchers.StatisticalScience1991;6(2):163-74.
26. NolanD.WomeninStatisticsinAcademia:MentorsMatter.StatScie1992;7(2):267-72.
27. Alberts B. Science and World’s Future. 136th Annual Meeting ofthe National Science Academy Speech, Washington DC, 1999(available at http://www.nasonline.org/site/DocServer/1999address.pdf?docID=941)[lastdateofaccess:February24,2006]
28. HooverE.L.Mentoring surgeons inprivate and academicpractice.ArchSurg2005;140(6):598-608.

Le Journal statistique africain, numéro 4, mai 2007��4
Lehana Thabane, Marroon Thabane and Charles Harry Goldsmith
Le Journal statistique africain, numéro 4, mai 2007��4
29. Garfield E. Mentoring Young Scientists Is An Ethical Imperative--AndAPragmaticNecessity.TheScientist1992;6(24):411-2.
30. SneeR.D.StatisticalThinkingandItsContributiontoTotalQuality.AmStatistician1990;44(2):116-21
31. PocockS.J.RoleofStatisticsinMedicalResearch.BritJofPsychiatry1980;137:188-90.
32. RubergS.J,MasonR.L.IncreasingPublicAwarenessofStatisticsasaScienceandaProfession-StartingintheHighSchools.AmStatistician1988:42(3);167-70.
33. JoinerB.L.TheKeyRoleof Statisticians in theTransformationofNorthAmericanIndustry.AmStatistician1985;39(3):224-7.
34. Lievesley D. Making a Difference: A Role for the ResponsibleInternationalStatistician?AmStatistician2001;50(4):367-406.
35. BerkR.A.,BergJ,MortimerR,Walton-MossB,YeoTP,Measuringthe Effectiveness of Faculty Mentoring Relationships. Acad Med.2005;80:66–71.
36. HawkeyK.Roles,Responsibilities,andRelationshipsinMentoring:aLiteratureReviewandAgendaforResearch.JofTeachEduc.1997;48:325-335.
37. EnsherE,MurphyS.PowerMentoring.HowSuccessfulMentorsandProteges get the Most out of Their Relationships. Jossey-Bass: SanFrancisco,CA2005.
38. RasoolE.OpeningRemarksofPremierofCapeTownat the14thConference of Commonwealth Statisticians: September 5-9, 2005;CapeTown,SouthAfrica.
Topic Resources
Mentoring 1. GrigsbyK.FivePotentialPitfallforJuniorFacultyatAcademicHealthCenters.AcademicPhysician&Scientist2004;2-3
2. EnsherE,MurphyS.PowerMentoring.HowSuccess-fulMentorsandProtégésgettheMostoutofTheirRelationships.Jossey-Bass:SanFrancisco,CA2005.
3. http://www.peer.ca/topmenbks.html(providesalistoftopmentoring
Grant/ProposalWriting 1. MinerLE,GriffithJ.ProposalPlanningandWriting.Phoenix:OryxPress,1993.
2. OgdenTE,GoldbergIA.ResearchProposal:AGuidetoSuccess,3rded.NY:AacdemicPress,2002
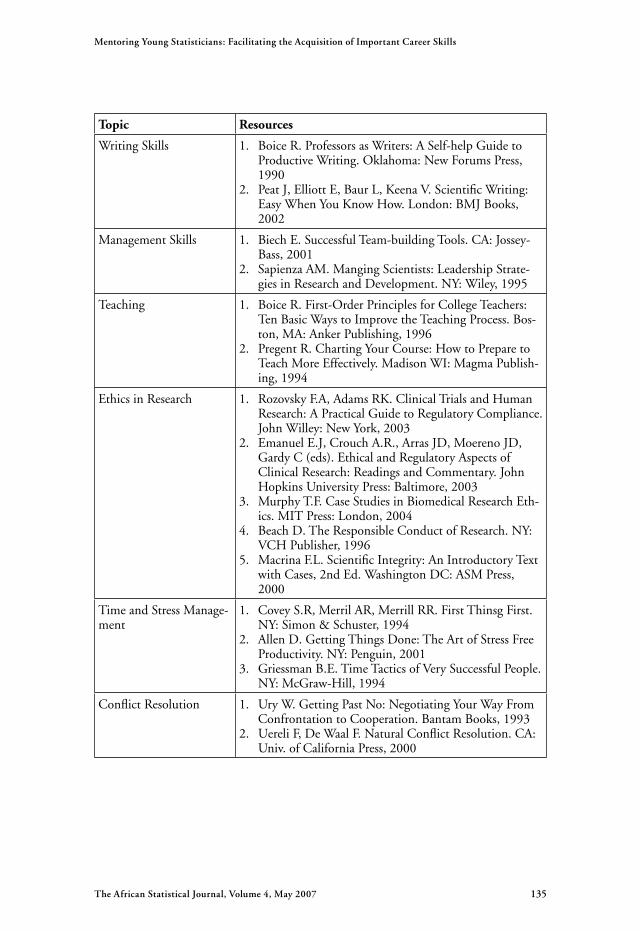
The African Statistical Journal, Volume 4, May 2007 ���
Mentoring Young Statisticians: Facilitating the Acquisition of Important Career Skills
Topic Resources
WritingSkills 1. BoiceR.ProfessorsasWriters:ASelf-helpGuidetoProductiveWriting.Oklahoma:NewForumsPress,1990
2. PeatJ,ElliottE,BaurL,KeenaV.ScientificWriting:EasyWhenYouKnowHow.London:BMJBooks,2002
ManagementSkills 1. BiechE.SuccessfulTeam-buildingTools.CA:Jossey-Bass,2001
2. SapienzaAM.MangingScientists:LeadershipStrate-giesinResearchandDevelopment.NY:Wiley,1995
Teaching 1. BoiceR.First-OrderPrinciplesforCollegeTeachers:TenBasicWaystoImprovetheTeachingProcess.Bos-ton,MA:AnkerPublishing,1996
2. PregentR.ChartingYourCourse:HowtoPreparetoTeachMoreEffectively.MadisonWI:MagmaPublish-ing,1994
EthicsinResearch 1. RozovskyF.A,AdamsRK.ClinicalTrialsandHumanResearch:APracticalGuidetoRegulatoryCompliance.JohnWilley:NewYork,2003
2. EmanuelE.J,CrouchA.R.,ArrasJD,MoerenoJD,GardyC(eds).EthicalandRegulatoryAspectsofClinicalResearch:ReadingsandCommentary.JohnHopkinsUniversityPress:Baltimore,2003
3. MurphyT.F.CaseStudiesinBiomedicalResearchEth-ics.MITPress:London,2004
4. BeachD.TheResponsibleConductofResearch.NY:VCHPublisher,1996
5. MacrinaF.L.ScientificIntegrity:AnIntroductoryTextwithCases,2ndEd.WashingtonDC:ASMPress,2000
TimeandStressManage-ment
1. CoveyS.R,MerrilAR,MerrillRR.FirstThinsgFirst.NY:Simon&Schuster,1994
2. AllenD.GettingThingsDone:TheArtofStressFreeProductivity.NY:Penguin,2001
3. GriessmanB.E.TimeTacticsofVerySuccessfulPeople.NY:McGraw-Hill,1994
ConflictResolution 1. UryW.GettingPastNo:NegotiatingYourWayFromConfrontationtoCooperation.BantamBooks,1993
2. UereliF,DeWaalF.NaturalConflictResolution.CA:Univ.ofCaliforniaPress,2000

Le Journal statistique africain, numéro 4, mai 2007���
Lehana Thabane, Marroon Thabane and Charles Harry Goldsmith
Le Journal statistique africain, numéro 4, mai 2007���
Topic Resources
CommunicationSkills 1. BriscoeM.H.PreparingScientificIllustrations:AGuidetoBetterPosters,PresentationsandPublica-tions.NY:Springer,1996
2. BoothV.CommunicatinginScience:WritingaScien-tificPagerandSpeakingatScientificMeetings,2nded.NY:CambridgeUniv.,1993
ReportingStatisticalResults
1. LangT.A,SecicM.HowtoReportStatisticsinMedi-cine.AmericanCollegeofPhysicianMedicalWritingandCommunication.Philadelphia,PA:2003.
2. MoherD,SchutzK.F,AtmanDG.TheCONSORTStatement:RevisedRecommendationsforImprovingtheQualityofReportsofParallel-groupRandomizedTrials.Lancet2001;357:1191-4.
3. CampbellM.K,ElbourneD.R,AltmanD.G.CON-SORTStatement:ExtensiontoClusterRandomizedTrials.BMJ2004;328:702-8.
4. BossuytP.Metal.TowardsCompleteReportingofStudiesofDiagnosticAccuracy:TheSTARDState-ment.AnnIntMed2003;138:40-5.
5. DesJarlaisD.C,LylesC,CrepazN.ImprovingtheReportingofNonrandomizedEvaluationsofBehav-ioralandPublicHealthInterventions:TheTRENDStatement.AmerJ.PubHealth2004;94(3):361-6.
6. StroupD.Fetal.Meta-analysisofObservationalStud-ies:AProposalforReporting:TheMOOSEStatement.JAMA2000;283:2008-12
7. MoherD,CookD.Jetal.ImprovingtheQualityofReportsofMeta-analysisofRandomizedControl-ledtrials:TheQUOROMStatement.Lancet1999;354:1896-1900.
8. SpeigelhalterD.J,MylesJ.P,JonesDR,AbramsKR.BayesianMethodsinHealthTechnology:AReview.HealthTechologyAssessment2000;4(38):133pages(Chapter8).
Reprinted with corrections

The African Statistical Journal, Volume 4, May 2007 ��7
Mentoring Young Statisticians: Facilitating the Acquisition of Important Career Skills

Le Journal statistique africain, numéro 4, mai 2007���
Editorial policy
TheAfricanStatisticalJournalwasestablishedtopromotetheunderstand-ingofstatisticaldevelopmentintheAfricanregion.Itfocusesonissuesre-latedtoofficialstatisticsaswellasapplicationofstatisticalmethodologiestosolvepracticalproblemsofgeneralinteresttoappliedstatisticians.Ofparticularinterestwillbeexpositionof:howstatisticscanhelptoillumi-natedevelopmentandpublicpolicyissueslikepoverty,gender,environ-ment,energy,HIV/AIDS,etc.;developmentofstatisticalliteracy;track-ingnationalandregionaldevelopmentagenda;developmentofstatisticalcapacitiesandeffectivenationalstatisticalsystems;andthedevelopmentofsectoralstatisticse.g.educationalstatistics,healthstatistics,agriculturalstatistics,etc.
Inadditiontoindividualacademicandpracticingstatisticians,theJour-nalshouldbeofgreat interesttoanumberof institutionsintheregionincludingNationalStatisticalOffices,CentralBanks,researchandtrain-inginstitutionsandsub-regionaleconomicgroupings,andinternationaldevelopmentagencies.
TheJournalservesasaresearchoutletandinformationsharingpublica-tionamongstatisticiansandusersofstatisticalinformationmainlyintheAfricanregion.Itpublishes,amongotherthings:
• articlesofanexpositoryorreviewnaturethatdemonstratethevitalroleofstatisticstosocietyratherthanpresenttechnicalmaterials,
• articles on statistical methodologies with special emphasis onapplications,
• articles about good practices and lessons learned in statisticaldevelopmentintheregion,
• opinionsonissuesofgeneralinteresttothestatisticalcommunityandusersofstatisticalinformationintheAfricanregion,
• noticesandannouncementsonupcomingevents,conferences,callsforpapers,and
• recentstatisticaldevelopmentsandanythingthatmaybeofinteresttothestatisticalcommunityintheregion.
Thepaperswhichneednotcontainoriginalmaterial,shouldbeofgeneralinteresttoawidesectionofprofessionalstatisticiansintheregion.
Allmanuscriptswillbereviewedandevaluatedoncontent,languageandpresentation.
The African Statistical Journal, Volume 4, May 2007 ���
Ligne éditoriale
LeJournalstatistiqueafricainaétéétablipourfavoriserlacompréhensiondudéveloppementstatistiquedanslarégionafricaine.Ilseconcentresurdesquestions liéesauxstatistiquesofficiellesaussibienque l’applicationdes méthodologies statistiques pour résoudre des problèmes pratiquesd’intérêt général pour les statisticiens de métier. L’intérêt particulier estdemontrercommentlesstatistiquespeuventaideràmettreenexerguelesproblèmesdedéveloppementetdepolitiquepubliquetelsquelapauvreté,legenre,l’environnement, l’énergie,leVIH/SIDA,etc.; ledéveloppe-mentdelaculturestatistique;lapriseencomptedesquestionsdedévelop-pementrégionaletnational;ledéveloppementdescapacitésstatistiquesetdessystèmesstatistiquesnationauxefficaces;etledéveloppementdesstatistiques sectorielles comme les statistiquesd’éducation,de santé,desstatistiquesagricoles,etc.
Enplusdesuniversitairesetdesstatisticiensdemétier,leJournaldevraitrevêtir un grand intérêt pour les institutions de la région, notammentlesofficesnationauxdestatistiques,lesbanquescentrales,lesinstitutsderechercheetlesorganisationséconomiquessous-régionauxetlesagencesinternationalesdedéveloppement.
LeJournalconstitueundocumentderechercheetd’informationentrelesstatisticiensetlesutilisateursdel’informationstatistique,principalementdanslarégionafricaine.Ilpublieentreautres:
• desarticlessurleplaidoyerenmatièredestatistiquequidémontrentlerôleessentieldesstatistiquesdanslasociétéplutôtquelaprésentationdesoutilstechniques,
• desarticlessurlesméthodologiesstatistiques,avecunaccentparticuliersurlesapplications,
• desarticlessurlesmeilleurespratiquesetlesleçonstiréesdelarégion,• des avis sur des questions d’intérêt général pour la communauté
statistiqueetlesutilisateursdel’informationstatistiquedanslarégionafricaine,
• des informations et des annonces sur les prochains événements, lesconférences,lesappelsàcontributionpourdespapiers,et
• lesdéveloppementsstatistiquesrécentsettoutautreaspectsusceptibled’intéresserlacommunautéstatistiquedanslarégion.
Lesarticles,quin’ontpasbesoindecontenirdumatérieloriginal,devraientintéresserunegrandepartiedesstatisticiensprofessionnelsdanslarégion.
Tous lesmanuscrits serontpassés en revue et évalués sur le contenu, lalangueetlaprésentation.

Le Journal statistique africain, numéro 4, mai 2007�40
NOTES TO AUTHORS
SubmissionManuscriptsinEnglishorFrenchshouldbesentbyemailtotheCo-Chair-persons,EditorialBoard,[email protected]@[email protected].
TitleThetitleshouldbebriefandspecific.Thetitlepageshouldincludethetitle,theauthor’sname,affiliationandaddress.Theaffiliationandaddressshouldbegivenasafootnoteonthetitlepage.Ifthemanuscriptiscoau-thored,thesameinformationshouldbegivenforthecoauthor(s).
Summary, Key Words and AcknowledgementsAshortsummaryofabout150wordsmustbeincludedatthebeginningofthemanuscripttogetherwithupto6keywordsusedinthemanuscript.Thekeywordsshouldnotrepeatwordsusedinthetitle.Acknowledge-ments,ifany,shouldbeinsertedatthebottomofthetitlepage.
SectionsSectionsshouldbenumbered.Subsectionsmaybeused.
Tables and Figures Tablesandfiguresshouldbenumberedandgivenatitle.Theseshouldbereferredtointhetextbynumber,notbypageorindicationssuchas“be-low”or“above”.
EquationsAnyequationsinthepapershouldbenumbered.Thenumbersshouldbeplacedtotherightoftheequation.
ReferencesAlistofreferencesshouldbegivenattheendofthepaper.Thereferencesshouldbe arranged alphabetically, and for the same author chronologi-cally.Thereferences shouldgiveauthor’snameandyearofpublication,titleanddetailsofthepublication–nameofJournal.Usea,b,c,etc.toseparatepublicationsofthesameauthorinthesameyear.
Examples Kish,L.(1988a).MultipurposeSampleDesigns,SurveyMethodology,14,19-32.Kish,L.(1988b).ATaxonomyofElusivePopulations,ProceedingsoftheSection on Survey Research Methods, American Statistical Association,44-46.
The African Statistical Journal, Volume 4, May 2007 �4�
Herzog,A.R.andDielman,L.(1985).AgeDifferencesinresponseAccu-racyforFactualSurveyQuestions,JournalofGerontology,40,350-367.
Inthetext,theauthor’ssurnamesonlyshouldbegiven,followedbytheyearofpublication inparentheses e.g.Kish (1988a).For threeormoreauthors,onlythefirstsurnameshouldbegiven,followedbyetal.Abbre-viationsibid,opt.cit.shouldnotbeused.

Le Journal statistique africain, numéro 4, mai 2007�42
NOTES AUX AUTEURS
SoumissionLesmanuscritsenanglaisouenfrançaisdoiventêtreenvoyésauxprési-dentsducomitéderédactionparemailauxadressessuivantesc.lufumpa@[email protected]à[email protected]
TitreLetitredevraitêtrebrefetdétaillé.Lapagedetitredoitinclureletitredupapier,lenomdel’auteur,l’affiliationetl’adresse.L’affiliationetl’adressedoiventfigurercommenotedebasdepage.Silemanuscritestproduitpardescoauteurs,lamêmeinformationdoitêtredonnéepourlescoauteurs.
Résumé, mots clés et reconnaissanceUnrésumécourtd’environ150motsdoitêtreinclusaudébutdumanu-scritainsiqu’environ6motsclésutilisésdanslemanuscrit.Lesmotsclésnedoiventpasrépéterlesmotsutilisésdansletitre.Lessignesderecon-naissance,s’ilyena,doiventêtreinsérésenbasdelapagetitre.
SectionLessectionsdoiventêtrenumérotées.Dessous-sectionspeuventêtreem-ployées.
Tableaux et graphiques Les tableaux et les graphiques doivent être numérotés et comporter untitre.Ceux-cidevraientêtrementionnésdansletexteparlenombrecor-respondant,etnonparuneindicationdepageoupard’autresindicationstellesque“ci-dessous”ou“au-dessusde”.
ÉquationsToutesleséquationsdanslepapierdoiventêtrenumérotées.Lesnombresdoiventêtreplacésàladroitedel’équation.
RéférencesUnelistederéférencesdoitêtrefournieà lafindupapier.Lesréférenc-esdoivent être classéesparordre alphabétique, etpour lemêmeauteurchronologiquement.Lesréférencesdoiventdonnerlenomdel’auteuretl’annéedepublication,letitreetautresdétailsconcernantlapublication.Employera,b,c, etc.pour séparer lespublicationsdumêmeauteuraucoursderlamêmeannée.

The African Statistical Journal, Volume 4, May 2007 �4�
Exemples Kish,L.(1988a).MultipurposeSampleDesigns,SurveyMethodology,14,19-32.Kish,L.(1988b).ATaxonomyofElusivePopulations,ProceedingsoftheSection on Survey Research Methods, American Statistical Association,44-46.
Herzog,A.R.andDielman,L.(1985).AgeDifferencesinresponseAccu-racyforFactualSurveyQuestions,JournalofGerontology,40,350-367.
Nedoiventfigurerdansletextequelesnomsdefamilledesauteurs,suividel’annéedelapublicationentreparenthèsesparexempleKish(1988a).Pourtroisauteursouplus,seulementlepremiernomdefamilledevraientêtre donnés, suivi des autres. Les abréviations, comme ibid, opt, cit nedoiventpasêtreemployées.

Le Journal statistique africain, numéro 4, mai 2007�44
Acknowledgments
TheEditorialBoardwouldliketoexpressitsappreciationtoallauthorswhosubmittedpapersforpublicationinthisissueoftheAfricanStatisticalJournal.
TheEditorialBoardalsoconveysitsgratitudetoitsmembersandstaffoftheAfricanDevelopmentBank’sStatisticsDepartmentwhoassistedwiththereviewofthepaperspublishedinthisvolume.

The African Statistical Journal, Volume 4, May 2007 �4�
Remerciements
LecomitéderédactionvoudraitexprimersagratitudeàtouslesauteursquiontsoumisdesarticlespourlapublicationdanscetteéditionduJour-nalstatistiqueafricain.
LecomitéderédactionégalementétendsesremerciementsàsesmembresetaupersonnelduDépartementdelastatistiquedelaBanqueAfricainedeDéveloppementquiontassistépourpasserenrevuelesarticlespubliésdanscevolume.

Le Journal statistique africain, numéro 4, mai 2007�4�

The African Statistical Journal, Volume 4, May 2007 �47
MINISTERIAL STATEMENT
1. We, African Ministers of Finance, Planning and EconomicDevelopment, meeting in Addis Ababa 2-3 April 2007, under theauspices of the United Nations Economic Commission for Africa(ECA), reaffirm our commitment to the Millennium DevelopmentGoals (MDGs), which together with other internationally agreedgoals,havebecomeoursharedframeworkfordevelopmentandglobalpartnership. We reiterate that the MDGs constitute the minimumtargets forsustainableeconomicgrowthanddevelopment,aswellasforreducingpovertyandinequality.
2. Werecallourstatementfollowingourconferenceonthetheme“Achieving the MDGs in Africa”,heldinAbujain2005,whichcriticallyreviewedprogressandobstaclesencounteredtowardsmeeting theMDGs.Wefurther recall the 2000 Millennium Declaration; the 2002 UnitedNationsConferenceonFinancingforDevelopmentinMonterrey;the2005WorldSummit;the2005UnitedNationsHigh-LevelDialogueonFinancingforDevelopment;the2005G8SummitinGleneagles;the2006AfricanMinistersofFinancemeetinginNigeria;the2006AfricanPlenaryonPovertyReductionStrategiesheldinCairo;andthe2005AfricanUnion(AU)SummitofHeadsofStateandGovernmentin Sirte, Libya. In this context, we acknowledge that some progresshas been made in implementing these commitments and urge thatimplementationbeaccelerated.
3. We reaffirm the importance of the New Partnership for Africa’sDevelopment(NEPAD)astheframeworkforAfrica’sdevelopmentandsupport thedecisionmadeby theSummitof theNEPADHeadsofStateandGovernmentImplementationCommitteeinAlgiers,Algeria,in March 2007 to establish a NEPAD Planning and CoordinatingAuthorityandfurthersupportitssubsequentintegrationintotheAUstructure. We commend the role of the Economic Commission for
United Nations Economic Commission for Africa
ConferenceofAfricanMinistersofFinance,PlanningandEconomicDevelopment/Fortieth
sessionoftheCommission
Fortieth session of the Commission
AddisAbaba,Ethiopia2-3April2007

Le Journal statistique africain, numéro 4, mai 2007�4�
Africa(ECA)incoordinatingtheeffortsofUnitedNationsagenciesinsupportoftheimplementationofNEPADandtherevitalizationoftheclustersystem.
4. WewelcomeECA’ssupporttoAfricancountriestotracktheprogressinimplementingthecommitmentsemanatingfromregionalandglobalconferencesandsummits,includingtheWorldSummitonSustainableDevelopment(WSSD),theWorldSummitontheInformationSociety(WSIS)andtheBrusselsProgrammeofActionontheLeastDevelopedCountries(LDCs).OnthebasisofthereportspreparedbyECA,wenotewithconcernthatmanyAfricancountriesarenotontracktowardsmeetingtheagreedgoalsandtargets.
Sustaining high economic growth and achieving the MDGs
5. We note with satisfaction the strong overall growth performance inAfrica,butremainconcernedaboutthehighwithin-regionvariation,thelowimpactonemploymentcreation,andthefactthatthemajorityofAfricancountriesareoff-tracktomeetingtheMDGsby2015.Asweapproachthemid-pointfortheMDGsin2007,ourgovernmentsmustact urgently to scale up public sector investments in infrastructure,agriculture, health and education, which are the foundation forprivate-sector-led growth. We urge our countries, in keeping withthe commitment made in the Abuja Declaration on HIV/AIDS,Tuberculosis and other related infectious diseases to allocate 15 percentoftheirbudgetstohealth.Wenotetheeffortsofourcountriestoincreasedomesticresourcemobilizationbutrecognizethatclosingthesubstantialfundinggapswillnecessitateexternalresources.
6. We reaffirm that efforts to end conflicts are necessary to accelerateprogresstowardsachievingdevelopmentacrossAfrica.Inthisregard,we urge our governments to sustain and enhance security andstabilityacrossthecontinentinordertoenableeffectivescaling-upofinvestments to achieve the MDGs. We commend the efforts of theAUinthepromotionofpeace,securityandstabilityandcalluponittoenhanceitsroleintheexercise,particularlythroughitsPeaceandSecurityCouncil.
7. RecallingthesolemncommitmentmadeattheMillenniumSummittorespecthumanrightsandpromotetheruleoflaw,weconsiderthatjuridicalsafeguards,respectforhumanrightsandenhancementofthe

The African Statistical Journal, Volume 4, May 2007 �4�
foundationsof the ruleof lawanddemocracyconstitute anecessaryandevenobligatoryenvironmentforachievingtheMDGs.
8. Wefurthernotewithconcerntheeffectsofclimatechangeacrossthecontinent.Theyincreaseourcountries’vulnerabilitytonaturaldisasters,threatenfutureeconomicgrowthanddevelopment,andposeamajorchallenge to reducing poverty in Africa. We note with appreciationtheoutcomesofthe12thConferenceofPartiesoftheUnitedNationsFrameworkConventiononClimateChange(UNFCCCCOP12),heldinNovember2006andtheJanuary2007,AUSummitonthethemeofscienceandtechnologyandclimatechange.
9. Weapplaudtheremarkableprogressthatsomeofourcountrieshavemade in raising agricultural productivity, increasing primary schoolenrolment,increasingaccesstowatersupply,controllingmalaria,andotherquick-impactinitiatives.WealsotakenoteoftheresultsachievedbytheMillenniumVillagestoshowhowtheMDGscanbeachievedin poor communities. These successes demonstrate the feasibility ofachievingtheMDGs.TheyunderscorethattheGoalscanbemet ifsound policies and practical strategies for scaling-up investments inagriculture, infrastructure, science and technology, gender equality,education,health,andothervital areasarebacked-upwithadequatefinancing.
Planning and framework for action
10.We reiterate our strong commitment to align our comprehensivenational development strategies including the Poverty ReductionStrategy Papers (PRSPs) with the MDGs and other internationallyagreed goals. We commend the strong partnership between ECA,the African Development Bank (AfDB), and the United NationsDevelopment Programme (UNDP) in supporting the preparationand implementationof strategies toachieve theMDGsacrossAfricaand their effective support for capacity building around MDG-based planning and scaling-up of investments. We also support thecollaboration among ECA, AUC, AfDB and UNDP in monitoringandevaluatingtheattainmentoftheMDGs.
11.WealsocommendECA,AUC,andtheregionaleconomiccommunities(RECs)fortheirsupporttoAfrica’sregionalintegrationandeconomicdevelopment. However, we note with concern the slow pace of
ECONOMIC COMMISSION FOR AFRICA

Le Journal statistique africain, numéro 4, mai 2007��0
implementingexistingregionalintegrationprogrammesinAfricaandunderscoretheimportanceofscaling-upinvestmentsinAfrica’sregionalinfrastructureandotherregionalpublicgoodstoincreaseintra-Africantradeasanessentialcomponentforachievinghighergrowth,meetingtheMDGs,andlong-termdevelopment.
12.Weareconcernedbythewidedisparitybetweenthegrowingdemandforhigh-qualitystatisticsontheonehandandtheweaknessofstatisticalsystems on the other. In particular, inadequate human and financialcapacity, coupledwithpoor compliancewith international standards,contribute tounsatisfactorydataon theMDGsandotherkey socio-economicvariablesinmostcountries.Inthiscontext,wecommendECAforstrengtheningitsfocusonstatisticsandstatisticalcapacitybysetting-uptheAfricanCentreforStatistics(ACS)andnotewithsatisfactionthetremendousprogressmadebymemberStatesinassemblingdataundertheInternationalComparisonProgramme(ICP).
Partnership for development
13.Wenotewith grave concern that, despite promises todouble aidby2010, Official Development Assistance (ODA) to Africa, excludingone-offdebt relief, actually fell during2005.Moreoverdevelopmentpartners are yet toprovide time frames as tohow theywill increaseODAineachAfricancountry.Weemphasize that in theabsenceofpredictablecommitmentstoscale-upaid,Africancountriesareseriouslyconstrainedinplanningthenecessaryincreasesinpublicinvestmentsanddrawing-upMedium-TermExpenditureFrameworks(MTEFs)toachievetheMDGs.
14.WewelcometheAidforTrade(AfT)initiativeandapplauditsfocusonstrengtheningAfricancountries’supplycapacities,buildingtrade-related infrastructure, and dealing with adjustment costs related totradeliberalization.WeunderscorethecomplementarityofAfTwithothersourcesofdevelopmentassistance,andnotethatpublicprivatepartnershipsshouldplayakeyroleasanimplementationvehicleoftheAfTinitiativeatbothnationalandregionallevels.
15.Recognizing the role that the diaspora can play in financing thedevelopment of African countries, we commit ourselves to use allnecessarystrategiestomobilizethesavingofthisdiasporawithintheframeworkofpublic-privatepartnership.
The African Statistical Journal, Volume 4, May 2007 ���
A call for action to scale-up for succcess
16. The need to act now:WithtimerunningouttoachievetheMDGsby2015,weresolvetoshifttheemphasisfromdiscussingprinciplestoworkingoutthepracticalitiesforenhancedaction.Weunderscoretheurgencyforustofollowthrough,incollaborationwiththeinternationalcommunity, on commitments. The year 2007 must be the year ofredoubledeffortatnational,regional,andgloballevels.
17.Ownership and self-belief: We are determined to ensure thatcomprehensive national development strategies are country ownedwithastrongsenseofbeliefinourselvesthatthetaskcanbeachieved.In particular, we require sufficient policy space to design strategiesadapted to the specificneedsofourcountrieswithaviewtoendingaiddependencyover timeanduse thatspaceeffectively.WecommittoredoubleoureffortstoshareexperiencesamongmemberStates,topromotepeerlearning,andtobuildstrongAfricanleadershiptoguidetheprocess.
18.MDG-based comprehensive national development strategies:Wecommit,bytheendof2007,toalignourcomprehensivenationaldevelopment strategies and medium-term expenditure frameworkswiththeMDGsandotherinternationallyagreedgoals.Inparticular,these include sound economic policies and clear accountabilityframeworksinsupportofsustaininghigheconomicgrowth.Moreover,wewillpreparepracticalstrategiesforimplementingtheQuickImpactInitiativesasagreedatthe2005WorldSummitandreaffirmedatthe2006ConferenceonFinancingforDevelopmentheldinNigeria.Theseimmediatesteps,whichcansaveandimprovemillionsofliveswithinthespanofonlyafewyears,includethefreedistributionofmosquitonetsandeffectiveantimalarialtreatments,theexpansionofschoolmealprogrammesusinghome-grownfoods,andtheeliminationofuserfeesforprimaryeducationandhealth-careservices,allofwhicharemadepossiblebytimelyandpredictableincreasesinODA.
19.Monitoring and evaluation:Weundertaketoput inplace,by theendof 2008, a mechanism in our member States for monitoring, tracking,andevaluatingprogresstowardstheMDGs.Inthisregard,wecommittopromotepeerlearningandknowledgesharingasonesuchmechanismandcommendECAforsetting-uptheLearningGrouponPRSsandMDGs.Withinthecontextofpeerlearning,werecommendthattheconferenceofministersin2010shouldfocusontheprogressinthescaling-upeffort.
ECONOMIC COMMISSION FOR AFRICA
Le Journal statistique africain, numéro 4, mai 2007��2
20.Domestic resource mobilization: As part of national strategies toachievetheMDGsandotherinternationallyagreedgoals,weresolvetoincreasedomesticspendingontheMDGs,ensuringthatresourcesfrom debt relief, revenues from natural resources and other sourcesarechannelledtowardsmeetingtheGoals.Inaddition,weresolvetostrengthen and deepen our financial sector, promote microfinancinginorder to facilitate access to credit for themost vulnerable groups,harnessremittancesfordevelopment,andfurtherimprovethebusinessandinvestmentenvironmenttoattractincreasingflowsofFDI.
21.Investment in gender equality: We recognize that improving thepositionandconditionofwomeninourcountriesiscentraltoachievingtheMDGs.Weresolvetoincreaseinvestmentsingenderequalityandwomen’s empowerment that improve the statusofwomen, includingtheprovisionofwater,energy,educationandhealth;improveincome-generating opportunities; and strengthen policies to reduce violenceagainstwomen.
22.Generating employment:Werecognize thecentral roleofemploymentinthefightagainstpovertyandtheattainmentoftheMDGsandpledgeto integrate employment-creating policies in our national developmentprogrammesandtoincreaseinvestmentstowardsemploymentcreation.
23.Revitalizing African agriculture: We take note of recentcommitments, in particular the AU Summit on Food Security andthe Summit onFertilizer, andwill doourutmost to launchby end2008theAfricanGreenRevolutiontoraiseagriculturalproductivitybyensuringtheaccessofsmallholderfarmerstofertiliserandimprovedseeds, with the help of targeted subsidies as necessary; investing inwater management; strengthening agricultural extension services;expandingruralinfrastructure,especiallyroadsandenergyservices;andpromotingregionalcooperationinintra-Africantradeandinvestmentin agriculture. We reiterate our commitment to the implementationoftheNEPADComprehensiveAfricaAgricultureDevelopmentPlan(CAADP)andtoallocate10percentofourbudgetstoagricultureaspertheMaputoDecisionof2003.
24.Climate change and development:WerequestECAincollaborationwith AUC, AfDB and other international institutions to developand implement the Climate Information for Development in Africa(ClimDev-Africa) Programme and to report on progress at eachConferenceofthisCommission.Wealsorequestourgovernmentsto
The African Statistical Journal, Volume 4, May 2007 ���
integrateclimateadaptationandmitigationmeasuresintotheirnationaldevelopment strategies with support from our development partnersandtheRECs.
25.Statistics and statistical capacity:Weresolvetoimproveavailability,timelinessandqualityofdatainconformitywithinternationalstandards.We further commit to harmonize statistics across the continent andendorse the Reference Regional Strategic Framework for statisticalcapacity building in Africa (RRSF). We call on ECA, AUC andAfDBtocontinuetheircoordinationandleadershiproleinstatisticaldevelopmentinAfrica,andtofurtherstrengthenthecollaborationwithregional bodies and subregional organizations, including the RECs.In this regard we call on the Friends of the ECA to continue theirvaluablesupportforthisendeavour.Moreover,weresolvetolendourfullsupporttotheAfricaSymposiaonStatisticalDevelopment(ASSD)anditsrecommendationsaswellasitsfocusonthe2010RoundofthePopulationandHousingCensuses. In addition,we recommend thatthe ICP Africa be continued in order to facilitate intra-country andinternationalcomparisonsandcalluponECA,AUC,AfDBandotherpartnerstosupportitssustainability.
26.Regional Integration: We commend ECA, AUC, AfDB, and theRECs for preparing detailed infrastructure action plans, which nowneedtobeimplemented.Inparticular,wecallonourgovernmentsanddevelopmentpartners tofinance the implementationof theNEPADInfrastructureProgramme.WealsosupportcurrenteffortsbytheAUCincollaborationwithECAandAfDBinrationalizingtheRECsanddeveloping a minimum integration programme. To that end, AUCwillcollaboratewithcivilsocietyorganizationsinordertoengagethesupportoftheAfricanpeople.
27.Financing for development:WerequestECA,incollaborationwiththeAUC, toorganizeanassessmentof the statusof implementationof theMonterreyConsensus inAfricaandtoproposepracticalwaysin which all African countries can effectively access financing fordevelopment inpreparation for theGlobalMid-TermReviewof theMonterreyConsensustobeheldinQatarinearly2008.Wecommitto strengthen south-southcooperationasacomplementary sourceofdevelopmentfinance.
28.Aid for Trade: We strongly support the AfT initiative and urgedevelopmentpartnerstoexpeditetheongoingworkonAfTtomake
ECONOMIC COMMISSION FOR AFRICA

Le Journal statistique africain, numéro 4, mai 2007��4
itoperationalandensureadequatefundingonapredictablebasis.Weask ECA to work with the AUC and the AfDB to support Africangovernments in implementing this initiative. This includes definingnew mechanisms through national and regional AfT programmesin addressing Africa’s trade-related challenges. Moreover, it will benecessarytoidentifythecontributionsofthethreeinstitutionstothefollow-up and evaluation mechanisms for these programmes in thecountriesconcerned.Finally,weunderscorethatfundingfortheAfTneedstobeadequateandpredictable.
29.Economic Partnership Agreements (EPAs): We acknowledge thechallengesthattheEconomicPartnershipAgreements(EPAs)betweenEU and African countries and the related trade liberalization couldpresent to our member States. In this regard, we request the EU tomakeavailableadditionalresourcestomeettheadjustmentandotherassociatedcostsandurgethatanewEPAsframeworkbeadoptedbeforetheexpirationofthecurrentoneinDecember2007.
30.Implementation of ODA commitments:WecallontheG-8Leaders,attheir2008SummitinHeiligendamm,Germany,tomakeexplicitaclearactionplanfortheimplementationoftheirGleneaglescommitmentto double aid to Africa in order to ensure effective and predictabledeliveryofaid.WeacknowledgetheprogressmadebytheEuropeanUnion(EU)towardsmeetingtheircommitments inraisingODAtoAfrica.WefurthercallontheEUandotherdevelopmentpartnerstoimplementtheParisDeclarationcommitmentsonaideffectiveness.Werequestdevelopmentpartnersinourcountriestosharetheirplansforscaling-upaidwithourgovernmentsduring2007andbeyond.
31.Enhanced support from international organizations: We requestthe United Nations and international financial institutions to assistour governments in preparing and implementing MDG-basedcomprehensive national development strategies and quick impactinitiatives.Inparticular,wecallonthemtosupportopportunitiesforscaling-up investments to meet the MDGs and the mobilization ofnecessarydomesticandexternalresources.Wecallonthemtoprepare,inconsultationwithmemberStates,theirplansofsupportinthisregardbyend2007.

The African Statistical Journal, Volume 4, May 2007 ���
Positioning ECA to effectively meet Africa’s challenges
32.We recognize ECA’s key role in promoting economic and socialdevelopment in Africa. We note with satisfaction the strengthenedcollaborationamongECA,AUC,andAfDB.Further,wehavetakennote of the ECA Business Plan 2007 – 2009, which articulates thestrategicdirectionoftheCommissionandlaysoutaboldandenhancedprogrammeinsupporttomemberStates,andcommendtheExecutiveSecretary for his vision and leadership. In this regard, we urge ourmember States and development partners to support the Plan withadequateresources.
33.Inconclusion,wethankECAforsuccessfullyconveningtheFortiethsessionof theConferenceofAfricanMinistersofFinance,PlanningandEconomicDevelopment.WearegratefultotheFederalDemocraticRepublicofEthiopiafortheexcellentleadershipduringourdeliberations.WewishalsotothanktheGovernmentandthepeopleofEthiopiafortheirgenerosityandwarmhospitalityaccordedtousduringourstayinAddisAbaba.
ECONOMIC COMMISSION FOR AFRICA

Le Journal statistique africain, numéro 4, mai 2007���
The African Statistical Journal, Volume 4, May 2007 ��7
DÉCLARATION MINISTÉRIELLE
1.Nous, Ministres africains des finances, de la planification et dudéveloppement économique, réunis à Addis-Abeba les 2 et 3 avril2007,souslesauspicesdelaCommissionéconomiquepourl’Afrique(CEA), réaffirmons notre engagement en faveur des Objectifs duMillénairepourledéveloppement(OMD),qui,avecd’autresobjectifsconvenus à l’échelon international, constituent notre cadre commundedéveloppementetdepartenariatmondial.NousréaffirmonsquelesOMDconstituentdesobjectifsminimauxdecroissanceéconomiqueetdedéveloppementdurable,ainsiquederéductiondelapauvretéetdesinégalités.
2.NousrappelonslaDéclarationissuedenotreConférencetenueàAbujaen2005surlethème«RéaliserlesOMDenAfrique»,quiprésentaitunexamencritiquedesprogrèsaccomplisetdesobstaclesrencontrésdanslaréalisationdesOMD.NousrappelonségalementlaDéclarationduMillénairede2000,laConférencedesNationsUniessurlefinancementdudéveloppementtenueàMonterreyen2002,leSommetmondialde2005,ledébatdehautniveaudel’ONUen2005surlefinancementdudéveloppement, leSommetduG-8àGleneaglesen2005,laréuniondes ministres africains des finances au Nigéria en 2006, la RéunionplénièreafricainesurlesstratégiesderéductiondelapauvretéauCaireen2006etleSommetdeschefsd’Étatetdegouvernementdel’UnionafricaineàSirte(Libye)en2005.Àcepropos,nousreconnaissonsquedesprogrèsontétéfaitspourcequiestd’honorercesengagementsetdemandonsinstammentquelamiseenœuvresoitaccélérée.
3.Nous réaffirmons l’importance du NEPAD en tant que cadre dedéveloppementde l’Afrique,nousappuyons ladécision,prise lorsduSommetduComitédeschefsd’ÉtatetdegouvernementchargédelamiseenœuvreduNEPADtenuàAlgerenmars2007,decréerune
Nations Unies - Commission Economique pour l’Afrique
Conférencedesministresafricainsdesfinances,delaplanificationetdudéveloppementéconomique
Quarantième session de la Commission
Addis-Abeba2et3avril2007

Le Journal statistique africain, numéro 4, mai 2007���
autoritédeplanificationetdecoordinationduNEPADetnoussommesfavorables à l’intégrationde cette autoritédans la structurede l’UA.Nous saluons le rôle de la Commission économique pour l’Afrique(CEA)danslacoordinationdeseffortsdéployésparlesorganismesdesNationsUniesàl’appuidelamiseenœuvreduNEPAD,ainsiquelarelancedelaformuledesgroupessectoriels.
4.Nous saluons l’appui que la CEA fournit aux pays pour suivre les
progrèsaccomplisdans lamiseenœuvredesengagementsdécoulantdesconférencesetréunionsausommetorganiséesauxniveauxrégionalet mondial, notamment le Sommet mondial pour le développementdurable, le Sommet mondial sur la société de l’information et leProgrammed’actiondeBruxellesenfaveurdespayslesmoinsavancés.AuvudesrapportsétablisparlaCEA,nousnotonsavecpréoccupationque de nombreux pays africains ne sont pas en voie de réaliser lesObjectifsetlesciblesfixés.
MAINTIEN D’UNE CROISSANCE ÉCONOMIQUE FORTE ET RÉALISATION DES OMD 5.Nousnotonsavecsatisfactionla fortecroissanceglobalede l’Afrique,
mais demeurons préoccupés par sa forte irrégularité et son faibleimpact sur la création d’emplois, ainsi que par le fait que la plupartdes pays africains ne sont toujours pas en bonne voie de réaliser lesOMDd’icià2015.Commenoussommespratiquementàmi-parcoursde lamiseenœuvredesOMDen2007,nosgouvernementsdoiventsans tarder prendre des mesures pour effectuer des investissementspublicssupplémentairesdanslesinfrastructures,l’agriculture,lasantéetl’éducation,quiconstituentlefondementd’unecroissancealimentéepar le secteurprivé.Nous exhortonsnospays à allouer15%de leurbudgetàlasanté,conformémentàl’engagementprisdanslaDéclarationd’AbujasurleVIH/sida,latuberculoseetlesautresmaladiesinfectieusesconnexes.Nosprenonsnotedeseffortsdenospaysvisantàaccroîtrelamobilisationdesressourcesintérieures,maisnousreconnaissonsquedesressourcesextérieuresserontnécessairespourcomblerd’importantsdéficitsdefinancement.
6.Nousréaffirmonsque leseffortsvisantàmettrefinauxconflits sontnécessairespouraccélérerledéveloppementdel’ensembleducontinent.Àcetégard,nousnousengageonsàfavoriseretàaméliorerlasécuritéetlastabilitésurtoutlecontinentpourpermettrel’accroissementdes
The African Statistical Journal, Volume 4, May 2007 ���
investissementsnécessairesàlaréalisationdesOMD.Noussaluonsleseffortsdel’Unionafricainedanslapromotiondelapaix,delasécuritéetdelastabilité,etl’appelonsàrenforcersonrôledanscedomaine,enparticulieràtraverssonConseildelapaixetdelasécurité.
7.Rappelantl’engagementsolennelfaitlorsduSommetduMillénairederespecterlesdroitsdel’hommeetdepromouvoirl’Etatdedroit,nousconsidéronsquelasécuritéjuridique,lerespectdesdroitsdel’hommeetlerenforcementdesfondementsdel’Etatdedroitetdeladémocratieconstituent un environnement nécessaire et même obligatoire pouratteindrelesOMD.
8.Nous notons en outre avec préoccupation les effets du changementclimatique sur tout le continent. Ils rendent nos pays encore plusvulnérables aux catastrophes naturelles, compromettent la croissanceéconomique et ledéveloppement futurs et constituentungranddéfipourlaréductiondelapauvretéenAfrique.NousprenonsnoteavecsatisfactionlesconclusionsdeladouzièmesessiondelaConférencedesPartis à laConvention-cadredesNationsUnies sur les changementsclimatiques tenue en novembre 2006 et du Sommet de l’UA sur lethèmedelascience,delatechnologieetdeschangementsclimatiques,tenuenjanvier2007.
9.Nousnousréjouissonsdesprogrèsremarquablesaccomplisparcertains
paysquiont augmenté laproductivité agricole, accru la scolarisationdans l’enseignement primaire, étendu l’accès à l’approvisionnementeneau,maîtrisélepaludismeetprisd’autresinitiativesàeffetrapide.Nous prenons également note des résultats obtenus par les Villagesdu Millénaire, pour montrer comment réaliser les OMD dans descollectivités pauvres. Ces succès démontrent qu’il est parfaitementpossiblederéaliserlesOMD.IlssoulignentquelesObjectifspeuventêtreréalisés,siunfinancementadéquatappuiedespolitiquesjudicieusesetdesstratégiesconcrètesvisantà intensifier les investissementsdansl’agriculture,lesinfrastructures,lascienceetlatechnologie,l’égalitédessexes,l’éducation,lasantéetautresdomainescruciaux.
Planification et cadre pour l’action 10.Nousréaffirmonsquenoussommesrésolusàalignernosstratégiesglobales
dedéveloppementnational,notammentlesdocumentsdestratégiepourlaréductiondelapauvreté,surlesOMDetautresobjectifsconvenusà
COMMISSION ÉCONOMIQUE POUR L’AFRIQUE
Le Journal statistique africain, numéro 4, mai 2007��0
l’écheloninternational.NoussaluonslepartenariatremarquablequelaCEA,laBanqueafricainededéveloppement(BAD),etleProgrammedesNationsUniespourledéveloppement(PNUD)ontétablipourappuyerl’élaborationetlamiseenœuvredesstratégiesvisantàréaliserlesOMDpartout en Afrique et pour appuyer efficacement le renforcement descapacitésenmatièredeplanificationfondéesurlesOMDetaugmenterlesinvestissements.NoussommeségalementfavorablesàlacollaborationentrelaCEA,laCUA,laBADetlePNUDdanslecadredusuivietdel’évaluationdeseffortsvisantàréaliserlesOMD.
11.Nous félicitons également la CEA, la CUA et les communautéséconomiques régionales pour leur appui à l’intégration régionale etau développement économique de l’Afrique. Nous notons cependantavec préoccupation la lenteur de la mise en œuvre des programmesd’intégration régionale existants en Afrique et soulignons qu’ilest important d’augmenter les investissements à effectuer dansl’infrastructurerégionaledel’Afriqueetautresbienspublicsrégionauxpour stimuler le commerce intra-africain, qui est une composanteessentielledel’augmentationdelacroissance,delaréalisationdesOMDetdudéveloppementàlongterme.
12.Nous sommes préoccupés par l’écart important qui existe entre lademandecroissantedestatistiquesdequalité,d’unepart,etlafaiblessedes systèmes statistiques, d’autrepart.Enparticulier, la faiblessedescapacitéshumainesetfinancières,conjuguéeaunon-respectdesnormesinternationales,contribueàlamauvaisequalité,danslaplupartdespays,desdonnéessurlesOMDetdesautresvariablessocioéconomiquesclefs.Danscecontexte,nousfélicitonslaCEAderenforcerl’accentsurlesstatistiquesetlescapacitésstatistiquesencréantleCentreafricainpourlastatistiqueetnousnotonsavecsatisfactionlesprogrèsconsidérablesquelesÉtatsmembresontaccomplispourréunirdesdonnéesdanslecadreduProgrammedecomparaisoninternationale(PCI).
Partenariat pour le développement
13.Nousnotonsavecunevivepréoccupationqu’endépitdelapromessededoublerl’aideavant2010,etexceptédescasisolésderemisededette,l’aidepubliqueaudéveloppement(APD)pourl’Afriqueaenfaitbaissédurantl’année2005.Enoutre,lespartenairesdedéveloppementn’ontpasencorefournidecalendrierssurl’augmentationdeleurAPDpourchaquepaysafricain.Noussoulignonsque,sansengagementsprévisiblesàaccroîtrel’aide,lespaysafricainsaurontbeaucoupdemalàplanifier
The African Statistical Journal, Volume 4, May 2007 ���
lesnécessairesaugmentationsdesinvestissementspublicsetàélaboreruncadrededépensesàmoyentermepourréaliserlesOMD.
14.Nousnousfélicitonsdel’InitiativeAidepourlecommerceetdel’accentquiyestmissurlerenforcementdescapacitésdeproductiondespaysafricains,l’améliorationdesinfrastructurescommercialesetlagestiondes coûts d’ajustement liés à la libéralisation des échanges. Noussoulignons la complémentarité entre l’Initiative et les autres formesd’aideaudéveloppementetestimonsquelespartenariatspublic-privédevraientjouerunrôleclefdanslamiseenœuvredecetteinitiativeauxéchelonsnationaletrégional.
15.Reconnaissantlerôlequepeutjouerladiasporadanslefinancementdudéveloppementdespaysafricains,nousnousengageonsàutilisertouteslesstratégiesnécessairespourmobiliserl’épargnedecettediasporadanslecadred’unpartenariatpublic-privé.
APPEL À L’ACTION POUR LA RÉUSSITE
16.Nécessité d’agir sans délai:LetempsnousétantcomptépourréaliserlesOMDd’ici2015,nous sommesdécidés àpasserdudébat sur lesprincipesàl’élaborationdemodalitéspratiquespouruneactionàplusgrande échelle.Nous soulignons combien il est urgent d’honorer lesengagementsprix,encollaborationaveclacommunautéinternationale.L’année 2007 doit être celle d’un redoublement d’efforts à l’échellenationale,régionaleetmondiale.
17.Maîtrise et confiance en soi:Nous sommes résolusà faireen sorteque nos pays aient la maîtrise des stratégies nationales globales dedéveloppement et qu’ils aient la ferme conviction que la tâche peutêtre accomplie. En particulier, il nous faut disposer d’une margede manœuvre politique suffisante – et l’utiliser à bon escient - pourconcevoirdesstratégiesadaptéesauxbesoinsspécifiquesdenospays,le but étant de mettre fin progressivement à la dépendance vis-à-visde l’aide. Nous nous engageons à redoubler d’efforts pour amenerlespaysmembresàmettreencommunleursdonnéesd’expérience,àpromouvoirl’apprentissagemutueletàbâtirunleadershipafricainfortpourconduireleprocessus.
18.Stratégies nationales globales de développement basées sur les OMD: Nous nous engageons à aligner, d’ici à la fin de 2007, nosstratégiesnationalesglobalesdedéveloppementetnoscadresdedépenses
COMMISSION ÉCONOMIQUE POUR L’AFRIQUE

Le Journal statistique africain, numéro 4, mai 2007��2
àmoyentermesurlesOMDetlesautresobjectifsinternationalementconvenus. Il s’agit notamment d’adopter des politiques économiquessaines etdes cadresd’obligation redditionnelle clairs en faveurd’unecroissanceéconomiqueforteetdurable.Enoutre,nousélaboreronsdesmodalitéspratiquesdemiseenoeuvredesinitiativesàeffetimmédiatadoptéesauSommetmondialde2005etréaffirméesàlaConférencede2006surlefinancementdedéveloppementtenueauNigeria.Parmices mesures immédiates, susceptibles de sauver et d’améliorer desmillionsdeviesenquelquesannéesseulement,figurentladistributiongratuite de moustiquaires et de traitements antipaludiques efficaces,l’élargissement des programmes de cantines scolaires utilisant desproduits alimentaires locaux et la suppression des frais d’inscriptionpourl’enseignementprimaireetdesfraismédicaux,querendpossiblesl’augmentationrapideetprévisibledel’APD.
19.Évaluation et suivi des progrès:Nousnousproposonsdemettreenplaced’icià lafinde2008,dansnosÉtatsmembres,unmécanismede suivi et d’évaluation des progrès effectués vers la réalisation desOMD.Acetégard,nousnousengageonsàpromouvoirl’apprentissagemutueletlamiseencommundesconnaissances,quiferontpartiedecemécanisme,etnousfélicitonslaCEAd’avoircréélegroupederéflexionsur les SRP et les OMD. Nous recommandons, en ce qui concernel’apprentissagemutuel,qu’en2010laConférencedesministresexaminelesprogrèsréalisésdansl’accroissementdel’effort.
20.Mobilisation des ressources intérieures:DanslecadredesstratégiesnationalespourréaliserlesOMDetlesautresobjectifsinternationalementconvenus,nousnousengageonsàaccroîtrelesdépensesintérieuressurlesOMD,enveillantàcequelesressourcesprovenantdel’allégementdeladetteetlesrevenuscréésparlesressourcesnaturellesouprovenantd’autressourcessoientorientéesverslaréalisationdecesobjectifs.Enoutre,nousnousengageonsàrenforceretàapprofondirnotresecteurfinancier,àpromouvoirlamicrofinancepourfaciliterl’accèsaucréditpour les plus vulnérables, àmettre les envois de fonds au servicedudéveloppement et à améliorer davantage le climat des affaires et desinvestissementsafind’attirerplusd’IED.
21. Investissements en faveur de l’égalité entre les sexes:Reconnaissantl’importancecrucialepourlaréalisationdesOMDdelaconditiondesfemmesetde laplacequ’ellesoccupentdansnospays,nousprenonsla résolution d’accroître les investissements susceptibles d’améliorerleur statut notamment en leur assurant l’accès à l’eau, à l’énergie, à

The African Statistical Journal, Volume 4, May 2007 ���
l’éducation et à la santé; de promouvoir les activités rémunératriceset de renforcer les mesures de répression de la violence à l’égarddesfemmes.
22.Création d’emplois: Nous reconnaissons le rôle central de l’emploidans la lutte contre la pauvreté et pour la réalisation des OMD etnous nous engageons à intégrer des politiques de création d’emploisdansnosprogrammesnationauxdedéveloppement et à accroître lesinvestissementsenfaveurdel’emploi.
23.Revitalisation de l’agriculture africaine: Nous prenons acte desengagementsprisrécemment,enparticulier lorsduSommetdel’UAsurlasécuritéalimentaireetduSommetsurlesengrais,etnousferonstoutpour lancer,avantfin2008, laRévolutionverteafricainevisantà accroître la productivité agricole en garantissant l’accès des petitsexploitants agricoles àdes engrais et àdes semences améliorées, avecl’aidedesubventionscibléesselonquedebesoin;eninvestissantdanslagestiondel’eau;enrenforçantlesservicesdevulgarisationagricole;endéveloppant l’infrastructure rurale, enparticulier les routes et lesservicesénergétiques;etenfacilitant lacoopérationrégionalepour lecommerce intra-africain et l’investissement dans l’agriculture. NousréitéronsnotreengagementàmettreenœuvreleProgrammeintégréduNEPADpourledéveloppementdel’agricultureenAfriqueetàallouer10% de nos budgets à l’agriculture, conformément à la Décision deMaputode2003.
24.Changements climatiques et développement:NousdemandonsàlaCEA,encollaborationaveclaCommissiondel’Unionafricaine,laBanqueafricainededéveloppementetd’autresinstitutionsinternationales,demettreaupointetd’exécuterleProgrammed’informationsclimatiquespourledéveloppementenAfrique(ClimDevAfrique)etdefairerapportsurlesprogrèsaccomplisàchaqueConférencedenotreCommission.Nous demandons également à nos Gouvernements d’intégrer desmesuresd’adaptationauxchangementsclimatiquesetd’atténuationdeseffetsdeceux-cidansleursstratégiesnationalesdedéveloppement,avecleconcoursdenospartenairesdedéveloppementetdescommunautéséconomiquesrégionales.
25.Statistique et capacités statistiques: Nous sommes déterminés àaméliorerladisponibilité,lapertinenceetlaqualitédesdonnéesdanslerespectdesnormesinternationales.NousnousengageonsparailleursàharmoniserlesstatistiquesdanstoutlecontinentetàadopterleCadre
COMMISSION ÉCONOMIQUE POUR L’AFRIQUE
Le Journal statistique africain, numéro 4, mai 2007��4
stratégique régional de référence pour le renforcement des capacitésstatistiquesenAfrique.NousdemandonsàlaCEA,àlaCUAetàlaBADdecontinueràjouerleurrôledecoordinationetdedirectiondansledéveloppementdelastatistiqueenAfrique,etderenforcerencorelacollaborationavecdesorganismesrégionauxetdesorganisationssous-régionales,ycomprislescommunautéséconomiquesrégionales.Àcetégard,nousdemandonsauxAmisdelaCEAdecontinuerd’apporterleurappuiprécieuxàceteffort.Enoutre,nousdécidonsd’apporternotresoutiensansréserveauSymposiumafricainpourledéveloppementdelastatistiqueetàsesrecommandations,etnoussouscrivonsàl’importanceaccordéeàlasériederecensementsdelapopulationetdel’habitatde2010. Deplus,nous recommandons lapoursuiteduProgrammedecomparaison internationale (PCI) pour l’Afrique afin de faciliter lescomparaisonsnationalesetinternationales,etdemandonsàlaCEA,àlaCUA,àlaBADetàd’autrespartenairesdeveilleràsaviabilité.
26.Intégration régionale:NousfélicitonslaCEA,laCUA,laBADetlesCERd’avoirétablidesplansd’actiondétailléssurl’infrastructure,quidoiventêtredésormaismisenœuvre.Nousdemandonsenparticulierànosgouvernementsetauxpartenairesdedéveloppementdefinancerl’exécution du Plan d’action du NEPAD sur l’infrastructure. NoussoutenonségalementleseffortsquelaCUA,agissantencollaborationaveclaCEAetlaBAD,déploieactuellementpourrationaliserlesCERetélaborerunprogrammeminimumd’intégration.Aceteffet,laCUAsedoitdecollaborerégalementaveclesorganisationsdelasociétécivileafind’obtenirl’appuidespopulationsafricaines.
27.Financement du développement: Nous demandons à la CEA, encollaborationaveclaCommissiondel’Unionafricaine,d’évaluerl’étatd’applicationduConsensusdeMonterreyenAfriqueetdeproposerdesmoyensconcretspermettantàtouslespaysafricainsd’avoireffectivementaccèsaufinancementdudéveloppementdanslecadredespréparatifsdel’Examenmondialàmi-parcoursduConsensusdeMonterrey,quisetiendraauQataraudébutde2008.NousnousengageonsàrenforcerlacoopérationSud-Sudcommesourcecomplémentairedefinancementdudéveloppement.
28.Aide pour le commerce: Nous soutenons fermement l’initiativeAidepourlecommerceetinvitonslespartenairesdedéveloppementàaccélérerlestravauxencourspourqu’elledevienneopérationnelleetàgarantirunfinancementsuffisantetprévisible.NousdemandonsàlaCEAdecollaboreraveclaCUAetlaBADpouraiderlesgouvernements
The African Statistical Journal, Volume 4, May 2007 ���
africains à mettre cette initiative en œuvre. Il s’agit notamment dedéfinirdesmécanismesnouveauxàtraverslesprogrammesnationauxet régionauxd’aidepour lecommerceafinde résoudre lesdifficultésdel’Afriqueauplancommercial.Deplus,ilfautidentifierlesapportsdes trois institutions auxmécanismesde suivi etd’évaluationde cesprogrammespourlespaysconcernés.Enfin,nousinsistonssurlefaitque le financement de l’aide pour le commerce doit être appropriéetprévisible.
29.Accords de partenariat économique: Nous sommes conscients desdifficultés que présenteront pour nos Etats membres les Accords departenariatéconomiqueentrel’UnioneuropéenneetlespaysafricainsainsiquelalibéralisationdeséchangesquivadepairaveclesAccords.Acetégard,nousprionsl’Unioneuropéennededégagerdesressourcessupplémentairespourleurpermettredefairefaceaucoûtdel’ajustementetauxcoûtsconnexes,etnousdemandonsqu’unnouveaucadrepourlesAPEsoitadoptéavantl’expirationducadreactuelendécembre2007.
30.Concrétisation des engagements relatifs à l’APD: À l’occasiondu Sommet du G-8 de 2008, qui sera organisé à Heiligendamm(Allemagne), nousdemandons aux dirigeants du G-8 d’indiquer unplan d’action clair pour la concrétisation de leur engagement pris àGleneaglesdedoubler l’aide accordée à l’Afrique, afinque l’aide soitfournie de manière effective et prévisible. Nous saluons les progrèsaccomplis par l’Union européenne pour ce qui est d’honorer leursengagementsd’accroîtrel’APDenfaveurdel’Afrique.Nousappelonsenoutrel’UEetlesautrespartenairesdedéveloppementàdonnersuiteaux engagements pris dans la Déclaration de Paris sur l’efficacité del’aide.Nousdemandons auxpartenairesdedéveloppementdansnospays respectifs de communiquer ànos gouvernements leurs plansderenforcementdel’aidependantl’année2007etau-delà.
31.Accroissement de l’appui des organisations internationales:Nousdemandons à l’ONU et aux institutions financières internationalesd’aider nos Gouvernements à établir et à exécuter des stratégiesnationales globales de développement axées sur les OMD, ainsi quedesinitiativesàimpactrapide.Nousleurdemandonsenparticulierdepromouvoir les possibilités de renforcementdes investissements pourréaliserlesOMDetlamobilisationdesressourcesnationalesetexternesnécessaires.Nouslesinvitonsàélaborer,enconsultationaveclesÉtatsmembres,leursplansdesoutienàcetégardd’icifin2007.
COMMISSION ÉCONOMIQUE POUR L’AFRIQUE
Le Journal statistique africain, numéro 4, mai 2007���
Positionner la CEA de façon à relever efficacement les défis de l’Afrique
32.NousreconnaissonslerôlefondamentaldelaCEAdanslapromotiondudéveloppementéconomiqueetsocialenAfrique.NousnotonsavecsatisfactionlerenforcementdelacollaborationentrelaCEA,laCUAetlaBAD.Enoutre,nousavonsprisnoteduPland’activités2007-2009delaCEA,quidéfinitl’orientationstratégiqueduprogrammedetravaildelaCommissionetquidécritunprogrammeambitieuxetrenforcéd’appuiauxÉtatsmembres,etnousfélicitonsleSecrétaireexécutifdesa vison etde son leadership.À cet égard,nous exhortonsnosÉtatsmembresetnospartenairesdedéveloppementàappuyerlePlanavecdesressourcesappropriées.
33.Enconclusion,nousremercionslaCEAd’avoirorganiséavecsuccèslaquarantièmesessiondelaConférencedesministresafricainsdesfinances,de la planification et du développement économique. Nous sommesreconnaissants à la République fédérale démocratique d’Éthiopie del’excellenteconduitedesdébats.Noussouhaitonségalementremercierle Gouvernement et le peuple éthiopiens de leur générosité et del’hospitalitéchaleureusedontnousavonsbénéficiépendantnotreséjouràAddis-Abeba.

The African Statistical Journal, Volume 4, May 2007 ��7
YourExcellencies,HeadsofRwandanHigherInstitutionsMrAbdouleiJanneh,ExecutiveSecretaryofUNECAHonourableAnaDiasLourenco,MinisterforPlanning,RepublicofAngolaHeadsofNationalStatisticalOfficesDistinguishedLadiesandGentlemen,
LetmebeginmyremarksbyacknowledgingtheimportantroleplayedbytheUnitedStatesEconomicCommissionforAfrica,andtheGovernmentofSouthAfrica, forspearheadingthestrengtheningofAfrica’sstatisticalcapabilities. I also thank Honourable Ana Dias Lourenco, Minister forPlanning,theRepublicofAngolaforjoiningustodayinthisimportantmeetingonstatisticaldevelopmentonourcontinent.
Forourcontinenttotransformwemustbuildastrongstatisticalbasis–andsothisongoingendeavourisvitalindeed.
It is my pleasure to address the “2007 Africa Symposium on statisticalDevelopment”.Thisimportantmeeting,Iamtold,istoreviewprepara-tions for a complete enumerationof theAfricanPopulationduring the2010roundofPopulationandHousingcensuses.Ihavenodoubtthatyouwillhaveafruitfulsymposiumandvaluabledis-cussionsthatwillinturnenableourcontinenttosuccessfullyundertakePopulationandHousingCensusesasenvisaged.
Besides the census rounds, however, I believe that this is an importantforumfordiscussionofimprovingpolicy-makingonourcontinent,morespecifically,theimperativeofbasingtheprocessonrobustevidence.Myremarks this morning focus on the importance of statistics, and gener-allyevidence-basedpolicy-makinginAfrica,anareathat,Iamafraid,stillleavesalottobedesiredonourcontinent.
LADIESANDGENTLEMEN,
Letusconsiderforamomentwhatis“evidence-basedpolicy-making”.Insimpleterms,evidence-basedpolicy-makingisameansbywhichpoliciesandprogrammesintendedtoimprovelivesarebasedonclearlydefined,time-bound,andmeasurablemilestones.Thisallowstimelymodification,
The Importance of Statistics as a Basis for Effective Policy-making in AfricaSpeech by His Excellency Paul KagamePresident of the Republic of RwandaKigali, Intercontinental Hotel, January ��th 2007

Le Journal statistique africain, numéro 4, mai 2007���
consolidationorchangeofpolicyasthecasemayrequire,thusensuringurgentresponsetochallenges.It is inthiscontextthatstatisticsbecomepart and parcel of ‘evidence-based’ policy-making, statistics understoodheretomeanmorethanaroutinecollectionandstorageofnumbers,butratherascredibleandscientificallyderivedevidenceintendedtoevaluatetheimpactofpolicy-making.
Thatiswhynationalofficeschargedwithproducingofficialstatisticsmustbecapacitatedforgreatereffectivenessandefficiency.Theseofficesmustbeempoweredtoutilizemodernmethodsofgatheringevidenceforgoodpolicy-making, including issue-based demand-driven surveys, dedicatedandtimelyconductedcensuses,tailor-maderesearch,cost/benefitanalysis,economicmodeling,forecastsandprojections.Theseconstitutedifferenttools forplanning,measuring andmonitoringdevelopmentpolicyout-comes,allofwhichshareoneimportantelement:reliablestatisticsuponwhichpolicydevelopmentandmanagementdepend.
Howdowegetthere?Thefirststepistoabandonpreviousapproachestopolicy-making that essentially did not deliver quality services to Africanpeople.Theseapproaches,generallyoperatinginpoorgovernanceenviron-ments,wereinfluenced,forexample,bypersonalgain,powerfulinterests,orpurelyideologicalconsiderationsthatweresimplynotpeople-centred.
Itcanbestatedthat,thenotedapproachestopolicy-makingdisregardedtheutilityofstatisticsaltogether.Wemustmakeadecisivebreakwiththispast.Iputittoyouthatthisistheveryreasonwhyweareheretoday:anassemblyofAfrican statisticians to explorepracticalways andmeansofreinforcingournationalstatisticalagenciesandsystemssoastoprovidethefoundationforevidence-basedpolicy-making.
InourcaseinRwanda,wearedeterminedtoengenderastatisticsculturethatmustplaceusonaneffectivepathofevidence-basedpolicy-making.Thatiswhywearereinforcingournationalstatisticsagencyandsystemsthatincorporatenotonlycentral,butalllevelsofGovernment.Wemustaccelerateour agendaofbuildingMinisterialplanning,monitoring, andevaluationunitsbyequippingthemwithprofessionals,aswellaswithin-frastructuralcapacity,toenablethemtobecomethebasisofevidence-basedpolicy-making.Thereisnootherbasisforexecuting,monitoring,andeval-uatingtheworkwedoasleadersorprofessionalsinpublicservice.

The African Statistical Journal, Volume 4, May 2007 ���
The Importance of Statistics as a Basis for Effective Policy-making in Africa
Le Journal statistique africain, numéro 4, mai 2007�70
YOUREXCELLENCIES,
IfweformconsensushereinKigalithatevidence-basedpolicy-makingisurgentlyrequired,andthatstatisticalcapacitiesarethebasis,wemustad-dressatthissymposiumtworelatedcriticalissues:
First,wemustcontinuetoprobewhycurrentcapacitiesofAfrica’sstatis-ticsagenciesandsystemsremainweak.Second,wehavetoproposehowtoformulateandimplementanachievableagendaofre-positioningournationalstatisticsagenciesandsystemsinordertosupportevidence-basedpolicymakinginAfrica.Mostimportantly,astrategyoftrainingacriticalmassofstatisticiansisvital,ifwearetomakeevidence-basedpolicy-mak-ing a reality on the continent. We are not only talking of professionalstatisticians in central statistics bureaus; rather, awhole rangeof policymakers,businessoperators,civilsociety,andindeed,engenderingacultureofstatisticsacrosstheboard.ItisinthissensethatdecisionmakersincentralMinistriesorlocalgov-ernment,havetoabandonanecdotalapproachesintheexecutionoftheirdaily responsibilities.Wemustalsobegin toaddress thegenerally inad-equatestateofinfrastructureonourcontinent, includinglimiteduseofframesandICTinscientificsamplingmethods,datacollection,dataqual-ity,analysis,anddisseminationofofficialstatistics.
WithregardtotheKigalimeeting,Iurgeyoutoreflectonwhypreviouseffortsonstatisticalcapacitybuildinghavenotledtodesiredoutcomes.
DISTINGUISHEDLADIESANDGENTLEMEN,
InyourdiscussionsatthisKigalisymposium,youmustappreciatetheim-perativeofnationalownershipofpolicy-makinganddevelopmentman-agement.Itismyviewthatonlywhennationalgovernmentsanddomesticstakeholderstakechargeofpolicymanagement,willeffectivedevelopmen-talresultsbecomerealized.Thisisalsotrueofstatisticalcapacities.Iamtold,forexample,thatthereisalmostnosingleAfricancountrythatdoesnotdependonsome“donated”statisticsfromdevelopmentagencies.
Theburningquestionsare:Wherearesuchdatacollectedfromthatna-tional governments do not have access to? Why does this dependencypersist?Statistical capacitybuildingmust, therefore,becomeanational,regional,andcontinentalpriorityanchoredinthebroaderattemptatpol-icy-ownership,aswellasevidence-basedpolicy-making.Attheendofthissymposium,weexpectwell-thoughtoutresolutionsthatshouldguideus

The African Statistical Journal, Volume 4, May 2007 �7�
aswebuild strong statistical institutionsand systemsonourcontinent.Inthissense,weoughttochallengeourselvestodrawlessonsandgoodpracticesfromwithinthecontinentandbeyond.Itiscriticalthatwein-corporate lessons intobuildingourstatistical systems–andurgently,asopposedtoparticipatinginannualmeetingsthatcoverthesameissuesandsamegrounds.WeshoulddevisepracticalandeffectivestrategiesonhowtheKigaliresolutionscanaddsignificantvaluetoAfrica’sstatisticsagenciesandsystems.
DistinguishedLadies andGentlemen, Iwish you aproductivemeetingandIthankyouforyourattention.
Le Journal statistique africain, numéro 4, mai 2007�72
Upcoming events / Evénements en vue
RegionalworkshoponGDPbreakdownundertheframeworkoftheIn-ternationalComparisonProgramforAfrica(ICP-Africa),Yaoundé,Cam-eroon,June2007;
Sub-regional workshop on PPP computation methods,Yaoundé, Cam-eroon,September2007;
Sub-regional workshop on PPP computation methods, Dar Es Salaam,Tanzania,September2007;
Sub-regionalworkshoponPPPcomputationmethods,Kampala,Ougan-da,October2007;
Sub-regional workshop on PPP computation methods, Abidjan, Côted’Ivoire,October2007;
ICP-AfricaRegionalworkshopon thefinalPPP results;Tunis,Tunisia,September2007;
AdvisoryBoardonStatisticalActivities(ABSA),AddisAbaba,Ethiopia,30May2007
CODIMeeting,AddisAbaba,Ethiopia,1-4June2007
OECD’sWorldForumonStatistics,KnowledgeandPolicy,Istanbul,Tur-key,27-30June2007
ISI,56thBiennialSession,Lisbon,Portugal,22-29August2007
Fourth InternationalConference onAgricultural Statistics –AdvancingStatisticalIntegrationandAnalysis(ICASIV-ASIA),Beijing,China,22-24October2007

The African Statistical Journal, Volume 4, May 2007 �7�

African S
tatistical Journal / Journal statistique africain
FONDS AFRICAIN DE DEVELOPPEMEN
T
AFRICAN DEVELOPMENT FUND
BA
NQUE
AFRICAINE DE DEVELOPPEMENT
© ADB/BAD, 2007 – Statistics Department • Département des statistiquesTemporary Relocation Agency (TRA) – Agence Temporaire de Relocalisation (ATR)13 Avenue du GhanaBP. 323, 1002 Tunis Belvedère Tunis, Tunisia / TunisieTel: (+216) 71 103 216Fax: (+216) 71 103 743 Email: [email protected] / Internet: http://[email protected]
Volume 4 – M
ay / Mai 2007
African Statistical Journal Journal statistique africain
Volume 4 – May / Mai 2007African Development Bank Group
Groupe de la Banque africaine de développement
International Comparison Program for Africa:Towards Economic Convergence Measurement
Construction and Civil Engineering Work:Designing a Time-Space Index
Estimating National Annual Average Prices within the ICP-Africa Framework: Back to Surveys
Détermination des parités de pouvoir d’achat élémentairesdans le cadre du PCI-Afrique : la méthode CPD
Comparative Consumption and Price Levels in African Countries:First Results of the International Comparison Program for Africa
Consommation et niveaux des prix dans les pays africains :premiers résultats du Programme
de comparaison internationale pour l’Afrique
Nouveaux défis en statistiques agricoles :initiatives de la FAO
Analysing Data from Participatory On-farm Trials
Invigorating the Celebrations of the African Statistics Day : LessonsLearned from the 2006 Edition
Mentoring Young Statisticians:Facilitating the Acquisition of Important Career Skills