Embed Size (px)
Citation preview

HAL Id: halshs-01820209https://halshs.archives-ouvertes.fr/halshs-01820209
Preprint submitted on 21 Jun 2018
HAL is a multi-disciplinary open accessarchive for the deposit and dissemination of sci-entific research documents, whether they are pub-lished or not. The documents may come fromteaching and research institutions in France orabroad, or from public or private research centers.
L’archive ouverte pluridisciplinaire HAL, estdestinée au dépôt et à la diffusion de documentsscientifiques de niveau recherche, publiés ou non,émanant des établissements d’enseignement et derecherche français ou étrangers, des laboratoirespublics ou privés.
African states and development in historical perspective:Colonial public finances in British and French West
Denis Cogneau, Yannick Dupraz, Sandrine Mesplé-Somps
To cite this version:Denis Cogneau, Yannick Dupraz, Sandrine Mesplé-Somps. African states and development in historicalperspective: Colonial public finances in British and French West. 2018. �halshs-01820209�

WORKING PAPER N° 2018 – 29
African states and development in historical perspective: Colonial public finances in British and French West
Denis Cogneau Yannick Dupraz
Sandrine Mesplé-Somps
JEL Codes: Keywords : Public finances, West Africa, state building, colonization
PARIS-JOURDAN SCIENCES ECONOMIQUES
48, BD JOURDAN – E.N.S. – 75014 PARIS TÉL. : 33(0) 1 80 52 16 00=
www.pse.ens.fr
CENTRE NATIONAL DE LA RECHERCHE SCIENTIFIQUE – ECOLE DES HAUTES ETUDES EN SCIENCES SOCIALES
ÉCOLE DES PONTS PARISTECH – ECOLE NORMALE SUPÉRIEURE INSTITUT NATIONAL DE LA RECHERCHE AGRONOMIQUE – UNIVERSITE PARIS 1

African states and development inhistorical perspective:
Colonial public finances in British andFrench West Africa∗
Denis Cogneau†, Yannick Dupraz‡and Sandrine Mesplé-Somps§
2018
Abstract. — Why does it seem so difficult to build a sizeable developmentalstate in Africa? A growing literature looks at the colonial roots of differences ineconomic development, often using the French/British difference as a source ofvariation to identify which features of the colonial past mattered. We use historicalarchives to build a new dataset of public finances in 9 French and 4 British colonies ofWest Africa from 1900 to independence. Though we find some significant differencesbetween French and British colonies, we conclude that overall patterns of publicfinances were similar in both empires. The most striking fact is the great increasein expenditure per capita in the last decades of colonization: it quadrupled betweenthe end of World War II and independence. This increase in expenditure wasmade possible partly by an increase in customs revenue due to rising trade flows,but mostly by policy changes: net subsidies from colonizers to their colonies becamepositive, while, within the colonies, direct and indirect taxation rates increased. Weconclude that the last fifteen years of colonization are a key period to understandcolonial legacies.
Keywords: Public finances, West Africa, state building, colonization.
∗Historical data were collected within the “Afristory” research program coordinated by DenisCogneau (PSE - IRD). Financial support from the French Agency for Research (ANR) isgratefully acknowledged. Cédric Chambru, Manon Falquerho, Quynh Hoang, Maria LopezPortillo, and Ariane Salem have provided excellent research assistance for archive extraction.
†Senior research fellow at Institut de Recherche pour le Développement (IRD) and associateprofessor at Paris School of Economics.
‡CAGE post-doctoral research fellow, University of Warwick.§Research fellow at Institut de Recherche pour le Développement (IRD), LEDa, DIAL UMR225 and PSL, Université Paris-Dauphine.
1

1. Introduction
Why does it seem so difficult to build a sizeable developmental state in Africa?The economic literature has put forward weak states as a key factor explainingAfrica’s relative underdevelopment (Acemoglu and Robinson, 2012; Michalopou-los and Papaioannou, 2014). While some researchers insist that the conditionsexplaining weak state capacity in Africa existed long before European coloniza-tion (Herbst, 2000), others argue that most present-day features of African stateswere inherited from the colonial period (Cooper, 2002). Colonial African stateswere minimal, “gatekeeper” states, oriented towards resource extraction, and over-reliant on external trade taxation or archaic domestic taxes.Since Africa was practically entirely colonized, there is no good counter-factual
for European colonization. To identify the features of colonialism that mattered forlong term economic development, researchers have focused on sources of variationsuch as the distinction between settler and extraction colonies (Acemoglu et al.,2001), and the French/British difference. The British colonial legacy has been saidto be more favorable because of the kind of legal and institutional framework itset up (La Porta et al., 1998, 1999) and because of its effect on education (Brown,2000; Grier, 1999).Surprisingly, the history of public finances has been, with a few exceptions,
absent from this debate, while the recent economic literature has highlighted theimportance of taking the long run into account when thinking about state capacitybuilding (Besley and Persson, 2009, 2013).To better understand the links between the past and the present in developing
countries in general, and in Africa in particular, we need to have a better knowledgeof the functioning of colonial states which gave birth to today’s independent states.From historical archives, we constructed a new dataset of public finances in 13countries of West Africa from 1900 to independence, that we were able to extendto the postcolonial period for some variables and some countries. West Africa wasthe first region of Sub-Saharan Africa to bear prolonged European presence. Withits checker-board of French and British colonies, it seems like the best region toundertake a comparative study of British and French colonialism.Though we find some differences between French and British colonies (greater
2

importance of education expenditure in British colonies, greater reliance on directtaxation in French colonies), we conclude that, overall, the level and composition ofrevenue and expenditure were similar in both Empires, especially when we considerpairs of neighboring colonies sharing similar geographical conditions. About half ofpublic expenditure was oriented toward economic exploitation (infrastructure andproduction support). Although Nigeria stands out by its low level of net publicexpenditure and revenue per capita throughout the period, it does not seem thatBritish “indirect rule” in other West African colonies resulted in smaller colonialstates.The most striking fact is the great increase in expenditure in the last decades
of colonization: in French and British colonies alike, real expenditure per capitaquadrupled between 1940 and 1955. This massive increase in the size of colonialstates is not explained by public sector wage inflation. It was partly made possibleby an increase in customs taxes resulting from higher trade flows, but mostlyby changes in colonial policy: higher direct and indirect taxation rates, and anincrease in external revenue in the form of subsidies from France and Britain.In the history of African states, the very last fifteen years of colonization were
of great importance: this is during this period that a number of features of con-temporary states, such as external financing dependency, were put in place. Wealso have tentative evidence that this is during this period that civil service wagesetting policies started diverging in French- and English-speaking Africa.We are certainly not the first ones to be interested in the history of public
finances in Africa, but we might be among the first ones to do so in a systematicand comparable manner over a long period of time. One of our goals is to buildreliable long term series of public finance data in Africa, something that did notexist until today. Public finance series for African countries usually start in the1980s (Cagé and Gadenne, 2015; Baunsgaard and Keen, 2010). Closely relatedto our work are the book of Davis and Huttenback (1986), who study the costsand benefits of British imperialism from 1860 to 1912 and conclude that it mainlytransferred income within Britain from the middle to the upper class, the work ofHuillery (2014), who studies financial transfers between France and French WestAfrica over the colonial period, and the work of Frankema and van Waijenburg(2014), who study colonial revenue in French and British Africa from 1880 to 1940.
3

Frankema and van Waijenburg’s (2014) geographical scope is more extended thatours, but their data are far less detailed (they focus on gross revenue alone) anddo not cover the last 20 years of colonization.The rest of the chapter is organized as follows: we first give a brief summary of
the history of conquest and colonial rule in French and British West Africa (section1), before presenting the methodology used to construct the database (section2). We then present our series on colonial expenditure (section 3) and revenue(section 4), before discussing some preliminary postcolonial figures (section 5),and concluding (section 6).
2. France and Britain in West Africa
This section gives a very brief summary of the history of conquest and colonialrule in French and British West Africa, stressing the main differences between thetwo colonizers put forward by historians of the region.
2.1. Conquest
French and British conquest of West Africa took place mostly in the second halfof the 19th century and followed a pattern of expansion from small establishmentson the coast inwards. In 1850, the French were present in the Four Communesof Sénégal and on a narrow strip of coast-land in present-day Ivory Coast. TheBritish possessed Gambia, the Colony of Freetown, and settlements on the coastof present-day Ghana. Territorial conquest began around this date and acceler-ated in the last 20 years of the century (this Scramble for Africa by Europeanpowers was formalized and regulated by the Berlin Conference of 1884-85). TheBritish extended their territories around Freetown and in the Gold Coast, andadded Nigeria to their West African possessions. From their coastal settlements,the French expanded well into the interior, conquering a one-piece territory thatbecame the federation of AOF (Afrique Occidentale Française) in 1895.By the beginning of the 20th century, military conquest was mostly complete.
Except for the sharing of German Togo and Cameroon between the French and theBritish after World War I, the borders between the two empires did not move until
4

Figure 1: France and Britain in West Africa at the eve of decolonization
decolonization — figure 1. Lord Salisbury famously contrasted French expansion inWest Africa “by a large and constant expenditure, and by a succession of militaryexpeditions” with Great Britain’s “policy of advance by commercial enterprise”.1
In the end, French West Africa was more extended (4.7 millions km2 versus 1.25million for the 4 British colonies), but less populated (15.6 millions inhabitants in1910 versus 30 millions for British West Africa — 24.5 millions in Nigeria alone),and offered more opportunities for trade — if only because all of Great Britain’s 4West African colonies were coastal. This is something we have to account for whencomparing French and British colonial public finances: taxing maritime trade is acheap and easy way of collecting revenue that is not available in landlocked regions.
1Quoted in Hargreaves (1971), p. 261.
5

2.2. French and British colonial rule
A lot has been written on the differences between French and British colonial poli-cies in Africa. These differences are often subsumed under the classical oppositionbetween French direct rule and British indirect rule, but they include, beyondthe question of the role of traditional authorities in colonial rule, differences ineducation and labor policies.Comparative studies of colonial administration in Africa have crystallized in
the first decades of the 20th century the idea of an opposition between Frenchdirect rule and British indirect rule (Dimier, 2004; Perham, 1967; Mair, 1936).According to this view, French colonial administration was very centralized andbased on assimilation of colonial territories with France, while British colonialadministration was much more decentralized, based upon cooperation with localchiefs. This view owes a lot to the writings of Frederick Lugard, governor of Nigeriain the beginning of the 20th century, whose book The Dual Mandate in BritishColonial Africa was widely read in colonial circles (Lugard, 1922). In this book,Lugard theorized the system of administration that he established in NorthernNigeria, where he preserved the administrative, judiciary and religious structureof the Sokoto Caliphate.The relevance of this opposition started being questioned and nuanced from the
moment it was first expressed: French administration also relied on traditionalauthorites (Labouret, 1934; Delavignette, 1946), and British chiefs were often ar-tificial creations without much local legitimacy (Hailey, 1938). More recent work(Crowder, 1964; Geschiere, 1993) has underlined the reality of the opposition be-tween French and British policies towards local institutions. Crowder (1964) ar-gued that, despite the existence of a form of indirect rule in French colonies, thedifferences between the two systems “were rather those of kind than of degree.”Even more recently, research on the long term legacy of the type of colonial rulehas yielded somewhat contradictory results: while some insist on the detrimentaleffect of despotic chiefs empowered by indirect rule (Mamdani, 1996; Acemogluet al., 2014b,a), others argue that empowering local authorities with tax collectionbuilt local government capacity and had positive long term effects (Berger, 2009).Education has been underlined as the other major difference between French and
6

British rule in Africa. In British colonies, education was mainly undertaken by re-ligious missions, partly financed by public subsidies, while the French favored pub-lic schools in their colonies. Mission schools where more local, employing mainlyAfrican teachers and teaching in local languages, and were therefore more efficientat providing primary education to a large number of children (Gifford and Weiskel,1971). Primary enrolment rates were on average higher in British Africa duringthe colonial period (Benavot and Riddle, 1988), and some have argued that dif-ferences in educational legacies are important in explaining present-day outcomes(Brown, 2000; Grier, 1999). Cross country studies are not really able to isolate theeffect of colonial rule from the effect of pre-existing conditions (Frankema, 2012),but Cogneau and Moradi (2014) and Dupraz (2016) have used natural experi-ments to estimate a positive causal effect of British colonizer identity on educationoutcomes, even though Dupraz (2016) calls into question the persistence of thesedifferences over time.Although it is tempting to see in the success of British religious missions an il-
lustration of the benefits of laissez-faire education policies, we should keep in mindthat cooperation between colonial governments and missions was important, andthat missions were subsidized. The Phelps-Stoke Report on Education (1922),commissioned by an American fund to study education in Africa, was very in-fluential in shaping education policies in British African colonies: it advocatedcloser cooperation between missions and colonial governments, and recommendedincreasing government expenditure on education Fajana (1978). The questiontherefore remains of the extent to which government cooperation and subsidiesmattered for the success of missionary education in British Africa.A third aspect of the opposition between French and British rule concerns civil
liberties. Although colonization was everywhere, and almost by definition, syn-onymous with the imposition of a dual legal system (one for Europeans, one forAfricans), the restriction of civil liberties seems to have been harsher in FrenchAfrica. One good illustration of this is forced labor. Though all colonial powersintroduced some form of coerced labor in their African colonies, France (and Por-tugal) stood out by their large scale use of forced labor well into the 20th century(Cooper, 1996; van Waijenburg, 2015). In French colonies, forced labor took theform of both a labor tax (prestation) and the use of military conscription for public
7

works. The prestation (or corvée) required Africans to work a certain number ofdays per year on local public work projects, while military conscripts were used forlonger period of times on larger scale projects. Although the British used forcedlabor in their colonies, they were quicker to abandon it, immediately ratifying the1930 International Labor Office Forced Labor Convention while the French refuseduntil 1937, and continued to use forced labor up to World War II (Cooper, 1996).
2.3. From fiscal autonomy to development policies toindependence
Before World War II, fiscal autonomy was the stated aim of both British andFrench colonial policies (Davis and Huttenback, 1986; Gardner, 2012). Huillery(2014) computed the net public subsidies from metropolitan France to AOF duringthe entire colonial period, and concluded that they were overall very limited. Fromthe 1920s on, in both France and the UK, colonial administrators started callingfor metropolitan investments in the colonies. Albert Sarraut’s (1923) plan foreconomic development of the colonies was largely ignored, while in the UK similarideas failed to translate into action (Constantine, 1984).In 1929, the British Colonial Development Act created a Colonial Develop-
ment Fund credited by the British Treasury to finance investment projects inthe colonies, but the amount of money transferred to the Fund remained very lim-ited. The Colonial Development and Welfare Acts of 1940 and 1945 increased theamounts transferred to the Fund and broadened the scope of projects that couldbe financed (Constantine, 1984). France created in 1945 a similar fund, the FIDES(Fonds d’investissement pour le développement économique et social), dedicated tolarge scale infrastructure in the colonies.One of the reasons for the creation of these development funds was that France
and Britain’s possession of colonial empires were increasingly being questionedby the international community, especially by the United States and the USSR,the two great victors of World War II. Colonial rule was also more and morecontested from within, notably by labor movements. Faced with the necessity ofthinking about colonization in new ways, Britain insisted on the need for moreself-government, while France devised plans for assimilation of its colonies into a
8

large French polity (Cooper, 1996). But after a short period of rapid institutionalchange, all British and French colonies of West Africa became independent in aspace of 8 years between 1957 (independence of the Gold Coast, which becameGhana) and 1965 (independence of the Gambia).
3. Methodology and data
We collected detailed data on public finances every three years from 1901 to 1958for all colonies of AOF and the four British colonies of West Africa. This sectionbriefly presents the way we built our dataset, and addresses the potential pitfallsof a comparison between French and British colonies.
3.1. Assembling various sources of data
Public finances in the federation of AOF were organised in a pyramidal structure(Huillery, 2014) — see figure 2. At the top of the pyramid, the French metropoli-tan budget, more specifically, the budget of the Ministry of Colonies (Ministèredes Colonies), provided advances and grants to the budget of the General Gov-ernment (Gouvernment Général) of AOF, and various auxiliary budgets, such asdevelopment funds and railway budgets. It also provided loans to federal level loanbudgets. The Ministry of Colonies was also responsible for military expenditure inthe colonies. The General Government of the AOF collected taxes (mainly customduties) and was responsible for expenditure in federal-level administration andinfrastructure. Local (colony-level) budgets (Budgets locaux) collected direct andindirect taxes, received grants from the General Government, and were responsiblefor colony-level expenditure.We collected data from the final accounts (Comptes Définitifs) of each of these
budgets. Final accounts give a measure of effective revenue and expenditure at theend of the fiscal year. We used provisional budget estimates when we could not findfinal accounts, but also to collect data on the number of government employeesand their wage — this information practically never appears in final accounts.Though we consider grants and loans made by the metropolitan government to thecolonies, our data does not include direct expenditure of the French budget via the
9

Figure 2: Financial Structure of the AOF
French Budget
AOFBudget
AuxiliaryBudgets
LoanBudgets
LocalBudget
LocalBudget
LocalBudget
LocalBudget
subventionsadvancesloans
Source: Huillery (2014).
10

Ministry of Colonies. The reason is that these were mostly military expenditure,whose allocation between the different regions of the French empire requires relyingon many assumptions. As for civil expenditure, they do not make much differencefor the period we consider here. Though we include revenue transferred fromrailways to the General Budget, and capital expenditure on railways made by theGeneral Budget or loan budgets, our figures do not incorporate railway recurrentexpenditure.Our source for the FIDES accounts gives us only the expenditure side. On the
revenue side, knowing that the fund was financed partly by subsidies from Franceand partly by contributions from the colonies (appearing in colonial budgets), werecover the French government subsidy by subtracting colonies’ contribution fromtotal expenditure.2
The federal structure of AOF poses a challenge when we want to do colony-level comparisons. On top of direct transfers from the federal budget to eachcolony’s budget, part of the General Government’s expenditure was for federal-level administration and infrastructure projects, such as railways spanning severalcolonies. We allocate this federal-level expenditure to each colony in proportion ofits population. As far as revenue is concerned, a population rule is disputable: thebulk (74% on average) of net federal revenue was made of custom duties, whichshould be primarily allocated to coastal colonies with a high volume of trade. Tohave an idea of the contribution of each colony to the federal budget’s customduties, we take advantage of the fact that the AOF ceased to exist in 1957. Weuse the share of each colony in the total custom duties of former AOF colonies in1958 to allocate custom duties of the AOF to specific colonies in each year before1958. Other categories of revenue are allocated in proportion of population.The British colonies of West Africa were not organized in a federal structure
and their budgets were independent from one another. Each colony therefore hadits separate auxiliary, loan, and development budgets — figure 3. Local publicfinances, which were practically non-existent in AOF, were somewhat developedin British colonies. All over British Africa, local government, called Native Ad-
2These subventions appear in the Ministry of Colonies’ budgets, but we could not find thesebudgets for some years in the 1950s, where subventions to the FIDES were particularlyimportant. For year where we have the Ministry of Colonies’ budgets, our method matchesthe subsidies directly observed.
11
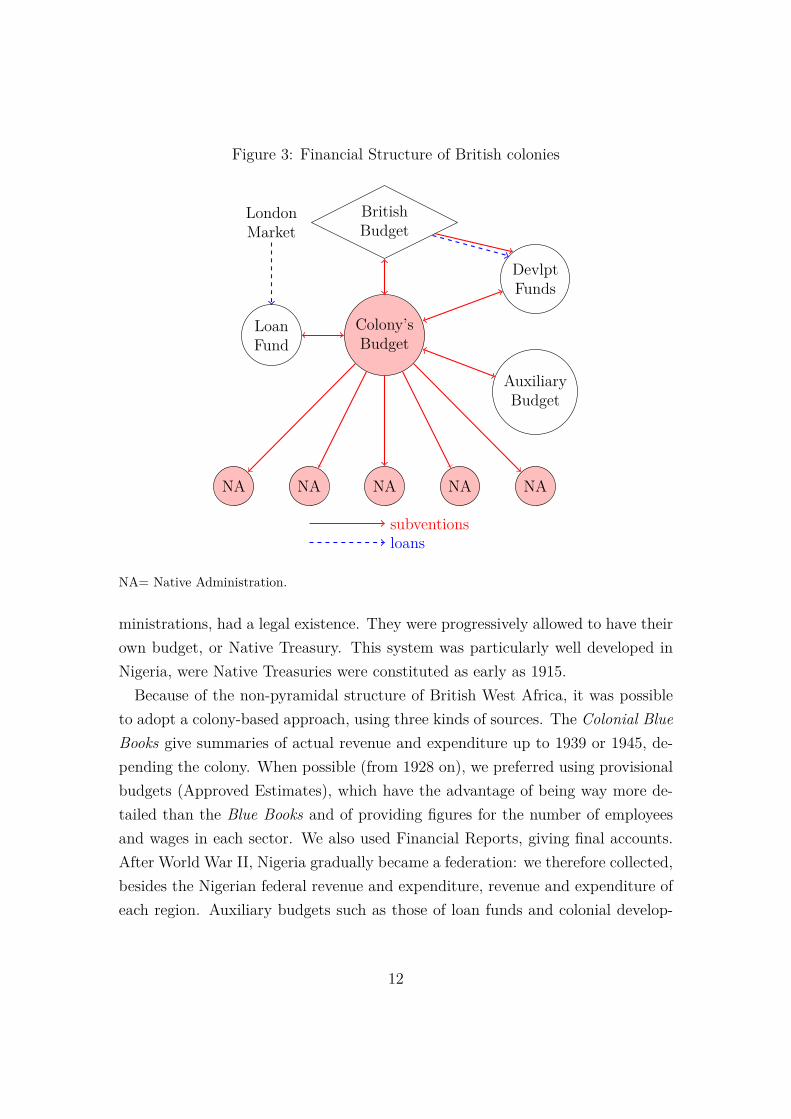
Figure 3: Financial Structure of British colonies
BritishBudget
Colony’sBudget
LoanFund
LondonMarket
AuxiliaryBudget
DevlptFunds
NA NA NA NA NA
subventionsloans
NA= Native Administration.
ministrations, had a legal existence. They were progressively allowed to have theirown budget, or Native Treasury. This system was particularly well developed inNigeria, were Native Treasuries were constituted as early as 1915.Because of the non-pyramidal structure of British West Africa, it was possible
to adopt a colony-based approach, using three kinds of sources. The Colonial BlueBooks give summaries of actual revenue and expenditure up to 1939 or 1945, de-pending the colony. When possible (from 1928 on), we preferred using provisionalbudgets (Approved Estimates), which have the advantage of being way more de-tailed than the Blue Books and of providing figures for the number of employeesand wages in each sector. We also used Financial Reports, giving final accounts.After World War II, Nigeria gradually became a federation: we therefore collected,besides the Nigerian federal revenue and expenditure, revenue and expenditure ofeach region. Auxiliary budgets such as those of loan funds and colonial develop-
12

Table 1: Native Administration Finances around 1946/1949
Nigeria Gold Coast Sierra Leone Gambia
Share of NA revenuein total public revenue 0.25 0.09 0.04 0.05Share of directtaxes in NA revenue 0.71 0.34 0.60 0.76
Share of NA exp.in total public exp. 0.23 0.09 0.05 0.05Share of administrationin NA expenditure 0.22 0.29 0.59 ?Share of educationin NA expenditure 0.08 0.21 0.05 ?
Nigeria: sources are 1945 Nigeria Estimates for colonial finances, 1946 esti-mates from Hailey (1950) for Native Treasuries Western and Northern re-gions, 1947 final accounts for Native Treasuries Eastern region. Gold Coast:sources are 1946 Gold Coast Estimates for Colonial finances, 1946 final ac-counts for Native Treasuries, Colony and Northern Territories and 1946estimates for Native Treasuries, Colony. Sierra Leone: sources are 1949Gambia Estimates for colonial finances, 1948 estimates from Hailey (1950)for Native Treasuries. Gambia: sources are 1946 Gambia Estimates forcolonial finances, 1947 estimates from Hailey (1950) for Native Treasuries.
ment funds are usually found in the Blue Books, Approved Estimates of FinancialReports for each colony. Like for AOF, railway auxiliary budgets were not takeninto account.Finding Native Treasury budgets proved more difficult. In Nigeria, the system
of Native Administration was well developed and we were able to find provisionalbudgets or final accounts for most years. In Gambia, Sierra Leone and the GoldCoast, we only found figures for a handful of years but these figures indicate thatin Nigeria only did Native Treasuries represent an important share of total publicrevenue (25% in 1946 –see table 1). Our results include Native Treasury revenueand expenditure when available (1916-1949 for Nigeria, 1940-1946 for the GoldCoast, 1946 for Gambia and 1949 for Sierra Lone).
13

3.2. Variable definition
The collection of public finance data at a detailed level offers two main advantages:1/ we are able to construct comparable variables for British and French colonies; 2/we can construct consolidated revenue and expenditure figures (cancelling out thevarious transfers between different budgets) and measures of net expenditure andrevenue, whereas most papers considering colonial public finances, like Frankemaand van Waijenburg (2014), present gross figure.We collected internal revenue variables (custom duties, other indirect taxes,
direct taxes, revenue of administrative services and industrial exploitations), aswell as external revenue variables (grants, loans, advances, interests and reim-bursements) and transfers from reserve funds. We collected internal expenditurevariables (administration, financial services, justice, security, health, education,production support, infrastructure), as well as external expenditure (grants, loans,advances, interests and reimbursements) and transfers to reserve funds.Since, for AOF, we do not take into account military expenditure (which was the
responsibility of the Ministry of Colonies), we also exclude military expenditurein British colonial budgets. British colonial military expenditure was small, andtherefore does not make much difference overall, as can be seen in figure 4.We define net public revenue (NPR) and net public expenditure (NPR) in the
following way:
NPEt =∑
i
total expenditureit −∑
i
loansOit −
∑i
advancesOit
−∑
i
interestsOit −
∑i
reimbursementsOit
−∑
i
reserve fund transfersOit −
∑i
grantsOit +
∑i
local grantsOit
NPRt =∑
i
total revenueit −∑
i
loansIit −
∑i
advancesIit
−∑
i
interestsIit −
∑i
reimbursementsIit
−∑
i
reserve fund transfersIit −
∑i
grantsIit +
∑i
local grantsIit
14

where t indexes time, i indexes budgets, O=paid out and I=paid in. Net publicrevenue is revenue net of all external revenue and all payments between budgets.It is a measure of what was actually levied inside a colony, and we can think ofit as a measure of fiscal capacity. Net public expenditure is expenditure net of allexternal payments an payments betweens budgets. It is a measure of what wasactually spent inside a colony. We call net surplus/deficit the difference betweenNPE and NPR:
NSt = NPEt −NPRt = −NDt
Net deficits are by construction equal to the sum of net subsidies, net loans, netadvances, net interests and reimbursements and net reserve fund transfers. It is ameasure of the capacity for a territory to self-finance.
3.3. The pitfalls of comparison
In order for the comparison between French and British colonies to make sense, weneed to ensure that amounts are expressed in a single deflated unit of account andnormalized by population. Normalizing by GDP to obtain shares of expenditureand revenue in GDP is made difficult by the absence of GDP figures for Africancolonies for most of the colonial periods, although Jerven (2012) has computedestimates for the Gold Coast.We also need to make sure that public finance figures are comparable. One
challenge is the use of coerced labor for public works in French colonies: vanWaijenburg (2015) has attempted to compute the implied fiscal value of corvéelabor, assuming a counter-factual where it would have been paid at the averageunskilled public sector wage. She finds a very high contribution of coerced laborto public expenditure, especially in the beginning of the 20th century — and stillas high as 20% of monetary public expenditure in the 1930s. However, the averagepublic sector unskilled wage is likely an over-valuation of the contribution of corvéelabor. The figures presented in this chapter encompass only monetary expenditureand revenue.All British colonial budgets were written in pounds. French colonial budgets
were written in francs before 1946 and in CFA francs afterwards (a money com-mon to all African colonies and pegged to the franc). We expressed all monetary
15

variables in 1913 pounds and francs using UK and French consumption indices fromVilla (1994) and London and Cambridge Economic Service and Alford (1973). Fig-ures in 1913 pounds were then converted into 1913 francs using the exchange ratefor 1913 from London and Cambridge Economic Service and Alford (1973). Thereason we rely on French and British CPIs is that we do not systematically haveAfrican CPIs. Building African CPIs during the colonial period is not an easytask: it has been attempted by Frankema and van Waijenburg (2012) for Britishcolonies; for French colonies, the available data seem too scarce for now. UsingFrench and British CPIs, we need to assume that the inflation differential betweenEurope and its colonies was moderate. During peacetime, this is a reasonableassumption, but there are reasons to believe that the inflation differential betweenFrance and AOF was high during World War II — AOF joined Free France veryearly on and was cut from Vichy France during most of the conflict. However, thefigures provided by Thioub (1994) for Sénégal point to inflation being relativelysimilar in West Africa and in France during the war.3 Moreover, it is not obviousthat public expenditure should be deflated using the consumption basket of anaverage worker. One simple way to test the robustness of our findings (especiallythe massive increase in public expenditure in the last fifteen years of colonization)is to measure the size of the colonial state in number of government employees(nurses, teachers, policemen). We undertake this comparison for Côte d’Ivoireand Ghana.To compute per capita figures, we relied on population estimates from Frankema
and Jerven (2014). The population figures they give apply to countries in theirpresent-day borders. After WWI, part of German Kamerun was attached to thecolony of Nigeria (the other part became French Cameroun) and part of GermanTogoland was attached to the Gold Coast (the other part became French Togo,which joined AOF in 1919). In AOF, the borders of different colonies evolvedduring the period (notably, the colony of Haute-Volta disappeared between 1932and 1947 and its territory was divided between other AOF colonies). We adaptedpopulation figures accordingly, using sub-colony population figures from Huillery
3 The cost of living in Dakar was multiplied by 3.58 from 1938 to 1944 according to Thioub(1994), while it was multiplied by 2.7 in the same period in France, and by 4 in the period1938-45 (Villa, 1994).
16

(2009), Cogneau and Moradi (2014) for Togo, Cameroonian censuses and Leagueof Nations reports for British Cameroon.When comparing British and French colonial public finances, it is very hard to
assume that the geographical areas compared were identical in all respects exceptidentity of the colonizer. Restricting the comparison to West Africa avoids havingto compare vastly different regions, but by no mean do we argue that it solves theselection problem. The British colonies we consider were, for one thing, all coastal,while AOF extended well inside the interior of West Africa. We acknowledge theproblem of comparing AOF with all British West African colonies and extend theregional analysis by considering pairs of neighboring colonies. The best case studyis surely the Gold Coast/Côte d’Ivoire comparison (both were colonized early andboth specialized in cocoa production), but we also compare Sierra Leone withGuinée, Gambia with Sénégal (although Gambia, a very small colony, might notbe a very good comparison) and Nigeria with its two coastal neighbors, Dahomeyand Cameroon (although Cameroon was not part of the AOF).
4. The size and role of colonial states
When considering net civil expenditure per capita (figure 4), the striking fact is nota cross empire difference but the great increase in expenditure per head in the latecolonial period, in both British and French colonies. In the AOF, net expenditureper head was multiplied by more than 4 in the last decades of colonization, jumpingfrom an average of 7.7 1913 francs in the 1930’s to 33.4 in 1955. In the 4 Britishcolonies of West Africa, net civil expenditure per head was multiplied by a bit lessthan 4, jumping from an average of 5.3 1913 francs in the 1930’s to 19.9 in 1955.One should not put too much emphasis on the higher expenditure per capita in
AOF for most of the period: results presented on figure 4 are heavily influencedby Nigeria, whose large size gives it a lot of weight in the computation of totalexpenditure: according to Frankema and Jerven (2014), in 1930 the populationof Nigeria was 24.5 millions against 3.8 millions for the Gold Coast, 1.4 millionsfor Sierra Leone and 240 000 for Gambia. Nigeria was specific inside the Britishempire, because of its sheer size, but also because it was the colony that servedas a model for Frederick Lugard’s theory of indirect rule (Lugard, 1922). When
17
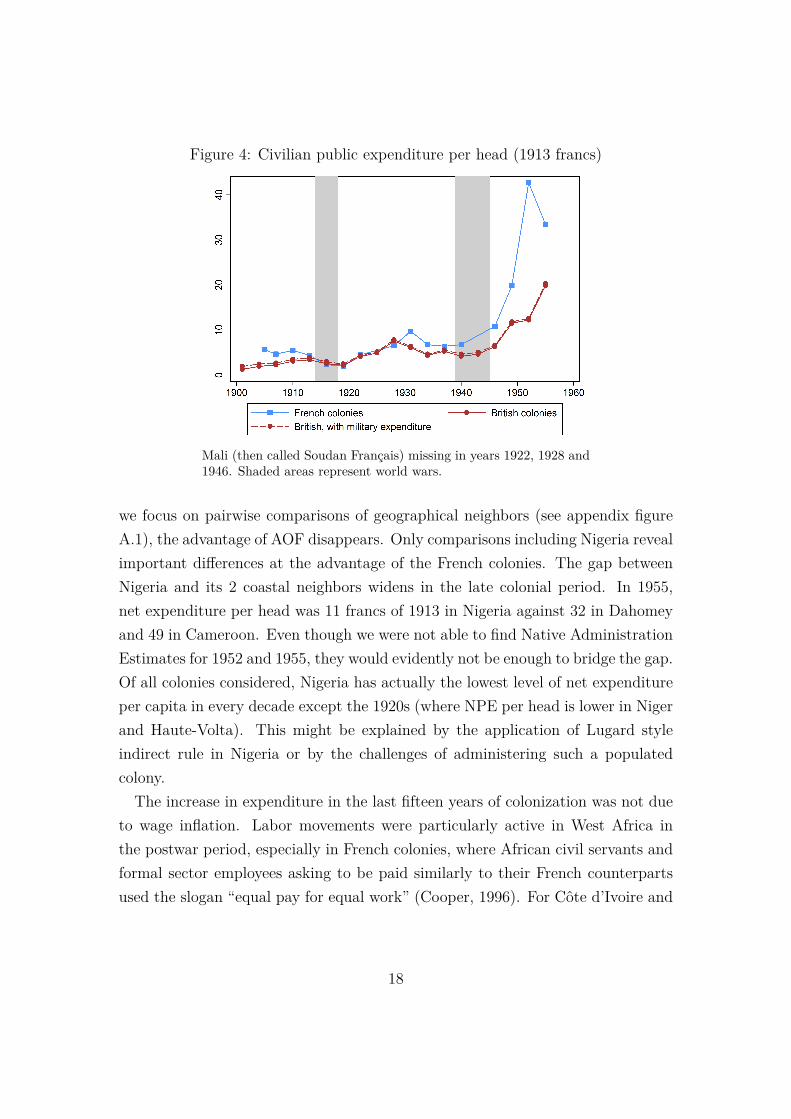
Figure 4: Civilian public expenditure per head (1913 francs)
Mali (then called Soudan Français) missing in years 1922, 1928 and1946. Shaded areas represent world wars.
we focus on pairwise comparisons of geographical neighbors (see appendix figureA.1), the advantage of AOF disappears. Only comparisons including Nigeria revealimportant differences at the advantage of the French colonies. The gap betweenNigeria and its 2 coastal neighbors widens in the late colonial period. In 1955,net expenditure per head was 11 francs of 1913 in Nigeria against 32 in Dahomeyand 49 in Cameroon. Even though we were not able to find Native AdministrationEstimates for 1952 and 1955, they would evidently not be enough to bridge the gap.Of all colonies considered, Nigeria has actually the lowest level of net expenditureper capita in every decade except the 1920s (where NPE per head is lower in Nigerand Haute-Volta). This might be explained by the application of Lugard styleindirect rule in Nigeria or by the challenges of administering such a populatedcolony.The increase in expenditure in the last fifteen years of colonization was not due
to wage inflation. Labor movements were particularly active in West Africa inthe postwar period, especially in French colonies, where African civil servants andformal sector employees asking to be paid similarly to their French counterpartsused the slogan “equal pay for equal work” (Cooper, 1996). For Côte d’Ivoire and
18

Figure 5: Number of civil servants per 1000 inhabitants and average civil servicewage in Côte d’Ivoire and the Gold Coast
Shaded areas represent world wars.
the Gold Coast, we were able to construct comparable series for the number of civilservants and civil service wages (figure 5): in both colonies, the number of civilservants per head is multiplied by a bit less than 3 between the 1930s and 1958.While in the Gold Coast, the average civil service wage is divided by more than 2between the 1920s and the 1950s, as the civil service expands and africanizes, itremains more or less constant in Côte d’Ivoire.
Figure 6: Distribution of net expenditure by sectors, French and British colonies
Mali (then called Soudan Français) missing in years 1922, 1928 and 1946.
What were colonial states doing? The structure of expenditure was very similarin French and British colonies. Figure 6 reveals that public expenditure in thecolonies was primarily oriented towards economic exploitation: the first categoryof expenditure was infrastructure (around 30%), while production support (subsi-dies to private companies, forestry, geological surveys, agricultural research, etc.)
19

represented around 15%. In the beginning of the period, administrative expen-diture (broadly defined, including justice and financial services) was the secondcategory of expenditure (a bit more than 25% on average in French and Britishcolonies alike in the first 2 decades of the 20th century); however, the share ofadministration in expenditure decreased as colonial states expanded (the share ofadministration was 11% in both British and French colonies in 1955). It doesn’tseem that the British version of “indirect rule” translated into lower administrationexpenditure as compared with French colonies.
Figure 7: Share of education in net civilian public expenditure
Mali (then called Soudan Français) missing in years 1922, 1928 and1946. Shaded areas represent world wars.
Education share in expenditure increased during the period: in the first 2decades of the 20th century, education represented on average 2.6% of net ex-penditure in French colonies and 2.4% in British colonies. In 1955, these shareswere 11.6% in British colonies and 7.6% in French colonies. It seems that sharesof education in expenditure started diverging in the 1930s (see Figure 7): on aver-age, in this decade, the share of education was 4% in French colonies against 6.4%in British colonies. Divergence is even more pronounced if we compare the GoldCoast with its neighbor Côte d’Ivoire (see Figure A.2): in the 1930’s, the shareof education expenditure averaged 3.1% in Côte d’Ivoire against 9.5% in the Gold
20

Coast (where 45% of education expenditure was subsidies to mission schools). Itis tempting to see here the effect of the Phelps-Stoke Report on Education (1922),advocating increased public expenditure in education, which was very influentialin shaping education policies in British Africa.Overall, patterns of public spending in French and British colonies of West
Africa share more common aspects than differences. We agree with Frankemaand van Waijenburg (2014) that identity of the colonizer does not seem to beparticularly relevant in explaining the size of colonial states. But in light of theradical increase in net expenditure in the very last decades of colonization inBritish and French colonies alike, we hesitate to conclude that state formation wasprimarily determined by local factors. Such a radical shift in colonial policies hintsthat the scope of possible policies was not that limited.
5. Financing colonial states
Figure 8: Net public revenue per head (1913 francs)
Mali (then called Soudan Français) missing in years 1922, 1928 and1946. Shaded areas represent world wars.
What accounts for the boom in expenditure in the decades following World WarII? Part of it is due to an increase in trade flows and in the corresponding customs
21

taxes, but most of it is due to a change in fiscal policy: higher direct and indirecttaxation rates, and the beginning of public aid (positive net subsidies from thecolonizers to their colonies).Revenue per head net of external financing increased fourfold in AOF from 1940
to 1955, going from 7 to 29.4 1913 francs per head. In British West Africa, itincreased fourfold as well, going from 4.6 to 19.4 1913 francs per head (figure8). The lack of reliable GDP figures before 1950 makes it difficult to expressthis increase in GDP shares, but it is very unlikely explained by GDP growth.In the Gold Coast, where net public revenue per capita was multiplied by fivebetween 1937 and 1955, GDP per capita increased by 50% between 1913 and 1955according to the Maddison project database (Bolt and van Zanden, 2014), whileGDP per capita actually decreased between 1937 and 1955 according to Jerven’s(2012) figures.
Figure 9: Customs duties and direct taxes per head
Mali (then called Soudan Français) missing in years 1922, 1928 and 1946. Shaded areasrepresent world wars.
In AOF, the increase in net revenue was explained by an increase in customduties and direct taxes alike, while in British West Africa, most of the increasecame from custom duties (see figure 9). Part of the increase in customs revenueis explained by an increase in trade flows. Figure 10 displays the value of importsand exports per capita in AOF, and the corresponding effective rates of taxation— obtained by dividing the value of imports (exports) by total tax revenue fromimports (exports). Trade flows per capita nearly quadrupled between the depres-sion era of the 1930s and the 1950s. However, they only double if we compare
22

the 1950s to pre-1929 levels. The increase in customs revenue is also explainedby intensification of trade taxation: export tax rates roughly doubled between the1920s and the 1950s, while import tax rates nearly tripled (figure 10, panel 2).
Figure 10: Trade flows and customs tax rates in AOF
Togo is missing for all years. Shaded areas represent World Wars.
Overall, the repartition of net revenue by source shows that British coloniesof West Africa relied more on custom duties and less on direct taxes than theirFrench neighbors (see figure 11). However, local conditions such as the fact of be-ing landlocked are an important determinant of the use of custom duties in colonialtaxation. The last panel of figure 11 shows the distribution of revenue by sourceconsidering French coastal colonies only. In AOF, custom duties were collected bythe General Government: we allocated them to colonies following the 1958 distri-bution of custom duties (when AOF no longer existed). Unsurprisingly, coastalcolonies make the bulk of total custom duties collected in the former AOF in 1958(46% for Côte d’Ivoire, 22% for Dahomey, 16% for Sénégal). When consideringonly coastal colonies, although the share of custom duties increases slightly andthe share of direct taxes decreases, the difference with British colonies remains.The period between World War II and decolonization was also a period of in-
crease in external revenue. The evolution of net deficits (net revenue minus netexpenditure, military included for British colonies) reveals 4 periods (figure 12):before WorldWar I, while French colonies were running net deficits, British colonieshad, on average, balanced public finances. This hides a great difference betweenNorthern Nigeria and other British colonies of West Africa: while in NorthernNigeria, grants in aid from the British government represented the bulk of rev-
23

Figure 11: Distribution of net revenue by source, French and British colonies
Mali (then called Soudan Français) missing in years 1922, 1928 and 1946.
enue, other British colonies were running substantial net surpluses. Then, up tothe middle of the 1920s, French and British colonies alike ran very important netsurpluses (up to 60% of net expenditure) as they were reimbursing the loans of thepreceding period. From the mid 1920s to World War II, public finances were onaverage balanced. In the late colonial period, British and French colonies of WestAfrica started running net deficits again.In the last fifteen years of colonization, net deficits corresponded to large subsi-
dies from France and Britain to their West African colonies (figure 13). In AOF,as was shown by Huillery (2014), colonies were on average a net subsidizer of theFrench government up to World War II. In the late colonial period, with the set-ting up of the FIDES, a fund dedicated to large scale infrastructure in the colonies,AOF became a net receiver of subsidies. For the post-WWII period, our resultsare somewhat different from those of Huillery (2014). While she finds that themaximum annual amount of net subsidies to AOF never exceeded 80 millions 1914
24

Figure 12: Net surplus/deficit, French and British colonies
No observation for French colonies in 1901, 1904, 1925 and 1943, for British colonies in1905. Mali (then called Soudan Français) missing in years 1922, 1928 and 1946.
francs and that the AOF was a net subsidizer of the French government for mostof the 1950s, we find much higher figure (up to 300 millions 1913 francs for theyear 1952).4
In Great Britain as well, the philosophy of colonial policies changed over the firsthalf of the century. Before World War I, freshly conquered Northern Nigeria wasstill reliant on British Treasury grants for the balancing of its budget (althoughthe other British colonies of West Africa received no grants), but the ultimate goalof British Imperial policy was self sufficiency of the colonies. In the 1920s and1930s, the idea that the British Treasury should be empowered to give financialassistance to the colonies for big infrastructure projects gradually gained ground(Constantine, 1984). Although Imperial government expenditure on colonial devel-opment remained extremely limited in the aftermath of the Colonial DevelopmentAct of 1929, the Colonial Development and Welfare Acts of 1940 and 1945 starteda policy of development aid to British colonies.The increase in net subsidies was more pronounced in French colonies, where
they represent more than 20% of total expenditure in AOF in 1949, and morethan 30% in 1952, while they are always below 10% in British colonies. This waslikely a manifestation of the different ways in which France and Britain envisionedthe future of their African empire after World War II (self-government versus
4These different results seem to be due to the different way in which we compute Frenchsubventions to the FIDES. Huillery (2014) computes them from the Ministry of Colonies’budget, in which some years are missing in the 1950s.
25

Figure 13: Net subsidies from colonizer, French and British colonies
No observation for French colonies in 1901, 1904, 1925 and 1943, for British colonies in1905. Mali (then called Soudan Français) missing in years 1922, 1928 and 1946.
assimilation).Overall, we observe a change in colonial fiscal policies in the last twenty years
of colonization: France and Britain increase both internal taxation and subsidiesto the colonies. Pinning down the exact cause of this change in policy is ar-duous, but we offer three broad mechanisms (that are not necessarily mutuallyexclusive): 1/ Political change in Europe: already in the 1930s, the view ofcolonization started shifting in policy circles, some colonial administrators callingfor higher metropolitan investments in the colonies (Sarraut, 1923; Constantine,1984). Renewed political elites after World War II might have defended a moredevelopmentalist view of colonization. 2/ State capacity building: France andBritain reaped in the 1950s the fruits of investments in fiscal capacity in earlierdecades. However, this explanation would fit with positive net subsidies from col-onizers before World War II and balanced budget after, not the opposite. 3/ Ap-peasement: face with internal (notably labor movements) and external (UnitedStates and USSR) pressure for change, France and Britain started investing in theircolonies to avoid losing their empires. However, the dismantling of the French andBritish colonial empires around 1960 did not mark a discontinuity in terms of pub-lic finances. Notably, France and Britain continued disbursing public aid primarilyto their former colonies.
26

6. Colonial legacies
One of our goals is to build and compare long series over the entire 20th cen-tury. However, finding detailed budgetary data after decolonization proves quitedifficult. Recent public finance series, such as the IMF’s Government FinanceStatistics start in the 1980s and are notoriously imperfect (Baunsgaard and Keen,2010). For French-speaking West Africa, we were able to find public finance figuresin the reports of the Franc Zone (a monetary union between France and some ofits former colonies that survived decolonization).
Figure 14: Net public expenditure per head in French-speaking West Africa overthe 20th century (in 1913 francs)
Mali (then called Soudan Français) missing in years 1922, 1928 and 1946. Guinéemissing from 1958 on, Mauritanie missing in 1976. Shaded areas represent world wars.The dashed line marks independence (1960) for every country except Guinée, whichgained independence in 1958.
In terms of public finances, independence was no breaking point. In French-speaking West Africa, after having been multiplied by more than 4 between 1940and 1955, net public expenditure per head increased by 50% between 1955 andthe beginning of the 1980s. Figure 14 clearly shows that, in terms of expenditure,the discontinuity is after World War II rather than in 1960. The last fifteen yearsof colonization inaugurated a period of dependence from external financing that
27
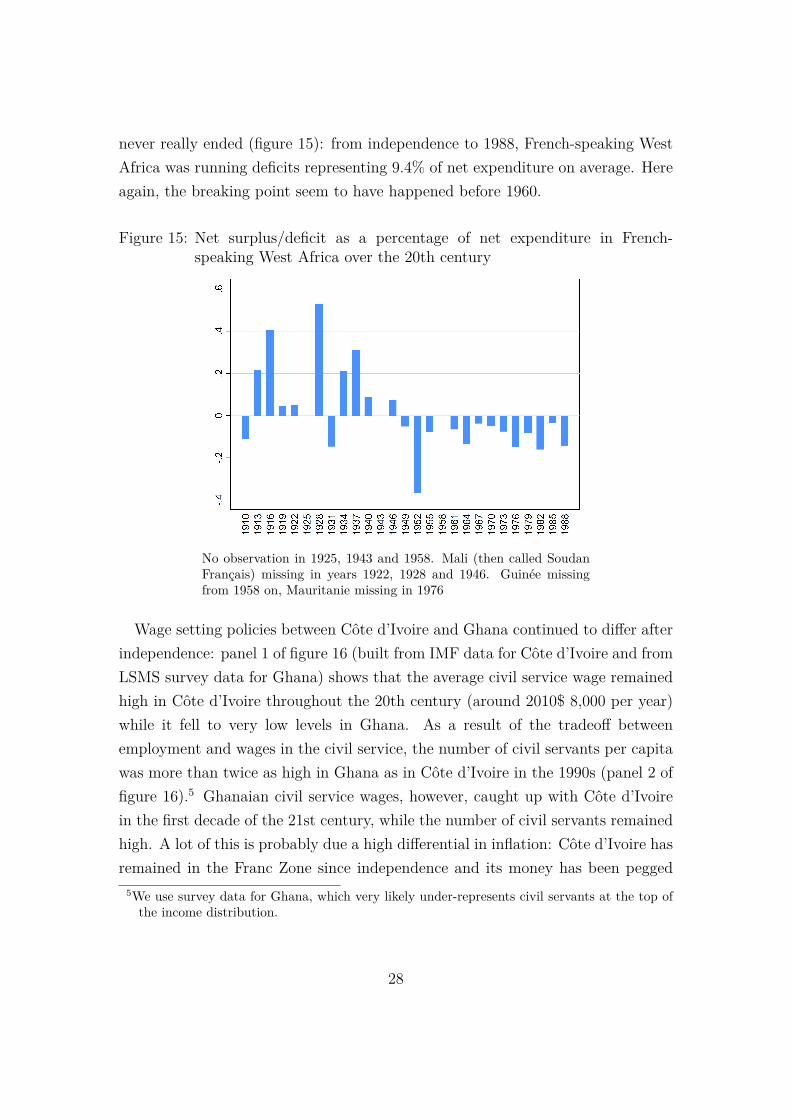
never really ended (figure 15): from independence to 1988, French-speaking WestAfrica was running deficits representing 9.4% of net expenditure on average. Hereagain, the breaking point seem to have happened before 1960.
Figure 15: Net surplus/deficit as a percentage of net expenditure in French-speaking West Africa over the 20th century
No observation in 1925, 1943 and 1958. Mali (then called SoudanFrançais) missing in years 1922, 1928 and 1946. Guinée missingfrom 1958 on, Mauritanie missing in 1976
Wage setting policies between Côte d’Ivoire and Ghana continued to differ afterindependence: panel 1 of figure 16 (built from IMF data for Côte d’Ivoire and fromLSMS survey data for Ghana) shows that the average civil service wage remainedhigh in Côte d’Ivoire throughout the 20th century (around 2010$ 8,000 per year)while it fell to very low levels in Ghana. As a result of the tradeoff betweenemployment and wages in the civil service, the number of civil servants per capitawas more than twice as high in Ghana as in Côte d’Ivoire in the 1990s (panel 2 offigure 16).5 Ghanaian civil service wages, however, caught up with Côte d’Ivoirein the first decade of the 21st century, while the number of civil servants remainedhigh. A lot of this is probably due a high differential in inflation: Côte d’Ivoire hasremained in the Franc Zone since independence and its money has been pegged
5We use survey data for Ghana, which very likely under-represents civil servants at the top ofthe income distribution.
28

to the franc (now the euro), leaving no room for adjustments through inflation.Ghana, on the other hand, has had an independent monetary policy since 1957and has known very high levels of inflation, especially in the 1970s and 1980s.
Figure 16: Civil service in Côte d’Ivoire and Ghana over the 20th century
Sources: authors’ data for the colonial period. After independence: IMF data for Côted’Ivoire and LSMS survey data for Ghana. Shaded areas represent world wars. Thedashed line marks independence of Côte d’Ivoire (1960), the dotted line independenceof Ghana (1958).
7. Conclusion
Even though we underline significant differences between French and British colo-nial policies (for instance greater reliance on direct taxation in French colonies,greater importance of education in British colonies), patterns of colonial publicfinances in French and British West Africa share more common aspects than dif-ferences. With the important exception of Nigeria, where net expenditure perhead was the lowest of all colonies considered throughout the period, it does notseem that the size of colonial states was smaller in British colonies.The striking fact is the formidable increase in net expenditure in the end of the
period, in British and French colonies alike. This increase in expenditure was madepossible by an increase in internal revenue due to booming trade flows, and higherdirect and indirect taxation rates, as well as an increase in external revenue in theform of subsidies from the colonizers. Identifying the cause of this policy change isnot straightforward, although we favor an appeasement explanation, where France
29

and Britain responded to external and internal pressure to end colonization byinvesting in their colonies in the hope to keep their empires.In terms of public finances, independence was no breaking point, so that the last
fifteen years of colonization is an important period for understanding a number offeatures of contemporary African states, such as external financing dependency.We also have some evidence that civil service wage setting policies started divergingin French and British Africa in this period.
References
Acemoglu, D., Chaves, I. N., Osafo-Kwaako, P., and Robinson, J. A.,2014a. “Indirect Rule and State Weakness in Africa: Sierra Leone in Compar-ative Perspective.” NBER Chapters, National Bureau of Economic Research,Inc.
Acemoglu, D., Johnson, S., and Robinson, J. A., 2001. “The ColonialOrigins of Comparative Development: An Empirical Investigation.” AmericanEconomic Review 91(5), 1369–1401.
Acemoglu, D., Reed, T., and Robinson, J. A., 2014b. “Chiefs: EconomicDevelopment and Elite Control of Civil Society in Sierra Leone.” Journal ofPolitical Economy 122(2), 319–368.
Acemoglu, D. and Robinson, J., 2012. Why Nations Fail: The Origins ofPower, Prosperity, and Poverty. Crown Publishing Group.
Baunsgaard, T. and Keen, M., 2010. “Tax Revenue and (or?) Trade Liberal-ization.” Journal of Public Economics 94(9–10).
Benavot, A. and Riddle, P., 1988. “The Expansion of Primary Education,1870–1940: Trends and Issues.” Sociology of Education 61(3), 191–210.
Berger, D., 2009. “Taxes, Institutions and Local Governance: Evidence from aNatural Experiment in Colonial Nigeria.” mimeo, New York University.
30
Besley, T. and Persson, T., 2009. “The Origins of State Capacity: PropertyRights, Taxation, and Politics.” American Economic Review 99(4), 1218–1244.
Besley, T. J. and Persson, T., 2013. “Taxation and Development.” CEPRDiscussion Papers 9307.
Bolt, J. and van Zanden, J. L., 2014. “The Maddison Project: collaborativeresearch on historical national accounts.” The Economic History Review 67(3),627–651.
Brown, D. S., 2000. “Democracy, Colonization, and Human Capital in Sub-Saharan Africa.” Studies in Comparative International Development 35(1), 20–40.
Cagé, J. and Gadenne, L., 2015. “Tax Revenues, Development, and the FiscalCost of Trade Liberalization, 1792–2006.” mimeo.
Cogneau, D. and Moradi, A., 2014. “Borders that Divide: Education andReligion in Ghana and Togo since Colonial Times.” Journal of Economic History74(3), 694–728.
Constantine, S., 1984. The Making of British Colonial Development Policy,1914–1940. London: Frank Cass.
Cooper, F., 1996. Decolonization and African Society: The Labor Question inFrench and British Africa. Cambridge: Cambridge University Press.
—, 2002. Africa Since 1940: The Past of the Present. New Approaches to AfricanHistory, Cambridge University Press.
Crowder, M., 1964. “Indirect Rule: French and British Style.” Africa: Journalof the International African Institute 34(3), 197–205.
Davis, L. E. and Huttenback, R. A., 1986. Mammon and the pursuit of Em-pire : the political economy of British imperialism, 1860-1912. Interdisciplinaryperspectives on modern history, Cambridge: Cambridge university press.
Delavignette, R., 1946. Service Africain. Paris: Gallimard.
31

Dimier, V., 2004. Le gouvernement des colonies, regards croisés franco-britanniques. Bruxelles: Editions de l’Université de Bruxelles.
Dupraz, Y., 2016. “Decompressing French and British colonial legacies in educa-tion: A natural experiment in Cameroon.” mimeo, Paris School of Economics.
Fajana, A., 1978. Education in Nigeria, 1842–1939: An Historical Analysis.Longman Nigeria.
Frankema, E., 2012. “The Origins of Formal Education in Sub-Saharan Africa— Was British Rule More Benign?” European Review of Economic History 16,335–355.
Frankema, E. and Jerven, M., 2014. “Writing history backwards or sideways:towards a consensus on African population, 1850–2010.” Economic History Re-view 67(4), 907–931.
Frankema, E. and van Waijenburg, M., 2012. “Structural Impediments toAfrican Growth? New Evidence from Real Wages in British Africa, 1880–1965.”The Journal of Economic History 72(04), 895–926.
—, 2014. “Metropolitan blueprints of colonial taxation? Lessons from fiscal capac-ity building in British and French Africa, c. 1880–1940.” The Journal of AfricanHistory 55(3), 371–400.
Gardner, L., 2012. Taxing Colonial Africa: The Political Economy of BritishImperial Rule. Oxford: Oxford University Press.
Geschiere, P., 1993. “Chiefs and colonial rule in Cameroon: inventing chief-taincy, French and British Style.” Africa: Journal of the International AfricanInstitute 63(02), 151–175.
Gifford, P. and Louis, W. R., 1971. France and Britain in Africa: ImperialRivalry and Colonial Rule. New Haven and London: Yale University Press.
Gifford, P. and Weiskel, T. C., 1971. “African education in a colonial context:French and British styles.” In Gifford and Louis (1971), chap. 19, pages 663–711.
32
Grier, R. M., 1999. “Colonial Legacies and Economic Growth.” Public Choice98, 317–335.
Hailey, L., 1938. An African Survey, a study of problems arising in Africa Southof Sahara. London, New York, Toronto: Oxford University Press.
—, 1950. Native administration in the British African territories. London: H.M.Stationery Office.
Hargreaves, J. D., 1971. “British and French Imperialism in West Africa,1885–1898.” In Gifford and Louis (1971), chap. 7, pages 261–282.
Herbst, J., 2000. States and Power in Africa: Comparative Lessons in Authorityand Control. Princeton Studies in International History and Politics, PrincetonUniversity Press.
Huillery, E., 2009. “History Matters: The Long-Term Impact of Colonial Pub-lic Investments in French West Africa.” American Economic Journal: AppliedEconomics 1(2), 176–215.
—, 2014. “The Black Man’s Burden: The Cost of Colonization of French WestAfrica.” The Journal of Economic History 74(01), 1–38.
Jerven, M., 2012. “Future challenges in measuring Africa’s past: Lessons fromestimating GDP for the Gold Coast, 1891–1954.” African economic historyworking paper series 3/2012.
La Porta, R., Lopez-de Silanes, F., Shleifer, A., and Vishny, R. W.,1998. “Law and Finance.” Journal of Political Economy 106(6), 1113–1155.
—, 1999. “The Quality of Government.” Journal of Law, Economics and Organi-zation 15(1), 222–79.
Labouret, H., 1934. “Protectorat ou administration directe. Direct or indirectrule.” Afrique française .
London and Cambridge Economic Service and Alford, R., 1973. TheBritish Economy: Key Statistics, 1900–1970. Times Newspapers.
33

Lugard, F. D., 1922. The Dual Mandate in British Tropical Africa. London:William Blackwood and Sons.
Mair, L., 1936. Native Policies in Africa. London: Routledge.
Mamdani, M., 1996. Citizen and Subject: Contemporary Africa and the Legacyof Late Colonialism. Princeton: Princeton University Press.
Michalopoulos, S. and Papaioannou, E., 2014. “National Institutions andSubnational Development in Africa.” Quarterly Journal of Economics 129(1).
Perham, M., 1967. Colonial sequence, 1930–1949: a chronological commentaryupon British colonial policy especially in Africa. London: Methuen.
Sarraut, A., 1923. La mise en valeur des colonies françaises. Paris: Payot.
Thioub, I., 1994. “Économie coloniale et rémunération de la force de travail :le salaire du manoeuvre à Dakar de 1930 à 1954.” Revue française d’histoired’outre-mer 81(305).
van Waijenburg, M., 2015. “Financing the African colonial State: The revenueimperative and forced labour.” African economic history working paper series20/2015.
Villa, P., 1994. “Un siècle de données macroéconomiques.” INSEE-Résultats n.303–304 (série économie générale n. 86–87).
34

Appendix
A. Comparison of pairs of geographical neighbors
Figure A.1: Total net expenditure per head in pairs of geographical neighbors
Shaded areas represent world wars.
35

Figure A.2: Share of education expenditure in pairs of geographical neighbors
Shaded areas represent world wars.
36