Embed Size (px)
Citation preview
AFRICAN FUTURES PAPERKnowledge empowers Afr ica! Le savoir émancipe l’Afr ique!
www.issafrica.org | www.ifs.du.edu
POPULATION FUTURES:REVISITING SOUTH AFRICA’S
NATIONAL DEVELOPMENT PLAN 2030Ara Go, Jonathan Moyer, Mickey Rafa, and Julia Schünemann
SUMMARYUnderstanding the underlying dynamics of population change is critical for national planning. This analysis explores South Africa’s fertility, mortality and migration outlooks, with a particular emphasis on the uncertainty surrounding migration. Using the International Futures (IFs) model and data from the South African 2011 National Census data, we simulated three potential population futures for South Africa to 2030 and compare these to the figures in the National Development Plan (NDP) 2030. According to our mid-range forecasts, by 2030 South Africa’s population is projected to increase to:
64,4 million with rapidly declining in-migration 66,4 million with relatively stable in-migration 68,8 million with rapidly increasing in-migration
Apart from being much higher, this range of potential futures in 2030 is much wider than the one set out in the NDP. In a second step, our extended analysis up to 2050 explores the impacts of these scenarios in the longer term. There we find an even greater range of uncertainty to be considered by national planners and policy makers in South Africa. Using the IFs Base Case, we conclude with an exploration of forecasts at the provincial level and find a higher baseline forecast than the NDP for many of South Africa’s provinces,
most notably for the Eastern Cape, Gauteng, KwaZulu-Natal and the Western Cape. These findings are important at the provincial and national level, because the demographic profile of a population has implications across all areas of public policy, including service delivery, employment, education, and healthcare.
THIS SERIES This paper is the second in a three-part series, the goal of which is to test the central planning assumptions that inform South Africa’s NDP 2030. The fi rst brief in the series analysed the feasibility of the NDP’s economic growth rate targets and explored some of the associated human development targets. The forthcoming third brief will explore the implications of global shifts in energy sources and technologies for South Africa, including the increasing use of hydraulic fracturing (also known as ‘fracking’).1
INTRODUCTIONThe current brief explores reasonable population scenarios for South Africa at the national and provincial levels up to 2050 by analysing trends in fertility, mortality, and migration. The analysis utilises the International Futures (IFs) software to produce integrated population forecasts for South Africa and compares IFs forecasts with forecasts from other authoritative sources, including the NDP population projections. We explore the IFs Base Case and two alternative population scenarios for South
OCTOBER 2013 No. 7
1
2
Africa, with a primary focus on potential migration futures. The analysis concludes with the IFs Base Case population forecasts at the provincial level in order to explore the implications of current interprovincial and international migration trends on the future of South Africa’s provinces. Through this analysis we hope to contribute to the discussion of South Africa’s future and the associated policy choices confronting the country over the coming decades. Our forecasts present other plausible scenarios beyond those in South Africa’s NDP 2030 and could have substantial implications for the work of the National Planning Commission (NPC).
THE NATIONAL DEVELOPMENT PLAN 2030The NDP 2030 aims to reduce poverty and eliminate inequality by 2030. These two overarching goals and the targets set to help achieve them are the result of a long process of analysis and consultation undertaken by the Commission. Its Diagnostic Report outlined its view of South Africa’s achievements and shortcomings since 1994.2 The report identified a failure to implement policies and an absence of broad partnership as the main reasons for slow progress, and set out nine primary challenges to future growth. These include high levels of unemployment, poor quality of school education for black students, deficiencies in infrastructure, spatial divides that compromise inclusive development, overreliance of the economy on resources, shortcomings in the public health system and public services in general, high corruption levels, and a divided society.
To address these challenges, the NDP 2030 sets ambitious targets and lays the framework to guide key choices and actions for their achievement. The targets span a broad range of key systems that impact human development, with raising employment, improving education, and building government capacity to implement development policy standing out as high priorities. Population forecasts at national and provincial level are foundational to the work undertaken by the Commission for it impacts upon service delivery and infrastructure targets at all levels.
POPULATION AND PLANNINGUnderstanding demographic trends such as the size and structure of a country’s population is an important aspect of government planning. Public sector investments that are guided by such information range from employment and retirement to education and healthcare.3 The NPC fully acknowledges that ‘ignorance of demographic trends can result in a
serious misallocation of resources and inappropriate interventions’, and that, ‘if policy interventions are informed by current and projected demographic profiles then programmes to improve health, education and skills can be properly targeted, and the appropriate services and infrastructure provided’.4 The good news is that, unlike economic growth rate volatility, demographic trends are relatively stable over time and can be forecasted with a relatively high level of certainty for the near and medium term, meaning that planning to meet population needs is not only important but also possible.
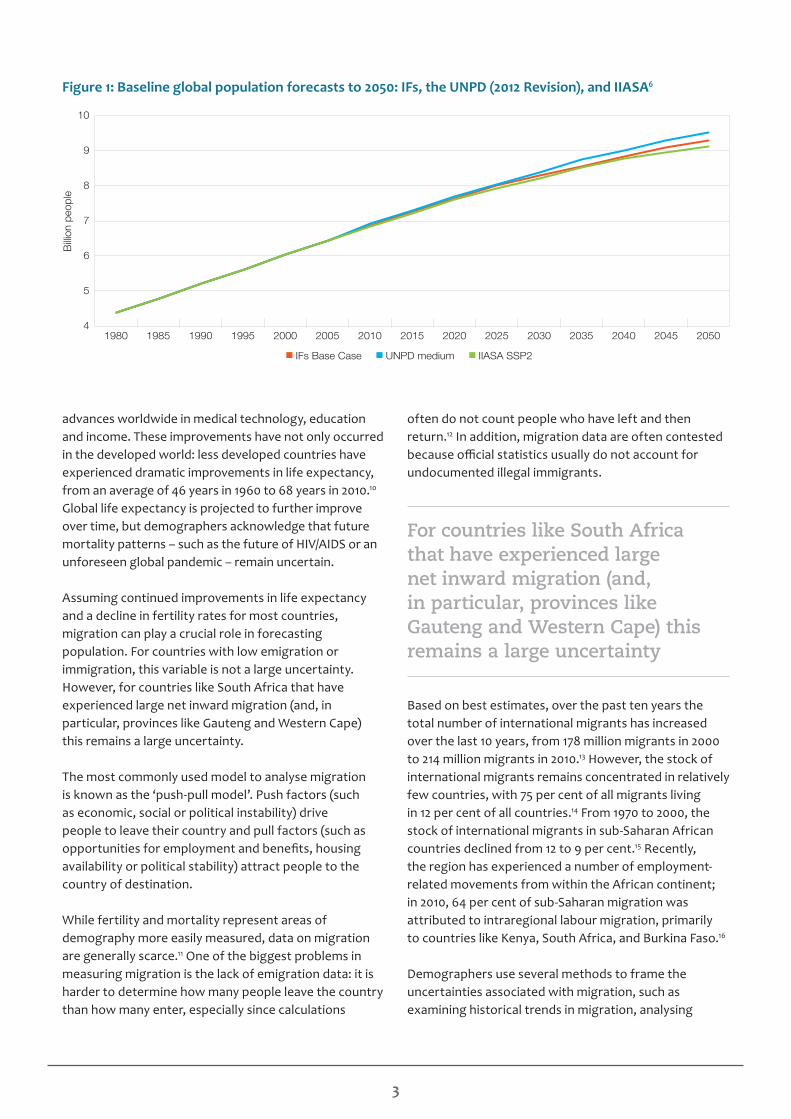
At the global level, several institutions have been forecasting population size and other characteristics for the world and regions as well as for individual countries. The United Nations Population Division (UNPD) has produced population projections with global coverage on a regular basis since the 1950s. The World Bank, the United States Census Bureau (USCB) and the International Institute for Applied Systems Analysis (IIASA) have also produced forecasts of the global population.5 Each forecasting institution has its own model with varying methodologies and assumptions about reality, resulting in a range of forecast results. The graph below compares the results of three different baseline global population forecasts: the UNPD’s medium-fertility scenario; IIASA’s second Shared Socioeconomic Pathway (SSP2), sometimes called its Middle of the Road pathway; and the IFs Base Case, which is explained in detail in this policy brief’s subsequent section.
Modelling demographic trends requires a representation of the three drivers of population change – fertility, mortality and migration. Fertility is most commonly expressed as the total fertility rate (TFR), i.e. the average number of children a woman would be expected to give birth to by the end of her reproductive years. While it obviously has an impact on immediate population growth through births, it can also have a very big effect on long-term population growth by changing future generations’ reproductive capacity. This phenomenon is particularly evident in less developed regions where fertility levels remain high.7 Global fertility has declined consistently across time and most demographers assume that it will stabilise at or around two children per woman, though this is not certain.8
Mortality is generally measured by life expectancy (LE) at birth, indicating the average number of years that newborn infants can expect to live based on current conditions.9 Life expectancy has increased globally for the past half-century, due in large part to continued
3
advances worldwide in medical technology, education and income. These improvements have not only occurred in the developed world: less developed countries have experienced dramatic improvements in life expectancy, from an average of 46 years in 1960 to 68 years in 2010.10 Global life expectancy is projected to further improve over time, but demographers acknowledge that future mortality patterns – such as the future of HIV/AIDS or an unforeseen global pandemic – remain uncertain.
Assuming continued improvements in life expectancy and a decline in fertility rates for most countries, migration can play a crucial role in forecasting population. For countries with low emigration or immigration, this variable is not a large uncertainty. However, for countries like South Africa that have experienced large net inward migration (and, in particular, provinces like Gauteng and Western Cape) this remains a large uncertainty.
The most commonly used model to analyse migration is known as the ‘push-pull model’. Push factors (such as economic, social or political instability) drive people to leave their country and pull factors (such as opportunities for employment and benefits, housing availability or political stability) attract people to the country of destination.
While fertility and mortality represent areas of demography more easily measured, data on migration are generally scarce.11 One of the biggest problems in measuring migration is the lack of emigration data: it is harder to determine how many people leave the country than how many enter, especially since calculations
often do not count people who have left and then return.12 In addition, migration data are often contested because official statistics usually do not account for undocumented illegal immigrants.
For countries like South Africa that have experienced large net inward migration (and, in particular, provinces like Gauteng and Western Cape) this remains a large uncertainty
Based on best estimates, over the past ten years the total number of international migrants has increased over the last 10 years, from 178 million migrants in 2000 to 214 million migrants in 2010.13 However, the stock of international migrants remains concentrated in relatively few countries, with 75 per cent of all migrants living in 12 per cent of all countries.14 From 1970 to 2000, the stock of international migrants in sub-Saharan African countries declined from 12 to 9 per cent.15 Recently, the region has experienced a number of employment-related movements from within the African continent; in 2010, 64 per cent of sub-Saharan migration was attributed to intraregional labour migration, primarily to countries like Kenya, South Africa, and Burkina Faso.16
Demographers use several methods to frame the uncertainties associated with migration, such as examining historical trends in migration, analysing
Figure 1: Baseline global population forecasts to 2050: IFs, the UNPD (2012 Revision), and IIASA6
1980 1985 1990 1995 2000 2005 2010 2015 2020 2025 2030 2035 2040 2045 2050
10
9
8
7
6
5
4
IFs Base Case UNPD medium IIASA SSP2
Billi
on p
eopl
e
4
results from previous projections, and estimating the probability that future migration flows will fall within a certain range.17 Even though there is no accurate way to characterise uncertainties in general, the most common approach is to present a projection assumed to be the ‘most likely’ outcome, which is comparable to the IFs Base Case, and some alternative scenarios that assume higher or lower variants.
UNDERSTANDING INTERNATIONAL FUTURES: A TOOL FOR EXPLORING POPULATION FUTURES The International Futures (IFs) tool models relationships across variables from a wide range of key global systems for 186 countries from 2010 to 2100. In the model, relationships are structured in the model in two interconnected ways: first, by leveraging a very large set of historical data series (nearly 2 500 series in the most recent version of the model), and second, by relying heavily on extant academic literature. The model allows leaders and policymakers to shape reasonable expectations about global, regional and/or country-specific change and continuity and to formulate reasonable yet aggressive policy choices for long-term strategic planning initiatives. It is important to bear in mind that IFs forecasts are highly contingent scenarios – not predictions.
The IFs model allows leaders and policymakers to shape reasonable expectations about global, regional and/or country-specific change and continuity and to formulate reasonable yet aggressive policy choices for long-term strategic planning initiatives
IFs allows users to perform three types of analysis. First, historical trends and relationships can be analysed to understand how a country has developed over time. Second, these relationships are formalised in the model to produce Base Case forecasts. These initial forecasts – integrated across all systems covered in IFs – are useful indicators of where a country seems to be heading under current circumstances and policies and in the absence of major shocks to the system (wars, pandemics etc.). Third, scenario analysis augments the Base Case
analysis by exploring the leverage that policymakers have to push systems to more desirable outcomes.
The IFs Base Case is a collection of central tendency forecasts that represent a scenario of how the future may unfold. The Base Case assumes no major paradigm shifts, policy changes or ‘black swans’ (very low probability but high impact events, such as a global pandemic or a nuclear war). Although the Base Case generally demonstrates continuity with historical patterns, it provides a structure that can also generate a wide range of non-linear, dynamic, and endogenous forecasts rather than just a simple linear extrapolation of historical trajectories and current trends.18 Given that the Base Case is built from initial conditions of all historical variables and is periodically analysed and assessed in comparison to many other forecasts, it can be a good starting point to carry out scenario analysis and construct alternative future scenarios. Users can build their own alternative scenarios to the IFs Base Case or other forecasts by altering parameters within the system.19
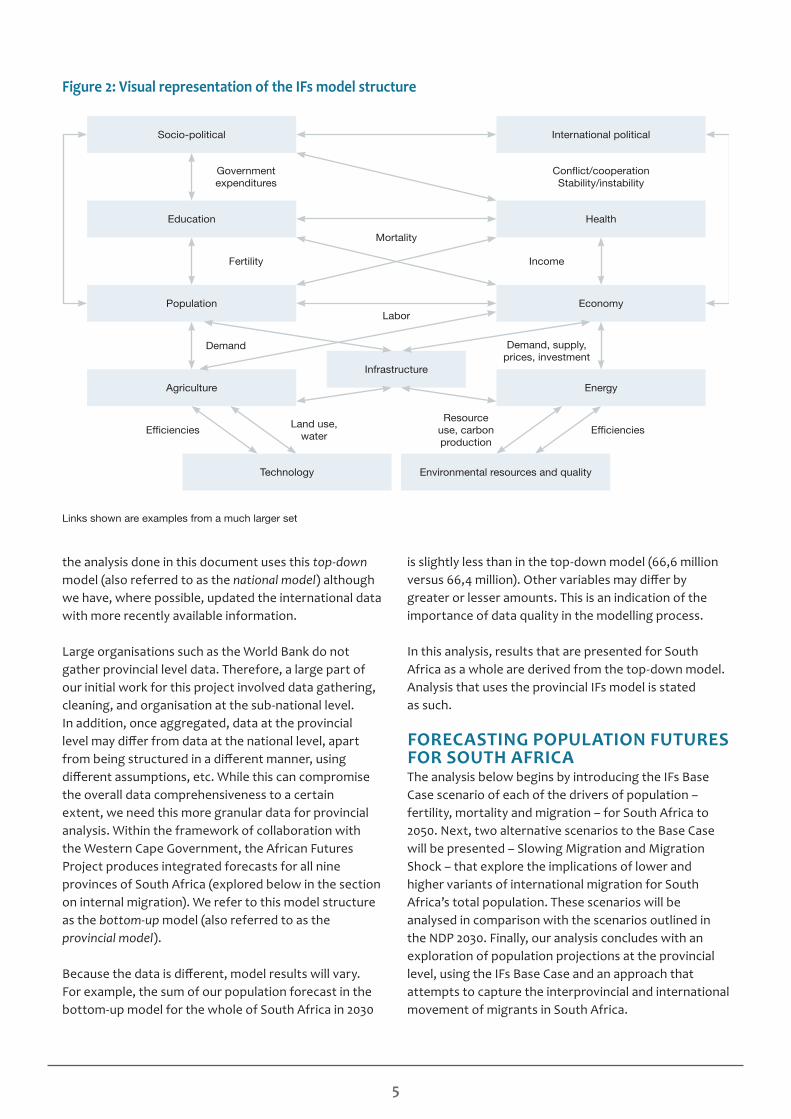
The population module in IFs represents 22 age-sex cohorts to age 100+ in a standard cohort-component system structure. It calculates change in cohort-specific fertility of households in response to income, education, infant mortality and contraception use. Mortality rates are a function of income, income distribution, assumptions about technological change, and proximate drivers of health outcomes (like smoking, obesity and environmental conditions). IFs represents the impact of morbidity and mortality on each age cohort for communicable disease, non communicable disease and injuries broken down into 15 death categories. The module also represents migration, which ties to flows of remittances. Lastly, because IFs is structured as an integrated assessment model with dynamically interacting sub-systems, changes in population have an impact on the forecasts of each sub-system in the model. Figure 2 illustrates the integrated structure of IFs.
The IFs tool was originally structured at a country level. Most of the data for this national-level model is taken from standard international organisation databases (World Bank, United Nations, International Monetary Fund, etc.). This international data often originates from national sources, and much of the South African data can be traced back to Statistics South Africa (Stats SA) although there may be time lag with the inclusion of more current data, such as for the 2011 census. Some of
5
the analysis done in this document uses this top-down model (also referred to as the national model) although we have, where possible, updated the international data with more recently available information.
Large organisations such as the World Bank do not gather provincial level data. Therefore, a large part of our initial work for this project involved data gathering, cleaning, and organisation at the sub-national level. In addition, once aggregated, data at the provincial level may differ from data at the national level, apart from being structured in a different manner, using different assumptions, etc. While this can compromise the overall data comprehensiveness to a certain extent, we need this more granular data for provincial analysis. Within the framework of collaboration with the Western Cape Government, the African Futures Project produces integrated forecasts for all nine provinces of South Africa (explored below in the section on internal migration). We refer to this model structure as the bottom-up model (also referred to as the provincial model).
Because the data is different, model results will vary. For example, the sum of our population forecast in the bottom-up model for the whole of South Africa in 2030
is slightly less than in the top-down model (66,6 million versus 66,4 million). Other variables may differ by greater or lesser amounts. This is an indication of the importance of data quality in the modelling process.
In this analysis, results that are presented for South Africa as a whole are derived from the top-down model. Analysis that uses the provincial IFs model is stated as such.
FORECASTING POPULATION FUTURES FOR SOUTH AFRICAThe analysis below begins by introducing the IFs Base Case scenario of each of the drivers of population – fertility, mortality and migration – for South Africa to 2050. Next, two alternative scenarios to the Base Case will be presented – Slowing Migration and Migration Shock – that explore the implications of lower and higher variants of international migration for South Africa’s total population. These scenarios will be analysed in comparison with the scenarios outlined in the NDP 2030. Finally, our analysis concludes with an exploration of population projections at the provincial level, using the IFs Base Case and an approach that attempts to capture the interprovincial and international movement of migrants in South Africa.
Figure 2: Visual representation of the IFs model structure
Socio-political International political
Education Health
Population Economy
Agriculture Energy
Infrastructure
Technology Environmental resources and quality
Governmentexpenditures
Mortality
Fertility Income
Demand, supply, prices, investment
Demand
Land use, water
Links shown are examples from a much larger set
Resource use, carbon production
Ef�cienciesEf�ciencies
Labor
Con�ict/cooperationStability/instability
6
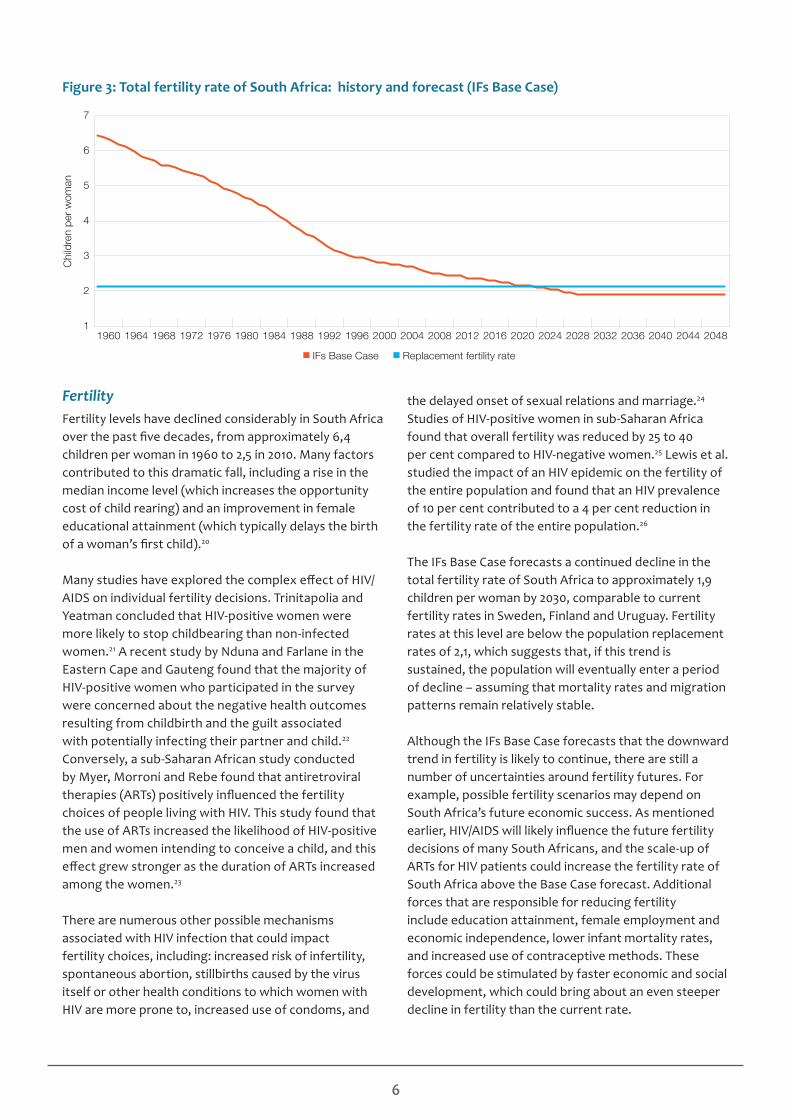
FertilityFertility levels have declined considerably in South Africa over the past five decades, from approximately 6,4 children per woman in 1960 to 2,5 in 2010. Many factors contributed to this dramatic fall, including a rise in the median income level (which increases the opportunity cost of child rearing) and an improvement in female educational attainment (which typically delays the birth of a woman’s first child).20
Many studies have explored the complex effect of HIV/AIDS on individual fertility decisions. Trinitapolia and Yeatman concluded that HIV-positive women were more likely to stop childbearing than non-infected women.21 A recent study by Nduna and Farlane in the Eastern Cape and Gauteng found that the majority of HIV-positive women who participated in the survey were concerned about the negative health outcomes resulting from childbirth and the guilt associated with potentially infecting their partner and child.22 Conversely, a sub-Saharan African study conducted by Myer, Morroni and Rebe found that antiretroviral therapies (ARTs) positively influenced the fertility choices of people living with HIV. This study found that the use of ARTs increased the likelihood of HIV-positive men and women intending to conceive a child, and this effect grew stronger as the duration of ARTs increased among the women.23
There are numerous other possible mechanisms associated with HIV infection that could impact fertility choices, including: increased risk of infertility, spontaneous abortion, stillbirths caused by the virus itself or other health conditions to which women with HIV are more prone to, increased use of condoms, and
the delayed onset of sexual relations and marriage.24 Studies of HIV-positive women in sub-Saharan Africa found that overall fertility was reduced by 25 to 40 per cent compared to HIV-negative women.25 Lewis et al. studied the impact of an HIV epidemic on the fertility of the entire population and found that an HIV prevalence of 10 per cent contributed to a 4 per cent reduction in the fertility rate of the entire population.26
The IFs Base Case forecasts a continued decline in the total fertility rate of South Africa to approximately 1,9 children per woman by 2030, comparable to current fertility rates in Sweden, Finland and Uruguay. Fertility rates at this level are below the population replacement rates of 2,1, which suggests that, if this trend is sustained, the population will eventually enter a period of decline – assuming that mortality rates and migration patterns remain relatively stable.
Although the IFs Base Case forecasts that the downward trend in fertility is likely to continue, there are still a number of uncertainties around fertility futures. For example, possible fertility scenarios may depend on South Africa’s future economic success. As mentioned earlier, HIV/AIDS will likely influence the future fertility decisions of many South Africans, and the scale-up of ARTs for HIV patients could increase the fertility rate of South Africa above the Base Case forecast. Additional forces that are responsible for reducing fertility include education attainment, female employment and economic independence, lower infant mortality rates, and increased use of contraceptive methods. These forces could be stimulated by faster economic and social development, which could bring about an even steeper decline in fertility than the current rate.
Figure 3: Total fertility rate of South Africa: history and forecast (IFs Base Case)
1960 1964 1968 1972 1976 1980 1984 1988 1992 1996 2000 2004 2008 2012 2016 2020 2024 2028 2032 2036 2040 2044 2048
7
6
5
4
3
2
1
IFs Base Case Replacement fertility rate
Chi
ldre
n pe
r w
oman
7
Mortality
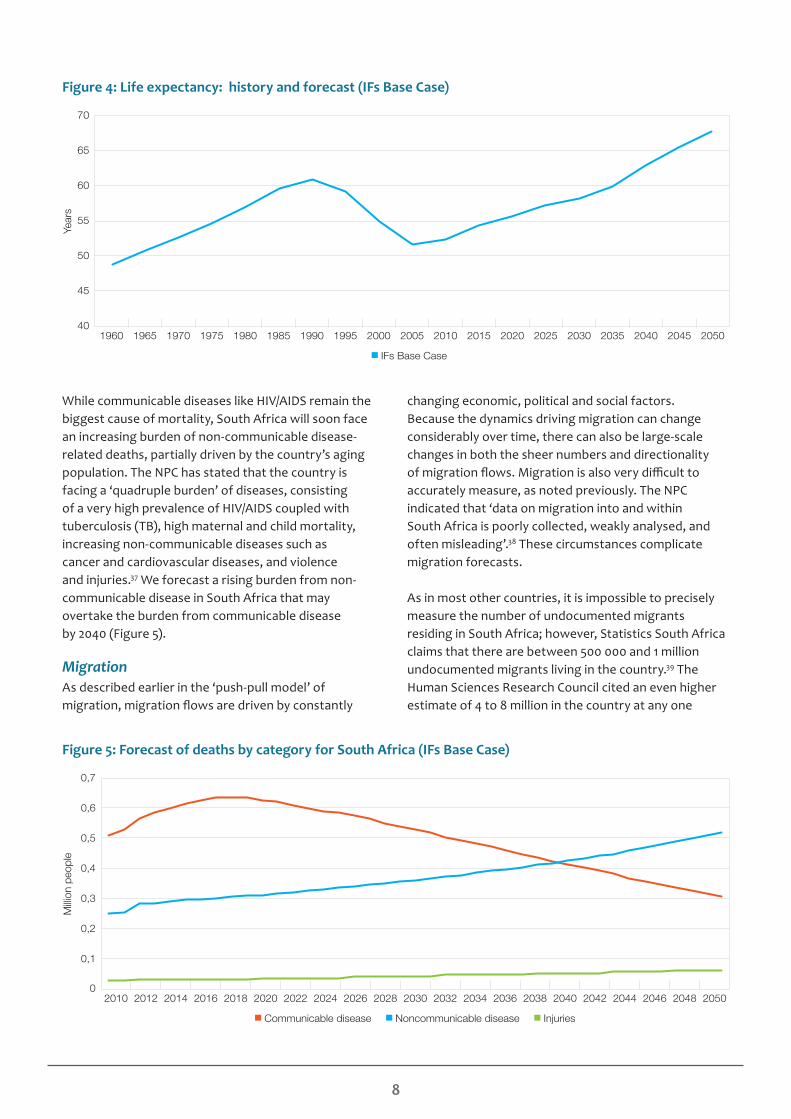
South Africa’s average life expectancy improved substantially between 1960 and 1990, from approximately 49 to 60 years according to data from the UN. However, HIV/AIDS reversed this trend dramatically, with life expectancy plummeting to approximately 51,7 years by 2005. Although this rapid decline has been followed by some recovery since 2005, South Africa’s life expectancy of 52,4 years in 2010 still placed it 168th among the 186 countries included in IFs, and significantly below other middle-income countries such as China, Brazil and Egypt.27 Even among African countries, South Africa ranked 35th in life expectancy in 2010, and the gap between South Africa and Libya – the country that currently shows the highest life expectancy in Africa – is more than 20 years.
Due in large part to the introduction and continued scale-up of ARTs, the life expectancy of the average South African has improved since 2005
The implementation of ARTs in South Africa at the turn of the 21st century marked a decisive change in the fight against the HIV/AIDS epidemic. ARTs have become more accessible to patients due to the medication’s declining cost and increasing resources, such as health facilities providing ARTs and nurses trained and certified to initiate ARTs in the absence of a doctor.28 Because of these recent improvements, the total number of patients receiving ARTs in the country has increased from 923 000 in February 2010 to 1,9 million to date, doubling within three years.29
An increase in infant mortality in the late 1990s was another avenue through which the HIV/AIDS epidemic affected life expectancy. Recently, however, infant mortality rates have been on the decline, due in part to the implementation of ART programmes that prevent the vertical transmission of HIV from mother to child.30 Data suggest that infant mortality last peaked at 31 deaths per 1 000 in 2001 and had dropped to approximately 20 deaths per 1 000 in 2010.31 The Base Case suggests that this positive trend will continue, partially driven by continued improvements in HIV/AIDS treatment.
Recent studies have confirmed the improvements in life expectancy of HIV patients due to the implementation of ARTs on a broader scale. Leigh F. Johnson et al. found that when an HIV positive patient began ARTs sooner, their life expectancy increased to the level equivalent of 80 per cent of the average life expectancy of the HIV-negative population.32 This study showed that the life expectancy of HIV patients could be dramatically increased with the early adoption of ARTs.33 One recent study in KwaZulu-Natal found that life expectancy in the general population improved from 49,2 years in 2003 to 60,5 in 2011 – an increase of nearly 11 years of life expectancy achieved in only eight years. This rapid improvement coincided with the implementation of an ART programme in the public health sector.34
Due in large part to the introduction and continued scale-up of ARTs, the life expectancy of the average South African has improved since 2005. The data in Figure 4 are taken from the United Nations Population Division35 (UNPD) and they are significantly lower than current estimates from Statistics South Africa.36 Because it takes time for data to filter through from national statistical offices to international offices, the top-down model likely under-estimates current and future life expectancy. That said, current values produced from Stats South Africa are also likely to be revised by the UNPD. The current IFs Base Case (Figure 4) suggests that life expectancy will continue to increase to 58 years by 2030 –far below the NDP target of 70 years. This is based on a conservative initialization and forecast.
The course of HIV/AIDS remains a great uncertainty in terms of South Africa’s future development. The extent of the epidemic’s impact will largely depend on political commitment to HIV/AIDS programmes, the efficacy of treatment (ARTs), and the impact of transmission prevention methods like contraceptives. The effective-ness of HIV medication has improved so rapidly in recent years that existing forecasts of life expectancy (including the IFs Base Case) might have substantially underestimated the effects of ART scale-up on survival in HIV-affected populations. There is a possibility that if the right policies are put in place and the efficacy of ARTs continues to improve, the positive trend in life expectancy will be accelerated in comparison to the forecasts projected in the Base Case that could achieve the NDP target.
8
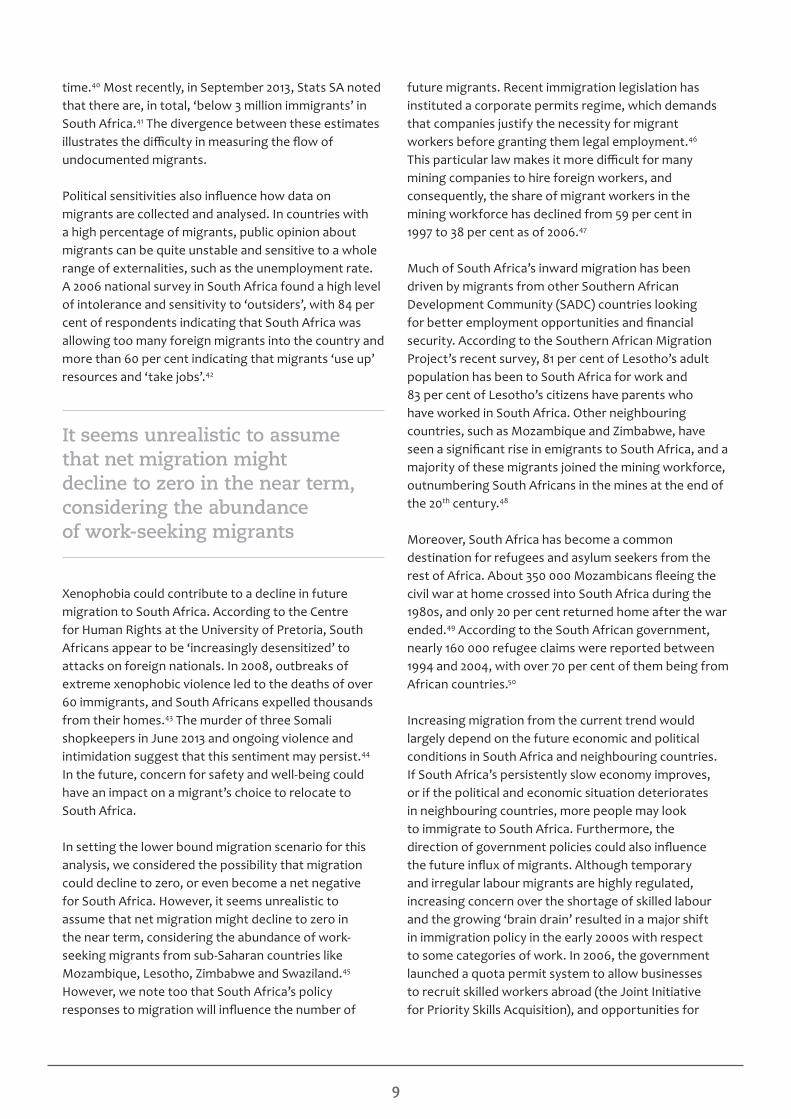
While communicable diseases like HIV/AIDS remain the biggest cause of mortality, South Africa will soon face an increasing burden of non-communicable disease-related deaths, partially driven by the country’s aging population. The NPC has stated that the country is facing a ‘quadruple burden’ of diseases, consisting of a very high prevalence of HIV/AIDS coupled with tuberculosis (TB), high maternal and child mortality, increasing non-communicable diseases such as cancer and cardiovascular diseases, and violence and injuries.37 We forecast a rising burden from non-communicable disease in South Africa that may overtake the burden from communicable disease by 2040 (Figure 5).
MigrationAs described earlier in the ‘push-pull model’ of migration, migration flows are driven by constantly
changing economic, political and social factors. Because the dynamics driving migration can change considerably over time, there can also be large-scale changes in both the sheer numbers and directionality of migration flows. Migration is also very difficult to accurately measure, as noted previously. The NPC indicated that ‘data on migration into and within South Africa is poorly collected, weakly analysed, and often misleading’.38 These circumstances complicate migration forecasts.
As in most other countries, it is impossible to precisely measure the number of undocumented migrants residing in South Africa; however, Statistics South Africa claims that there are between 500 000 and 1 million undocumented migrants living in the country.39 The Human Sciences Research Council cited an even higher estimate of 4 to 8 million in the country at any one
Figure 5: Forecast of deaths by category for South Africa (IFs Base Case)
2010 2012 2014 2016 2018 2020 2022 2024 2026 2028 2030 2032 2034 2036 2038 2040 2042 2044 2046 2048 2050
0,1
0,7
0,6
0,5
0,4
0,3
0,2
0
Communicable disease Noncommunicable disease Injuries
Milli
on p
eopl
e
Figure 4: Life expectancy: history and forecast (IFs Base Case)
1960 1965 1970 1975 1980 1985 1990 1995 2000 2005 2010 2015 2020 2025 2030 2035 2040 2045 2050
70
65
60
55
50
45
40
IFs Base Case
Year
s
9
time.40 Most recently, in September 2013, Stats SA noted that there are, in total, ‘below 3 million immigrants’ in South Africa.41 The divergence between these estimates illustrates the difficulty in measuring the flow of undocumented migrants.
Political sensitivities also influence how data on migrants are collected and analysed. In countries with a high percentage of migrants, public opinion about migrants can be quite unstable and sensitive to a whole range of externalities, such as the unemployment rate. A 2006 national survey in South Africa found a high level of intolerance and sensitivity to ‘outsiders’, with 84 per cent of respondents indicating that South Africa was allowing too many foreign migrants into the country and more than 60 per cent indicating that migrants ‘use up’ resources and ‘take jobs’.42
It seems unrealistic to assume that net migration might decline to zero in the near term, considering the abundance of work-seeking migrants
Xenophobia could contribute to a decline in future migration to South Africa. According to the Centre for Human Rights at the University of Pretoria, South Africans appear to be ‘increasingly desensitized’ to attacks on foreign nationals. In 2008, outbreaks of extreme xenophobic violence led to the deaths of over 60 immigrants, and South Africans expelled thousands from their homes.43 The murder of three Somali shopkeepers in June 2013 and ongoing violence and intimidation suggest that this sentiment may persist.44 In the future, concern for safety and well-being could have an impact on a migrant’s choice to relocate to South Africa.
In setting the lower bound migration scenario for this analysis, we considered the possibility that migration could decline to zero, or even become a net negative for South Africa. However, it seems unrealistic to assume that net migration might decline to zero in the near term, considering the abundance of work-seeking migrants from sub-Saharan countries like Mozambique, Lesotho, Zimbabwe and Swaziland.45 However, we note too that South Africa’s policy responses to migration will influence the number of
future migrants. Recent immigration legislation has instituted a corporate permits regime, which demands that companies justify the necessity for migrant workers before granting them legal employment.46 This particular law makes it more difficult for many mining companies to hire foreign workers, and consequently, the share of migrant workers in the mining workforce has declined from 59 per cent in 1997 to 38 per cent as of 2006.47
Much of South Africa’s inward migration has been driven by migrants from other Southern African Development Community (SADC) countries looking for better employment opportunities and financial security. According to the Southern African Migration Project’s recent survey, 81 per cent of Lesotho’s adult population has been to South Africa for work and 83 per cent of Lesotho’s citizens have parents who have worked in South Africa. Other neighbouring countries, such as Mozambique and Zimbabwe, have seen a significant rise in emigrants to South Africa, and a majority of these migrants joined the mining workforce, outnumbering South Africans in the mines at the end of the 20th century.48
Moreover, South Africa has become a common destination for refugees and asylum seekers from the rest of Africa. About 350 000 Mozambicans fleeing the civil war at home crossed into South Africa during the 1980s, and only 20 per cent returned home after the war ended.49 According to the South African government, nearly 160 000 refugee claims were reported between 1994 and 2004, with over 70 per cent of them being from African countries.50
Increasing migration from the current trend would largely depend on the future economic and political conditions in South Africa and neighbouring countries. If South Africa’s persistently slow economy improves, or if the political and economic situation deteriorates in neighbouring countries, more people may look to immigrate to South Africa. Furthermore, the direction of government policies could also influence the future influx of migrants. Although temporary and irregular labour migrants are highly regulated, increasing concern over the shortage of skilled labour and the growing ‘brain drain’ resulted in a major shift in immigration policy in the early 2000s with respect to some categories of work. In 2006, the government launched a quota permit system to allow businesses to recruit skilled workers abroad (the Joint Initiative for Priority Skills Acquisition), and opportunities for
10
workers in some specialised fields were promoted by South African embassies abroad.51 If reforms are enacted that permit more legal employment of migrants, then immigration to South Africa is likely to increase.
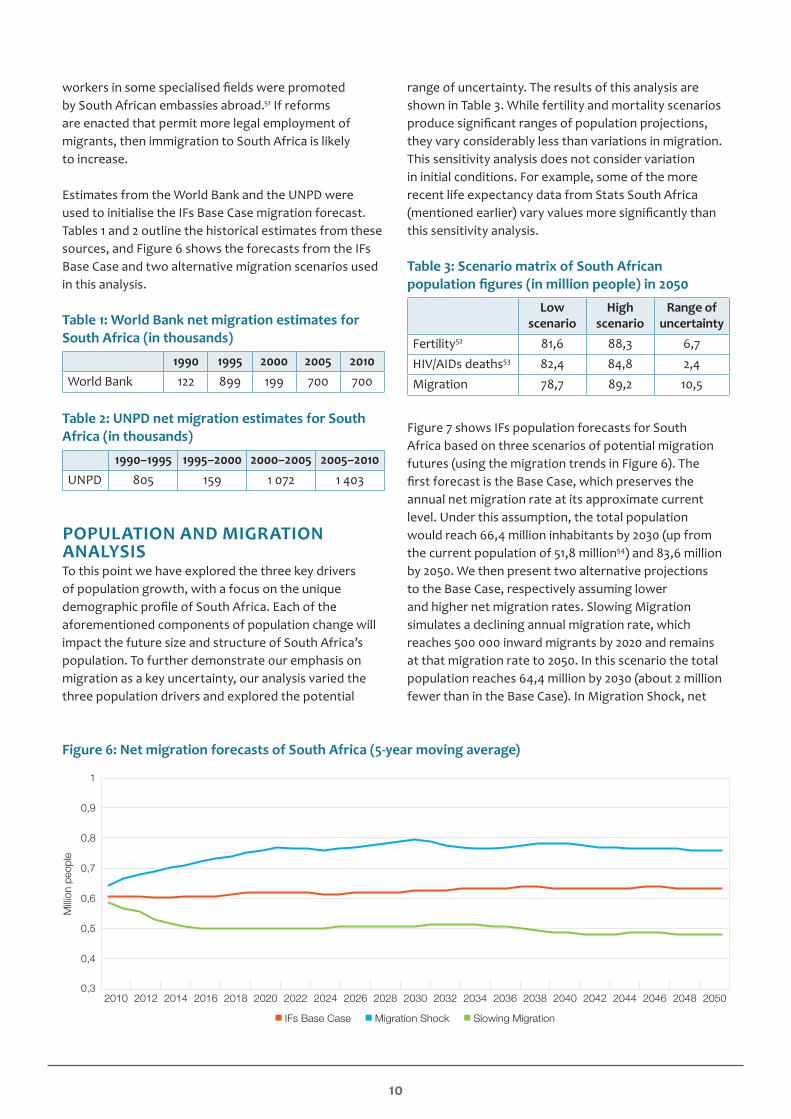
Estimates from the World Bank and the UNPD were used to initialise the IFs Base Case migration forecast. Tables 1 and 2 outline the historical estimates from these sources, and Figure 6 shows the forecasts from the IFs Base Case and two alternative migration scenarios used in this analysis.
Table 1: World Bank net migration estimates for South Africa (in thousands)
1990 1995 2000 2005 2010World Bank 122 899 199 700 700
Table 2: UNPD net migration estimates for South Africa (in thousands)
1990–1995 1995–2000 2000–2005 2005–2010UNPD 805 159 1 072 1 403
POPULATION AND MIGRATION ANALYSISTo this point we have explored the three key drivers of population growth, with a focus on the unique demographic profile of South Africa. Each of the aforementioned components of population change will impact the future size and structure of South Africa’s population. To further demonstrate our emphasis on migration as a key uncertainty, our analysis varied the three population drivers and explored the potential
range of uncertainty. The results of this analysis are shown in Table 3. While fertility and mortality scenarios produce significant ranges of population projections, they vary considerably less than variations in migration. This sensitivity analysis does not consider variation in initial conditions. For example, some of the more recent life expectancy data from Stats South Africa (mentioned earlier) vary values more significantly than this sensitivity analysis.
Table 3: Scenario matrix of South African population figures (in million people) in 2050
Low scenario
High scenario
Range of uncertainty
Fertility52 81,6 88,3 6,7HIV/AIDs deaths53 82,4 84,8 2,4Migration 78,7 89,2 10,5
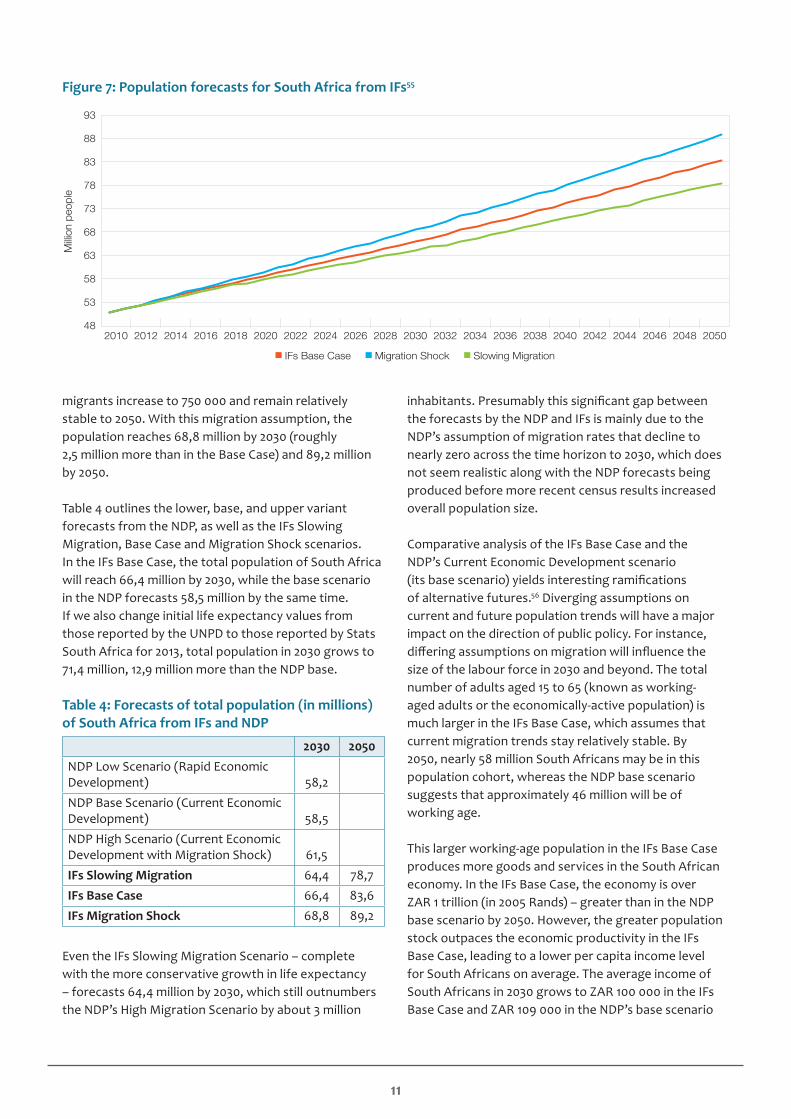
Figure 7 shows IFs population forecasts for South Africa based on three scenarios of potential migration futures (using the migration trends in Figure 6). The first forecast is the Base Case, which preserves the annual net migration rate at its approximate current level. Under this assumption, the total population would reach 66,4 million inhabitants by 2030 (up from the current population of 51,8 million54) and 83,6 million by 2050. We then present two alternative projections to the Base Case, respectively assuming lower and higher net migration rates. Slowing Migration simulates a declining annual migration rate, which reaches 500 000 inward migrants by 2020 and remains at that migration rate to 2050. In this scenario the total population reaches 64,4 million by 2030 (about 2 million fewer than in the Base Case). In Migration Shock, net
Figure 6: Net migration forecasts of South Africa (5-year moving average)
2010 2012 2014 2016 2018 2020 2022 2024 2026 2028 2030 2032 2034 2036 2038 2040 2042 2044 2046 2048 2050
0,4
1
0,9
0,8
0,7
0,6
0,5
0,3
IFs Base Case Migration Shock Slowing Migration
Milli
on p
eopl
e
11
migrants increase to 750 000 and remain relatively stable to 2050. With this migration assumption, the population reaches 68,8 million by 2030 (roughly 2,5 million more than in the Base Case) and 89,2 million by 2050.
Table 4 outlines the lower, base, and upper variant forecasts from the NDP, as well as the IFs Slowing Migration, Base Case and Migration Shock scenarios. In the IFs Base Case, the total population of South Africa will reach 66,4 million by 2030, while the base scenario in the NDP forecasts 58,5 million by the same time. If we also change initial life expectancy values from those reported by the UNPD to those reported by Stats South Africa for 2013, total population in 2030 grows to 71,4 million, 12,9 million more than the NDP base.
Table 4: Forecasts of total population (in millions) of South Africa from IFs and NDP
2030 2050NDP Low Scenario (Rapid Economic Development) 58,2NDP Base Scenario (Current Economic Development) 58,5NDP High Scenario (Current Economic Development with Migration Shock) 61,5IFs Slowing Migration 64,4 78,7IFs Base Case 66,4 83,6IFs Migration Shock 68,8 89,2
Even the IFs Slowing Migration Scenario – complete with the more conservative growth in life expectancy – forecasts 64,4 million by 2030, which still outnumbers the NDP’s High Migration Scenario by about 3 million
inhabitants. Presumably this significant gap between the forecasts by the NDP and IFs is mainly due to the NDP’s assumption of migration rates that decline to nearly zero across the time horizon to 2030, which does not seem realistic along with the NDP forecasts being produced before more recent census results increased overall population size.
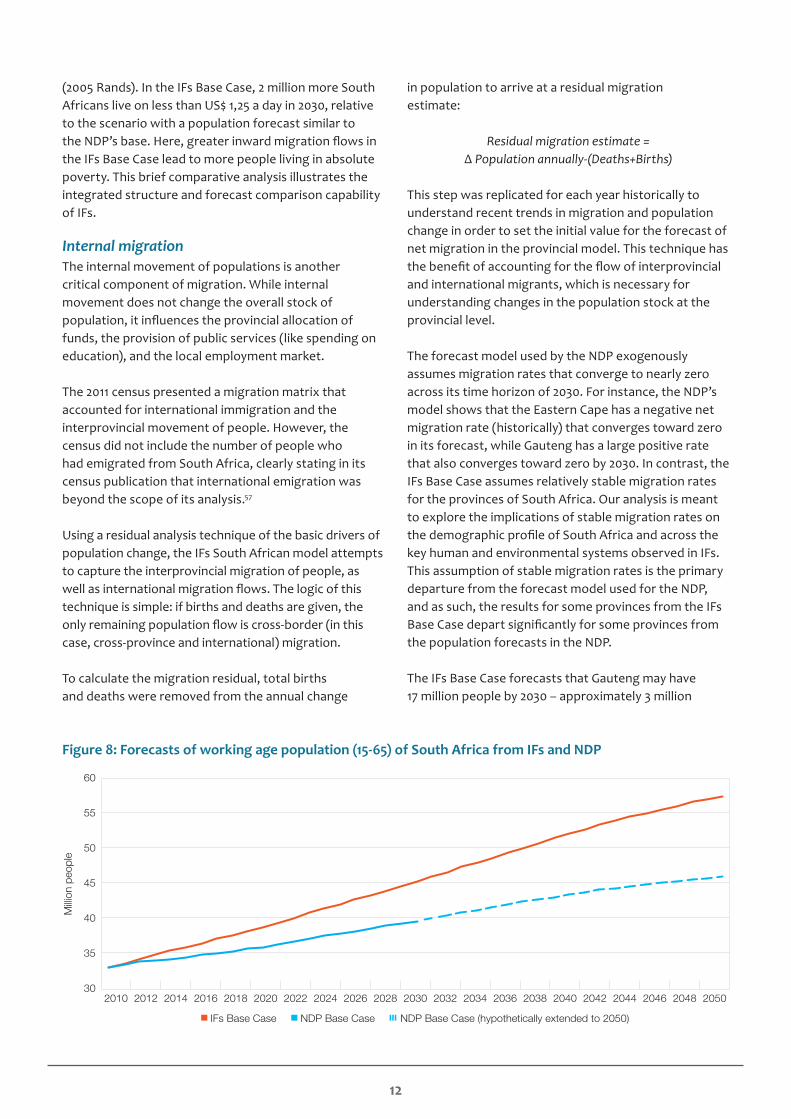
Comparative analysis of the IFs Base Case and the NDP’s Current Economic Development scenario (its base scenario) yields interesting ramifications of alternative futures.56 Diverging assumptions on current and future population trends will have a major impact on the direction of public policy. For instance, differing assumptions on migration will influence the size of the labour force in 2030 and beyond. The total number of adults aged 15 to 65 (known as working-aged adults or the economically-active population) is much larger in the IFs Base Case, which assumes that current migration trends stay relatively stable. By 2050, nearly 58 million South Africans may be in this population cohort, whereas the NDP base scenario suggests that approximately 46 million will be of working age.
This larger working-age population in the IFs Base Case produces more goods and services in the South African economy. In the IFs Base Case, the economy is over ZAR 1 trillion (in 2005 Rands) – greater than in the NDP base scenario by 2050. However, the greater population stock outpaces the economic productivity in the IFs Base Case, leading to a lower per capita income level for South Africans on average. The average income of South Africans in 2030 grows to ZAR 100 000 in the IFs Base Case and ZAR 109 000 in the NDP’s base scenario
Figure 7: Population forecasts for South Africa from IFs55
2010 2012 2014 2016 2018 2020 2022 2024 2026 2028 2030 2032 2034 2036 2038 2040 2042 2044 2046 2048 2050
53
93
88
83
78
73
68
63
58
48
IFs Base Case Migration Shock Slowing Migration
Milli
on p
eopl
e
12
(2005 Rands). In the IFs Base Case, 2 million more South Africans live on less than US$ 1,25 a day in 2030, relative to the scenario with a population forecast similar to the NDP’s base. Here, greater inward migration flows in the IFs Base Case lead to more people living in absolute poverty. This brief comparative analysis illustrates the integrated structure and forecast comparison capability of IFs.
Internal migrationThe internal movement of populations is another critical component of migration. While internal movement does not change the overall stock of population, it influences the provincial allocation of funds, the provision of public services (like spending on education), and the local employment market.
The 2011 census presented a migration matrix that accounted for international immigration and the interprovincial movement of people. However, the census did not include the number of people who had emigrated from South Africa, clearly stating in its census publication that international emigration was beyond the scope of its analysis.57
Using a residual analysis technique of the basic drivers of population change, the IFs South African model attempts to capture the interprovincial migration of people, as well as international migration flows. The logic of this technique is simple: if births and deaths are given, the only remaining population flow is cross-border (in this case, cross-province and international) migration.
To calculate the migration residual, total births and deaths were removed from the annual change
in population to arrive at a residual migration estimate:
Residual migration estimate = ∆ Population annually-(Deaths+Births)
This step was replicated for each year historically to understand recent trends in migration and population change in order to set the initial value for the forecast of net migration in the provincial model. This technique has the benefit of accounting for the flow of interprovincial and international migrants, which is necessary for understanding changes in the population stock at the provincial level.
The forecast model used by the NDP exogenously assumes migration rates that converge to nearly zero across its time horizon of 2030. For instance, the NDP’s model shows that the Eastern Cape has a negative net migration rate (historically) that converges toward zero in its forecast, while Gauteng has a large positive rate that also converges toward zero by 2030. In contrast, the IFs Base Case assumes relatively stable migration rates for the provinces of South Africa. Our analysis is meant to explore the implications of stable migration rates on the demographic profile of South Africa and across the key human and environmental systems observed in IFs. This assumption of stable migration rates is the primary departure from the forecast model used for the NDP, and as such, the results for some provinces from the IFs Base Case depart significantly for some provinces from the population forecasts in the NDP.
The IFs Base Case forecasts that Gauteng may have 17 million people by 2030 – approximately 3 million
Figure 8: Forecasts of working age population (15-65) of South Africa from IFs and NDP
2010 2012 2014 2016 2018 2020 2022 2024 2026 2028 2030 2032 2034 2036 2038 2040 2042 2044 2046 2048 2050
35
60
55
50
45
40
30
IFs Base Case NDP Base Case NDP Base Case (hypothetically extended to 2050)
Milli
on p
eopl
e
13
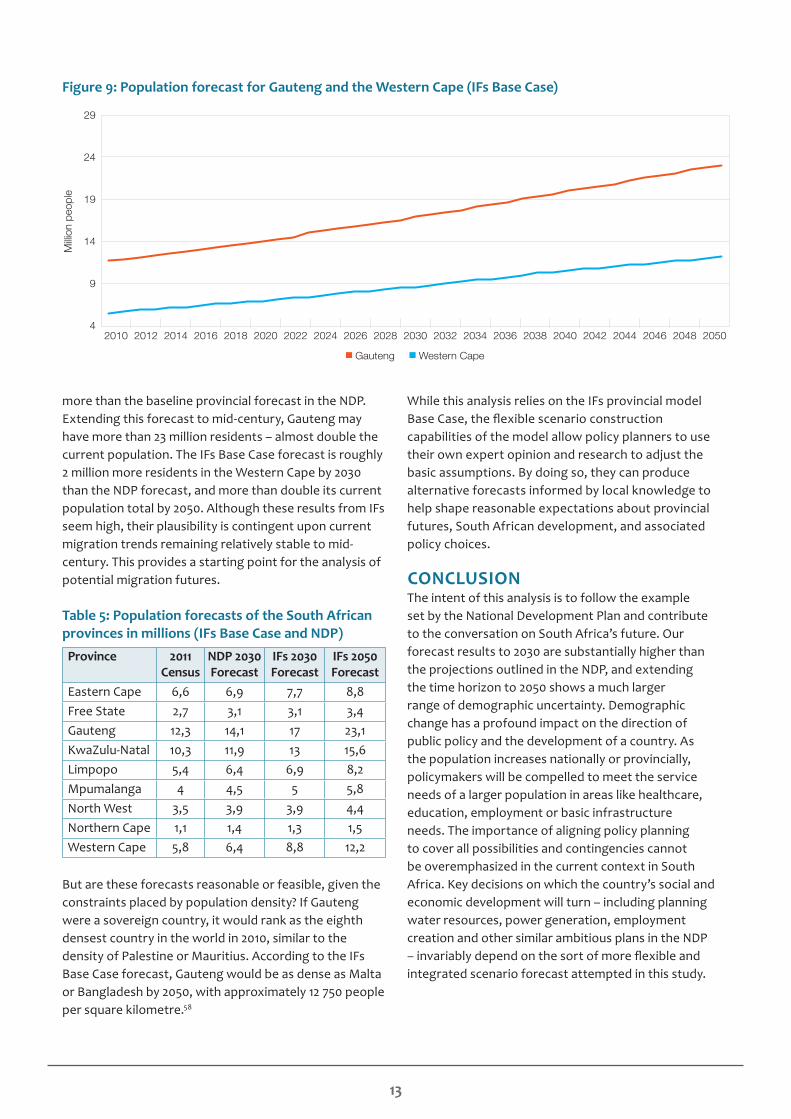
more than the baseline provincial forecast in the NDP. Extending this forecast to mid-century, Gauteng may have more than 23 million residents – almost double the current population. The IFs Base Case forecast is roughly 2 million more residents in the Western Cape by 2030 than the NDP forecast, and more than double its current population total by 2050. Although these results from IFs seem high, their plausibility is contingent upon current migration trends remaining relatively stable to mid-century. This provides a starting point for the analysis of potential migration futures.
Table 5: Population forecasts of the South African provinces in millions (IFs Base Case and NDP)
Province 2011 Census
NDP 2030 Forecast
IFs 2030 Forecast
IFs 2050 Forecast
Eastern Cape 6,6 6,9 7,7 8,8Free State 2,7 3,1 3,1 3,4Gauteng 12,3 14,1 17 23,1KwaZulu-Natal 10,3 11,9 13 15,6Limpopo 5,4 6,4 6,9 8,2Mpumalanga 4 4,5 5 5,8North West 3,5 3,9 3,9 4,4Northern Cape 1,1 1,4 1,3 1,5Western Cape 5,8 6,4 8,8 12,2
But are these forecasts reasonable or feasible, given the constraints placed by population density? If Gauteng were a sovereign country, it would rank as the eighth densest country in the world in 2010, similar to the density of Palestine or Mauritius. According to the IFs Base Case forecast, Gauteng would be as dense as Malta or Bangladesh by 2050, with approximately 12 750 people per square kilometre.58
While this analysis relies on the IFs provincial model Base Case, the flexible scenario construction capabilities of the model allow policy planners to use their own expert opinion and research to adjust the basic assumptions. By doing so, they can produce alternative forecasts informed by local knowledge to help shape reasonable expectations about provincial futures, South African development, and associated policy choices.
CONCLUSIONThe intent of this analysis is to follow the example set by the National Development Plan and contribute to the conversation on South Africa’s future. Our forecast results to 2030 are substantially higher than the projections outlined in the NDP, and extending the time horizon to 2050 shows a much larger range of demographic uncertainty. Demographic change has a profound impact on the direction of public policy and the development of a country. As the population increases nationally or provincially, policymakers will be compelled to meet the service needs of a larger population in areas like healthcare, education, employment or basic infrastructure needs. The importance of aligning policy planning to cover all possibilities and contingencies cannot be overemphasized in the current context in South Africa. Key decisions on which the country’s social and economic development will turn – including planning water resources, power generation, employment creation and other similar ambitious plans in the NDP – invariably depend on the sort of more flexible and integrated scenario forecast attempted in this study.
Figure 9: Population forecast for Gauteng and the Western Cape (IFs Base Case)
2010 2012 2014 2016 2018 2020 2022 2024 2026 2028 2030 2032 2034 2036 2038 2040 2042 2044 2046 2048 2050
9
29
24
19
14
4
Gauteng Western Cape
Milli
on p
eopl
e
14
ABOUT THE AUTHORSAra Go is a Research Assistant at the Frederick S. Pardee Center for International Futures and an M.A. Candidate in International Development at the Josef Korbel School of International Studies at the University of Denver in the US. Dr Jonathan D. Moyer is the Associate Director of the Frederick S. Pardee Center for International Futures at the Josef Korbel School of International Studies at the University of Denver. Mickey Rafa is Research Assistant at the Pardee Center for International Futures at the Josef Korbel School of International Studies at the University of Denver. Dr Julia Schuenemann is a senior researcher at the Institute for Security Studies, where she leads the African Futures Project.
NOTES1 Jakkie Cilliers and Hanna Camp, The National Development Plan 2030:
Highway or Byway?, African Futures Policy Brief (6). 2013. Available at: http://www.issafrica.org/futures/uploads/PaperAF6.pdf.
2 National Planning Commission, Diagnostic Overview, 2011. Available at: http://www.npconline.co.za/pebble.asp?relid=206.
3 Joseph Chamie, For Better Planning, Watch Global Demographic Trends (12 December 2012), Yale Global Online, http://yaleglobal.yale.edu/content/better-planning-watch-global-demographic-trends (accessed on 12 May 2013).
4 National Planning Commission, National Development Plan 2030: Our Future – Make it Work (2012), 98.
5 Brian C. O’Neill et al, A Guide to Global Population Projections, Demographic Research 4.8 (2001). 203-288, www.demographic-research.org/Volumes/Vol4/8/ (accessed on 15 May 2013).
6 Data acquired from the International Futures (IFs) modelling system, version 6.75. IFs was initially developed by Barry B. Hughes and is based at the Frederick S. Pardee Center for International Futures, Josef Korbel School of International Studies, University of Denver, www.ifs.du.edu. UNPD forecasts obtained from the Population Division of the Department of Economic and Social Affairs of the United Nations Secretariat, World Population Prospects: The 2012 Revision, http://esa.un.org/unpd/wpp/index.htm (accessed on 15 May 2013).
7 Population Reference Bureau, Understanding and Using Population Projections, http://www.prb.org/Publications/PolicyBriefs/UnderstandingandUsingPopulationProjections.aspx (accessed on 21 May 2013).
8 Joseph Chamie, Global Population of 10 Billion by 2100? – Not So Fast (26 October 2011), Yale Global Online, Available at: http://yaleglob-al.yale.edu/content/global-population-10-billion-not-so-fast (accessed on 21 May 2013).
9 Henry Mosley, Mortality and Morbidity: Data Sources for Measuring Mortality, The Johns Hopkins University, 2006, http://ocw.jhsph.edu/courses/populationchange/PDFs/Lecture6.pdf (accessed on 24 May 2013).
10 International Futures, version 6.75. Grouping used for this measurement is the UN Less Developed Countries.
11 Loren B. Landau and Véronique Gindrey, Gauteng 2055 Trend Paper: Population & Migration, University of the Witwatersrand Forced Migration Studies Programme, 2008.
12 Tara Polzer, Population Movements in and to South Africa, Migration Fact Sheet 1, University of the Witwatersrand Forced Migration Studies Programme, 2010.
13 United Nations, Department of Economic and Social Affairs, Population Division, Trends in International Migrant Stock: The 2008 Revision, 2009.
14 United Nations, Department of Economic and Social Affairs, Population Division, Trends in Total Migrant Stock: The 2003 Revision, 2003.
15 International Organization for Migration, Global Estimates and Trends Available at: http://www.iom.int/cms/en/sites/iom/home/about-migration/facts--figures-1/global-estimates-and-trends.html (accessed on 24 May 2013).
16 International Organization for Migration, World Migration Report 2011: Communicating Effectively about Migration, 2011, 62.
17 Population Reference Bureau, Ibid.18 Barry B. Hughes, Mohammod T. Irfan, Jonathan D. Moyer, Dale
S. Rothman, and José R. Solórzano, Exploring Future Impacts of Environmental Constraints on Human Development, Sustainability (2012), 958-994.
19 For further information on scenario analysis in IFs, see the IFs Help System. Available at: http://www.du.edu/ifs/help.
20 For further research on the drivers of fertility, see: Laura Rossouw, Rulof Burger, and Ronelle Burger, The Fertility Transition in South Africa: A Retrospective Panel Data Analysis, Stellenbosch Economic Working Papers 03(12 ), 2012. T. J. Mathews and Stephanie J. Ventura, Birth and Fertility Rates by Educational Attainment: United States, 1994, Monthly Vital Statistics Report 45.10 (1997), Hyattsville, Maryland: National Center for Health Statistics.
21 Jenny Trinitapolia and Sara Yeatman, Uncertainty and Fertility in a Generalized AIDS Epidemic (2011), American Sociological 76.6 (2011), 935-954.
22 Mzikazi Nduna and Lindiwe Farlane, Women Living with HIV in South Africa and Their Concerns About Fertility, AIDS and Behavior 13.1 (2009), 62-65.
23 Landon Myer, Chelsea Morroni, and Kevin Rebe, Prevalence and Determinants of Fertility Intentions of HIV-Infected Women and Men Receiving Antiretroviral Therapy in South Africa, AIDS Patient Care and STDs 21(4), 2007, 278-285.
24 Simon Gregson, Basia Zaba and Susan-Catherine Hunter, The Impact of HIV-1 on Fertility in Sub-Saharan Africa: Causes and Consequences, United Nations Completing the Fertility Transition 48/49 (2009), 111-138.
25 Basia Zaba and Simon Gregson, Measuring the Impact of HIV on Fertility in Africa, AIDS 12(1) (1998), 41-50.
26 James J.C. Lewis, Carine Ronsmans, Alex Ezeh, and Simon Gregson, The Population Impact of HIV on Fertility in Sub-Saharan Africa, AIDS 18 (supplement 2) (2004), 35-43.
27 Life expectancy data in the top-down model are taken from the UNPD. These data are normalised by the UNPD to be comparable for cross-sectional and longitudinal analysis internationally. The data on life expectancy differ considerably between the UNPD and Stats SA. According to the Stats SA 2013 mid-year population estimates, South Africa’s life expectancy was 57,6 years – more than 5 years greater than the 2010 estimate from the UNPD.
28 South Africa increased the health facilities providing ARTs from fewer than 500 in 2010 to 3 540 in 2013. The number of nurses trained and certified to initiate ARTs in the absence of a doctor (NIMART – Nurse Initiated Management of Antiretroviral Therapy) was also increased from only 250 to 23,000 to date. The new ground- breaking Fixed Dose Combination (FDC) therapy was just introduced and therefore reduced the cost of ARTs from R314 per patient per month to only R89.
15
29 Aaron Motsoaledi, Health Budget speech (15 May 2013). Department of Health. Available at: http://www.doh.gov.za/docs/sp/2013/Health_Budget_speech.pdf.
30 David E. Bourne, MaryLou Thompson, Linnea L. Brody, Mark Cotton, Beverly Draper, Ria Laubscher, M. Fareed Abdullah, and Jonny E. Myers, Emergence of a Peak in Early Infant Mortality Due to HIV/AIDS in South Africa, Aids 23(1) (2009), 101-106.
31 Data on infant mortality obtained from the Actuarial Society of South Africa.
32 Leigh F. Johnson, Joel Mossong, Rob E. Dorrington, Michael Schomaker, Christopher J. Hoffmann, et al, Life Expectancies of South African Adults Starting Antiretroviral Treatment: Collaborative Analysis of Cohort Studies, PLoS Med 10(4) (2013).
33 This study suggests that early adoption of ARTs should occur before the patient’s CD4 count declines to 200 cells per cubic millimeter. A higher CD4 count is indicative of a stronger immune system. As a point of reference, AIDS occurs when the CD4 count of a patient is less than 200 cells per cubic millimeter.
34 Jacob Bor, Abraham J. Horbst, Marie-Louise Newell, and Till Bärnighausen, Increases in Adult Life Expectancy in Rural South Africa: Valuing the Scale-Up of HIV Treatment, Science 339(6122) (2013), 961-965. A note on this study: the gains observed in life expectancy were driven entirely by a decline in HIV-related mortality, as death rates from other causes remained relatively constant over the study period.
35 Data available at: http://esa.un.org/wpp/Excel-Data/mortality.htm.36 Data obtained from Statistics South Africa 2013 mid-year population
estimates. Available at: http://www.statssa.gov.za/publications/P0302/P03022013.pdf.
37 National Planning Commission, National Development Plan 2030: Our Future – Make it Work (2012), 101-102.
38 Ibid., 103-105.39 Jonathan Crush, South Africa: Policy in the Face of Xenophobia,
Migration Policy Institute, 2008, http://www.migrationinformation.org/Feature/print.cfm?ID=689 (accessed on 28 May 2013).
40 Ibid.41 Irvine Makuyana, Migrants to be profiled – Stats SA, in The NewAge
newspaper, 26 September 2013, p 642 Jonathan Crush, The Perfect Storm: Xenophobia in Contemporary South
Africa, Kingston, Ont.: Southern African Migration Report 2008.43 Christy McConnell, Migration and Xenophobia in South Africa, Conflict
Trends 1 (2009), 34-40.44 BBC, Somalis march in Cape Town against South Africa attack, June 7,
2013, 45 International Organization for Migration, About IOM in Southern
Africa, http://iom.org.za/web/index.php?option=com_content&view=article&id=3&Itemid=13&lang=en (accessed on May 28 2013)
46 Ralph M Ertner and Christina K Matsvai, The Current South African Immigration Law, IntoSA Information Brief 2013, 3-5.
47 Jonathan Crush, South Africa: Policy in the Face of Xenophobia, Migration Policy Institute, 2008, http://www.migrationinformation.org/Feature/print.cfm?ID=689 (accessed on 28 May 2013).
48 Ibid.49 Ibid.50 Ibid.51 Jonathan Crush, Complex Movements, Confused Responses: Labour
Migration in South Africa, Southern African Migration Programme (SAMP) Policy Brief No. 25, 2011, 11-13.
52 These scenarios were produced with a 10 per cent variation in fertility above and below the Base Case from 2010 to 2020.
53 These scenarios were produced with a 10 per cent variation in AIDS mortality above and below the Base Case from 2010 to 2020.
54 Current figure from the 2011 census. Available at: http://www.statssa.gov.za/Publications/P03014/P030142011.pdf (accessed on 19 June 2013).
55 We chose not to include historical values in this graph but in each of these scenarios we imposed the population values from the 2011 census to initialise the forecasts. This produced a bump in the graph between historical and forecast values.
56 It is important to stress that this is a comparative analysis of the hypothetical population size from the NDP base case – not a direct forecast comparison with the model used by the NDP. As such, direct comparisons cannot be made from our forecasts that expand upon population forecasts. This extension of analysis is meant to illustrate the integrated nature of IFs.
57 Statistics South Africa, Census 2011 Statistical release – P0301.4, 2012, 22.
58 International Futures (IFs) modelling system, version 6.75.
AFRICAN FUTURES PROJECT
The African Futures Project (www.issafrica.org/futures) is a collaboration between the Institute for Security Studies (http://www.issafrica.
org) and the Frederick S. Pardee Center for International Futures (www.ifs.du.edu) at the Josef Korbel School of International Studies,
University of Denver. The Institute for Security Studies is an African organisation which aims to enhance human security on the continent. It
does independent and authoritative research, provides expert policy analysis and advice, and delivers practical training and technical
assistance. The Pardee Center is the home of the International Futures modelling system, an integrated approach to exploring and
understanding human development and the broad implications of policy choices. These organisations leverage each others’ expertise to
provide forward-looking, policy-relevant material that frames uncertainty around human development in Africa.
The authors would like to thank Jakkie Cilliers, Janet Dickson and Hanna Camp for valuable feedback on this paper.
Series editors: Jonathan D Moyer ([email protected]) and Julia Schünemann ([email protected]).
Layout and graphics: Compress DSL.
Project funding thanks to:
The Hanns Seidel Foundation, South Africa.
16