Embed Size (px)
Citation preview

AFRICAN DEVELOPMENT BANK
REPUBLIC OF SOUTH AFRICA
COUNTRY STRATEGY PAPER 2013-2017
SOUTHERN AFRICA RESOURCE CENTER
(SARC)
March 2013
TABLE OF CONTENTS
ACRONYMS AND ABBREVIATIONS ................................................................................. ii
EXECUTIVE SUMMARY ..................................................................................................... iv
I. INTRODUCTION ............................................................................................................. 1
II. COUNTRY CONTEXT AND PROSPECTS ................................................................... 1
2.1. Political Context ......................................................................................................... 1
2.2. Economic Context ...................................................................................................... 1
2.3. Recent Economic Developments and Outlook ........................................................... 2
2.4. Business Environment and Competitiveness.............................................................. 4
2.5. Governance ................................................................................................................. 5
2.6. Trade and Regional Integration .................................................................................. 6
2.7. Poverty, Social Inclusion and Equity ......................................................................... 6
2.8. Gender ........................................................................................................................ 9
2.9. Environment and Climate Change .............................................................................. 9
III. HIGHLIGHTS OF PREVIOUS BANK COUNTRY STRATEGY ............................. 10
IV. THE COUNTRY STRATEGY .................................................................................... 11
4.1. Government National Strategy ................................................................................. 11
4.2. The Bank’s Country Strategy ................................................................................... 13
4.3. Cross-Cutting Issues ................................................................................................. 15
V. STRATEGY IMPLEMENTATION ............................................................................... 16
5.1. Indicative Resource Parameters ............................................................................... 16
5.2. Program Overview and Sector Focus ....................................................................... 17
VI. RESULTS MANAGEMENT ....................................................................................... 19
6.1. Monitoring ................................................................................................................ 19
6.2. Risks ......................................................................................................................... 19
VII. CONCLUSION AND RECOMMENDATION ........................................................... 20
ANNEX I. COUNTRY STRATEGY RESULTS FRAMEWORK.......................................... I
ANNEX II. SELECTED ECONOMIC AND SOCIAL INDICATORS ................................. III
ANNEX III. COUNTRY PORTFOLIO IMPROVEMENT PLAN ....................................... IV
ANNEX IV. BANK GROUP PORTFOLIO 2008-2012 .......................................................... V
ANNEX V. PORTFOLIO MONITORING AND PERFORMANCE INDICATORS OF
RATED PROJECTS. .............................................................................................................. VI
ANNEX VI. SUMMARY OF THE 2008-2012 CSP COMPLETION REPORT ................. VII
ANNEX VII. MATRIX OF MAJOR DONOR ACTIVITIES IN SOUTH AFRICA .......... VIII
ANNEX VIII. GREEN ENERGY ........................................................................................ VIII
ANNEX IX. SUMMARY OF STUDY: MANUFACTURING, PRODUCTIVITY,
INNOVATION AND JOBS—A COMPARISON WITH THE BRICS ................................ IX
LIST OF BOXES
Box 1: South-South Cooperation-Opportunities and Challenges
Box 2: Unemployment and Need for Greater Economic Transformation
Box 3: Lessons from CSP Completion Report and CPPR
Box 4: The Link between Bank LTS, Southern African RISP, and South African CSP
2013-2017
Box 5: The Role of Southern Africa Resource Center (SARC) in Implementing the CSP
LIST OF GRAPHS
Figure 1: Selected Economic Indicators
Figure 2: 2011 Mo Ibrahim Index of African Governance
LIST OF TABLES
Table 1: Indicative lending and non-lending operations
CURRENCY EQUIVALENTS
1 UA = US$ 1.50833
1 UA = Euro 1.1565
1 UA = ZAR 12.2788
FISCAL YEAR
1 April to 31 March
This CSP was prepared following a consultative mission held in South Africa from 23 July -7 August 2012. The
CSP was prepared by a team led by Mr. Ebrima Faal (Regional Director, SARC). The team included Mr.
Kennedy Mbekeani (Regional Economist, SARC), Ms. Eva Ruganzu (Chief Country Program Officer, SARC),
Mr. Wolassa Kumo (Senior Country Economist, SARC), Ms. Imen Chorfi (Senior Data Analyst, SARC), Mr.
Devinder Goyal (Chief Regional Financial Management Coordinator, SARC), Mr. Hussein Iman (Chief
Investment Officer, SARC), Mr. Moses Ayiemba (Chief Regional Procurement Coordinator, SARC), Ms. Cecile
Ambert (Senior Strategy Expert, Private Sector Department), Ms. Nana Kgosidintsi (Senior Health Analyst,
SARC), Mr. Frank Boahene (Principal Education Analyst, SARC), Mr. Farai Kanonda (Senior Financial
Analyst, SARC), Ms. Motsilisi Lebesa (Principal Energy Economist, SARC), Mr. Mecuria Assefaw (Chief
Financial Analyst, Water and Sanitation Department), Ms. Kisa Mfalila (Principal Environmental Analyst,
Department of Agriculture and Agro Industry), Mr. Patrick Opoku-Darkwa (Senior Transport Engineer,
Department of Transport and ICT), Ms. Delenia McIver (Principal Legal Counsel, SARC) and Mr. Mukul
Kumar (Chief Procurement Specialist, SARC).
Questions on the document should be addressed to Mr. Ebrima Faal, Regional Director, SARC.

ii
ACRONYMS AND ABBREVIATIONS
ADB African Development Bank
ADF African Development Fund
ANC African National Congress
ASGISA Accelerated and Shared Growth Initiative of South Africa
BRICS Brazil, Russia, India, China and South Africa
CPPR Country Portfolio Performance Report
CSP Country Strategy Paper
COMESA Common Market of Eastern and Southern Africa
COPE Congress of the People
DFID UK Department for International Development
EAC East African Community
EMBI JP Morgan’s Emerging Markets Bond Index GDP Gross Domestic Product
GoRSA Government of Republic of South Africa
HEST Higher Education, Science and Technology
HIV/AIDS Acquired Immunodeficiency Virus/Acquired Immunodeficiency
Syndrome
IMF International Monetary Fund
IFC International Finance Cooperation
JICA Japanese International Cooperation Agency
MDGs Millennium Development Goals
NDP National Development Plan- Vision for 2030
NGP New Growth Path 2011-2020
NPC National Planning Commission
OECD Organization for Economic Cooperation and Development
OSBP One-stop Boarder Post
PEFA Public Expenditure and Financial Accountability
PPPs Public-Private Partnerships
SADC Southern African Development Community
SACU Southern African Customs Union
SIPs Strategic Integrated Projects
SMME Small, Medium and Micro Enterprises
UA Unit of Account
UNDP United Nations Development Program
WHO World Health Organization
iii

iv
EXECUTIVE SUMMARY
South Africa’s potential growth has slowed over the last few years. Considerable efforts will
be needed to meet the Government’s goal of raising per capita income to at least US$ 13,750 and
to create 11 million new jobs by 2030. Moreover, inequality continues to be very high,
suggesting that making growth more inclusive remains an important policy challenge.
The authorities have diagnosed the key constraints to raising potential growth and
recognize the need for deep-rooted structural reforms. The broad aim of the reforms is to
raise the share of private investment, including ‘green growth’ technologies, and improve the
level of education and skills in order to raise productivity levels closer to those of other emerging
market countries. Towards this end, reforms envisage improvements in governance and
inclusiveness, promoting catalytic investment projects, focusing on high value-added
manufacturing and services sectors, as well as broader economic reforms to raise incomes of the
poorest households and reform public finances to ensure their sustainability and remove
distortions.
The New Growth Path and the National Development Plan support the government's long-
term goal of building a harmonious and prosperous society through livelihood
improvement, and regionally balanced and environmentally sustainable growth. Reforms
will be carried out to stem rising income inequality, address structural imbalances, and further
open up the economy. Public expenditure will be geared towards livelihood improvement, and
strong support will be provided to education, healthcare, social security and public housing.
Infrastructure remains a high priority with an emphasis on promoting rural development and
emerging strategic industries, in particular modern clean energy and environment-friendly
technologies, while piloting development of green and low-carbon cities. Resource conservation
to combat climate change and improve natural resource management is a priority
This new CSP therefore seeks to position the Bank to continue playing a catalytic role in
South Africa’s development process through an enhanced operational focus on innovation
and value addition to support manufacturing and job creation. It promotes intensified focus
on generating knowledge, sharing best practices, building capacity, and fostering regional
cooperation. Lending activities will include smaller demonstration and pilot-type projects for
scaling-up through domestic financing. This, in turn, would facilitate knowledge sharing among
executing agencies and with other developing member countries through South-South
cooperation, and foster a stronger strategic focus on inclusive and environmentally sustainable
growth as well as regional cooperation and integration. The opening of the Southern Africa
Resource Centre (SARC) has ensured better partner coordination. SARC is working closely with
South Africa and the Regional Economic Communities to deepen regional integration and
economic cooperation to enhance the region’s competitiveness and diversification of economic
activity to spur inclusive and sustainable growth. The opening of SARC has also enhanced
portfolio performance through (i) improved consultation with local authorities, as well as
development partners for joint initiation, design, financing and monitoring of projects, and (ii)
timely support to capacity development of implementing agencies in various aspects of project
management. In addition, collaboration between ECON and SARC has significantly enhanced
Bank capacity to respond with knowledge solutions on emerging issues as well as preparation of
influential policy notes on key issues.
1
I. INTRODUCTION
1.1 The Bank’s current Republic of South Africa Country Strategy Paper (CSP) 2008-
2012 (ADB/BD/WP/2008/12/Revised) was approved by the Bank’s Board of Directors in
April 2008. This new CSP for the period 2013-2017 is anchored on the country’s new
development strategies, the New Growth Path (NGP) and the National Development Plan- vision
for 2030, and on the Bank’s new long-term strategy (LTS) 2013-2022. The CSP provides an
assessment of the country’s development prospects and challenges, national strategic options,
and the role that the Bank could play, in collaboration with the Government and other
development partners, in helping the country realize its development goals.
1.2. A number of factors make a new country strategy for South Africa timely. These
include, among others: chronic high level of unemployment, poverty and inequality despite
steady economic growth during the past decade; the recent announcement by the Government of
large scale medium and long term infrastructure investment plans; the country’s accession to the
BRICS group of fast growing emerging market economies; and the adoption of new
development strategies by the Government and the Bank Group. These together provide an
opportunity for both South Africa and the Bank to build a renewed partnership to foster the
country’s economic development and regional integration in Southern Africa.
II. COUNTRY CONTEXT AND PROSPECTS
2.1. Political Context
2.1.1. South Africa is a constitutional multiparty democracy characterized by free and fair
elections. It is also characterized by a dominant political party with the African National
Congress (ANC) winning landslide victories in all four democratic elections since the end of the
Apartheid regime in 1994. The ANC’s liberation credentials and economic resources make it
difficult for opposition parties to break into electoral politics. The ANC’s long-term power is
guaranteed through its participation in the Tripartite Alliance with the South African Communist
party and the Congress of South African Trade Unions. The balance of power within the
Tripartite Alliance remains strongly in favor of the ANC.
2.1.2. The debate on land reform and nationalisation of mines still occupy policy debates
within the ruling party and is likely to intensify leading up to the party’s national elective
conference in December 2012 and the next general elections in 2014. The ability of the
Government (at the national, provincial, and municipal levels) to deliver essential social services
in the townships, informal settlements, and rural communities remains a serious challenge.
2.2. Economic Context
2.2.1. Following a strong recovery from the downturn of 2008−09, economic momentum in
South Africa is losing steam against the backdrop of a weaker external environment. As the
recovery took hold, macroeconomic policies moved towards a less accommodative stance from
early 2010. As a result, inflation remains contained but outside the target band of 3-6 percent and
the rapid post-crisis buildup in public debt to finance the 2010 FIFA World Cup and household
debt is leveling off. More recently, the growth of manufacturing exports has begun to ease, while
commodity exports have thus far remained resilient. With regard to sectoral trends, the
contribution of the primary sector (mining and agriculture) to GDP has declined substantially,
while that of the secondary sector (manufacturing, electricty; gas and water; and construction)

2
declined marginally. The contribution of the tertiary sector grew from 49 percent in 1994 to 57
percent in 2011.
2.2.2. Increasing potential growth and reducing income inequalities are the key challenges
over the medium term. High and stable growth requires sustained structural reforms anchored
around medium-term fiscal consolidation. This would help raise productivity and target public
assistance to the most needy. To further deepen the inclusiveness of growth, consideration could
be given to use the institutional frameworks to introduce innovative social partnerships in critical
areas such as skills development and job creation for youths. Strong partnerships with the
manufacturing and energy sectors would also boost growth and create employment opportunities
in green growth technologies.
2.3. Recent Economic Developments and Outlook
2.3.1. Economic activity is easing. Following the rebound in 2010, private consumption
growth remained strong through the third quarter of 2011 giving robust employment and wage
growth. Manufacturing export growth has weakened, although commodity exports have
nevertheless continued to grow at a healthy pace. Forward-looking sentiment indicators suggest
less optimistic near˗term prospects (Figure 1).
2.3.2. The output gap has widened slightly but inflation remained contained. This reflects
the timely monetary policy tightening that began in 2010 and the easing of temporary supply side
factors which had increased headline inflation in the middle of 2011. Core inflation rose
modestly, reaching 4.6 percent in May 2012, reflecting the recovery in domestic demand.
2.3.3. The monetary policy stance has correctly balanced the risks to growth and inflation.
Headline inflation is projected to ease in 2012 as domestic demand moderates. As a result, policy
rates should be maintained around current levels, but should be eased if growth prospects worsen
significantly. The authorities should continue to allow two˗way flexibility of the exchange rate to
allow the currency to move in line with fundamentals, while limiting intervention to smooth out
excess volatility.
2.3.4. Notwithstanding the weakening environment, South Africa’s external position
remains strong. The real effective exchange rate remained broadly stable in the year through
July 2012 before the recent episode of market volatility, and the current account surplus is
expected to have remained roughly constant in 2012. This reflects stronger commodity exports
being offset by robust consumption and capital goods imports.
2.3.5. Continued strong growth in credit to households has increased household
indebtedness in recent years. Bank credit to the private sector has risen by 13.7 percentage
points to 87 percent of GDP during 2002−2008 and has averaged about 77 percent of GDP since
then. Despite the recent growth of credit, the banking system remains sound. Overall credit
growth continues to decelerate since 2008, but there are no evident signs of overheating or asset
price pressures. Against an average capital adequacy ratio of 14.3 percent over 2009-2011 period
nonperforming loans have declined by 1.2 percentage points to around 4.6 percent in March
2012. Housing prices rose by 3.3 percent nationwide during 2008−2011 period, but have eased
more recently and remain in line with fundamentals, although certain areas have seen sharp rises.
2.3.6. Fiscal policy continues to be countercyclical in support of growth and employment
given the continued weakness in global markets. Barring significant spending shortfalls at the

3
subnational level due to capacity constraints, the authorities will likely miss their fiscal deficit
target of 4.6 percent of GDP for 2012. Government spending on wages is projected to be higher
by 7.0 percent compared to the budget reflecting recent agreements with the unions. This is not
offset by revenues which are estimated to grow in line with the budget at 27.4 percent of GDP.
-12
-10
-8
-6
-4
-2
0
2
4
6
8
2008 2009 2010 2011 2012 2013 2014Per
cen
tReal GDP Growth
Real GDP growth
Gross value added at basic prices of manufacturing (GDP)_growth
4
5
6
7
8
9
10
11
2008 2009 2010 2011 2012 2013 2014
Per
cen
t
Annual Inflation
-6
-5
-4
-3
-2
-1
0
1
2
0
5
10
15
20
25
30
35
2001
2002
2003
2004
2005
2006
2007
2008
2009
2010
2011
2012
2013
2014
Per
cen
t o
f G
DP
General Government Revenue, Expenditure
and Fiscal Balance
General government total expenditure
General government revenue
General government net lending/borrowing (left scale)
3.8
5.95.3
4.9 4.8 4.74.4
-7.2
-4.0
-2.8 -3.3
-5.5 -5.8 -6.1
-8
-6
-4
-2
0
2
4
6
8
2008 2009 2010 2011 2012 2013 2014
Per
cen
t
Current Account Balance and Foreign Reserves
Gross reserves (in months of total imports)
Current account balance (% of GDP)
85
90
95
100
105
110
115
120
125
Jan-0
5
Jun-0
5
Nov-0
5
Apr-
06
Sep
-06
Feb
-07
Jul-
07
Dec
-07
May
-08
Oct
-08
Mar
-09
Aug-0
9
Jan-1
0
Jun
-10
Nov-1
0
Apr-
11
Sep
-11
Feb
-12
Jul-
12
Business Confidence Index
10
12
14
16
18
20
22
24
2.4
2.6
2.8
3.0
3.2
3.4
3.6
3.8
4.0
4.2
Jan-10 Jul-10 Jan-11 Jul-11 Jan-12 Jul-12
Per
cen
t
Tri
llio
ns
Market Capitalisation Volatility (left scale)
Stock Market (FTSE/JSE Top 40 Index)
Figure 1. South Africa Selected Economic Indicators
Sources: SA National Treasury, SA Reserve Bank, SA Statistics, SA Chamber of Commerce and Industry, SA JSE Limited, AfDB, IMF
4
To achieve the authorities’ projected deficit path and generate sufficient fiscal space,
consolidation needs to be faster than under the current medium-term scenarios.
2.3.7. Financial market volatility has risen alongside higher global risk aversion. Capital
flows were robust through the first half of 2012 led by portfolio bond inflows. However, foreign
investors subsequently scaled back their exposures, mainly in equity markets and Government
securities, prompting a rand depreciation of around 8 percent against the U.S. dollar since the
beginning of 2012. Business Confidence Index which measures relative business confidence
over time is showing a downward trend. The EMBI sovereign spreads for South Africa
highlighting investor risk aversion with respect to South African securities has been volatile but
trended downward since the beginning of 2012.
2.3.8. The risks to growth over the medium term are tilted to the downside. While a
softening in activity is envisaged in 2012, the risks of a sharper slowdown are substantial if the
Eurozone crisis continues to deepen. There is enough scope for monetary policy to be eased if
the growth outlook weakens substantially, but fiscal space is more limited. Domestic downside
risks include the potential that households will be unable to sustain their consumption growth
due to high levels of indebtedness, and that credit quality may decline with income. This could
be exacerbated by a tightening of financing conditions. If downside risks materialize, temporary
expenditure measures could be put in place but would need to be solidly framed within a credible
medium-term consolidation plan. On the upside, a swift and decisive resolution of the crisis in
Europe as well as faster growth in other major advanced economies would increase South
African exports.
2.4. Business Environment and Competitiveness
2.4.1. The assessments of private business regulatory climate indicate that the country
remains one of the most conducive in Africa. The World Bank’s Doing Business 2012 Report
ranks South Africa 35th
globally and 2nd
in Africa after Mauritius. In 2010/11 South Africa
implemented a new company law, which eliminated the requirement to reserve a company name
and simplified the incorporation document. It also reduced the number of days required to
register property and simplified business exit regulatory requirements. The Government has also
introduced a number of measures to ensure equity and efficiency of the tax system, including
reducing the number of tax paid from 12 in 2006 to 9 in 2010 and total tax rate as percent of
commercial profit from 37.6 percent in 2006 to 30.5 percent in 2010. Import tariff has been
reduced significantly; tax on international trade and transactions accounted for 4.5 percent of tax
revenue in fiscal 2011/12 compared to 4.8 percent in fiscal 2006/07.
2.4.2. In spite of these measures challenges remain. Trading across borders remains difficult,
with the country ranking 144th
out of 183 countries. For instance, it takes 30 days to export and
31 days to import compared to 5 and 4 days, respectively, in Singapore. The product market
regulation is also regarded as relatively onerous partly due to the presence of significant number
of parastatals which enjoy near monopoly positions. The South African economy is highly
concentrated and anticompetitive trade practices are widespread. Labor laws are characterized by
a considerable degree of rigidity in hiring and firing workers, while minimum wage demanded
by new entrants is considered to be three times the average for the other BRICS countries. Apart
from these, historical and new barriers to growth and formalization of microenterprises remain
high, exacerbating the unemployment problem.
5
2.5. Governance
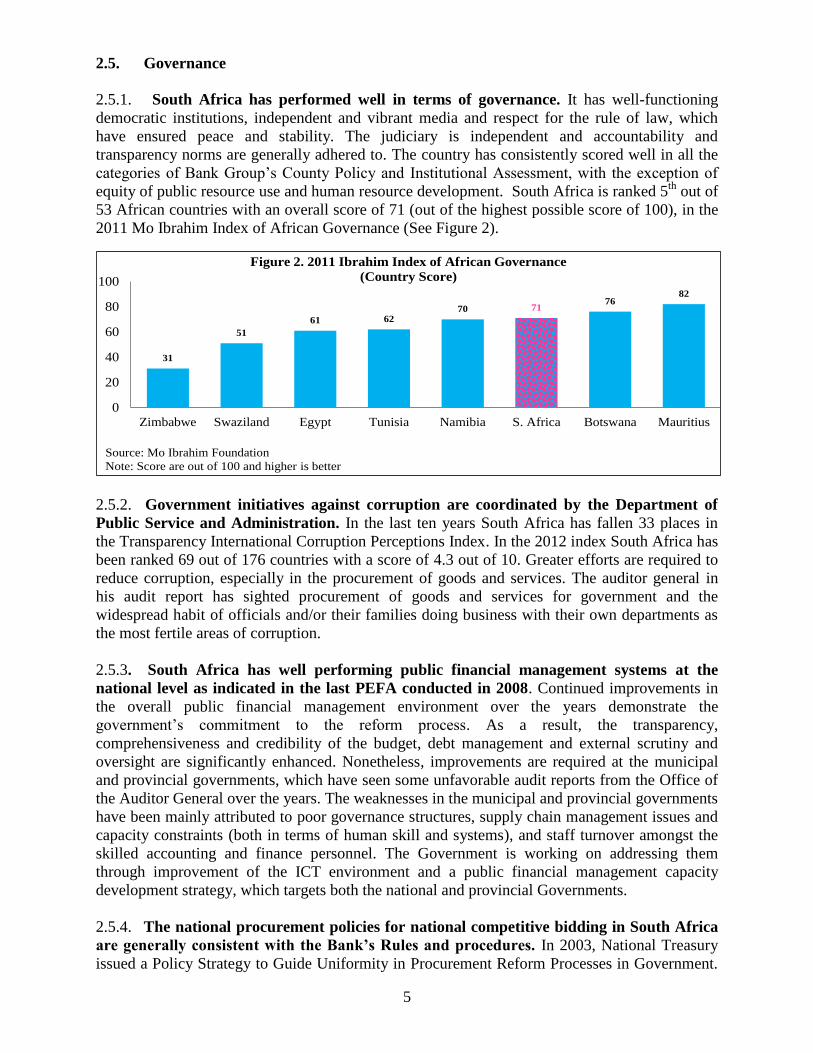
2.5.1. South Africa has performed well in terms of governance. It has well-functioning
democratic institutions, independent and vibrant media and respect for the rule of law, which
have ensured peace and stability. The judiciary is independent and accountability and
transparency norms are generally adhered to. The country has consistently scored well in all the
categories of Bank Group’s County Policy and Institutional Assessment, with the exception of
equity of public resource use and human resource development. South Africa is ranked 5th
out of
53 African countries with an overall score of 71 (out of the highest possible score of 100), in the
2011 Mo Ibrahim Index of African Governance (See Figure 2).
2.5.2. Government initiatives against corruption are coordinated by the Department of
Public Service and Administration. In the last ten years South Africa has fallen 33 places in
the Transparency International Corruption Perceptions Index. In the 2012 index South Africa has
been ranked 69 out of 176 countries with a score of 4.3 out of 10. Greater efforts are required to
reduce corruption, especially in the procurement of goods and services. The auditor general in
his audit report has sighted procurement of goods and services for government and the
widespread habit of officials and/or their families doing business with their own departments as
the most fertile areas of corruption.
2.5.3. South Africa has well performing public financial management systems at the
national level as indicated in the last PEFA conducted in 2008. Continued improvements in
the overall public financial management environment over the years demonstrate the
government’s commitment to the reform process. As a result, the transparency,
comprehensiveness and credibility of the budget, debt management and external scrutiny and
oversight are significantly enhanced. Nonetheless, improvements are required at the municipal
and provincial governments, which have seen some unfavorable audit reports from the Office of
the Auditor General over the years. The weaknesses in the municipal and provincial governments
have been mainly attributed to poor governance structures, supply chain management issues and
capacity constraints (both in terms of human skill and systems), and staff turnover amongst the
skilled accounting and finance personnel. The Government is working on addressing them
through improvement of the ICT environment and a public financial management capacity
development strategy, which targets both the national and provincial Governments.
2.5.4. The national procurement policies for national competitive bidding in South Africa
are generally consistent with the Bank’s Rules and procedures. In 2003, National Treasury
issued a Policy Strategy to Guide Uniformity in Procurement Reform Processes in Government.
31
51
61 6270 71
7682
0
20
40
60
80
100
Zimbabwe Swaziland Egypt Tunisia Namibia S. Africa Botswana Mauritius
Figure 2. 2011 Ibrahim Index of African Governance
(Country Score)
Source: Mo Ibrahim Foundation
Note: Score are out of 100 and higher is better

6
Preferential Procurement Policy Framework Act was amended to integrate preferences with
legislation on Black Economic Empowerment. In 2007, the government issued the Municipal
Regulations on Minimum Competency Levels. This provides minimum levels of educational
qualifications and experience for Supply Chain Management personnel. There is also increasing
movement towards e-procurement in the public sector, including training for small and medium
firms. The Bank undertook an assessment of the South African national procurement procedures
in 2011 to determine the conditions under which they will be used for awarding contracts under
national competitive bidding in Bank financed projects. The main deviations of the procurement
procedures are with respect to compliance with the Bank’s fiduciary obligations, and compliance
with internationally accepted best practice.
2.6. Trade and Regional Integration
2.6.1. South Africa has succeeded to reinsert its economy back into world trade following
a long period of internal political difficulties and international reactions to the apartheid
regime. The ratio of trade in goods and services to GDP rose from 41 percent in 1994 to 53
percent in 2011 indicating that the international exchange of goods and services has been an ever
more important element of economic activity in South Africa in the post-apartheid era. However,
since the mid-1990s, the trade sector has not been able to keep up with developments in world
markets – especially in intermediate goods. South Africa‘s position in the global trade
architecture has remained constant or even deteriorated slightly since 1995. This flat trend
contrasts with the performance of its BRICS partners (Brazil, Russia, India and China) who
continued to deepen their integration into world trade supply chains after 1995.
2.6.2. South Africa has significant interests in the SADC region and in regional
integration. It dominates the region economically, accounting for 41 percent of SADC’s total
trade and about 63 percent of SADC’s GDP. It has the requisite economic capability and levels
of diversification that are required to drive economic integration in a manner that is mutually
beneficial to the region – technology transfer, reduce poverty, foster social development and
promote collective protection of the environment, particularly in the case of shared
(transboundary) natural resources. South Africa's economic weight and growth spillovers to the
rest of the region have traditionally underpinned its key role in trade and economic integration
initiatives in the region. Besides its important role in SACU, South Africa is also engaged in
ongoing liberalization efforts within SADC. The official launch of the SADC Free Trade Area in
August 2008 paved the way for a broader customs union, monetary union, and a common market
in the future. The current global economic crisis has prompted ambitious discussions to create a
unique trading block involving COMESA, EAC and SADC that would serve as a stepping-stone
towards the creation of an African Economic Community.
2.6.3. Since 1994, South Africa has gained prominence on the international stage. It is an
active member of key multilateral institutions and a key player at the G-20, and the G-24. South
Africa joined the BRICS in April 2011 and is an avid promoter of South-South cooperation (see
Box 1).
2.7. Poverty, Social Inclusion and Equity
2.7.1. South Africa is the world’s most unequal society. Despite South Africa's position as
Africa's economic powerhouse, its wealth is spread more unevenly than in any other country in
7
the world; the gap between rich and poor is wide. The top deciles accounts for 58 percent of the
country’s income while the bottom deciles accounts for 0.5 percent. Income Gini coefficient
remains around 0.70 while consumption Gini was 0.63 in 2011 (see Annex 2). Its dual economy
is characterized by a well-developed economy on one hand and an underdeveloped and
marginalized one on the other. High structural unemployment and considerable social challenges
include violent crime and an HIV/AIDS pandemic. Real poverty has declined due to
Box 1. South-South Cooperation-Opportunities and Challenges
South Africa is a becoming a key player in global institutions. In addition to regional and continental
memberships, South Africa is a member of the International Monetary Fund, the World Bank, the World Trade
Organization and the United Nations system in general. With other emerging markets, it is playing a pivotal role
in reshaping global governance and financial and trade architecture. Its membership of the G20 group of
advanced and emerging economies is in line with the shifting balance of global economic power. In April 2011,
South Africa became the fifth partner of the BRICS. The strategic role of these emerging economies cannot be
overstated. The early twenty-first century has seen the beginning of a considerable shift in the global balance of
power. Major international governance challenges can no longer be addressed without the ongoing co-operation
of the large countries of the global South.
Opportunities for South-South Cooperation: Since emerging market countries, especially the BRICS, began
their steady climb, international cooperation has been faced not only with new opportunities, but also with a
number of specific challenges. In the past decade South-South trade has expanded more quickly than North-South
trade. South-South investment too has shown unprecedented dynamism driven by complementary structures in
the two regions—African raw materials for industrial, manufacturing and service industries. Investors from the
South often have important regional know-how, use appropriate technologies and prove more willing to take
business risks in a difficult political environment. A further indicator of the increased importance of South-South
cooperation is the fact that countries in the South have become an additional source of official development
assistance but along the lines of the Baudung Principles, especially that of non-interference in the recipient
country’s internal affairs.
Challenges of South-South Cooperation: While the positive sides of the current South-South dynamism are to
be seen primarily in the increased inflows of resources, especially to the benefit of poor developing countries,
many African states face major challenges because of increased dependence on raw materials and the greater
pressure of competition from Asian countries in the case of light manufactures. The high-level dialogues between
the G8 and the five leading anchor countries (Brazil, China, India, Mexico and South Africa) announced as part of
the Heiligendamm process may help considerably to ensure that benefits are derived from closer South-South
cooperation and that conceivable risks are discussed. Partners are determined to work to strengthen
complementarity between them, building on their common objectives and learning from each other. During the
political debate new relations have also been identified from time to time.
BRICS Bank: An important initiative resulting from the BRICS grouping is the proposal for the creation of a
BRICS Bank – a developmental-focused finance institution to support and drive commerce between the BRICS
economies and South-South cooperation. While it may be necessary to develop a financial institution to support
trade and development within the BRICS, the strategic question for Africa and the Bank is how the BRICS bank
will benefit African business and the African development and integration agendas. The headline is that the bank
will direct sovereign wealth to serve the development needs of the developing economies: a “South-South” bank.
The multilateral bank may emulate BRICS financial institutions such as Development Bank of South Africa,
China Development Bank and the Brazil Development Bank, which have direct capital to designated “strategic”
projects in domestic economies as well as projecting commercial interests abroad.
Knowledge work: Broader support for South-South cooperation for knowledge sharing and technology transfer
will be a key feature of the new CPS, including expanded cooperation with the centers of excellence in South
Africa. The Bank will actively promote knowledge sharing between centers of excellence in South African and
the rest of the BRICS for showcasing innovative projects, developing capacity, and encouraging institutional
reform. Through the South-South knowledge sharing platform, South Africa will be an entry point to knowledge
sharing between the BRICS and the rest of the continent. To this end, South-South regional and continent wide
knowledge sharing initiatives will be actively promoted.

8
redistribution – an increase in government grants – rather than growth in the country’s
productive capacity. The percentage of individuals that benefited from social grants has
increased significantly from 12.9 percent of the total adult population in 2002 to 29.6 percent in
2011, while the percentage of individuals that were at risk of food insecurity decreased from 27.1
percent of total population to 23.3 percent between 2002 and 2011. Yet this redistribution
remains limited.
2.7.2. South Africa is characterized by chronic high levels of unemployment. The total
number of unemployed labour force reached 4.47 million during the second quarter of 2012. Of
these, 49.8 percent are women; 59.3 percent of the unemployed did not complete grade 12, while
6.3 percent had tertiary qualification. About 52.7 percent of African and Coloured population is
unemployed, while 9.5 percent of Indians and 5.7 of Whites are unemployed. Over 50 percent of
youth is unemployed. The main cause of the high unemployment remains the mismatch between
the skills the population can offer and the formal sector requirements. The situation has been
worsened by the global financial and economic crisis. South Africa lost 870,000 jobs between
the fourth quarter of 2008 and the fourth of quarter of 2009 due to the global economic
downturn. The UNDP Human Development Report 2011 ranks South Africa 123rd
out of 187
countries, placing it in the category of countries that have achieved modest levels of human
development.
2.7.3. Poverty levels remain unacceptably high. Incidence of poverty in rural areas is more
than twice as high as in the urban areas. The proportion of the population living below US$1.25
(PPP) per day was 13.8 percent in 2011 (See Annex 2). About 69 percent of those who live in
poverty live in rural areas and 31 percent live in urban areas. Although access to basic social
services is relatively high, (nearly 90 percent of South Africa’s households have access to piped
water and 83 percent are connected to electricity supply), however, access to decent housing
remains a major challenge with nearly 19 percent of households living in informal settlements.
Through active Government interventions in fighting poverty, South Africa has more than halved
the population living in extreme poverty and thus met the MDG 1 ahead of the target date.
2.7.4. The national literacy rate remains very high and universal access and gender parity
have been achieved in schooling in 2010 and about 99 percent of children complete grade 1
to 9. Youth functional illiteracy fell to less than 10 percent in 2009. However, the quality of
education for poor black South Africans remain inadequate. Only 1 percent of African schools
are among top performing on high school certificate results, as compared to 31 percent for
formerly privileged schools. The key concern for the Government remains improving the quality
Box 2. Unemployment and Need for Greater Economic Transformation
Deeply entrenched legacy issues and post-apartheid economic policy that focused on exports of primary
products has failed to address the structural unemployment rate of about 25 percent, which has the
potential to be establishing over the medium term. Prior to 1994, South Africa’s development was based on
exports of primary products, particularly gold and other minerals. Manufacturing developed gradually,
stimulated by state-led and private investment. The post-apartheid Government starting in 1994 pledged to drive
a structural transformation of the economy to redress the apartheid legacy of poverty and inequality. Almost
two decades later, the challenge remains and inequality continues to grow. The economy is now dominated by
finance capital and owners of mineral-energy resources. Platinum has replaced gold as the key mineral export.
South Africa’s manufacturing sector which was strong prior to 1994 has declined. Globalization has meant a
collapse of the tariff barriers that protected manufacturing, and the influx of cheap manufactured goods has led
to the decline of local industries. The local shoe and clothing manufacturing industry, for instance, has been
dramatically reduced as a result of imports from Asia. The decline of manufacturing has increased structural
unemployment (See Annex VIII).

9
and the functionality of the education system particularly within historically black and
chronically underperforming sections of the country is schooling system.
2.7.5. Substantial progress has been made in the prevention of malnutrition, mother to
child transmission of HIV, immunization coverage and access to free health care facilities. In spite of these, the national incidence of severe malnutrition averaged 7.8 percent and studies
indicate a rising trend in child mortality in recent years. The under-five mortality rate of 54.3 in
2011 was far higher than the target of 20 deaths per thousand live births by 2015. A key concern
for the Government is how to make optimal use of current health resources to achieve better
health outcomes for children, while ensuring the quality and effectiveness of implementation.
Moreover, despite having the largest antiretroviral treatment program in the world, the country
had not achieved the goal of universal access to antiretroviral treatment for all those who need it
by 2010. As a result, it is unlikely to achieve the MDG of halting and reversing the spread of
HIV and tuberculosis by 2015.
2.8. Gender
Women’s access to political power and decision-making has improved since 1994. A
number of departments (national and provincial) have made considerable progress in gender
representation at senior management levels. Despite improvements in addressing the gender
divide, the authorities and development partners acknowledge that the empowerment of women
remains a slow process especially at the provincial level. South Africa’s success in bringing
about gender equality has perhaps been most visible in the area of politics and decision making,
particularly in national parliament where 42.3 percent of Members of Parliament and 39 percent
of cabinet ministers are women in 2012. More needs to be done, to improve the lives of rural
black women. The Government has successfully tackled gender gaps in education. Access to
health services has greatly improved but it is still very unequal. HIV/AIDS infection rate remains
high, with women primarily affected due to poverty. Social security services have greatly
improved and numerous legislations on women’s rights have been promulgated.
2.9. Environment and Climate Change
The Government has made significant achievements in developing a robust and
conducive policy, strategic, institutional and analytical framework for addressing climate
change impacts that the country is currently facing. Through the recently adopted National
Climate Change Response Policy which guides the implementation of climate change initiatives,
work is underway to mainstream climate change adaptation, mitigation and disaster risk
management priorities into key economic sectors which include: (i) water; (ii) agriculture; (iii)
health; (iv) biodiversity and ecosystems; and, (v) human settlements. On mitigation, the
Government is currently assessing the existing potential for reducing carbon dioxide, while at the
same time identifying priority adaptation measures to be incorporated into sectoral plans to
ensure climate change issues are addressed. A national Monitoring and Evaluation system is
being set up for data collection, monitoring and reporting that will detail up-to date emissions
data in the form of a greenhouse gas inventory; develop indicators for measuring the transitional
process to low carbon development and climate resilient economy and society; and, analyze the
impact of mitigation and adaptation measures and track funding flows. A governance structure,
housed within the Department of Environmental Affairs, has also been set up to coordinate and
manage climate change initiatives. South Africa also signed a comprehensive Green Economy
Accord with various social partners in 2011 to create more than 300,000 jobs over the next
decade.
10
III. HIGHLIGHTS OF PREVIOUS BANK COUNTRY STRATEGY
3.1. The key strategic directions of the Country Strategy Paper (CSP) 2008-2012 were:
(i) enhancing private sector competitiveness; (ii) partnership for regional integration and
development; and, (iii) knowledge management and capacity building. The CSP was reviewed
and updated in November 2009 and reaffirmed the relevance of the main pillars of the strategy.
3.2. Bank Portfolio: Bank Group portfolio in South Africa has 23 operations with a total
commitment of UA3.23 billion. The portfolio comprises of 5 public sector projects (including 2
loans and 3 grants), 8 private sector loans and 10 private sector multinational loans and equity
investments. Public sector projects account for 61.5 percent of total operations, while private
sector loans account for 33.1 percent and private sector equity investments take up the balance.
Bank operations in South Africa are dominated by the energy sector (which takes up 62 percent)
and finance (21.4 percent). The remaining investments cover transport and communication,
mining beneficiation, support to SME development, and water and sanitation (See Annex IV).
3.3. Performance of Bank Group Portfolio: The overall performance of the Bank Group
portfolio is satisfactory. As at end of June 2012, the average disbursement rate was 53 percent
(See Annex V). Although most projects encountered start up delays, progress towards achieving
CSP outputs has generally been satisfactory with noticeable progress in implementation in the
priority sectors. It is too early for the outcome targets, especially long-term outcomes, to
materialize.
3.4. Lessons from Past Strategy and Interventions: The CSP Completion Report and Country
Portfolio Performance Review (CPPR) provided important lessons that have informed the design
of the new CSP (See Annex VI for the Summary Completion Report). Box 3 below highlights
the key lessons that informed the design of the new CSP.
Box 3. Lessons from CSP Completion Report and CPPR
Better benchmarking of Results framework. The need for clear baseline data for the output and outcome
indicators to ensure better monitoring of results.
Support for energy companies and various modalities of carbon trading and finance can make a positive
contribution to green development. Emphasis on innovation and clean technology requires the Bank to
continuously improve staff’s knowledge of emerging technologies.
Improved connectivity is correlated with increased business cooperation, cross-border trade, and
investments. The country program can reinforce the Bank’s regional integration initiatives by focusing on
transport connectivity and border town development to promote economic corridors;
There is a need to focus on more vigorous application of project readiness filters to improve quality–at-
entry and address systemic obstacles in processing and implementing projects.
Need for the Bank to add value to the development process of middle-income countries like South Africa
with an expanded focus on private sector development as well as encouraging more public-private partnerships.
More innovative approaches are needed to support the SME sector. Due to availability of low cost loans to
the private sector from the Government, especially to SMEs, and in addition to direct funding, the Bank will
explore new mechanisms for supporting private sector development.
The Bank should continue to explore cooperation with South African institutions. To catalyze financing
for regional infrastructure greater attention should be paid to capacity development and inter-agency
coordination to facilitate increasingly complex financing initiatives.
The transaction costs involved in accessing MIC and Bilateral Trust Funds are considerable. The Bank
will seek to simplify and streamline its fiduciary processes and being more flexible without compromising
standards.
For MICs, the Bank should look beyond the provision of financial assistance as the main modality for
development cooperation and emphasize other value-added partnership modalities including serving as an agent
for capacity development, knowledge management, technology facilitation, and South-South cooperation.

11
IV. THE COUNTRY STRATEGY
4.1. Government National Strategy
4.1.1. The New Growth Path and the National Development Plan support the Government's
long-term goal of building a harmonious and prosperous society through livelihood
improvement, and regionally balanced and environmentally sustainable growth. Reforms will be
carried out to stem rising income inequality, address structural imbalances, and further open up
the economy. Public expenditure will be geared towards livelihood improvement, and strong
support will be provided to education, healthcare, social security and public housing.
Infrastructure remains a high priority with an emphasis on promoting rural development and
emerging strategic industries, in particular modern clean energy and environment-friendly
technologies, while piloting development of green and low-carbon cities. Resource conservation
to combat climate change and improve natural resource management is also a priority.
4.1.2. The National Development Plan (NDP) builds on the Government's New Growth
Path (NGP), which targets 5-million new jobs by 2020. It sets an ambitious target of reducing
South Africa's unemployment rate from 25 percent in 2011 to 6 percent by 2030 by creating
11million new jobs. This will require meeting the subsequent target of annual average GDP
growth of around 5½ percent between now and 2030. Both the NGP and the NDP focus strongly
on economic interventions to achieve job-creating growth. To increase both employment creation
and economic growth, the plan proposes 8 interventions:
Raising exports, focusing on areas in which South Africa already has endowments and
comparative advantages, such as mining, construction, mid-skill manufacturing, agriculture and
agro-processing, tourism and business services;
Increasing the size and effectiveness of the country's innovation system, and ensuring closer
alignment with companies that operate in sectors that fit in with the growth strategy;
Improving the functioning of the labor market to help the economy absorb more labor,
through reforms and specific proposals concerning dispute resolution and discipline;
Supporting small business through better coordination of the activities of small business
agencies, development finance institutions, and private and public incubators;
Improving the country's skills base through better education and vocational training;
Increasing investment in social and economic infrastructure in order to lower costs, raise
productivity and bring more people into the mainstream of the economy;
Reduce the regulatory burden in sectors where the private sector is the main investor, such as
broadband internet connectivity, to achieve greater capacity and lower prices; and,
Improve the capacity of the state to implement effective economic policy.
Industrial Policy Action Plan remains the key pillar of the NGP and has put in place necessary
platforms to unlock growth and employment generation in a range of sectors including the

12
amendment of procurement regulations; the launching of the manufacturing competitiveness
enhancement programme; greater strategic alignment of trade and competition policy with
industrial policy; and interventions designed to stimulate sub regional growth through Special
Economic Zones, among others.
4.1.3. Intersection with the Bank’s Long-Term Strategy (LTS): The Bank’s new LTS
objectives of supporting inclusive and the transition to green growth are consistent with the main
priorities of the NGP and the NDP. In particular, the Bank’s focus on infrastructure, skills
development and regional integration is consistent with South Africa’s approach to development,
while the emphasis on environmental protection and addressing the impacts of climate change is
consistent with the Government’s approach to environmentally sustainable development. Both
the Bank and the Government share the goal of strengthening private sector development and
South-South cooperation for knowledge sharing. An improved investment climate will enhance
private sector development. South Africa’s priority areas of infrastructure, manufacturing, skills
development, and environment are shared with the LTS.1 In other words, South Africa’s priority
of creating a harmonious and prosperous society, by reducing inequalities, is in line with the
inclusive growth objective of the LTS, while the focus on climate change and environmental
issues is in line with the transition to green growth agenda. Development of lagging regions and
cooperation on environment and climate change are expected to contribute to enhanced regional
cooperation and integration. Good governance, gender equity, and knowledge solutions are also
key components of the LTS.
4.1.4. Relevance of the CSP Completion Report: The findings and recommendations of the
last CSP as described in paragraph 32 above remain highly relevant to the preparation of the new
CSP given the high degree of continuity between the Government’s NGP and NDP. In particular,
the new CSP’s focus on skills development for job creation will reinforce the Government’s
ongoing emphasis on inclusive growth and fostering social cohesion while ensuring green
1 A report on “Manufacturing, Productivity, Innovation and Jobs: A comparison with the BRICS” is summarized in
Annex VIII. The New Growth Path, as well as the Industrial Policy Action Plan, regard manufacturing as the main
driver of growth and employment. The Government has introduced the Manufacturing Competitiveness
Enhancement Scheme to revitalize the sector to reverse the current trend of deindustrialization and promote
employment creation. The manufacturing sector study contributes towards this effort.
Box 4. The Link between Bank LTS, Southern African RISP, and South African CSP 2013-2017
The Bank Group Long Term Strategy strives to support the twin cross-cutting objectives of inclusive
growth and transition to green growth in the Regional Member Countries. It focuses on five core operational
priorities that will inform all of its activities, namely infrastructure development, regional integration, private
sector development, governance and accountability, and skills and technology. The Southern Africa RISP
conforms to the themes of the LTS and is underpinned by the Bank’s Regional Integration Strategy, which
focuses on regional infrastructure and capacity building in support of infrastructure interventions. Regional
integration remains key to the Bank’s mandate and is an important continental initiative. The Bank is well
positioned to play a lead role in fostering the integration of Africa’s economies to create larger more attractive
markets, linking landlocked countries to international markets, and support intra-African trade. Regional member
countries see the private sector as key partner in ensuring quality and sustainable growth. The Bank will therefore
assist RMCs create an enabling environment for expanding domestic and foreign investment and promote the
development of African businesses and entrepreneurs to attain inclusion and seize green growth opportunities to
create jobs and enhance wealth. The South Africa CSP 2013-2017 is fully aligned with the strategic thrust of the
Bank’s LTS and the Southern Africa RISP. The two proposed areas of focus, infrastructure, and regional
integration, driven by private sector development, human capital development, knowledge services, and
governance will significantly contribute to reduction in poverty and inequality, while addressing challenges of
environmental sustainability.

13
economic development. Further, a longer time is required to implement fully the strategic
repositioning initiated under the previous CSP.
4.1.5. Coordination of the Bank’s assistance: Development assistance constitutes less than 1
percent of the South African budget and there is no institutionalized donor coordination
mechanism in South Africa. The Ministry of Finance and National Treasury coordinate the
Bank’s development assistance to South Africa. The Bank consults regularly with relevant line
ministries and local government agencies. In addition, the Bank maintains regular contact with
development partners and civil society groups to exchange information and foster cooperation in
areas of common interest. The initiative to cooperate with DFID on regional integration is one of
such engagements. The Bank also works with private sponsors, state-owned enterprises and
domestic financial institutions on issues related to private sector development. Infrastructure
investment including support to transition to green growth remains the main area of comparative
advantage for the Bank. South Africa has launched a massive infrastructure investment plan
worth R3.2 trillion over the next decade and the Bank is well positioned to tap into further
financing opportunities during the current CSP period.
4.1.6. Apart from the Bank, South Africa’s major development partners with field presence in
the country include the World Bank, the European Union, DFID and the United Nations
Agencies (Annex VII). The World Bank is one of the main co-financiers of the largest Bank project
in South Africa (the Eskom Medupi Power project). The Bank has emphasized the use and
strengthening of the country systems to build effective institutions in line with the Paris Declaration
and Accra Agenda, as well as the Busan Partnership for Effective Development Cooperation. The use
of country systems for financial management of Bank funded projects is the main area that requires
greater improvement in donor harmonization.
4.2. The Bank’s Country Strategy
4.2.1. Goals, Objectives, and Assistance Approach: The new CSP seeks to adapt to South
Africa’s rapidly changing circumstances and set a new foundation for the continuously evolving
partnership with the Bank. Almost two decades of successful reforms have helped South Africa
maintain its position as Africa’s largest economy and facilitated a swift transition to the rank of
major world economies. In line with its growing economic strength and international status,
South Africa has come to play an increasing role in promoting regional and pan-African
integration, continental and global public goods, sharing knowledge, and providing development
assistance both bilaterally, as well as through multilateral finance institutions (See Box 1).
4.2.2. Despite these, South Africa continues to face complex development challenges,
including significant poverty, sharp income inequality, and widening regional disparities.
In addition, South Africa’s economy is highly carbon-intensive, and its greenhouse gas emissions
per capita are similar to that of industrialized countries, partly because of its strong reliance on
coal, which places it at the center of the global climate change challenge. Failure to address more
decisively the rising fiscal pressures and social agenda would jeopardize South Africa’s long-
term growth prospects. Thus, there remains important and challenging development work for the
Bank to undertake in South Africa, which continues to rely on external financing and technical
assistance (TA) to complement its own financing and expertise to catalyze policy reform,
introduce innovation, access new technology, and adopt international best practices.
4.2.3. The new CSP therefore seeks to position the Bank to continue playing a catalytic
role in South Africa’s development process through an enhanced operational focus on

14
innovation and value addition to support manufacturing and job creation. It promotes
intensified focus on generating knowledge, sharing best practices, building capacity, and
fostering regional cooperation. The Bank’s comparative advantage is that South Africa’s higher
education system is characterized by weak knowledge production that often does not translate
into innovation to support manufacturing and create jobs. Lending activities will include smaller
demonstration and pilot-type projects for scaling-up through domestic financing. This, in turn,
would facilitate knowledge sharing among executing agencies and with other developing
member countries through South-South cooperation, and foster a stronger strategic focus on
inclusive and environmentally sustainable growth as well as regional cooperation and
integration.
4.2.4. The opening of the Southern Africa Resource Centre (SARC) has ensured better partner
coordination. SARC is working closely with South Africa and the Regional Economic
Communities to deepen regional integration and economic cooperation to enhance the region’s
competitiveness and diversification of economic activity to spur inclusive and sustainable
growth. The opening of SARC has also enhanced portfolio performance through (i) improved
consultation with local authorities, as well as development partners for joint initiation, design,
financing and monitoring of projects, and (ii) timely support to capacity development of
implementing agencies in various aspects of project management. Further, collaboration
between ECON and SARC would significantly enhance the Bank’s capacity to respond with
knowledge solutions on emerging issues, as well as preparation of influential policy notes on key
issues.
4.2.5. Country Strategy Pillars: The CSP for 2013-2017 is closely attuned to the needs of
South Africa as a large middle-income country. Guided by the Government’s commitment to
“pro-poor, pro-job, pro-growth, and pro-environment” development, the two strategic pillars are
infrastructure; and regional integration. The pillars are consistent with the Government’s longer-
term master plans of job creation and inclusive growth and climate change action plans.
Synergies between the lending, TA, and Analytical Advisory Assistance (AAA) programs will
be strengthened as will the complementarity between public sector and non-sovereign operations
by mainstreaming private sector development across the full range of operations. Further, other
cross cutting themes such as knowledge solutions, good governance and capacity development,
and gender equity will be actively pursued to maximize development impacts.
Pillar 1: Infrastructure. The Bank will support government efforts to achieve growth that is
more inclusive through infrastructure development. The Bank’s public sector operations will
seek to strengthen the enabling environment for private sector development by financing
infrastructure development while the non-sovereign operations will continue to finance catalytic
projects, including improved financial and logistical services, and public-private partnerships
(PPPs) for infrastructure investment, particularly in clean energy, urban environmental
protection, and social infrastructure. The Bank will support the government’s efforts to
foster a cleaner and more sustainable growth process by strengthening capacity of
environmental management and pilot testing cutting-edge clean energy and energy
efficiency technologies. Support for the development of low-carbon transport systems,
particularly in public transport; strengthening protection and sustainable use of land, water and
forest resources; helping to develop model livable and low-carbon cities; and promoting the
development and institutionalization of green financing instruments will be key drivers for Bank
engagement. The South African government has launched R840 billion medium and R3.2 trillion
long-term National Infrastructure Plan in 2012 to transform the economy, create jobs, ensure
inclusive growth and promote regional integration. The plan also identifies lack of skills and

15
capacity in particular lack of engineers, technologists, and technicians as well as project
managers as the main constraint to implement the program. On skills development, the Bank will
support the Government’s efforts to achieve inclusive growth through interventions in Higher
Education, Science and Technology (HEST) for innovation and technical skills for the
implementation and maintenance of the critical infrastructure. Inclusive growth and equity would
benefit from greater private sector participation in the economy to generate better employment
prospects, as private companies generate the largest share of GDP growth and employment.
Pillar 2: Support for Regional Integration. This pillar will provide the link that is needed
between the country strategy and the RISP. In this regard, the regional orientation of the country
program will be further strengthened to complement the Bank’s support for regional cooperation
programs, particularly the Southern Africa Regional Integration Strategy and SADC programs.
The Bank will continue to work closely with the Government to support regional integration
through country projects and TA, with a focus on transport connectivity, clean energy,
development of corridor cities, and trade facilitation to promote economic corridors for
regionally inclusive development. In addition to these, the Bank will seek to strengthen the
enabling environment for private sector development by supporting policy and regulatory
reforms, and improving access to finance. The Bank's non-sovereign operations will continue to
finance catalytic projects, focusing on innovative financing solutions (i.e. microfinance, SMEs,
green finance, lines of credit to financial institutions for cross border investments, and trade
finance). The Bank will also strengthen capacity and strategy development support for
government agencies involved in regional programs. Support for regional integration will
continue to reinforce the country program’s efforts to reduce regional imbalances. Further, the
Bank will strengthen efforts to promote knowledge sharing between South Africa and other
regional and non-regional member countries for expanded South-South cooperation mainly
through ESWs.
4.3. Cross-Cutting Issues
4.3.1. Knowledge solutions: Knowledge sharing will be more actively promoted in all the
priority sectors to promote best practices and scaling up of successful demonstration
projects. Capacity development and policy advisory technical assistance will be complemented
by Analytical Advisory Assistance to enhance the Bank’s responsiveness to government requests
for policy advice on a wider range of issues. The Bank will also actively promote knowledge
sharing among executing and implementing agencies for showcasing innovative projects,
developing capacity, and encouraging institutional reform. Further, broader support for South-
South cooperation for knowledge sharing will be a key feature of the new CSP, including
expanded cooperation with the South Africa’s centers of excellence and the BRICS.
4.3.2. Gender equity: Gender equity will remain the key component of the strategy and
will be proactively incorporated in loans and technical assistance. Project preparatory
technical assistance will identify ways in which gender can be mainstreamed and gender action
plans will be prepared during project formulation and included in the project appraisal. Gender
performance targets, indicators and benchmarks will also be included in the design and
monitoring frameworks of relevant projects as appropriate. Where feasible, gender-disaggregated
data will be identified and collected as part of project monitoring and evaluation, and included in
gender action plans.
4.3.3. Good Governance: The Bank will support government efforts to strengthen the
policy, legal, fiduciary and regulatory frameworks and practices to (i) improve delivery and

16
management of infrastructure and public services, and (ii) promote the enabling environment for
private sector development. The Bank will also provide support for PPPs, reform of tariffs and
cost-recovery policies for sustainable development of clean energy and municipal services, and
adoption of regulations and market-based solutions to encourage natural resource conservation.
Further, the Bank will expand its support for capacity development and sharing of good
practices, including from its non-sovereign operations.
V. STRATEGY IMPLEMENTATION
5.1. Indicative Resource Parameters
5.1.1. South Africa is an ADB only country in the Bank’s country classification system and
is eligible for ADB financing. According to the three-year rolling plan and budget 2013-2015,
the indicative sovereign lending level is about UA700 million per annum during 2013-2015,
broadly in line with the average annual lending in the previous CSP period, 2008-2012. The
annual sovereign lending level beyond that point would continue to be formulated in the context
of the annual work program and budget framework exercise (See Table 1).
5.1.2. In terms of financing, actual ceilings for the Bank financing will be determined by
project-specific considerations, Bank’s risk exposure and available co-financing. The Bank
will draw on a mix of financing instruments to provide longer-term financing predictability and
integrate support for reform programs and capacity development with investment operations. The
use of multi-tranche financing facilities, sector development programs, sector loans, retroactive
financing, and global funds will be explored, in addition to policy-based loans, investment
projects, and technical assistance projects. Non-sovereign operations will follow the Bank’s
prudential exposure limits and continue to mobilize commercial financing and private
participation in Bank financed projects. SARC and the Private Sector Operations Department
will work closely to create further synergies between public and non-sovereign sector operations.
5.1.3 Trust Funds and Grants: Looking further ahead, the Bank’s partnership with South
Africa is anticipated to continue to evolve toward an engagement and relationship based
primarily on the development and sharing of innovation, knowledge, management experience,
and international best practices and technology. The Bank will continue to mobilize grant
resources from its administered and global trust funds, for activities related to human
development, promotion of regional integration initiatives, clean energy and clean coal
technologies, and other climate-change related issues.

17
Table 1. Indicative lending and non-lending operations
Operations
2013
UA
million
2014
UA
million
2015
UA
million
Department
Lending program
Climate Resilient Green Economy (Sector Budget Support) 100 … … ONEC
Transmission Grid Strengthening … 200 … ONEC
Eskom renewable energy … … 100 ONEC
Water Supply, Health and Sanitation Program 100 … 80 OWAS &
OSHD
Lesotho Highland Water Supply Project Phase II … 150 … OWAS
Private sector development operations (infrastructure, manufacturing,
regional integration, and enhancing productive capacity of SMEs,
PPPs)
400 350 450 OPSM &
OSHD
Higher Education Science and Technology … 100 … OSHD
Subtotal 600 800 630
Non-lending program
Manufacturing, Productivity, Innovation, and Jobs : A Comparison
with the BRIC
0.03 … … SARC
The Role of South Africa in Regional Integration in Southern Africa 0.3 … SARC
Update of the Feasibility Study of Moloto Development Corridor 0.5 … … OITC
The Model shift from Road to Rail freight traffic 0.10 … … OITC
Independent System Market Operator 0.6 … … ONEC
Reduction of greenhouse gas emissions in agriculture and forestry
through soil sequestration
1.3 … … OSAN
Modeling Costing and Financing Options for Expansion of Higher
Education Infrastructure
… 0.08 … OSHD
Impacts Evaluation of NHI Pilot Program 0.02 OSHD
Sub total 2.5 0.4
Total 602.5 800.4 630.0 Note: ONEC = Energy, Environment and Climate Change; OSHD = Human Development; OPSM = Private Sector; OWAS=
Water and Sanitation; OSAN= Agriculture and Agro-Industry; and OITC= Transport and ICT.
5.1.4. The indicative lending operations in Table 1 include both the validated and proposed
pipeline for the initial three-year period and are fully aligned with the two strategic areas of
focus. Dialogue is continuing with the National Treasury to explore lending opportunities with
two State Owned Enterprises: the South African Airways and the African Exploration Mining
and Finance Corporation. The Airways has already issued expression of interest for funding by
the commercial banks to purchase airplanes worth USD900 million over the next five years.
5.2. Program Overview and Sector Focus
5.2.1. Bank support will be demand-driven and results-based, and will focus on
government priorities that reflect the Bank’s comparative advantage in specific areas that
have potential to contribute to job creation and inclusive and environmentally sustainable
development. Compared to the previous CSP, operations within each priority sector will be
more selective in line with the joint emphasis on innovation and value addition to facilitate
further sector repositioning. All the Bank lending and TA will accordingly be carefully screened
to ensure value addition, transition to green growth or social development orientation, and
enhanced synergies with regional cooperation and integration programs in line with the proposed
strategic pillars. Support for innovative financing solutions and access to finance in the priority
sectors remains an important operational objective. The Bank will continue to support
microfinance, SME finance, affordable housing, agro-processing and agriculture, green finance,
and municipal finance. The Bank will explore direct financing opportunities through on-lending
18
to the recently constituted new Small Enterprise Finance Agency (SEFA) under the Industrial
Development Corporation (IDC).
5.2.2. Energy: Ambitious targets have been set by the Integrated Resource Plan to
improve energy efficiency, reduce carbon emissions and encourage development of clean
energy resources. The Bank’s support to the energy sector will seek to play a leadership role in
introducing cutting-edge technologies for high-impact climate change mitigation, particularly to
reduce coal dependence. The Bank will provide support in five areas: (i) energy efficiency and
conservation, development of energy service companies, and application of smart grid
technologies; (ii) renewable energy, including wind, concentrated solar, biomass, geothermal and
small hydropower; (iii) cleaner and lower carbon fossil fuel technologies and carbon capture and
storage; (iv) access and transmission grid strengthening; and (v) development of regional power
projects and trading arrangements. While South Africa aspires to reduce the share of coal in
energy mix to 48 percent in 2030, it at the same time envisions expanding dry-cooled coal
generations over the plan period. The Bank will continue to support environmentally efficient
coal projects with particular focus on grid strengthening. Knowledge solutions, TA, and grant
resources will support innovative demonstration projects and the development of carbon trading
systems. The scaling up of low carbon technologies, particularly in clean energy, hinges on
securing financing on attractive terms. Mobilizing low-cost financing, including supporting the
government to gain access to concessionary resources being made available for greenhouse gas
mitigation in the energy, transport, and land use sectors at the global level will therefore be an
integral part of the strategy (See Annex VII for more details).
5.2.3. Transport: The Bank’s support will increase the role of lower carbon and safer
transport modes. It will improve the management and maintenance of transport assets,
encourage efficient delivery of public transport services, and contribute to regional connectivity
and trade facilitation, particularly through efforts to integrate safety considerations, foster
multimodal services, improve asset management and maintenance, and incorporate intelligent
system design technologies. Key areas of support include: (i) road network rehabilitation, rural
roads, more effective road maintenance systems, and road safety; (ii) efficient and safe railways
and ports with strong regional dimensions and facilitation of containerization; (iii) urban public
transport, multimodal passenger hubs, and traffic demand management; (iv) inland waterways
and inland ports; and (v) multimodal logistics centers, logistics services, and intelligent transport
systems.
5.2.4. Natural resources, water, and agriculture: Increasing water scarcity and weather
volatility threaten the South Africa’s efforts to meet its food security, rural livelihood and
natural resource management objectives. The Bank will support demonstration projects that
contribute to sound land, water and natural resources management and climate change initiatives
that also support rural livelihood improvement through contract farming schemes and other
market-driven opportunities. The Bank will also support water and sanitation operations geared
towards achieving the sector goal of attaining universal access to affordable and sufficient water
supply and sanitation services.
5.2.5. Education: Skill shortages and skill mismatches affect all sectors of the economy.
The Bank will assist the government to enhance skills development through interventions in
HEST for innovation and technical skills for the implementation and maintenance of the critical
infrastructure. In this regard, the Bank will support the government’s efforts to close skills gaps
for the Strategic Integrated Projects (SIPs) covering social and economic infrastructure across the
nine provinces as stipulated in the 2012 National Infrastructure Plan. The Bank will also support
19
the government’s derive to develop an integrated skills plan for the next 20 years across all the
SIPs. According to the Engineering Council of South Africa, South Africa has one engineer per
3166 of the population, well behind Brazil (227), the UK (311) and Chile (681). In 2011, there
were only about 15000 professional engineers in South Africa.
VI. RESULTS MANAGEMENT
6.1. Monitoring
A CSP results framework designed to focus the Bank assistance on the delivery of results
is shown in Annex I. The results framework will serve as a management tool for the Bank and
the Government in several respects: (i) progress made in achieving outcomes will be carefully
monitored each year through the Bank project and TA review missions and annual portfolio
reviews; (ii) individual project and program interventions will be designed to contribute to CSP
outcomes; and (iii) tracking and evaluating the success of the CSP (See Box 5 on the role of
SARC).
6.2. Risks
Three major risks could hamper the implementation of the proposed strategy.
Global economic environment: South Africa remains vulnerable to unexpected movements
in capital flows and commodity prices. Volatility in capital flows complicates monetary policy.
High international oil prices could push up the government’s domestic subsidy bill and crowd
out resources required for essential infrastructure investments, social services, and other pro-poor
programs. Surges in oil and food prices could fuel inflation and reduce living standards of poor
and near-poor households. The Bank will continue to support government-led medium-term
reform programs, and will consider the government’s request for support to respond to changing
global conditions. Committing to a medium-term anchor accompanied by well-articulated
revenue and expenditure measures, while allowing room for automatic stabilizers to operate and
some discretionary spending to counter cyclical downturns, would help cement credibility.
Public–private partnership: Delivering investments in infrastructure and services in ways
that leverage private participation is central to the CSP. Key risks include inability of the
government to address issues in land acquisition, tariff setting, and state-owned enterprise reform
that are needed to encourage PPPs in infrastructure investments. The Bank will work with the
government to develop a pipeline of feasible PPP projects, and will focus its policy dialogue and
capacity development support in areas with sound prospects for advancing private participation
in infrastructure provision.
Skills mismatch and social tensions: Finally, failure to achieve minimum growth rates of at
least 5 percent as envisaged in NGP, the skills mismatch and the resulting chronic high level of
unemployment, poverty and inequality could cause social tension and derail the democratic gains
made during the past 18 years. Lack of skills and capacity at national, provincial and local
government levels but also skills gaps in the private sector continue to hamper project
implementation. To help mitigate this risks, Bank programs would include a skills building
component aimed at increasing ownership and employment opportunities and a stronger team-
based approach will be encouraged to provide both policy and project based support.
20
VII. CONCLUSION AND RECOMMENDATION
7.1. Conclusion
South Africa continues to face complex development challenges. This Bank Group
strategy is designed to support the Government’s efforts. The CSP for 2013-2017 is closely
attuned to the needs of South Africa as a large middle-income country. Guided by the
government’s commitment to “pro-poor, pro-job, pro-growth, and pro-environment”
development, the two strategic pillars are infrastructure, and regional integration. The pillars are
consistent with the government’s longer-term master plans and climate change action plans.
7.2. Recommendation
The Board of Directors is invited to consider and approve the proposed Country Strategy
Paper for the Republic of South Africa for 2013-2017, based on a sustainable annual lending
envelope ranging from UA600 to 700 million.
Box 5. The Role of Southern Africa Resource Center (SARC) in Implementing the CSP
Quality assurance is essential to maximizing the CSP’s development effectiveness. The government has
asked the Bank to gradually shift to more project investments (within programmatic frameworks) to address
binding constraints to inclusive and environmentally sustainable growth, especially infrastructure and related
services. The transition to increased project support will be gradual and may be adjusted during the CSP period
to respond to changing government needs for policy-based support and for the Bank resources and expertise. To
support the CSP implementation, SARC is working to strengthen the staff mix, focus and deployment responses.
With the opening of SARC, the new Delegation of Authority Matrix, and adequate and timely deployment
of key staff, the Bank will strive to sustain high quality standards by: (i) strengthening upstream
consultation for joint initiation of projects and TA; (ii) improving project conceptualization and design; (iii)
delegating greater project administration responsibilities to SARC Tasks Managers; and (vi) expanding capacity
development of executing and implementing agencies in various aspects of project management, including
fiduciary safeguards, and the design and use of results frameworks. Consultation workshops will be used to
share best practices in project management, discuss initial project and TA concepts, and encourage scaling up of
innovative projects for wider replication.
The establishment of SARC earlier this year is also contributing to improve partner coordination. This
will continue to be emphasized during the CSP period. SARC will continue to work closely with South Africa
and the Regional Economic Communities to deepen regional integration and economic cooperation to enhance
the region’s competitiveness and for diversifying economic activity to spur more inclusive and sustainable
growth.

I
ANNEX I. COUNTRY STRATEGY RESULTS FRAMEWORK
Country Development Goals
1. Increase GDP growth to at least 5 ½ percent by 2015. 2. Reduce the unemployment rate to 15 percent by 2020 and 6 percent by 2030 from 25 percent in 2012.
3. Reduce population living below poverty line of US$2 per day to 0 percent in 2030 from 33 percent in 2009 (13.8 percent below US$1.25 in 2011).
4. Promote environmentally sustainable economic development; green growth with rich biodiversity.
Government Sector
Objectives
Constraints hindering
achievement of desired
outcomes
Final Outcomes
(by 2017)
Final Outputs
(by 2017)
Mid-Term Outcomes
(by 2015)
Mid Term
Outputs
(by 2015)
Bank Group Interventions during
CSP period (ongoing & proposed)
PILLAR 1: INFRASTRUCTURE
1. INFRASTRUCTURE DEVELOPMENT
ENERGY
Development of energy infrastructure to enhance
economic growth,
employment, poverty reduction; and
environmental
sustainability
Lack of resources for expanded energy
infrastructure investment
High cost and uncertainty of
green energy technology
Increase in household access to electricity to 85%
(baseline: 82.7% in 2011)
Green energy 9% of energy
mix (baseline: 2.2% in 2011)
Emission falls to lower limit
398 million metric tonnes CO2 equivalent (583 upper
limit) in 2020 (baseline: 500
million metric tonnes CO2 eq. in 2010)
100MW
Increase in household access to electricity to
83.7%
Green energy 4% of
energy mix
Emission falls to lower
limit 450 million metric tonnes CO2 equivalent
-
Proposed:
Eskom renewable Energy project
Climate resilient green economy operations
Transmission Grid Strengthening
100MW
100MW
400 Kms transmission
lines
-
4,764 MW
3,176 MW
Ongoing
Medupi Power Project
Eskom Renewable energy investment
project: Sere and Upp. 100 MW (Sere) 100 MW (Sere)
WATER SECTOR
All South Africans will
have access to affordable, sufficient and safe water
and hygienic sanitation
Limited water resources;
Unevenly distributed water resources;
Deteriorating quality of water
and sanitation services and pollution;
Household access to water
supply to increase to 95% (baseline: 89.5% in 2011)
Access to sanitation to increase to 84% (baseline:
79% in 2010)
Lesotho Highland
Water Project Phase II completed by 2020
Household access to
water to increase to 92%
30% achieved
Proposed:
Lesotho Highland Water Project II;
Water supply and sanitation project 1 water supply and
sanitation project completed
Access to sanitation to
increase to 81.5%
1 water supply and
sanitation project completed
2. Higher Education, Science and Technology for Infrastructure Development
Enhance research,
development and innovation in human
capital for a growing
knowledge economy
Poor performance of
education system in producing learners with
ability to pursue
mathematics and science studies at higher education
institutions
Increased supply of high-
level skills in science and technology
Number of civil
engineers to increase to 20,000 by 2017
(baseline: 15000 in
2011)
25% achieved 25% achieved Proposed:
Higher Education and Science and Technology

II
PILLAR 2: REGIONAL INTEGRATION
REGIONAL INFRASTRUCTURE
Deepen regional integration and trade, free
movement of persons,
business, labour and services across the region,
and enhance cooperation
Inadequate infrastructure
(Transport, Energy and ICT);
High transaction costs and costs of tradable goods,
Improved road transport,
energy supply and trade
facilitation infrastructure
2 transport and 4
power supply projects
completed
Improved trade flows and
movement of people;
1 transport, 2 power
projects completed
Proposed: Regional infrastructure development
50,620 permanent
employment; increase in GDP by US$420 million;
increase in fixed investment
by US$920 million all at regional level
At least one energy,
ICT, roads, water projects in SADC
region are completed
50% achieved
50% achieved
Ongoing
DBSA 5th Line of Credit
FACILITATION OF CROSS BORDER INVESTMENT AND TRADE
Tight foreign exchange controls;
High cost of funds for South African Banks;
Lack of knowledge of
regional market;
South Africa trade with BRIC to increase to 40% (baseline:
18.6% in 2011)
Trade with sub-Saharan
Africa 25% (baseline: 18% in 2010)
Intra-regional trade in SADC 12% (baseline: 7% in 2010).
Improved border clearance efficiency at South African
border by 20% from status in
2012
Share of portfolio of South African Banks and
major institutional investors in Africa region
to increase
50% achieved
50% achieved
Proposed:
Regional trade and investment
7 projects in low income and fragile states
completed
50% achieved
50% achieved
Ongoing:
Lines of credit IDC
OSBP project
Two one stop border
posts completed;
Reduction in truck waiting time at
Beitbridge from 36
hours to under 24 hours 6 months after
completion of
construction
1 one stop border
post built
SUPPORT TO SMEs
Address the structural
imbalance and high level
of concentration in the economy, and close the
skills gap to enhance the
labour absorptive capacity of the economy
Declining share of
manufacturing in GDP and
the general trend of deindustrialization;
Unemployment falls to 15%
in 2020 (Baseline: 25% in
2012)
Share of manufactured
output in total output rise
to 18% (baseline:13.4% in 2011)
50% achieved
50% achieved
Proposed:
Industry, mining and quarrying; and
Agriculture value chains
1 processing (sinter) plant
and 1 smelter plant
completed
9,500 indirect jobs
and 5,000 direct
jobs
50% achieved Ongoing:
Kalagadi industrial beneficiation
project
Land Bank Project
34 farmers and agri-
businesses receive loans
from Land Bank
50% achieved 17 farmers and agri-
businesses receive
loans from Land Bank
Enhance entrepreneurial
skills and investments in SMEs to ensure job
creation and poverty
reduction
Limited access to finance,
high level of crime, Problems of access to land
and transport.
Total Entrepreneurial
Activity Index (TEAI) reaches 15% (baseline: 8.9%
in 2010).
Number of small
businesses increase to 2.5 million (baseline: 2.4
million in 2011).
TEAI reaches 13% Number of small
businesses reach 2.45 million
Proposed:
Loans SEFA; Financial intermediation with SA commercial banks and DFIs
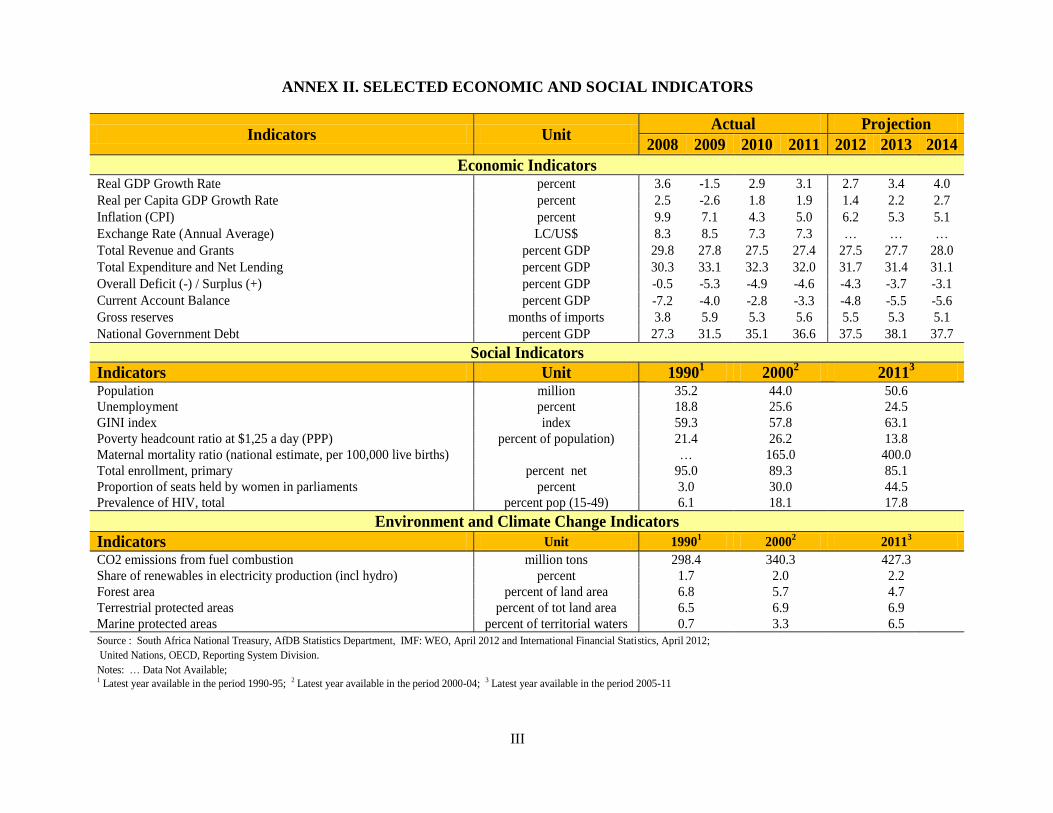
III
ANNEX II. SELECTED ECONOMIC AND SOCIAL INDICATORS
Indicators Unit Actual Projection
2008 2009 2010 2011 2012 2013 2014
Economic Indicators Real GDP Growth Rate percent 3.6 -1.5 2.9 3.1 2.7 3.4 4.0
Real per Capita GDP Growth Rate percent 2.5 -2.6 1.8 1.9 1.4 2.2 2.7
Inflation (CPI) percent 9.9 7.1 4.3 5.0 6.2 5.3 5.1
Exchange Rate (Annual Average) LC/US$ 8.3 8.5 7.3 7.3 … … …
Total Revenue and Grants percent GDP 29.8 27.8 27.5 27.4 27.5 27.7 28.0
Total Expenditure and Net Lending percent GDP 30.3 33.1 32.3 32.0 31.7 31.4 31.1
Overall Deficit (-) / Surplus (+) percent GDP -0.5 -5.3 -4.9 -4.6 -4.3 -3.7 -3.1
Current Account Balance percent GDP -7.2 -4.0 -2.8 -3.3 -4.8 -5.5 -5.6
Gross reserves months of imports 3.8 5.9 5.3 5.6 5.5 5.3 5.1
National Government Debt percent GDP 27.3 31.5 35.1 36.6 37.5 38.1 37.7
Social Indicators
Indicators Unit 19901 2000
2 2011
3
Population million 35.2 44.0 50.6
Unemployment percent 18.8 25.6 24.5
GINI index index 59.3 57.8 63.1
Poverty headcount ratio at $1,25 a day (PPP) percent of population) 21.4 26.2 13.8
Maternal mortality ratio (national estimate, per 100,000 live births) … 165.0 400.0
Total enrollment, primary percent net 95.0 89.3 85.1
Proportion of seats held by women in parliaments percent 3.0 30.0 44.5
Prevalence of HIV, total percent pop (15-49) 6.1 18.1 17.8
Environment and Climate Change Indicators
Indicators Unit 19901 2000
2 2011
3
CO2 emissions from fuel combustion million tons 298.4 340.3 427.3
Share of renewables in electricity production (incl hydro) percent 1.7 2.0 2.2
Forest area percent of land area 6.8 5.7 4.7
Terrestrial protected areas percent of tot land area 6.5 6.9 6.9
Marine protected areas percent of territorial waters 0.7 3.3 6.5
Source : South Africa National Treasury, AfDB Statistics Department, IMF: WEO, April 2012 and International Financial Statistics, April 2012;
United Nations, OECD, Reporting System Division.
Notes: … Data Not Available; 1 Latest year available in the period 1990-95; 2 Latest year available in the period 2000-04; 3 Latest year available in the period 2005-11
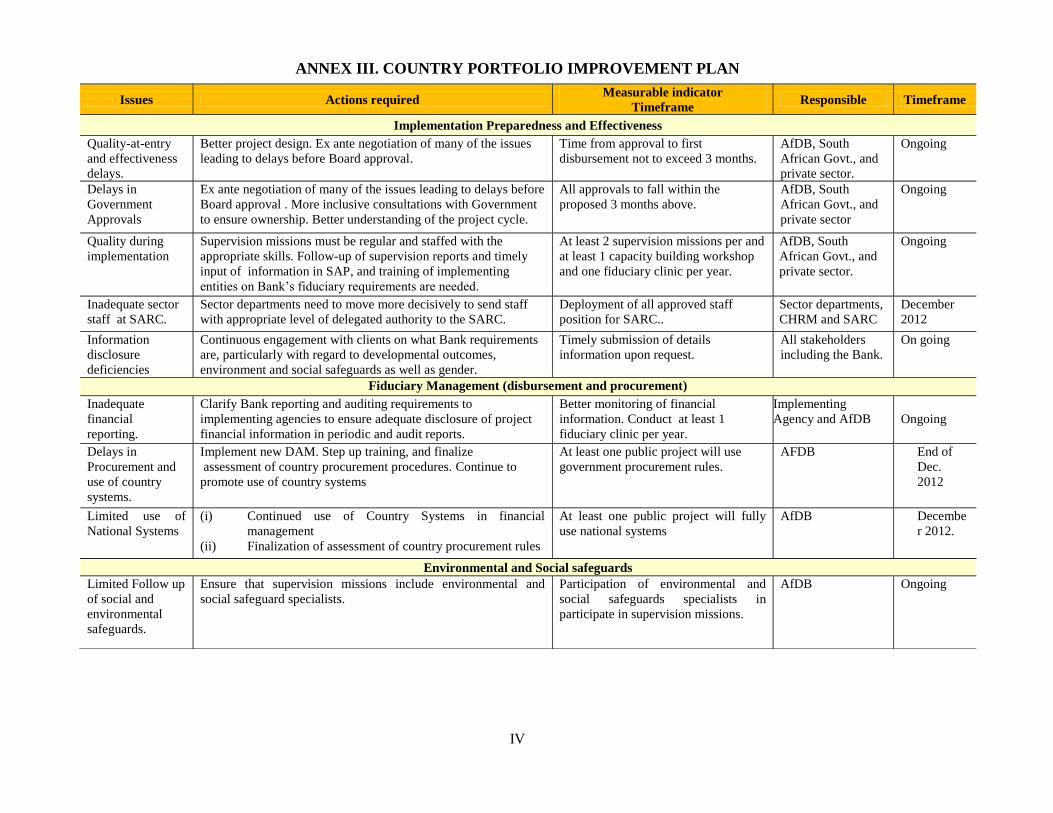
IV
ANNEX III. COUNTRY PORTFOLIO IMPROVEMENT PLAN
Issues Actions required Measurable indicator
Timeframe Responsible Timeframe
Implementation Preparedness and Effectiveness
Quality-at-entry
and effectiveness
delays.
Better project design. Ex ante negotiation of many of the issues
leading to delays before Board approval.
Time from approval to first
disbursement not to exceed 3 months.
AfDB, South
African Govt., and
private sector.
Ongoing
Delays in
Government
Approvals
Ex ante negotiation of many of the issues leading to delays before
Board approval . More inclusive consultations with Government
to ensure ownership. Better understanding of the project cycle.
All approvals to fall within the
proposed 3 months above.
AfDB, South
African Govt., and
private sector
Ongoing
Quality during
implementation
Supervision missions must be regular and staffed with the
appropriate skills. Follow-up of supervision reports and timely
input of information in SAP, and training of implementing
entities on Bank’s fiduciary requirements are needed.
At least 2 supervision missions per and
at least 1 capacity building workshop
and one fiduciary clinic per year.
AfDB, South
African Govt., and
private sector.
Ongoing
Inadequate sector
staff at SARC.
Sector departments need to move more decisively to send staff
with appropriate level of delegated authority to the SARC.
Deployment of all approved staff
position for SARC..
Sector departments,
CHRM and SARC
December
2012
Information
disclosure
deficiencies
Continuous engagement with clients on what Bank requirements
are, particularly with regard to developmental outcomes,
environment and social safeguards as well as gender.
Timely submission of details
information upon request.
All stakeholders
including the Bank.
On going
Fiduciary Management (disbursement and procurement)
Inadequate
financial
reporting.
Clarify Bank reporting and auditing requirements to
implementing agencies to ensure adequate disclosure of project
financial information in periodic and audit reports.
Better monitoring of financial
information. Conduct at least 1
fiduciary clinic per year.
Implementing
Agency and AfDB
Ongoing
Delays in
Procurement and
use of country
systems.
Implement new DAM. Step up training, and finalize
assessment of country procurement procedures. Continue to
promote use of country systems
At least one public project will use
government procurement rules.
AFDB End of
Dec.
2012
Limited use of
National Systems
(i) Continued use of Country Systems in financial
management
(ii) Finalization of assessment of country procurement rules
At least one public project will fully
use national systems
AfDB Decembe
r 2012.
Environmental and Social safeguards
Limited Follow up
of social and
environmental
safeguards.
Ensure that supervision missions include environmental and
social safeguard specialists.
Participation of environmental and
social safeguards specialists in
participate in supervision missions.
AfDB Ongoing

V
ANNEX IV. BANK GROUP PORTFOLIO 2008-2012
Sector Name Long NameApproval
Date
Effect.
Date
Closing
Date
Approved
Amount
(UA)
millions
Disb.Rate
percent
Age
(years
since
approval)
Implementati
on Progress
(IP)
Development
Outcome
Indicator
(DO)
Medupi Power Project 14-Oct-09 11-Aug-10 31-Dec-16 1,756.0 43.0% 2.6
Eskom Renewable Energy Invest. Project 30-May-11 18-Jul-12 31-Dec-18 233.7 0.0% 1.1
TRANSPORT Transnet Ltd 7-Nov-08 5-Oct-11 5-Oct-13 260.0 37.0% 2.1
Line of Credit to Standard Bank 11-Sep-08 27-May-09 31-Dec-11 140.1 100.0% 3.7
Line of Credit to Ned Bank 11-Sep-08 6-Jan-09 28-Feb-10 63.7 100.0% 3.7
Global Trade Liquidity Program, Standard Bank of South
Africa7-Sep-09 20-Nov-09 30-Jun-10 67.0 100.0% 2.9
Line of Credit to Industrial Development Corporation 19-May-10 26-Sep-11 26-May-13 129.7 53.0% 2.2
Summit Development group 20-Sep-10 15-Jun-12 31-Dec-16 15.7 0.0% 1.8
Evolution One Equity Fund 27-May-10 3-May-10 31-Dec-16 7.9 26.5% 3.1
5th Line of Credit to Development Bank of Southern
Africa3-Feb-11 19-Mar-12 17-Oct-12 192.0 50.0% 1.4
Land Bank 20-Jun-12 Pending Pending 80.2 0.0% 0.2
Kalagadi Beneficiation Loan 18-May-11 Pending Pending 139.0 0.0% 1.2
New Africa Mining Fund 19-Jul-10 16-Jun-11 31-Dec-17 15.7 1.4%
Agri Business Investment Fund 28-Jan-09 30-Jun-09 31-Dec-14 9.5 55.0% 3.5
8 MILES FUND 23-Jun-10 18-Apr-12 31-Dec-17 31.5 0.0% 2.1
Development of South Africa One Stop Border Post 22-Dec-11 Pending Pending 0.2 0.0% 0.6
INFRASTRUCTURE Emerging Africa Infrastructure Fund 3-Nov-09 25-May-10 31-Dec-17 27.6 24.0% 2.7
Other Billion (O3b) Equity Fund 10-Jun-10 6-Dec-10 31-Dec-16 31.4 49.6% 2.1
New Dawn satellite Project 11-Mar-09 29-Oct-09 31-Dec-12 18.9 67.0% 2.7
WATER Integrated Water harvesting 14-Apr-09 15-Dec-09 31-Dec-12 0.3 100.0% 3.3
Color/Designation
Red Unsatisfactory
Orange Satisfactory
Green Highly Satisfactory
Grey Not Available (Not Rated)
POWER
FINANCE
MINING &
QUARRYING
MULTISECTOR
TELECOMMUNICATI
ONS
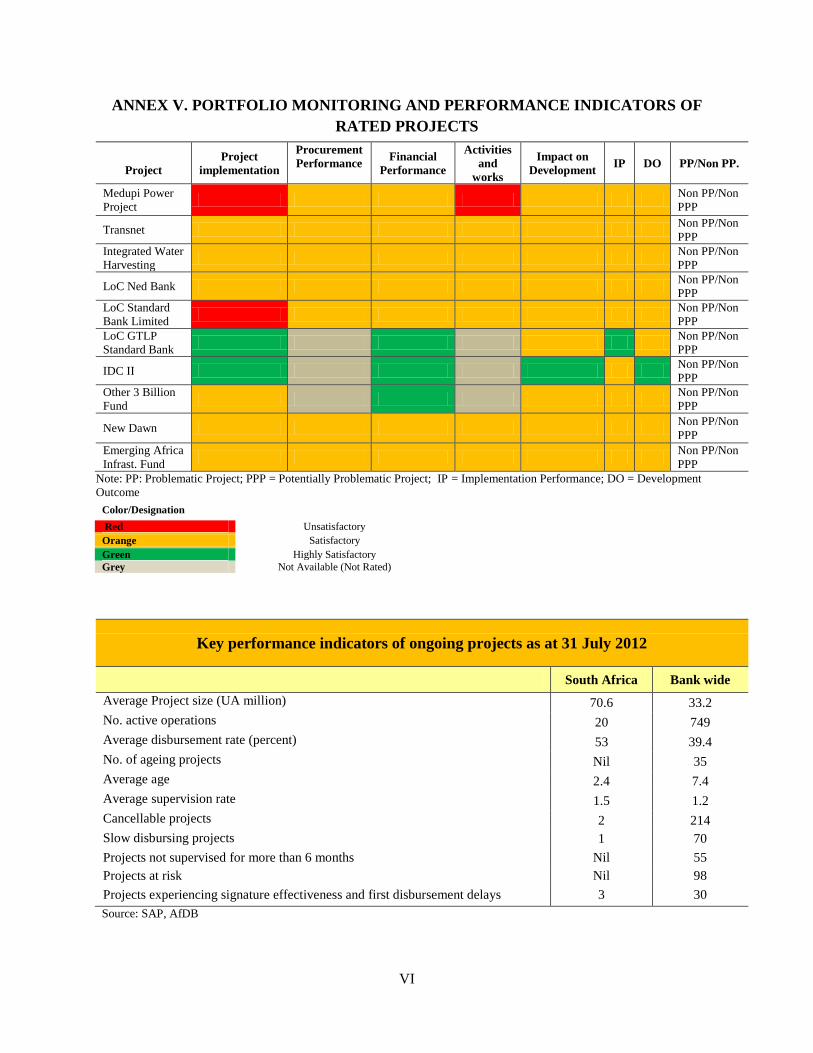
VI
ANNEX V. PORTFOLIO MONITORING AND PERFORMANCE INDICATORS OF
RATED PROJECTS
Project
Project
implementation
Procurement
Performance
Financial
Performance
Activities
and
works
Impact on
Development IP DO PP/Non PP.
Medupi Power
Project
Non PP/Non
PPP
Transnet Non PP/Non
PPP
Integrated Water
Harvesting
Non PP/Non
PPP
LoC Ned Bank Non PP/Non
PPP
LoC Standard
Bank Limited
Non PP/Non
PPP
LoC GTLP
Standard Bank
Non PP/Non
PPP
IDC II Non PP/Non
PPP
Other 3 Billion
Fund
Non PP/Non
PPP
New Dawn Non PP/Non
PPP
Emerging Africa
Infrast. Fund
Non PP/Non
PPP
Note: PP: Problematic Project; PPP = Potentially Problematic Project; IP = Implementation Performance; DO = Development
Outcome
Color/Designation
Red Unsatisfactory
Orange Satisfactory
Green Highly Satisfactory
Grey Not Available (Not Rated)
Key performance indicators of ongoing projects as at 31 July 2012
South Africa Bank wide
Average Project size (UA million) 70.6 33.2
No. active operations 20 749
Average disbursement rate (percent) 53 39.4
No. of ageing projects Nil 35
Average age 2.4 7.4
Average supervision rate 1.5 1.2
Cancellable projects 2 214
Slow disbursing projects 1 70
Projects not supervised for more than 6 months Nil 55
Projects at risk Nil 98
Projects experiencing signature effectiveness and first disbursement delays 3 30
Source: SAP, AfDB
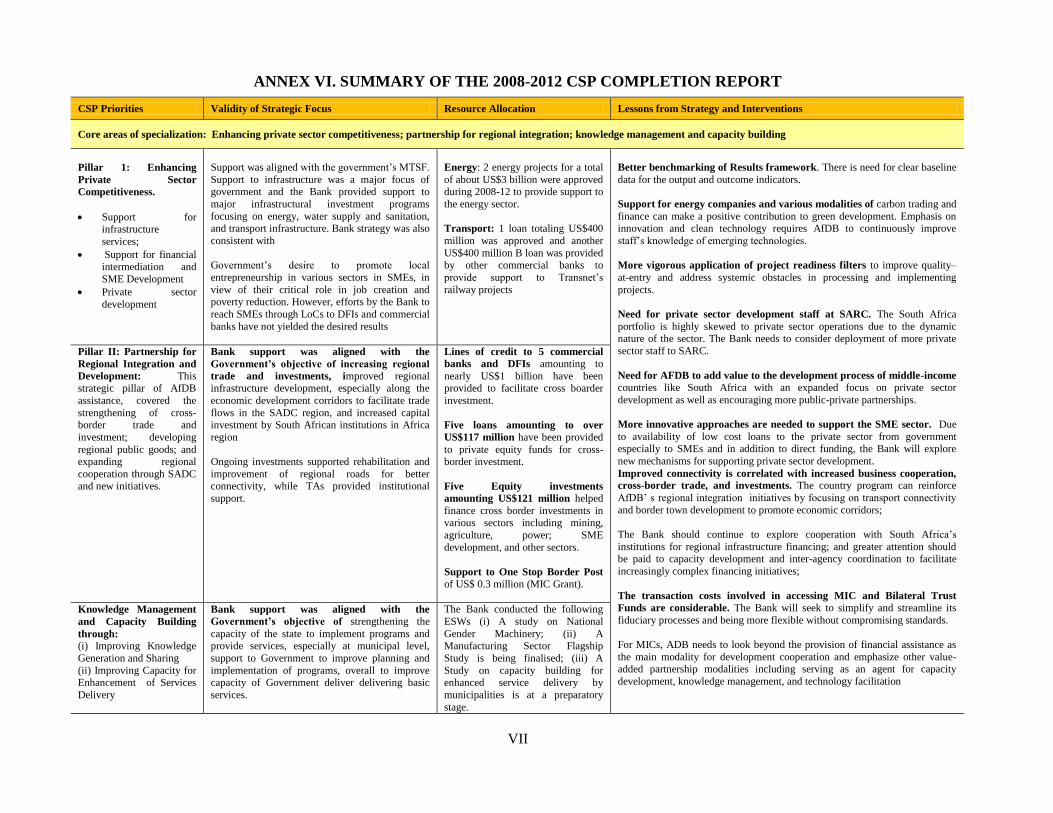
VII
ANNEX VI. SUMMARY OF THE 2008-2012 CSP COMPLETION REPORT
CSP Priorities Validity of Strategic Focus Resource Allocation Lessons from Strategy and Interventions
Core areas of specialization: Enhancing private sector competitiveness; partnership for regional integration; knowledge management and capacity building
Pillar 1: Enhancing
Private Sector
Competitiveness.
Support for infrastructure
services;
Support for financial
intermediation and
SME Development
Private sector
development
Support was aligned with the government’s MTSF.
Support to infrastructure was a major focus of government and the Bank provided support to
major infrastructural investment programs
focusing on energy, water supply and sanitation, and transport infrastructure. Bank strategy was also
consistent with
Government’s desire to promote local
entrepreneurship in various sectors in SMEs, in
view of their critical role in job creation and poverty reduction. However, efforts by the Bank to
reach SMEs through LoCs to DFIs and commercial
banks have not yielded the desired results
Energy: 2 energy projects for a total
of about US$3 billion were approved during 2008-12 to provide support to
the energy sector.
Transport: 1 loan totaling US$400
million was approved and another
US$400 million B loan was provided
by other commercial banks to
provide support to Transnet’s
railway projects
Better benchmarking of Results framework. There is need for clear baseline
data for the output and outcome indicators.
Support for energy companies and various modalities of carbon trading and
finance can make a positive contribution to green development. Emphasis on innovation and clean technology requires AfDB to continuously improve
staff’s knowledge of emerging technologies.
More vigorous application of project readiness filters to improve quality–
at-entry and address systemic obstacles in processing and implementing
projects.
Need for private sector development staff at SARC. The South Africa
portfolio is highly skewed to private sector operations due to the dynamic nature of the sector. The Bank needs to consider deployment of more private
sector staff to SARC.
Need for AFDB to add value to the development process of middle-income countries like South Africa with an expanded focus on private sector
development as well as encouraging more public-private partnerships.
More innovative approaches are needed to support the SME sector. Due
to availability of low cost loans to the private sector from government
especially to SMEs and in addition to direct funding, the Bank will explore
new mechanisms for supporting private sector development.
Improved connectivity is correlated with increased business cooperation,
cross-border trade, and investments. The country program can reinforce
AfDB’ s regional integration initiatives by focusing on transport connectivity
and border town development to promote economic corridors;
The Bank should continue to explore cooperation with South Africa’s
institutions for regional infrastructure financing; and greater attention should be paid to capacity development and inter-agency coordination to facilitate
increasingly complex financing initiatives;
The transaction costs involved in accessing MIC and Bilateral Trust
Funds are considerable. The Bank will seek to simplify and streamline its
fiduciary processes and being more flexible without compromising standards.
For MICs, ADB needs to look beyond the provision of financial assistance as
the main modality for development cooperation and emphasize other value-added partnership modalities including serving as an agent for capacity
development, knowledge management, and technology facilitation
Pillar II: Partnership for
Regional Integration and
Development: This strategic pillar of AfDB
assistance, covered the
strengthening of cross-border trade and
investment; developing
regional public goods; and expanding regional
cooperation through SADC and new initiatives.
Bank support was aligned with the
Government’s objective of increasing regional
trade and investments, improved regional infrastructure development, especially along the
economic development corridors to facilitate trade
flows in the SADC region, and increased capital investment by South African institutions in Africa
region
Ongoing investments supported rehabilitation and
improvement of regional roads for better connectivity, while TAs provided institutional
support.
(i) Lines of credit to 5 commercial
banks and DFIs amounting to
nearly US$1 billion have been provided to facilitate cross boarder
investment.
Five loans amounting to over
US$117 million have been provided
to private equity funds for cross-border investment.
Five Equity investments
amounting US$121 million helped
finance cross border investments in various sectors including mining,
agriculture, power; SME
development, and other sectors.
(ii) Support to One Stop Border Post of US$ 0.3 million (MIC Grant).
Knowledge Management
and Capacity Building
through:
(i) Improving Knowledge
Generation and Sharing
(ii) Improving Capacity for Enhancement of Services
Delivery
Bank support was aligned with the
Government’s objective of strengthening the
capacity of the state to implement programs and provide services, especially at municipal level,
support to Government to improve planning and
implementation of programs, overall to improve capacity of Government deliver delivering basic
services.
The Bank conducted the following
ESWs (i) A study on National
Gender Machinery; (ii) A Manufacturing Sector Flagship
Study is being finalised; (iii) A
Study on capacity building for enhanced service delivery by
municipalities is at a preparatory
stage.

VIII
ANNEX VII. MATRIX OF MAJOR DONOR ACTIVITIES IN SOUTH AFRICA
Ca
pa
city
bu
ild
ing
an
d
Inst
itu
tio
n
Su
pp
ort
En
vir
on
men
t
an
d c
lim
ate
Inv
estm
ent
Cli
ma
te
Ed
uca
tion
Hea
lth
(HIV
/AID
S)
Pri
va
te
sect
or
Ag
ricu
ltu
re
Oth
er
Hu
ma
na
Dev
elo
pm
ent
Wa
ter
S
ecto
r
En
erg
y
Sec
tor
Tra
nsp
ort
Pu
bli
c P
riv
ate
Pa
rtn
ersh
ip
(PP
P)
Tra
de
Go
ver
na
nce
African Development Bank + + + + + +
World Bank + + +
IFC +
IMF +
European Commission/EIB + + + +
UN and its Organs + + + +
JICA + +
Others, specify
Source: AfDB and Development Partners
ANNEX VIII. GREEN ENERGY
South Africa is the largest contributor to greenhouse gas (GHG) emissions in Africa. In 2009, the
International Energy Agency listed South Africa as the thirteenth highest emitter of carbon dioxide in the
world. According to the country’s National Climate Change Response Green Paper, the energy sector is
the largest source of GHG emissions, accounting for more than 80 percent of the country’s emissions. The
high emissions are mainly due to the structure of the economy, which has been historically characterised
by energy-intensive sectors such as mining, mineral processing and beneficiation.
During the climate change negotiations, within the framework of the Conference of Parties (COP) to
the Kyoto Protocol, South Africa committed to contributing to the global greenhouse gas mitigation
effort. The emissions trajectory would peak between 2020 and 2025, remaining stable for a decade
thereafter, and declining in absolute terms from around 2035. This was on condition that the country
received the necessary finance, technology and support from the international community.
South Africa has therefore integrated a climate constraint that takes account of its mitigation
commitments, into its energy planning tools including the Integrated Energy Plan (IEP) and the
Integrated Resource Plan (IRP) for electricity generation. Furthermore, within the context of the New
Growth Path and the country’s Industrial Policy Action Plan, South Africa is committed to creating a
business environment that facilitates the development of a local renewable energy technology
manufacturing, implementation and export industry and that maximises its job creation potential.
According to the IRP, the contribution of coal based electricity plants to total production capacity
should drop to 48 percent by 2030. This will be offset by the increased contribution of combined cycle
gas turbines (5 percent), open cycle gas turbines (9 percent), renewable energy (33 percent) and nuclear
energy (25 percent). The construction of transmission lines will be an important element of the electricity
supply expansion investment programme given the need to feed the power generated from the renewable
energy initiatives into the grid. In order to cushion the final consumers from the high costs of implementing
renewable energy projects, the Government is currently working on the establishment of a Renewable
Energy Fund to pool concessionary resources.
A key policy development in the sector is the proposed policy change towards the creation of the
Independent System Market Operator (ISMO) which will be responsible for generation planning,
system operation and expansion planning and buying of all electricity. The Government is also
currently working on the South Africa electrification initiative which seeks to develop a strategy and
implementation models to achieve 100 percent electrification in the country by about 2020.
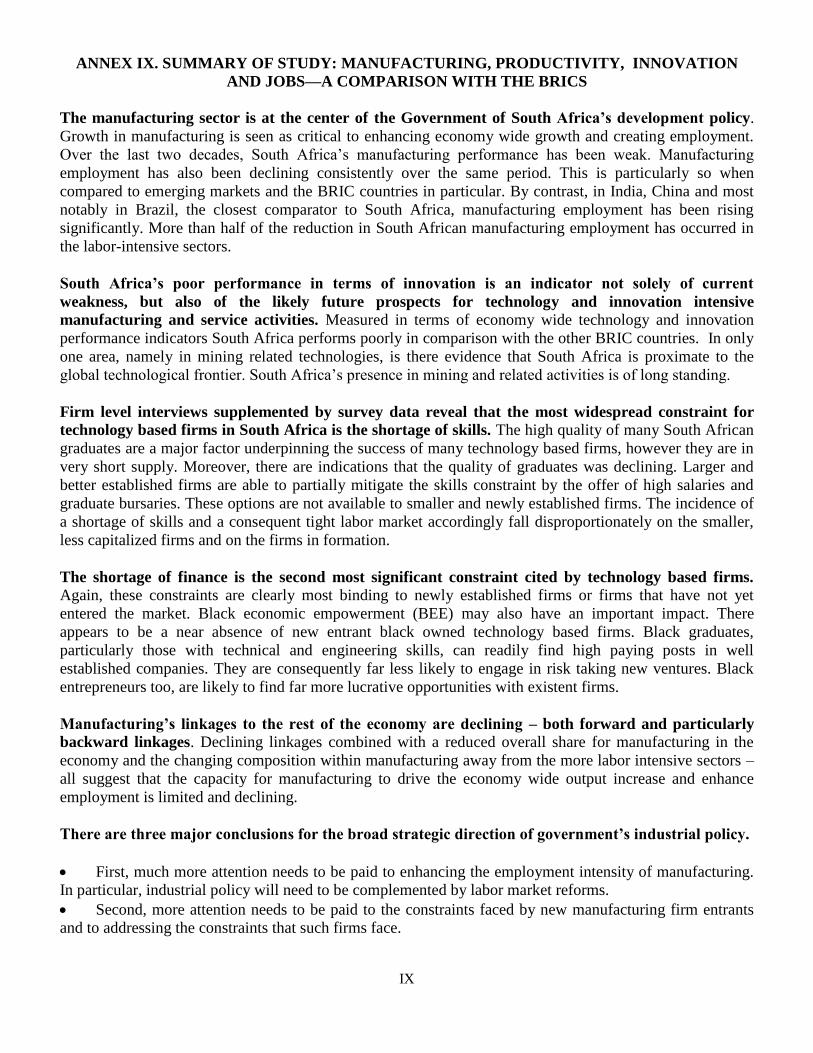
IX
ANNEX IX. SUMMARY OF STUDY: MANUFACTURING, PRODUCTIVITY, INNOVATION
AND JOBS—A COMPARISON WITH THE BRICS
The manufacturing sector is at the center of the Government of South Africa’s development policy.
Growth in manufacturing is seen as critical to enhancing economy wide growth and creating employment.
Over the last two decades, South Africa’s manufacturing performance has been weak. Manufacturing
employment has also been declining consistently over the same period. This is particularly so when
compared to emerging markets and the BRIC countries in particular. By contrast, in India, China and most
notably in Brazil, the closest comparator to South Africa, manufacturing employment has been rising
significantly. More than half of the reduction in South African manufacturing employment has occurred in
the labor-intensive sectors.
South Africa’s poor performance in terms of innovation is an indicator not solely of current
weakness, but also of the likely future prospects for technology and innovation intensive
manufacturing and service activities. Measured in terms of economy wide technology and innovation
performance indicators South Africa performs poorly in comparison with the other BRIC countries. In only
one area, namely in mining related technologies, is there evidence that South Africa is proximate to the
global technological frontier. South Africa’s presence in mining and related activities is of long standing.
Firm level interviews supplemented by survey data reveal that the most widespread constraint for
technology based firms in South Africa is the shortage of skills. The high quality of many South African
graduates are a major factor underpinning the success of many technology based firms, however they are in
very short supply. Moreover, there are indications that the quality of graduates was declining. Larger and
better established firms are able to partially mitigate the skills constraint by the offer of high salaries and
graduate bursaries. These options are not available to smaller and newly established firms. The incidence of
a shortage of skills and a consequent tight labor market accordingly fall disproportionately on the smaller,
less capitalized firms and on the firms in formation.
The shortage of finance is the second most significant constraint cited by technology based firms. Again, these constraints are clearly most binding to newly established firms or firms that have not yet
entered the market. Black economic empowerment (BEE) may also have an important impact. There
appears to be a near absence of new entrant black owned technology based firms. Black graduates,
particularly those with technical and engineering skills, can readily find high paying posts in well
established companies. They are consequently far less likely to engage in risk taking new ventures. Black
entrepreneurs too, are likely to find far more lucrative opportunities with existent firms.
Manufacturing’s linkages to the rest of the economy are declining – both forward and particularly
backward linkages. Declining linkages combined with a reduced overall share for manufacturing in the
economy and the changing composition within manufacturing away from the more labor intensive sectors –
all suggest that the capacity for manufacturing to drive the economy wide output increase and enhance
employment is limited and declining.
There are three major conclusions for the broad strategic direction of government’s industrial policy.
First, much more attention needs to be paid to enhancing the employment intensity of manufacturing.
In particular, industrial policy will need to be complemented by labor market reforms.
Second, more attention needs to be paid to the constraints faced by new manufacturing firm entrants
and to addressing the constraints that such firms face.

X
Third, policy supports that aim to enhance economy wide output and employment growth should pay
more attention to the significant heterogeneity of linkages and of employment intensity of the different
subsectors in manufacturing as well as to the linkage and employment intensity of other non-manufacturing
sectors.
Innovation will be vital to spur growth and prosperity, otherwise South Africa will continue to lose its
comparative advantage in the emerging markets. It is clear that South Africa has to foster an economy
driven by innovation, exports, Green Growth opportunity and clean energy. This will require investment in
human capital and infrastructure to adopt new regimes for trade, patents, immigration and technology
transfer; to devise methods for government to work more effectively, and to restore fiscal prudence to
budget and debt policies.