Embed Size (px)
Citation preview
Africa in a changing global environment
www.kpmg.com/africa
www.kpmg.com/za/dealadvisory
African Capital Markets Series
ContentsExecutive Summary 1
Definitions 6
Introduction 7
Overview of FDI into Africa 12
Where have the FDI inflows into Africa been going? 17
The African landscape 26 Insights into FDI inflows and growth in Southern Africa 42 Insights into FDI inflows and growth in East Africa 52 Insights into FDI inflows and growth in Central Africa 62 Insights into FDI inflows and growth in West Africa 72 Annexures - Annexure 1: Complete list of Developed, 79 Developing and Transition Countries - Annexure 2: Best Practices Index, 2015 – 81 Developing and Transition Countries Included and Excluded - Annexure 3a: Corruption Perceptions Index, 2016 – 85 Developing and Transition Countries Included and Excluded - Annexure 3b: Corruption Perceptions Index, 2015 – 88 Developing and Transition Countries Included and Excluded - Annexure 4: Policy Perceptions Index, 2015 – 91 Developing and Transition Countries Included and Excluded - Annexure 5: Investment Attractiveness Index, 2015 – 94 Developing and Transition Countries Included and Excluded - Annexure 6: Global Competitiveness Index, 2016 - 2017 – 97 Developing and Transition Countries Included and Excluded - Annexure 7: Ease of Doing Business, 2016 – 100 Developing and Transition Countries Included and Excluded - Annexure 8: Comparative GDP Growth – 103 Developing and Transition Countries Included and Excluded
Sources 107
Contributors 108
EXECUTIVE SUMMARY
Context to this ReportThis Report considers Africa’s position in the current global economic environment and measures how Africa ranks, by individual country, by region and as a continent, with competing Developing and Transition Economies with regards to the following areas:
• competitiveness (as measured by The World Economic Forum’s Global Competitiveness Report, 2016 – 2017);
• FDI inflows (as measured by the UNCTAD World Investment Report, 2016 and UNCTAD Global Investment Trends Monitor Reports);
• ease of doing business (as measured by The World Bank’s Ease of Doing Business Survey, 2016 and the Fraser Institute Annual Survey of Mining Companies Policy Perception Index, 2015);
• corruption (as measured by the Transparency International Corruption Perception Index, 2016); and
• GDP growth (as measured by BMI Research’s GDP growth forecasts).
This Report also measures each African country and region’s ranking in terms of the RMB Global Markets Research Where to Invest in Africa Report, 2016 – 2017.
This Report gives insights into what direction the world economy is expected to take in the context of the current trust crisis by Developed and other economies as identified in the Edelman Trust Barometer, 2017 resulting in the recent increase in populist views by the general populations of the world. It cites the risks to the world economy due to the resultant inward looking policies and protectionist measures as identified in the World Economic Forum’s Global Risks Report, 2017. It also highlights the potential and expected global economic impact of the so called fourth industrial revolution as detailed in The World Bank Group’s Global Economic Prospects Report, 2017, and The World Economic Forum’s Future of Jobs Report, 2016 as well as The World Economic Forum’s Global Competitiveness Report, 2016 – 2017. The fourth industrial revolution is building on the digital revolution, or third industrial revolution, that has been occurring since the 1950’s. According to The World Economic Forum, the fourth industrial revolution is characterised by a fusion of technologies that is blurring the lines between the physical, digital and biological spheres with developments in the fields of artificial intelligence, machine learning, robotics, nanotechnology, 2D printing and genetics and biotechnology.
This Report documents how Africa, as a continent, regionally and by individual country, compares to its main Developing and Transition Economy competitors as an investment prospect for the limited available FDI. The Report further suggests the areas over which individual African countries have control and can work towards improving in order to increase their attractiveness as an FDI inflows destination and their competitiveness in order to best position themselves to cope with and take advantage of the economic benefits offered by the fourth industrial revolution.
The definitions commencing on page 6 have been used in this Executive Summary.
What influences foreign direct investment into Africa | 2
The current global economic environmentThe global economy, and in particular the Developing and Transition Economies, is currently facing two major challenges. The first challenge is sluggish growth leading to stagnant global trade, subdued investment and increasing policy world-wide uncertainty. The second challenge is being that the world is on the brink of the fourth industrial revolution which is expected to drive significant change to global industry and business models and possibly lead to a net loss of jobs.
The first challenge results in low levels of global GDP growth and an increasingly unequal distribution of income growth in many economies, resulting in more inward-looking policies and increasing protectionist measures by many countries, including Developed Economies. This is evidenced by the recent Brexit vote in the UK and the Republican vote in the USA. The decline in trust in government, business, media and even NGO’s, as evidenced by the figures that have emerged in the Edelman Trust Barometer, 2017, is adding to populist views by the general population in Developed Economies.
A further impact of the lacklustre global economic environment is the lower GDP growth, reduced FDI inflows and higher inflation being experienced by Developing and Transition Economies. For Sub-Saharan Africa, specifically, this also comes at a time when these countries have also been, and continue to be, impacted by lower commodity prices, adverse weather conditions and political and security challenges.
While FDI inflows to Developing Economies are projected to increase by 6% to 8% during 2018 and global growth is expected to increase slightly from 2.3% to 2.7%, these projections are subject to significant risk in the form of a potential decline in global openness and economic integration. Competitiveness and innovation are considered to be essential elements to reigniting global growth and
these will be constrained if protectionist measures increase and global trade declines. Policy making in the US, under the Trump administration, may lead to an appreciation of the USD and US bond yields with a subsequent adverse effect on Developing Economies due to increasingly unfavourable exchange rates and a reduced ability to issue debt instruments as well as potential portfolio outflows from Developing Economies.
The effect of the second challenge, namely the fourth industrial revolution, is that the drivers of change in this area will have a notable impact on jobs. Certain existing jobs are likely to disappear and new job opportunities will be created. The challenge for Developing Economies, many of which are struggling with limited skilled resources and high unemployment rates, is that the fourth industrial revolution will result in heightened labour productivity and a widening skills gap, making it even harder for these countries to be competitive. In order to become more competitive and improve their future growth prospects, Developing Countries need to invest in human and physical capital and FDI inflows are vital in order for them to do this. The recommendations that Emerging Market Developing Economies implement a comprehensive, consistent and co-ordinated approach to policy making, address economic vulnerabilities and enhance international integration by promoting trade and FDI are certainly worth implementing. These measures become less effective, however, in an environment of reduced global co-operation and a decline in open, trading economies. From a Developed Economies point of view, protectionist measures and reduced global trade may impact on individual company’s abilities to innovate and invest in new technologies as they will no longer be exposed in the same way to competition and new ideas and the technology transfer that comes from imports and foreign investment.
3 | What influences foreign direct investment into Africa
How does Africa currently compare to other Developing and Transition Economies?Africa’s share of the total FDI inflows to Developing Economies declined during 2015, from 5% during 2014 to 3% during 2015. Latin America and The Caribbean’s share of total FDI inflows to Developing Economies also declined during 2015 from 13% in 2014 to 10% in 2015. This leaves Asia as the marginal gaining region on the FDI inflows when compared to other Developing Economies. It must be borne in mind, however, that the distribution of global FDI inflows changed during 2015 with the Developing Economies share of total global FDI inflows shrinking from 55% in 2014 to 43% in 2015. This change in the global FDI inflows patterns is largely due to an unusually high level of cross-border M&A activity in Developing Economies during 2015 rather than the more productive increase in FDI inflows in the form of Greenfield FDI.
From an overall global competitiveness point of view, Africa’s average competitiveness ranking is 21% compared to Latin America and The Caribbean’s average ranking of 40%, the Transition Economies average ranking of 45% and Asia’s average ranking of 57%. This implies that Africa is significantly less competitive than Asia, Latin America and The Caribbean and the Transition Economies. Africa needs to focus on improving infrastructure, technological readiness and health and primary education in order to create more job opportunities for its burgeoning young population.
At 34%, Africa’s average ranking in the Corruption Perceptions Index, 2016 is lower than the average rankings for any other Developing and Transition Economy and is significantly down from its average ranking of 41% in the Corruption Perceptions Index, 2015. Latin America and The Caribbean lead in this area with an average ranking of 51% (2015 – 48%), followed by Asia at 47% (2015 – 52%), Oceania at 41% (2015 – 17%) and the Transition Economies at 38% (2015 – 40%). Corruption is considered in the Global Competitiveness Index, 2016 – 2017, and is, therefore, considered important in ensuring the competitiveness of any economy going forward. Corruption also results in reduced available funding for improvements to infrastructure, healthcare and education in affected regions and economies. Africa needs to improve in this area if it intends to compete with these economies for FDI inflows and in terms of global competitiveness.
On the ease of doing business front, measured in terms of the Ease of Doing Business Survey, 2016, the Transition Economies are ahead with an average ranking of 71% compared to Asia at 48%, Latin America and The Caribbean at 44%, Oceania at 39% and Africa at 26%. Africa has the lowest average ranking of the regional Developing and Transition Economies. In order to encourage competitiveness and growth, the legal and administrative framework within which government, business and individuals operate must be efficient and of a good quality. The institutional environment must encourage investment by protecting the legal rights of investors and enabling them to fully leverage information and communication technologies in daily activities and production processes resulting in increased efficiency and innovation. Corruption reduces the efficiency and quality of the institutional environment in a country and this impacts
on the relevant country’s ability to be competitive. Africa has a low ranking in the Ease of Doing Business Survey, 2016 which means that it is difficult for companies to start and maintain a business in many African countries. A low ranking in this survey creates the perception that the accounting and reporting standards and general transparency is poor with the result that it is more difficult for companies to prevent fraud and mismanagement, ensure good governance and maintain investor and consumer confidence. Difficulties in doing business in a country discourages much needed FDI resulting in less funding being available for infrastructure, education and healthcare.
GDP growth for Emerging Market Regions is forecast to continue to be subdued during 2017 and 2018. Africa has the highest forecast average GDP growth at 4.3% in 2017 and 4.4% in 2018. Asia has the second highest forecast average GDP growth at 3.4% in 2017 and 4.0% in 2018. These growth forecasts are subject to significant uncertainty, particularly with regards to global policy uncertainty regarding trade and increasing protectionist tendencies.
Growth in Sub-Saharan Africa is estimated to have dropped in 2016 due to low commodity prices, weak external demand, drought, electricity generation issues and security problems in some countries combined with a sharp decline in estimated FDI inflows during 2016. While the UNCTAD Global Investment Trends Monitor No.24, October 2016 is forecasting FDI to increase marginally during 2017, the extractive industries were not identified as being likely contenders for FDI inflows in any region. It is further noted that a move by the US global leadership away from free trade, globalisation and open markets is expected to have as yet unquantified negative consequences for Emerging Markets. Brexit is also expected to have a negative impact on trade and investment into Africa. The greater than expected slowdown in China could also impact demand for export commodities and commodity prices. Lower growth rates in certain countries had a knock on negative effect on employment and credit to the private sector. Recovery of growth in Sub-Saharan Africa is forecast to be moderate as a result of on-going lower commodity prices.
What can be doneCountries can only influence their own policies and ability to adapt to the changes that are expected to take place. African countries have generally made forward strides in adopting and/or revising investment laws in order to attract FDI inflows, particularly, into the manufacturing sector and providing incentives for investment. More can be done, however, in the area of facilitating investment by making it easier to invest in the various countries. African countries need to focus on improving their rankings in the Corruption Perceptions Index, which dropped significantly during 2016, and the Ease of Doing Business Survey thereby promoting their countries as the country of choice for the limited available FDI inflows.
African countries can also continue to focus on utilising all available funding to improve education, health and infrastructure so that they are prepared, to the best extent possible, for the fourth industrial revolution and to derive the best benefits available from the changes to come.
5 | What influences foreign direct investment into Africa
What influences foreign direct investment into Africa | 6
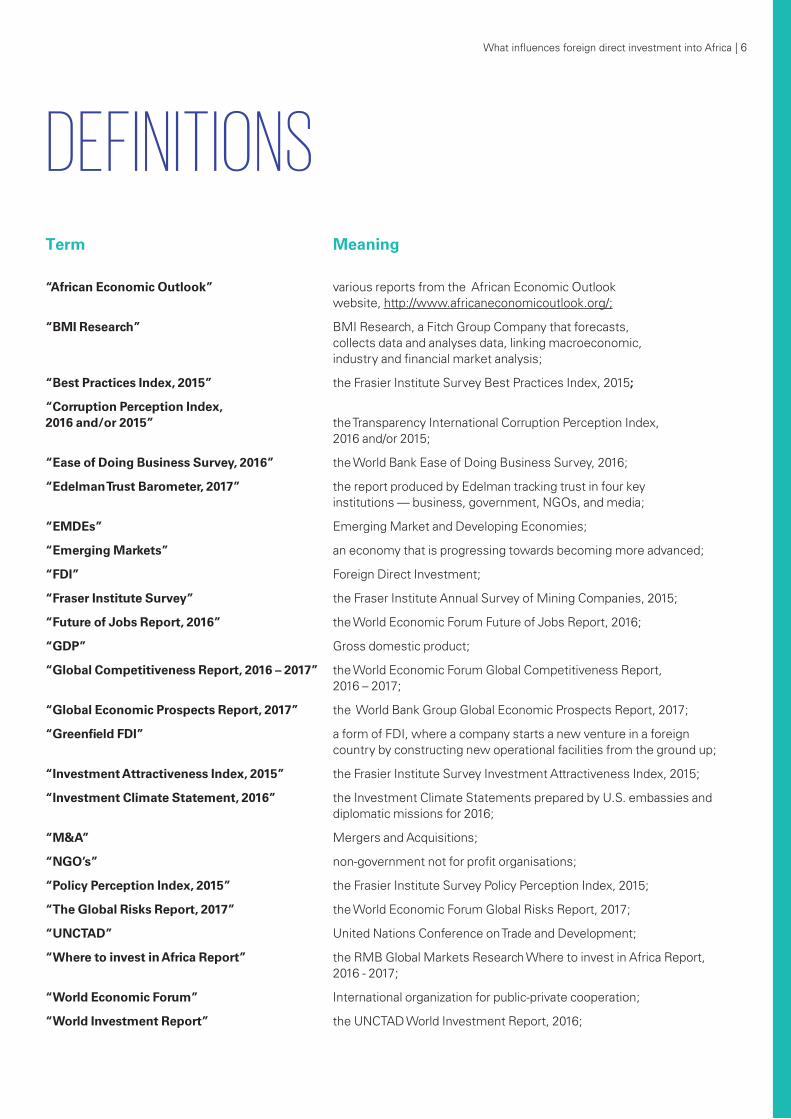
DEFINITIONSTerm Meaning
“African Economic Outlook” various reports from the African Economic Outlook website, http://www.africaneconomicoutlook.org/;
“BMI Research” BMI Research, a Fitch Group Company that forecasts, collects data and analyses data, linking macroeconomic, industry and financial market analysis;
“Best Practices Index, 2015” the Frasier Institute Survey Best Practices Index, 2015;
“Corruption Perception Index, 2016 and/or 2015” the Transparency International Corruption Perception Index, 2016 and/or 2015;
“Ease of Doing Business Survey, 2016” the World Bank Ease of Doing Business Survey, 2016;
“Edelman Trust Barometer, 2017” the report produced by Edelman tracking trust in four key institutions — business, government, NGOs, and media;
“EMDEs” Emerging Market and Developing Economies;
“Emerging Markets” an economy that is progressing towards becoming more advanced;
“FDI” Foreign Direct Investment;
“Fraser Institute Survey” the Fraser Institute Annual Survey of Mining Companies, 2015;
“Future of Jobs Report, 2016” the World Economic Forum Future of Jobs Report, 2016;
“GDP” Gross domestic product;
“Global Competitiveness Report, 2016 – 2017” the World Economic Forum Global Competitiveness Report, 2016 – 2017;
“Global Economic Prospects Report, 2017” the World Bank Group Global Economic Prospects Report, 2017;
“Greenfield FDI” a form of FDI, where a company starts a new venture in a foreign country by constructing new operational facilities from the ground up;
“Investment Attractiveness Index, 2015” the Frasier Institute Survey Investment Attractiveness Index, 2015;
“Investment Climate Statement, 2016” the Investment Climate Statements prepared by U.S. embassies and diplomatic missions for 2016;
“M&A” Mergers and Acquisitions;
“NGO’s” non-government not for profit organisations;
“Policy Perception Index, 2015” the Frasier Institute Survey Policy Perception Index, 2015;
“The Global Risks Report, 2017” the World Economic Forum Global Risks Report, 2017;
“UNCTAD” United Nations Conference on Trade and Development;
“Where to invest in Africa Report” the RMB Global Markets Research Where to invest in Africa Report, 2016 - 2017;
“World Economic Forum” International organization for public-private cooperation;
“World Investment Report” the UNCTAD World Investment Report, 2016;
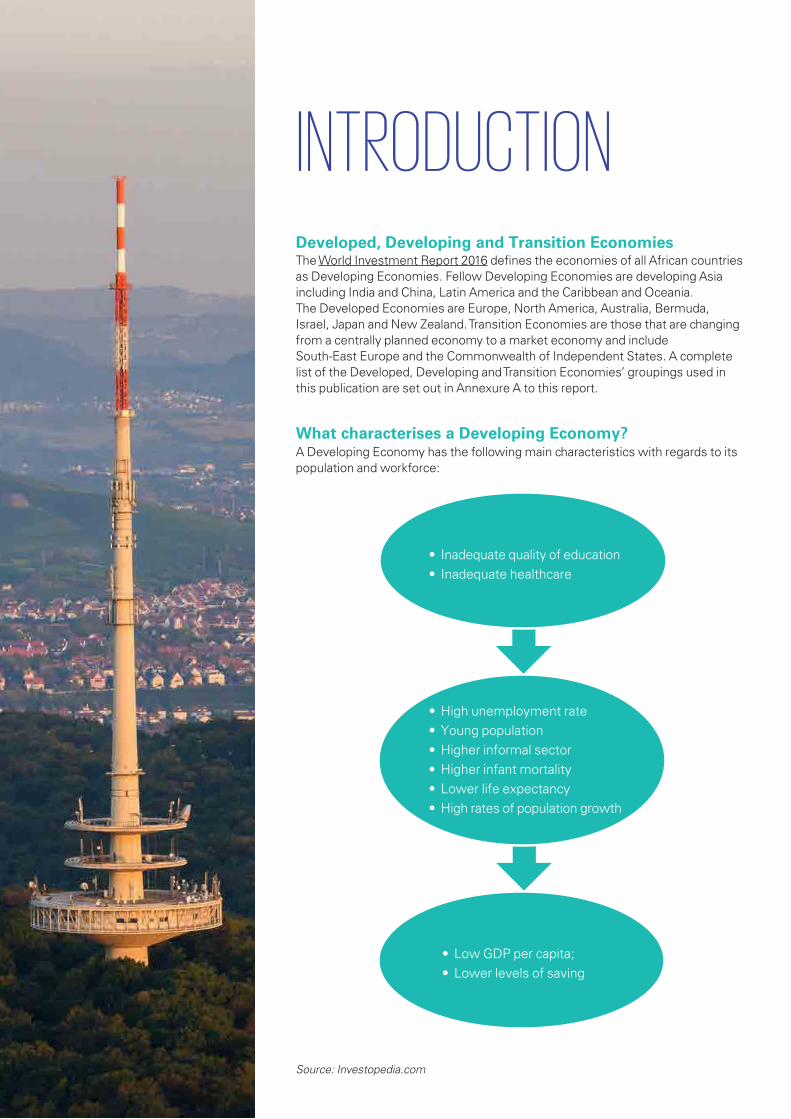
INTRODUCTIONDeveloped, Developing and Transition EconomiesThe World Investment Report 2016 defines the economies of all African countries as Developing Economies. Fellow Developing Economies are developing Asia including India and China, Latin America and the Caribbean and Oceania. The Developed Economies are Europe, North America, Australia, Bermuda, Israel, Japan and New Zealand. Transition Economies are those that are changing from a centrally planned economy to a market economy and include South-East Europe and the Commonwealth of Independent States. A complete list of the Developed, Developing and Transition Economies’ groupings used in this publication are set out in Annexure A to this report.
What characterises a Developing Economy?A Developing Economy has the following main characteristics with regards to its population and workforce:
• High unemployment rate• Young population• Higher informal sector• Higher infant mortality• Lower life expectancy• High rates of population growth
• Inadequate quality of education• Inadequate healthcare
• Low GDP per capita;• Lower levels of saving
Source: Investopedia.com
What influences foreign direct investment into Africa | 8
In addition to the above characteristics attributable to the population and work forces, Developing Economies frequently face other challenges such as poor infrastructure, dependency on the agricultural and extractive industries, corruption, inflationary and currency pressures, political and social instability and, in certain countries, deteriorating fiscal positions and current accounts.
What is the future of jobs?With Developing Economies being characterised by inadequate levels of education and health care leading to high levels of unemployment and a young and rapidly growing population, the views of the World Economic Forum, as detailed in their Future of Jobs Report 2016, is concerning.
The Future of Jobs Report 2016 states that the world is on the brink of a fourth industrial revolution with developments in fields such as artificial intelligence and machine learning, robotics, nanotechnology, 3D printing and genetics and biotechnology all driving change to global industries and business models. These major drivers of change are expected to have a significant impact on jobs and will result in both displacement from existing jobs, particularly in the areas of routine white collar office functions, and the creation of jobs, specifically in the areas of computer and mathematical, architectural and engineering related fields. It is anticipated, however, that the current employment trends will result in a net loss of 5.1 million jobs due to the drivers of change noted above, over the five year period ending 2020.
Based on the nature of the jobs that are expected to be created, the drivers of change will result in heightened labour productivity and a widening skills gap. This is not good news for Developing Economies which are already struggling with limited skilled resources and high unemployment rates. The governments of Developing Economies need to focus more than ever on improving education and up-skilling their population to mitigate the negative effects of the expected employment trends and take advantage of the opportunities presented.
What are the economic prospects for Emerging Market and Developing Economies (“EMDE’s”)?According to the Global Economic Prospects Report 2017, published by the World Bank Group, the 2017 calendar year will be marked by stagnant global trade, subdued investment and heightened policy uncertainty.
Global growth during 2016 was estimated to be a very low at 2.3% and is only projected to rise to 2.7% during 2017.
Emerging Markets are Developing Economies that have made great strides forward in terms of development, reforms and growth. EMDE’s account for approximately 75% of the world’s population and the world’s poor and about 33% of the global GDP. EMDE’s grew at an estimated 3.4% during 2016. Commodity exporting EMDE’s grew at a mere 0.3%, with improved growth in Russia and Brazil, together with a gradual increase in commodity prices, off-setting additional weakness in other exporting EMDE’s, in particular, Sub-Saharan Africa. Growth for EMDE’s is expected to increase slightly in 2017 due to an improving environment for commodity exporters and continued strong domestic demand from commodity importers in these countries, however, the recovery in growth for Sub-Saharan Africa is expected to be weaker than previously anticipated as some commodity exporting countries are struggling to adjust to lower commodity prices. The Middle East and North Africa are expected to see modest growth due to recovering oil prices. Growth in Latin America and the Caribbean and in Europe and Central Asia is expected to improve during 2017 due to activity in Brazil and Russia being perceived to have reached the bottom of its cycle. Commodity-importing economies in East Asia and the Pacific and South Asia are expected to experience steady growth. Growth in EMDE’s is subject to various risks including increasing policy uncertainty in Developed Economies and some EMDE’s, financial market disruptions and weakening potential growth. The Global Economic Prospects Report 2017 suggests that investment by EMDE’s in human and physical capital will help close the lack of skills and poor infrastructure gaps and support growth going forward. Efforts by EMDE’s to implement a comprehensive, consistent and co-ordinated approach to policy making, address economic vulnerabilities and enhance international integration by promoting trade and FDI will help these countries to improve the resilience of their economies and help them deal with shocks when they materialise as well as improve their growth prospects.
FDI to EMDE’s is vital in order to assist them to expand their economic activity, accommodate rapid urbanisation and to achieve sustainable development goals. FDI inflows to EMDE’s were depressed during 2016, although the FDI inflows were fairly diverse amongst the various countries. On the assumption that commodity exporters will achieve higher growth, FDI inflows should increase marginally during 2017.
9 | What influences foreign direct investment into Africa
What does this mean?Both the Global Economic Prospects Report 2017 and The Future of Jobs Report 2016 are expressing the same views. In order to create sustainable economic growth and take advantage of the opportunities presented by future employment trends, policy makers need to up skill the labour force, embrace productivity enhancing technology and improve infrastructure. This can be achieved by improving the quality of education and health care although this is not a quick fix.
The recently launched Edelman Trust Barometer, 2017 indicates that trust in the institutions of government, media, business and NGO’s is in crisis globally. The Edelman Trust Barometer, 2017 surveys the general on-line population and distinguishes between:
• respondents’ who have a university education, are in the top 25% of household income per age group in their respective countries and are significant users of media business news (“Informed Public”); and
• respondents’ who are not part of the Informed Public (“Mass Population”).
According to the findings of the Edelman Trust Barometer, 2017, the Mass Population distrusts their institutions of government, media, business and NGO’s in 20 out of the 28 countries surveyed including in the USA, Canada, South Africa, Australia and the UK. This decline in trust is leading to a rejection of established authority by the Mass Population, which comprises 91% of the total population surveyed, and is adding to populist views by the general populations in the Developed Economies. These populist views are in turn leading to the more inward-looking policies and increasing protectionist measures by Developed Countries and are contributing significantly to the global risks to the economy of the world as identified in The Global Risks Report 2017, published by the World Economic Forum.
The five key challenges, identified by The Global Risks Report 2017, all of which require greater global attention and action, are as follows:
- fostering greater solidarity and long-term thinking in market capitalism;
- revitalising global economic growth;
- recognising the importance of identity and inclusiveness in healthy political communities;
- mitigating the risks and exploiting the opportunities of the fourth industrial revolution; and
- strengthening systems of global co-operation.
In light of the above identified risks, the confirmation contained in the Global Competitiveness report, 2016 – 2017, published by the World Economic Forum, that stagnating and unequally distributed income growth in many economies is resulting in more inward-looking policies, increasing protectionist measures and a general question of the premises underlying globalisation by many people in developed economies, as was evidenced by the recent Brexit vote, is concerning. The Global Competitiveness report, 2016 – 2017 goes on to state that the abrupt economic slowdown being experienced by many Emerging Markets as a result of the end of the commodities super cycle has exposed the slow pace or lack of competitiveness (defined as the set of institutions, policies and factors that determine the level of prosperity of an economy and which also determines the level of prosperity an economy can achieve) enhancing reforms in these economies in recent years. The Global Competitiveness report, 2016 – 2017 warns that this could increase polarization and threaten social cohesion. The Global Competitiveness Report, 2016 – 2017 also identifies the fourth industrial revolution as being a future major source of growth and development and notes that, as the fourth industrial revolution gains momentum, it will be increasingly important to support the emergence of new sectors of economic activity through competitiveness reforms that foster innovations. According to the Global Competitiveness Report, 2016 – 2017, only a few economies currently have the ability to build enabling environments for innovation.
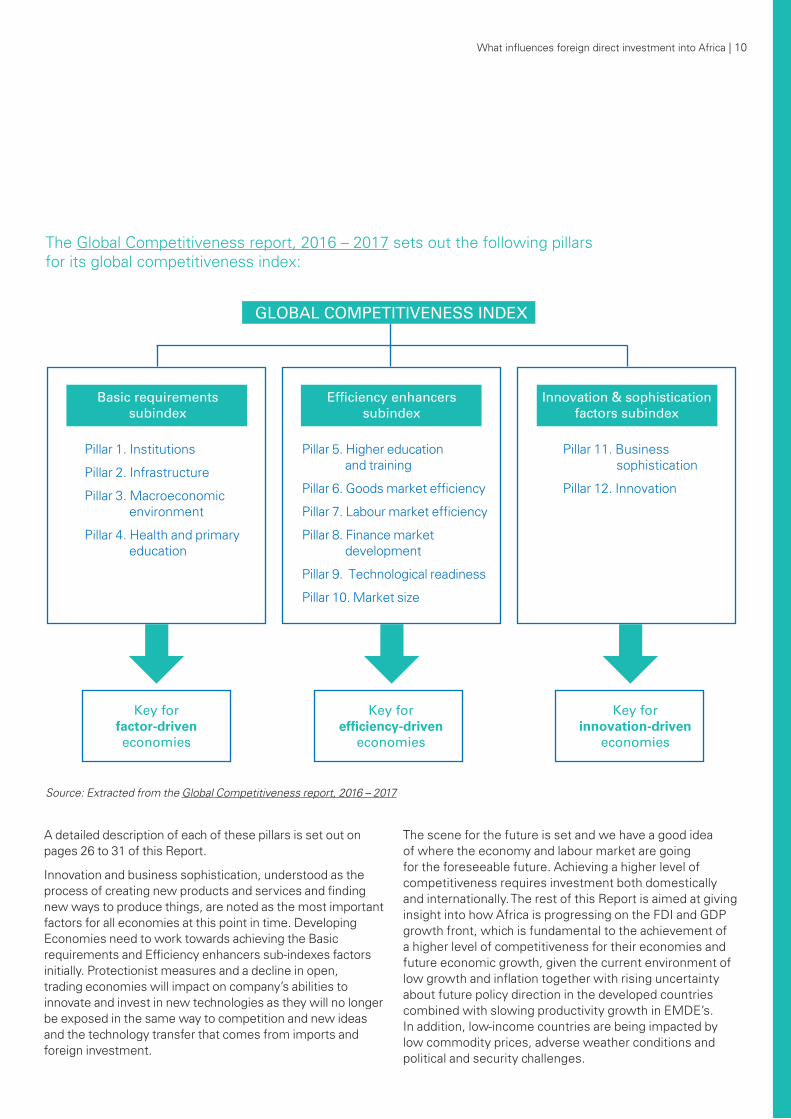
The Global Competitiveness report, 2016 – 2017 sets out the following pillars for its global competitiveness index:
What influences foreign direct investment into Africa | 10
A detailed description of each of these pillars is set out on pages 26 to 31 of this Report.
Innovation and business sophistication, understood as the process of creating new products and services and finding new ways to produce things, are noted as the most important factors for all economies at this point in time. Developing Economies need to work towards achieving the Basic requirements and Efficiency enhancers sub-indexes factors initially. Protectionist measures and a decline in open, trading economies will impact on company’s abilities to innovate and invest in new technologies as they will no longer be exposed in the same way to competition and new ideas and the technology transfer that comes from imports and foreign investment.
The scene for the future is set and we have a good idea of where the economy and labour market are going for the foreseeable future. Achieving a higher level of competitiveness requires investment both domestically and internationally. The rest of this Report is aimed at giving insight into how Africa is progressing on the FDI and GDP growth front, which is fundamental to the achievement of a higher level of competitiveness for their economies and future economic growth, given the current environment of low growth and inflation together with rising uncertainty about future policy direction in the developed countries combined with slowing productivity growth in EMDE’s. In addition, low-income countries are being impacted by low commodity prices, adverse weather conditions and political and security challenges.
Source: Extracted from the Global Competitiveness report, 2016 – 2017
Pillar 1. Institutions
Pillar 2. Infrastructure
Pillar 3. Macroeconomic environment
Pillar 4. Health and primary education
Pillar 11. Business sophistication
Pillar 12. Innovation
Pillar 5. Higher education and training
Pillar 6. Goods market efficiency
Pillar 7. Labour market efficiency
Pillar 8. Finance market development
Pillar 9. Technological readiness
Pillar 10. Market size
Key for factor-driveneconomies
Key for efficiency-driven
economies
Key for innovation-driven
economies
GLOBAL COMPETITIVENESS INDEX
Basic requirements subindex
Efficiency enhancers subindex
Innovation & sophistication factors subindex
47 784
55 142 52 152
58 302 54 079
-
10 000
20 000
30 000
40 000
50 000
60 000
70 000
2011 2012 2013 2014 2015
Total FDI into Africa in USD millions
What influences foreign direct investment into Africa | 12
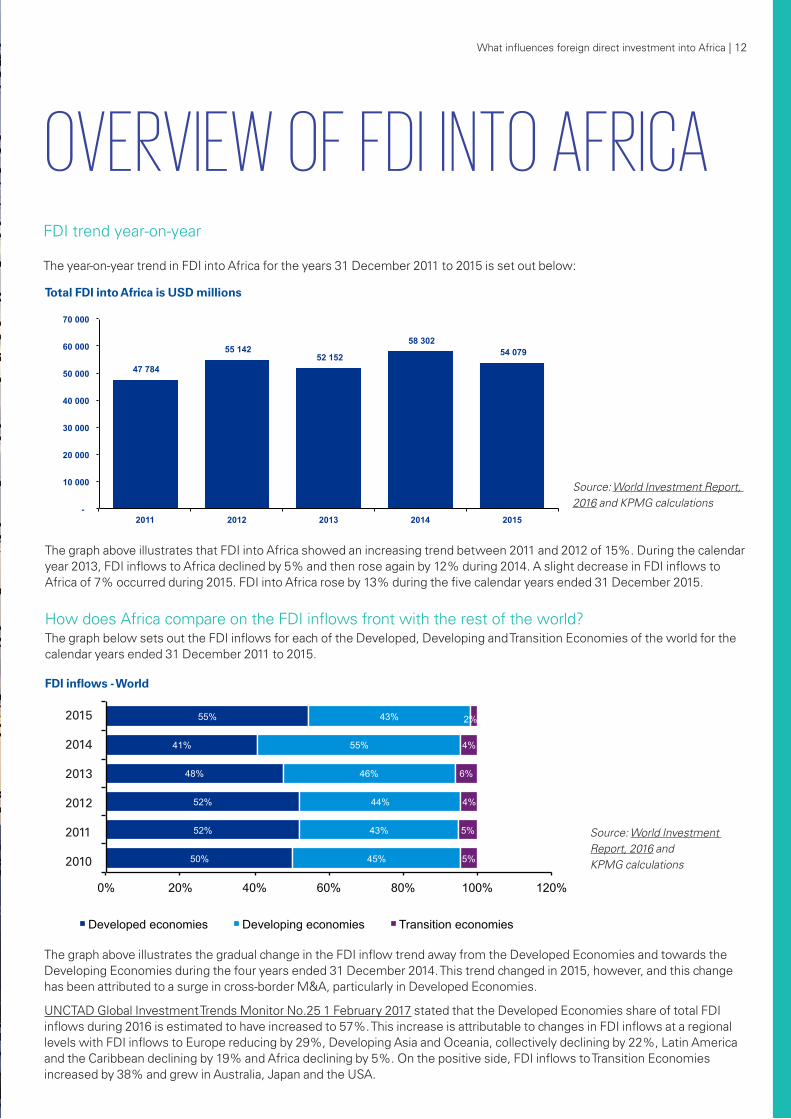
FDI trend year-on-year The year-on-year trend in FDI into Africa for the years 31 December 2011 to 2015 is set out below:
OVERVIEW OF FDI INTO AFRICA
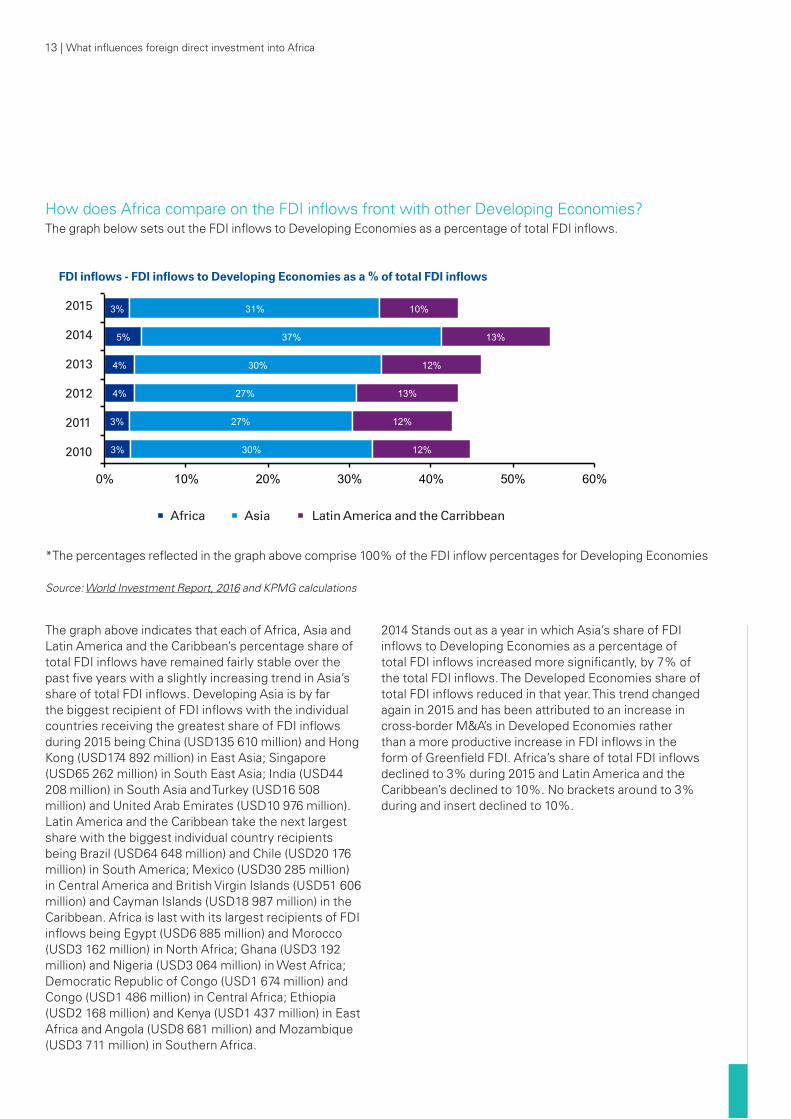
The graph above illustrates that FDI into Africa showed an increasing trend between 2011 and 2012 of 15%. During the calendar year 2013, FDI inflows to Africa declined by 5% and then rose again by 12% during 2014. A slight decrease in FDI inflows to Africa of 7% occurred during 2015. FDI into Africa rose by 13% during the five calendar years ended 31 December 2015. How does Africa compare on the FDI inflows front with the rest of the world?The graph below sets out the FDI inflows for each of the Developed, Developing and Transition Economies of the world for the calendar years ended 31 December 2011 to 2015.
The graph above illustrates the gradual change in the FDI inflow trend away from the Developed Economies and towards the Developing Economies during the four years ended 31 December 2014. This trend changed in 2015, however, and this change has been attributed to a surge in cross-border M&A, particularly in Developed Economies.
UNCTAD Global Investment Trends Monitor No.25 1 February 2017 stated that the Developed Economies share of total FDI inflows during 2016 is estimated to have increased to 57%. This increase is attributable to changes in FDI inflows at a regional levels with FDI inflows to Europe reducing by 29%, Developing Asia and Oceania, collectively declining by 22%, Latin America and the Caribbean declining by 19% and Africa declining by 5%. On the positive side, FDI inflows to Transition Economies increased by 38% and grew in Australia, Japan and the USA.
Source: World Investment Report, 2016 and KPMG calculations
Total FDI into Africa is USD millions
Source: World Investment Report, 2016 and KPMG calculations50%
52%
52%
48%
41%
55%
45%
43%
44%
46%
55%
43%
5%
5%
4%
6%
4%
2%
0% 20% 40% 60% 80% 100% 120%
2 010
2011
2012
2013
2014
2015
Units
FDI inflows - World
Developed economies Developing economies Transitional economies
50%
52%
52%
48%
41%
55%
45%
43%
44%
46%
55%
43%
5%
5%
4%
6%
4%
2%
0% 20% 40% 60% 80% 100% 120%
2 010
2011
2012
2013
2014
2015
Units
FDI inflows - World
Developed economies Developing economies Transitional economies
50%
52%
52%
48%
41%
55%
45%
43%
44%
46%
55%
43%
5%
5%
4%
6%
4%
2%
0% 20% 40% 60% 80% 100% 120%
2 010
2011
2012
2013
2014
2015
Units
FDI inflows - World
Developed economies Developing economies Transitional economies
FDI inflows - World
2015
2014
2013
2012
2011
2010
Source: World Investment Report, 2016 and KPMG calculations
The graph above indicates that each of Africa, Asia and Latin America and the Caribbean’s percentage share of total FDI inflows have remained fairly stable over the past five years with a slightly increasing trend in Asia’s share of total FDI inflows. Developing Asia is by far the biggest recipient of FDI inflows with the individual countries receiving the greatest share of FDI inflows during 2015 being China (USD135 610 million) and Hong Kong (USD174 892 million) in East Asia; Singapore (USD65 262 million) in South East Asia; India (USD44 208 million) in South Asia and Turkey (USD16 508 million) and United Arab Emirates (USD10 976 million). Latin America and the Caribbean take the next largest share with the biggest individual country recipients being Brazil (USD64 648 million) and Chile (USD20 176 million) in South America; Mexico (USD30 285 million) in Central America and British Virgin Islands (USD51 606 million) and Cayman Islands (USD18 987 million) in the Caribbean. Africa is last with its largest recipients of FDI inflows being Egypt (USD6 885 million) and Morocco (USD3 162 million) in North Africa; Ghana (USD3 192 million) and Nigeria (USD3 064 million) in West Africa; Democratic Republic of Congo (USD1 674 million) and Congo (USD1 486 million) in Central Africa; Ethiopia (USD2 168 million) and Kenya (USD1 437 million) in East Africa and Angola (USD8 681 million) and Mozambique (USD3 711 million) in Southern Africa.
2014 Stands out as a year in which Asia’s share of FDI inflows to Developing Economies as a percentage of total FDI inflows increased more significantly, by 7% of the total FDI inflows. The Developed Economies share of total FDI inflows reduced in that year. This trend changed again in 2015 and has been attributed to an increase in cross-border M&A’s in Developed Economies rather than a more productive increase in FDI inflows in the form of Greenfield FDI. Africa’s share of total FDI inflows declined to 3% during 2015 and Latin America and the Caribbean’s declined to 10%. No brackets around to 3% during and insert declined to 10%.
*The percentages reflected in the graph above comprise 100% of the FDI inflow percentages for Developing Economies
13 | What influences foreign direct investment into Africa
How does Africa compare on the FDI inflows front with other Developing Economies?The graph below sets out the FDI inflows to Developing Economies as a percentage of total FDI inflows.
FDI inflows - FDI inflows to Developing Economies as a % of total FDI inflows
2015
2014
2013
2012
2011
2010 3%
3%
4%
4%
5%
3%
30%
27%
27%
30%
37%
31%
12%
12%
13%
12%
13%
10%
0% 10% 20% 30% 40% 50% 60%
2 010
2 011
2 012
2 013
2 014
2 015
Units
FDI inflows - FDI inflows to developing economies as a % of total FDI inflows
Africa Asia Latin America and the Caribbean Latin America and the CarribbeanAsiaAfrica
What influences foreign direct investment into Africa | 14
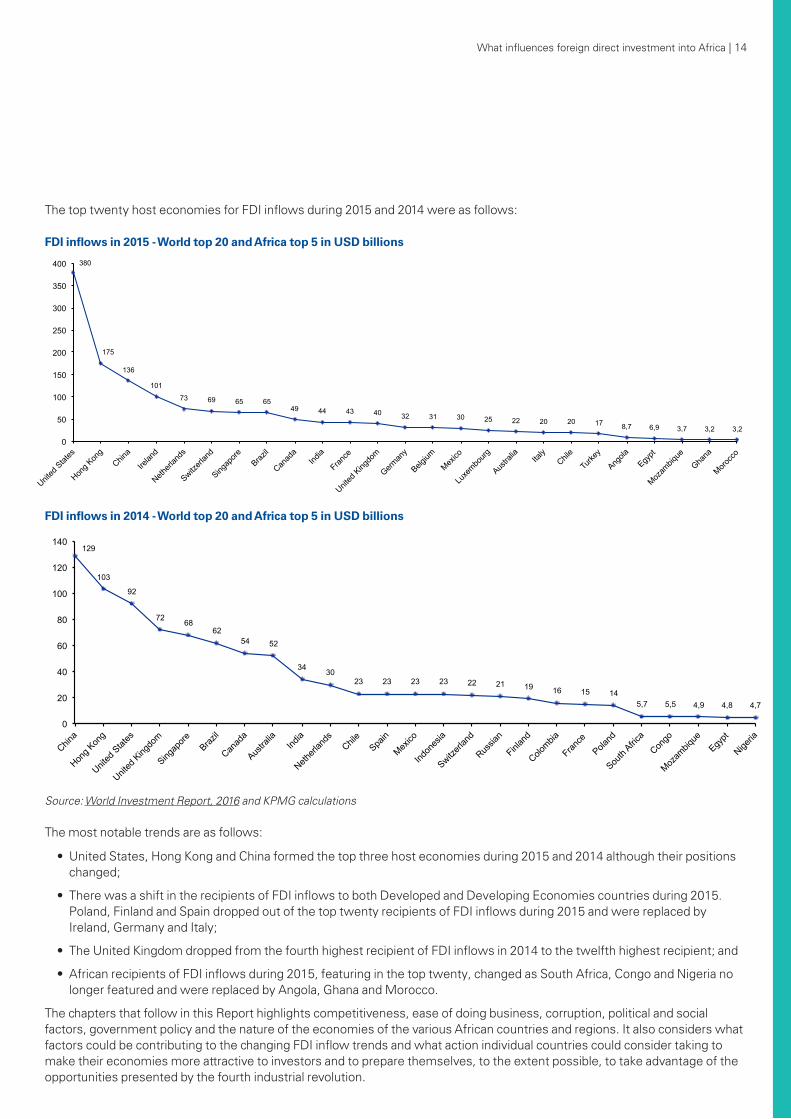
The top twenty host economies for FDI inflows during 2015 and 2014 were as follows:
Source: World Investment Report, 2016 and KPMG calculations
The most notable trends are as follows:
• United States, Hong Kong and China formed the top three host economies during 2015 and 2014 although their positions changed;
• There was a shift in the recipients of FDI inflows to both Developed and Developing Economies countries during 2015. Poland, Finland and Spain dropped out of the top twenty recipients of FDI inflows during 2015 and were replaced by Ireland, Germany and Italy;
• The United Kingdom dropped from the fourth highest recipient of FDI inflows in 2014 to the twelfth highest recipient; and
• African recipients of FDI inflows during 2015, featuring in the top twenty, changed as South Africa, Congo and Nigeria no longer featured and were replaced by Angola, Ghana and Morocco.
The chapters that follow in this Report highlights competitiveness, ease of doing business, corruption, political and social factors, government policy and the nature of the economies of the various African countries and regions. It also considers what factors could be contributing to the changing FDI inflow trends and what action individual countries could consider taking to make their economies more attractive to investors and to prepare themselves, to the extent possible, to take advantage of the opportunities presented by the fourth industrial revolution.
380
175
136
101
73 69 65 65 49 44 43 40 32 31 30 25 22 20 20 17 8,7 6,9 3,7 3,2 3,2
0
50
100
150
200
250
300
350
400
United
Stat
es
Hong K
ong
China
Irelan
d
Netherl
ands
Switzerl
and
Singap
ore
Brazil
Canad
a Ind
ia
France
United
King
dom
German
y
Belgium
Mexico
Luxe
mbourg
Austra
lia
Italy
Chile
Turke
y
Angola
Egypt
Mozam
bique
Ghana
Morocc
o
Uni
ts
FDI inflows in 2015 - World top 20 and Africa top 5
129
103
92
72 68 62
54 52
34 30 23 23 23 23 22 21 19 16 15 14
5,7 5,5 4,9 4,8 4,7
0
20
40
60
80
100
120
140
China
Hong K
ong
United
Stat
es
United
King
dom
Singap
ore
Brazil
Canad
a
Austra
lia
India
Netherl
ands
Chil
e
Spain
Mexico
Indon
esia
Switzerl
and
Russia
n
Finlan
d
Colombia
France
Poland
South
Africa
Congo
Mozam
bique
Egypt
Nigeria
Uni
ts
FDI inflows in 2014 - World top 20 and Africa top 5
FDI inflows in 2015 - World top 20 and Africa top 5 in USD billions
FDI inflows in 2014 - World top 20 and Africa top 5 in USD billions
15 | What influences foreign direct investment into Africa
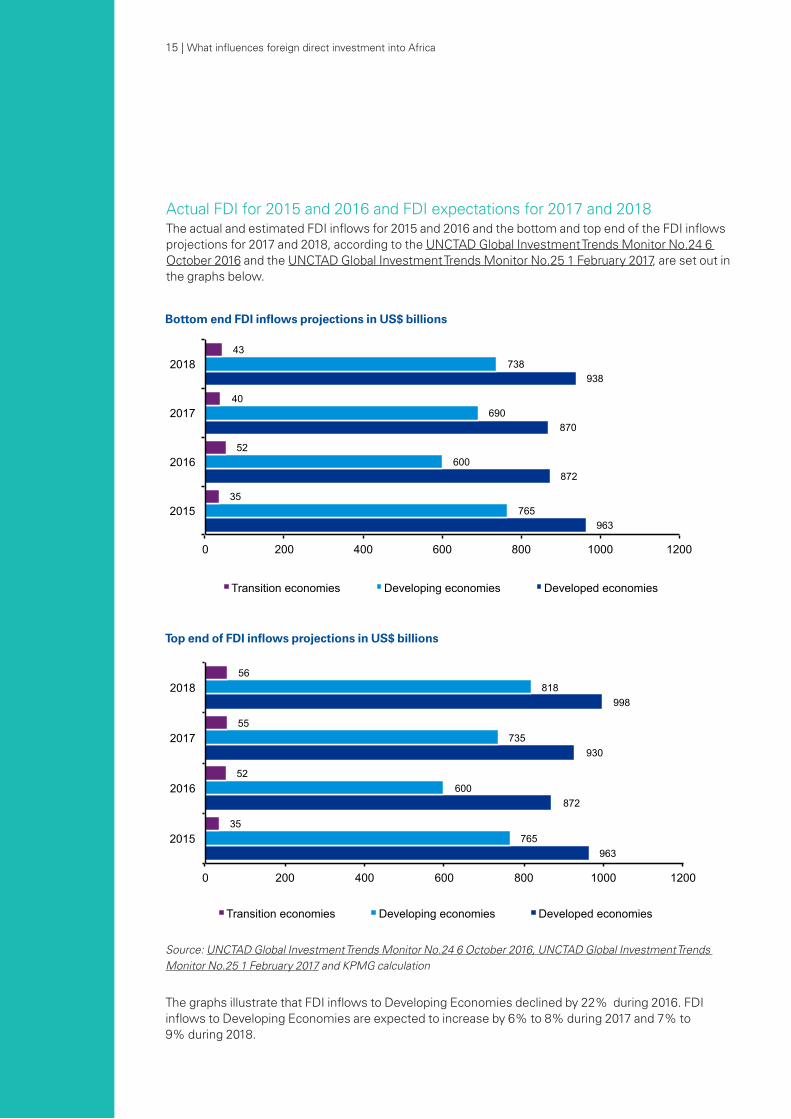
Actual FDI for 2015 and 2016 and FDI expectations for 2017 and 2018The actual and estimated FDI inflows for 2015 and 2016 and the bottom and top end of the FDI inflows projections for 2017 and 2018, according to the UNCTAD Global Investment Trends Monitor No.24 6 October 2016 and the UNCTAD Global Investment Trends Monitor No.25 1 February 2017, are set out in the graphs below.
The graphs illustrate that FDI inflows to Developing Economies declined by 22% during 2016. FDI inflows to Developing Economies are expected to increase by 6% to 8% during 2017 and 7% to 9% during 2018.
Source: UNCTAD Global Investment Trends Monitor No.24 6 October 2016, UNCTAD Global Investment Trends Monitor No.25 1 February 2017 and KPMG calculation
Top end of FDI inflows projections in US$ billions
Bottom end FDI inflows projections in US$ billions
963
872
870
938
765
600
690
738
35
52
40
43
0 200 400 600 800 1000 1200
2015
2016
2017
2018
Units
Bottom end FDI inflows projections
Transition economies Developing economies Developed economies
963
872
930
998
765
600
735
818
35
52
55
56
0 200 400 600 800 1000 1200
2015
2016
2017
2018
Units
Top end of FDI inflows projections
Transition economies Developing economies Developed economies
The decline in global FDI inflows during 2016 are attributed to the following factors:
• a fragile global economy;
• persistent weak aggregate demand;
• effective policy measures by the United States Treasury Department to reduce tax inversion deals (the practice of relocating a company’s legal domicile to a lower-tax country, or tax haven, usually while retaining its material operations in its higher-tax country of origin), thereby making it harder for companies to move their tax domiciles out of the United States and then shift profits to low-tax countries (i.e. reduction in cross-border M&A investment); and
• a reduction in profits by multinational enterprises.
According to a survey conducted with executives of various multinational enterprises by UNCTAD contained in the UNCTAD Global Investment Trends Monitor No.25 1 February 2017, the factors that could increase FDI during 2017 and 2018 are as follows:
• an improvement in the economy of the United States;
• agreements such as the Transatlantic Trade and Investment Partnership, Regional Comprehensive Economic Partnership and the Trans-Pacific Partnership;
• ongoing technological change
• the digital economy;
• global urbanisation; and
• offshoring.
Geopolitical uncertainty, debt concerns, terrorism and cyber threats were considered factors that would dampen FDI inflows to affected countries during this period.
UNCTAD Global Investment Trends Monitor No.25 1 February 2017, however, highlights the fact that there are a number of significant uncertainties that could materially impact on the recovery of FDI during 2017. These uncertainties are as follows:
• an increase in interest rates in the USA could result in a shift in the composition of capital flows with implications for exchange rates and financial systems throughout the world, but specifically for Developing Economies;
• multinational enterprises, which have increased their levels of corporate debt significantly during recent years, may have a reduced ability to invest due to rising costs of capital;
• on-going uncertainty about Developed Economies economic policies in the near future may negatively impact on FDI.
17 | What influences foreign direct investment into Africa
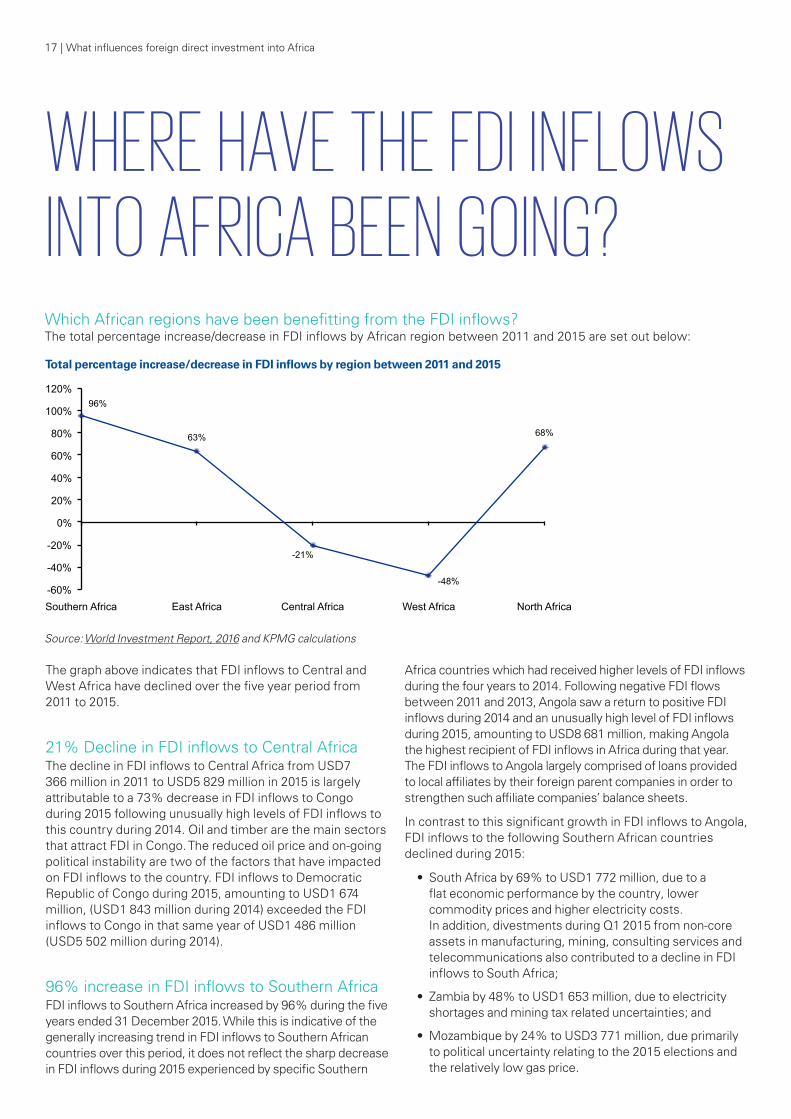
Which African regions have been benefitting from the FDI inflows? The total percentage increase/decrease in FDI inflows by African region between 2011 and 2015 are set out below:
WHERE HAVE THE FDI INFLOWS INTO AFRICA BEEN GOING?
The graph above indicates that FDI inflows to Central and West Africa have declined over the five year period from 2011 to 2015.
21% Decline in FDI inflows to Central AfricaThe decline in FDI inflows to Central Africa from USD7 366 million in 2011 to USD5 829 million in 2015 is largely attributable to a 73% decrease in FDI inflows to Congo during 2015 following unusually high levels of FDI inflows to this country during 2014. Oil and timber are the main sectors that attract FDI in Congo. The reduced oil price and on-going political instability are two of the factors that have impacted on FDI inflows to the country. FDI inflows to Democratic Republic of Congo during 2015, amounting to USD1 674 million, (USD1 843 million during 2014) exceeded the FDI inflows to Congo in that same year of USD1 486 million (USD5 502 million during 2014).
96% increase in FDI inflows to Southern AfricaFDI inflows to Southern Africa increased by 96% during the five years ended 31 December 2015. While this is indicative of the generally increasing trend in FDI inflows to Southern African countries over this period, it does not reflect the sharp decrease in FDI inflows during 2015 experienced by specific Southern
Africa countries which had received higher levels of FDI inflows during the four years to 2014. Following negative FDI flows between 2011 and 2013, Angola saw a return to positive FDI inflows during 2014 and an unusually high level of FDI inflows during 2015, amounting to USD8 681 million, making Angola the highest recipient of FDI inflows in Africa during that year. The FDI inflows to Angola largely comprised of loans provided to local affiliates by their foreign parent companies in order to strengthen such affiliate companies’ balance sheets.
In contrast to this significant growth in FDI inflows to Angola, FDI inflows to the following Southern African countries declined during 2015:
• South Africa by 69% to USD1 772 million, due to a flat economic performance by the country, lower commodity prices and higher electricity costs. In addition, divestments during Q1 2015 from non-core assets in manufacturing, mining, consulting services and telecommunications also contributed to a decline in FDI inflows to South Africa;
• Zambia by 48% to USD1 653 million, due to electricity shortages and mining tax related uncertainties; and
• Mozambique by 24% to USD3 771 million, due primarily to political uncertainty relating to the 2015 elections and the relatively low gas price.
Source: World Investment Report, 2016 and KPMG calculations
96%
63%
-21%
-48%
68%
-60%
-40%
-20%
0%
20%
40%
60%
80%
100%
120%
Southern Africa East Africa Central Africa West Africa North Africa
Uni
ts
Increase/decrease in FDI inflows by region between 2011 and 2015 Total percentage increase/decrease in FDI inflows by region between 2011 and 2015
19 | What influences foreign direct investment into Africa
63% Increase in FDI inflows to East AfricaThe 63% increase in FDI inflows to East Africa from USD4 778 million in 2011 to USD7 808 million in 2015 is largely attributable to increased FDI inflows over this period to Kenya (246% over the five year period), Ethiopia (246%), Uganda (18%) and Tanzania (25%). FDI inflows to Kenya increased by 37% during 2015 due to Kenya’s continuing status as a business hub for oil and gas exploration, manufacturing exports and consumer goods and services. Kenya also followed Tanzania’s lead during 2015 and abolished its restriction on foreign ownership of listed firms. Ethiopia continued to attract FDI inflows during 2015 from Asian firms seeking alternative production bases for textiles and garments for export to the EU. Furthermore, North America invested USD2 200 million in Ethiopia during 2015.
48% Decline in West AfricaThe decline in FDI inflows to West Africa are largely attributable to Nigeria which saw a decline in FDI inflows from USD8 915 million in 2011 to USD3 064 million in 2015 due mainly to the following:
• lower oil prices and incomplete policy adjustment thereto;
• security issues with militants’ attacks on oil pipelines negatively impacting on oil production; and
• electricity and fuel shortages combined with policy uncertainty adversely impacted activity in the non-oil sector in Nigeria.
68% increase in FDI inflows to North AfricaNorth Africa saw a significant decline in FDI inflows during 2011, however, this trend has been gradually reversing. In 2015 North Africa received 23% of total FDI inflows to Africa. The increase in FDI inflows to North Africa are largely attributable to Egypt, which saw increased FDI inflows during 2015 of 49%, and Sudan, which received FDI inflows of approximately 39% more in 2015 than in 2014. The FDI inflows into Egypt were largely in the financial and pharmaceutical industries followed by investments into the telecommunications and gas industries. The FDI inflows into Sudan were in the oil industry.
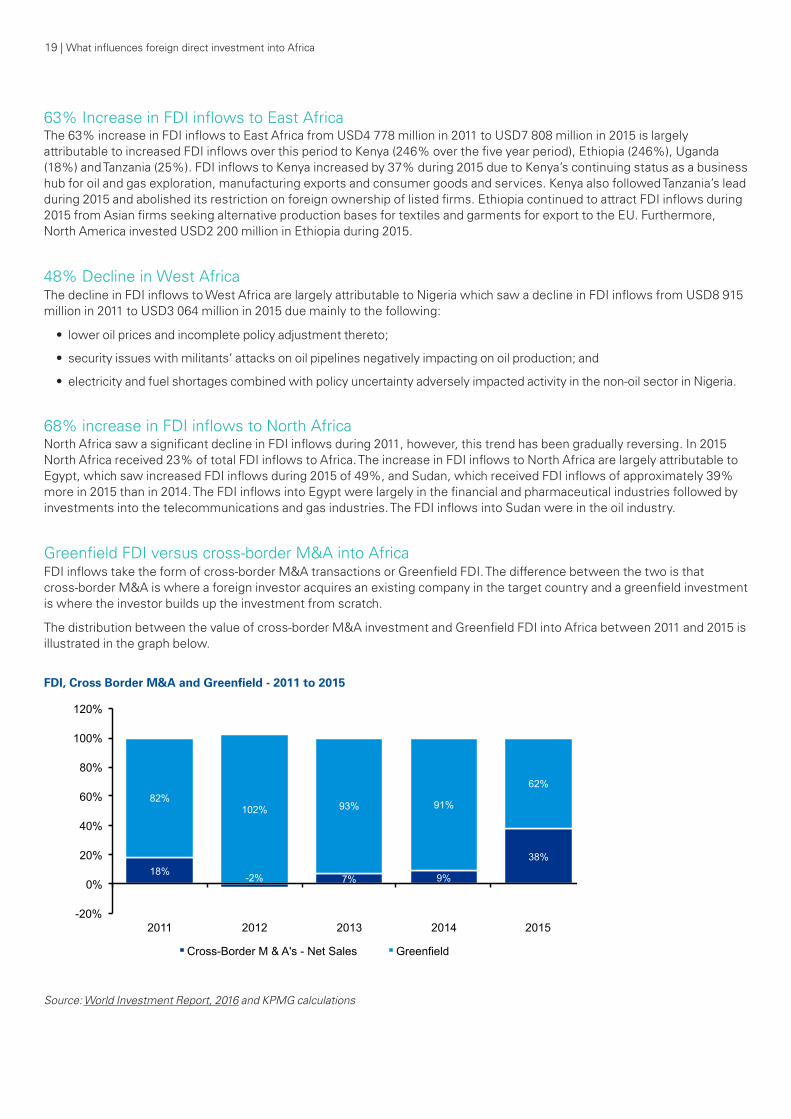
Greenfield FDI versus cross-border M&A into AfricaFDI inflows take the form of cross-border M&A transactions or Greenfield FDI. The difference between the two is that cross-border M&A is where a foreign investor acquires an existing company in the target country and a greenfield investment is where the investor builds up the investment from scratch.
The distribution between the value of cross-border M&A investment and Greenfield FDI into Africa between 2011 and 2015 is illustrated in the graph below.
Source: World Investment Report, 2016 and KPMG calculations
Southern Africa 20%
East Africa 15%
Central Africa 7% West Africa
27%
North Africa 31%
Announced greenfields FDI into Africa - 2015
18% -2% 7% 9%
38%
82% 102% 93% 91%
62%
-20%
0%
20%
40%
60%
80%
100%
120%
2011 2012 2013 2014 2015
Uni
ts
FDI, Cross Border M&A and Greenfield - 2011 to 2015
Cross-Border M & A's - Net Sales Greenfield
FDI, Cross Border M&A and Greenfield - 2011 to 2015
What influences foreign direct investment into Africa | 20
The deal values for M&A investment into many African countries are fairly small in comparison to developed countries and some other Developing Economies countries. Many multinational enterprises take the Greenfield FDI route due to a lack of suitable acquisition targets in some African countries.
Some of the pro’s and con’s of Greenfield FDI versus cross-border M&A investment are set out in the table below:
Greenfield FDI
Pro’s
1. Some governments provide subsidies and tax and other benefits to companies starting a business from scratch in their country;
2. The parent company has greater control over all aspects of the business;
3. The investor works with, and establishes a relationship, with the relevant regulatory and other authorities, from the beginning;
4. The parent company will have control over all employee hires;
5. The parent company will have control over its brand;
6. There are press and publicity opportunities. Con’s
7. Greenfields FDI is likely to cost more;
8. The entry process and negotiations with regulators can be very time consuming;
9. Government regulations may place multinational enterprises at a disadvantage in the short term.
Cross-border M&A investments
Pro’s 1. The investor acquires an established market;
2. Negotiations usually occur at the top level and the target company often handles licensing and compliance issues;
3. Licences are acquired as part of the acquisition;
4. The investor acquires skilled workers as part of the acquisition;
5. The investor acquires a brand with the business;
6. The investor acquires a knowledge base. Con’s
7. Difficulties may be encountered integrating a parent company with its acquisition targets;
8. Tax and legal problems may be encountered;
9. The acquisition process may be expensive and time-consuming.
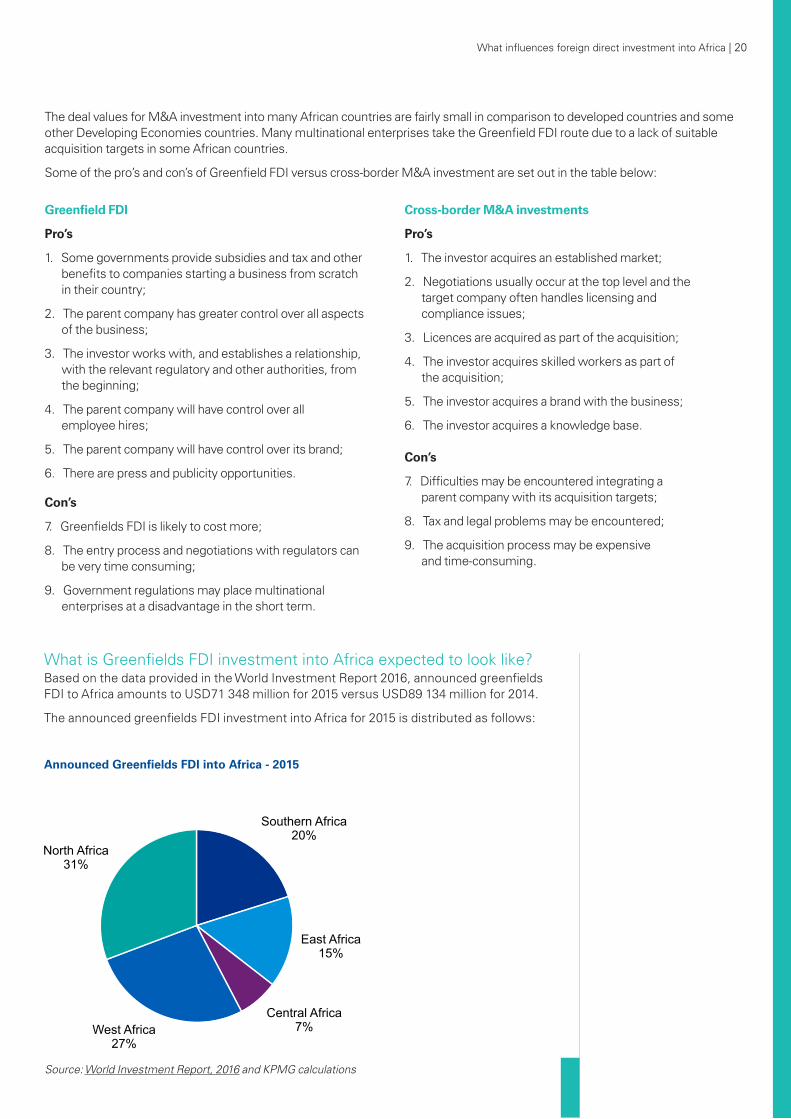
What is Greenfields FDI investment into Africa expected to look like?Based on the data provided in the World Investment Report 2016, announced greenfields FDI to Africa amounts to USD71 348 million for 2015 versus USD89 134 million for 2014.
The announced greenfields FDI investment into Africa for 2015 is distributed as follows:
Source: World Investment Report, 2016 and KPMG calculations
Southern Africa 20%
East Africa 15%
Central Africa 7% West Africa
27%
North Africa 31%
Announced greenfields FDI into Africa - 2015 Announced Greenfields FDI into Africa - 2015
21 | What influences foreign direct investment into Africa
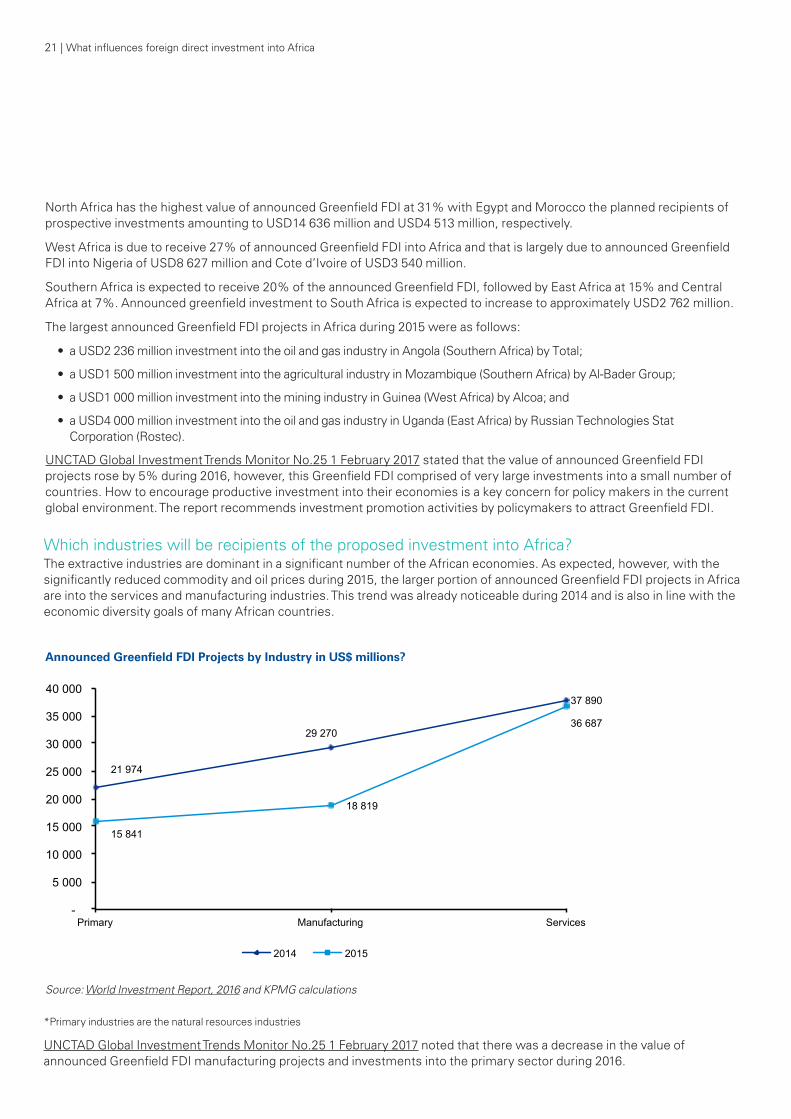
Which industries will be recipients of the proposed investment into Africa?The extractive industries are dominant in a significant number of the African economies. As expected, however, with the significantly reduced commodity and oil prices during 2015, the larger portion of announced Greenfield FDI projects in Africa are into the services and manufacturing industries. This trend was already noticeable during 2014 and is also in line with the economic diversity goals of many African countries.
North Africa has the highest value of announced Greenfield FDI at 31% with Egypt and Morocco the planned recipients of prospective investments amounting to USD14 636 million and USD4 513 million, respectively.
West Africa is due to receive 27% of announced Greenfield FDI into Africa and that is largely due to announced Greenfield FDI into Nigeria of USD8 627 million and Cote d’Ivoire of USD3 540 million.
Southern Africa is expected to receive 20% of the announced Greenfield FDI, followed by East Africa at 15% and Central Africa at 7%. Announced greenfield investment to South Africa is expected to increase to approximately USD2 762 million.
The largest announced Greenfield FDI projects in Africa during 2015 were as follows:
• a USD2 236 million investment into the oil and gas industry in Angola (Southern Africa) by Total;
• a USD1 500 million investment into the agricultural industry in Mozambique (Southern Africa) by Al-Bader Group;
• a USD1 000 million investment into the mining industry in Guinea (West Africa) by Alcoa; and
• a USD4 000 million investment into the oil and gas industry in Uganda (East Africa) by Russian Technologies Stat Corporation (Rostec).
UNCTAD Global Investment Trends Monitor No.25 1 February 2017 stated that the value of announced Greenfield FDI projects rose by 5% during 2016, however, this Greenfield FDI comprised of very large investments into a small number of countries. How to encourage productive investment into their economies is a key concern for policy makers in the current global environment. The report recommends investment promotion activities by policymakers to attract Greenfield FDI.
Source: World Investment Report, 2016 and KPMG calculations
*Primary industries are the natural resources industries
UNCTAD Global Investment Trends Monitor No.25 1 February 2017 noted that there was a decrease in the value of announced Greenfield FDI manufacturing projects and investments into the primary sector during 2016.
21 974
29 270
37 890
15 841
18 819
36 687
-
5 000
10 000
15 000
20 000
25 000
30 000
35 000
40 000
Primary Manufacturing Services
Uni
ts
Announced Greenfield FDI Projects by Industry
2014 2015
Announced Greenfield FDI Projects by Industry in US$ millions?
What influences foreign direct investment into Africa | 22
23 | What influences foreign direct investment into Africa
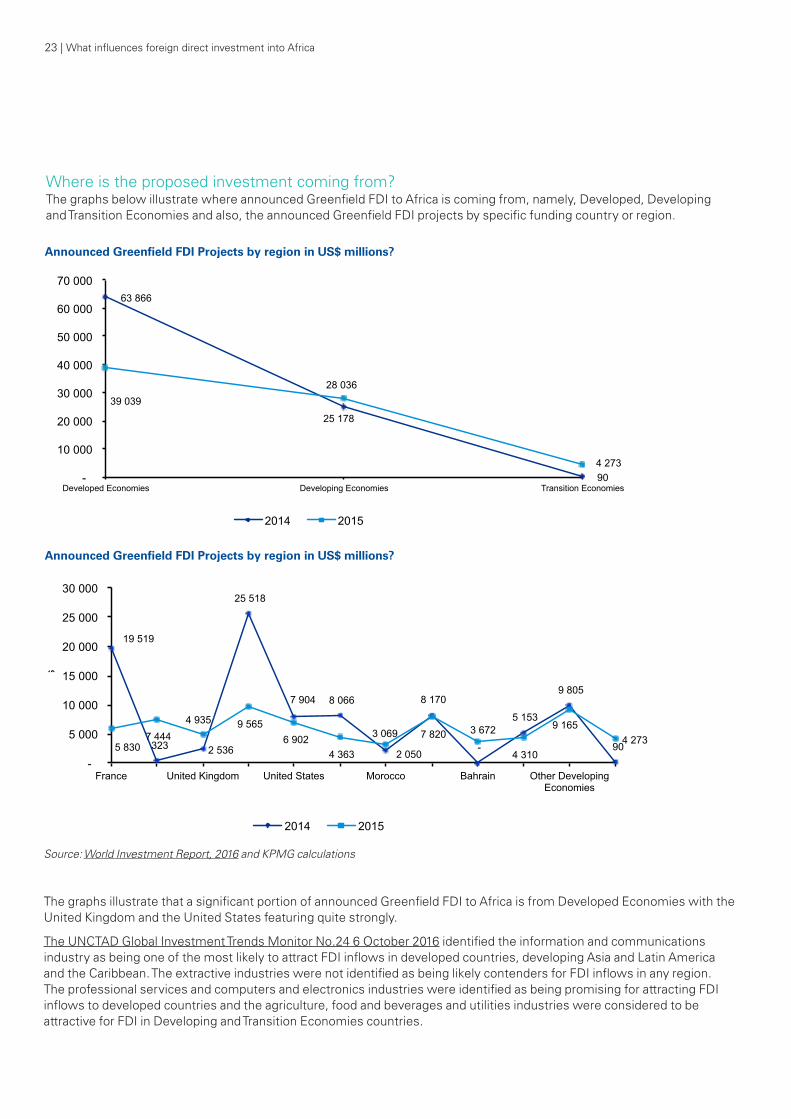
Where is the proposed investment coming from?The graphs below illustrate where announced Greenfield FDI to Africa is coming from, namely, Developed, Developing and Transition Economies and also, the announced Greenfield FDI projects by specific funding country or region.
Source: World Investment Report, 2016 and KPMG calculations
The graphs illustrate that a significant portion of announced Greenfield FDI to Africa is from Developed Economies with the United Kingdom and the United States featuring quite strongly.
The UNCTAD Global Investment Trends Monitor No.24 6 October 2016 identified the information and communications industry as being one of the most likely to attract FDI inflows in developed countries, developing Asia and Latin America and the Caribbean. The extractive industries were not identified as being likely contenders for FDI inflows in any region. The professional services and computers and electronics industries were identified as being promising for attracting FDI inflows to developed countries and the agriculture, food and beverages and utilities industries were considered to be attractive for FDI in Developing and Transition Economies countries.
63 866
25 178
90
39 039 28 036
4 273 -
10 000
20 000
30 000
40 000
50 000
60 000
70 000
Developed Economies Developing Economies Transition Economies
Uni
ts
Announced Greenfield FDI Projects by Region
2014 2015
19 519
323 2 536
25 518
7 904 8 066
2 050
8 170
-
5 153
9 805
90 5 830 7 444
4 935 9 565 6 902
4 363
3 069 7 820 3 672
4 310
9 165 4 273
-
5 000
10 000
15 000
20 000
25 000
30 000
France United Kingdom United States Morocco Bahrain Other Developing Economies
Uni
ts
Announced Greenfield FDI Projects by Region
2014 2015
Announced Greenfield FDI Projects by region in US$ millions?
Announced Greenfield FDI Projects by region in US$ millions?
What influences foreign direct investment into Africa | 24
This, together with the as yet unknown impact of both Brexit and the Trump administration may impact further on FDI inflows to Africa going forward.
An article entitled 10 economic consequences of Donald Trump’s election win published on 28 November 2016 by The Guardian and written by Anatole Kaletsky, chief economist and co-chair of Gavekal Dragonomics, cited the following 10 economic consequences of the Trump presidency. The article was well balanced and presented a mixture of good and bad consequences, as follows:
• US growth is anticipated to grow above the 2.2% annual average rate achieved during Barack Obama’s second term. This increase is expected to be as a result of increased public spending and more relaxed debt limits by the Republican Party. It is anticipated that Trump will implement the Keynesian fiscal stimulus, defined generally as debt-financed consumer-oriented tax cuts and substantial increases in government spending to increase aggregate demand which should ideally lead to increased economic output, jobs and incomes. The effect will be that growth and inflation will both increase;
• The Republicans’ will introduce tax reforms, such as amnesty for multinational companies that repatriate foreign profits, which will be financed largely by higher public borrowing. These tax reforms will have the effect of creating bigger budget deficits while stimulating more growth and inflation;
• Deregulation of the American banks, thereby enabling them to loosen lending standards, particularly for middle-income households, will also result in increased growth in the US;
• Trump will increase geopolitical stability by potentially stabilising relations with the Russian and Chinese administrations;
• Trump’s election may force American’s to re-energise efforts to reform the US Electoral College process. To date, the necessary legislation has already been passed in states representing 61% of the required votes. Opposition to Trump in certain key states could encourage voters to elect legislature to counteract federal conservatism with progressive state laws on issues such as air quality, related to global warming considerations, healthcare and abortion, treatment of migrants and gun control;
• US global leadership is expected to move away from free trade, globalisation and open markets which will have negative consequences for emerging economies and multinational companies, whose business strategies and development models have assumed free trade and open capital flows;
• Inflation and long-term interest rates are expected to increase, possibly dramatically, due to large tax cuts, increased public spending as well as potential additional trade protectionism and measures to remove immigrant workers;
• Increased growth and long-term interest rates are likely to lead to strengthening of the dollar which will be bad news for Emerging Markets governments and companies which have accumulated dollar based debts due to the near-zero interest rates offered by the US; and
• Trump’s presidential victory could potentially increase the instance of populist upheavals in Europe which could trigger another Euro crisis and further threaten the stability of the European Union.
An article on African Renewal issue August to November 2016, entitled Africa after Brexit and written by Amelia Tan, based in New York, noted the following potential impact on African economies of Brexit:
• Trade and investment in Africa will be the area most affected by Brexit. Most of the trade arrangements the UK has with African countries were negotiated through the EU. These agreements will cease to apply and/or will have to be renegotiated with the UK when Brexit eventually takes place, a process that will take two years from the time the UK officially informs the EU of its intention to pull out. This could result in complications for countries exporting to the UK during the negotiation period;
• If the UK economy goes into recession subsequent to Brexit, it will negatively impact growth in South Africa, Nigeria and Kenya, the UK’s largest African markets and may result in reduced aid to countries such as Ethiopia and Sierra Leone; and
• Brexit may reduce development aid to Africa if the UK stops contributing to the European Development Fund.
25 | What influences foreign direct investment into Africa
What influences foreign direct investment into Africa | 26
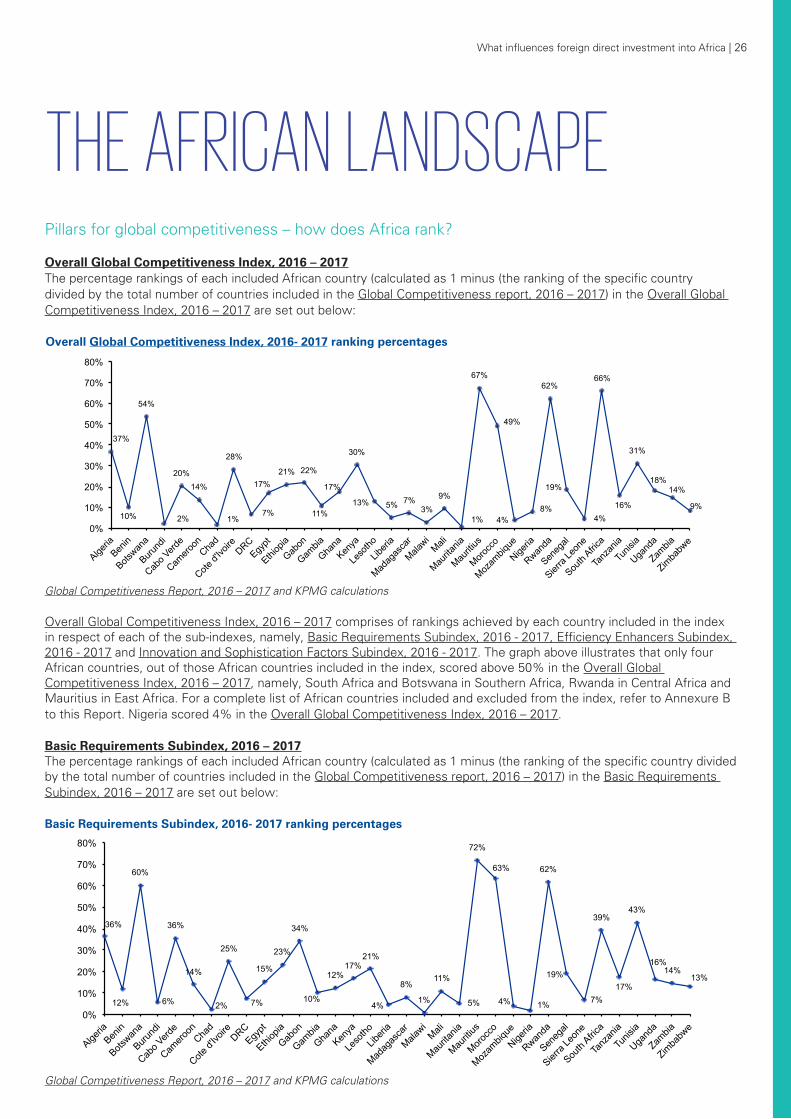
Pillars for global competitiveness – how does Africa rank? Overall Global Competitiveness Index, 2016 – 2017The percentage rankings of each included African country (calculated as 1 minus (the ranking of the specific country divided by the total number of countries included in the Global Competitiveness report, 2016 – 2017) in the Overall Global Competitiveness Index, 2016 – 2017 are set out below:
THE AFRICAN LANDSCAPE
Global Competitiveness Report, 2016 – 2017 and KPMG calculations
Overall Global Competitiveness Index, 2016 – 2017 comprises of rankings achieved by each country included in the index in respect of each of the sub-indexes, namely, Basic Requirements Subindex, 2016 - 2017, Efficiency Enhancers Subindex, 2016 - 2017 and Innovation and Sophistication Factors Subindex, 2016 - 2017. The graph above illustrates that only four African countries, out of those African countries included in the index, scored above 50% in the Overall Global Competitiveness Index, 2016 – 2017, namely, South Africa and Botswana in Southern Africa, Rwanda in Central Africa and Mauritius in East Africa. For a complete list of African countries included and excluded from the index, refer to Annexure B to this Report. Nigeria scored 4% in the Overall Global Competitiveness Index, 2016 – 2017.
Basic Requirements Subindex, 2016 – 2017The percentage rankings of each included African country (calculated as 1 minus (the ranking of the specific country divided by the total number of countries included in the Global Competitiveness report, 2016 – 2017) in the Basic Requirements Subindex, 2016 – 2017 are set out below:
Global Competitiveness Report, 2016 – 2017 and KPMG calculations
37%
10%
54%
2%
20% 14%
1%
28%
7%
17% 21% 22%
11%
17%
30%
13% 5% 7% 3%
9%
1%
67%
49%
4% 8%
62%
19%
4%
66%
16%
31%
18% 14%
9%
0%
10%
20%
30%
40%
50%
60%
70%
80%
Algeria
Benin
Botswan
a
Burund
i
Cabo V
erde
Camero
on
Chad
Cote d'
Ivoire
DRC
Egypt
Ethiop
ia
Gabon
Gambia
Ghana
Kenya
Leso
tho
Liberi
a
Madag
asca
r
Malawi
Mali
Maurita
nia
Mauriti
us
Morocc
o
Mozam
bique
Nigeria
Rwanda
Seneg
al
Sierra
Leon
e
South
Africa
Tanz
ania
Tunis
ia
Ugand
a
Zambia
Zimba
bwe
Uni
ts
Overall Global Competitiveness Index - 2016 - 2017 Rank %
36%
12%
60%
6%
36%
14%
2%
25%
7%
15%
23%
34%
10%
12% 17%
21%
4%
8%
1%
11%
5%
72%
63%
4% 1%
62%
19%
7%
39%
17%
43%
16% 14%
13%
0%
10%
20%
30%
40%
50%
60%
70%
80%
Algeria
Benin
Botswan
a
Burund
i
Cabo V
erde
Camero
on
Chad
Cote d'
Ivoire
DRC
Egypt
Ethiop
ia
Gabon
Gambia
Ghana
Kenya
Leso
tho
Liberi
a
Madag
asca
r
Malawi
Mali
Maurita
nia
Mauriti
us
Morocc
o
Mozam
bique
Nigeria
Rwanda
Seneg
al
Sierra
Leon
e
South
Africa
Tanz
ania
Tunis
ia
Ugand
a
Zambia
Zimba
bwe
Uni
ts
Basic Requirements - 2016 - 2017 Rank %
Overall Global Competitiveness Index, 2016- 2017 ranking percentages
Basic Requirements Subindex, 2016- 2017 ranking percentages
27 | What influences foreign direct investment into Africa
The Basic Requirements Subindex, 2016 – 2017, which has a weighting of 20 – 60% in the Global Competitiveness Index, 2016 – 2017, comprises of the following four pillars:
• Pillar 1: Institutions, which has a weighting of 25% of the Basic Requirements Subindex, 2016 – 2017 and which comprises of both public and private institutions and includes the following elements:
- Public institutions, which has a weighting of 75% of the Institutions element: Property rights (property rights and intellectual property protection); Ethics and corruption (diversion of public funds, public trust in politicians and irregular payments and bribes); Undue influence (judicial independence and favouritism in decisions of government officials); Public-sector performance (wastefulness of government spending, burden of government regulation, efficiency of legal framework in settling disputes, efficiency of legal framework in challenging regulations and transparency of government policymaking) and Security (business costs of terrorism, business costs of crime and violence, organised crime and reliability of police services);
- Private institutions which has a weighting of 25% of the Institutions element: Corporate ethics (ethical behaviour of firms) and Accountability (strength of auditing and reporting standards, efficiency of corporate boards, protection of minority shareholders’ interests and strength of investor protection).
• Pillar 2: Infrastructure, which has a weighting of 25% of the Basic Requirements Subindex, 2016 – 2017 and which comprises of Transport infrastructure and Electricity and telephony infrastructure and includes the following elements:
- Transport infrastructure, which has a weighting of 50% of the Infrastructure element: Quality of overall infrastructure, Quality of roads, Quality of railroad infrastructure, Quality of port infrastructure, Quality of air transport infrastructure and Available airline seat kilometers;
- Electricity and telephony infrastructure, which has a weighting of 50% of the Infrastructure element: Quality of electricity supply, Mobile telephone subscriptions and Fixed telephone lines.
• Pillar 3: Macroeconomic environment, which has a weighting of 25% of the Basic Requirements Subindex, 2016 – 2017 and which comprise of the following elements: Government budget balance, Gross national savings, Inflation, Government debt and Country credit rating;
• Pillar 4: Health and primary education which has a weighting of 25% of the Basic Requirements Subindex, 2016 – 2017 and which comprises of Health and Primary education and includes the following elements:
- Health, which has a weighting of 50% of the Health and Primary education element: Business impact of malaria, Malaria incidence, Business impact of tuberculosis, Tuberculosis incidence, Business impact of HIV/AIDS, HIV prevalence, Infant mortality and Life expectancy;
- Primary education, which has a weighting of 50% of the Health and Primary education element: Quality of Primary education and Primary education enrolment rate.
In the Basic Requirements Subindex, 2016 – 2017, Africa does not shine particularly brightly, with only four countries scoring rankings in excess of 50%, namely, Mauritius at 72%, Morocco at 63%, Rwanda at 62% and Botswana at 60%. South Africa scored 39% and Nigeria a mere 1%.
What influences foreign direct investment into Africa | 28
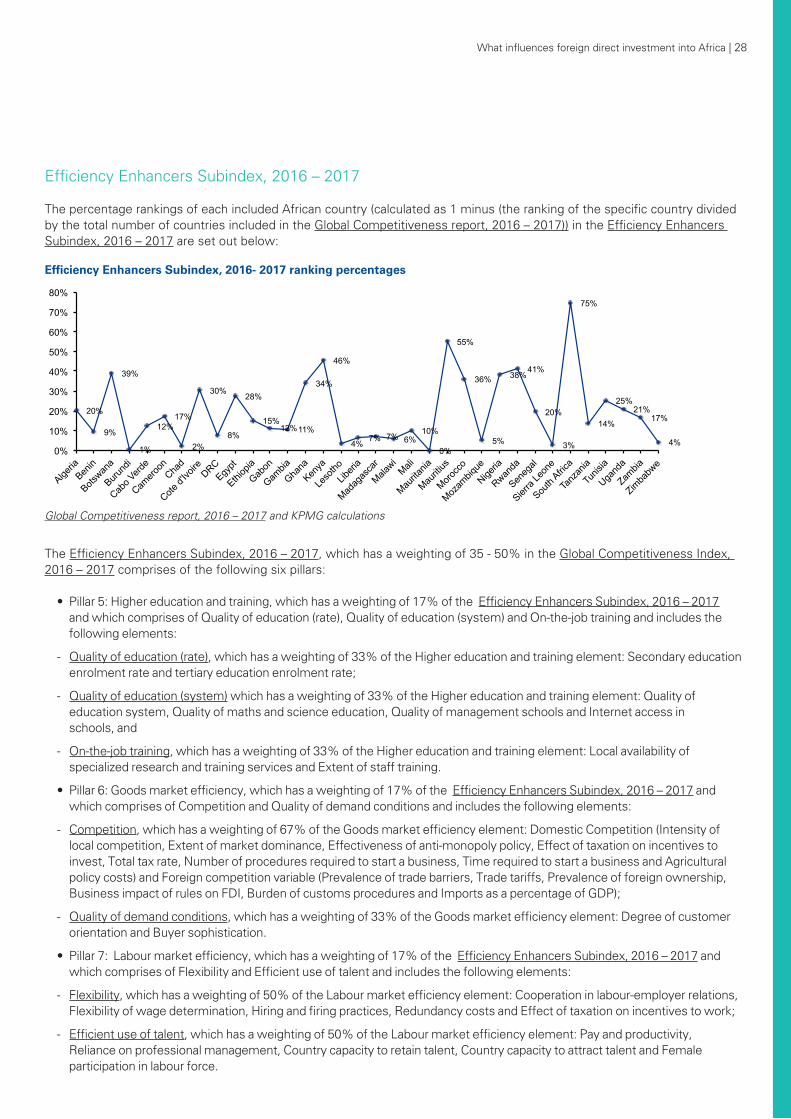
Efficiency Enhancers Subindex, 2016 – 2017 The percentage rankings of each included African country (calculated as 1 minus (the ranking of the specific country divided by the total number of countries included in the Global Competitiveness report, 2016 – 2017)) in the Efficiency Enhancers Subindex, 2016 – 2017 are set out below:
The Efficiency Enhancers Subindex, 2016 – 2017, which has a weighting of 35 - 50% in the Global Competitiveness Index, 2016 – 2017 comprises of the following six pillars:
• Pillar 5: Higher education and training, which has a weighting of 17% of the Efficiency Enhancers Subindex, 2016 – 2017 and which comprises of Quality of education (rate), Quality of education (system) and On-the-job training and includes the following elements:
- Quality of education (rate), which has a weighting of 33% of the Higher education and training element: Secondary education enrolment rate and tertiary education enrolment rate;
- Quality of education (system) which has a weighting of 33% of the Higher education and training element: Quality of education system, Quality of maths and science education, Quality of management schools and Internet access in schools, and
- On-the-job training, which has a weighting of 33% of the Higher education and training element: Local availability of specialized research and training services and Extent of staff training.
• Pillar 6: Goods market efficiency, which has a weighting of 17% of the Efficiency Enhancers Subindex, 2016 – 2017 and which comprises of Competition and Quality of demand conditions and includes the following elements:
- Competition, which has a weighting of 67% of the Goods market efficiency element: Domestic Competition (Intensity of local competition, Extent of market dominance, Effectiveness of anti-monopoly policy, Effect of taxation on incentives to invest, Total tax rate, Number of procedures required to start a business, Time required to start a business and Agricultural policy costs) and Foreign competition variable (Prevalence of trade barriers, Trade tariffs, Prevalence of foreign ownership, Business impact of rules on FDI, Burden of customs procedures and Imports as a percentage of GDP);
- Quality of demand conditions, which has a weighting of 33% of the Goods market efficiency element: Degree of customer orientation and Buyer sophistication.
• Pillar 7: Labour market efficiency, which has a weighting of 17% of the Efficiency Enhancers Subindex, 2016 – 2017 and which comprises of Flexibility and Efficient use of talent and includes the following elements:
- Flexibility, which has a weighting of 50% of the Labour market efficiency element: Cooperation in labour-employer relations, Flexibility of wage determination, Hiring and firing practices, Redundancy costs and Effect of taxation on incentives to work;
- Efficient use of talent, which has a weighting of 50% of the Labour market efficiency element: Pay and productivity, Reliance on professional management, Country capacity to retain talent, Country capacity to attract talent and Female participation in labour force.
Global Competitiveness report, 2016 – 2017 and KPMG calculations
20%
9%
39%
1%
12% 17%
2%
30%
8%
28%
15% 12% 11%
34%
46%
4% 7% 7% 6%
10%
0%
55%
36%
5%
38% 41%
20%
3%
75%
14%
25% 21%
17%
4% 0%
10%
20%
30%
40%
50%
60%
70%
80%
Algeria
Benin
Botswan
a
Burund
i
Cabo V
erde
Camero
on
Chad
Cote d'
Ivoire
DRC
Egypt
Ethiop
ia
Gabon
Gambia
Ghana
Kenya
Leso
tho
Liberi
a
Madag
asca
r
Malawi
Mali
Maurita
nia
Mauriti
us
Morocc
o
Mozam
bique
Nigeria
Rwanda
Seneg
al
Sierra
Leon
e
South
Africa
Tanz
ania
Tunis
ia
Ugand
a
Zambia
Zimba
bwe
Uni
ts
Efficiency Enhancers - 2016 - 2017 Rank % Efficiency Enhancers Subindex, 2016- 2017 ranking percentages
29 | What influences foreign direct investment into Africa
• Pillar 8: Financial market development, which has a weighting of 17% of the Efficiency Enhancers Subindex, 2016 – 2017 and which comprises of Efficiency and Trustworthiness and confidence and includes the following elements:
- Efficiency, which has a weighting of 50% of the Financial market development element: Financial services meeting business needs, Affordability of financial services, Financing through local equity market, Ease of access to loans and Venture capital availability;
- Trustworthiness and confidence, which has a weighting of 50% of the Financial market development element: Soundness of banks, Regulation of securities exchanges and Legal rights index.
• Pillar 9: Technological readiness, which has a weighting of 17% of the Efficiency Enhancers Subindex, 2016 – 2017 and which comprises of Technological adoption and ICT use and includes the following elements:
- Technological adoption, which has a weighting of 50% of the Technological readiness element: Availability of latest technologies, Firm-level technology absorption and FDI and technology transfer;
- ICT use, which has a weighting of 50% of the Technological readiness element: Internet users, Broadband Internet subscriptions; Internet bandwidth, Mobile broadband subscriptions, Mobile telephone subscriptions and Fixed telephone lines.
• Pillar 10: Market size, which has a weighting of 17% of the Efficiency Enhancers Subindex, 2016 – 2017 and which comprises of Domestic market size and Foreign market size and includes the following elements:
- Domestic market size, which has a weighting of 75% of the Market size element: Domestic market size index;
- Foreign market size, which has a weighting of 25% of the Market size element: Foreign market size index. South Africa scored a high ranking of 75% in the Efficiency Enhancers Subindex, 2016 – 2017, followed by Mauritius at
55%, Kenya with 46%. Nigeria scored 38% and Egypt 28%.
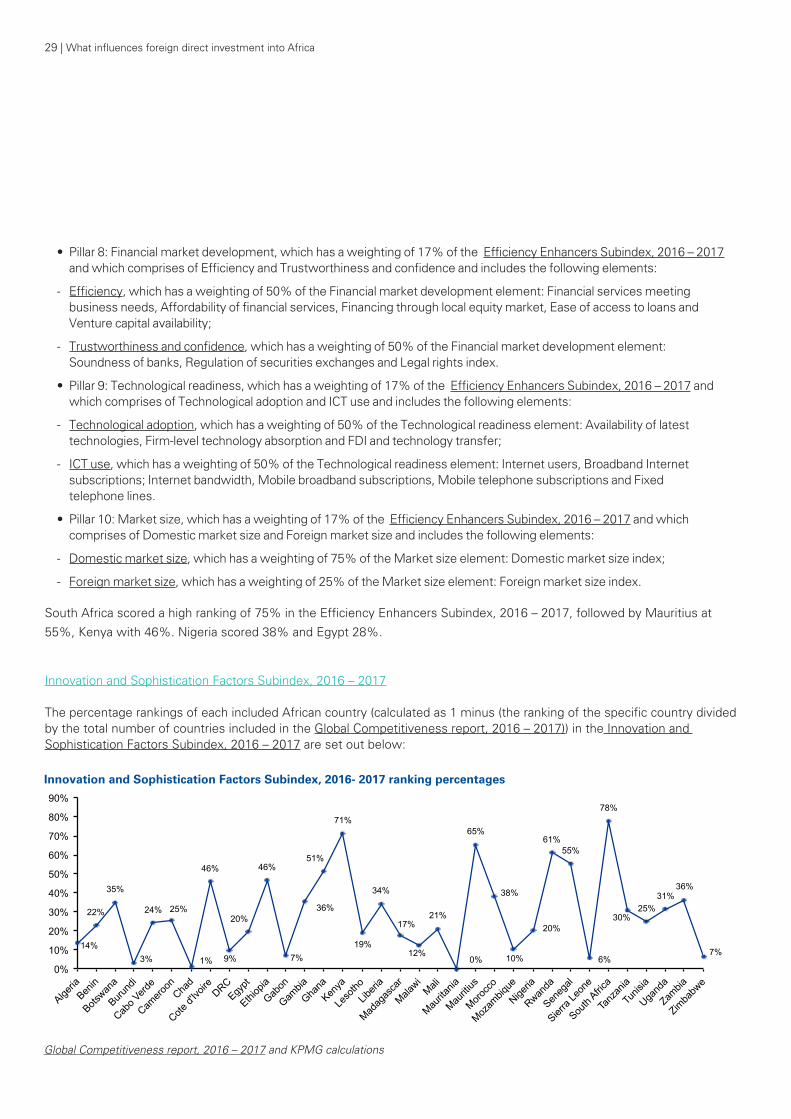
Innovation and Sophistication Factors Subindex, 2016 – 2017 The percentage rankings of each included African country (calculated as 1 minus (the ranking of the specific country divided by the total number of countries included in the Global Competitiveness report, 2016 – 2017)) in the Innovation and Sophistication Factors Subindex, 2016 – 2017 are set out below:
Global Competitiveness report, 2016 – 2017 and KPMG calculations
14%
22%
35%
3%
24% 25%
1%
46%
9%
20%
46%
7%
36%
51%
71%
19%
34%
17%
12%
21%
0%
65%
38%
10%
20%
61% 55%
6%
78%
30% 25%
31% 36%
7%
0%
10%
20%
30%
40%
50%
60%
70%
80%
90%
Algeria
Benin
Botswan
a
Burund
i
Cabo V
erde
Camero
on
Chad
Cote d'
Ivoire
DRC
Egypt
Ethiop
ia
Gabon
Gambia
Ghana
Kenya
Leso
tho
Liberi
a
Madag
asca
r
Malawi
Mali
Maurita
nia
Mauriti
us
Morocc
o
Mozam
bique
Nigeria
Rwanda
Seneg
al
Sierra
Leon
e
South
Africa
Tanz
ania
Tunis
ia
Ugand
a
Zambia
Zimba
bwe
Uni
ts
Innovation and Sophistication Factors - 2016 - 2017 Rank % Innovation and Sophistication Factors Subindex, 2016- 2017 ranking percentages
What influences foreign direct investment into Africa | 30
The Innovation and Sophistication Factors Subindex, 2016 – 2017, which has a weighting of 5 - 30% in the Global Competitiveness Index, 2016 – 2017 comprises of the following two pillars:
• Pillar 11: Business sophistication conditions, which has a weighting of 50% of the Innovation and Sophistication Factors Subindex, 2016 – 2017 and which comprises of Business sophistication and includes the following elements:
- Business sophistication: Local supplier quantity, Local supplier quality, State of cluster development, Nature of competitive advantage, Value chain breadth, Control of international distribution, Production process sophistication, Extent of marketing, Willingness to delegate authority and Reliance on professional management;
• Pillar 12: R&D Innovation, which has a weighting of 50% of the Innovation and Sophistication Factors Subindex, 2016 – 2017 and which comprises of R&D Innovation and includes the following elements:
- R&D Innovation: Capacity for innovation, Quality of scientific research institutions, Company spending of R&D, University-industry collaboration in R&D, company spending on R&D; Government procurement of advanced technology products, Availability of scientists and engineers, PCT patent application and Intellection property perception.
Africa’s ratings in respect of the Innovation and Sophistication Factors Subindex, 2016 – 2017 are better than for either the Basic Requirements Subindex, 2016 – 2017 or the Efficiency Enhancers Subindex, 2016 – 2017. Five African countries achieved ratings of over 50%, namely, Ghana with 51%, Kenya with 71%, Mauritius with 65%, Senegal with 55% and South Africa with 78%. Nigeria achieved a rating of 20%. Global Competitiveness report, 2016 – 2017 has identified the following five clear ways for measuring competitiveness of economies during the fourth industrial revolution. These five measures are as follows:
• Productivity remains a key driver of prosperity, in other words, prosperity can only increase if inputs of production are used in smarter and more efficient ways to fulfil constantly changing demands;
• Future orientation is central, which means that economies will need to be able to adapt to changes and respond to shocks quickly and relatively smoothly to be successful;
• Innovation is essential and all industries and societies in an economy will need to be more flexible, interconnected and open to new ideas and business models. Education is key to this measure as the education system needs to offer life-long learning opportunities and teach learners to think critically, collaborate with individuals of different backgrounds and expose them to different points of view and ideas. The financial sector needs to offer venture capital and new financing solutions for smaller and/or more risky projects and also leverage information and communications technologies;
• Information and communication technology infrastructure is imperative and countries need to transition to a digital economy in order to be competitive; and
• The world is more levelled than it used to be which means that, regardless of income levels, all pillars are equally important to all economies if they want to stay competitive.
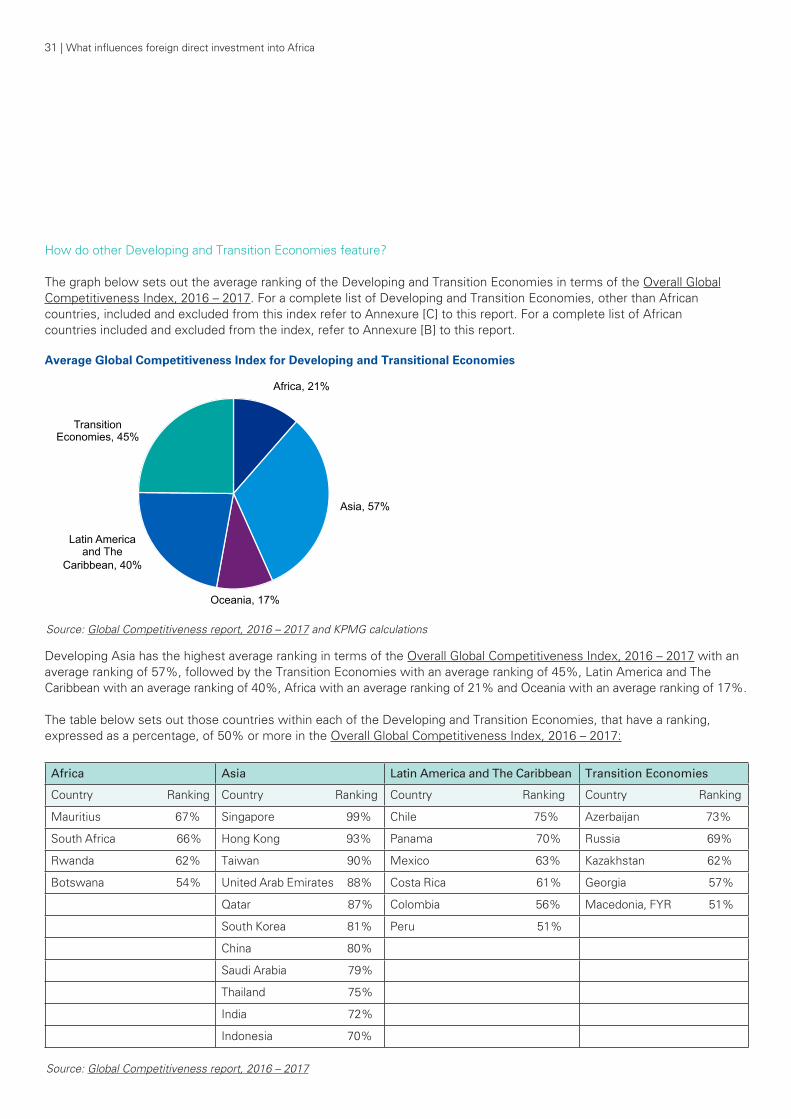
31 | What influences foreign direct investment into Africa
How do other Developing and Transition Economies feature? The graph below sets out the average ranking of the Developing and Transition Economies in terms of the Overall Global Competitiveness Index, 2016 – 2017. For a complete list of Developing and Transition Economies, other than African countries, included and excluded from this index refer to Annexure [C] to this report. For a complete list of African countries included and excluded from the index, refer to Annexure [B] to this report.
Source: Global Competitiveness report, 2016 – 2017 and KPMG calculations
Developing Asia has the highest average ranking in terms of the Overall Global Competitiveness Index, 2016 – 2017 with an average ranking of 57%, followed by the Transition Economies with an average ranking of 45%, Latin America and The Caribbean with an average ranking of 40%, Africa with an average ranking of 21% and Oceania with an average ranking of 17%. The table below sets out those countries within each of the Developing and Transition Economies, that have a ranking, expressed as a percentage, of 50% or more in the Overall Global Competitiveness Index, 2016 – 2017:
Source: Global Competitiveness report, 2016 – 2017
Africa Asia Latin America and The Caribbean Transition Economies
Country Ranking Country Ranking Country Ranking Country Ranking
Mauritius 67% Singapore 99% Chile 75% Azerbaijan 73%
South Africa 66% Hong Kong 93% Panama 70% Russia 69%
Rwanda 62% Taiwan 90% Mexico 63% Kazakhstan 62%
Botswana 54% United Arab Emirates 88% Costa Rica 61% Georgia 57%
Qatar 87% Colombia 56% Macedonia, FYR 51%
South Korea 81% Peru 51%
China 80%
Saudi Arabia 79%
Thailand 75%
India 72%
Indonesia 70%
Africa, 21%
Asia, 57%
Oceania, 17%
Latin America and The
Caribbean, 40%
Transition Economies, 45%
Average GCI for Developing and Transitional Economies
Average Global Competitiveness Index for Developing and Transitional Economies
What does this mean? Africa does not rank well in the Global Competitiveness report, 2016 – 2017. This needs to be addressed if Africa wishes to be competitive in light of fourth industrial revolution and the economic realities that it will bring. The Sub-Saharan African economies are generally amongst the least competitive in the world in terms of the Global Competitiveness report, 2016 – 2017 due to declining prices and demand for oil and gas and certain commodities, drought, political uncertainty due to elections, and, in certain countries, health and security issues. These factors have put pressure on public funds needed for investment in infrastructure and education and also on foreign investment into Sub-Saharan Africa for 2015 and 2016. Sub-Saharan Africa must focus on improving infrastructure, technological readiness and health and primary education in order to create more job opportunities for its burgeoning young population. North Africa needs to focus on innovation, technological readiness and health and primary education as well as diversification away from the energy sector in order to reduce unemployment and meet the populations demand for higher living standards and economic opportunities.
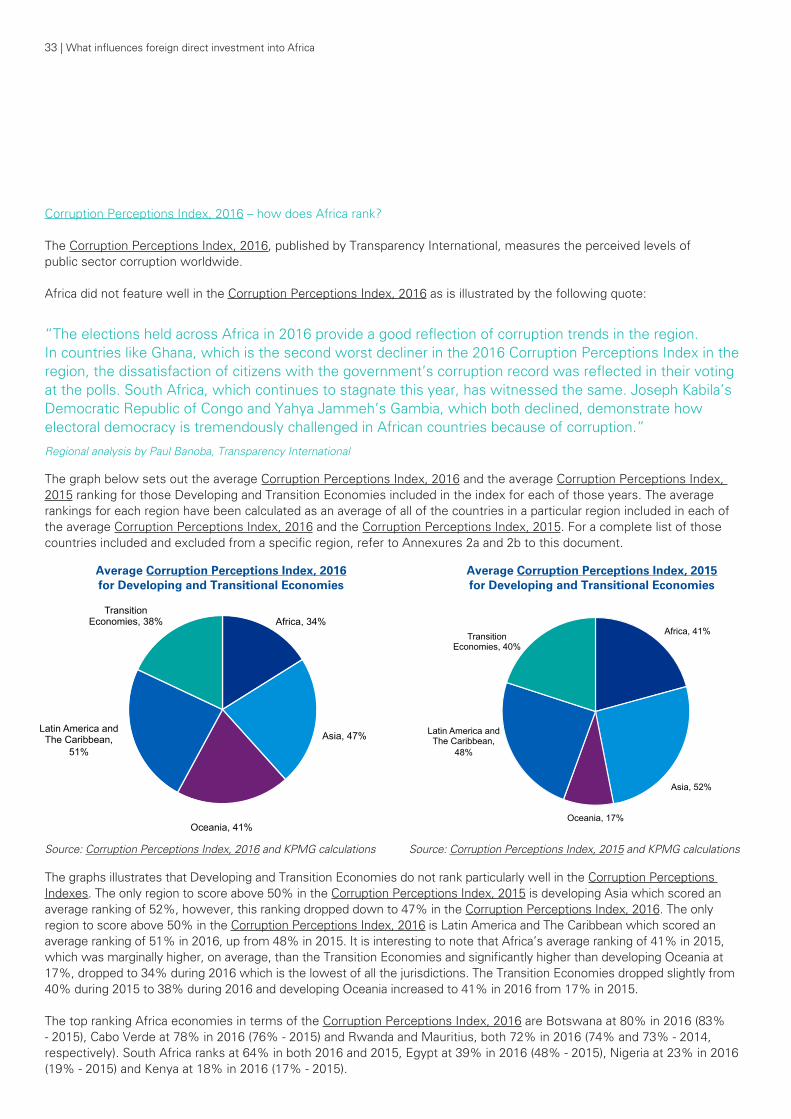
33 | What influences foreign direct investment into Africa
Corruption Perceptions Index, 2016 – how does Africa rank? The Corruption Perceptions Index, 2016, published by Transparency International, measures the perceived levels of public sector corruption worldwide. Africa did not feature well in the Corruption Perceptions Index, 2016 as is illustrated by the following quote:
“The elections held across Africa in 2016 provide a good reflection of corruption trends in the region.In countries like Ghana, which is the second worst decliner in the 2016 Corruption Perceptions Index in the region, the dissatisfaction of citizens with the government’s corruption record was reflected in their voting at the polls. South Africa, which continues to stagnate this year, has witnessed the same. Joseph Kabila’s Democratic Republic of Congo and Yahya Jammeh’s Gambia, which both declined, demonstrate how electoral democracy is tremendously challenged in African countries because of corruption.”
The graph below sets out the average Corruption Perceptions Index, 2016 and the average Corruption Perceptions Index, 2015 ranking for those Developing and Transition Economies included in the index for each of those years. The average rankings for each region have been calculated as an average of all of the countries in a particular region included in each of the average Corruption Perceptions Index, 2016 and the Corruption Perceptions Index, 2015. For a complete list of those countries included and excluded from a specific region, refer to Annexures 2a and 2b to this document.
Source: Corruption Perceptions Index, 2016 and KPMG calculations
The graphs illustrates that Developing and Transition Economies do not rank particularly well in the Corruption Perceptions Indexes. The only region to score above 50% in the Corruption Perceptions Index, 2015 is developing Asia which scored an average ranking of 52%, however, this ranking dropped down to 47% in the Corruption Perceptions Index, 2016. The only region to score above 50% in the Corruption Perceptions Index, 2016 is Latin America and The Caribbean which scored an average ranking of 51% in 2016, up from 48% in 2015. It is interesting to note that Africa’s average ranking of 41% in 2015, which was marginally higher, on average, than the Transition Economies and significantly higher than developing Oceania at 17%, dropped to 34% during 2016 which is the lowest of all the jurisdictions. The Transition Economies dropped slightly from 40% during 2015 to 38% during 2016 and developing Oceania increased to 41% in 2016 from 17% in 2015. The top ranking Africa economies in terms of the Corruption Perceptions Index, 2016 are Botswana at 80% in 2016 (83% - 2015), Cabo Verde at 78% in 2016 (76% - 2015) and Rwanda and Mauritius, both 72% in 2016 (74% and 73% - 2014, respectively). South Africa ranks at 64% in both 2016 and 2015, Egypt at 39% in 2016 (48% - 2015), Nigeria at 23% in 2016 (19% - 2015) and Kenya at 18% in 2016 (17% - 2015).
Regional analysis by Paul Banoba, Transparency International
Source: Corruption Perceptions Index, 2015 and KPMG calculations
Africa, 41%
Asia, 52%
Oceania, 17%
Latin America and The Caribbean,
48%
Transition Economies, 40%
Average CPI for Developing and Transitional Economies
Africa, 34%
Asia, 47%
Oceania, 41%
Latin America and The Caribbean,
51%
Transition Economies, 38%
Average CPI for Developing and Transitional Economies Average Corruption Perceptions Index, 2016 for Developing and Transitional Economies
Average Corruption Perceptions Index, 2015 for Developing and Transitional Economies
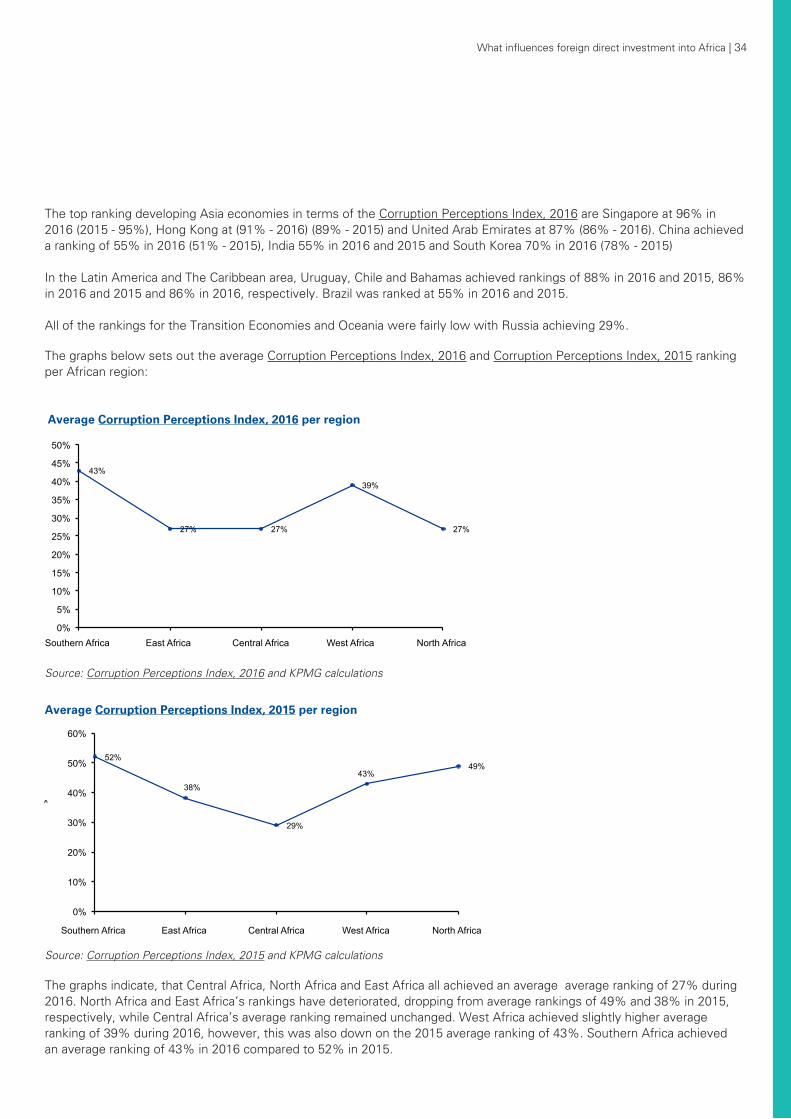
What influences foreign direct investment into Africa | 34
The top ranking developing Asia economies in terms of the Corruption Perceptions Index, 2016 are Singapore at 96% in 2016 (2015 - 95%), Hong Kong at (91% - 2016) (89% - 2015) and United Arab Emirates at 87% (86% - 2016). China achieved a ranking of 55% in 2016 (51% - 2015), India 55% in 2016 and 2015 and South Korea 70% in 2016 (78% - 2015) In the Latin America and The Caribbean area, Uruguay, Chile and Bahamas achieved rankings of 88% in 2016 and 2015, 86% in 2016 and 2015 and 86% in 2016, respectively. Brazil was ranked at 55% in 2016 and 2015. All of the rankings for the Transition Economies and Oceania were fairly low with Russia achieving 29%.
The graphs indicate, that Central Africa, North Africa and East Africa all achieved an average average ranking of 27% during 2016. North Africa and East Africa’s rankings have deteriorated, dropping from average rankings of 49% and 38% in 2015, respectively, while Central Africa’s average ranking remained unchanged. West Africa achieved slightly higher average ranking of 39% during 2016, however, this was also down on the 2015 average ranking of 43%. Southern Africa achieved an average ranking of 43% in 2016 compared to 52% in 2015.
Source: Corruption Perceptions Index, 2016 and KPMG calculations
The graphs below sets out the average Corruption Perceptions Index, 2016 and Corruption Perceptions Index, 2015 ranking per African region:
Source: Corruption Perceptions Index, 2015 and KPMG calculations
52%
38%
29%
43% 49%
0%
10%
20%
30%
40%
50%
60%
Southern Africa East Africa Central Africa West Africa North Africa
Uni
ts
Average CPI per region Average Corruption Perceptions Index, 2015 per region
Average Corruption Perceptions Index, 2016 per region
43%
27% 27%
39%
27%
0%
5%
10%
15%
20%
25%
30%
35%
40%
45%
50%
Southern Africa East Africa Central Africa West Africa North Africa
Uni
ts
Average CPI per region
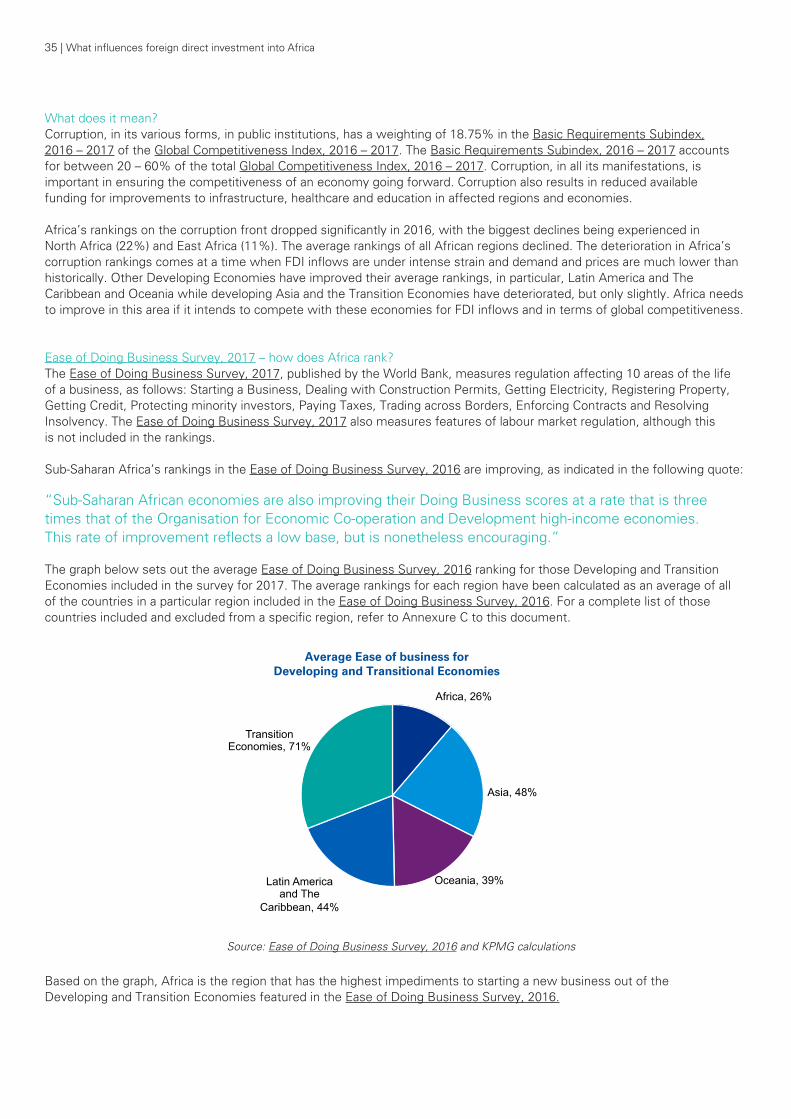
35 | What influences foreign direct investment into Africa
“Sub-Saharan African economies are also improving their Doing Business scores at a rate that is three times that of the Organisation for Economic Co-operation and Development high-income economies. This rate of improvement reflects a low base, but is nonetheless encouraging.”
The graph below sets out the average Ease of Doing Business Survey, 2016 ranking for those Developing and Transition Economies included in the survey for 2017. The average rankings for each region have been calculated as an average of all of the countries in a particular region included in the Ease of Doing Business Survey, 2016. For a complete list of those countries included and excluded from a specific region, refer to Annexure C to this document.
Source: Ease of Doing Business Survey, 2016 and KPMG calculations
Based on the graph, Africa is the region that has the highest impediments to starting a new business out of the Developing and Transition Economies featured in the Ease of Doing Business Survey, 2016.
Africa, 26%
Asia, 48%
Oceania, 39% Latin America and The
Caribbean, 44%
Transition Economies, 71%
Average Ease of business for Developing and Transitional Economies
What does it mean?Corruption, in its various forms, in public institutions, has a weighting of 18.75% in the Basic Requirements Subindex, 2016 – 2017 of the Global Competitiveness Index, 2016 – 2017. The Basic Requirements Subindex, 2016 – 2017 accounts for between 20 – 60% of the total Global Competitiveness Index, 2016 – 2017. Corruption, in all its manifestations, is important in ensuring the competitiveness of an economy going forward. Corruption also results in reduced available funding for improvements to infrastructure, healthcare and education in affected regions and economies.
Africa’s rankings on the corruption front dropped significantly in 2016, with the biggest declines being experienced in North Africa (22%) and East Africa (11%). The average rankings of all African regions declined. The deterioration in Africa’s corruption rankings comes at a time when FDI inflows are under intense strain and demand and prices are much lower than historically. Other Developing Economies have improved their average rankings, in particular, Latin America and The Caribbean and Oceania while developing Asia and the Transition Economies have deteriorated, but only slightly. Africa needs to improve in this area if it intends to compete with these economies for FDI inflows and in terms of global competitiveness.
Ease of Doing Business Survey, 2017 – how does Africa rank?The Ease of Doing Business Survey, 2017, published by the World Bank, measures regulation affecting 10 areas of the life of a business, as follows: Starting a Business, Dealing with Construction Permits, Getting Electricity, Registering Property, Getting Credit, Protecting minority investors, Paying Taxes, Trading across Borders, Enforcing Contracts and Resolving Insolvency. The Ease of Doing Business Survey, 2017 also measures features of labour market regulation, although this is not included in the rankings. Sub-Saharan Africa’s rankings in the Ease of Doing Business Survey, 2016 are improving, as indicated in the following quote:
Average Ease of business for Developing and Transitional Economies
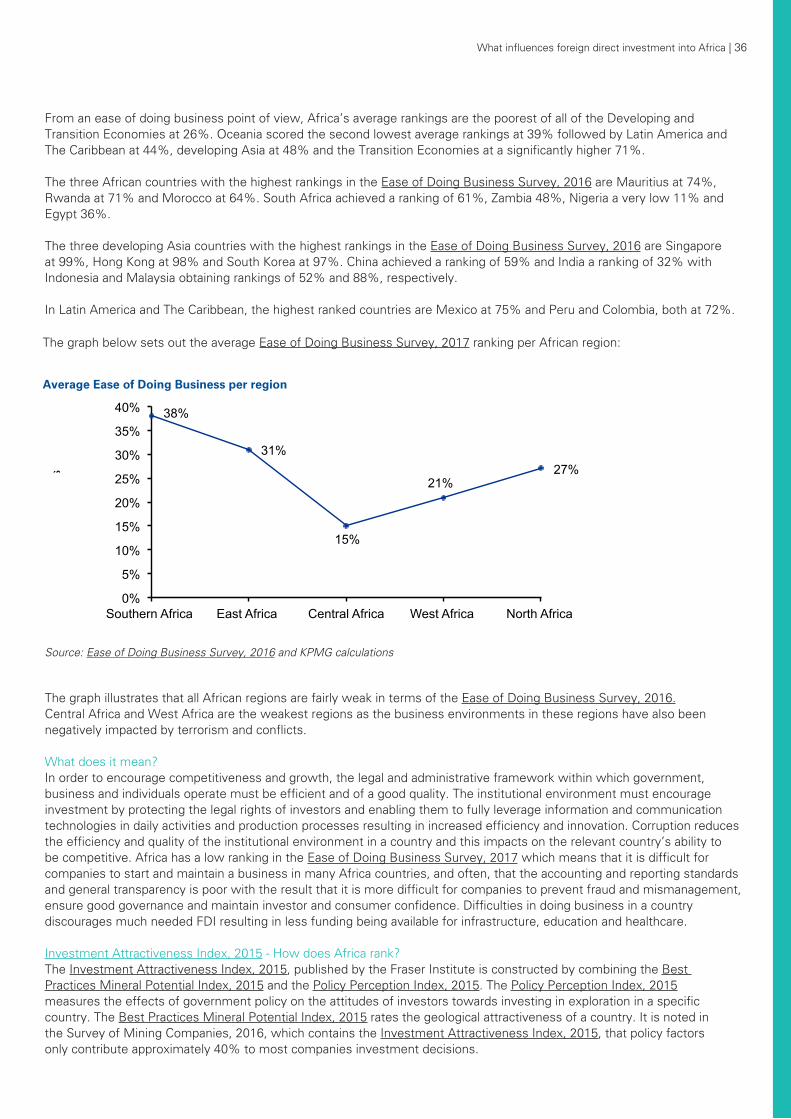
What influences foreign direct investment into Africa | 36
The graph below sets out the average Ease of Doing Business Survey, 2017 ranking per African region:
Source: Ease of Doing Business Survey, 2016 and KPMG calculations
The graph illustrates that all African regions are fairly weak in terms of the Ease of Doing Business Survey, 2016. Central Africa and West Africa are the weakest regions as the business environments in these regions have also been negatively impacted by terrorism and conflicts. What does it mean?In order to encourage competitiveness and growth, the legal and administrative framework within which government, business and individuals operate must be efficient and of a good quality. The institutional environment must encourage investment by protecting the legal rights of investors and enabling them to fully leverage information and communication technologies in daily activities and production processes resulting in increased efficiency and innovation. Corruption reduces the efficiency and quality of the institutional environment in a country and this impacts on the relevant country’s ability to be competitive. Africa has a low ranking in the Ease of Doing Business Survey, 2017 which means that it is difficult for companies to start and maintain a business in many Africa countries, and often, that the accounting and reporting standards and general transparency is poor with the result that it is more difficult for companies to prevent fraud and mismanagement, ensure good governance and maintain investor and consumer confidence. Difficulties in doing business in a country discourages much needed FDI resulting in less funding being available for infrastructure, education and healthcare.
Investment Attractiveness Index, 2015 - How does Africa rank?The Investment Attractiveness Index, 2015, published by the Fraser Institute is constructed by combining the Best Practices Mineral Potential Index, 2015 and the Policy Perception Index, 2015. The Policy Perception Index, 2015 measures the effects of government policy on the attitudes of investors towards investing in exploration in a specific country. The Best Practices Mineral Potential Index, 2015 rates the geological attractiveness of a country. It is noted in the Survey of Mining Companies, 2016, which contains the Investment Attractiveness Index, 2015, that policy factors only contribute approximately 40% to most companies investment decisions.
From an ease of doing business point of view, Africa’s average rankings are the poorest of all of the Developing and Transition Economies at 26%. Oceania scored the second lowest average rankings at 39% followed by Latin America and The Caribbean at 44%, developing Asia at 48% and the Transition Economies at a significantly higher 71%. The three African countries with the highest rankings in the Ease of Doing Business Survey, 2016 are Mauritius at 74%, Rwanda at 71% and Morocco at 64%. South Africa achieved a ranking of 61%, Zambia 48%, Nigeria a very low 11% and Egypt 36%. The three developing Asia countries with the highest rankings in the Ease of Doing Business Survey, 2016 are Singapore at 99%, Hong Kong at 98% and South Korea at 97%. China achieved a ranking of 59% and India a ranking of 32% with Indonesia and Malaysia obtaining rankings of 52% and 88%, respectively. In Latin America and The Caribbean, the highest ranked countries are Mexico at 75% and Peru and Colombia, both at 72%.
38%
31%
15%
21% 27%
0%
5%
10%
15%
20%
25%
30%
35%
40%
Southern Africa East Africa Central Africa West Africa North Africa
Uni
ts
Average Ease of Doing Business per region Average Ease of Doing Business per region
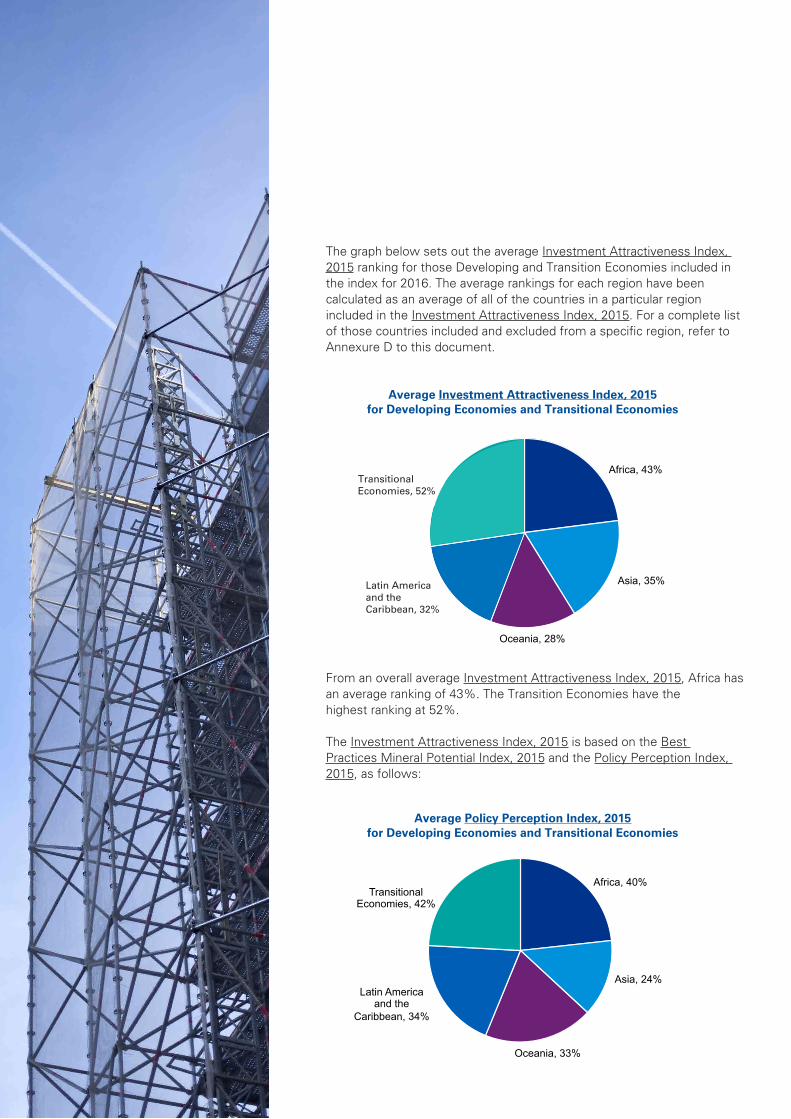
The graph below sets out the average Investment Attractiveness Index, 2015 ranking for those Developing and Transition Economies included in the index for 2016. The average rankings for each region have been calculated as an average of all of the countries in a particular region included in the Investment Attractiveness Index, 2015. For a complete list of those countries included and excluded from a specific region, refer to Annexure D to this document.
From an overall average Investment Attractiveness Index, 2015, Africa has an average ranking of 43%. The Transition Economies have the highest ranking at 52%. The Investment Attractiveness Index, 2015 is based on the Best Practices Mineral Potential Index, 2015 and the Policy Perception Index, 2015, as follows:
Africa, 40%
Asia, 24%
Oceania, 33%
Latin America and the
Caribbean, 34%
Transitional Economies, 42%
Average BPI for Developing Economies and Transitional Economies Average Policy Perception Index, 2015
for Developing Economies and Transitional Economies
Africa, 43%
Asia, 35%
Oceania, 28%
Latin America and the
Caribbean, 32%
Transitional Economies, 52%
Average BPI for Developing Economies and Transitional Economies
Latin America and the Caribbean, 32%
Average Investment Attractiveness Index, 2015 for Developing Economies and Transitional Economies
Transitional Economies, 52%
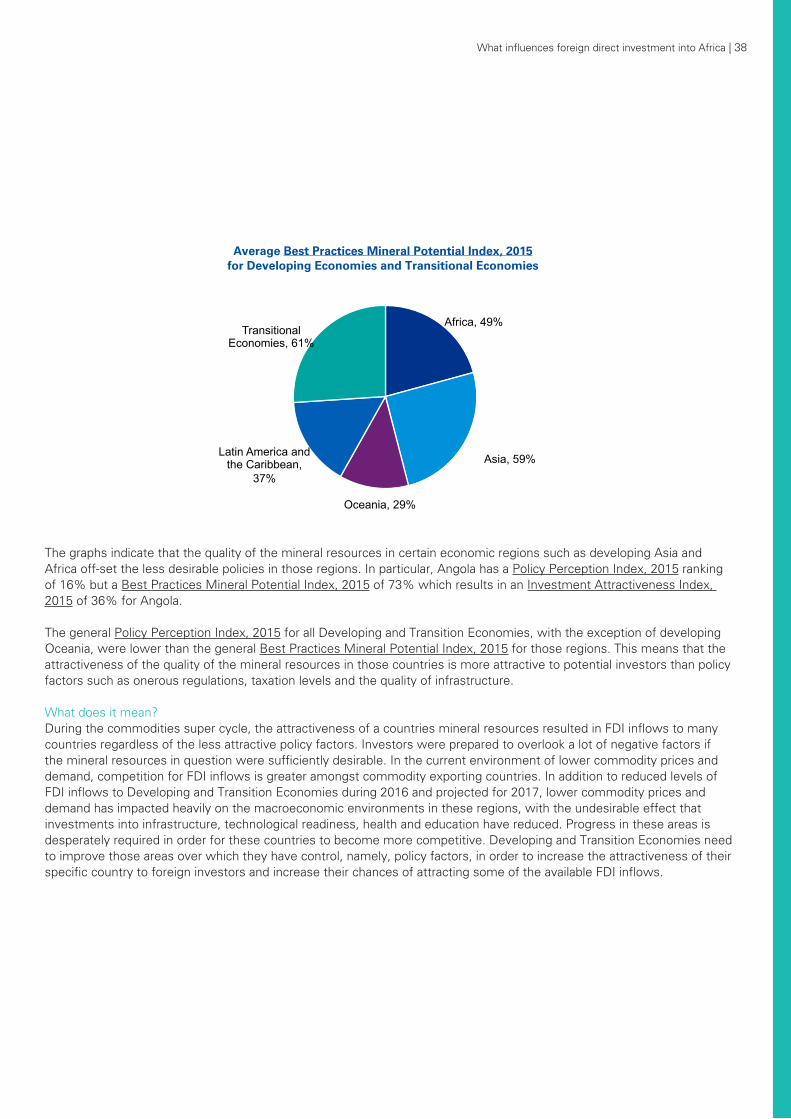
What influences foreign direct investment into Africa | 38
The graphs indicate that the quality of the mineral resources in certain economic regions such as developing Asia and Africa off-set the less desirable policies in those regions. In particular, Angola has a Policy Perception Index, 2015 ranking of 16% but a Best Practices Mineral Potential Index, 2015 of 73% which results in an Investment Attractiveness Index, 2015 of 36% for Angola. The general Policy Perception Index, 2015 for all Developing and Transition Economies, with the exception of developing Oceania, were lower than the general Best Practices Mineral Potential Index, 2015 for those regions. This means that the attractiveness of the quality of the mineral resources in those countries is more attractive to potential investors than policy factors such as onerous regulations, taxation levels and the quality of infrastructure.
What does it mean?During the commodities super cycle, the attractiveness of a countries mineral resources resulted in FDI inflows to many countries regardless of the less attractive policy factors. Investors were prepared to overlook a lot of negative factors if the mineral resources in question were sufficiently desirable. In the current environment of lower commodity prices and demand, competition for FDI inflows is greater amongst commodity exporting countries. In addition to reduced levels of FDI inflows to Developing and Transition Economies during 2016 and projected for 2017, lower commodity prices and demand has impacted heavily on the macroeconomic environments in these regions, with the undesirable effect that investments into infrastructure, technological readiness, health and education have reduced. Progress in these areas is desperately required in order for these countries to become more competitive. Developing and Transition Economies need to improve those areas over which they have control, namely, policy factors, in order to increase the attractiveness of their specific country to foreign investors and increase their chances of attracting some of the available FDI inflows.
Africa, 49%
Asia, 59%
Oceania, 29%
Latin America and the Caribbean,
37%
Transitional Economies, 61%
Average BPI for Developing Economies and Transitional Economies Average Best Practices Mineral Potential Index, 2015
for Developing Economies and Transitional Economies
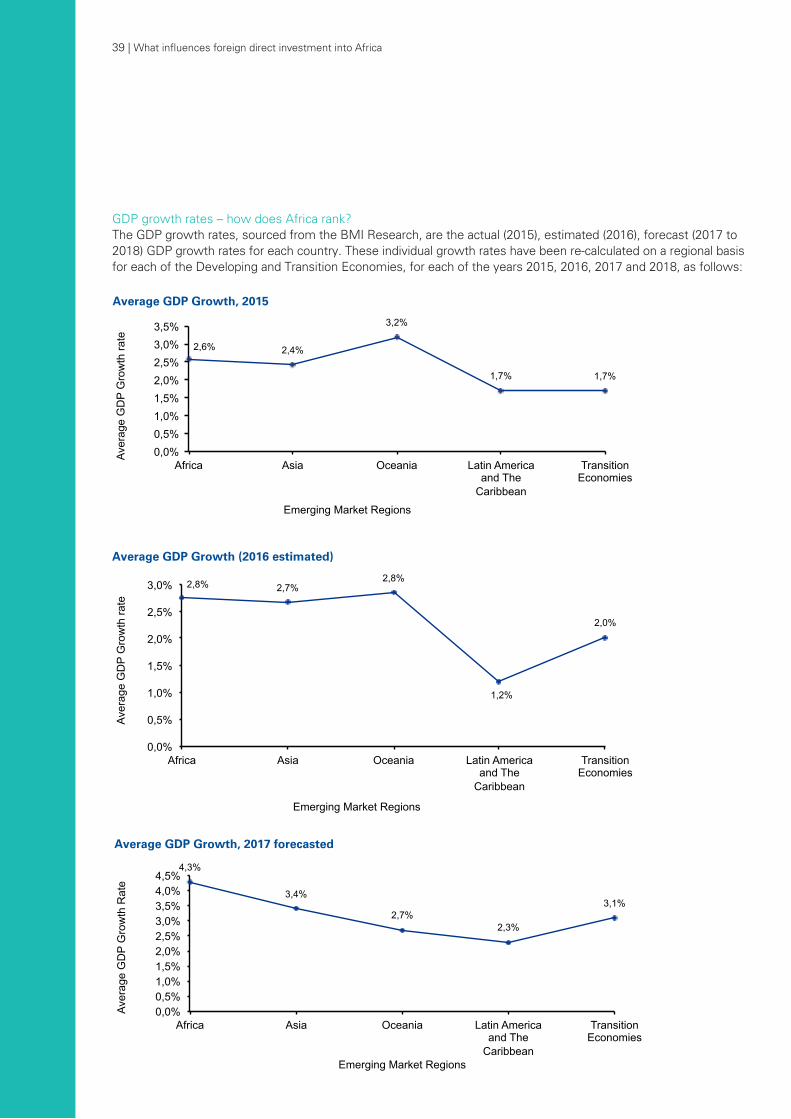
39 | What influences foreign direct investment into Africa
GDP growth rates – how does Africa rank?The GDP growth rates, sourced from the BMI Research, are the actual (2015), estimated (2016), forecast (2017 to 2018) GDP growth rates for each country. These individual growth rates have been re-calculated on a regional basis for each of the Developing and Transition Economies, for each of the years 2015, 2016, 2017 and 2018, as follows:
2,6% 2,4%
3,2%
1,7% 1,7%
0,0% 0,5% 1,0% 1,5% 2,0% 2,5% 3,0% 3,5%
Africa Asia Oceania Latin America and The
Caribbean
Transition Economies
AVE
RG
AE
GD
P G
RO
WTH
RAT
E
EMERGING MARKET REGIONS
Average GDP Growth, 2015 2,8% 2,7%
2,8%
1,2%
2,0%
0,0%
0,5%
1,0%
1,5%
2,0%
2,5%
3,0%
Africa Asia Oceania Latin America and The
Caribbean
Transition Economies
Aver
age
GD
P G
row
th ra
te
Emerging Market Regions
Average GDP Growth (2016, estimated) 2,8% 2,7% 2,8%
1,2%
2,0%
0,0%
0,5%
1,0%
1,5%
2,0%
2,5%
3,0%
Africa Asia Oceania Latin America and The
Caribbean
Transition Economies
Aver
age
GD
P G
row
th ra
te
Emerging Market Regions
Average GDP Growth (2016, estimated)
4,3%
3,4%
2,7% 2,3%
3,1%
0,0% 0,5% 1,0% 1,5% 2,0% 2,5% 3,0% 3,5% 4,0% 4,5%
Africa Asia Oceania Latin America and The
Caribbean
Transition Economies
Aver
age
GD
P G
row
th R
ate
Emerging Market Regions
Average GDP Growth, 2017 forecasted
2,8% 2,7% 2,8%
1,2%
2,0%
0,0%
0,5%
1,0%
1,5%
2,0%
2,5%
3,0%
Africa Asia Oceania Latin America and The
Caribbean
Transition Economies
Aver
age
GD
P G
row
th ra
te
Emerging Market Regions
Average GDP Growth (2016, estimated)
Average GDP Growth, 2015
Average GDP Growth (2016 estimated)
Average GDP Growth, 2017 forecasted
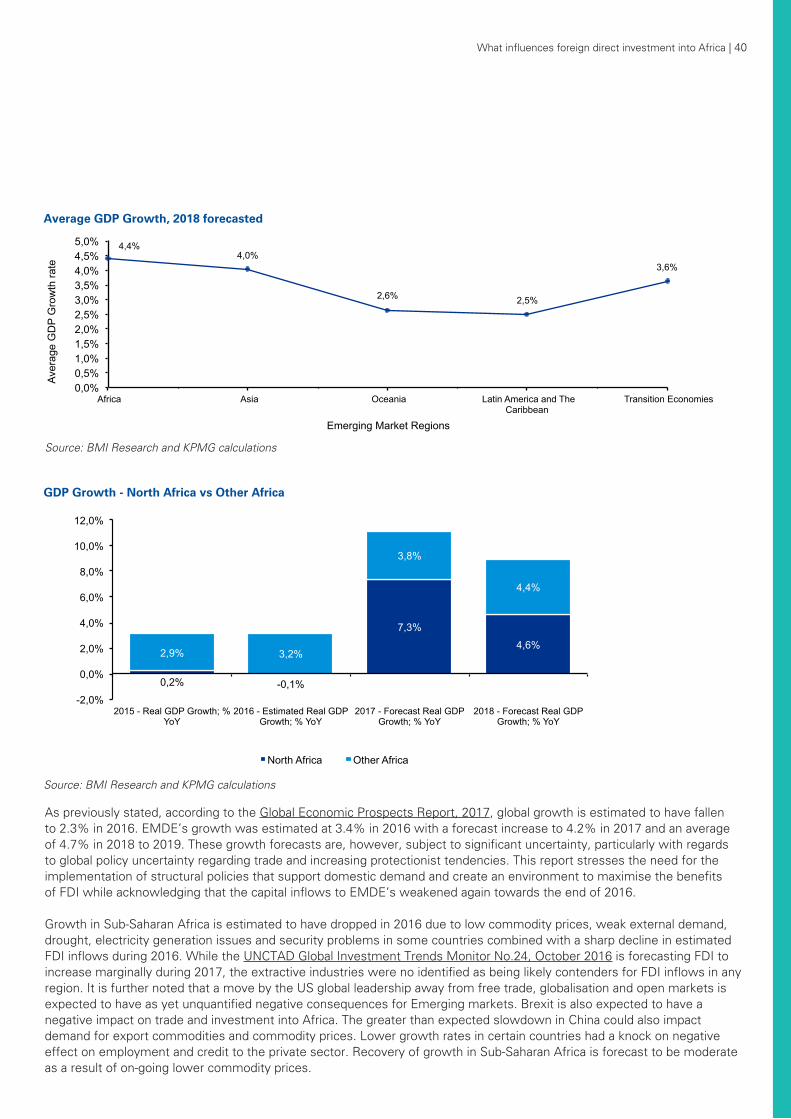
4,4% 4,0%
2,6% 2,5%
3,6%
0,0% 0,5% 1,0% 1,5% 2,0% 2,5% 3,0% 3,5% 4,0% 4,5% 5,0%
Africa Asia Oceania Latin America and The Caribbean
Transition Economies
Aver
age
GD
P G
row
th ra
te
Emerging Market Regions
Average GDP Growth, 2018 forecasted
What influences foreign direct investment into Africa | 40
Source: BMI Research and KPMG calculations
Source: BMI Research and KPMG calculations
As previously stated, according to the Global Economic Prospects Report, 2017, global growth is estimated to have fallen to 2.3% in 2016. EMDE’s growth was estimated at 3.4% in 2016 with a forecast increase to 4.2% in 2017 and an average of 4.7% in 2018 to 2019. These growth forecasts are, however, subject to significant uncertainty, particularly with regards to global policy uncertainty regarding trade and increasing protectionist tendencies. This report stresses the need for the implementation of structural policies that support domestic demand and create an environment to maximise the benefits of FDI while acknowledging that the capital inflows to EMDE’s weakened again towards the end of 2016. Growth in Sub-Saharan Africa is estimated to have dropped in 2016 due to low commodity prices, weak external demand, drought, electricity generation issues and security problems in some countries combined with a sharp decline in estimated FDI inflows during 2016. While the UNCTAD Global Investment Trends Monitor No.24, October 2016 is forecasting FDI to increase marginally during 2017, the extractive industries were no identified as being likely contenders for FDI inflows in any region. It is further noted that a move by the US global leadership away from free trade, globalisation and open markets is expected to have as yet unquantified negative consequences for Emerging markets. Brexit is also expected to have a negative impact on trade and investment into Africa. The greater than expected slowdown in China could also impact demand for export commodities and commodity prices. Lower growth rates in certain countries had a knock on negative effect on employment and credit to the private sector. Recovery of growth in Sub-Saharan Africa is forecast to be moderate as a result of on-going lower commodity prices.
0,2% -0,1%
7,3%
4,6% 2,9% 3,2%
3,8%
4,4%
-2,0%
0,0%
2,0%
4,0%
6,0%
8,0%
10,0%
12,0%
2015 - Real GDP Growth; % YoY
2016 - Estimated Real GDP Growth; % YoY
2017 - Forecast Real GDP Growth; % YoY
2018 - Forecast Real GDP Growth; % YoY
Uni
ts
GDP Growth - North Africa vs Other Africa
North Africa Other Africa
Average GDP Growth, 2018 forecasted
GDP Growth - North Africa vs Other Africa
41 | What influences foreign direct investment into Africa
THE AFRICAN LANDSCAPE
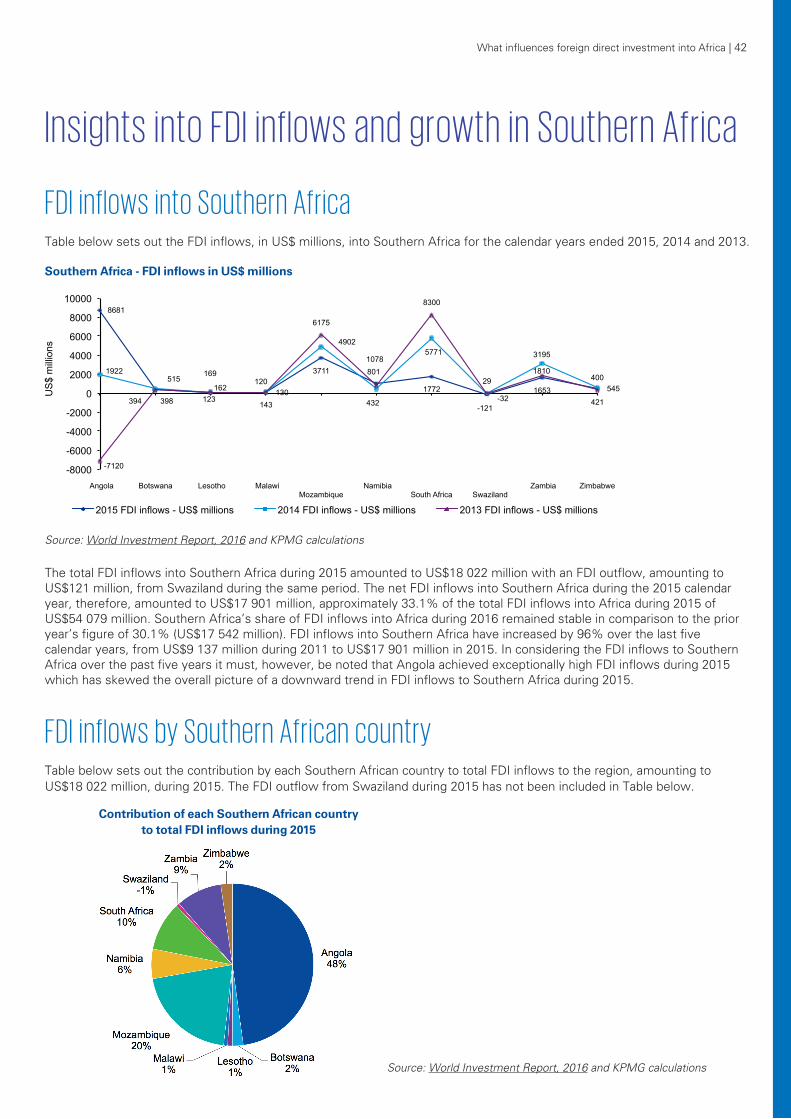
What influences foreign direct investment into Africa | 42
Insights into FDI inflows and growth in Southern Africa FDI inflows into Southern Africa Table below sets out the FDI inflows, in US$ millions, into Southern Africa for the calendar years ended 2015, 2014 and 2013.
Source: World Investment Report, 2016 and KPMG calculations
The total FDI inflows into Southern Africa during 2015 amounted to US$18 022 million with an FDI outflow, amounting to US$121 million, from Swaziland during the same period. The net FDI inflows into Southern Africa during the 2015 calendar year, therefore, amounted to US$17 901 million, approximately 33.1% of the total FDI inflows into Africa during 2015 of US$54 079 million. Southern Africa’s share of FDI inflows into Africa during 2016 remained stable in comparison to the prior year’s figure of 30.1% (US$17 542 million). FDI inflows into Southern Africa have increased by 96% over the last five calendar years, from US$9 137 million during 2011 to US$17 901 million in 2015. In considering the FDI inflows to Southern Africa over the past five years it must, however, be noted that Angola achieved exceptionally high FDI inflows during 2015 which has skewed the overall picture of a downward trend in FDI inflows to Southern Africa during 2015.
FDI inflows by Southern African country Table below sets out the contribution by each Southern African country to total FDI inflows to the region, amounting to US$18 022 million, during 2015. The FDI outflow from Swaziland during 2015 has not been included in Table below.
Source: World Investment Report, 2016 and KPMG calculations
8681
394
169
143
3711 1078
1772
-121
1653 421
1922 515
162 130
4902
432
5771
-32
3195
545
-7120
398 123
120
6175
801
8300
29 1810
400
-8000
-6000
-4000
-2000
0
2000
4000
6000
8000
10000
Angola Botswana Lesotho Malawi Mozambique
Namibia South Africa
Swaziland
Zambia Zimbabwe
US
$ m
illio
ns
Southern Africa - FDI Inflows
2015 FDI inflows - US$ millions 2014 FDI inflows - US$ millions 2013 FDI inflows - US$ millions
Southern Africa - FDI inflows in US$ millions
Contribution of each Southern African country to total FDI inflows during 2015
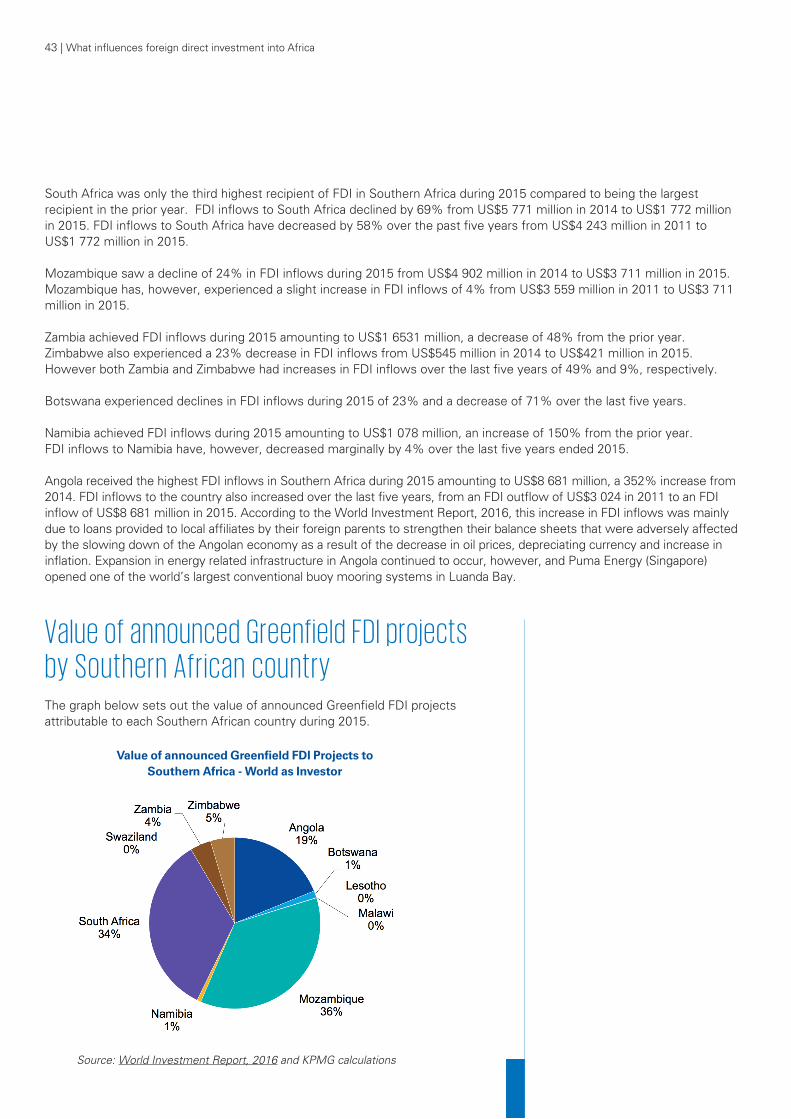
43 | What influences foreign direct investment into Africa
South Africa was only the third highest recipient of FDI in Southern Africa during 2015 compared to being the largest recipient in the prior year. FDI inflows to South Africa declined by 69% from US$5 771 million in 2014 to US$1 772 million in 2015. FDI inflows to South Africa have decreased by 58% over the past five years from US$4 243 million in 2011 to US$1 772 million in 2015.
Mozambique saw a decline of 24% in FDI inflows during 2015 from US$4 902 million in 2014 to US$3 711 million in 2015. Mozambique has, however, experienced a slight increase in FDI inflows of 4% from US$3 559 million in 2011 to US$3 711 million in 2015.
Zambia achieved FDI inflows during 2015 amounting to US$1 6531 million, a decrease of 48% from the prior year. Zimbabwe also experienced a 23% decrease in FDI inflows from US$545 million in 2014 to US$421 million in 2015. However both Zambia and Zimbabwe had increases in FDI inflows over the last five years of 49% and 9%, respectively.
Botswana experienced declines in FDI inflows during 2015 of 23% and a decrease of 71% over the last five years.
Namibia achieved FDI inflows during 2015 amounting to US$1 078 million, an increase of 150% from the prior year. FDI inflows to Namibia have, however, decreased marginally by 4% over the last five years ended 2015.
Angola received the highest FDI inflows in Southern Africa during 2015 amounting to US$8 681 million, a 352% increase from 2014. FDI inflows to the country also increased over the last five years, from an FDI outflow of US$3 024 in 2011 to an FDI inflow of US$8 681 million in 2015. According to the World Investment Report, 2016, this increase in FDI inflows was mainly due to loans provided to local affiliates by their foreign parents to strengthen their balance sheets that were adversely affected by the slowing down of the Angolan economy as a result of the decrease in oil prices, depreciating currency and increase in inflation. Expansion in energy related infrastructure in Angola continued to occur, however, and Puma Energy (Singapore) opened one of the world’s largest conventional buoy mooring systems in Luanda Bay.
Value of announced Greenfield FDI projects by Southern African country The graph below sets out the value of announced Greenfield FDI projects attributable to each Southern African country during 2015.
Source: World Investment Report, 2016 and KPMG calculations
Value of announced Greenfield FDI Projects to Southern Africa - World as Investor
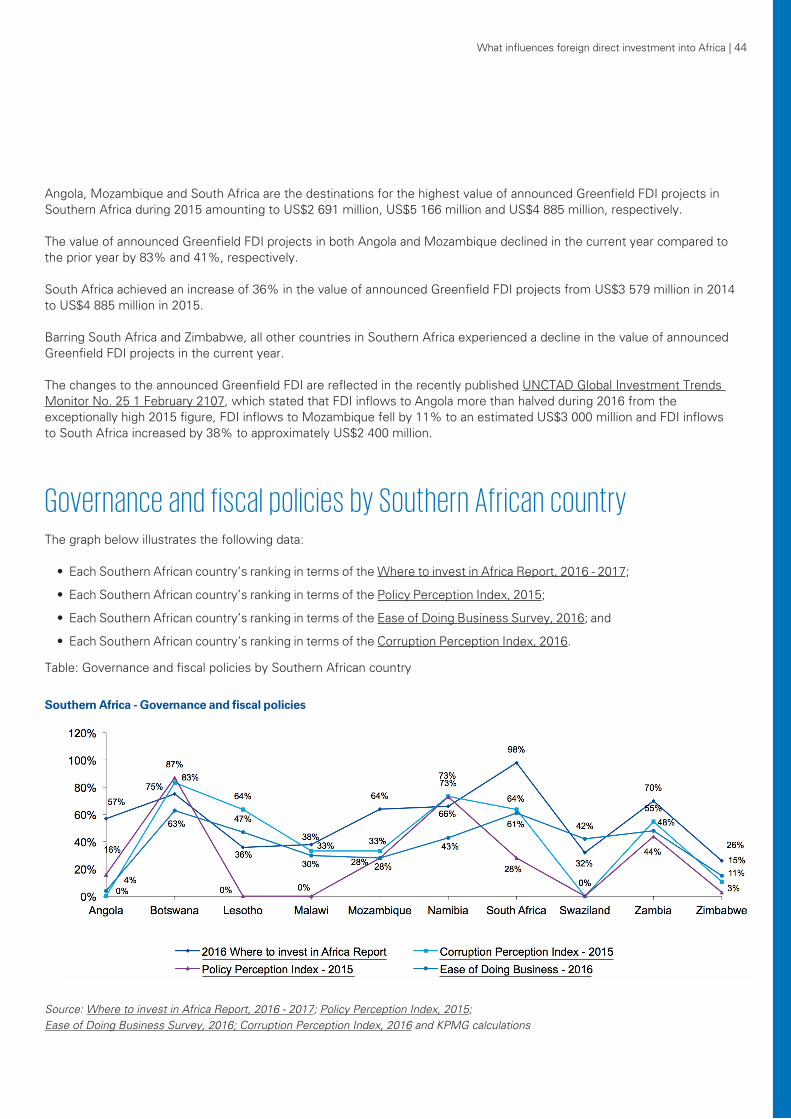
What influences foreign direct investment into Africa | 44
Angola, Mozambique and South Africa are the destinations for the highest value of announced Greenfield FDI projects in Southern Africa during 2015 amounting to US$2 691 million, US$5 166 million and US$4 885 million, respectively.
The value of announced Greenfield FDI projects in both Angola and Mozambique declined in the current year compared to the prior year by 83% and 41%, respectively.
South Africa achieved an increase of 36% in the value of announced Greenfield FDI projects from US$3 579 million in 2014 to US$4 885 million in 2015.
Barring South Africa and Zimbabwe, all other countries in Southern Africa experienced a decline in the value of announced Greenfield FDI projects in the current year. The changes to the announced Greenfield FDI are reflected in the recently published UNCTAD Global Investment Trends Monitor No. 25 1 February 2107, which stated that FDI inflows to Angola more than halved during 2016 from the exceptionally high 2015 figure, FDI inflows to Mozambique fell by 11% to an estimated US$3 000 million and FDI inflows to South Africa increased by 38% to approximately US$2 400 million.
Governance and fiscal policies by Southern African country The graph below illustrates the following data:
• Each Southern African country’s ranking in terms of the Where to invest in Africa Report, 2016 - 2017;
• Each Southern African country’s ranking in terms of the Policy Perception Index, 2015;
• Each Southern African country’s ranking in terms of the Ease of Doing Business Survey, 2016; and
• Each Southern African country’s ranking in terms of the Corruption Perception Index, 2016.
Table: Governance and fiscal policies by Southern African country
Source: Where to invest in Africa Report, 2016 - 2017; Policy Perception Index, 2015; Ease of Doing Business Survey, 2016; Corruption Perception Index, 2016 and KPMG calculations
Southern Africa - Governance and fiscal policies
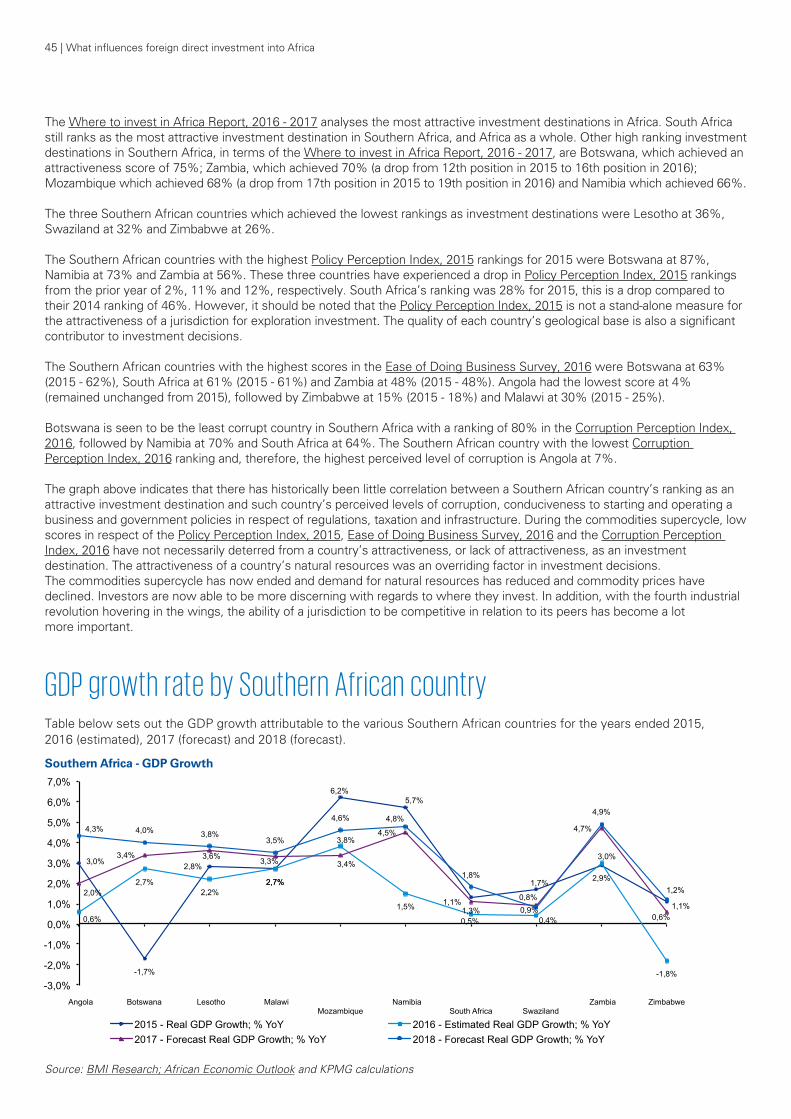
45 | What influences foreign direct investment into Africa
The Where to invest in Africa Report, 2016 - 2017 analyses the most attractive investment destinations in Africa. South Africa still ranks as the most attractive investment destination in Southern Africa, and Africa as a whole. Other high ranking investment destinations in Southern Africa, in terms of the Where to invest in Africa Report, 2016 - 2017, are Botswana, which achieved an attractiveness score of 75%; Zambia, which achieved 70% (a drop from 12th position in 2015 to 16th position in 2016); Mozambique which achieved 68% (a drop from 17th position in 2015 to 19th position in 2016) and Namibia which achieved 66%.
The three Southern African countries which achieved the lowest rankings as investment destinations were Lesotho at 36%, Swaziland at 32% and Zimbabwe at 26%.
The Southern African countries with the highest Policy Perception Index, 2015 rankings for 2015 were Botswana at 87%, Namibia at 73% and Zambia at 56%. These three countries have experienced a drop in Policy Perception Index, 2015 rankings from the prior year of 2%, 11% and 12%, respectively. South Africa’s ranking was 28% for 2015, this is a drop compared to their 2014 ranking of 46%. However, it should be noted that the Policy Perception Index, 2015 is not a stand-alone measure for the attractiveness of a jurisdiction for exploration investment. The quality of each country’s geological base is also a significant contributor to investment decisions.
The Southern African countries with the highest scores in the Ease of Doing Business Survey, 2016 were Botswana at 63% (2015 - 62%), South Africa at 61% (2015 - 61%) and Zambia at 48% (2015 - 48%). Angola had the lowest score at 4% (remained unchanged from 2015), followed by Zimbabwe at 15% (2015 - 18%) and Malawi at 30% (2015 - 25%).
Botswana is seen to be the least corrupt country in Southern Africa with a ranking of 80% in the Corruption Perception Index, 2016, followed by Namibia at 70% and South Africa at 64%. The Southern African country with the lowest Corruption Perception Index, 2016 ranking and, therefore, the highest perceived level of corruption is Angola at 7%.
The graph above indicates that there has historically been little correlation between a Southern African country’s ranking as an attractive investment destination and such country’s perceived levels of corruption, conduciveness to starting and operating a business and government policies in respect of regulations, taxation and infrastructure. During the commodities supercycle, low scores in respect of the Policy Perception Index, 2015, Ease of Doing Business Survey, 2016 and the Corruption Perception Index, 2016 have not necessarily deterred from a country’s attractiveness, or lack of attractiveness, as an investment destination. The attractiveness of a country’s natural resources was an overriding factor in investment decisions. The commodities supercycle has now ended and demand for natural resources has reduced and commodity prices have declined. Investors are now able to be more discerning with regards to where they invest. In addition, with the fourth industrial revolution hovering in the wings, the ability of a jurisdiction to be competitive in relation to its peers has become a lot more important.
GDP growth rate by Southern African country Table below sets out the GDP growth attributable to the various Southern African countries for the years ended 2015, 2016 (estimated), 2017 (forecast) and 2018 (forecast).
Source: BMI Research; African Economic Outlook and KPMG calculations
Southern Africa - GDP Growth
3,0%
-1,7%
2,8%
2,7%
6,2% 5,7%
1,3%
1,7% 2,9%
1,1% 0,6%
2,7% 2,2%
2,7%
3,8%
1,5%
0,5% 0,4%
3,0%
-1,8%
2,0%
3,4% 3,6% 3,3% 3,4%
4,5%
1,1% 0,9%
4,7%
0,6%
4,3% 4,0% 3,8% 3,5%
4,6% 4,8%
1,8%
0,8%
4,9%
1,2%
-3,0%
-2,0%
-1,0%
0,0%
1,0%
2,0%
3,0%
4,0%
5,0%
6,0%
7,0%
Angola Botswana Lesotho Malawi Mozambique
Namibia South Africa
Swaziland
Zambia Zimbabwe
Southern Africa - GDP Growth
2015 - Real GDP Growth; % YoY 2016 - Estimated Real GDP Growth; % YoY 2017 - Forecast Real GDP Growth; % YoY 2018 - Forecast Real GDP Growth; % YoY
Growth in Southern Africa slowed down in 2015. Lower commodity prices, drought and power shortages have all impacted growth in the region.
Mozambique and Namibia achieved the highest and second highest GDP growth in Southern Africa in 2015 at 6.2% and 5.7% respectively. In Mozambique GDP growth is estimated to decline to 3.8% in 2016 and this decline in growth is forecast to continue with growth forecast at 3.4% in 2017. GDP growth is only forecast to increase again in 2018 to 4.6%. In Namibia GDP growth is estimated to drop to 1.5% in 2016 and then forecast to increase to 4.5% in 2017 and 4.8% in 2018.
Botswana and Zimbabwe achieved the lowest GDP growth in Southern Africa in 2015. GDP growth in Botswana is estimated to increase to 2.7% in 2016, and then forecast at 3.4% for 2017 and 4.0% for 2018. In Zimbabwe, GDP growth in 2016 is estimated at negative 2.2% and is forecast to only start improving in 2017.
South Africa only recorded GDP growth of 1.3% in 2015. In 2016, growth in South Africa is estimated at 0.5%. During 2017 and 2018, GDP growth is forecast at 1.1% and 1.8% respectively. Many factors have contributed to the low growth in the country, including a drop in commodity prices, droughts and strikes.
47 | What influences foreign direct investment into Africa
Conclusion
Angola Prior to 2013, Angola experienced divestment, however, from 2014, Angola has again been receiving FDI inflows into the country. FDI inflows in 2015 amounted to US$8 681 million. The increase in FDI inflows to Angola during 2015 is misleading, however, as it is largely due to loans provided to local affiliates by their foreign parents in order to strengthen such affiliates balance sheets. The value of announced Greenfield FDI projects in 2015 amounted to US$2 691 million, a decrease of 83% from the prior year. UNCTAD Global Investment Trends Monitor No. 25 1 February 2107, stated that FDI inflows to Angola more than halved during 2016 from the 2015 figure.
Angola is considered to be a reasonably attractive investment destination in terms of the Where to invest in Africa Report, 2015 - 2016 with a ranking of 57% (64% in 2015). Angola’s rankings in the Policy Perception Index, 2015 and Ease of Doing Business Survey, 2016 are poor at 16% and 4%, respectively. The cost of doing business in Angola is significantly increased by the poor state of its transport infrastructure.
GDP growth in Angola is estimated to have fallen sharply during 2016 due to the low oil price which was compounded by a decline in oil production due to a reduction in productive FDI inflows to the country. Lower commodity revenue and a devaluating currency resulted in a reduction in public spending which weakened domestic demand. The country is forecast to achieve GDP growth of 2.0% in 2017 and 4.3% in 2018 partially due to recovering oil prices.
Angola achieved a ranking of 70th out of 109 countries (36%) in the Investment Attractiveness Index, 2015, 92nd out of 109 countries (16%) in the Policy Perception Index, 2015 and 29th out of 109 countries (73%) in the Best Practices Mineral Potential Index, 2015.
Angola’s political situation is currently stable and this stability is expected to continue.
Botswana
Botswana’s share of FDI inflows to Southern Africa is 2% and the country’s FDI inflows have declined by 23% year on year and by 71% over the last five years. The value of announced Greenfield FDI projects in Botswana have also decreased by 21% during 2015 to US$187 million. Botswana’s dependency on the diamond industry and the proximity of its diamond resources to the end of their life, are deterrents to investment into the country, however, in terms of the Investment Climate Statement for 2016 Report, the Government of Botswana has launched initiatives to promote foreign investment to diversify its economy beyond diamond mining.
Botswana achieved very good ratings in each of the Where to invest in Africa Report, 2015/6, Policy Perception Index, 2015, Ease of Doing Business Survey, 2016 and Corruption Perspective Index, 2016 with scores of 75%, 87%, 63% and 80%, respectively with no change in their rankings compared to the prior year.
Botswana achieved a score of 64% (78% – 2014) in the Investment Attractiveness Index, 2015 (39th out of 109 countries) and a score of 37% (63% - 2014) in the Best Practices Mineral Potential Index, 2015, a significant drop from the prior year.
Botswana’s estimated economic growth for 2016 is 2.7%. GDP growth is forecast to improve slightly to 3.4% in 2017 and 4.0% in 2018.
Botswana is considered to be a stable democracy with an independent judiciary system and that is not expected to change going forward.
What influences foreign direct investment into Africa | 48
Mozambique
Mozambique attracted the second highest FDI inflows in Southern Africa and the third highest in Africa during 2015 of US$3 711 million, this is however a decline of 24% from the prior year. According to the World Investment Report, 2016, this decline was due primarily to uncertainty related to the 2015 elections and low gas prices. The closing down of the Anglo-American offices in Mozambique in 2015 also impacted FDI inflows. The value of announced Greenfield FDI projects into Mozambique decreased by 41% during 2015 to US$5 166 million. UNCTAD Global Investment Trends Monitor No. 25 1 February 2107 stated that FDI inflows to Mozambique during 2016 fell by 11% to an estimated US$3 000 million.
Mozambique ranked 19th out of 53 countries in the Where to invest in Africa Report, 2016 - 2017 which equates to a ranking of 64%, dropping from 17th position in 2015. Mozambique’s rankings in the Policy Perception Index, 2015, Ease of Doing Business Survey, 2016 and Corruption Perspective Index, 2016 are 28%, 28% and 19%, respectively, which, while not high rankings, are better than the rankings achieved by Angola and Zimbabwe.
Mozambique ranked 84th out of 109 countries in the Investment Attractiveness Index, 2015, an effective ranking of 23% and 78th out of 109 jurisdictions in the Best Practices Mineral Potential Index, 2015, an effective ranking of 28%.
Mozambique has the highest GDP growth rates in Southern Africa although, the current weak commodity prices pose some downside risk to GDP growth rates going forward and GDP growth is forecast to decrease in 2017 and 2018. Mozambique’s biggest export commodity is aluminium with coal continuing to grow as a contributor to exports. Significant gas exports are considered to be possible in the medium term. Mozambique is still projected to achieve high growth rates driven by natural resource exploration and production, construction, and exploiting largely untapped agricultural potential.
The ruling Frente de Libertação de Moçambique (“Frelimo”) party, which has been in power since Mozambique gained independence in 1975, dominates the political scene. The 2014 elections proceeded smoothly despite continuing political rivalry between the ruling Frelimo party and the opposition Renamo parties.
Namibia
Namibia achieved FDI inflows of US$1 078 million during 2015, a 150% increase in FDI inflows from the prior year. The value of announced Greenfield FDI projects into Namibia has declined by 41% during 2015 to US$108 million.
Namibia ranked 18th out of 53 African Countries in the Where to invest in Africa Report, 2016 - 2017. Namibia achieved scores of 70% (73% - 2015) in the Corruption Perspective Index, 2016, 43% (47% - 2015) in the Ease of Doing Business Survey, 2016 and 73% (84% - 2014) in the Policy Perception Index, 2015. Namibia is ranked at 33rd and 50th out of 109 countries in the Investment Attractiveness Index, 2015 and Best Practices Mineral Potential Index, 2015, respectively.
Namibia’s GDP growth is estimated at 1.5% for 2016. Namibia is forecast to achieve GDP growth rates of 4.5% in 2017 and 4.8% in 2018.
Namibia is a stable democracy with low political risk and stable trend lines.

49 | What influences foreign direct investment into Africa
What influences foreign direct investment into Africa | 50
South Africa South Africa has experienced a significant decrease of 69% in FDI inflows during 2015, with FDI inflows to the country amounting to US$1 772 million in 2015, compared to US$5 771 million in 2014. South Africa experienced the biggest decline in Southern Africa in FDI inflows during 2015. The value of announced Greenfield FDI projects into South Africa during 2015 has increased by 36% to US$4 885 million. According to the Investment Climate Statement, 2016, the biggest concern for investors has become the direction of economic policy, which is creating uncertainty about the future regulatory and investment climate in the country. Therefore, unless the policy indicators and ability to conduct business in South Africa start to improve, South Africa will continue to lose ground as the most attractive investment destination in Africa and FDI inflows are lightly to continue to decline. UNCTAD Global Investment Trends Monitor No. 25 1 February 2107 stated that FDI inflows to South Africa increased by 38% to an estimated US$2 400 million, although this is still a relatively low level of FDI inflows compared to prior years.
South Africa is ranked the best investment destination in Africa, in accordance with the Where to invest in Africa Report, 2016 - 2017, due to the perception that South Africa has the best business environment in Africa and robust physical infrastructure. South Africa’s ranking in the Ease of Doing Business Survey, 2016 was 61%, no change from the prior year. Areas that negatively impact South Africa’s doing business ranking include: starting a business; getting electricity; registering property; protecting minority investors; and enforcing contracts. South Africa continues to rank reasonably well with regards to the Corruption Perspective Index, 2016 (64%). South Africa’s ranking in the Policy Perception Index, 2015 was 28%, a drop from 46% in the prior year. This is largely due to strikes and perceived inadequate labour laws with regards to the mineral sector strikes. South Africa ranked 66th out of 109 jurisdictions in the Investment Attractiveness Index, 2015, an effective ranking of 39%. The quality of South Africa’s mineral resources ranked at 53% in terms of the Best Practices Mineral Potential Index, 2015.
South Africa has the one of the lowest forecast GDP growth rates in Southern Africa at 0.5% for 2016, 1.1% for 2017 and 1.8% for 2018.
Zambia
Zambia experienced a decrease in FDI inflows from US$3 195 million in 2014 to US$1 653 million. This is mainly due to a drop in commodity prices. The value of Greenfield FDI projects into Zambia in 2015 also decreased by 81% to US$562 million.
Zambia has reasonable rankings in the Corruption Perspective Index, 2016 and Ease of Doing Business Survey, 2016 of 51% and 48%, respectively. In the Policy Perception Index, 2015, Zambia achieved a ranking of 44%, a decrease from 2014. Zambia also achieved a ranking of 70% in the Where to invest in Africa Report, 2016 - 2017, a drop from the prior year. Improving accountability and the fight against corruption continue to receive attention from the Zambian government.
Zambia is estimated to achieve the second highest GDP growth rate of the Southern African countries for 2016 at 3.0% and is forecast to achieve the highest GDP growth for 2017 and 2018 at 4.7% and 4.9%, respectively. GDP growth in Zambia has been affected by poor electricity generation, drought and a decline in commodity prices, mainly copper.
Copper is Zambia’s single largest export commodity and diversifying the economy away from its overdependence on this resource is an important goal of the Zambian government. Zambia ranked 68th out of 109 countries in the Investment Attractiveness Index, 2015, an effective ranking of 38%. The quality of Zambia’s mineral resources is ranked at 33%, in terms of the Best Practices Mineral Potential Index, 2015, this is a significant decrease from the prior year ranking of 75%. The main reason for the decline is uncertainties related to the mining tax regime.
Zambia is considered to be a stable democracy, a perception that has been reinforced by the recent presidential by-elections.
What does this mean? Productive FDI inflows to Southern Africa declined significantly during 2015 due mainly to the low commodity prices. The global FDI inflows are estimated to have declined by 15% during 2016 with the FDI inflows to Developing Economies estimated to have reduced by 16%. Growth generally dropped across the region during 2015 and slightly more in 2016. The rankings of most Southern African countries in the Policy Perception Index, 2015 have deteriorated due to more difficulties in starting business in the various countries, labour issues, electricity shortages and amendments to tax laws. In addition to low growth and reduced FDI inflows as a result of the weaker global growth environment, many Southern African countries have also been battling with drought. The rankings of the Southern African countries in the Overall Global Competitiveness Index, 2016 – 2017 generally declined slightly during 2016 with South Africa being the only Southern African country to achieve a ranking of over 50%.
Southern African countries need to continue to focus on improving those factors over which they have control such as corruption, ease of doing business and attractive and stable policies for investors. FDI inflows are essential for Southern African countries to continue to improve their infrastructure and education systems thereby enabling these countries to become more competitive in a fast changing global environment.
51 | What influences foreign direct investment into Africa
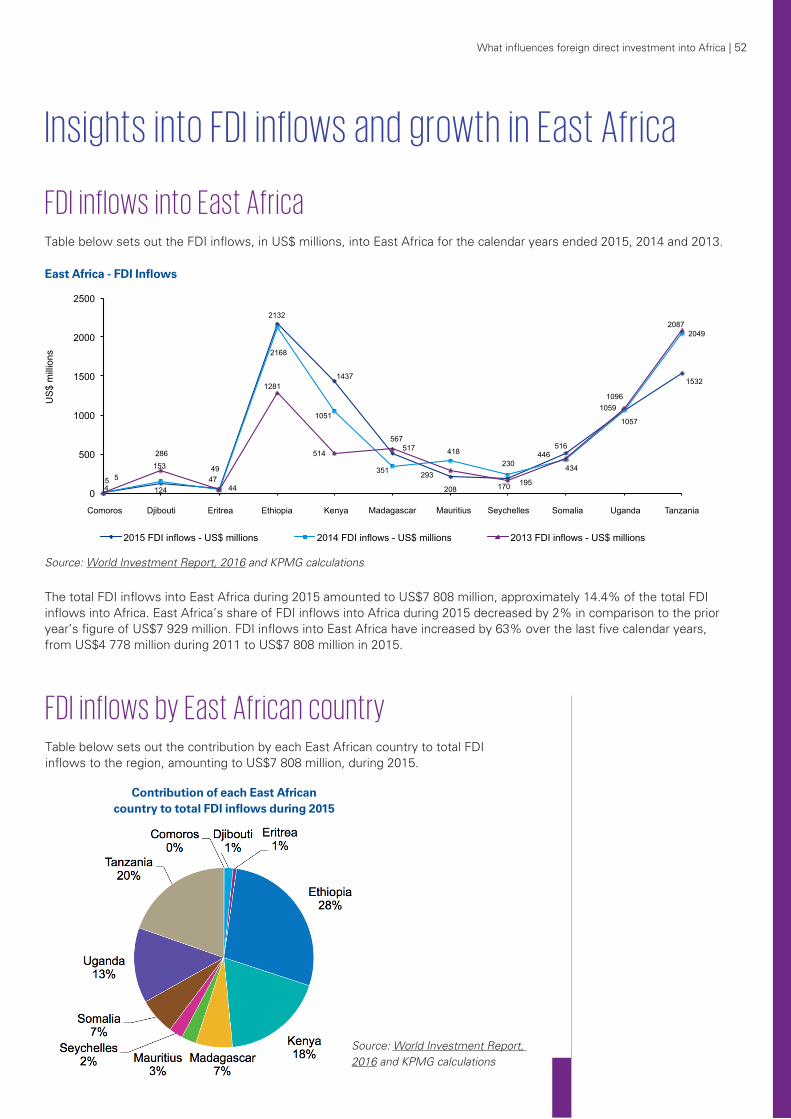
What influences foreign direct investment into Africa | 52
Insights into FDI inflows and growth in East Africa FDI inflows into East Africa Table below sets out the FDI inflows, in US$ millions, into East Africa for the calendar years ended 2015, 2014 and 2013.
Source: World Investment Report, 2016 and KPMG calculations
The total FDI inflows into East Africa during 2015 amounted to US$7 808 million, approximately 14.4% of the total FDI inflows into Africa. East Africa’s share of FDI inflows into Africa during 2015 decreased by 2% in comparison to the prior year’s figure of US$7 929 million. FDI inflows into East Africa have increased by 63% over the last five calendar years, from US$4 778 million during 2011 to US$7 808 million in 2015.
FDI inflows by East African country Table below sets out the contribution by each East African country to total FDI inflows to the region, amounting to US$7 808 million, during 2015.
Source: World Investment Report, 2016 and KPMG calculations
East Africa - FDI Inflows
5
124
49
2168
1437
517
208 195
516
1057
1532
5
153
47
2132
1051
351
418 230 434
1059
2049
4
286
44
1281
514
567
293 170
446
1096
2087
0
500
1000
1500
2000
2500
Comoros Djibouti Eritrea Ethiopia Kenya Madagascar
Mauritius
Seychelles
Somalia Uganda Tanzania
US
$ m
illio
ns
East Africa - FDI Inflows
2015 FDI inflows - US$ millions 2014 FDI inflows - US$ millions 2013 FDI inflows - US$ millions
5
124
49
2168
1437
517
208 195
516
1057
1532
5
153
47
2132
1051
351
418 230 434
1059
2049
4
286
44
1281
514
567
293 170
446
1096
2087
0
500
1000
1500
2000
2500
Comoros Djibouti Eritrea Ethiopia Kenya Madagascar
Mauritius
Seychelles
Somalia Uganda Tanzania
US
$ m
illio
ns
East Africa - FDI Inflows
2015 FDI inflows - US$ millions 2014 FDI inflows - US$ millions 2013 FDI inflows - US$ millions
Contribution of each East African country to total FDI inflows during 2015
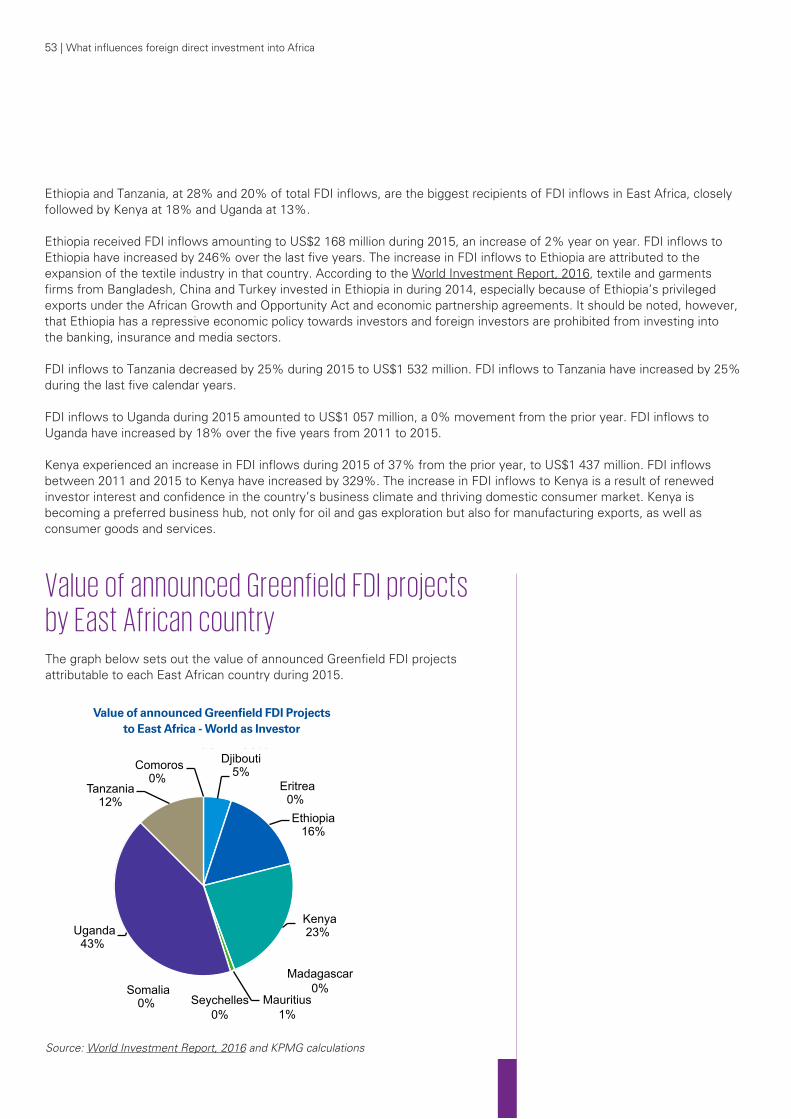
53 | What influences foreign direct investment into Africa
Ethiopia and Tanzania, at 28% and 20% of total FDI inflows, are the biggest recipients of FDI inflows in East Africa, closely followed by Kenya at 18% and Uganda at 13%.
Ethiopia received FDI inflows amounting to US$2 168 million during 2015, an increase of 2% year on year. FDI inflows to Ethiopia have increased by 246% over the last five years. The increase in FDI inflows to Ethiopia are attributed to the expansion of the textile industry in that country. According to the World Investment Report, 2016, textile and garments firms from Bangladesh, China and Turkey invested in Ethiopia in during 2014, especially because of Ethiopia’s privileged exports under the African Growth and Opportunity Act and economic partnership agreements. It should be noted, however, that Ethiopia has a repressive economic policy towards investors and foreign investors are prohibited from investing into the banking, insurance and media sectors.
FDI inflows to Tanzania decreased by 25% during 2015 to US$1 532 million. FDI inflows to Tanzania have increased by 25% during the last five calendar years.
FDI inflows to Uganda during 2015 amounted to US$1 057 million, a 0% movement from the prior year. FDI inflows to Uganda have increased by 18% over the five years from 2011 to 2015.
Kenya experienced an increase in FDI inflows during 2015 of 37% from the prior year, to US$1 437 million. FDI inflows between 2011 and 2015 to Kenya have increased by 329%. The increase in FDI inflows to Kenya is a result of renewed investor interest and confidence in the country’s business climate and thriving domestic consumer market. Kenya is becoming a preferred business hub, not only for oil and gas exploration but also for manufacturing exports, as well as consumer goods and services.
Value of announced Greenfield FDI projects by East African country The graph below sets out the value of announced Greenfield FDI projects attributable to each East African country during 2015.
Source: World Investment Report, 2016 and KPMG calculations
Comoros 0%
Djibouti 5%
Eritrea 0% Ethiopia
16%
Kenya 23%
Madagascar
0% Mauritius
1%
Seychelles
0%
Somalia 0%
Uganda 43%
Tanzania 12%
Value of announced Greenfield FDI Projects to East Africa - World as Investor
Value of announced Greenfield FDI Projects to East Africa - World as Investor
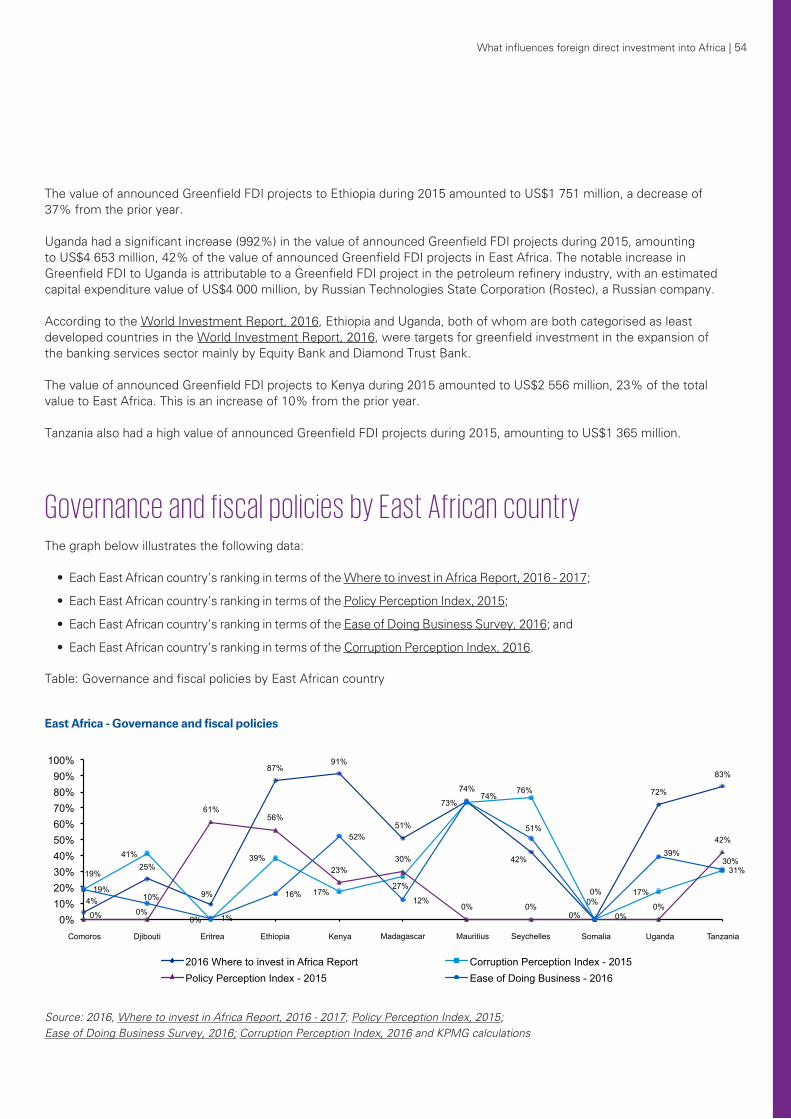
What influences foreign direct investment into Africa | 54
The value of announced Greenfield FDI projects to Ethiopia during 2015 amounted to US$1 751 million, a decrease of 37% from the prior year.
Uganda had a significant increase (992%) in the value of announced Greenfield FDI projects during 2015, amounting to US$4 653 million, 42% of the value of announced Greenfield FDI projects in East Africa. The notable increase in Greenfield FDI to Uganda is attributable to a Greenfield FDI project in the petroleum refinery industry, with an estimated capital expenditure value of US$4 000 million, by Russian Technologies State Corporation (Rostec), a Russian company.
According to the World Investment Report, 2016, Ethiopia and Uganda, both of whom are both categorised as least developed countries in the World Investment Report, 2016, were targets for greenfield investment in the expansion of the banking services sector mainly by Equity Bank and Diamond Trust Bank.
The value of announced Greenfield FDI projects to Kenya during 2015 amounted to US$2 556 million, 23% of the total value to East Africa. This is an increase of 10% from the prior year.
Tanzania also had a high value of announced Greenfield FDI projects during 2015, amounting to US$1 365 million.
Governance and fiscal policies by East African country The graph below illustrates the following data:
• Each East African country’s ranking in terms of the Where to invest in Africa Report, 2016 - 2017;
• Each East African country’s ranking in terms of the Policy Perception Index, 2015;
• Each East African country’s ranking in terms of the Ease of Doing Business Survey, 2016; and
• Each East African country’s ranking in terms of the Corruption Perception Index, 2016. Table: Governance and fiscal policies by East African country
Source: 2016, Where to invest in Africa Report, 2016 - 2017; Policy Perception Index, 2015; Ease of Doing Business Survey, 2016; Corruption Perception Index, 2016 and KPMG calculations
East Africa - Governance and fiscal policies
4%
25%
9%
87% 91%
51%
74%
42%
0%
72%
83%
19%
41%
0%
39%
17% 27%
73% 76%
0%
17%
30%
0% 0%
61% 56%
23% 30%
0% 0%
0%
0%
42%
19% 10%
1%
16%
52%
12%
74%
51%
0%
39%
31%
0% 10% 20% 30% 40% 50% 60% 70% 80% 90%
100%
Comoros Djibouti Eritrea Ethiopia Kenya Madagascar
Mauritius
Seychelles
Somalia Uganda Tanzania
East Africa - Where to Invest in Africa, PPI, Ease of Doing Business and CPI
2016 Where to invest in Africa Report Corruption Perception Index - 2015 Policy Perception Index - 2015 Ease of Doing Business - 2016
Kenya, at 91%, ranks as the most attractive investment destination in East Africa in terms of the Where to invest in Africa Report, 2016 - 2017. Kenya moved from 10th position in 2015 to 5th position in 2016. Other high ranking investment destinations in East Africa, in terms of the Where to invest in Africa Report, 2016 - 2017, are Ethiopia, which achieved an attractiveness score of 87% and Tanzania, which achieved an attractiveness score of 83%. Mauritius and Uganda also achieved good rankings at 74% and 72% respectively.
The three East African countries which achieved the lowest ranking as invest-ment destinations, in terms of the Where to invest in Africa Report, 2016 - 2017, were Comoros at 4%, Eritrea at 9% and Djibouti at 25%.
Only five East Africa countries out of eleven are included in the Policy Perception Index, 2015. Of those countries that are included, Eritrea and Ethiopia have the highest rankings at 61% and 56%, respectively.
Kenya, Mauritius and Seychelles are the only East African countries that achieved a ranking of over 50% in the Ease of Doing Business Survey, 2016, with rankings of 52%, 74% and 51%, respectively. Kenya and Seychelles improved their rankings from the prior year by 9% and 1%, respectively. Mauritius’ ranking declined by 9% from the prior year. Tanzania, Ethiopia, and Uganda all ranked in the bottom 50% with rankings of 31%, 16% and 39%, respectively.
Mauritius was the highest ranking East African country in terms of the Corruption Perspective Index, 2016, with a ranking of 72%. Ethiopia achieved the second highest ranking of the East African countries in the Corruption Perspective Index, 2016 with a ranking of 39%.
The East African graphs support the hypothesis that historically there has been no particular correlation between an East African country’s ranking as an attractive investment destination and such country’s perceived levels of corruption, conduciveness to starting and operating a business and government policies in respect of regulations, taxation and infrastructure. Ethiopia, Tanzania and Kenya all achieved rankings of over 80% in the Where to invest in Africa Report, 2016 - 2017 despite relatively low rankings in the Corruption Perspective Index, 2016 and Ease of Doing Business Survey, 2016.
There does seem to be more of a correlation between FDI inflows to an East African country and its rankings in the Where to invest in Africa Report, 2016 - 2017, although not between FDI inflows to an East African country and its rankings in the Corruption Perspective Index, 2016, Policy Perception Index, 2015 and Ease of Doing Business Survey, 2016. Ethiopia received 28% of the total FDI inflows to East Africa during 2015 (US$2 168 million) which is in line with its higher ranking of 87% in the Where to invest in Africa Report, 2016 - 2017. Tanzania received 20% of the total FDI inflows to East Africa during 2015 (US$1 532 million) and achieved a ranking of 83% in the Where to invest in Africa Report 2016 - 2017. This correlation is less clear with Kenya and Uganda which achieved FDI inflows of 18% and 14% of total FDI inflows to East Africa, respectively, during 2015 and achieved rankings of 91% and 72%, respectively in the Where to invest in Africa Report, 2016 - 2017.
According to the UNCTAD Global Investment Trends Monitor No. 25 1 February 2017, there was a decrease in the value of announced Greenfield FDI manufacturing projects across all industries during 2016. All East African countries, including Ethiopia and Kenya that experienced increased FDI inflows during 2015, will benefit from focusing on improving their rankings in the Corruption Perspective Index and the Ease of Doing business Survey.
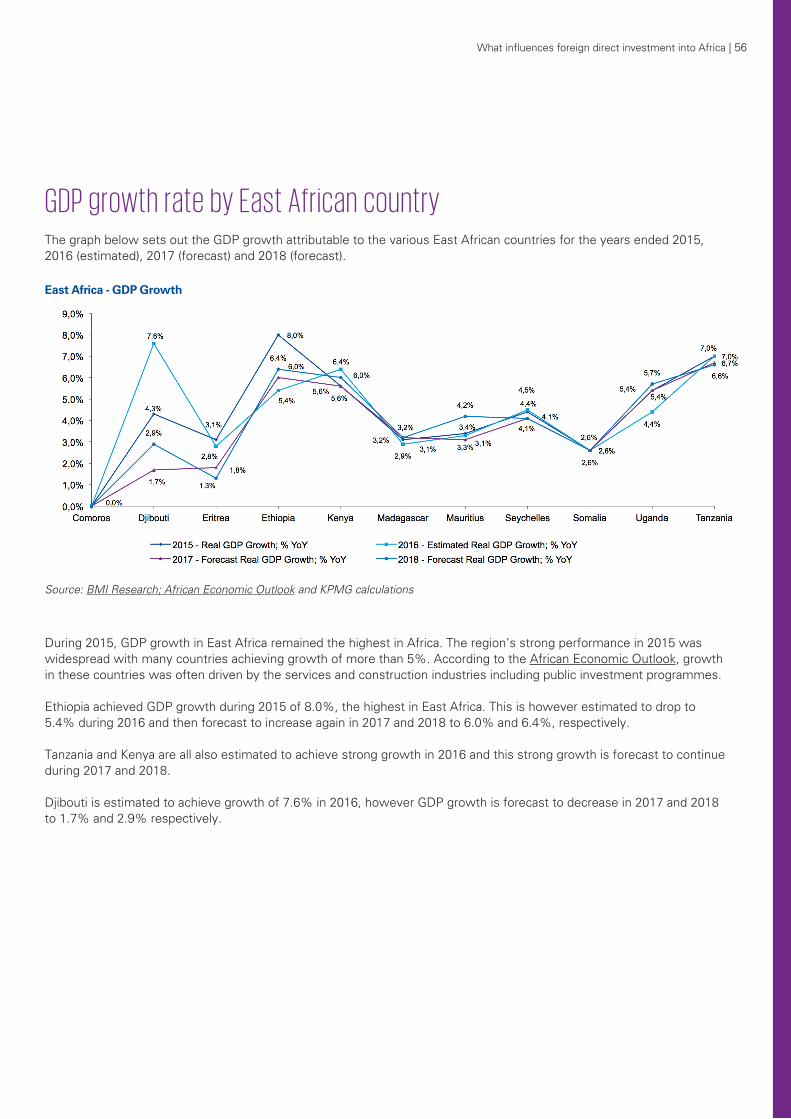
What influences foreign direct investment into Africa | 56
GDP growth rate by East African country The graph below sets out the GDP growth attributable to the various East African countries for the years ended 2015, 2016 (estimated), 2017 (forecast) and 2018 (forecast).
Source: BMI Research; African Economic Outlook and KPMG calculations
During 2015, GDP growth in East Africa remained the highest in Africa. The region’s strong performance in 2015 was widespread with many countries achieving growth of more than 5%. According to the African Economic Outlook, growth in these countries was often driven by the services and construction industries including public investment programmes.
Ethiopia achieved GDP growth during 2015 of 8.0%, the highest in East Africa. This is however estimated to drop to 5.4% during 2016 and then forecast to increase again in 2017 and 2018 to 6.0% and 6.4%, respectively.
Tanzania and Kenya are all also estimated to achieve strong growth in 2016 and this strong growth is forecast to continue during 2017 and 2018.
Djibouti is estimated to achieve growth of 7.6% in 2016, however GDP growth is forecast to decrease in 2017 and 2018 to 1.7% and 2.9% respectively.
East Africa - GDP Growth
57 | What influences foreign direct investment into Africa
Conclusion
Djibouti FDI inflows to Djibouti dropped by 19% during 2015 to US$124 million, however, FDI inflows over the last five years have increased by 57%. Additionally, the value of announced Greenfield FDI projects to Djibouti during 2015 increased by 90% to US$540 million.
Djibouti ranked 40th out of 53 African destinations in the Where to invest in Africa Report, 2016 - 2017, an effective ranking of 25% (23% in 2014). Djibouti’s rankings in the Ease of Doing Business Survey, 2016 and Corruption Perspective Index, 2016 are moderately poor at 10% and 30%, respectively. Economic development in Djibouti is slowed down by high electricity costs, high unemployment, an unskilled workforce and regional instability. An Independent Power Production law announced in 2015 has led to a surge of interest from foreign firms, with a number of ongoing negotiations for energy generation projects, including green and hydrocarbon technologies.
Djibouti is estimated to achieve growth of 7.6% in 2016. The forecast GDP growth in Djibouti is attributable to FDI, increased port activity and changes in the tax and labour codes. However GDP growth is forecast to decrease in 2017 and 2018 to 1.7% and 2.9% respectively.
Ethiopia
FDI inflows to Ethiopia between 2014 and 2015 increased by 2% to US$2 168 million. FDI inflows to Ethiopia have increased by 246% during the five years ended 2015. The value of announced Greenfield FDI projects into Ethiopia during 2015 was US$1 751 million, this is a 37% decline from the value of announced Greenfield FDI projects into the country during 2014. Competitive labour, strategic location, a good national airline, competitive costs in the energy sector and the growing consumer market are key factors that make Ethiopia attractive to investors. Ethiopia has been the recipient of a sizable portion of the FDI inflows to East Africa due to the opportunities in the textile industry. Tax incentives for investment in significant sectors including, the manufacturing, textiles, sugar, chemicals and pharmaceutical and mineral and metal processing sectors highlight the importance of FDI to the country. Ethiopia has an attractive ranking in the Where to Invest in Africa Report, 2016 - 2017. Ethiopia is attractive to investors due to the high growth rates and perceived opportunities despite the relatively high corruption and challenging business environment.
Ethiopia ranked 7th out of 53 African countries in the Where to invest in Africa Report, 2016 - 2017, an effective ranking of 87%. Ethiopia’s rankings in the Ease of Doing Business Survey, 2016 and Corruption Perspective Index, 2016 are poor at 16% and 39%, respectively. Ethiopia’s ranking in the Policy Perception Index, 2015 is 56%, however, this is a significant improvement from their prior year ranking of 7%. Ethiopia ranks 56th out of the 109 countries surveyed, in the Best Practices Mineral Potential Index, 2015 which equates to an attractiveness score of 49%.
Ethiopia is estimated to achieve GDP growth of 5.4% in 2016 and this is forecast to increase to 6.0% in 2017 and 6.4% in 2018.
Ethiopia has a very active political environment although it has become more stable subsequent to the post-election violence which occurred after the 2005 elections. The 2010 elections were won by the ruling Ethiopian People’s Revolutionary Democratic Front (EPRDF) which has been in power since 1991. The elections were considered, by international observers, to be generally peaceful.
What influences foreign direct investment into Africa | 58
Kenya Kenya received 18% of the total FDI inflows to East Africa during 2015, amounting to approximately US$1 437 million. Kenya’s FDI inflows increased by 37% in 2015 compared to the prior year and by 329% over the last five years. Kenya is the biggest economy in East Africa and is considered to be a gateway into the region. This fact, combined with the positive factors outlined below, are encouraging investment into Kenya despite the security and corruption factors and the difficulties in doing business in the country.
Kenya ranked 5th out of 53 African Countries in the Where to Invest in Africa Report, 2016 - 2017, an improvement from 10th position in the prior year. Kenya achieved moderately low scores in the Corruption Perspective Index, 2016 of 18%, Policy Perception Index, 2015 of 23% and the Best Practices Mineral Potential Index, 2015 of 3%. Kenya’s ranking in the Ease of Doing Business Survey, 2016 increased to 52% in 2016 from 43% in 2015 due to improvements in the following areas: starting a business; getting electricity; registering property; protecting minority investors; and resolving insolvency.
Kenya’s estimated GDP growth for 2016 is 6.4%. Kenya is forecast to grow at 5.6% for 2017 and 6.0% for 2018. Kenya’s GDP growth is being supported by a strong macroeconomic environment, a stable inflation and exchange rate, improvements in infrastructure and strong performance by the non-tourism sector. Opportunities exist in the country in the energy, telecommunications, extractives, transportation, infrastructure, light manufacturing, retail, technology, health care, mobile banking, and financial industries.
Kenya’s security environment has been seriously impacted by terrorist attacks in recent years and this has had a significant impact on tourism in the country.
Mauritius
FDI inflows to Mauritius were small during 2015, at US$208 million, only 3% of total FDI inflows to East Africa. FDI inflows to the country decreased by 50% year on year and by 52% over the last 5 years. The value of announced Greenfield FDI projects to Mauritius decreased by 77% during 2015, to US$77 million. Mauritius is a useful “springboard” into Africa, with low political risk, a stable financial sector and good infrastructure. Mauritius has a diversified economy driven by export-oriented manufacturing, tourism, and financial and business services.
Mauritius achieved a ranking of 74% in the Where to Invest in Africa Report, 2016 - 2017 and rankings of 74% and 72%, respectively, in the Ease of Doing Business Survey, 2016 and the Corruption Perspective Index, 2016. It was not covered in the Policy Perception Index, 2015.
Mauritius achieved GDP growth of 3.4% in 2015 and this is estimated to decrease to 3.3% during 2016. Growth is forecast to slightly decline again during 2017 and then increase to 4.2% in 2018. GDP growth in 2015 was boosted by tourism.
Mauritius is considered to be one of Africa’s most stable democracies.
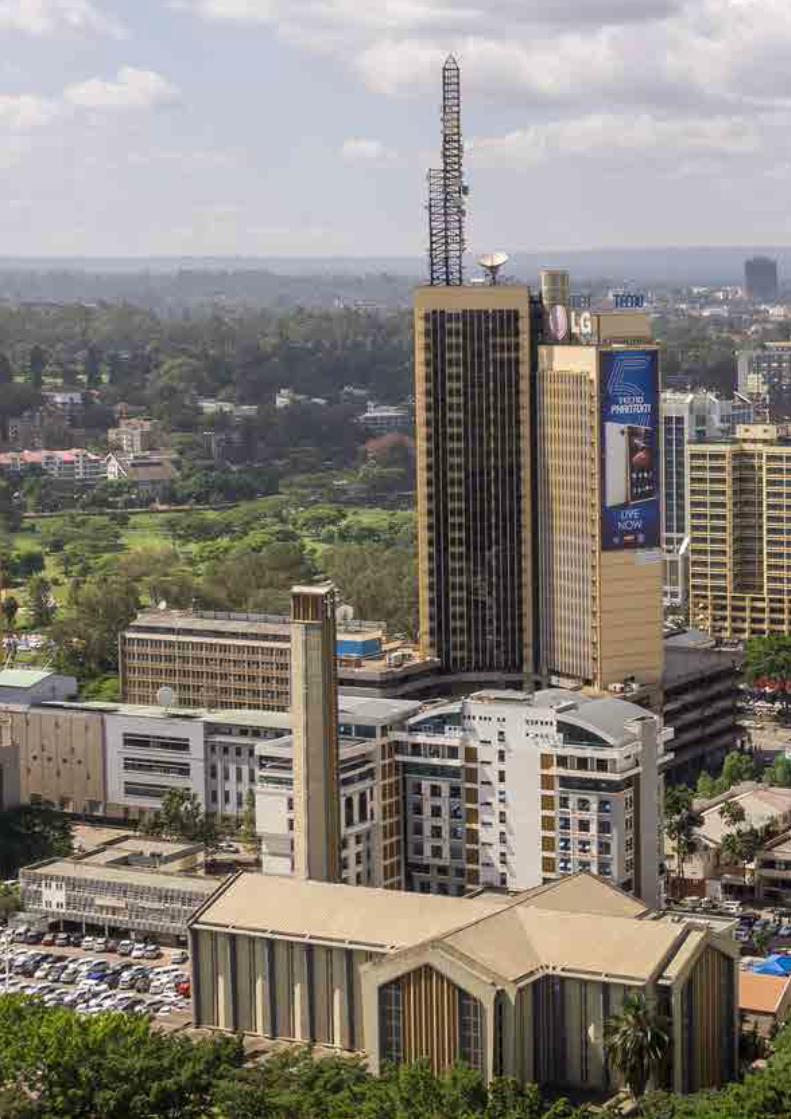
59 | What influences foreign direct investment into Africa
What influences foreign direct investment into Africa | 60
Uganda Uganda, with FDI inflows of US$1 057 million, is the fourth highest recipient of FDI inflows into East Africa. There was no movement in FDI inflows to Uganda year on year but FDI inflows have increased by 18% during the past five years. The value of announced Greenfield projects to Uganda during 2015 increased by 992% to US$4 653 million. Uganda has severe infrastructure shortfalls which make doing business in the country difficult. Uganda’s top agriculture exports include, coffee, tea, tobacco and cotton and other significant exports include fish, flowers and horticultural produce. High transportation costs and inadequate and unreliable power supply are two obstacles faced by the country.
Uganda is ranked 15th out of 53 countries in the Where to invest in Africa report, 2016 - 2017. Uganda achieved a low ranking in the Corruption Perspective Index, 2016 of 14% and a moderately low ranking in the Ease of Doing Business Survey, 2016 of 39% (an increase from 35% in 2015).
Uganda’s GDP growth for 2015 is 5.4% and is estimated to decrease to 4.4% in 2016 and then forecast to increase to 5.4% and 5.7%, respectively for 2017 and 2018. Growth was impacted by high energy costs, poor infrastructure, inflation and high interest rates.
Uganda remains a stable democracy and this is expected to continue in the medium-term. However, according to the Investment Climate Statements for 2016, National elections held on February 18, 2016 fell short of international standards, according to most international and domestic election observer missions. Projects managed by the Government of Uganda are hampered by a sluggish bureaucracy with a non-transparent decision-making process.
Tanzania
Tanzania received 20% of the FDI inflows to East Africa during 2015, amounting to US$1 532 million, making Tanzania the second highest recipient of FDI inflows to East Africa. FDI inflows to Tanzania decreased by 25% year on year but have increased by 25% during the past five years. The value of announced Greenfield projects to Tanzania during 2015 increased by 140% to US$1 365 million.
Tanzania achieved rankings in the Corruption Perspective Index, 2016 and Ease of Doing Business Survey, 2016 of 30% and 34%, respectively. Uganda achieved a ranking of 42% in the Policy Perception Index, 2015 and 35% in the Best Practices Mineral Potential Index, 2015.
Tanzania achieved GDP growth of 7.0% for 2015 and this is estimated to remain constant for 2016. GDP growth is forecast at 6.7% for 2017 and 6.6% for 2018. This growth is due to a relatively stable political environment, reasonable macroeconomic policies and structural reform.
The political situation in Tanzania and Zanzibar is currently stable.
What does this mean? Productive FDI inflows to East Africa only declined by 2% during 2015 due to strong investment into Ethiopia and Kenya, specifically in the area of manufacturing. According to the UNCTAD Global Investment Trends Monitor No. 25 1 February 2017, there was a decrease of 9% in the value of manufacturing projects across all industries, from a global perspective, during 2016. GDP growth in East Africa was the highest in Africa and this is estimated to continue, albeit, at a lower growth rate. In light of the decline in global FDI flows of 13% during 2016, and the decline in announced Greenfield FDI manufacturing projects across all industries during 2016, East African countries need to continue to focus on improving the business environments in their countries and make boosting domestic and foreign investment key policy priorities.
61 | What influences foreign direct investment into Africa
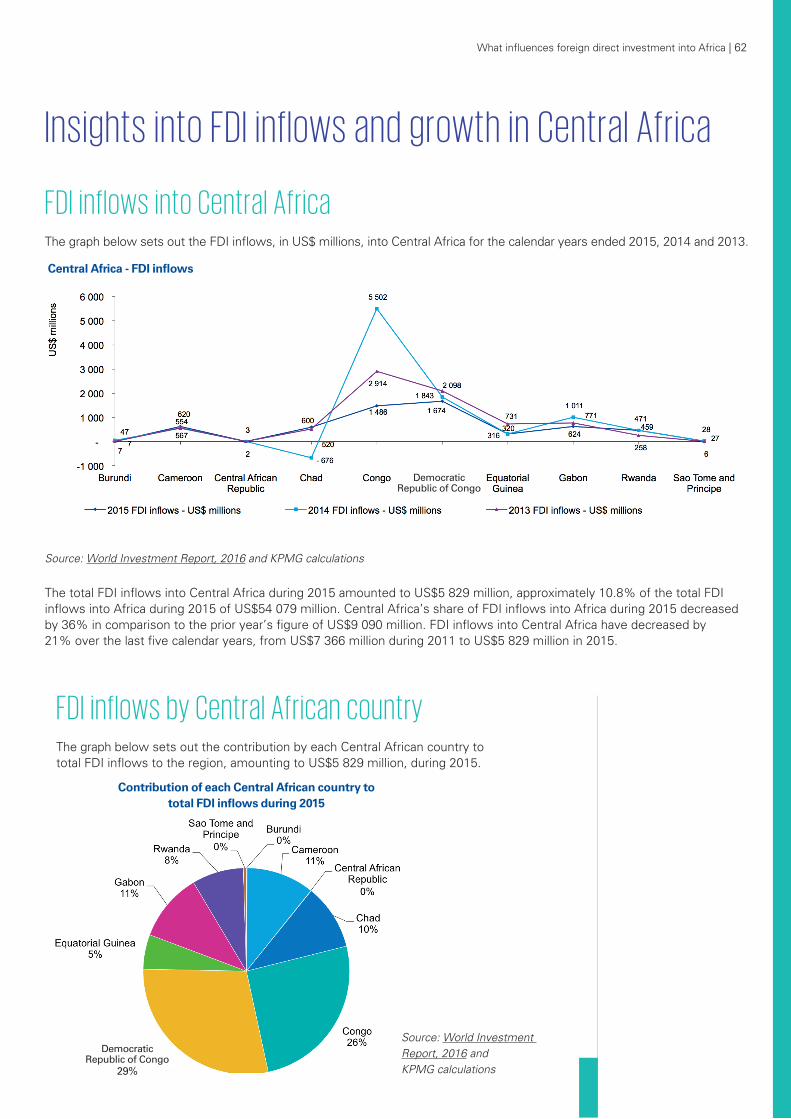
What influences foreign direct investment into Africa | 62
Insights into FDI inflows and growth in Central Africa FDI inflows into Central Africa The graph below sets out the FDI inflows, in US$ millions, into Central Africa for the calendar years ended 2015, 2014 and 2013.
Source: World Investment Report, 2016 and KPMG calculations
The total FDI inflows into Central Africa during 2015 amounted to US$5 829 million, approximately 10.8% of the total FDI inflows into Africa during 2015 of US$54 079 million. Central Africa’s share of FDI inflows into Africa during 2015 decreased by 36% in comparison to the prior year’s figure of US$9 090 million. FDI inflows into Central Africa have decreased by 21% over the last five calendar years, from US$7 366 million during 2011 to US$5 829 million in 2015.
FDI inflows by Central African country The graph below sets out the contribution by each Central African country to total FDI inflows to the region, amounting to US$5 829 million, during 2015.
Source: World Investment Report, 2016 and KPMG calculations
Central Africa - FDI inflows
Democratic Republic of Congo
Democratic Republic of Congo
29%
Contribution of each Central African country to total FDI inflows during 2015
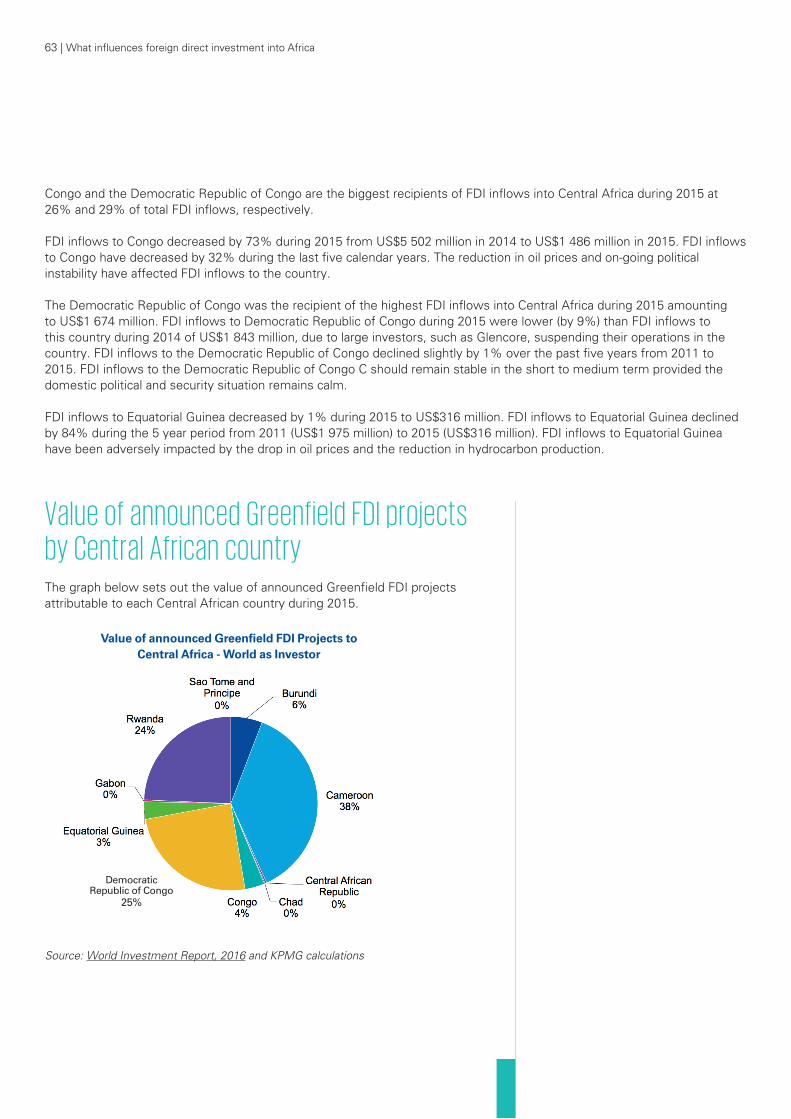
63 | What influences foreign direct investment into Africa
Congo and the Democratic Republic of Congo are the biggest recipients of FDI inflows into Central Africa during 2015 at 26% and 29% of total FDI inflows, respectively.
FDI inflows to Congo decreased by 73% during 2015 from US$5 502 million in 2014 to US$1 486 million in 2015. FDI inflows to Congo have decreased by 32% during the last five calendar years. The reduction in oil prices and on-going political instability have affected FDI inflows to the country.
The Democratic Republic of Congo was the recipient of the highest FDI inflows into Central Africa during 2015 amounting to US$1 674 million. FDI inflows to Democratic Republic of Congo during 2015 were lower (by 9%) than FDI inflows to this country during 2014 of US$1 843 million, due to large investors, such as Glencore, suspending their operations in the country. FDI inflows to the Democratic Republic of Congo declined slightly by 1% over the past five years from 2011 to 2015. FDI inflows to the Democratic Republic of Congo C should remain stable in the short to medium term provided the domestic political and security situation remains calm.
FDI inflows to Equatorial Guinea decreased by 1% during 2015 to US$316 million. FDI inflows to Equatorial Guinea declined by 84% during the 5 year period from 2011 (US$1 975 million) to 2015 (US$316 million). FDI inflows to Equatorial Guinea have been adversely impacted by the drop in oil prices and the reduction in hydrocarbon production.
Value of announced Greenfield FDI projects by Central African country The graph below sets out the value of announced Greenfield FDI projects attributable to each Central African country during 2015.
Source: World Investment Report, 2016 and KPMG calculations
Democratic Republic of Congo
25%
Value of announced Greenfield FDI Projects to Central Africa - World as Investor
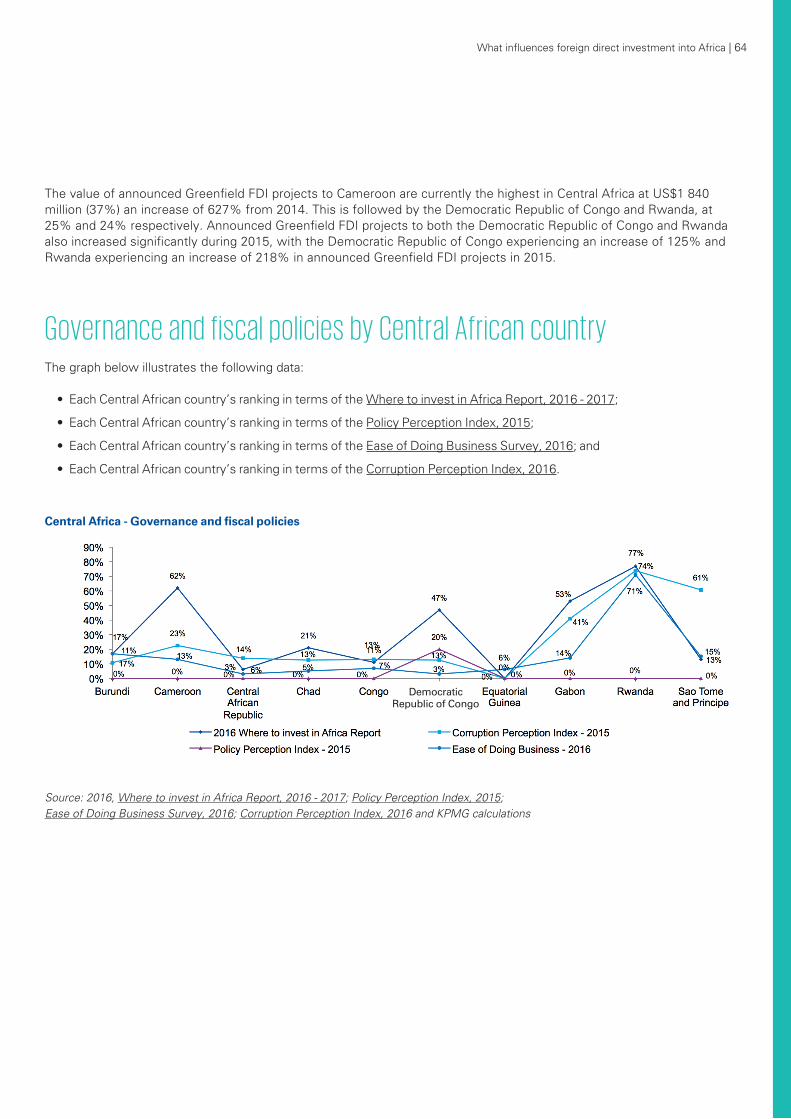
What influences foreign direct investment into Africa | 64
The value of announced Greenfield FDI projects to Cameroon are currently the highest in Central Africa at US$1 840 million (37%) an increase of 627% from 2014. This is followed by the Democratic Republic of Congo and Rwanda, at 25% and 24% respectively. Announced Greenfield FDI projects to both the Democratic Republic of Congo and Rwanda also increased significantly during 2015, with the Democratic Republic of Congo experiencing an increase of 125% and Rwanda experiencing an increase of 218% in announced Greenfield FDI projects in 2015.
Source: 2016, Where to invest in Africa Report, 2016 - 2017; Policy Perception Index, 2015; Ease of Doing Business Survey, 2016; Corruption Perception Index, 2016 and KPMG calculations
Governance and fiscal policies by Central African country The graph below illustrates the following data:
• Each Central African country’s ranking in terms of the Where to invest in Africa Report, 2016 - 2017;
• Each Central African country’s ranking in terms of the Policy Perception Index, 2015;
• Each Central African country’s ranking in terms of the Ease of Doing Business Survey, 2016; and
• Each Central African country’s ranking in terms of the Corruption Perception Index, 2016.
Central Africa - Governance and fiscal policies
Democratic Republic of Congo
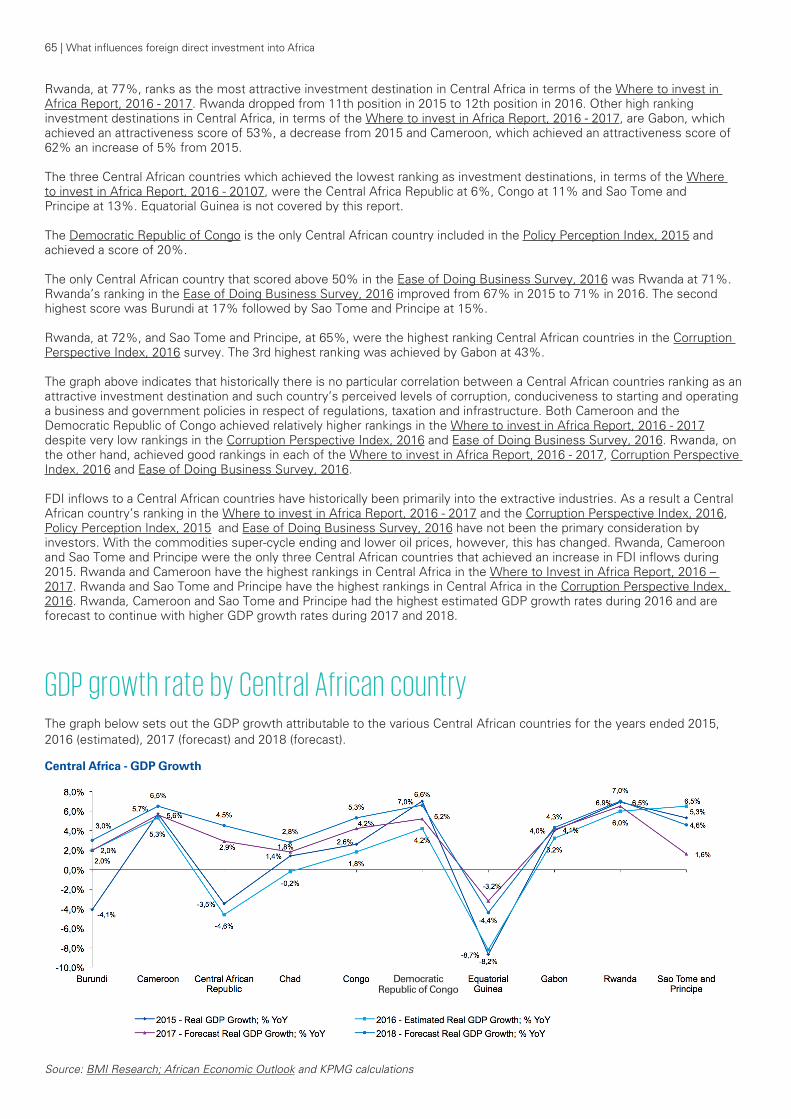
65 | What influences foreign direct investment into Africa
Rwanda, at 77%, ranks as the most attractive investment destination in Central Africa in terms of the Where to invest in Africa Report, 2016 - 2017. Rwanda dropped from 11th position in 2015 to 12th position in 2016. Other high ranking investment destinations in Central Africa, in terms of the Where to invest in Africa Report, 2016 - 2017, are Gabon, which achieved an attractiveness score of 53%, a decrease from 2015 and Cameroon, which achieved an attractiveness score of 62% an increase of 5% from 2015.
The three Central African countries which achieved the lowest ranking as investment destinations, in terms of the Where to invest in Africa Report, 2016 - 20107, were the Central Africa Republic at 6%, Congo at 11% and Sao Tome and Principe at 13%. Equatorial Guinea is not covered by this report.
The Democratic Republic of Congo is the only Central African country included in the Policy Perception Index, 2015 and achieved a score of 20%.
The only Central African country that scored above 50% in the Ease of Doing Business Survey, 2016 was Rwanda at 71%. Rwanda’s ranking in the Ease of Doing Business Survey, 2016 improved from 67% in 2015 to 71% in 2016. The second highest score was Burundi at 17% followed by Sao Tome and Principe at 15%.
Rwanda, at 72%, and Sao Tome and Principe, at 65%, were the highest ranking Central African countries in the Corruption Perspective Index, 2016 survey. The 3rd highest ranking was achieved by Gabon at 43%.
The graph above indicates that historically there is no particular correlation between a Central African countries ranking as an attractive investment destination and such country’s perceived levels of corruption, conduciveness to starting and operating a business and government policies in respect of regulations, taxation and infrastructure. Both Cameroon and the Democratic Republic of Congo achieved relatively higher rankings in the Where to invest in Africa Report, 2016 - 2017 despite very low rankings in the Corruption Perspective Index, 2016 and Ease of Doing Business Survey, 2016. Rwanda, on the other hand, achieved good rankings in each of the Where to invest in Africa Report, 2016 - 2017, Corruption Perspective Index, 2016 and Ease of Doing Business Survey, 2016.
FDI inflows to a Central African countries have historically been primarily into the extractive industries. As a result a Central African country’s ranking in the Where to invest in Africa Report, 2016 - 2017 and the Corruption Perspective Index, 2016, Policy Perception Index, 2015 and Ease of Doing Business Survey, 2016 have not been the primary consideration by investors. With the commodities super-cycle ending and lower oil prices, however, this has changed. Rwanda, Cameroon and Sao Tome and Principe were the only three Central African countries that achieved an increase in FDI inflows during 2015. Rwanda and Cameroon have the highest rankings in Central Africa in the Where to Invest in Africa Report, 2016 – 2017. Rwanda and Sao Tome and Principe have the highest rankings in Central Africa in the Corruption Perspective Index, 2016. Rwanda, Cameroon and Sao Tome and Principe had the highest estimated GDP growth rates during 2016 and are forecast to continue with higher GDP growth rates during 2017 and 2018.
GDP growth rate by Central African country The graph below sets out the GDP growth attributable to the various Central African countries for the years ended 2015, 2016 (estimated), 2017 (forecast) and 2018 (forecast).
Source: BMI Research; African Economic Outlook and KPMG calculations
Central Africa - GDP Growth
Democratic Republic of Congo
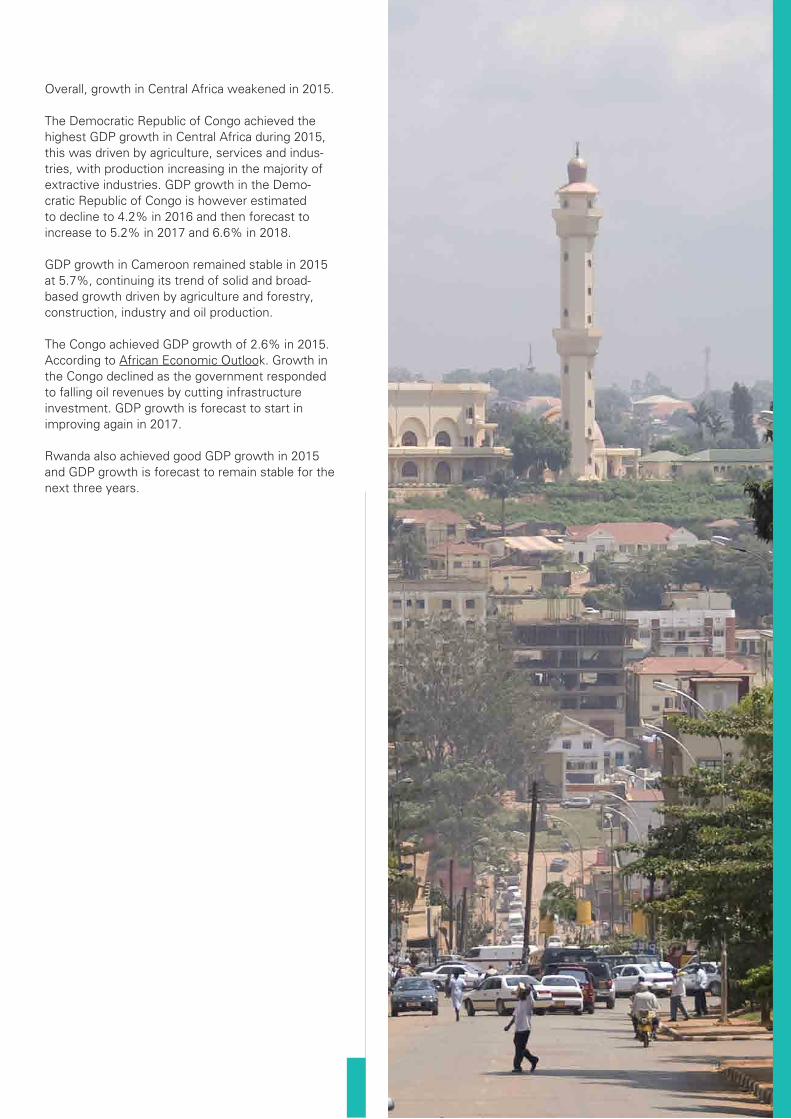
What influences foreign direct investment into Africa | 66
Overall, growth in Central Africa weakened in 2015.
The Democratic Republic of Congo achieved the highest GDP growth in Central Africa during 2015, this was driven by agriculture, services and indus-tries, with production increasing in the majority of extractive industries. GDP growth in the Demo-cratic Republic of Congo is however estimated to decline to 4.2% in 2016 and then forecast to increase to 5.2% in 2017 and 6.6% in 2018.
GDP growth in Cameroon remained stable in 2015 at 5.7%, continuing its trend of solid and broad-based growth driven by agriculture and forestry, construction, industry and oil production.
The Congo achieved GDP growth of 2.6% in 2015. According to African Economic Outlook. Growth in the Congo declined as the government responded to falling oil revenues by cutting infrastructure investment. GDP growth is forecast to start in improving again in 2017.
Rwanda also achieved good GDP growth in 2015 and GDP growth is forecast to remain stable for the next three years.
Conclusion
Cameroon Cameroon received FDI inflows during 2015 amounting to US$620 million, an increase of 12% from 2014. Over the past five years ended 2015, FDI inflows to Cameroon have increased by 75%. The value of announced Greenfield projects to Cameroon during 2015 amounted to US%1 840 million, an increase of 627% from the prior year.
Cameroon ranked 20th out of 53 African countries in the Where to invest in Africa Report, 2016 - 2017, an effective ranking of 62%, improving from being ranked at 23rd in 2015. Cameroon achieved poor scores in the Ease of Doing Business Survey, 2016 and Corruption Perspective Index, 2016, achieving an effective ranking of 13% and 18%, respectively. FDI inflows to Cameroon are slowly improving, despite its low rankings in the Ease of Doing Business Survey, 2016 and Corruption Perspective Index, 2016. Cameroon is faced with many challenges including corruption, political transition, reduction in oil prices, security concerns and unemployment. However, despite these challenges, there are opportunities that exist in the transport, energy, communication, mining and construction sectors.
Cameroon is forecast to achieve GDP growth of 5.6% in 2017 and 6.5% in 2018. Forecast GDP growth in Cameroon is one of the highest in Central Africa, despite the collapse of oil prices. The government of Cameroon is seeking FDI to develop and improve vital economic infrastructure in the region and have laws in place to encourage FDI in the country.
Chad
Chad achieved FDI inflows in 2015 of US$600 million, this is an improvement from 2014 where Chad had an FDI outflow of US$676 million. Chad had an increase in FDI inflows between 2011 and 2015 of 113%. The value of announced Greenfield FDI projects into Chad decreased by 98% during 2015.
Chad’s ranking in the Where to invest in Africa Report, 2016 - 2017 dropped from 34th in 2015 to 42nd in 2016. Chad’s rankings in the Ease of Doing Business Survey, 2016 and Corruption Perspective Index, 2016 are poor at 5% and 10%, respectively.
Chad is estimated have a negative GDP growth of 0.2% in 2016, however GDP growth is forecast to increase again to 1.8% in 2017 and 2.8% in 2018. The economic growth of Chad is very sensitive to oil price fluctuations and the recent collapse of oil prices, as well as security concerns have impacted growth in the country.
FDI inflows to Chad are increased despite its drop in ranking in the Where to invest in Africa Report, 2016 - 2017 and low rankings in the Ease of Doing Business Survey, 2016 and Corruption Perspective Index, 2016.There are opportunities in the agriculture and livestock breeding sectors and the Government of Chad have prioritised these sectors in an effort to diversify the economy and to maximize non-petroleum tax receipts in the wake of the drop in oil prices.
What influences foreign direct investment into Africa | 68
Congo FDI inflows to the Congo in 2015 amounted to US$1 486 million, a decline of 73% from 2014. FDI inflows to the Congo have declined by 32% over the past five between 2011 and 2015. The value of announced Greenfield FDI projects into Congo also decreased by 89% during 2015 to US$180 million.
Congo ranked 47th out of 53 countries in the Where to invest in Africa Report, 2016 - 2017, an effective ranking of 11%. Congo’s rankings in the Ease of Doing Business Survey, 2016 and Corruption Perspective Index, 2016 are poor at 7% and 10%, respectively.
It is estimated that Congo will achieve GDP growth of 1.8% in 2016, a decline compared to GDP growth in 2015. Growth is forecast to increase to 4.2% in 2017 and 5.3% in 2018.
Congo is forecast to achieve moderate GDP growth rates for 2017 and 2018. Despite its low rankings in the Corruption Perspective Index, 2016 and Ease of Doing Business Survey, 2016, Congo is achieving the second highest FDI inflows in Central Africa of US$1 486 million. Congo is faced with challenges including political stability and security risks. The economy is dependent on oil and as a result of the crash in the oil prices, growth and FDI inflows to the country have been adversely affected.
The Democratic Republic of Congo FDI inflows to the Democratic Republic of Congo in 2015 were the highest in Central Africa at 29% of total FDI inflows to the region. The value of announced Greenfield FDI projects into the Democratic Republic of Congo amounted to US$1 217 million, an increase of 125% from 2014.
The Democratic Republic of Congo achieved extremely low scores in the Policy Perception Index, 2015 (20%), Corruption Perspective Index, 2016 (11%) and Ease of Doing Business Survey, 2016 (3%), which are among the lowest scores in the region. The country is ranked 28th out of 53 countries in the Where to invest in Africa Report, 2016 - 2017.
The Democratic Republic of Congo is estimated to achieve GDP growth of 4.2% in 2016 and GDP growth is forecast at 5.2% in 2017 and 6.6% in 2018.
The high economic growth in the Democratic Republic of Congo is being driven by the extractive and manufacturing industries as well as agriculture, commerce and construction. The Democratic Republic of Congo achieved FDI inflows amounting to US$1 674 million during 2015 despite the extremely low scores achieved by the Democratic Republic of Congo in the Policy Perception Index, 2015, Corruption Perspective Index, 2016 and Ease of Doing Business Survey, 2016. The Democratic Republic of Congo ranks 60th out of 109 countries in terms of the Investment Attractiveness Index, 2015, which is an effective ranking of 45%. The Democratic Republic of Congo ranks 26th out of the 109 countries surveyed, in the Best Practices Mineral Potential Index, 2015 which equates to an attractiveness score of 76%. As a result, investors are prepared to invest into the Democratic Republic of Congo despite the political and corruption factors, the security situation, the impact of low global commodity prices and the difficulties in doing business in the country.
69 | What influences foreign direct investment into Africa
Rwanda
Rwanda received lower FDI inflows than those Central African countries that have outstanding extractive industries resources, however, it should be noted that FDI inflows to Rwanda have been increasing slowly but steadily over the past five years from US$119 million in 2011 to US$471 million in 2015, a 296% increase. The value of announced Greenfield FDI projects into Rwanda increased by 141% during 2015 to US$1 197 million.
Rwanda achieved the highest scores in the Where to invest in Africa Report, 2016 - 2017, Corruption Perspective Index, 2016 and Ease of Doing Business Survey, 2016, in Central Africa at 77%, 72% and 71%, respectively, and amended a law during 2014, thereby providing for a broader variety in the duration of mining licenses. In addition, the government has prioritised a public investment programme into transport and energy infrastructure with the aim of reducing congestion in the transport and energy sectors and bolstering economic growth.
Rwanda’s GDP growth for 2015 was 6.9% and the country was among the fastest-growing countries in the world. GDP growth is estimated at 6.0% in 2016 and forecast at 6.5% and 7.0%, respectively for 2017 and 2018.
Rwanda has become a stable democracy since the end of the civil war in 1994 with the ruling Rwandan Patriotic Front continuing to dominate the political landscape.
What does this mean? Based on the findings disclosed in the UNCTAD Global Investment Trends Mintor reports No.s 24 and 25, investment into the natural resources sector dropped significantly during 2016 and this situation is expected to continue during 2017. Central African countries that are primarily focused on natural resources can, therefore, expect to continue to see a decline in FDI inflows to their countries. Terrorism was also cited in these reports as a significant deterrent to FDI inflows. The rankings of Central African countries (those that are included) in the Overall Global Competitiveness Index, 2016 – 2017 are very low, with the exception of Rwanda. Rwanda was one of five Sub-Saharan African countries that increased its ranking in the Overall Global Competitiveness Index, 2016 – 2017.
Central African countries need to focus on improving the business environments, corruption and security situations in their countries in order to attract a share of the reduced global FDI inflows as well as consider their investment policy making. Rwanda has introduced investment promotion policies to attract Greenfield FDI to this country and this should continue to bear fruit for Rwanda.
71 | What influences foreign direct investment into Africa
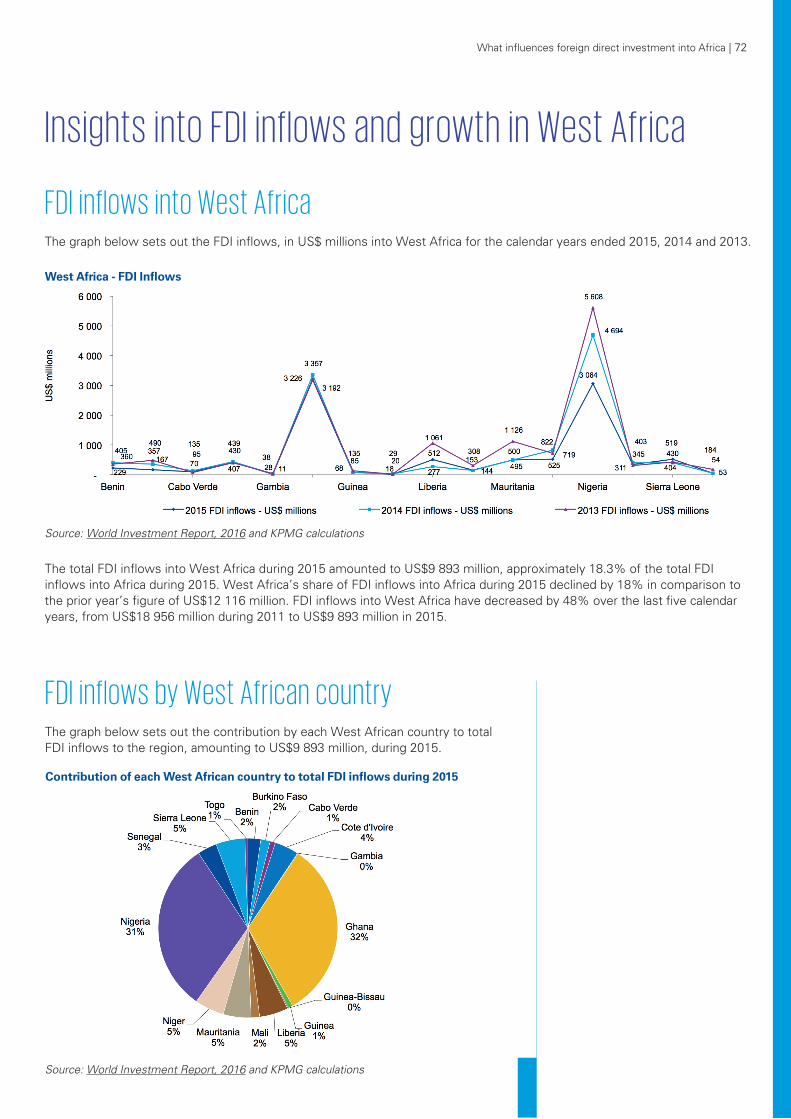
What influences foreign direct investment into Africa | 72
Insights into FDI inflows and growth in West Africa FDI inflows into West Africa The graph below sets out the FDI inflows, in US$ millions into West Africa for the calendar years ended 2015, 2014 and 2013.
Source: World Investment Report, 2016 and KPMG calculations
The total FDI inflows into West Africa during 2015 amounted to US$9 893 million, approximately 18.3% of the total FDI inflows into Africa during 2015. West Africa’s share of FDI inflows into Africa during 2015 declined by 18% in comparison to the prior year’s figure of US$12 116 million. FDI inflows into West Africa have decreased by 48% over the last five calendar years, from US$18 956 million during 2011 to US$9 893 million in 2015.
FDI inflows by West African country The graph below sets out the contribution by each West African country to total FDI inflows to the region, amounting to US$9 893 million, during 2015.
Source: World Investment Report, 2016 and KPMG calculations
West Africa - FDI Inflows
Contribution of each West African country to total FDI inflows during 2015
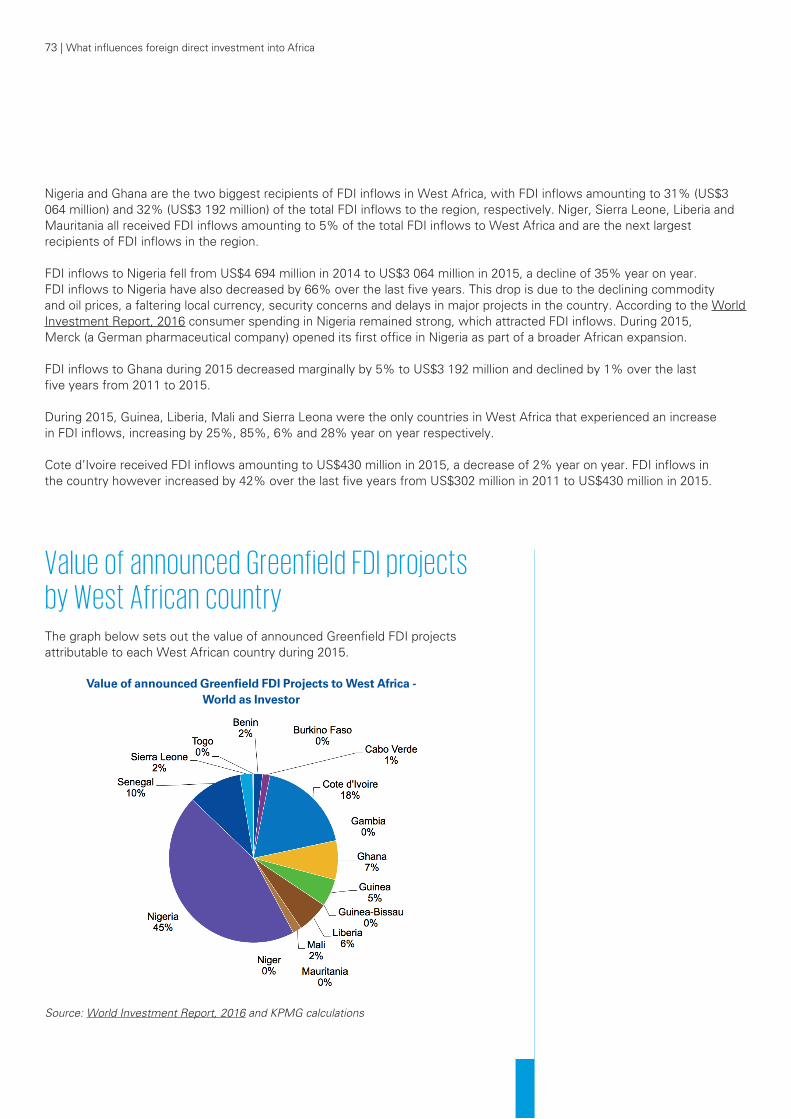
73 | What influences foreign direct investment into Africa
Nigeria and Ghana are the two biggest recipients of FDI inflows in West Africa, with FDI inflows amounting to 31% (US$3 064 million) and 32% (US$3 192 million) of the total FDI inflows to the region, respectively. Niger, Sierra Leone, Liberia and Mauritania all received FDI inflows amounting to 5% of the total FDI inflows to West Africa and are the next largest recipients of FDI inflows in the region.
FDI inflows to Nigeria fell from US$4 694 million in 2014 to US$3 064 million in 2015, a decline of 35% year on year. FDI inflows to Nigeria have also decreased by 66% over the last five years. This drop is due to the declining commodity and oil prices, a faltering local currency, security concerns and delays in major projects in the country. According to the World Investment Report, 2016 consumer spending in Nigeria remained strong, which attracted FDI inflows. During 2015, Merck (a German pharmaceutical company) opened its first office in Nigeria as part of a broader African expansion.
FDI inflows to Ghana during 2015 decreased marginally by 5% to US$3 192 million and declined by 1% over the last five years from 2011 to 2015.
During 2015, Guinea, Liberia, Mali and Sierra Leona were the only countries in West Africa that experienced an increase in FDI inflows, increasing by 25%, 85%, 6% and 28% year on year respectively.
Cote d’Ivoire received FDI inflows amounting to US$430 million in 2015, a decrease of 2% year on year. FDI inflows in the country however increased by 42% over the last five years from US$302 million in 2011 to US$430 million in 2015.
Value of announced Greenfield FDI projects by West African country The graph below sets out the value of announced Greenfield FDI projects attributable to each West African country during 2015.
Source: World Investment Report, 2016 and KPMG calculations
Value of announced Greenfield FDI Projects to West Africa - World as Investor
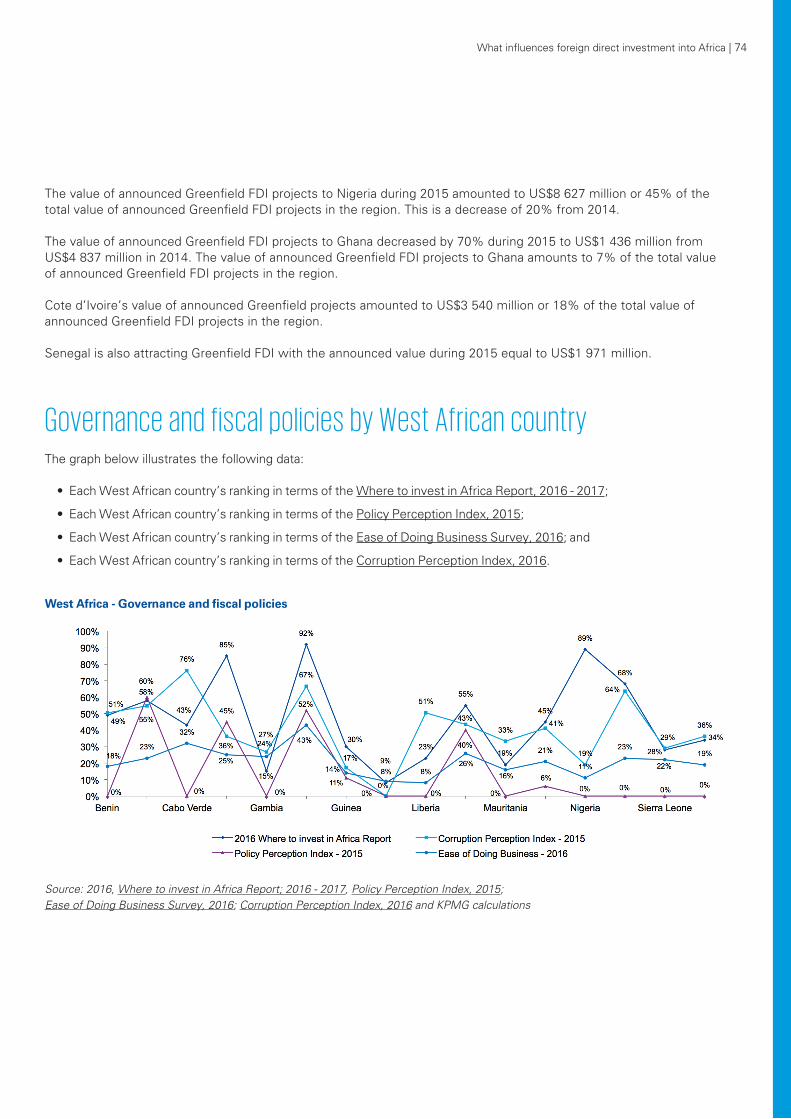
What influences foreign direct investment into Africa | 74
The value of announced Greenfield FDI projects to Nigeria during 2015 amounted to US$8 627 million or 45% of the total value of announced Greenfield FDI projects in the region. This is a decrease of 20% from 2014.
The value of announced Greenfield FDI projects to Ghana decreased by 70% during 2015 to US$1 436 million from US$4 837 million in 2014. The value of announced Greenfield FDI projects to Ghana amounts to 7% of the total value of announced Greenfield FDI projects in the region.
Cote d’Ivoire’s value of announced Greenfield projects amounted to US$3 540 million or 18% of the total value of announced Greenfield FDI projects in the region.
Senegal is also attracting Greenfield FDI with the announced value during 2015 equal to US$1 971 million.
Governance and fiscal policies by West African country The graph below illustrates the following data:
• Each West African country’s ranking in terms of the Where to invest in Africa Report, 2016 - 2017;
• Each West African country’s ranking in terms of the Policy Perception Index, 2015;
• Each West African country’s ranking in terms of the Ease of Doing Business Survey, 2016; and
• Each West African country’s ranking in terms of the Corruption Perception Index, 2016.
Source: 2016, Where to invest in Africa Report; 2016 - 2017, Policy Perception Index, 2015; Ease of Doing Business Survey, 2016; Corruption Perception Index, 2016 and KPMG calculations
West Africa - Governance and fiscal policies
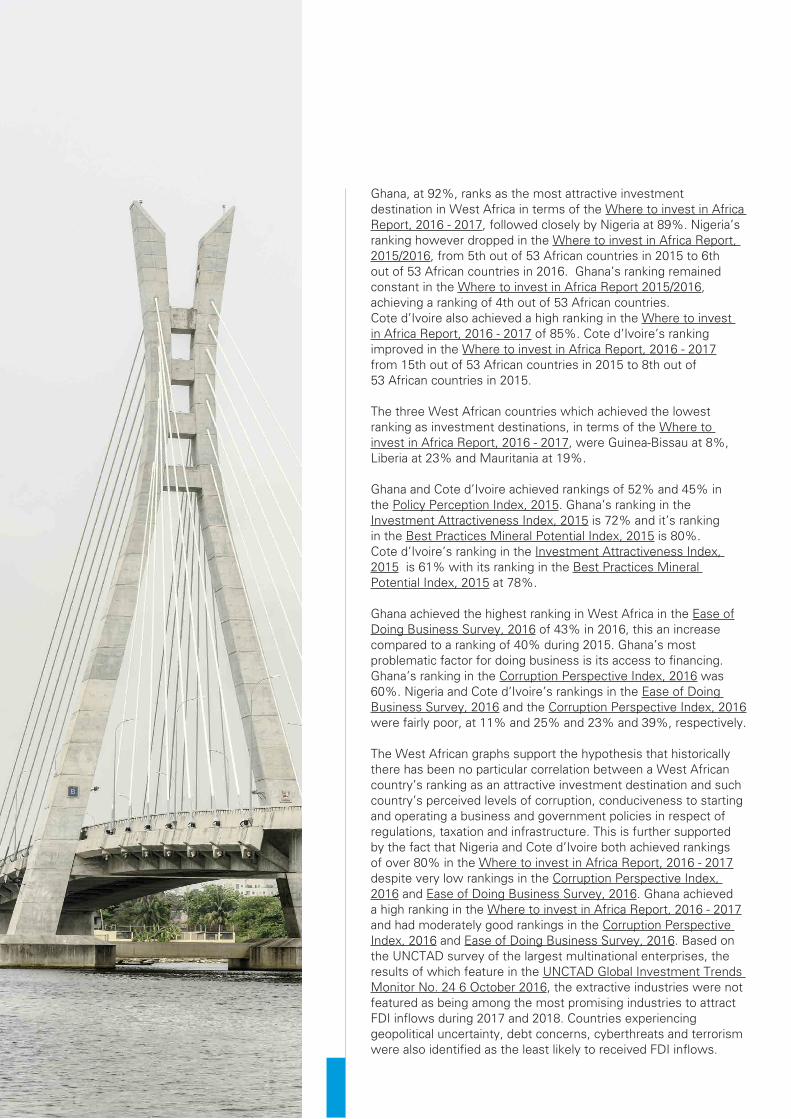
Ghana, at 92%, ranks as the most attractive investment destination in West Africa in terms of the Where to invest in Africa Report, 2016 - 2017, followed closely by Nigeria at 89%. Nigeria’s ranking however dropped in the Where to invest in Africa Report, 2015/2016, from 5th out of 53 African countries in 2015 to 6th out of 53 African countries in 2016. Ghana’s ranking remained constant in the Where to invest in Africa Report 2015/2016, achieving a ranking of 4th out of 53 African countries. Cote d’Ivoire also achieved a high ranking in the Where to invest in Africa Report, 2016 - 2017 of 85%. Cote d’Ivoire’s ranking improved in the Where to invest in Africa Report, 2016 - 2017 from 15th out of 53 African countries in 2015 to 8th out of 53 African countries in 2015.
The three West African countries which achieved the lowest ranking as investment destinations, in terms of the Where to invest in Africa Report, 2016 - 2017, were Guinea-Bissau at 8%, Liberia at 23% and Mauritania at 19%.
Ghana and Cote d’Ivoire achieved rankings of 52% and 45% in the Policy Perception Index, 2015. Ghana’s ranking in the Investment Attractiveness Index, 2015 is 72% and it’s ranking in the Best Practices Mineral Potential Index, 2015 is 80%. Cote d’Ivoire’s ranking in the Investment Attractiveness Index, 2015 is 61% with its ranking in the Best Practices Mineral Potential Index, 2015 at 78%.
Ghana achieved the highest ranking in West Africa in the Ease of Doing Business Survey, 2016 of 43% in 2016, this an increase compared to a ranking of 40% during 2015. Ghana’s most problematic factor for doing business is its access to financing. Ghana’s ranking in the Corruption Perspective Index, 2016 was 60%. Nigeria and Cote d’Ivoire’s rankings in the Ease of Doing Business Survey, 2016 and the Corruption Perspective Index, 2016 were fairly poor, at 11% and 25% and 23% and 39%, respectively.
The West African graphs support the hypothesis that historically there has been no particular correlation between a West African country’s ranking as an attractive investment destination and such country’s perceived levels of corruption, conduciveness to starting and operating a business and government policies in respect of regulations, taxation and infrastructure. This is further supported by the fact that Nigeria and Cote d’Ivoire both achieved rankings of over 80% in the Where to invest in Africa Report, 2016 - 2017 despite very low rankings in the Corruption Perspective Index, 2016 and Ease of Doing Business Survey, 2016. Ghana achieved a high ranking in the Where to invest in Africa Report, 2016 - 2017 and had moderately good rankings in the Corruption Perspective Index, 2016 and Ease of Doing Business Survey, 2016. Based on the UNCTAD survey of the largest multinational enterprises, the results of which feature in the UNCTAD Global Investment Trends Monitor No. 24 6 October 2016, the extractive industries were not featured as being among the most promising industries to attract FDI inflows during 2017 and 2018. Countries experiencing geopolitical uncertainty, debt concerns, cyberthreats and terrorism were also identified as the least likely to received FDI inflows.
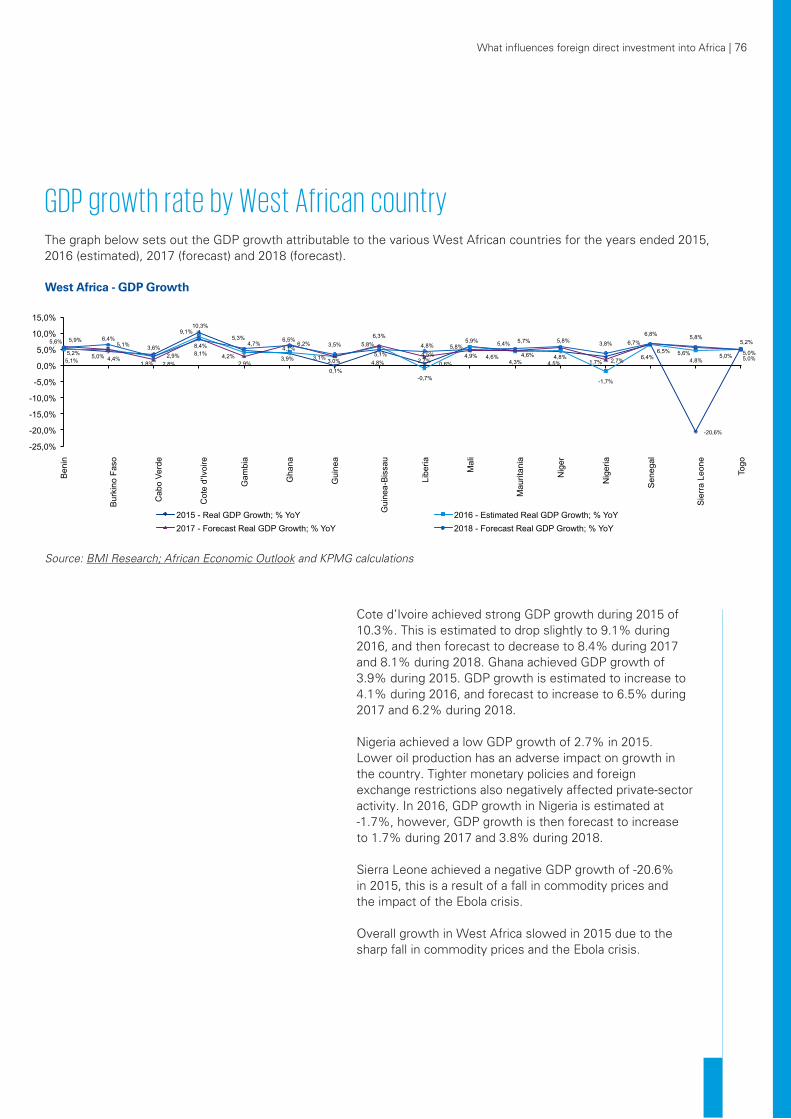
What influences foreign direct investment into Africa | 76
GDP growth rate by West African country The graph below sets out the GDP growth attributable to the various West African countries for the years ended 2015, 2016 (estimated), 2017 (forecast) and 2018 (forecast).
Source: BMI Research; African Economic Outlook and KPMG calculations
Cote d’Ivoire achieved strong GDP growth during 2015 of 10.3%. This is estimated to drop slightly to 9.1% during 2016, and then forecast to decrease to 8.4% during 2017 and 8.1% during 2018. Ghana achieved GDP growth of 3.9% during 2015. GDP growth is estimated to increase to 4.1% during 2016, and forecast to increase to 6.5% during 2017 and 6.2% during 2018.
Nigeria achieved a low GDP growth of 2.7% in 2015. Lower oil production has an adverse impact on growth in the country. Tighter monetary policies and foreign exchange restrictions also negatively affected private-sector activity. In 2016, GDP growth in Nigeria is estimated at -1.7%, however, GDP growth is then forecast to increase to 1.7% during 2017 and 3.8% during 2018.
Sierra Leone achieved a negative GDP growth of -20.6% in 2015, this is a result of a fall in commodity prices and the impact of the Ebola crisis.
Overall growth in West Africa slowed in 2015 due to the sharp fall in commodity prices and the Ebola crisis.
West Africa - GDP Growth
5,2% 4,4%
3,6%
10,3%
4,7%
3,9%
0,1% 4,8% 0,6%
5,9%
4,6% 4,5% 2,7%
6,5%
-20,6%
5,2%
5,1% 5,0%
2,8%
9,1%
4,2% 4,1%
3,0%
5,8%
-0,7%
5,8%
4,3% 4,8%
-1,7%
6,4% 4,8% 5,0%
5,9% 5,1%
1,8%
8,4%
2,9%
6,5%
3,1%
6,3%
2,7%
4,8%
4,6%
5,7%
1,7%
6,7%
5,6% 5,0%
5,6% 6,4%
2,9% 8,1%
5,3% 6,2% 3,5%
5,1% 4,5% 4,9%
5,4% 5,8% 3,8%
6,8% 5,8%
5,0%
-25,0%
-20,0%
-15,0%
-10,0%
-5,0%
0,0%
5,0%
10,0%
15,0%
Ben
in
B
urki
no F
aso
C
abo
Verd
e
C
ote
d'Iv
oire
Gam
bia
Gha
na
Gui
nea
G
uine
a-B
issa
u
Lib
eria
Mal
i
M
aurit
ania
Nig
er
Nig
eria
Sen
egal
S
ierr
a Le
one
Tog
o
West Africa - GDP Growth
2015 - Real GDP Growth; % YoY 2016 - Estimated Real GDP Growth; % YoY 2017 - Forecast Real GDP Growth; % YoY 2018 - Forecast Real GDP Growth; % YoY
77 | What influences foreign direct investment into Africa
Conclusion
Cote d’Ivoire FDI inflows to Cote d’Ivoire decreased slightly by 2% to US$430 million in 2015, however, the increase in FDI inflows from 2011 to 2015 was 42% due to the improved political situation and efforts by the government to improve the business environment and speed up structural reform. In 2015, a total of 9 534 businesses were created in the country, an increase of 47% from 2014. There are no laws that limit foreign investment in most sectors of the Ivoirian economy. There are restrictions on foreign investment in the health sector, law and accounting firms, and travel agencies, particularly in terms of required local licenses. The value of announced Greenfield FDI projects during 2015 amounted to US$3 540 million, an increase of 615% from 2014.
Cote d’Ivoire ranked 8th out of 53 African destinations in the Where to invest in Africa Report, 2016 an effective ranking of 85%. Cote d’Ivoire’s rankings in the Ease of Doing Business Survey, 2016 and Corruption Perspective Index, 2016 are moderately poor at 25% and 39%, respectively.
Cote d’Ivoire is estimated to achieve GDP growth of 9.1% in 2016 and then GDP growth is forecast to start decreasing slightly to 8.4% in 2017 and 8.1% in 2018, the highest forecast growth rates in West Africa. Cote d’Ivoire’s port infrastructure is amongst the best in Africa and is underpinning the strong growth in the country.
President Ouattara, who came to power in 2011, is still struggling to re-unite the country and political tensions remain high. President Ouattara won the 2015 elections with a landslide victory. The country has preserved its post 2011 political stability and is focusing intently on economic growth. Security concerns are still one of the challenges that continue to exist in the country.
Ghana
FDI inflows to Ghana between 2014 and 2015 decreased by 5% to US$3 192 million. FDI inflows to Ghana have decreased slightly by 1% over the last five years ended 2015. The value of announced Greenfield FDI projects into Ghana during 2015 was US$1 436 million, which constitutes 7% of the value of announced Greenfield FDI projects into the region during 2015, this is a decrease from the announced Greenfield FDI projects into Ghana during 2014 which amounted to US$4 837 million. Ghana has significant sovereign and domestic debt which is generally considered to be unsustainable but this has not deterred FDI inflows to the country. Ghana is considered to have significant opportunities in the oil and gas and cocoa industries and is also the second largest producer of gold in Africa. Ghana also has good governance, political stability and policy reforms. All of these factors have contributed to Ghana continuing to receive relatively higher levels of FDI inflows during 2015 than many of the other mineral resource based African economies. Ghana ranked 4th out of 53 African countries in the Where to invest in Africa Report, 2016 - 2017. Ghana’s rankings in the Policy Perception Index, 2015 and Corruption Perspective Index, 2016 are 52% and 60%, respectively, with its ranking in the Ease of Doing Business Survey, 2016 at 43%. Ghana has historically had one of the best business environments in Africa, although its business environment deteriorated in 2015.
Ghana’s GDP growth was 3.9% in 2015 and estimated at 4.1% in 2016. Growth is forecast at 6.5% and 6.2% in 2017 and 2018, respectively. Until recently Ghana was one of the fastest growing economies in the world and, despite the recent decline in its GDP growth rate and weak commodity and oil prices, it is still one of the most attractive countries for investment in Africa. The Ghanaian economy also has other challenges in the form of a depreciating currency, a continuing energy crisis, a deteriorating macroeconomic imbalance, and rising inflation and interest rates.
Ghana is a stable democracy and has experienced several peaceful and successful transitions in power.
Nigeria Although Nigeria achieved FDI inflows during 2015 of US$3 064 million, amounting to 31% of the total FDI inflows to West Africa, FDI inflows to Nigeria have declined by a significant 35% year on year during 2015 and by 66% over the last five years ended 2015. This decline is due largely to the declining commodity and oil prices, a depreciating currency and shortages in electricity and fuel as well as other challenges including corruption, an inconsistent regulatory and legal environment and security concerns. Despite the above mentioned negative factors, FDI inflows to Nigeria are still relatively high due to the country’s growing middle class and size of the economy. There are opportunities in the manufacturing and services sectors, as well as commercial agriculture. Nigerian oil is also of a high quality and is unearthed at a relatively low cost.
Nigeria ranked 6th out of 53 African countries in the Where to invest in Africa Report, 2016 - 2017, dropping from 5th in 2015. Nigeria achieved a poor score in the Ease of Doing Business Survey, 2016 (11%). Nigeria’s ranking in the Corruption Perspective Index, 2016 was at 23%.
Nigeria is estimated to achieve a negative GDP growth rate in 2016, however GDP growth is forecast to increase again in 2017 and 2018 to 1.7% and 3.8%, respectively. The continuing decline in the price of crude oil is also affecting economic growth in the country.
Nigeria experienced a relatively peaceful transition of power to the main opposition party, All Progressive’s Congress, during 2015, despite the insurgency in the north east. Addressing security issues remains a key challenge for Nigeria as these have a negative impact on investment into the country. What does this mean? Productive FDI inflows to West Africa declined by 18% during 2015 due mainly to the low commodity and oil prices, security issues and electricity and fuel shortages. Growth is estimated to have dropped during 2016, particularly in Nigeria which experienced negative real GDP growth of -1.7%. The rankings of the West African countries in the Ease of Doing Business Survey, 2016 generally improved slightly but, other than Ghana at 43% in 2016, the improvement is off such a low base that it does not result in a significant change for investors. The rankings of the West countries in the Overall Global Competitiveness Index, 2016 – 2017 were generally low including Ghana with a ranking of 17% and Nigeria with a ranking of 8%.
West African countries need to continue to focus on improving the business environments in their countries. Security and health situations in selected West African countries are also impacting heavily on the competitiveness of these economies and their attractiveness as FDI inflow destinations. FDI inflows are essential for West African countries to continue to improve their infrastructure and education systems thereby enabling these countries to become more competitive in a fast changing global environment. Ghana’s ranking in the Overall Global Competitiveness Index, 2016 – 2017 improved significantly during 2016, specifically due to improvements in the areas of labour market efficiency, macroeconomic environment, infrastructure, education and institutions.
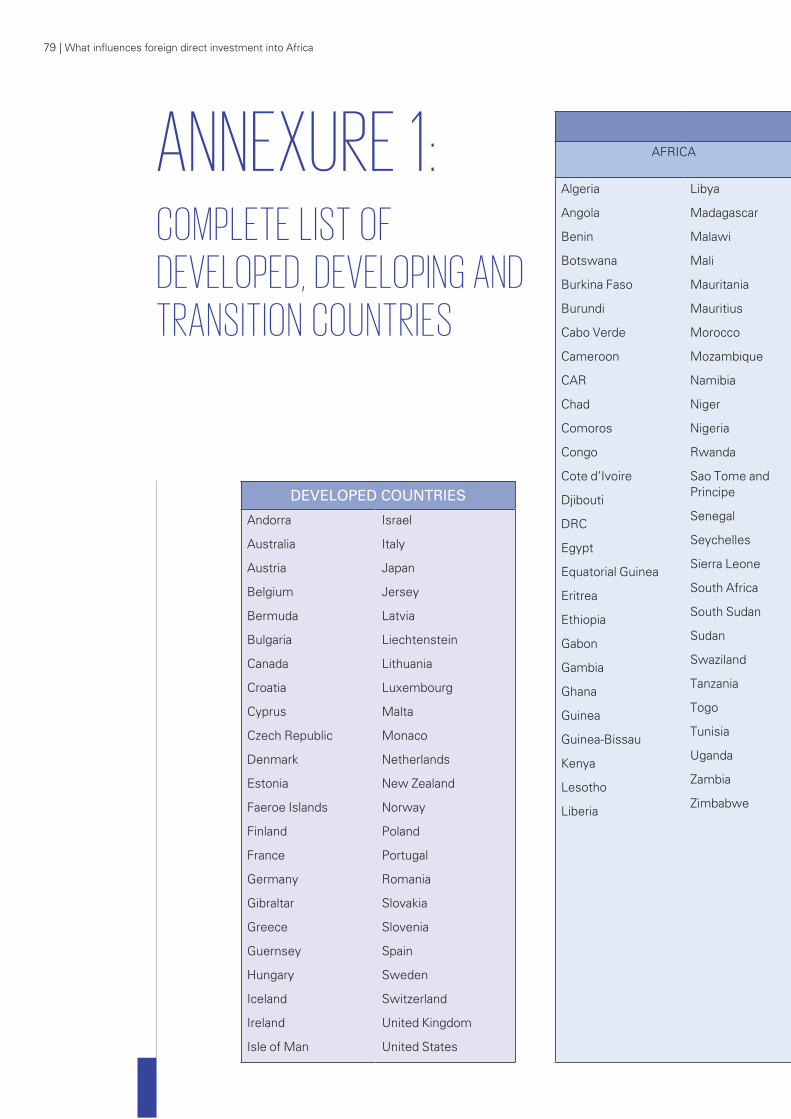
79 | What influences foreign direct investment into Africa
ANNEXURE 1:
DEVELOPED COUNTRIES
Andorra
Australia
Austria
Belgium
Bermuda
Bulgaria
Canada
Croatia
Cyprus
Czech Republic
Denmark
Estonia
Faeroe Islands
Finland
France
Germany
Gibraltar
Greece
Guernsey
Hungary
Iceland
Ireland
Isle of Man
Israel
Italy
Japan
Jersey
Latvia
Liechtenstein
Lithuania
Luxembourg
Malta
Monaco
Netherlands
New Zealand
Norway
Poland
Portugal
Romania
Slovakia
Slovenia
Spain
Sweden
Switzerland
United Kingdom
United States
COMPLETE LIST OF DEVELOPED, DEVELOPING AND TRANSITION COUNTRIES
DEVELOPING AND TRANSITION COUNTRIES
AFRICA ASIA OCEANIA LATIN AMERICA AND THE CARIBBEAN
TRANSITION ECONOMIES
Algeria
Angola
Benin
Botswana
Burkina Faso
Burundi
Cabo Verde
Cameroon
CAR
Chad
Comoros
Congo
Cote d’Ivoire
Djibouti
DRC
Egypt
Equatorial Guinea
Eritrea
Ethiopia
Gabon
Gambia
Ghana
Guinea
Guinea-Bissau
Kenya
Lesotho
Liberia
Libya
Madagascar
Malawi
Mali
Mauritania
Mauritius
Morocco
Mozambique
Namibia
Niger
Nigeria
Rwanda
Sao Tome and Principe
Senegal
Seychelles
Sierra Leone
South Africa
South Sudan
Sudan
Swaziland
Tanzania
Togo
Tunisia
Uganda
Zambia
Zimbabwe
Afghanistan
Bahrain
Bangladesh
Bhutan
Brunei
Cambodia
China
Hong Kong
India
Indonesia
Iran
Iraq
Jordan
Kuwait
Laos
Lebanon
Macao
Malaysia
Maldives
Mongolia
Myanmar
Nepal
North Korea
Oman
Pakistan
Palestine
Philippines
Qatar
Saudi Arabia
Singapore
South Korea
Sri Lanka
Syria
Taiwan
Thailand
Timor-Leste
Turkey
United Arab Emirates
Vietnam
Yemen
Cook Islands
Fiji
French Polynesia
Kiribati
Marshall Islands
Micronesia
New Caledonia
Palau
Papa New Guinea
Samoa
Solomon Islands
Tonga
Tuvalu
Vanuatu
Anguilla
Antigua and Barbuda
Argentina
Aruba
Bahamas
Barbados
Belize
Bolivia
Brazil
British Virgin Isles
Cayman Islands
Chile
Colombia
Costa Rica
Curacao
Dominica
Dominican Republic
Ecuador
El Salvador
Grenada
Guatemala
Guyana
Haiti
Honduras
Jamaica
Mexico
Montserrat
Nicaragua
Panama
Paraguay
Peru
Saint Lucia
Saint Vincent and the Grenadines
Sint Maarten
St Kitts and Nevis
Suriname
Trinidad and Tobago
Uruguay
Venezuela
Albania
Armenia
Azerbaijan
Belarus
Bosnia and Herzegovina
Georgia
Kazakhstan
Kyrgyzstan
Moldova
Montenegro
Russia
Serbia
Tajikistan
Turkmenistan
Ukraine
Uzbekistan
Yugoslav/Macedonia
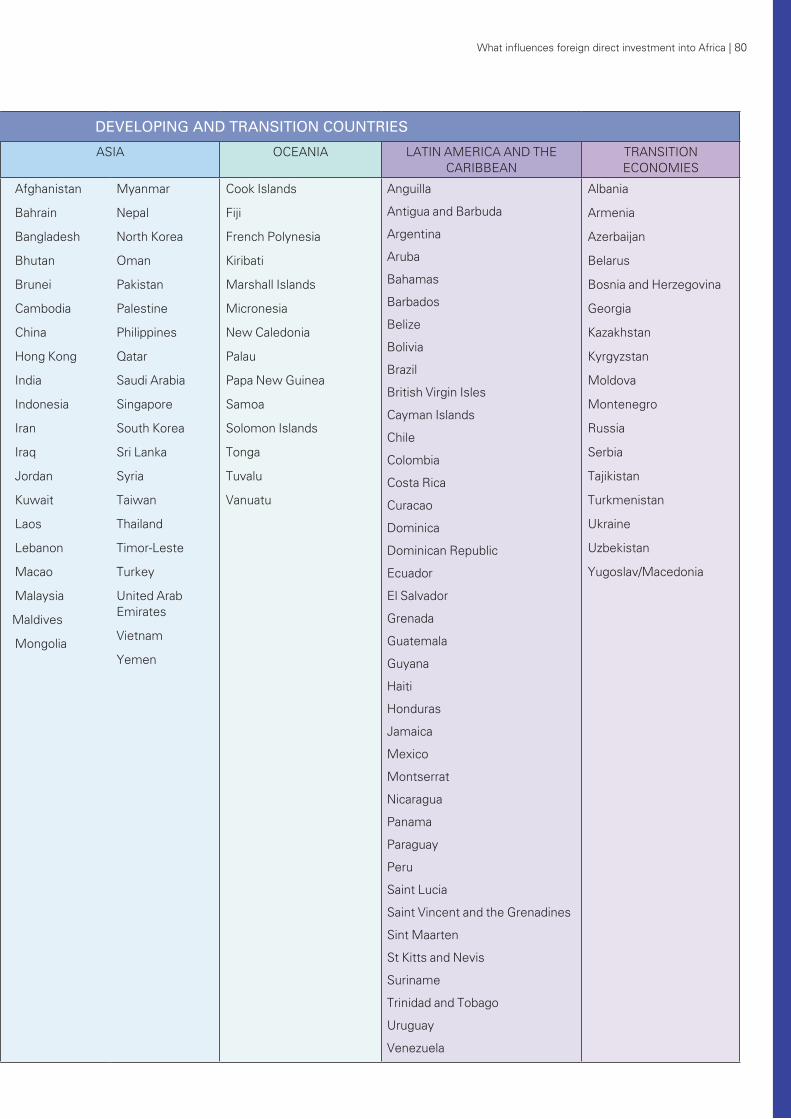
What influences foreign direct investment into Africa | 80
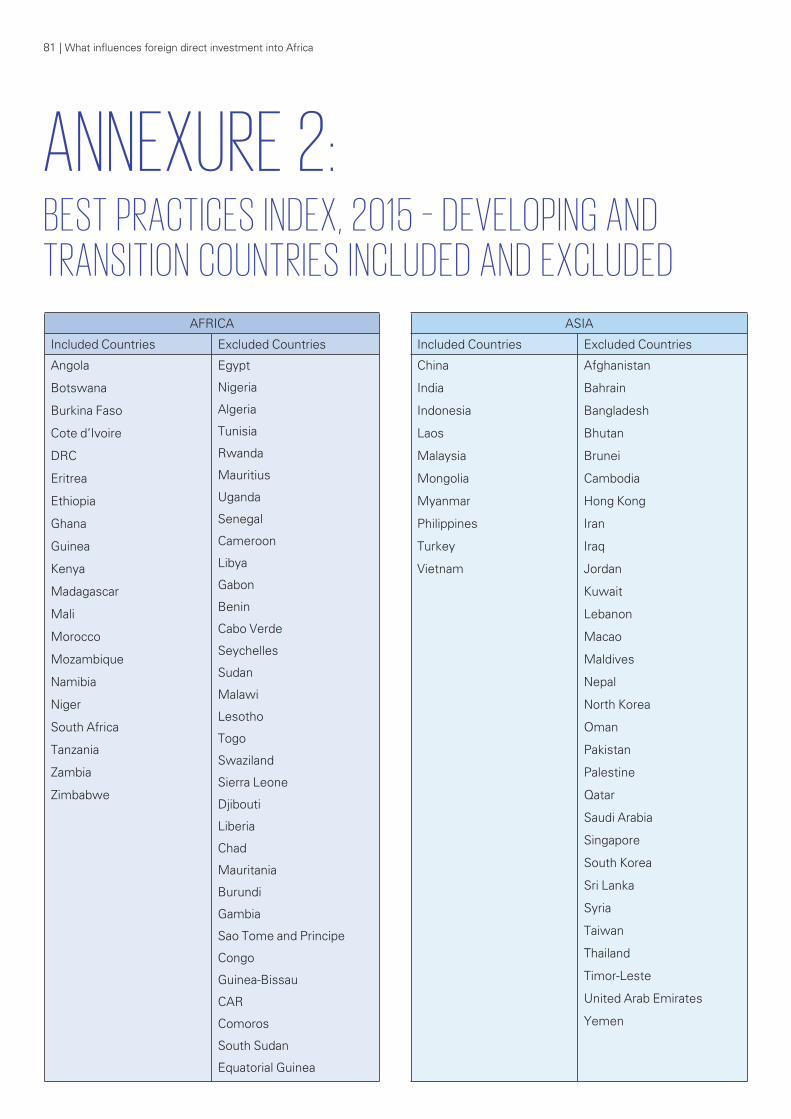
ANNEXURE 2:BEST PRACTICES INDEX, 2015 – DEVELOPING AND TRANSITION COUNTRIES INCLUDED AND EXCLUDED
81 | What influences foreign direct investment into Africa
AFRICA
Included Countries Excluded Countries
Angola
Botswana
Burkina Faso
Cote d’Ivoire
DRC
Eritrea
Ethiopia
Ghana
Guinea
Kenya
Madagascar
Mali
Morocco
Mozambique
Namibia
Niger
South Africa
Tanzania
Zambia
Zimbabwe
Egypt
Nigeria
Algeria
Tunisia
Rwanda
Mauritius
Uganda
Senegal
Cameroon
Libya
Gabon
Benin
Cabo Verde
Seychelles
Sudan
Malawi
Lesotho
Togo
Swaziland
Sierra Leone
Djibouti
Liberia
Chad
Mauritania
Burundi
Gambia
Sao Tome and Principe
Congo
Guinea-Bissau
CAR
Comoros
South Sudan
Equatorial Guinea
ASIA
Included Countries Excluded Countries
China
India
Indonesia
Laos
Malaysia
Mongolia
Myanmar
Philippines
Turkey
Vietnam
Afghanistan
Bahrain
Bangladesh
Bhutan
Brunei
Cambodia
Hong Kong
Iran
Iraq
Jordan
Kuwait
Lebanon
Macao
Maldives
Nepal
North Korea
Oman
Pakistan
Palestine
Qatar
Saudi Arabia
Singapore
South Korea
Sri Lanka
Syria
Taiwan
Thailand
Timor-Leste
United Arab Emirates
Yemen
OCEANIA
Included Countries Excluded Countries
Fiji
New Caledonia
Papa New Guinea
Solomon Islands
Cook Islands
French Polynesia
Kiribati
Marshall Islands
Micronesia
Palau
Samoa
Tonga
Tuvalu
Vanuatu
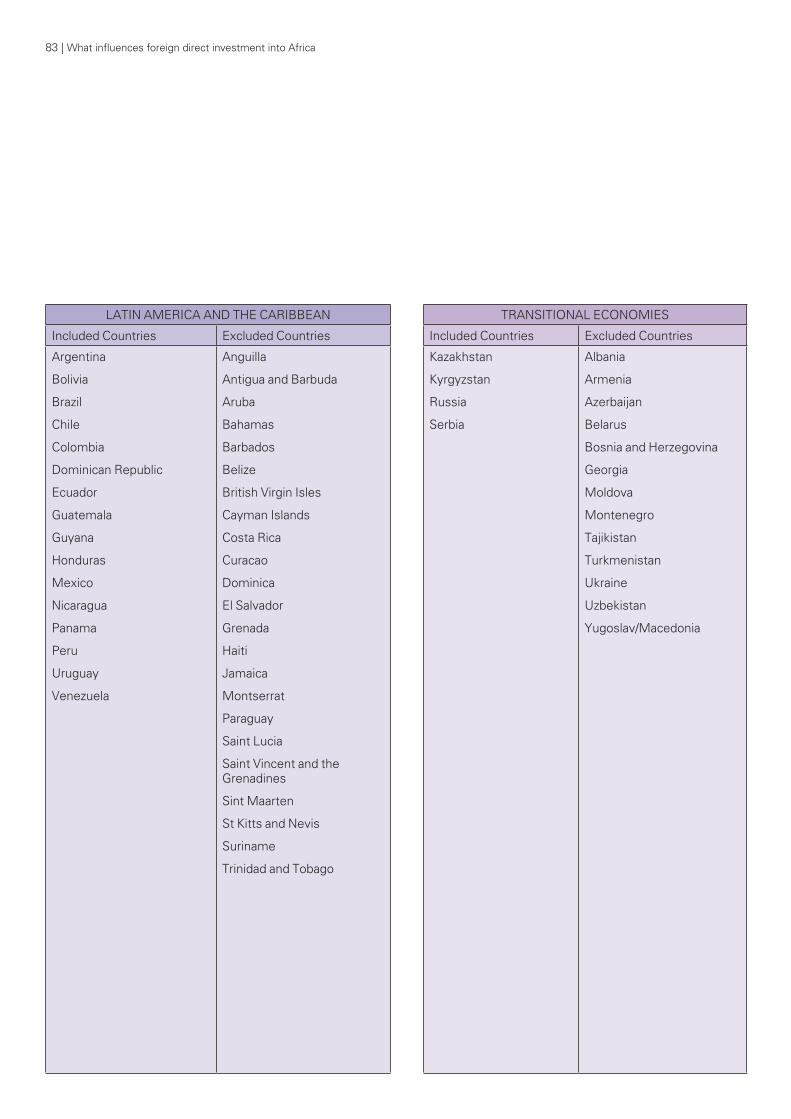
83 | What influences foreign direct investment into Africa
TRANSITIONAL ECONOMIES
Included Countries Excluded Countries
Kazakhstan
Kyrgyzstan
Russia
Serbia
Albania
Armenia
Azerbaijan
Belarus
Bosnia and Herzegovina
Georgia
Moldova
Montenegro
Tajikistan
Turkmenistan
Ukraine
Uzbekistan
Yugoslav/Macedonia
LATIN AMERICA AND THE CARIBBEAN
Included Countries Excluded Countries
Argentina
Bolivia
Brazil
Chile
Colombia
Dominican Republic
Ecuador
Guatemala
Guyana
Honduras
Mexico
Nicaragua
Panama
Peru
Uruguay
Venezuela
Anguilla
Antigua and Barbuda
Aruba
Bahamas
Barbados
Belize
British Virgin Isles
Cayman Islands
Costa Rica
Curacao
Dominica
El Salvador
Grenada
Haiti
Jamaica
Montserrat
Paraguay
Saint Lucia
Saint Vincent and the Grenadines
Sint Maarten
St Kitts and Nevis
Suriname
Trinidad and Tobago
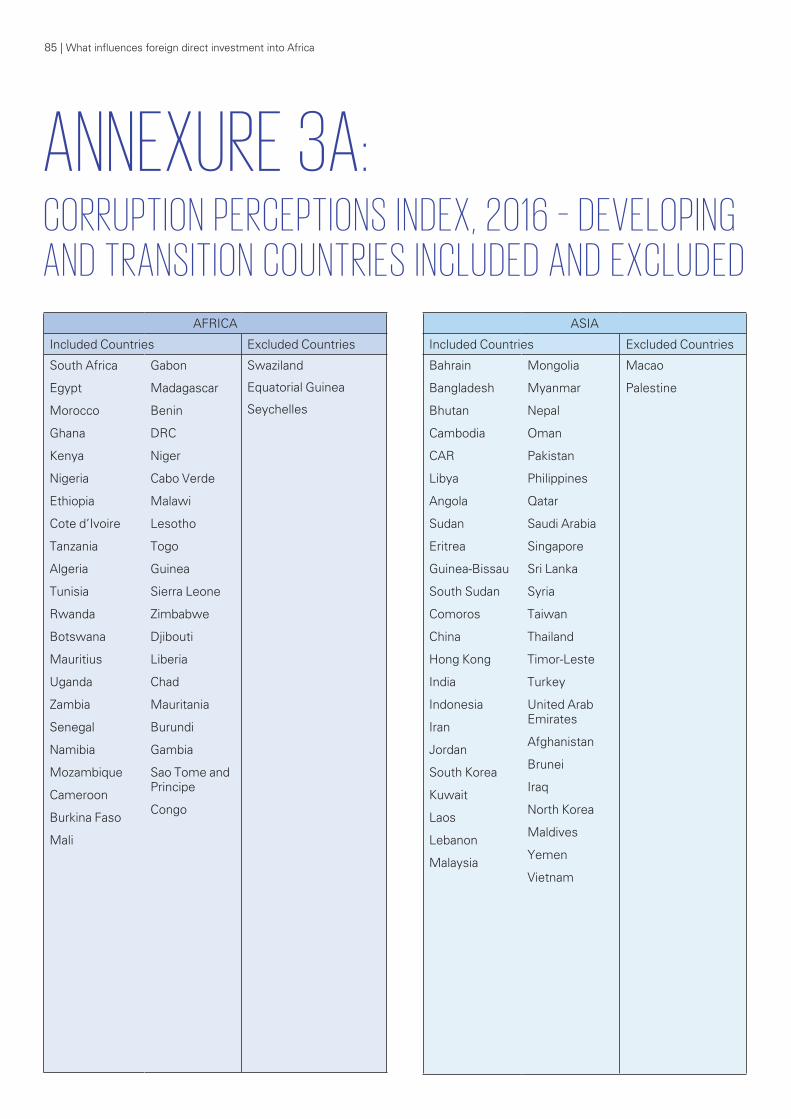
85 | What influences foreign direct investment into Africa
ANNEXURE 3A:CORRUPTION PERCEPTIONS INDEX, 2016 – DEVELOPING AND TRANSITION COUNTRIES INCLUDED AND EXCLUDED
AFRICA
Included Countries Excluded Countries
South Africa
Egypt
Morocco
Ghana
Kenya
Nigeria
Ethiopia
Cote d’Ivoire
Tanzania
Algeria
Tunisia
Rwanda
Botswana
Mauritius
Uganda
Zambia
Senegal
Namibia
Mozambique
Cameroon
Burkina Faso
Mali
Gabon
Madagascar
Benin
DRC
Niger
Cabo Verde
Malawi
Lesotho
Togo
Guinea
Sierra Leone
Zimbabwe
Djibouti
Liberia
Chad
Mauritania
Burundi
Gambia
Sao Tome and Principe
Congo
Swaziland
Equatorial Guinea
Seychelles
ASIA
Included Countries Excluded Countries
Bahrain
Bangladesh
Bhutan
Cambodia
CAR
Libya
Angola
Sudan
Eritrea
Guinea-Bissau
South Sudan
Comoros
China
Hong Kong
India
Indonesia
Iran
Jordan
South Korea
Kuwait
Laos
Lebanon
Malaysia
Mongolia
Myanmar
Nepal
Oman
Pakistan
Philippines
Qatar
Saudi Arabia
Singapore
Sri Lanka
Syria
Taiwan
Thailand
Timor-Leste
Turkey
United Arab Emirates
Afghanistan
Brunei
Iraq
North Korea
Maldives
Yemen
Vietnam
Macao
Palestine
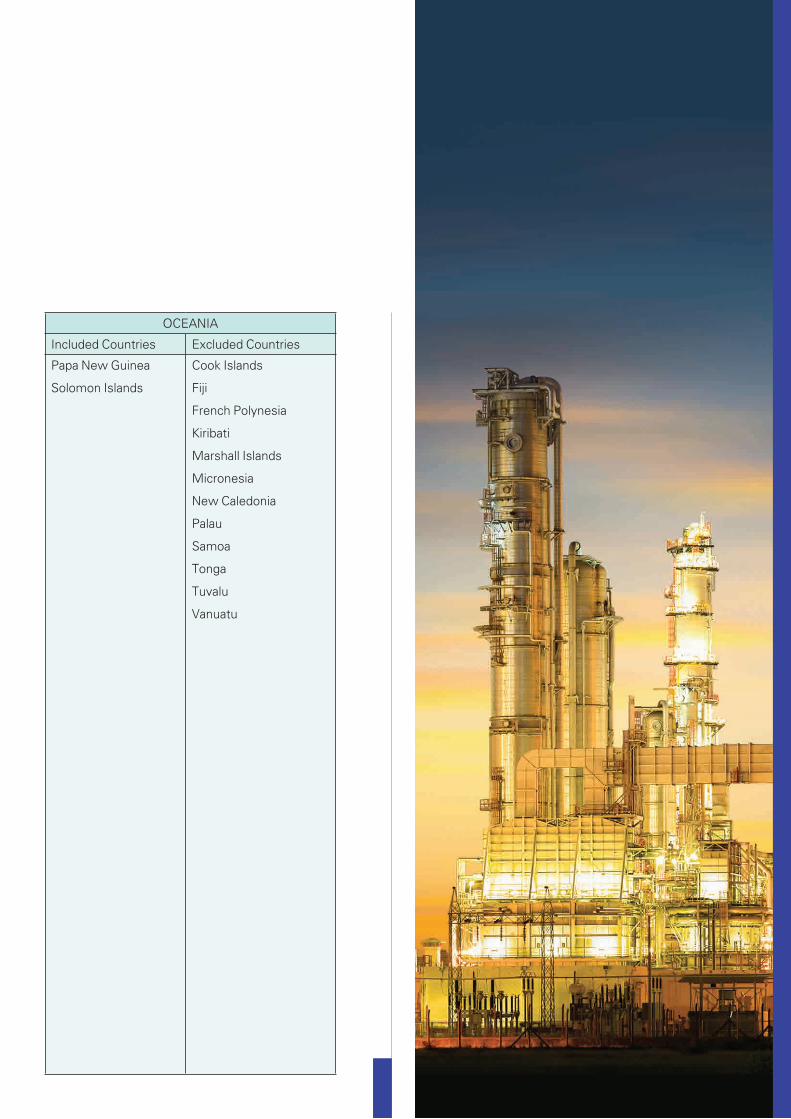
OCEANIA
Included Countries Excluded Countries
Papa New Guinea
Solomon Islands
Cook Islands
Fiji
French Polynesia
Kiribati
Marshall Islands
Micronesia
New Caledonia
Palau
Samoa
Tonga
Tuvalu
Vanuatu
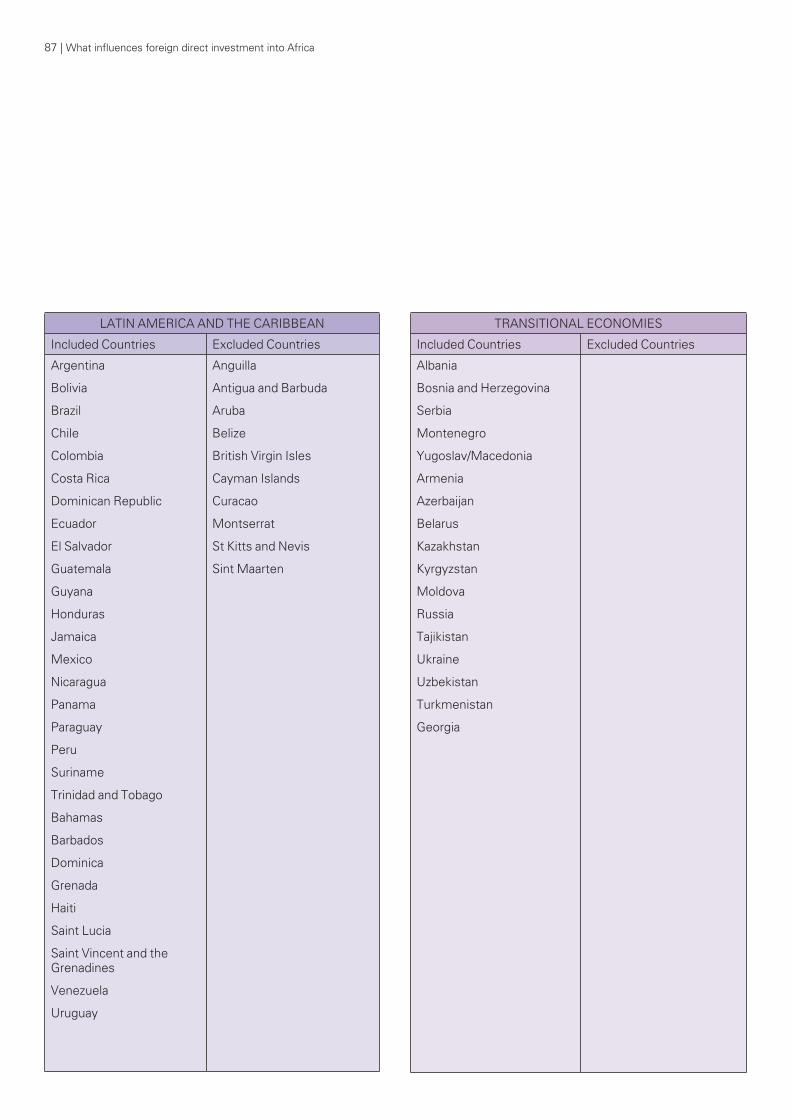
LATIN AMERICA AND THE CARIBBEAN
Included Countries Excluded Countries
Argentina
Bolivia
Brazil
Chile
Colombia
Costa Rica
Dominican Republic
Ecuador
El Salvador
Guatemala
Guyana
Honduras
Jamaica
Mexico
Nicaragua
Panama
Paraguay
Peru
Suriname
Trinidad and Tobago
Bahamas
Barbados
Dominica
Grenada
Haiti
Saint Lucia
Saint Vincent and the Grenadines
Venezuela
Uruguay
Anguilla
Antigua and Barbuda
Aruba
Belize
British Virgin Isles
Cayman Islands
Curacao
Montserrat
St Kitts and Nevis
Sint Maarten
TRANSITIONAL ECONOMIES
Included Countries Excluded Countries
Albania
Bosnia and Herzegovina
Serbia
Montenegro
Yugoslav/Macedonia
Armenia
Azerbaijan
Belarus
Kazakhstan
Kyrgyzstan
Moldova
Russia
Tajikistan
Ukraine
Uzbekistan
Turkmenistan
Georgia
87 | What influences foreign direct investment into Africa
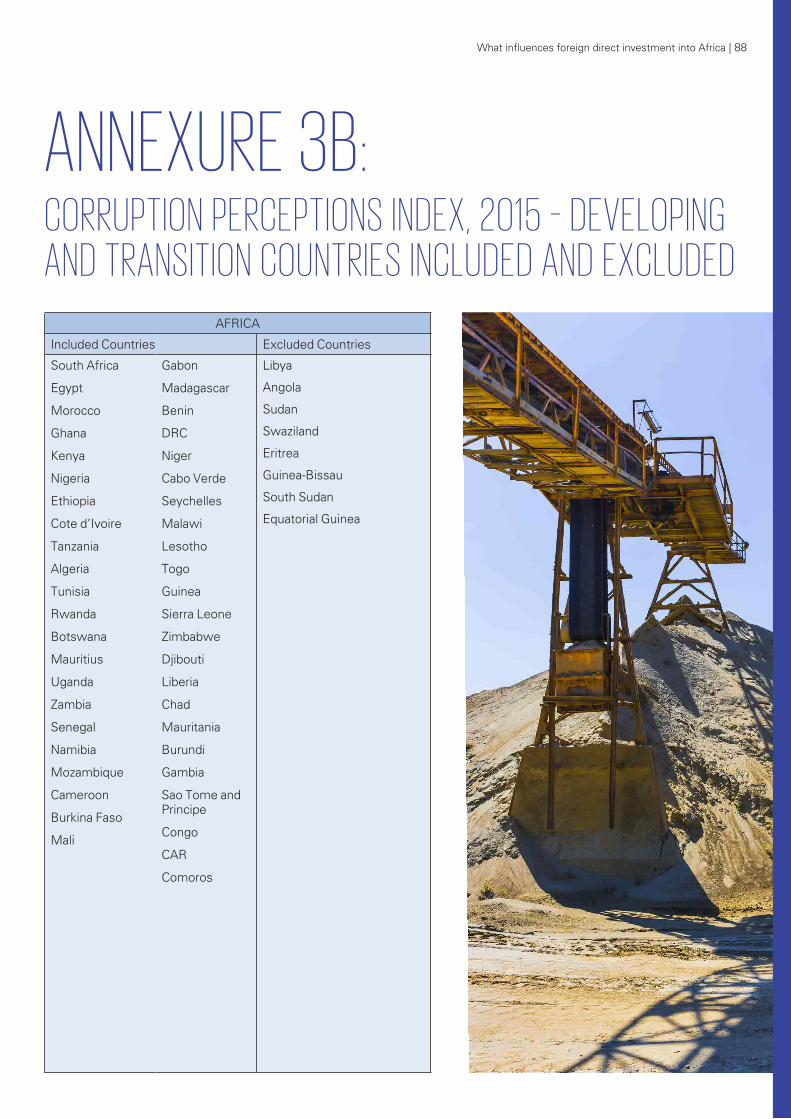
ANNEXURE 3B:CORRUPTION PERCEPTIONS INDEX, 2015 – DEVELOPING AND TRANSITION COUNTRIES INCLUDED AND EXCLUDED
What influences foreign direct investment into Africa | 88
AFRICA
Included Countries Excluded Countries
South Africa
Egypt
Morocco
Ghana
Kenya
Nigeria
Ethiopia
Cote d’Ivoire
Tanzania
Algeria
Tunisia
Rwanda
Botswana
Mauritius
Uganda
Zambia
Senegal
Namibia
Mozambique
Cameroon
Burkina Faso
Mali
Gabon
Madagascar
Benin
DRC
Niger
Cabo Verde
Seychelles
Malawi
Lesotho
Togo
Guinea
Sierra Leone
Zimbabwe
Djibouti
Liberia
Chad
Mauritania
Burundi
Gambia
Sao Tome and Principe
Congo
CAR
Comoros
Libya
Angola
Sudan
Swaziland
Eritrea
Guinea-Bissau
South Sudan
Equatorial Guinea
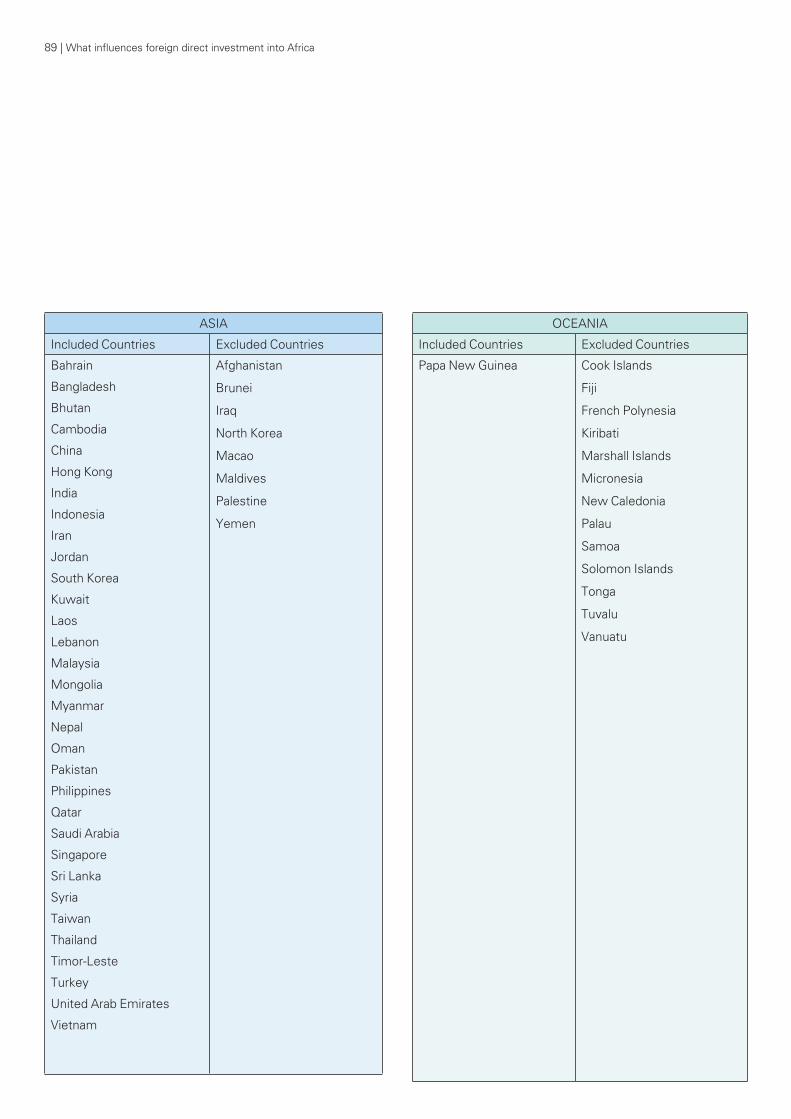
ASIA
Included Countries Excluded Countries
Bahrain
Bangladesh
Bhutan
Cambodia
China
Hong Kong
India
Indonesia
Iran
Jordan
South Korea
Kuwait
Laos
Lebanon
Malaysia
Mongolia
Myanmar
Nepal
Oman
Pakistan
Philippines
Qatar
Saudi Arabia
Singapore
Sri Lanka
Syria
Taiwan
Thailand
Timor-Leste
Turkey
United Arab Emirates
Vietnam
Afghanistan
Brunei
Iraq
North Korea
Macao
Maldives
Palestine
Yemen
89 | What influences foreign direct investment into Africa
OCEANIA
Included Countries Excluded Countries
Papa New Guinea Cook Islands
Fiji
French Polynesia
Kiribati
Marshall Islands
Micronesia
New Caledonia
Palau
Samoa
Solomon Islands
Tonga
Tuvalu
Vanuatu
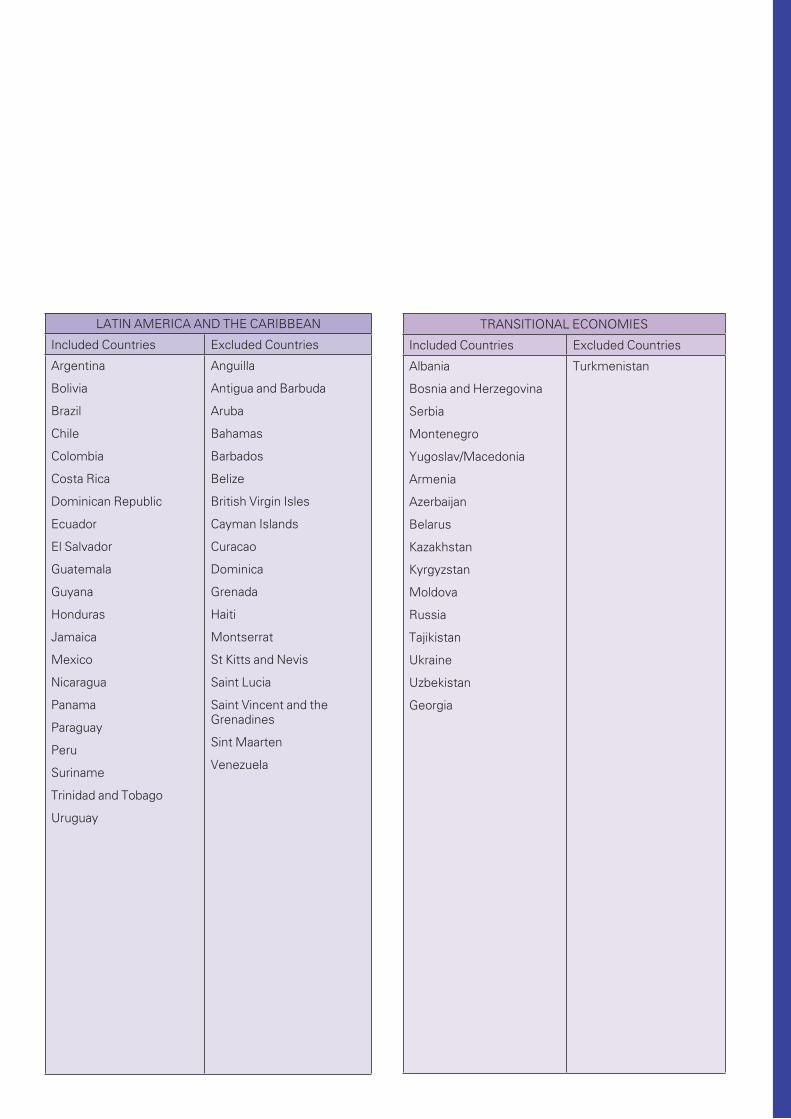
LATIN AMERICA AND THE CARIBBEAN
Included Countries Excluded Countries
Argentina
Bolivia
Brazil
Chile
Colombia
Costa Rica
Dominican Republic
Ecuador
El Salvador
Guatemala
Guyana
Honduras
Jamaica
Mexico
Nicaragua
Panama
Paraguay
Peru
Suriname
Trinidad and Tobago
Uruguay
Anguilla
Antigua and Barbuda
Aruba
Bahamas
Barbados
Belize
British Virgin Isles
Cayman Islands
Curacao
Dominica
Grenada
Haiti
Montserrat
St Kitts and Nevis
Saint Lucia
Saint Vincent and the Grenadines
Sint Maarten
Venezuela
TRANSITIONAL ECONOMIES
Included Countries Excluded Countries
Albania
Bosnia and Herzegovina
Serbia
Montenegro
Yugoslav/Macedonia
Armenia
Azerbaijan
Belarus
Kazakhstan
Kyrgyzstan
Moldova
Russia
Tajikistan
Ukraine
Uzbekistan
Georgia
Turkmenistan
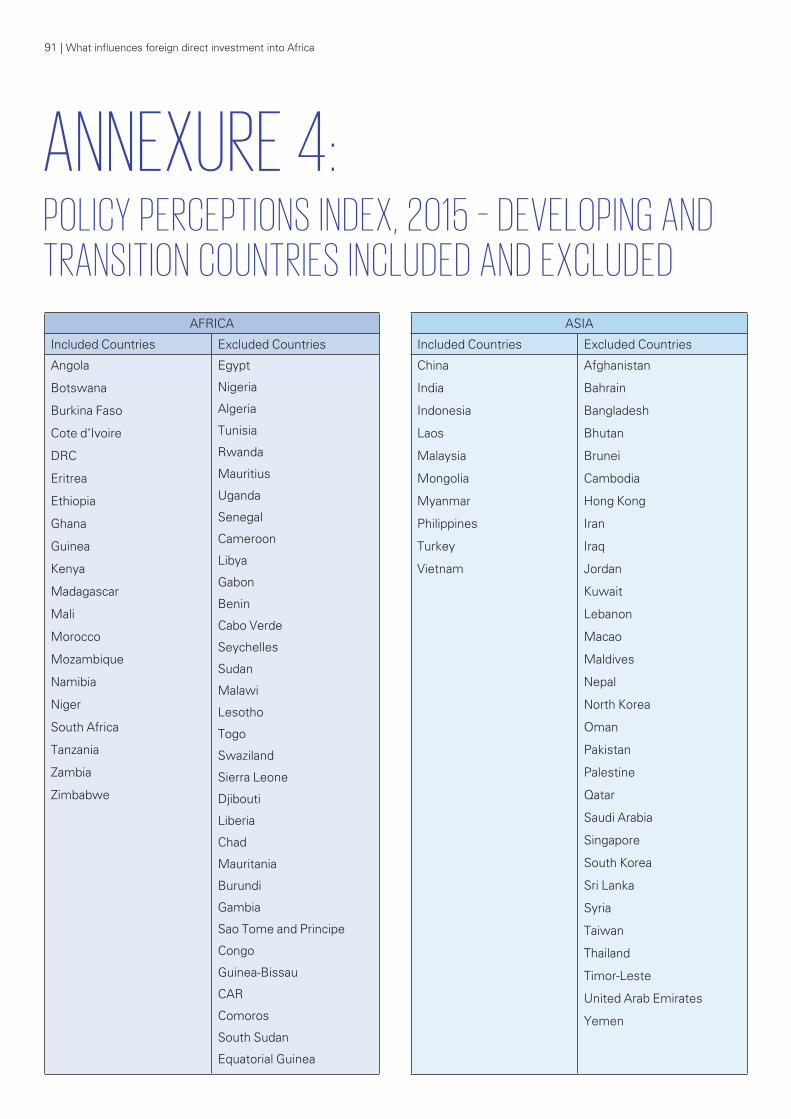
ANNEXURE 4:POLICY PERCEPTIONS INDEX, 2015 – DEVELOPING AND TRANSITION COUNTRIES INCLUDED AND EXCLUDED
AFRICA
Included Countries Excluded Countries
Angola
Botswana
Burkina Faso
Cote d’Ivoire
DRC
Eritrea
Ethiopia
Ghana
Guinea
Kenya
Madagascar
Mali
Morocco
Mozambique
Namibia
Niger
South Africa
Tanzania
Zambia
Zimbabwe
Egypt
Nigeria
Algeria
Tunisia
Rwanda
Mauritius
Uganda
Senegal
Cameroon
Libya
Gabon
Benin
Cabo Verde
Seychelles
Sudan
Malawi
Lesotho
Togo
Swaziland
Sierra Leone
Djibouti
Liberia
Chad
Mauritania
Burundi
Gambia
Sao Tome and Principe
Congo
Guinea-Bissau
CAR
Comoros
South Sudan
Equatorial Guinea
ASIA
Included Countries Excluded Countries
China
India
Indonesia
Laos
Malaysia
Mongolia
Myanmar
Philippines
Turkey
Vietnam
Afghanistan
Bahrain
Bangladesh
Bhutan
Brunei
Cambodia
Hong Kong
Iran
Iraq
Jordan
Kuwait
Lebanon
Macao
Maldives
Nepal
North Korea
Oman
Pakistan
Palestine
Qatar
Saudi Arabia
Singapore
South Korea
Sri Lanka
Syria
Taiwan
Thailand
Timor-Leste
United Arab Emirates
Yemen
91 | What influences foreign direct investment into Africa
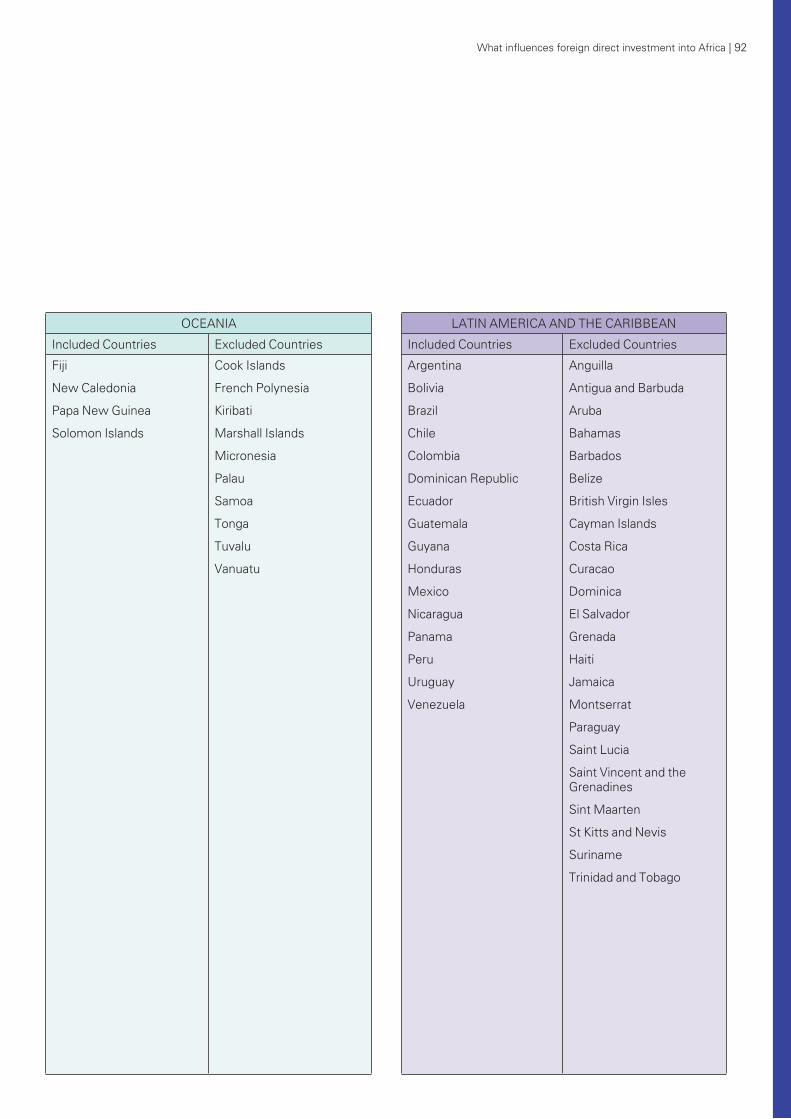
OCEANIA
Included Countries Excluded Countries
Fiji
New Caledonia
Papa New Guinea
Solomon Islands
Cook Islands
French Polynesia
Kiribati
Marshall Islands
Micronesia
Palau
Samoa
Tonga
Tuvalu
Vanuatu
LATIN AMERICA AND THE CARIBBEAN
Included Countries Excluded Countries
Argentina
Bolivia
Brazil
Chile
Colombia
Dominican Republic
Ecuador
Guatemala
Guyana
Honduras
Mexico
Nicaragua
Panama
Peru
Uruguay
Venezuela
Anguilla
Antigua and Barbuda
Aruba
Bahamas
Barbados
Belize
British Virgin Isles
Cayman Islands
Costa Rica
Curacao
Dominica
El Salvador
Grenada
Haiti
Jamaica
Montserrat
Paraguay
Saint Lucia
Saint Vincent and the Grenadines
Sint Maarten
St Kitts and Nevis
Suriname
Trinidad and Tobago
What influences foreign direct investment into Africa | 92
TRANSITIONAL ECONOMIES
Included Countries Excluded Countries
Kazakhstan
Kyrgyzstan
Russia
Serbia
Albania
Armenia
Azerbaijan
Belarus
Bosnia and Herzegovina
Georgia
Moldova
Montenegro
Tajikistan
Turkmenistan
Ukraine
Uzbekistan
Yugoslav/Macedonia
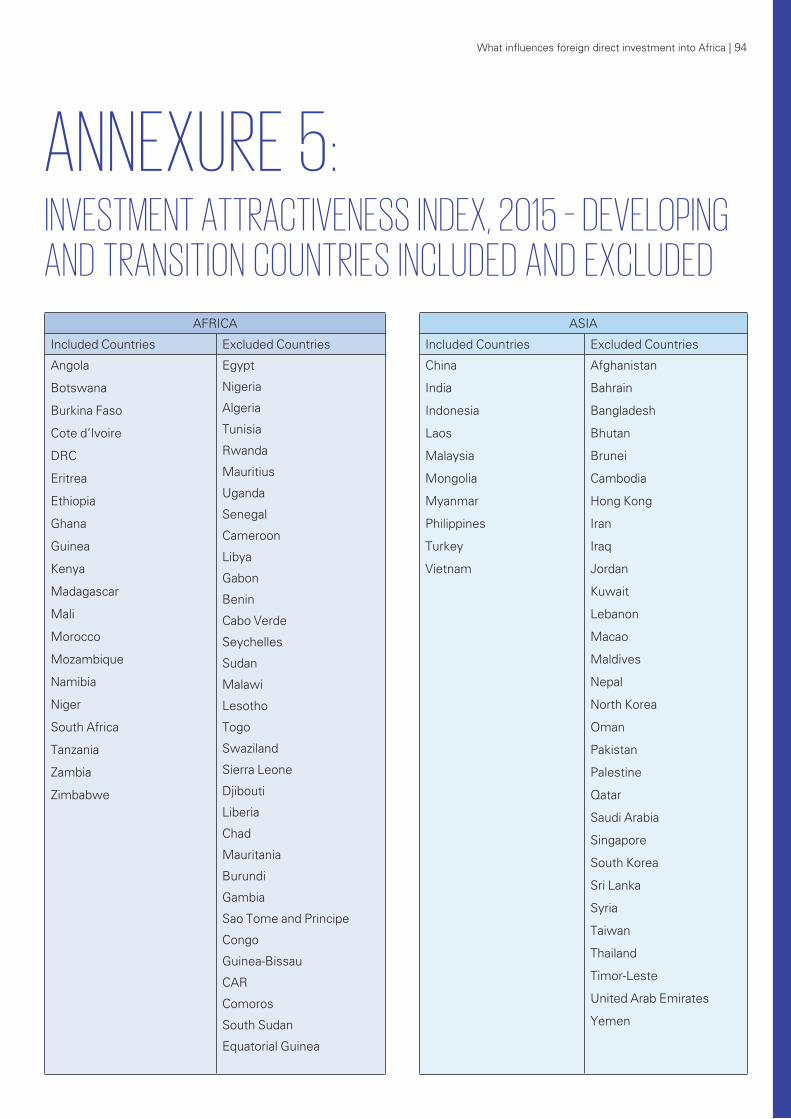
ANNEXURE 5:INVESTMENT ATTRACTIVENESS INDEX, 2015 – DEVELOPING AND TRANSITION COUNTRIES INCLUDED AND EXCLUDED
AFRICA
Included Countries Excluded Countries
Angola
Botswana
Burkina Faso
Cote d’Ivoire
DRC
Eritrea
Ethiopia
Ghana
Guinea
Kenya
Madagascar
Mali
Morocco
Mozambique
Namibia
Niger
South Africa
Tanzania
Zambia
Zimbabwe
Egypt
Nigeria
Algeria
Tunisia
Rwanda
Mauritius
Uganda
Senegal
Cameroon
Libya
Gabon
Benin
Cabo Verde
Seychelles
Sudan
Malawi
Lesotho
Togo
Swaziland
Sierra Leone
Djibouti
Liberia
Chad
Mauritania
Burundi
Gambia
Sao Tome and Principe
Congo
Guinea-Bissau
CAR
Comoros
South Sudan
Equatorial Guinea
ASIA
Included Countries Excluded Countries
China
India
Indonesia
Laos
Malaysia
Mongolia
Myanmar
Philippines
Turkey
Vietnam
Afghanistan
Bahrain
Bangladesh
Bhutan
Brunei
Cambodia
Hong Kong
Iran
Iraq
Jordan
Kuwait
Lebanon
Macao
Maldives
Nepal
North Korea
Oman
Pakistan
Palestine
Qatar
Saudi Arabia
Singapore
South Korea
Sri Lanka
Syria
Taiwan
Thailand
Timor-Leste
United Arab Emirates
Yemen
What influences foreign direct investment into Africa | 94
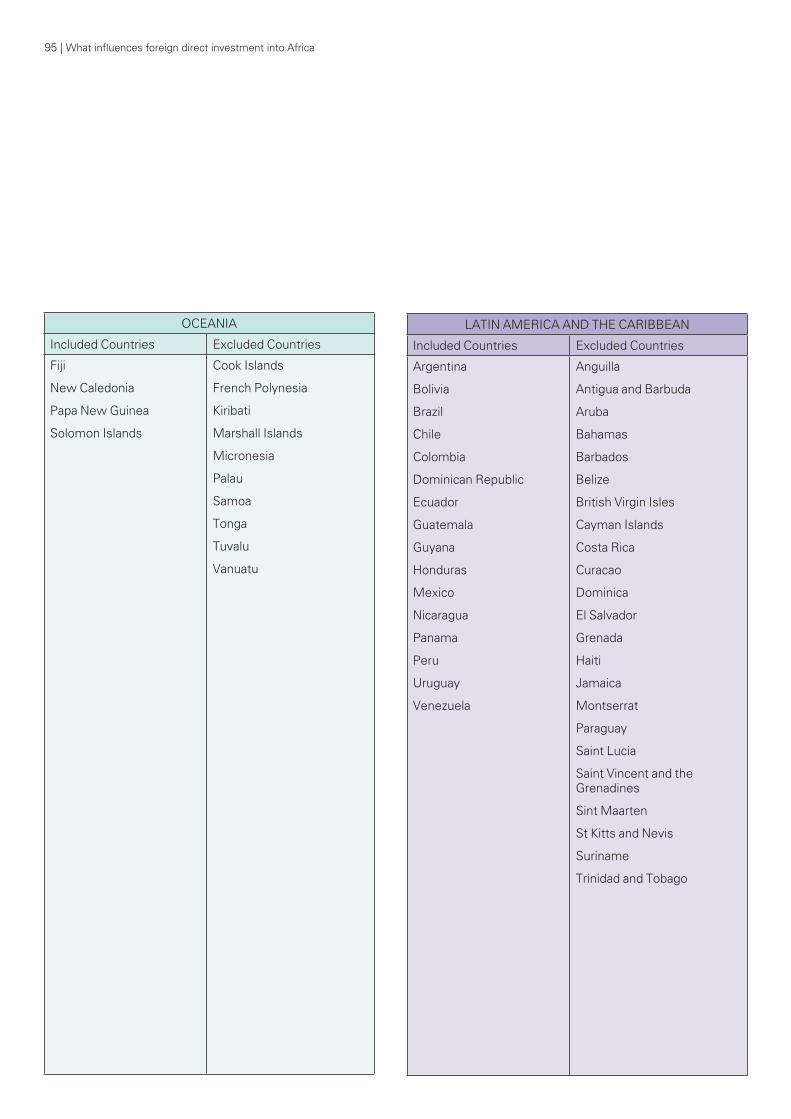
OCEANIA
Included Countries Excluded Countries
Fiji
New Caledonia
Papa New Guinea
Solomon Islands
Cook Islands
French Polynesia
Kiribati
Marshall Islands
Micronesia
Palau
Samoa
Tonga
Tuvalu
Vanuatu
LATIN AMERICA AND THE CARIBBEAN
Included Countries Excluded Countries
Argentina
Bolivia
Brazil
Chile
Colombia
Dominican Republic
Ecuador
Guatemala
Guyana
Honduras
Mexico
Nicaragua
Panama
Peru
Uruguay
Venezuela
Anguilla
Antigua and Barbuda
Aruba
Bahamas
Barbados
Belize
British Virgin Isles
Cayman Islands
Costa Rica
Curacao
Dominica
El Salvador
Grenada
Haiti
Jamaica
Montserrat
Paraguay
Saint Lucia
Saint Vincent and the Grenadines
Sint Maarten
St Kitts and Nevis
Suriname
Trinidad and Tobago
95 | What influences foreign direct investment into Africa
TRANSITIONAL ECONOMIES
Included Countries Excluded Countries
Kazakhstan
Kyrgyzstan
Russia
Serbia
Albania
Armenia
Azerbaijan
Belarus
Bosnia and Herzegovina
Georgia
Moldova
Montenegro
Tajikistan
Turkmenistan
Ukraine
Uzbekistan
Yugoslav/Macedonia
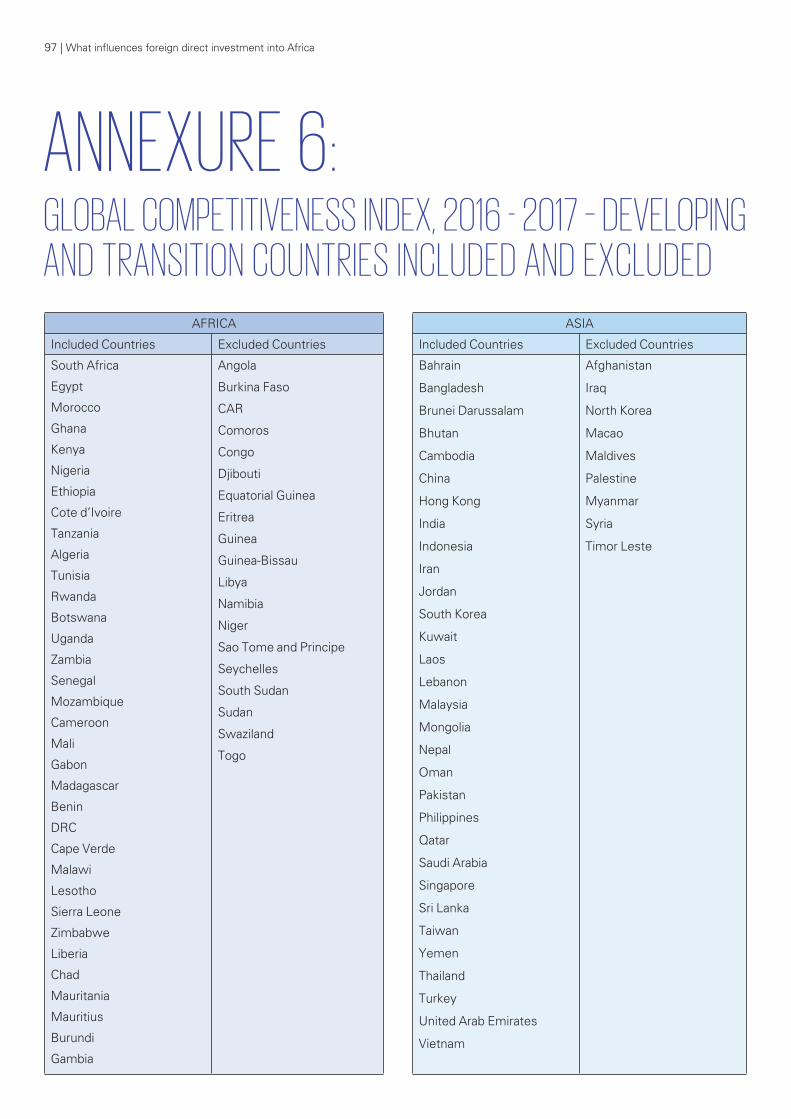
97 | What influences foreign direct investment into Africa
ANNEXURE 6:GLOBAL COMPETITIVENESS INDEX, 2016 - 2017 – DEVELOPING AND TRANSITION COUNTRIES INCLUDED AND EXCLUDED
AFRICA
Included Countries Excluded Countries
South Africa
Egypt
Morocco
Ghana
Kenya
Nigeria
Ethiopia
Cote d’Ivoire
Tanzania
Algeria
Tunisia
Rwanda
Botswana
Uganda
Zambia
Senegal
Mozambique
Cameroon
Mali
Gabon
Madagascar
Benin
DRC
Cape Verde
Malawi
Lesotho
Sierra Leone
Zimbabwe
Liberia
Chad
Mauritania
Mauritius
Burundi
Gambia
Angola
Burkina Faso
CAR
Comoros
Congo
Djibouti
Equatorial Guinea
Eritrea
Guinea
Guinea-Bissau
Libya
Namibia
Niger
Sao Tome and Principe
Seychelles
South Sudan
Sudan
Swaziland
Togo
ASIA
Included Countries Excluded Countries
Bahrain
Bangladesh
Brunei Darussalam
Bhutan
Cambodia
China
Hong Kong
India
Indonesia
Iran
Jordan
South Korea
Kuwait
Laos
Lebanon
Malaysia
Mongolia
Nepal
Oman
Pakistan
Philippines
Qatar
Saudi Arabia
Singapore
Sri Lanka
Taiwan
Yemen
Thailand
Turkey
United Arab Emirates
Vietnam
Afghanistan
Iraq
North Korea
Macao
Maldives
Palestine
Myanmar
Syria
Timor Leste
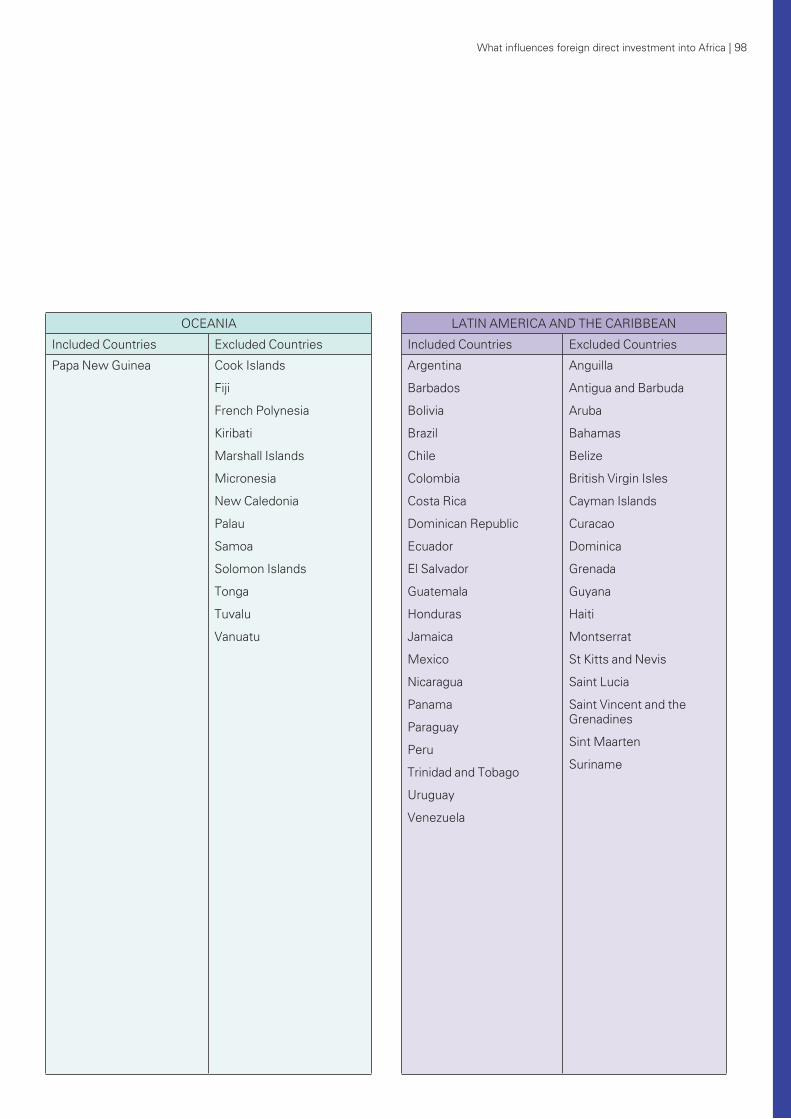
What influences foreign direct investment into Africa | 98
OCEANIA
Included Countries Excluded Countries
Papa New Guinea Cook Islands
Fiji
French Polynesia
Kiribati
Marshall Islands
Micronesia
New Caledonia
Palau
Samoa
Solomon Islands
Tonga
Tuvalu
Vanuatu
LATIN AMERICA AND THE CARIBBEAN
Included Countries Excluded Countries
Argentina
Barbados
Bolivia
Brazil
Chile
Colombia
Costa Rica
Dominican Republic
Ecuador
El Salvador
Guatemala
Honduras
Jamaica
Mexico
Nicaragua
Panama
Paraguay
Peru
Trinidad and Tobago
Uruguay
Venezuela
Anguilla
Antigua and Barbuda
Aruba
Bahamas
Belize
British Virgin Isles
Cayman Islands
Curacao
Dominica
Grenada
Guyana
Haiti
Montserrat
St Kitts and Nevis
Saint Lucia
Saint Vincent and the Grenadines
Sint Maarten
Suriname
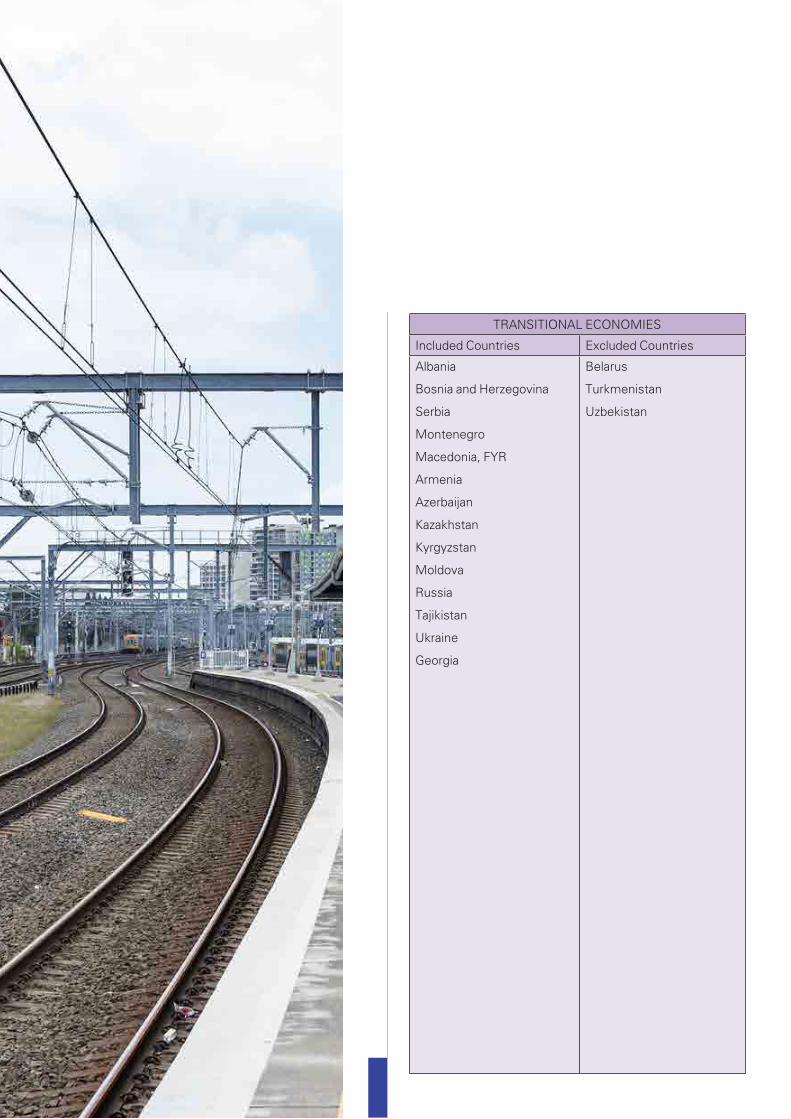
TRANSITIONAL ECONOMIES
Included Countries Excluded Countries
Albania
Bosnia and Herzegovina
Serbia
Montenegro
Macedonia, FYR
Armenia
Azerbaijan
Kazakhstan
Kyrgyzstan
Moldova
Russia
Tajikistan
Ukraine
Georgia
Belarus
Turkmenistan
Uzbekistan
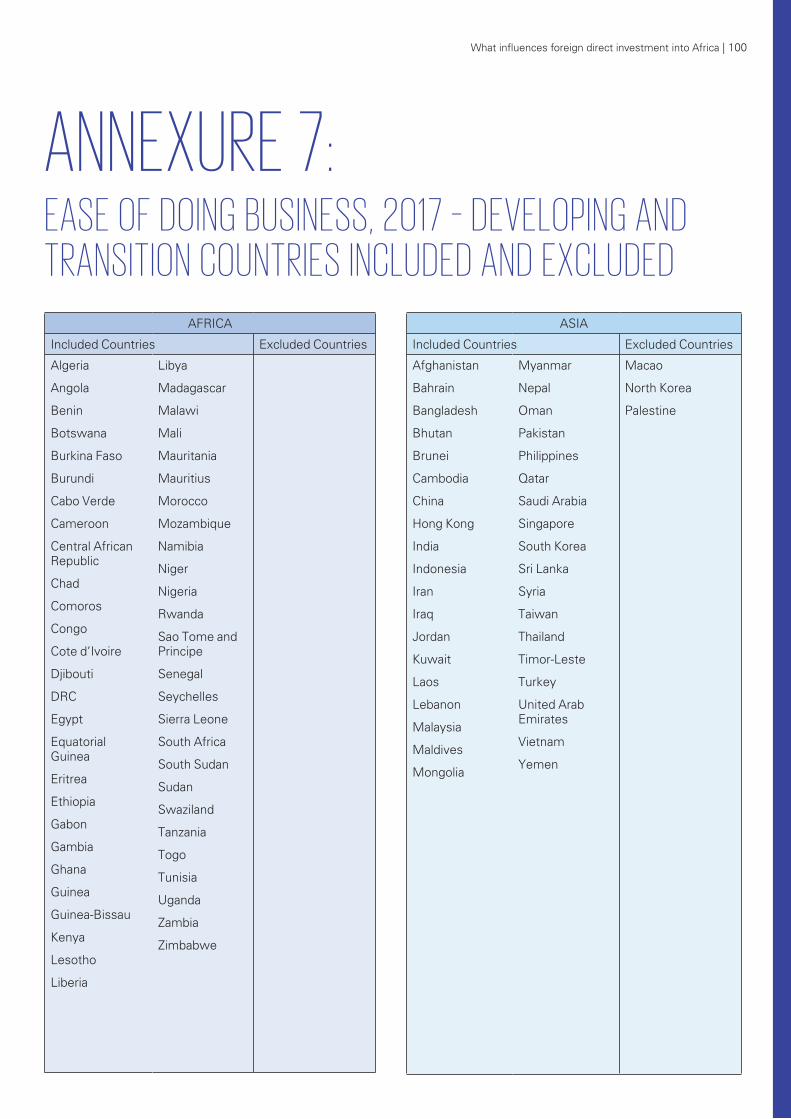
AFRICA
Included Countries Excluded Countries
Algeria
Angola
Benin
Botswana
Burkina Faso
Burundi
Cabo Verde
Cameroon
Central African Republic
Chad
Comoros
Congo
Cote d’Ivoire
Djibouti
DRC
Egypt
Equatorial Guinea
Eritrea
Ethiopia
Gabon
Gambia
Ghana
Guinea
Guinea-Bissau
Kenya
Lesotho
Liberia
Libya
Madagascar
Malawi
Mali
Mauritania
Mauritius
Morocco
Mozambique
Namibia
Niger
Nigeria
Rwanda
Sao Tome and Principe
Senegal
Seychelles
Sierra Leone
South Africa
South Sudan
Sudan
Swaziland
Tanzania
Togo
Tunisia
Uganda
Zambia
Zimbabwe
ANNEXURE 7:EASE OF DOING BUSINESS, 2017 – DEVELOPING AND TRANSITION COUNTRIES INCLUDED AND EXCLUDED
ASIA
Included Countries Excluded Countries
Afghanistan
Bahrain
Bangladesh
Bhutan
Brunei
Cambodia
China
Hong Kong
India
Indonesia
Iran
Iraq
Jordan
Kuwait
Laos
Lebanon
Malaysia
Maldives
Mongolia
Myanmar
Nepal
Oman
Pakistan
Philippines
Qatar
Saudi Arabia
Singapore
South Korea
Sri Lanka
Syria
Taiwan
Thailand
Timor-Leste
Turkey
United Arab Emirates
Vietnam
Yemen
Macao
North Korea
Palestine
What influences foreign direct investment into Africa | 100
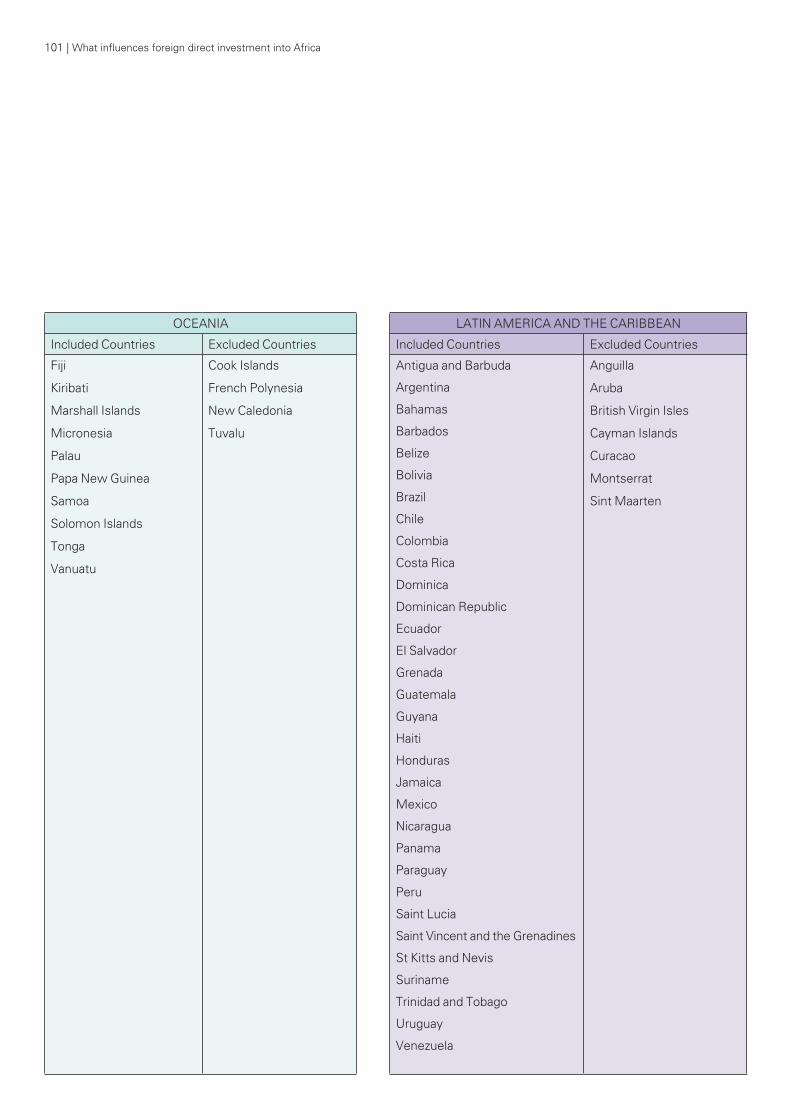
OCEANIA
Included Countries Excluded Countries
Fiji
Kiribati
Marshall Islands
Micronesia
Palau
Papa New Guinea
Samoa
Solomon Islands
Tonga
Vanuatu
Cook Islands
French Polynesia
New Caledonia
Tuvalu
LATIN AMERICA AND THE CARIBBEAN
Included Countries Excluded Countries
Antigua and Barbuda
Argentina
Bahamas
Barbados
Belize
Bolivia
Brazil
Chile
Colombia
Costa Rica
Dominica
Dominican Republic
Ecuador
El Salvador
Grenada
Guatemala
Guyana
Haiti
Honduras
Jamaica
Mexico
Nicaragua
Panama
Paraguay
Peru
Saint Lucia
Saint Vincent and the Grenadines
St Kitts and Nevis
Suriname
Trinidad and Tobago
Uruguay
Venezuela
Anguilla
Aruba
British Virgin Isles
Cayman Islands
Curacao
Montserrat
Sint Maarten
101 | What influences foreign direct investment into Africa
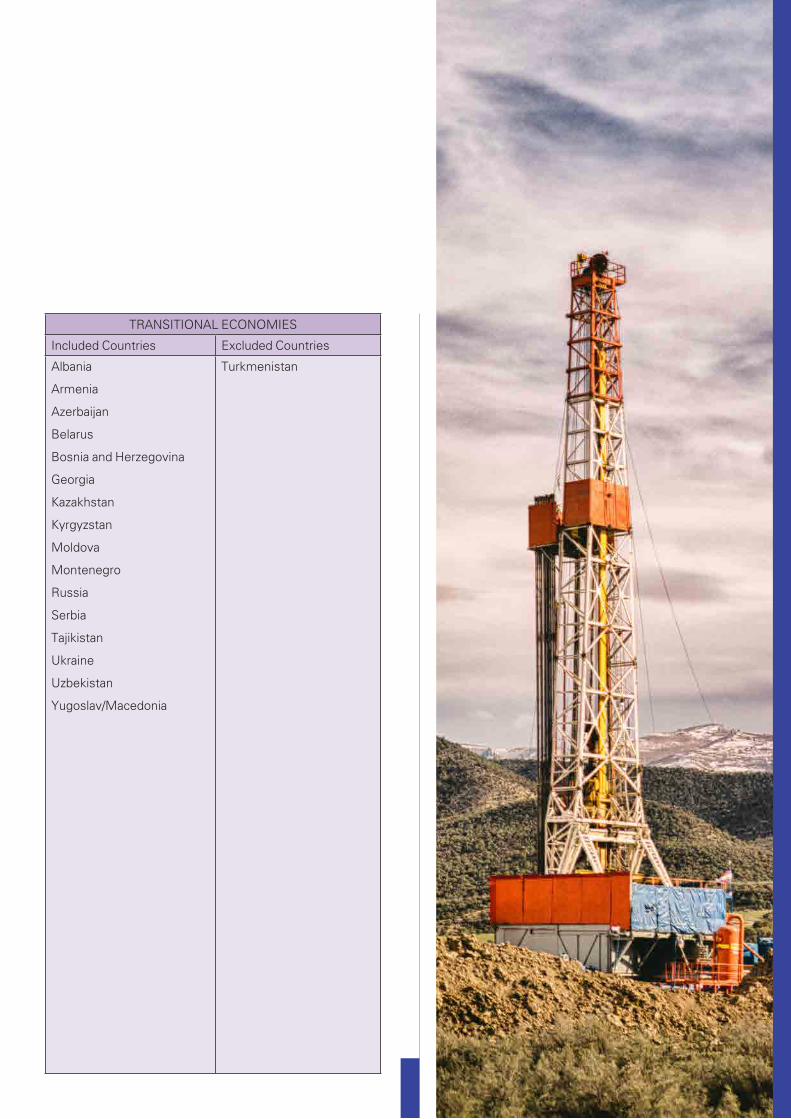
TRANSITIONAL ECONOMIES
Included Countries Excluded Countries
Albania
Armenia
Azerbaijan
Belarus
Bosnia and Herzegovina
Georgia
Kazakhstan
Kyrgyzstan
Moldova
Montenegro
Russia
Serbia
Tajikistan
Ukraine
Uzbekistan
Yugoslav/Macedonia
Turkmenistan
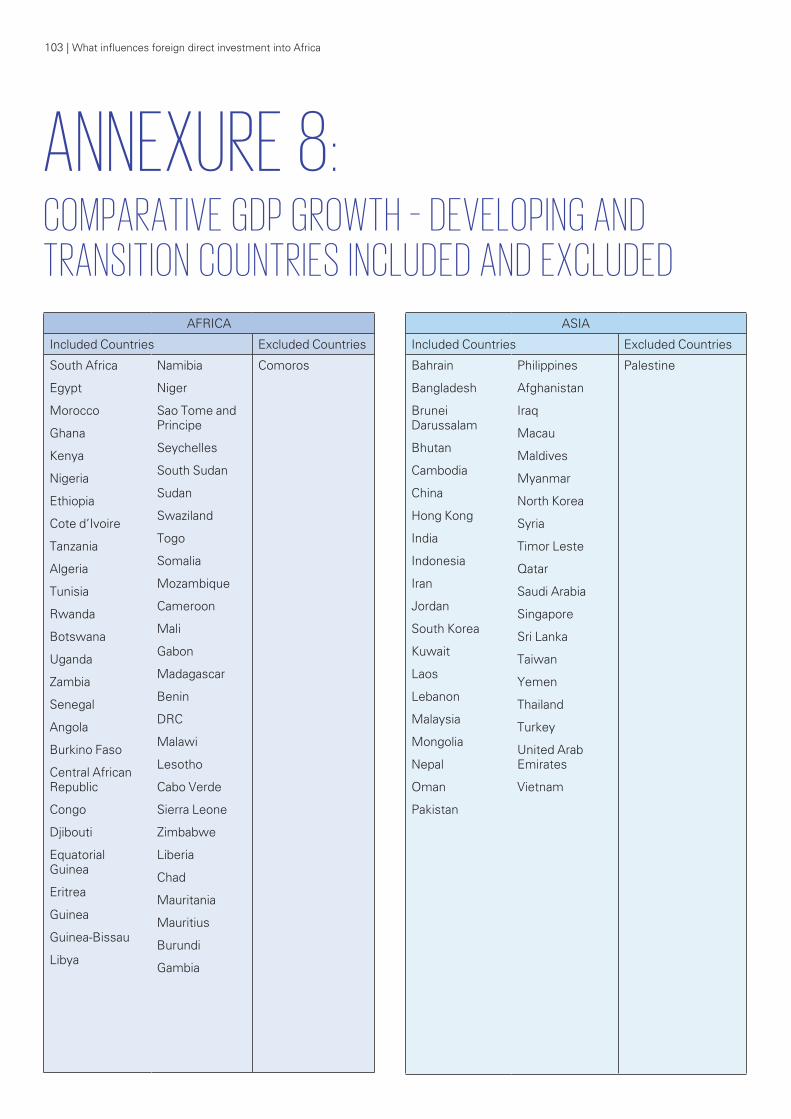
AFRICA
Included Countries Excluded Countries
South Africa
Egypt
Morocco
Ghana
Kenya
Nigeria
Ethiopia
Cote d’Ivoire
Tanzania
Algeria
Tunisia
Rwanda
Botswana
Uganda
Zambia
Senegal
Angola
Burkino Faso
Central African Republic
Congo
Djibouti
Equatorial Guinea
Eritrea
Guinea
Guinea-Bissau
Libya
Namibia
Niger
Sao Tome and Principe
Seychelles
South Sudan
Sudan
Swaziland
Togo
Somalia
Mozambique
Cameroon
Mali
Gabon
Madagascar
Benin
DRC
Malawi
Lesotho
Cabo Verde
Sierra Leone
Zimbabwe
Liberia
Chad
Mauritania
Mauritius
Burundi
Gambia
Comoros
ANNEXURE 8:COMPARATIVE GDP GROWTH – DEVELOPING AND TRANSITION COUNTRIES INCLUDED AND EXCLUDED
ASIA
Included Countries Excluded Countries
Bahrain
Bangladesh
Brunei Darussalam
Bhutan
Cambodia
China
Hong Kong
India
Indonesia
Iran
Jordan
South Korea
Kuwait
Laos
Lebanon
Malaysia
Mongolia
Nepal
Oman
Pakistan
Philippines
Afghanistan
Iraq
Macau
Maldives
Myanmar
North Korea
Syria
Timor Leste
Qatar
Saudi Arabia
Singapore
Sri Lanka
Taiwan
Yemen
Thailand
Turkey
United Arab Emirates
Vietnam
Palestine
103 | What influences foreign direct investment into Africa
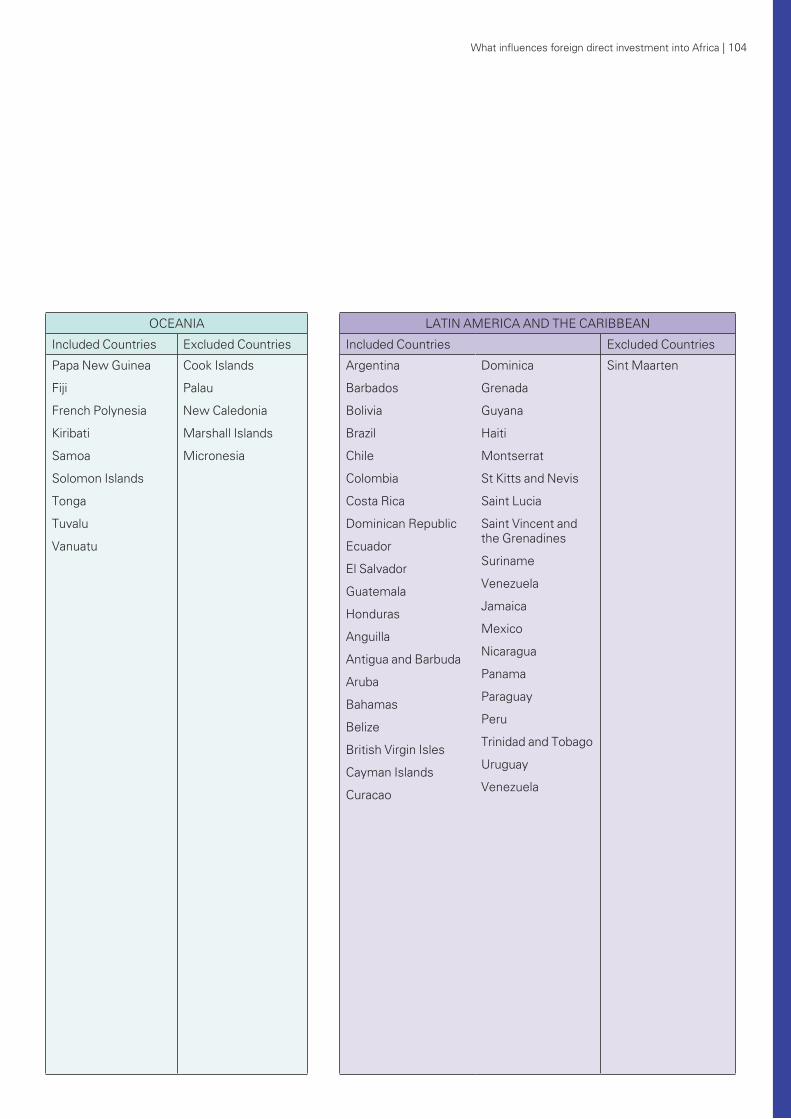
ASIA
Included Countries Excluded Countries
Bahrain
Bangladesh
Brunei Darussalam
Bhutan
Cambodia
China
Hong Kong
India
Indonesia
Iran
Jordan
South Korea
Kuwait
Laos
Lebanon
Malaysia
Mongolia
Nepal
Oman
Pakistan
Philippines
Afghanistan
Iraq
Macau
Maldives
Myanmar
North Korea
Syria
Timor Leste
Qatar
Saudi Arabia
Singapore
Sri Lanka
Taiwan
Yemen
Thailand
Turkey
United Arab Emirates
Vietnam
Palestine
OCEANIA
Included Countries Excluded Countries
Papa New Guinea
Fiji
French Polynesia
Kiribati
Samoa
Solomon Islands
Tonga
Tuvalu
Vanuatu
Cook Islands
Palau
New Caledonia
Marshall Islands
Micronesia
LATIN AMERICA AND THE CARIBBEAN
Included Countries Excluded Countries
Argentina
Barbados
Bolivia
Brazil
Chile
Colombia
Costa Rica
Dominican Republic
Ecuador
El Salvador
Guatemala
Honduras
Anguilla
Antigua and Barbuda
Aruba
Bahamas
Belize
British Virgin Isles
Cayman Islands
Curacao
Dominica
Grenada
Guyana
Haiti
Montserrat
St Kitts and Nevis
Saint Lucia
Saint Vincent and the Grenadines
Suriname
Venezuela
Jamaica
Mexico
Nicaragua
Panama
Paraguay
Peru
Trinidad and Tobago
Uruguay
Venezuela
Sint Maarten
What influences foreign direct investment into Africa | 104
TRANSITIONAL ECONOMIES
Included Countries Excluded Countries
Albania
Bosnia and Herzegovina
Belarus
Serbia
Montenegro
Macedonia, FYR
Armenia
Azerbaijan
Kazakhstan
Kyrgyzstan
Moldova
Russia
Tajikistan
Turkmenistan
Ukraine
Uzbekistan
Georgia
105 | What influences foreign direct investment into Africa

107 | What influences foreign direct investment into Africa
African Economic Outlook website
Article entitled 10 economic consequences of Donald Trump’s election win published on 28 November 2016 by The Guardian and written by Anatole Kaletsky
Article on the African Renewal Issue August to November 2016, entitled Africa after Brexit and written by Amelia Tan
BMI Research
Edelman Trust Barometer, 2017
Fraser Institute Annual Survey of Mining Companies, 2015
Global Economic Prospects Report, 2017
Investment Climate Statement, 2016
Investopedia.com
RMB Global Markets Research Where to Invest in Africa Report, 2016 - 2017
The Global Competitiveness Report, 2016-2017
The Global Risks Report 2017, 12th Edition
Transparency International Corruption Perception Index, 2015
UNCTAD Global Investment Trends Monitor No.24, 6 October 2016
World Bank Ease of Doing Business Survey, 2016 and 2015
World Economic Forum, the Future of Jobs Report, 2016
World Investment Report, 2016
SOURCES OF INFORMATION
John Geel Managing Partner, Deal Advisory South Africa T: +27 83 460 8116 E: [email protected]
Mickey BovePartner, Transactional Services T: +27 83 703 2684 E: [email protected]
Robbie Cheadle Associate Director, Transactional Services T: +27 82 718 4592 E: [email protected]
Donna Kairuz Manager, Transactional Services T: +27 82 719 3617 E: [email protected] With contributions from:Bryan LeithPartner, COO KPMG Africa Quinley Botha Manager, Deal Advisory South Africa
Moeketsi BoikanyoSupervisor, Deal Advisory South Africa
CONTRIBUTORS

All of the information included in this publication is for information purposes only, and whilst every effort has been made to ensure the information is accurate, it may not reflect the most current legal and regulatory developments. This information is not offered as legal or any other advice on any particular matter. The information is a summary and is not intended to be a substitute for the detailed provisions included in the listings requirements, laws, rules or regulations. Similarly, this publication does not address any aspects of laws of jurisdictions outside those specific exchanges described.
KPMG and the contributing authors expressly disclaim all liability to any person in respect of any action taken or not taken wholly or partly in reliance upon the whole or any part pf the contents of this publication. Readers are encouraged to consult with their professional advisors before taking any action.
© 2017 KPMG Services Proprietary Limited, a South African company and a member firm of the KPMG network of independent member firms affiliated with KPMG International Cooperative (“KPMG International”), a Swiss entity. All rights reserved. Printed in South Africa. KPMG and the KPMG logo are registered trademarks of KPMG International Cooperative (“KPMG International”), a Swiss entity. 16356MC
kpmg.com/socialmedia kpmg.com/app