Embed Size (px)
Citation preview
African Development Bank
The development of infrastructure in Africa is critical for fostering econo-mic growth and improving the living standards of Africans. It contributes significantly to human development, poverty reduction, and the attainment of the Sustainable Development Goals (SDGs). Investment in infrastructure accounts for over half of the recent improvements in economic growth in Africa and has the potential to contri-bute even more.
It is for this reason that infrastructure development across Africa remains central to the African Development Bank’s mission as espoused in its High 5s transformative agenda, cove-ring the period 2015-2025.
As part of its infrastructure develop-ment efforts, the Bank launched the Africa Infrastructure Knowledge Pro-gram (AIKP) to improve the availability of statistical information on infrastruc-ture development across Africa. The Bank also introduced an Africa In-frastructure Index (AIDI) to monitor the status and progress of infrastruture development across the continent. This brief presents the latest AIDI infor-mation on progress made by African
countries using data collected by the Bank under its AIKP. It also discusses the reasons behind the latest trends.
The present bulletin extends coverage to the period 2000–2018. The annual AIDI updates present selected indica-tors that comprise the Index’s major components, namely: (i) electricity; (ii) transport; (iii) ICT; and (iv) water and sa-nitation.
The AIKP program aims to provide an effective and sustainable platform for data collection and analysis on Africa’s infrastructure sectors. The Africa In-frastructure Development Index (AIDI) serves three key objectives, namely: (i) to monitor and evaluate the status and progress of infrastructure development across the continent; (ii) to assist in re-source allocation within the framework of ADF replenishments; and (iii) to contribute to policy dialogue within the Bank and between the Bank, African countries and development partners.
It also aims to institutionalize infrastruc-ture data collection in Africa by mains-treaming infrastructure statistics in the work programs of National Statistical Agencies. The program also generates
AfDB1. Introduction and Background
Statistics Department
Table of Contents1. Introduction and Background
2. The AIDI 2018 Highlights
3. Main Results
4. Conclusions
References
Annexes
Charles Leyeka Lufumpa Director, Statistics Department
Kouakou Koua Louis Division Manager, Economic and Social Statistics Division
Yassine Jmal Poverty & Infrastructure Statistics Expert, Economic and Social Statistics Division
Désiré Lakpa Statistician Assistant, Economic and Social Statistics Division
1
2
3
6
7
8
^ Ñê á Å~å =a Éî Éä ç é ã Éå í =_ ~å â
2
AfDB Development Index 2018African Development Bank
African Development Bank
the first position. Republic of Congo gained 7 positions (owing to fast electricity generation and ICT growth), fol-lowed by Ghana and Malawi (3 positions due to impro-vements in ICT and Water Supply and Sanitation), Ango-la, Côte d’Ivoire, and Ethiopia (2 positions each due to improvements in ICT, water supply and sanitation). The observed progress suggests that this group of countries is giving priority to investment in infrastructure in these sectors, which are critical to growing the economy.
The main losers in terms of rankingsGenerally, the bottom ten performing countries made very marginal gains in their performance—less than one percent point on the average, except Ethiopia and Mada-gascar. It is important to note that most of the countries in this category are fragile states or/and emerging from conflict. Some countries recorded a decline in the ove-rall performance index. They include Cabo Verde, 1.49; South Sudan, 0.34; and São Tomé and Príncipe, 0.24. In terms of ranking, Burkina Faso, Mauritania, Rwanda and Uganda saw the biggest drop, falling two positions.
Subregional rankings remain stableThe ranking of the five regions remain unchanged, with North Africa remaining in the first position, followed by Southern Africa, West Africa, East Africa and Central Africa. The best performing sub-region to emerge is Southern Africa, with an average of 2.0 points, followed by West Africa—1.55 points. The West African region recorded only 0.36 points—the lowest average in impro-vement.
ICT emerges as the main driver of AIDI improvementsThe ICT sector has driven the most improvements in the AIDI ratings over the past decade, compared to all other sectors. It is no coincidence that the top ten countries in the latest AIDI were those with the highest growth in their ICT sectors.
information on investment needs across countries and sectors, which are critical for informing private and public sector investment decisions, including Bank-managed support in African countries.
The AIDI’s methodological basis, the background and rationale for its development, are expounded in Annex 3. A revision of the original methodology is currently un-derway as more data are collected under the auspices of AIKP.
2. The AIDI 2018 Highlights
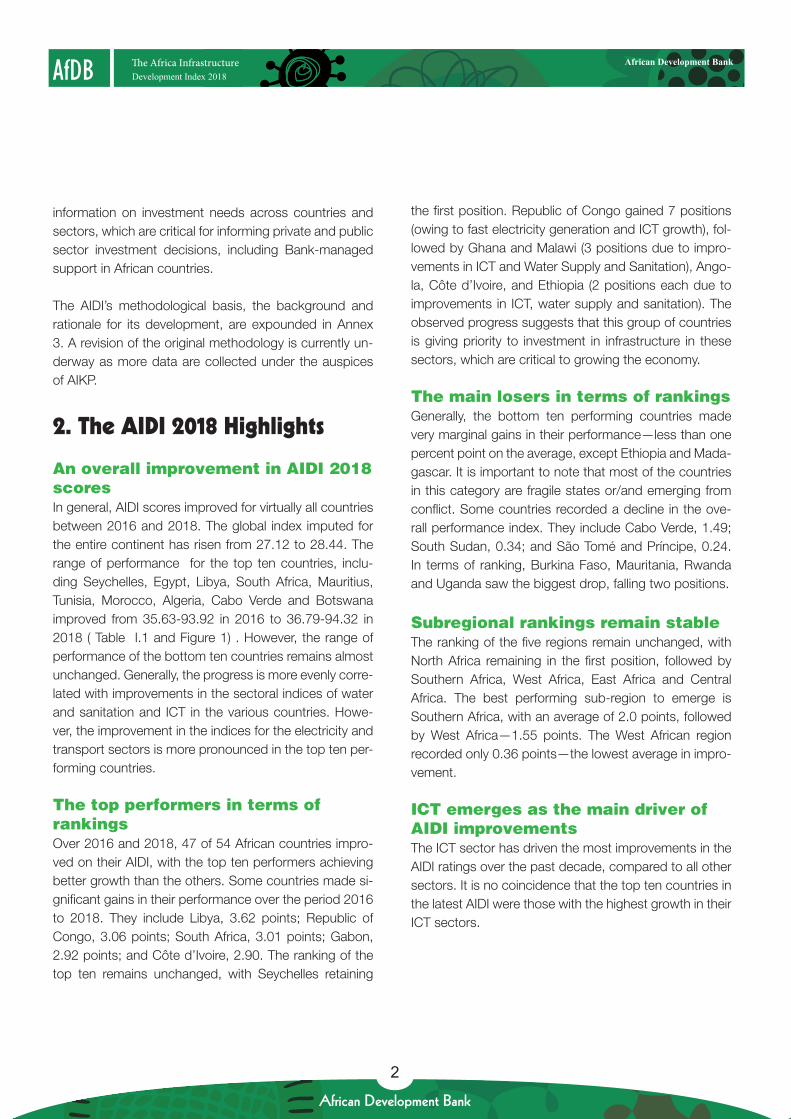
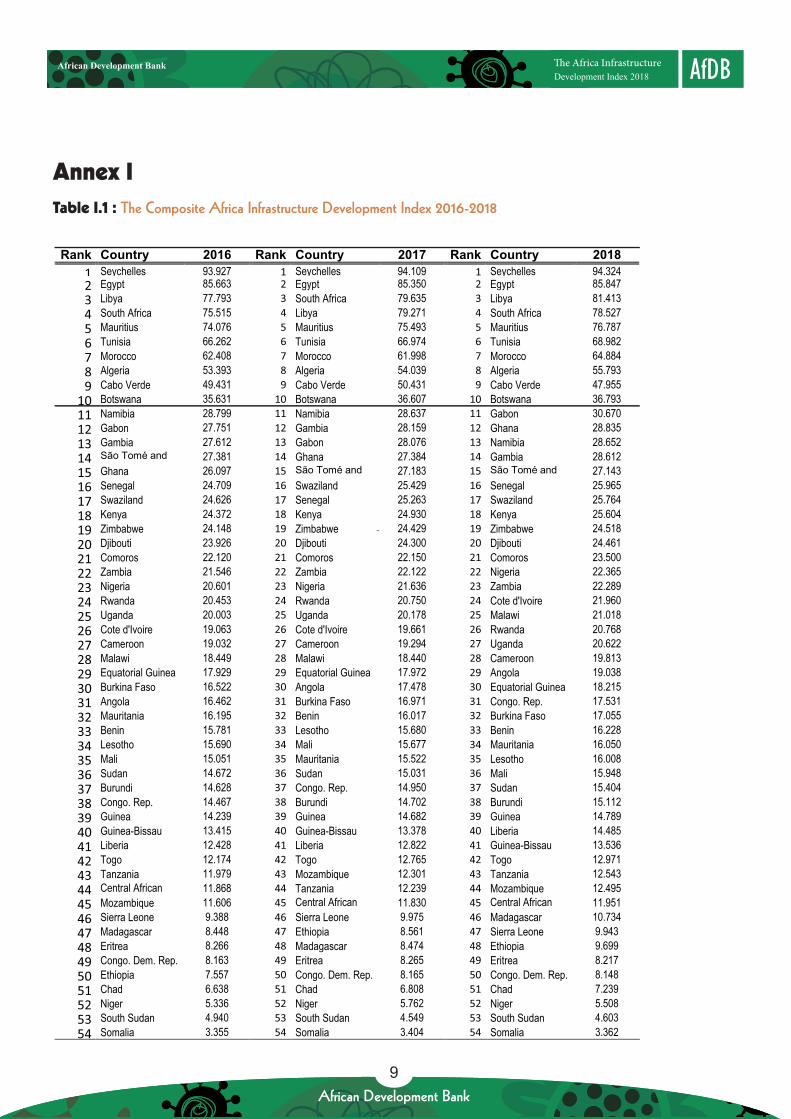
An overall improvement in AIDI 2018 scoresIn general, AIDI scores improved for virtually all countries between 2016 and 2018. The global index imputed for the entire continent has risen from 27.12 to 28.44. The range of performance for the top ten countries, inclu-ding Seychelles, Egypt, Libya, South Africa, Mauritius, Tunisia, Morocco, Algeria, Cabo Verde and Botswana improved from 35.63-93.92 in 2016 to 36.79-94.32 in 2018 ( Table I.1 and Figure 1) . However, the range of performance of the bottom ten countries remains almost unchanged. Generally, the progress is more evenly corre-lated with improvements in the sectoral indices of water and sanitation and ICT in the various countries. Howe-ver, the improvement in the indices for the electricity and transport sectors is more pronounced in the top ten per-forming countries.
The top performers in terms of rankingsOver 2016 and 2018, 47 of 54 African countries impro-ved on their AIDI, with the top ten performers achieving better growth than the others. Some countries made si-gnificant gains in their performance over the period 2016 to 2018. They include Libya, 3.62 points; Republic of Congo, 3.06 points; South Africa, 3.01 points; Gabon, 2.92 points; and Côte d’Ivoire, 2.90. The ranking of the top ten remains unchanged, with Seychelles retaining
^ Ñê á Å~å =a Éî Éä ç é ã Éå í =_ ~å â
3
Development Index 2018 AfDBAfrican Development Bank
African Development Bank
both sectors across the continent, but the rate of that growth has not been significant enough to affect indivi-dual country rankings in the AIDI.
Water supply and sanitation – disap-pointing progress for many coun-triesMany African countries have shown slower progress in water supply and sanitation, compared to developing countries in other regions of the world. Surprisingly, some countries that ranked in the top ten according to the AIDI scores still lack improved sanitation facilities, particularly in rural areas. In half of the African countries, less than 35 percent of the population have access to improved sani-tation facilities, and less than 76 percent have access to portable water.
The progress made in sanitation is still well below the targets set by the UN’s Sustainable Development Goals (SDGs). This needs to be addressed urgently, given the massive impact of this sector on the quality of life of Africans and its linkages to other sectors such as health—particularly in rural areas. Clearly, policies and investments targeting this sector are imperative to drive up overall AIDI scores and to achieve many of the SDGs.
3. Main Results
3.1. Country by country comparisonsThe AIDI 2018 results are presented in the form of scores and rankings using data collected by the Bank for the pe-riod 2010-2015. In general, scores are improving for all African countries, but not enough to boost the rankings of many countries. Figure 1 shows the status of all Afri-
can countries ranked according to the 2018 scores.
According to the AfDB report “African Telecom Infrastruc-ture Investment Needs, April 2015”, 2005-2010 was a period of very high growth for mobile telephony, marked by the emergence of new operators in the market, mas-sive growth in coverage extensions, higher broadband speeds, as well as the increase in subscriptions. The period 2010-2015 also witnessed the development of new submarine and regional overland cables, which pro-vided huge new capacity around coastal Africa, as well as facilitating mobile operator consolidation. This period also saw large investments by the private sector and the emergence of public-private partnerships (PPPs) in some countries, which has been a major factor behind the growth.
Over the next few decades, the mobile networks will need upgrading and modernization to support the shift to smartphones. The need for fiber broadband networks and the demand by both corporations, and the general public for superfast fiber access at national levels have emerged as urgent priorities to keep pace with global developments, and this will require major financial invest-ment. It is anticipated that in the near to medium term, ICT will continue to lead the growth and improvement in infrastructure development, as captured by the AIDI scores.
Transport and power recorded slower growthThe transport and power sectors require a much higher level of investment to fuel their growth. Although these sectors are crucial components of the AIDI, their contri-bution to the rankings of African countries is much lower than that of the ICT sector. Progress has been made in
^ Ñê á Å~å =a Éî Éä ç é ã Éå í =_ ~å â
4
AfDB Development Index 2018African Development Bank
African Development Bank
The AIDI 2018 shows that the top ten ranked countries remained the same as in the AIDI rankings in 2016, na-mely, Seychelles, Egypt, Libya, South Africa, Mauritius, Tunisia, Morocco, Algeria, Cabo Verde, and Botswana (cf. Table 1). Their specific ranking remains unchanged. These top ten countries are characterized principally by a robust investment performance in all sectors. Of these, five countries are in North Africa, and three are Small Is-land countries where tourism constitutes an important sector of their economies. They have therefore traditio-nally focused on improving infrastructure to attract visi-tors.
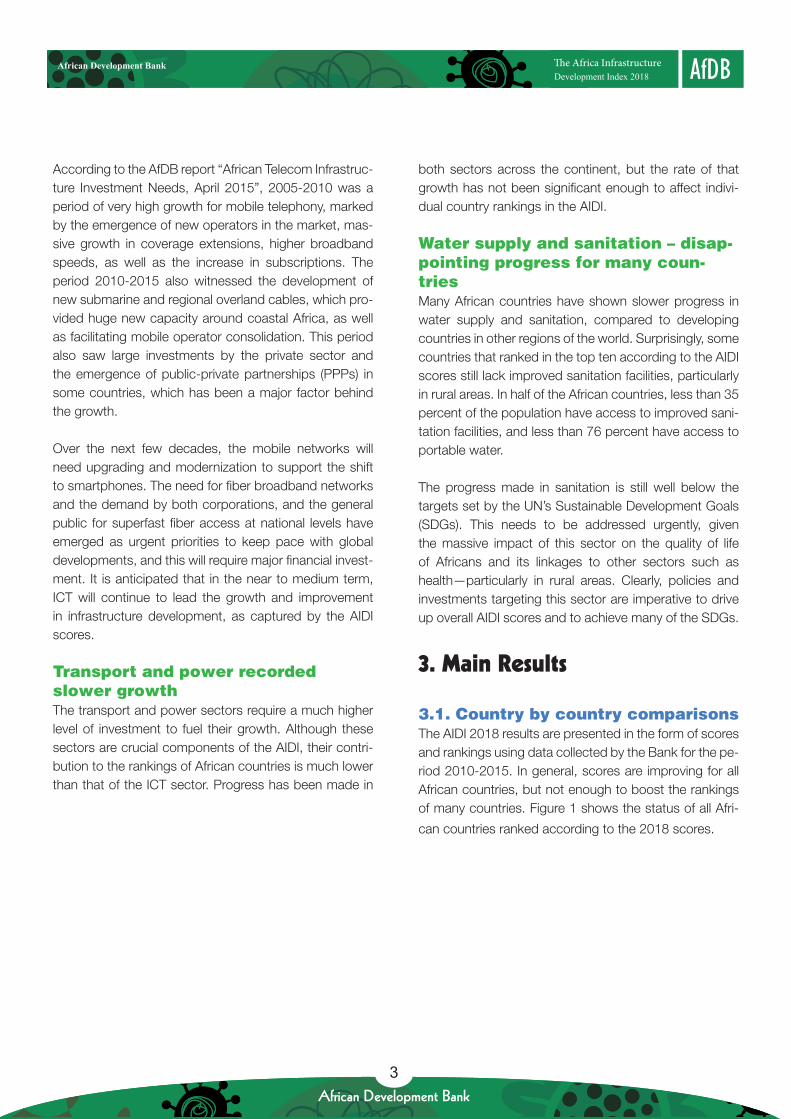
The bottom ten countries in the rankings are Central African Republic, Madagascar, Sierra Leone, Ethiopia, Eritrea, Democratic Republic of Congo, Chad, Niger, South Sudan, and Somalia. Mozambique has moved from the bottom ten countries, replaced by the Central African Republic. Notably, this group is characterized by low performance in ICT, transport, power, water and sa-nitation. It is evident that Libya, South Africa and Congo recorded the highest improvement, exceeding 3 points. Moreover, Congo Republic gained 7 positions in the ranking, moving from the 38th to 31st position. Cabo Verde recorded the worst performance, with its drop by 1.5 points, although the country remains in the top ten.
Detailed table on the AIDI index by country is presented in Annex 1.
Figure 1: AIDI 2018, Country
Scores
^ Ñê á Å~å =a Éî Éä ç é ã Éå í =_ ~å â
5
Development Index 2018 AfDBAfrican Development Bank
African Development Bank
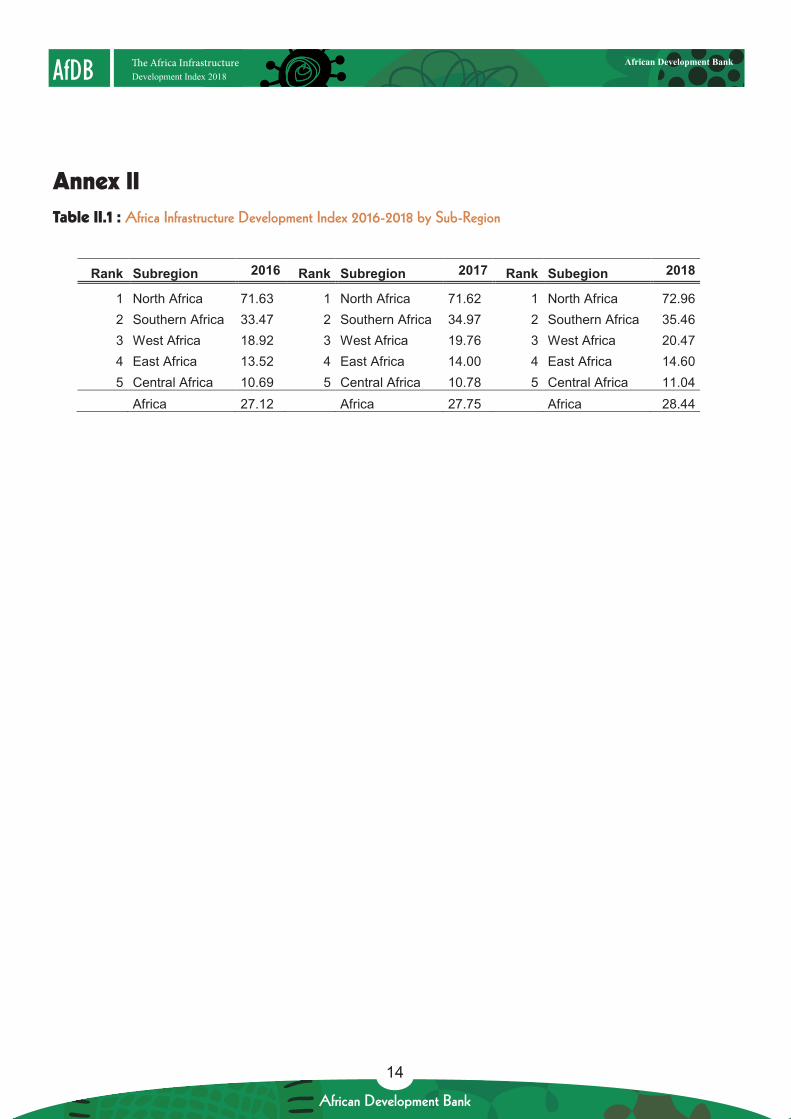
Between 2016 and 2018, Central Africa recorded a re-markable decline in both ICT and Electricity indexes. However, the subregion recorded a slight improvement in water and sanitation.
Annex 2 shows the Africa Infrastructure Development In-dex trend across subregions between 2016 and 2018.
3.3. Inequalities of access to in-frastructure servicesAfrica has the world’s fastest growing population and the highest poverty rate. The importance of access to basic infrastructure services on welfare is clear. The challenge of increasing access to these services across subregions is compounded by the unequal distribution of existing access for households in African Countries. We use the Gini coefficient here, with zero expressing perfect equality, which theoretically could mean equal access to infrastructure services, and 1 to extreme inequality.
3.2. Subregional analysis
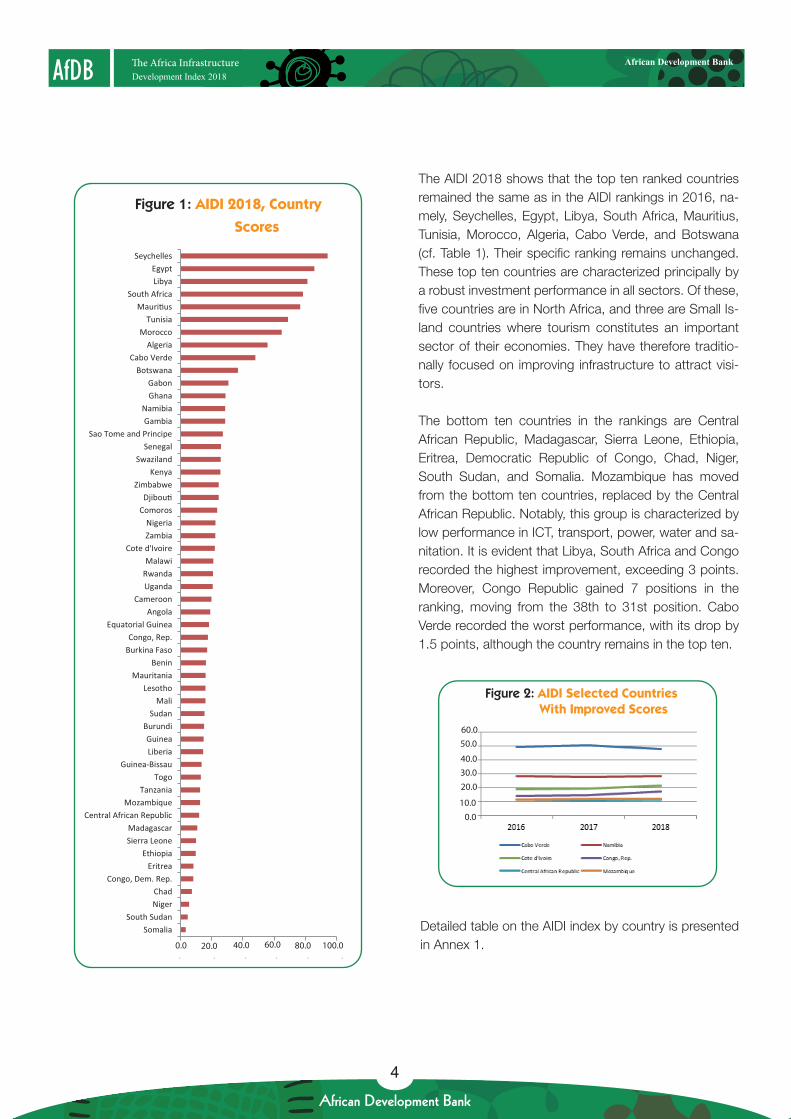
In the comparison of overall infrastructure development across Africa’s five subregions, North Africa emerges as the top performer, followed by Southern Africa, West Africa, East Africa, and Central Africa (cf. Fig. 3).
North and Southern Africa record higher performance in the following areas: ICT (mobile phone and internet subscription with greater international internet band-width), improved sanitation facilities, and transport.
On the other hand, West Africa performs well in fixed line phone subscriptions, the number of internet users, paved road density and, to a lesser degree, electricity generation.
Central Africa and East Africa recorded moderate and sometimes low performance in international internet bandwidth, paved road density, and phone subscrip-tions (both mobile and fixed). These subregions still have considerable potential for growth in these areas.
North Southem West East Central Africa Africa Africa Africa Africa Africa
Figure 5: ICT Index 2018-Subregional Comparison
^ Ñê á Å~å =a Éî Éä ç é ã Éå í =_ ~å â
6
AfDB Development Index 2018African Development Bank
African Development Bank
4. Conclusion
Virtually all major countries improved their scores in the AIDI 2018, though at different rates. The top ten coun-tries retained their overall rankings over the period. It is noteworthy that any significant improvement in the rankings of countries was mainly due to progress in the ICT sector and, to a lesser degree, in transport.
At the subregional level, no changes were recorded in the rankings over the period. However, although Central and East African countries (accounting for about 0.4 bil-lion people) have maintained their 4th and 5th position respectively, these subregions have the greatest poten-tial to improve their future scores and rankings.
Finally, although the inequalities of access to infrastruc-ture services between countries seem to be reduced over the past few years, the difference between the top ten countries and those at the bottom remains quite si-gnificant.
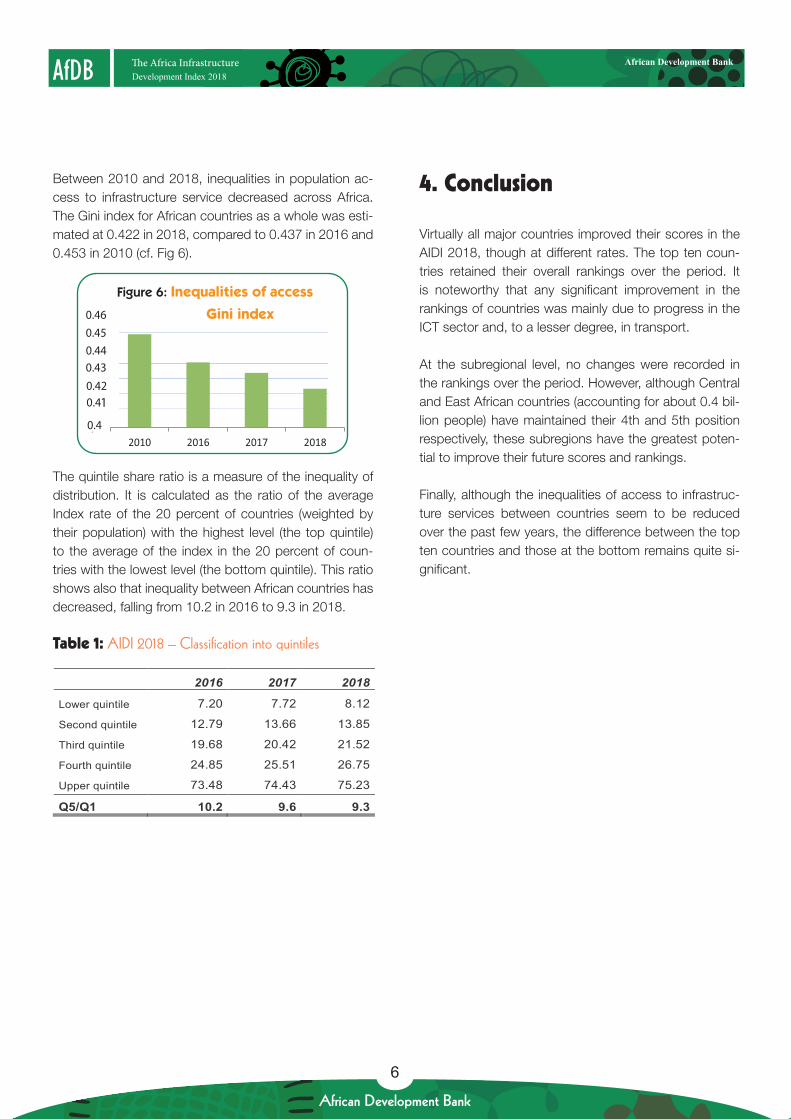
Between 2010 and 2018, inequalities in population ac-cess to infrastructure service decreased across Africa. The Gini index for African countries as a whole was esti-mated at 0.422 in 2018, compared to 0.437 in 2016 and 0.453 in 2010 (cf. Fig 6).
The quintile share ratio is a measure of the inequality of distribution. It is calculated as the ratio of the average Index rate of the 20 percent of countries (weighted by their population) with the highest level (the top quintile) to the average of the index in the 20 percent of coun-tries with the lowest level (the bottom quintile). This ratio shows also that inequality between African countries has decreased, falling from 10.2 in 2016 to 9.3 in 2018.
Table 1: AIDI 2018 – Classification into quintiles
Figure 6: Inequalities of access
Gini index
^ Ñê á Å~å =a Éî Éä ç é ã Éå í =_ ~å â
7
Development Index 2018 AfDBAfrican Development Bank
African Development Bank
Inclusive Development. Washington, DC: International Bank for Reconstruction and Development, World Bank.
8. Égert, B., Kozluk, T., and Sutherland, D. (2009). “In-frastructure and Growth: Empirical Evidence,” Working Paper 685. Paris: Organisation for Economic Coopera-tion and Development.
9. Jolliffe, I. T. (2002). Principal Component Analysis. Se-cond Edition. New York: Springer-Verlag.
10. Jolliffe, I. T., Trendafilov, N. T., and Uddin, M. (2003). “A Modified Principal Component Technique Based on the LASSO,” Journal of Computational and Graphical Statistics, 12 (3): 531–547.
11. Ncube, M. and Lufumpa, C.L. (2017). “Infrastructure in Africa: Lessons for Future Development”.v University of Bristol Policy Press.
12. Stern, N. (1991). “The Determinants of Growth,” Economic Journal, 101 (404): 122–133, January.
13. World Economic Forum (2012). The Global Competi-tiveness Report 2012–2013, New York: WEF.
References
1. African Development Bank’s Draft Report “African Te-lecom Infrastructure Investment Needs, April 2015”.
2. Anyanwu, J. C. and Erhijakpor, A. E.O. (2009). “The Impact of Road Infrastructure on Poverty Reduction in Africa.” In T. W. Beasley (ed.), Poverty in Africa. New York: Nova Science Publishers.
3. Cadima, J. and Jolliffe, I. T. (1995). “Loadings and Cor-relations in the Interpretation of Principal Components.” Journal of Applied Statistics, 22 (2): 203–214.
4. Canning, D. and Pedroni, P. (2008). “Infrastructure, Long-Run Economic Growth and Causality Tests for Cointegrated Panels,” Manchester School, 76 (5): 504–527.
5. Cattell, R. B. (1966). “The Scree Test for the Nu-mber of Factors,” Multivariate Behavioral Research, 1: 245-276.
6. Cooley, W. W. and Lohnes, P. R. (1971). Multivariate Data Analysis. New York: John Wiley & Sons.
7. Commission on Growth and Development (2008). The Growth Report: Strategies for Sustained Growth and
^ Ñê á Å~å =a Éî Éä ç é ã Éå í =_ ~å â
8
AfDB Development Index 2018African Development Bank
African Development Bank
Annexes
^ Ñê á Å~å =a Éî Éä ç é ã Éå í =_ ~å â
9
Development Index 2018 AfDBAfrican Development Bank
African Development Bank
Annex ITable I.1 : The Composite Africa Infrastructure Development Index 2016-2018
Rank Country 2016 Rank Country 2017 Rank Country 2018 1 Seychelles 93.927 1 Seychelles 94.109 1 Seychelles 94.324 2 Egypt 85.663 2 Egypt 85.350 2 Egypt 85.847 3 Libya 77.793 3 South Africa 79.635 3 Libya 81.413 4 South Africa 75.515 4 Libya 79.271 4 South Africa 78.527 5 Mauritius 74.076 5 Mauritius 75.493 5 Mauritius 76.787 6 Tunisia 66.262 6 Tunisia 66.974 6 Tunisia 68.982 7 Morocco 62.408 7 Morocco 61.998 7 Morocco 64.884 8 Algeria 53.393 8 Algeria 54.039 8 Algeria 55.793 9 Cabo Verde 49.431 9 Cabo Verde 50.431 9 Cabo Verde 47.955
10 Botswana 35.631 10 Botswana 36.607 10 Botswana 36.793 11 Namibia 28.799 11 Namibia 28.637 11 Gabon 30.670 12 Gabon 27.751 12 Gambia 28.159 12 Ghana 28.835 13 Gambia 27.612 13 Gabon 28.076 13 Namibia 28.652 14 São Tomé and 27.381 14 Ghana 27.384 14 Gambia 28.612 15 Ghana 26.097 15 São Tomé and 27.183 15 São Tomé and 27.143 16 Senegal 24.709 16 Swaziland 25.429 16 Senegal 25.965 17 Swaziland 24.626 17 Senegal 25.263 17 Swaziland 25.764 18 Kenya 24.372 18 Kenya 24.930 18 Kenya 25.604 19 Zimbabwe 24.148 19 Zimbabwe 24.429 19 Zimbabwe 24.518 20 Djibouti 23.926 20 Djibouti 24.300 20 Djibouti 24.461 21 Comoros 22.120 21 Comoros 22.150 21 Comoros 23.500 22 Zambia 21.546 22 Zambia 22.122 22 Nigeria 22.365 23 Nigeria 20.601 23 Nigeria 21.636 23 Zambia 22.289 24 Rwanda 20.453 24 Rwanda 20.750 24 Cote d'Ivoire 21.960 25 Uganda 20.003 25 Uganda 20.178 25 Malawi 21.018 26 Cote d'Ivoire 19.063 26 Cote d'Ivoire 19.661 26 Rwanda 20.768 27 Cameroon 19.032 27 Cameroon 19.294 27 Uganda 20.622 28 Malawi 18.449 28 Malawi 18.440 28 Cameroon 19.813 29 Equatorial Guinea 17.929 29 Equatorial Guinea 17.972 29 Angola 19.038 30 Burkina Faso 16.522 30 Angola 17.478 30 Equatorial Guinea 18.215 31 Angola 16.462 31 Burkina Faso 16.971 31 Congo. Rep. 17.531 32 Mauritania 16.195 32 Benin 16.017 32 Burkina Faso 17.055 33 Benin 15.781 33 Lesotho 15.680 33 Benin 16.228 34 Lesotho 15.690 34 Mali 15.677 34 Mauritania 16.050 35 Mali 15.051 35 Mauritania 15.522 35 Lesotho 16.008 36 Sudan 14.672 36 Sudan 15.031 36 Mali 15.948 37 Burundi 14.628 37 Congo. Rep. 14.950 37 Sudan 15.404 38 Congo. Rep. 14.467 38 Burundi 14.702 38 Burundi 15.112 39 Guinea 14.239 39 Guinea 14.682 39 Guinea 14.789 40 Guinea-Bissau 13.415 40 Guinea-Bissau 13.378 40 Liberia 14.485 41 Liberia 12.428 41 Liberia 12.822 41 Guinea-Bissau 13.536 42 Togo 12.174 42 Togo 12.765 42 Togo 12.971 43 Tanzania 11.979 43 Mozambique 12.301 43 Tanzania 12.543 44 Central African 11.868 44 Tanzania 12.239 44 Mozambique 12.495 45 Mozambique 11.606 45 Central African 11.830 45 Central African 11.951 46 Sierra Leone 9.388 46 Sierra Leone 9.975 46 Madagascar 10.734 47 Madagascar 8.448 47 Ethiopia 8.561 47 Sierra Leone 9.943 48 Eritrea 8.266 48 Madagascar 8.474 48 Ethiopia 9.699 49 Congo. Dem. Rep. 8.163 49 Eritrea 8.265 49 Eritrea 8.217 50 Ethiopia 7.557 50 Congo. Dem. Rep. 8.165 50 Congo. Dem. Rep. 8.148 51 Chad 6.638 51 Chad 6.808 51 Chad 7.239 52 Niger 5.336 52 Niger 5.762 52 Niger 5.508 53 South Sudan 4.940 53 South Sudan 4.549 53 South Sudan 4.603 54 Somalia 3.355 54 Somalia 3.404 54 Somalia 3.362
^ Ñê á Å~å =a Éî Éä ç é ã Éå í =_ ~å â
10
AfDB Development Index 2018African Development Bank
African Development Bank
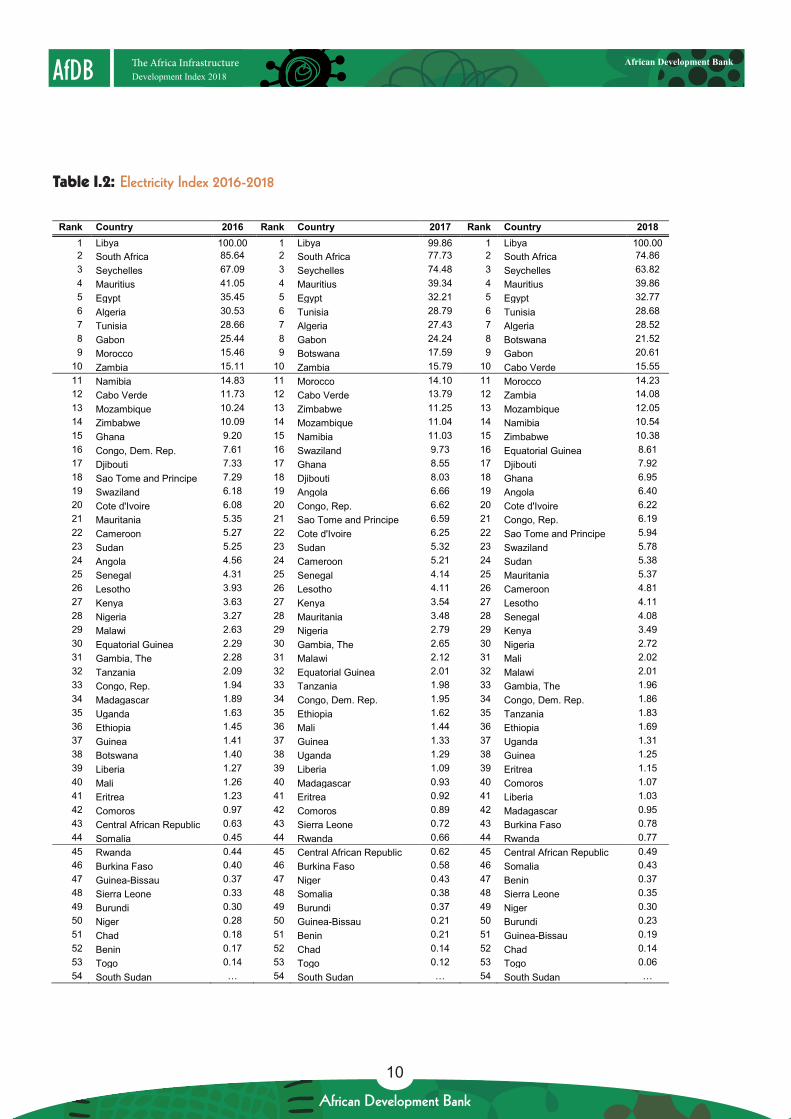
Table I.2: Electricity Index 2016-2018
^ Ñê á Å~å =a Éî Éä ç é ã Éå í =_ ~å â
11
Development Index 2018 AfDBAfrican Development Bank
African Development Bank
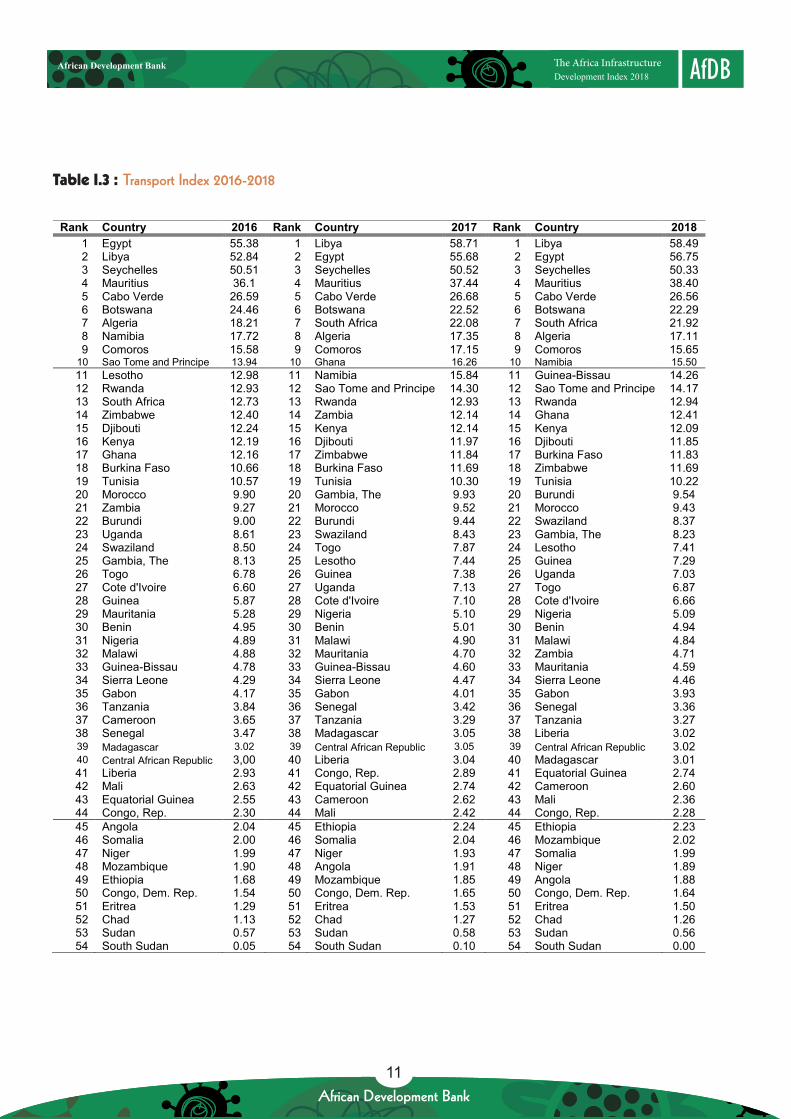
Table I.3 : Transport Index 2016-2018
^ Ñê á Å~å =a Éî Éä ç é ã Éå í =_ ~å â
12
AfDB Development Index 2018African Development Bank
African Development Bank
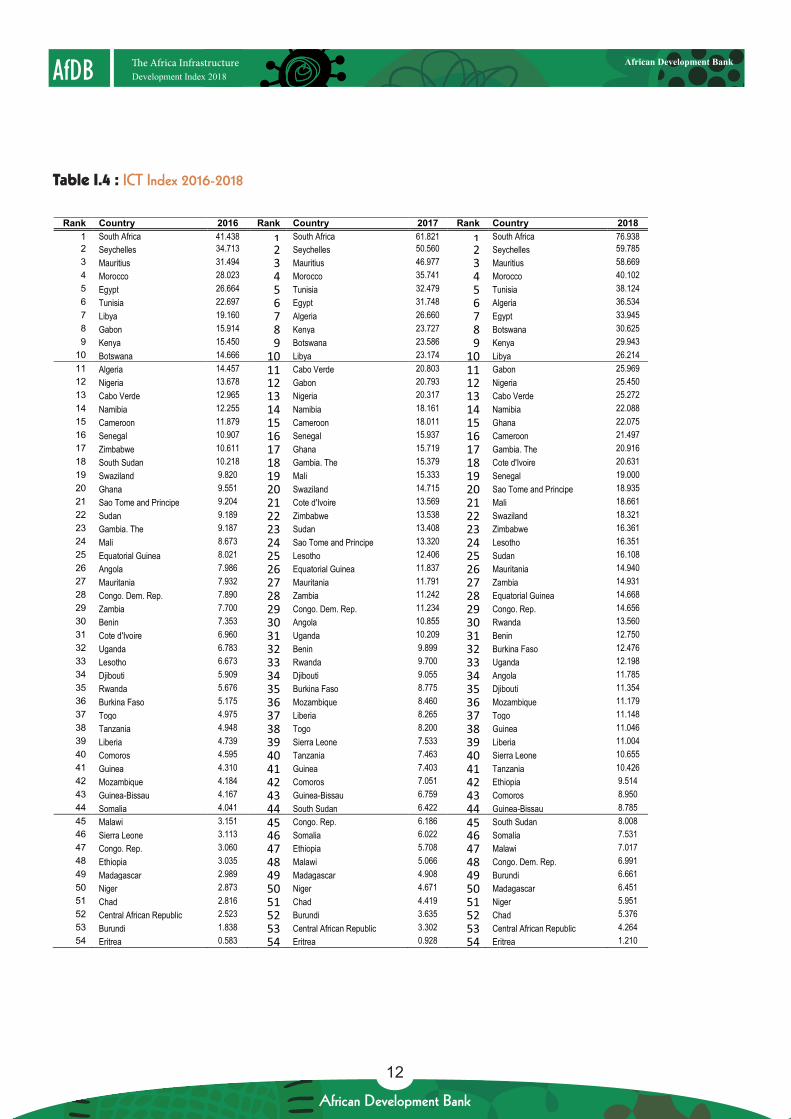
Table I.4 : ICT Index 2016-2018
^ Ñê á Å~å =a Éî Éä ç é ã Éå í =_ ~å â
13
Development Index 2018 AfDBAfrican Development Bank
African Development Bank
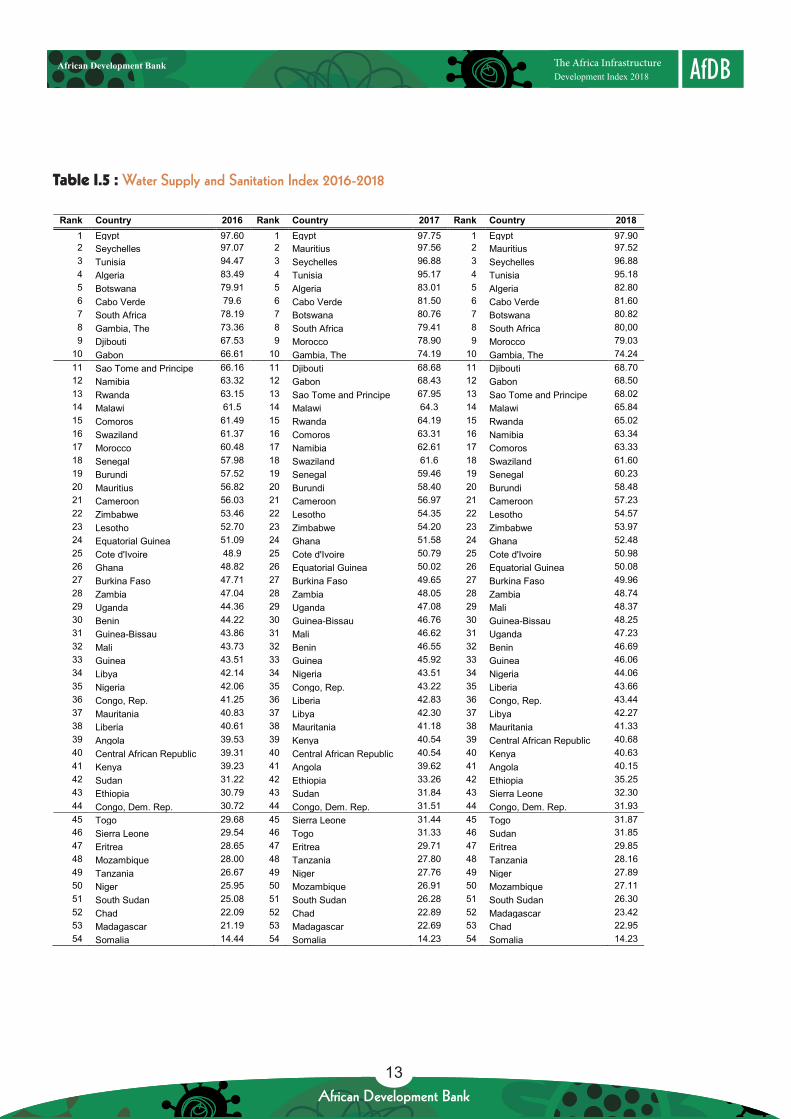
Table I.5 : Water Supply and Sanitation Index 2016-2018
^ Ñê á Å~å =a Éî Éä ç é ã Éå í =_ ~å â
14
AfDB Development Index 2018African Development Bank
African Development Bank
Annex IITable II.1 : Africa Infrastructure Development Index 2016-2018 by Sub-Region
^ Ñê á Å~å =a Éî Éä ç é ã Éå í =_ ~å â
15
Development Index 2018 AfDBAfrican Development Bank
African Development Bank
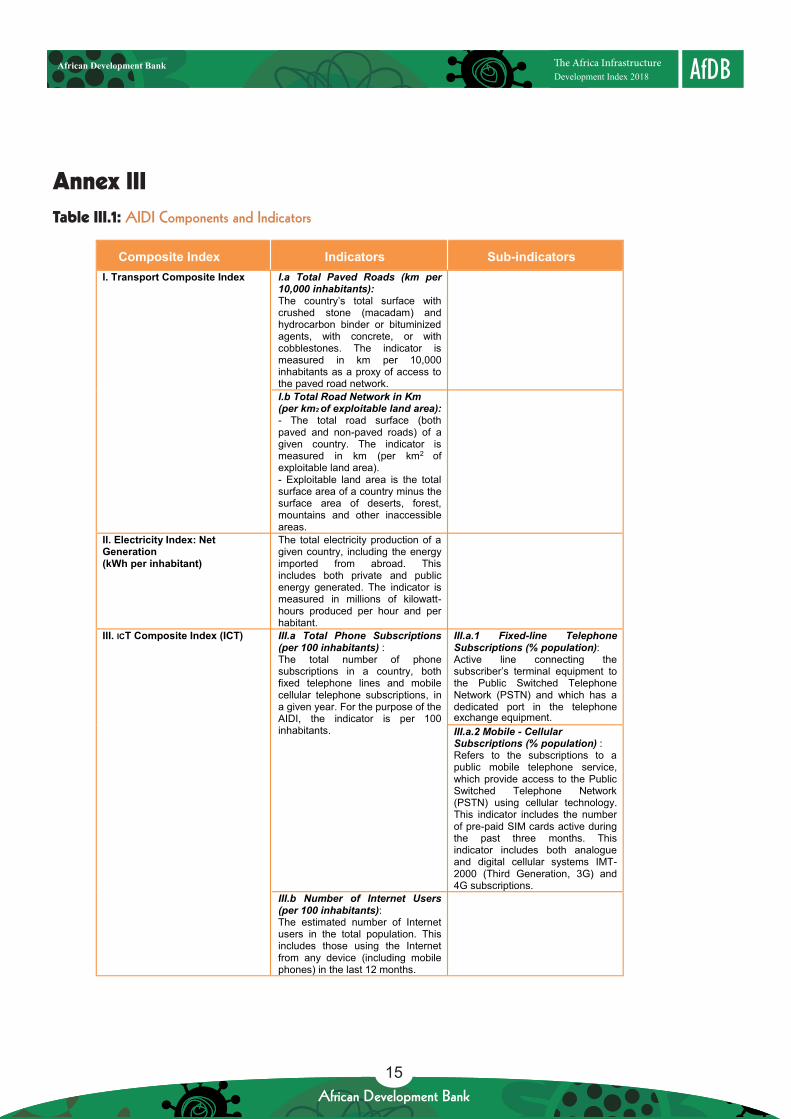
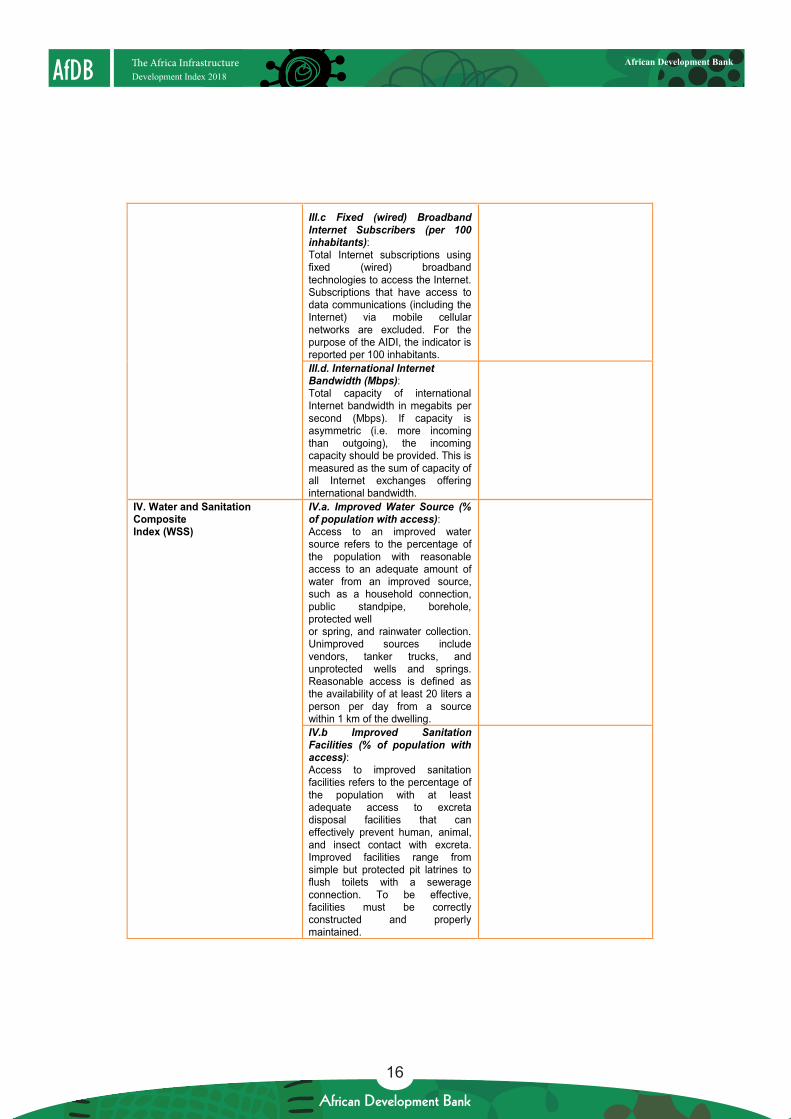
Annex IIITable III.1: AIDI Components and Indicators
^ Ñê á Å~å =a Éî Éä ç é ã Éå í =_ ~å â
16
AfDB Development Index 2018African Development Bank
African Development Bank
^ Ñê á Å~å =a Éî Éä ç é ã Éå í =_ ~å â
17
Development Index 2018 AfDBAfrican Development Bank
African Development Bank
III.2 Methodology
Data for the four components of the AIDI are collected from various sources. Each component represents a different facet of infrastructure development. The fol-lowing four steps are used in calculating the index:
Step 1: Normalization Procedure. Since the components of the AIDI are originally measured in different units, the observations are “standardized” or “normalized” to per-mit averaging, with the average regarded as a composite index. The normalization procedure used is the min–max formula applied to all observed values of each compo-nent during the period 2000–2010. This procedure ad-justs the “normalized component”to take values between 0 and 100 over the indicated period.
Step 2: Calculate a Composite Index for each Compo-nent. The composite index is calculated as a weighted average of indicators for each component that comprise more than one indicator. The weights are based on the inverse of the standard deviation of each normalized component: yt= (σtot/σx)*xt; where σtot is given by 1/σtot=Σx (1/σx) and σx is the standard deviation of the normalized component x. The rationale for step 2 is to reduce the impact of the most volatile components on the composite index and consequently the volatility of the rankings.
Step 3: Generate the AIDI Composite Index: The AIDI composite Index is computed using the sub-indeces of the four components and using the same method des-cribed in step 2.
Step 4: Generate the Subregional AIDI. Indices by su-bregion are calculated as a weighted average of the normalized components of the countries within the su-bregion The weighting variables selected are as follows: population size is used for electricity, water, sanitation and ICT (phone and internet) subscriptions, while the road network size is used for paved roads.


![LITA REMOTE EXPERIENCE INTERFACE AND INSFRASTRUCTURE 1.Science Operations Tools 1.Science Web Site [Dan Cueller (FRC)] 2.Science Operations Interface [Coppin](https://img.pdfslide.us/doc/110x75/5697bf9d1a28abf838c93ce1/lita-remote-experience-interface-and-insfrastructure-1science-operations-tools.jpg)