Embed Size (px)
Citation preview

ISSN 2077-5091
SUSTAINABLE DEVELOPMENT GOALS THREE-YEAR REALITY CHECK
AFRICA 2030
SDG Center for Africa
The Sustainable Development Goals Center for Africa (SDGC/A) is an international organization
that supports citizens, governments, civil society, businesses and academic institutions to accelerate
progress towards the Sustainable Development Goals (SDGs) in Africa.
Following the historic adoption of a new sustainable development agenda by the United Nations
General Assembly in September 2015, African leaders decided to take quick and firm action by
establishing the Center as a home-grown African institution – championing the implementation of
the SDGs in line with the principles of the African Union’s 2063 Agenda. By agreeing to establish an
African-owned center with proven technical expertise, African leaders wanted to ensure that they
act together in pursuit of a shared African development vision.
Opened in July 2016 at its headquarters in Kigali, Rwanda, the Center aims to build upon Africa’s
existing success with the Millennium Development Goals by bringing together people, ideas and
innovations to collectively achieve a more sustainable future.
AcknowledgementsThis third report, consistent with first and second versions of the Africa 2030 reports, monitors
progress towards the SDGs, including the financing of the goals, highlights trends in the run-up
to 2030, and explores the structural challenges Africa faces.
The SDGC/A would like to thank everyone who directly or indirectly contributed to this report, with
special recognition to the Program Committee of the SDGC/A Board of Directors (full list in the
Appendix) for their guidance and support. We pay special tribute to the co-chairs H.E. Paul Kagame
and Mr. Aliko Dangote.
Finally, we gratefully acknowledge the generosity and continued support of all contributing donors
and stakeholders.
Authors and Contributors
The lead authors of this third version of the report are SDG Advisors, Enock Nyorekwa Twinoburyo
(PhD), Lina Henao, Olive Dushime, Abigail Simkoko, Yigrem Kassa and Donald Ndahiro.
Other contributors are Tekalign Tsige Sahilu and Ashley Hufft.
The production of this report was directed by Dr. Belay Begashaw.
Copyright: The Sustainable Development Goals Center for Africa, 2019

www.sdgcafrica.org
June 2019
AFRICA 2030SUSTAINABLE DEVELOPMENT GOALS
THREE-YEAR REALITY CHECK
TABLE OF CONTENTS
ACRONYMS ..................................................................................................................................................................... 6
FOREWORD ...................................................................................................................................................................... 8
MAIN MESSAGES ........................................................................................................................................................... 10
ANNOTATED SUMMARY OF FINDINGS .......................................................................................................................... 14
INTRODUCTION ............................................................................................................................................................. 17
PART I. PROGRESS TOWARDS ACHIEVING THE SDGS ..................................................................................................... 19
1.1 Africa SDG Performance Review ...................................................................................................................... 21 1.2 SDG Forecasting .............................................................................................................................................. 35 1.3 MDG-related SDGs vs other SDGs ................................................................................................................... 50 1.4 Data Gaps for the SDGs ................................................................................................................................... 66 1.5 Current Performance Analysis .......................................................................................................................... 71
PART II. SDG SUPPLY-SIDE DYNAMICS ........................................................................................................................... 84
2.1 SDG Governance Framework ........................................................................................................................... 86 2.2 Financing for SDGs .......................................................................................................................................... 95
PART III. SDG SYNERGIES AND INTERACTIONS ............................................................................................................ 107
PART IV. MOVING ON ................................................................................................................................................... 116
4.1 Key Conclusions ............................................................................................................................................. 117 4.2 Recommendations ......................................................................................................................................... 119
REFERENCES ................................................................................................................................................................ 125
TABLE OF CONTENTS
5
FIGURES
PART I. PROGRESS TOWARDS ACHIEVING THE SDGS ............................................................................................................ 19
1.1 Percentage living below the national poverty line (%) 2011-2017 ......................................................................... 22 1.2 Prevalence of severe food insecurity (%) 2015 MDG-related SDGs vs other SDGs ................................................. 23 1.3 Under-five mortality rate (per 1,000 live births) 2016 ............................................................................................ 24 1.4 Total net primary enrolment rate (%) 2013-2015 ................................................................................................... 25 1.5 Proportion of seats held by women in national parliaments (%) 2017 ................................................................... 26 1.6 Access to basic water service (%) 2014 ................................................................................................................. 27 1.7 Access to electricity 2015 (%) ................................................................................................................................ 28 1.8 Unemployment 2016 (% of total labor force) ........................................................................................................ 29 1.9 Individuals using the internet (% of population) .................................................................................................... 30 1.10 Territorial CO2 emissions 2016 (metric tons) .......................................................................................................... 31 1.11 Proportion of important sites for terrestrial biodiversity that are covered by protected areas (%) 2017 ............... 32 1.12 Deaths due to conflict and terrorism 2016 (per 100,000) ...................................................................................... 33 1.13 World Bank statistical capacity indicator ............................................................................................................ 34
1.14 Regional poverty forecasts ..................................................................................................................................... 37 1.15 Historical undernutrition rates ................................................................................................................................ 40 1.16 Primary net enrolment rates in African regions and forecasts for West and Southern Africa .................................. 42 1.17 Under-five child mortality in Africa ......................................................................................................................... 44 1.18 Electrification in Africa ........................................................................................................................................... 46
1.19 Access to basic water service (%) 2014 ................................................................................................................. 48 1.20 Proportion of employed population below the international poverty line of US$1.90 per day (%) ........................ 51 1.21 Prevalence of undernourishment globally and in African regions 2005-2017 ........................................................ 52 1.22 Regional trends of under-five child mortality rates in Africa ................................................................................... 53
1.23 Regional adolescent fertility rate (births per 1,000 women ages 15-19) ................................................................ 54 1.24 Gross enrollment rate for primary schools .............................................................................................................. 55 1.25 Proportion of seats held by women in national parliaments (%) ............................................................................ 56 1.26 Total gross disbursement of ODA for water supply and sanitation (USD) ........................................................... 57
1.27 Population with access to basic sanitation services, 2015-2017 and 2030 projections .......................................... 58 1.28 Proportion of population with access to clean fuels and technologies for cooking ................................................ 59 1.29 Growth rate of real GDP per employed person (%) ................................................................................................ 60 1.30 Percentage coverage of protected areas in relation to marine areas by country 2018 .......................................... 63 1.31 Regional Red List Index ....................................................................................................................................... 64
1.32 Percentage of victims of intentional homicide per 100,000 people 2010-2015 ...................................................... 65 1.33 Number of indicators with data compared with number of indicators per SDG goal ............................................. 68 1.34 SDG data tier classification (Tiers I, II and III) ......................................................................................................... 69 1.35 Regional real GDP growth rate 2000-2023 ............................................................................................................ 73 1.36 GDP growth for African Countries ......................................................................................................................... 74 1.37 Gini coefficient of select African countries.............................................................................................................. 75

TABLE OF CONTENTS ... continued
1.38 Palma Ratio (select countries with data) ................................................................................................................ 76 1.39 Cereal yield per hectare .......................................................................................................................................... 79 1.40 Labor productivity - output per worker (GDP constant 2011 international USD in PPP) ........................................ 80 1.41 Primary completion rate, total (% of relevant age group) ...................................................................................... 81 1.42 Governance and SDG performance ....................................................................................................................... 83 PART II. SDG SUPPLY-SIDE DYNAMICS .................................................................................................................................. 84
2.1 SDG Target by type of effort .................................................................................................................................. 89 2.2 Top 10 investors in Africa by FDI stock 2016 (billions of dollars) ............................................................................ 90 2.3 Domestic revenue to GDP ................................................................................................................................... 102 2.4 ODA as share of GNI ............................................................................................................................................ 102 2.5 Net ODA to Africa, (constant 2015 prices) 2000-2016 .......................................................................................... 103 2.6 FDI flows into Africa ............................................................................................................................................ 105 2.7 Remittances to Africa ......................................................................................................................................... 106
PART III: SDG SYNERGIES AND INTERACTIONS ................................................................................................................... 107
3.1 Positive interactions between SDG 7 targets and the other SDG targets .............................................................. 112 3.2 Target central role by degree centrality ............................................................................................................... 113 3.3 Target central role by eigenvector centrality ......................................................................................................... 113 3.4 Target central role by betweenness centrality .................................................................................................... 114 3.5 Target central role by closeness centrality ............................................................................................................ 114
TABLES
PART II. SDG SUPPLY-SIDE DYNAMICS .................................................................................................................................. 84
2.1 Sources of top 10 investor FDI by North and South 2016 ....................................................................................... 90 2.2 SDG 17 target categorization ................................................................................................................................. 91 2.3 Share of total assets to GDP of selected National Development Banks ................................................................101
PART III. SDG SYNERGIES AND INTERACTIONS ................................................................................................................... 107
3.1 Overview of identified positive interactions between the targets of SDG 7 and other SDG targets ..................... 110
ACRONYMS
AAAA Addis Ababa Action AgendaAADFI Association of African Development Finance InstitutionsACFTA African Common Free Trade Agreement AfDB African Development BankAIDI Africa Infrastructure Development Index AIIB Asian Infrastructure Investment BankAPRM African Peer Review MechanismAU African UnionBNDES Banco Nacional de Desenvolvimento Econômico e SocialBNDES Brazil Development BankCDB China Development BankCEN–SAD Community of Sahel-Saharan StatesCIT Corporate Income TaxCOMESA Common Market for Eastern and Southern AfricaDAC Development Assistance Committee DBE Development Bank of EthiopiaDBSA Development Bank of South AfricaEAC East African Community ECA Economic Commission for Africa, ECCAS Economic Community of Central African StatesECOWAS Economic Community of West African StatesFAO Food and Agriculture OrganizationFDI Foreign Direct InvestmentGDP Gross Domestic ProductGNI Gross National Income HCI Human Capital Index HDI Human Development IndexHLPF High-level Political ForumIAEG SDGs Inter-agency and Expert Group on SDG Indicators IEA International Energy Agency IEA International Energy AgencyIGAD Intergovernmental Authority on Development andIHDI Inequality–adjusted Human Development IndexIIAG Ibrahim Index of African Governance ILO International Labour Organization IMF International Monetary FundIRENA International Renewable Energy AgencyIUCN International Union for Conservation of Nature JMP oint Monitoring ProgrammeKDB Korea Development Bank of KoreaKfW Kreditanstalt für WiederaufbauMDG Millennium Development Goal NDBs National Development BanksNDCs Nationally Determined Contributions NDPII Second National Development Plan NEPAD New Partnership for Africa’s Development
ODA Official Development AssistanceOECD Organization for Economic Cooperation and DevelopmentPIT Personal Income Tax PPP Public Private PartnershipREAP Renewable Energy Access Project REC Regional Economic CommunitySADC Southern African Development CommunitySDG Sustainable Development GoalSDGC/A Sustainable Development Goal Center for Africa SDSN Sustainable Development Solutions NetworkSNA Social Network Analysis SSA Sub-Saharan AfricaTFP Total Factor Productivity UDB Uganda Development BankUMA Arab Maghreb Union UN United NationsUNCTAD United Nations Conference on Trade and DevelopmentUNDP United Nations Development ProgrammeUNECA United Nations Economic Commission for AfricaUNFCCC United Nations Framework Convention on Climate Change UNICEF United Nations Children’s FundVNR Voluntary National Reviews WDI World Development IndicatorsWHO World Health Organisation
At a political level, the 2030 Agenda for Sustainable Devel-opment (SDG 2030) and the Addis Ababa Action Agenda (AAAA) have been universally adopted. African nations have already committed to achieving the goals of the SDG 2030 and the Africa Union Agenda 2063. When the con-tinent first adopted the 2030 Sustainable Development Agenda, its starting point was lower than other regions. African countries had huge development needs, but their economies faced a rapidly deteriorating fiscal space with rising levels of debt. Today, there is still a gap between what the agendas demand and what is workable on the ground. The ratification of the agenda and funding frameworks at the country level remain incomplete, as is the monitoring of progress – which remains largely voluntary. Voluntary national reporting schemes are incomprehensive, irregular and don’t always provide comparative data.
SDG data is thus scarce, and incomprehensive and inconsist-ent where it exists. The majority of African countries do not possess updated data for crucial indicators such as poverty, health, nutrition, education, infrastructure; where they do possess it, the latest available is from 2015. Internationally-generated data has proven insufficient to make up for this in assessing progress over the first three years. This has con-sequences: having no data undermines a country’s capacity to establish SDG baselines and to track the performance of indicators to reinforce evidence-based decision-making. Based on data for some SDG indicators, there has been notable progress towards only three goals: SDG 5 Gender equality, SDG 13 Climate action and SDG 15 Life on land. Where data exists, and with 12 years remaining, progress on the other fourteen goals remains off-track and the goals are unlikely to be met if rapid and unified action is not taken.
FOREWORD
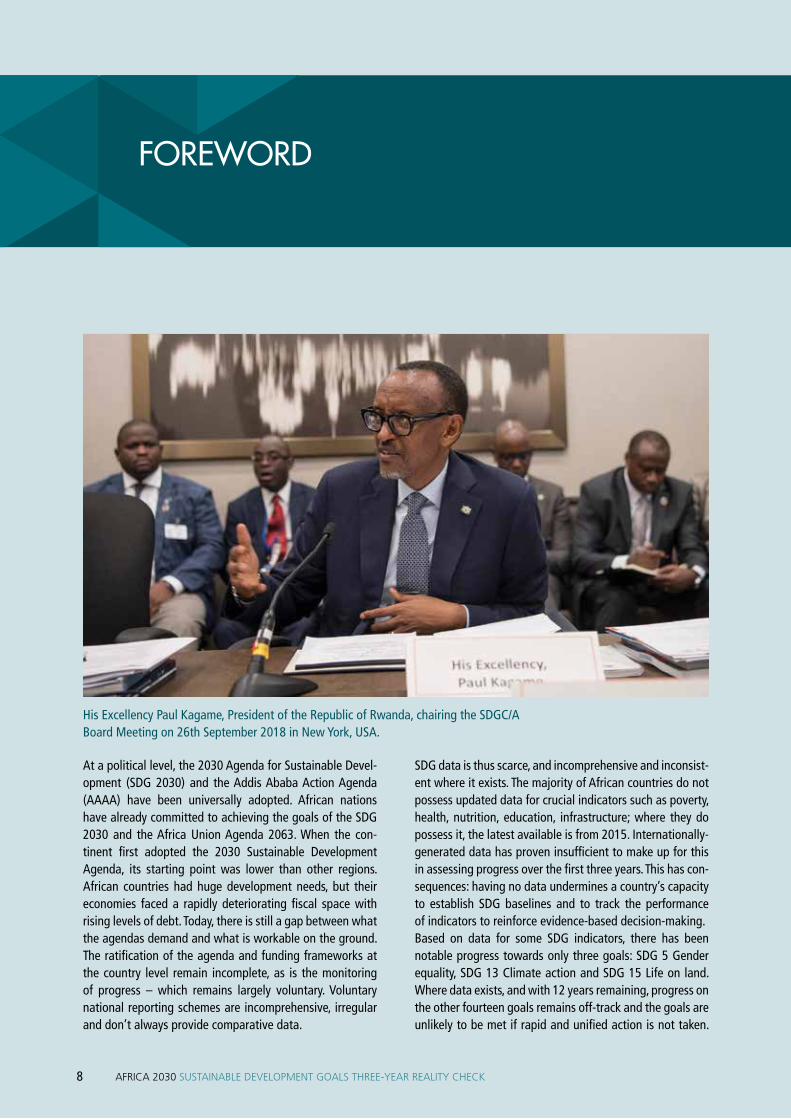
His Excellency Paul Kagame, President of the Republic of Rwanda, chairing the SDGC/A Board Meeting on 26th September 2018 in New York, USA.
8 AFRICA 2030 SUSTAINABLE DEVELOPMENT GOALS THREE-YEAR REALITY CHECK

For the people-centered goals, progress continues to be outstripped by high population growth. Africa’s continued lack of demographic transition will structurally constrain the attainment of SDGs (people-centered as well as other goals). Social inclusion remains a key challenge. However, SDG performance across the different regions in Africa is heterogeneous, with North Africa ahead of others.
The lack of progress on SDGs in Africa is a shared failure for all stakeholders. There is a persistent lack of clarity on mutual accountability mechanisms. This is also exhibited on the supply side, where the financing for SDGs is well below the requisite levels. Public revenue shortfalls are sizable, the pace of reform is slow, and one in five African countries does not raise enough in revenues to meet its basic state functions. Very slow or no action characterizes the devel-opment of National Financing Frameworks as stipulated in the AAAA. Also, external inflows continue to be constrained by inward-looking policies and tight global economic and financial conditions. However, financial outflows – particu-larly illicit financial flows – remain large, and exceed each of the main financial inflows into Africa (ODA, remittances and FDI).
The attainment of SDGs by African countries will not be business as usual. Africa’s failure to attain SDGs will have implications everywhere on the planet. Africa must step up, but shared pragmatic responsibility is also critical. Tradi-tional financial flows are key, as are external support for domestic revenue and statistical reforms. Political support for statistics, backed by the requisite financial instruments and resources, remains the most significant factor for data
revolution in Africa. An annual data tracking system for AAAA is crucial, as is the establishment of Africa-based funds for social inclusion. Continent-based accountability mechanisms are also needed, as well as support for exist-ing mechanisms. An evidence-based understanding of the synergies of SDGs is important so that national budgeting and mainstreaming can take them into account.
This report provides a holistic digest of the progress, con-straints and challenges that Africa continues to face, and it should form the basis for each stakeholder’s work plan going forwards. Opportunities exist: untapped investment opportunities and the growth of financial and technologi-cal innovations can be harnessed to support the imple-mentation of SDGs. All stakeholders should strive for full transparency while documenting and coordinating their efforts. Accountability mechanisms at the continent-wide level could leverage the mapping and tracking of the goals. Speeding up market integration will not only spur pockets of South-South cooperation but also drive progress towards the SDGs.
This report provides a three-year reality check on SDG pro-gress and has benefitted from far-reaching consultation with stakeholders. Its analysis and the next steps that it proposes should form the basis for our shared journey. If we truly work together, we can still leave no one behind.
Belay Begashaw, Ph.D. Director General
9AFRICA 2030 SUSTAINABLE DEVELOPMENT GOALS THREE-YEAR REALITY CHECK
10
MAIN MESSAGES
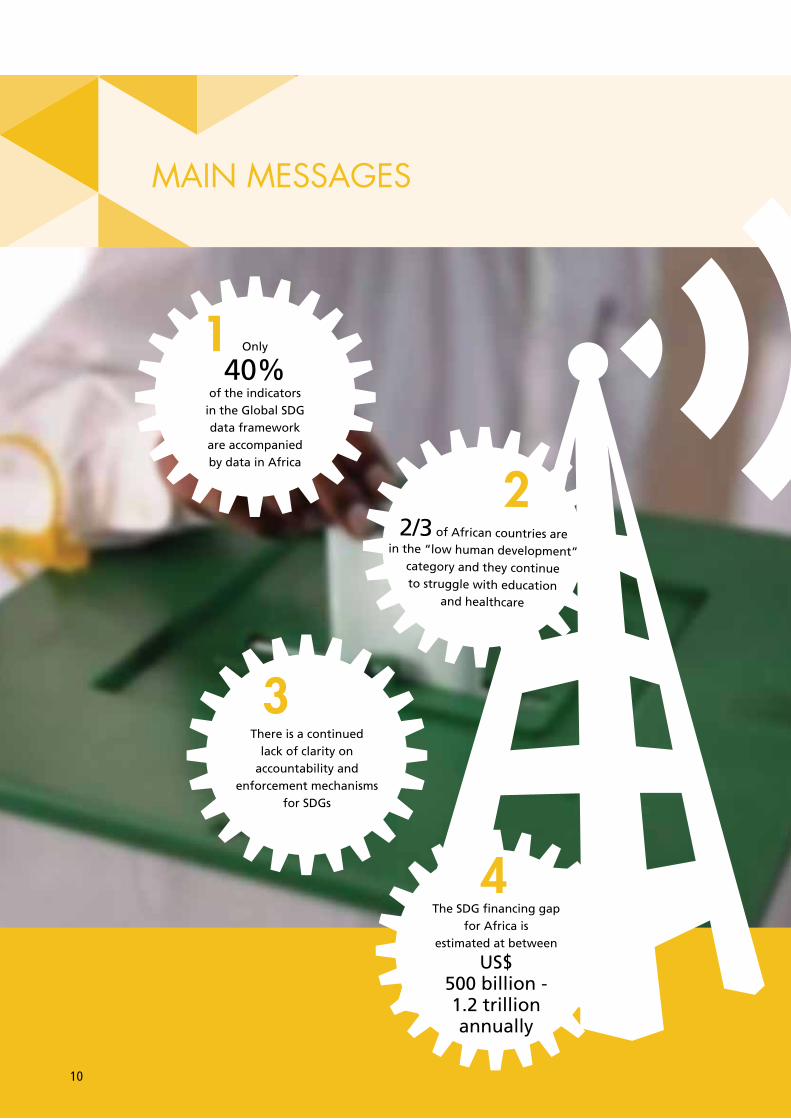
1 Only 40%
of the indicators in the Global SDG data framework are accompanied by data in Africa
3There is a continued
lack of clarity on accountability and
enforcement mechanisms for SDGs
The SDG financing gapfor Africa is
estimated at between
US$500 billion -1.2 trillionannually
4
22/3 of African countries are
in the “low human development” category and they continue to struggle with education
and healthcare

11AFRICA 2030 SUSTAINABLE DEVELOPMENT GOALS THREE-YEAR REALITY CHECK
The lack of comparable surveys is largely due to different survey timelines, which make it difficult to measure trends and compare nations. Beyond comparability, the scope, comprehensiveness, quantity and quality of the household surveys vary. Only half of the 54 African countries have produced comparable surveys over the last two decades – and most of these pre-date the SDG era. The irregularity of household surveys, censuses and high frequency data is also a problem. On average, African countries have carried out one survey every five years since the 1990s but many of them are not of the requisite operational and methodologi-cal standards. The reliance on modelled estimates by inter-national agencies, meanwhile, is problematic – population heterogeneity makes statistical modelling unreliable as the method for making adjustments/projections to ensure cross-country comparability. The data challenges reflect low levels of financial and political commitment and ex-penditure as well as a poor statistical capacity at national and regional levels. Only 22% of African countries are be-lieved to have independent statistics offices. Overall, the limited data profile for SDGs also makes evidence-planning for SDGs difficult, and compromises the transparency and eventual accountability.
2. ECONOMIC GROWTH REMAINS SUBDUED, AS DOES SOCIAL ECONOMIC INCLUSION
Africa saw unprecedented economic growth during the last two decades or so. In recent years, this growth has pla-teaued or failed to achieve its potential and many believe it has not been inclusive or consistent with the people and prosperity pillars of the SDGs. Growth remains lower than
MAIN MESSAGES
The holistic approach taken in this report reveals wide-ranging but overlapping and intertwined findings. The report identifies four main SDG issues that require the at-tention of everyone and are requisites for us to catch up on our pledge, “no one will be left behind”. If left unad-dressed, however, these issues will jeopardize the entire Agenda.
1. LARGE DATA GAPS CONTINUE TO PREDOMINATE Evidence-based planning is essential for sustainable devel-opment and Africa’s transformation. The 17 SDGs, with 169 targets and 232 indicators, require different levels of re-porting – national, regional and global. The huge demand for statistics to leverage effective planning and monitor-ing of SDGs has not been matched. The global indicator framework to monitor the 2030 Agenda was adopted nearly two years after the SDGs, in September 2015. Some of the indicators were adopted without any matching base-line information – which also raises questions about the SMART-ness (Specific, Measurable, Achievable, Realistic and Time-bound) of the indicators. The Agenda remains incomplete in terms of data-profiling and methodology. Nearly half of 169 targets are still not quantified to en-able effective assessment of progress and implementation. Tier III indicator methodology is not yet in place and, while Tier II has an internationally established methodology and standards, regular data production has not materialized.
Only 40% of the indicators in the Global SDG data frame-work are accompanied by data in Africa. Even where data exists, much is outdated, or incomparable across countries.

12 AFRICA 2030 SUSTAINABLE DEVELOPMENT GOALS THREE-YEAR REALITY CHECK
the SDG 8 target of at least 7% per annum. Social inclu-sion is in part constrained by the rapid population growth, which outstrips most of the SDG progress in key areas. The fact that 10 out of 17 SDGs are people-centered implies that the lack of demographic transition constrains struc-tural and social economic development. While the share of the African population in extreme food and income pov-erty has reduced over the years, the absolute number of people in poverty has increased. Global poverty remains concentrated in Africa, which is home to more than half of the world’s poor. Over 60 million children are stunted in Af-rica and over 280 million people are malnourished. Current forecasts show that 2030 targets for both malnutrition and poverty will not be realized. Meanwhile, the rate of pov-erty reduction associated with economic growth (growth elasticity to poverty reduction) has declined. Similarly, in-equality remains obstinately high, putting African societies among the most unequal in the world.
The performance on other human-centered SDG indicators is ominous. Two thirds of African countries are in the “low human development” category and they continue to strug-gle with education and healthcare. The average productiv-ity of an African 18-year old who is born today will be less than half that of a child who receives a good level of edu-cation and healthcare. Both under-five mortality and ma-ternal mortality in sub-Saharan Africa have improved in the last two decades but they remain the highest in the world. Under-five mortality stands at three times the 2030 target of 25 per 1000 live births. By 2030, no country should have more than 140 maternal deaths per 100,000 live births, but nearly 40% of African nations currently have over 500 ma-ternal deaths per 100,000 live births.
MAIN MESSAGES
3. GLOBAL SDG FRAME-WORK IS IN PLACE BUT LACKS FULLY FLEDGED IMPLEMENTATION AND ACCOUNTABILITY MECHANISMS
The formulation and adoption of SDGs in September 2015 laid the foundation for a comprehensive and interrelated global and local agenda to address the planet’s sustain-able development challenges. When the Millennium Devel-opment Goal (MDG) targets expired in 2015, discourse was informative and substantive but also democratic, repre-sentative and inclusive. The SDG agenda was distinguished from other global accords for its clarity of purpose, time-bounded set of targets and indicators, definitive partner-ships, and the funding framework enshrined in the Addis Abba Action Agenda (AAAA).
However, the formulation and the implementation of SDGs over the last three years reveals gaps and loose ends that are either shallowly addressed or entirely skipped over. There is a continued lack of clarity on accountability mechanisms for SDGs. Despite the endorsements and com-mitments of stakeholders, there is no system in place to quantify and account for their contributions. Nor is there a mechanism for ensuring compliance.
Without a mandatory reporting mechanism to measure collective progress, the High-level Political Forum (HLPF), which has supposedly facilitated voluntary reporting by sovereign nations for the last three years, is technically un-sound. Countries choose what to report. Naturally, those who have come forward (so far only 19 African countries)

13AFRICA 2030 SUSTAINABLE DEVELOPMENT GOALS THREE-YEAR REALITY CHECK
prefer to report on low-hanging fruits. This obscures the true picture of their effort and performance, and has an im-pact both nationally and in aggregate. It also makes com-parison untenable. The weaknesses in accountability also manifest on the supply side – particularly when it comes to financing SDGs. African nations are expected to invest in support of global agendas such as climate change, marine conservation, and other bio-diversity issues even though they are struggling to meet their own health and education needs and are not responsible for climate change. Three years after the adoption of the Paris Agreement, climate finance to Africa is insufficient or unrealized. In some coun-tries, policies on climate change are moving in contraven-tion of the agreement.
4. FINANCING FOR SDGS HAS FALLEN WOEFULLY SHORT OF TARGETS – AND THE FUNDING GAP IS PARTICULARLY LARGE IN AFRICA
The framework for financing for the SDGs is provided by the Addis Abba Action Agenda (AAAA), adopted in July 2015. The framework identifies the main sources of domes-tic and global financing, such as domestic taxation, Official Development Assistance (ODA), remittances, Foreign Direct Investment (FDI), philanthropy, development banks and other innovative measures. Both globally and in Africa, the vision of turning billions into trillions for development fi-nancing is far from realized. As such, the SDGs’ wide-rang-ing investment needs exceed the scope of the available op-tions. Less than half of the OECD’s Development Assistance
Committee (DAC) members are meeting the target of 0.7% of Gross National Income (GNI). Shortfalls in foreign assis-tance have not been matched by improvements in domes-tic revenue. The domestic revenue gap remains large: 20% of African countries generate less than 15% of their GDP through domestic revenue, and just 13% of revenue from tax. Illicit financial flows remain large and easily exceed the level of foreign aid received annually.
Remittances have become the most important source of foreign income into Africa, exceeding both ODA and FDI. They averaged US$63 billion per annum between 2011 and 2016. However, the cost of sending remittances to Africa is high, averaging 7.2% in 2017. This is more than double the SDG target of 3%. FDI has reduced over the years while the growth of ODA is marginal. The outlook for foreign income is uncertain when viewed in the context of rising national-ism, a narrowing fiscal space, underperforming advanced economies and volatile commodity prices. National Devel-opment Banks in Africa account for a tiny proportion of total assets—in the range of 0.3% to 2.7% of GDP—com-pared with other regions where development banks have loan portfolios worth over 15% of GDP. Other financial inflows to Africa are poorly documented, but what data exists shows that South-South co-operation, financing in-novations and philanthropy are scarce and insignificant. Public Private Partnerships are growing in number but half of the existing projects face serious problems. If Africa is left alone, it will face a funding gap of between 10% and 15% of GDP for selected areas in Education, health, wa-ter, energy, and road infrastructure. Africa is left alone, it will face a funding gap of between 10% and 15% of GDP for selected areas in education, health, water, energy, and road infrastructure. For all SDGs, the funding gap is large for Africa, estimated at between USD 500 billion and USD 1.2 trillion.
14 AFRICA 2030 SUSTAINABLE DEVELOPMENT GOALS THREE-YEAR REALITY CHECK
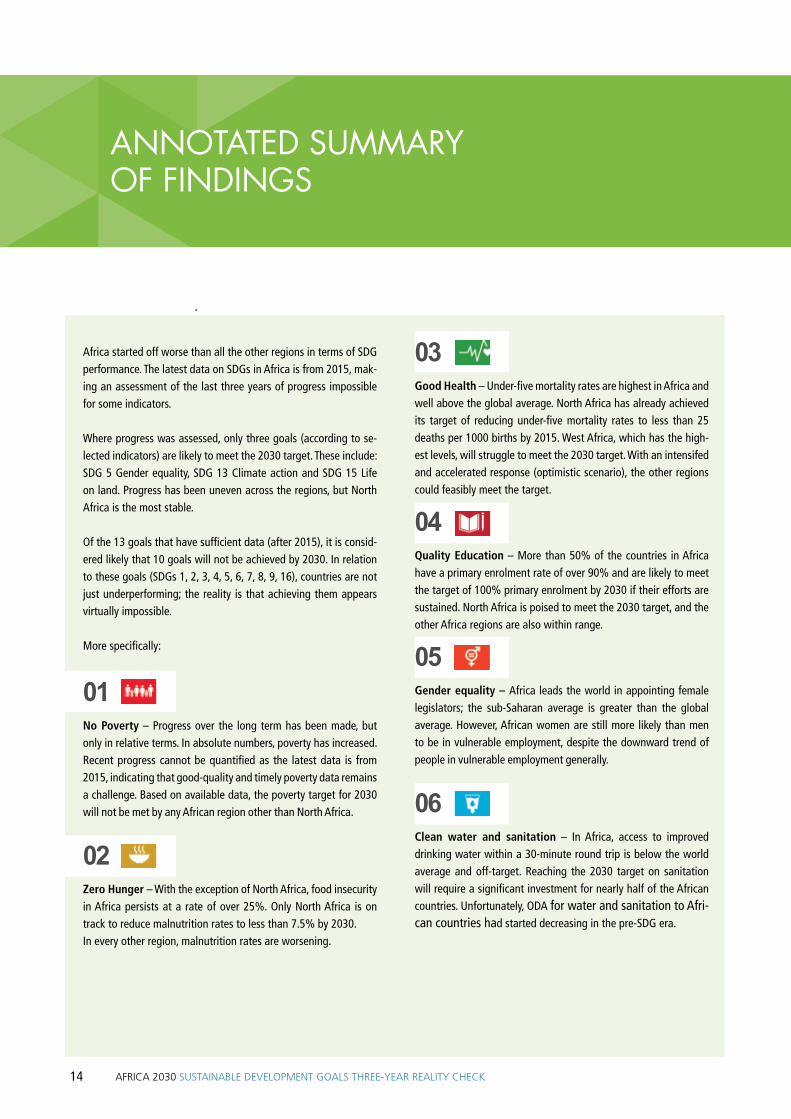
Africa started off worse than all the other regions in terms of SDG performance. The latest data on SDGs in Africa is from 2015, mak-ing an assessment of the last three years of progress impossible for some indicators.
Where progress was assessed, only three goals (according to se-lected indicators) are likely to meet the 2030 target. These include: SDG 5 Gender equality, SDG 13 Climate action and SDG 15 Life on land. Progress has been uneven across the regions, but North Africa is the most stable.
Of the 13 goals that have sufficient data (after 2015), it is consid-ered likely that 10 goals will not be achieved by 2030. In relation to these goals (SDGs 1, 2, 3, 4, 5, 6, 7, 8, 9, 16), countries are not just underperforming; the reality is that achieving them appears virtually impossible.
More specifically:
01No Poverty – Progress over the long term has been made, but only in relative terms. In absolute numbers, poverty has increased. Recent progress cannot be quantified as the latest data is from 2015, indicating that good-quality and timely poverty data remains a challenge. Based on available data, the poverty target for 2030 will not be met by any African region other than North Africa.
02Zero Hunger – With the exception of North Africa, food insecurity in Africa persists at a rate of over 25%. Only North Africa is on track to reduce malnutrition rates to less than 7.5% by 2030. In every other region, malnutrition rates are worsening.
ANNOTATED SUMMARY OF FINDINGS
03Good Health – Under-five mortality rates are highest in Africa and well above the global average. North Africa has already achieved its target of reducing under-five mortality rates to less than 25 deaths per 1000 births by 2015. West Africa, which has the high-est levels, will struggle to meet the 2030 target. With an intensifed and accelerated response (optimistic scenario), the other regions could feasibly meet the target.
04Quality Education – More than 50% of the countries in Africa have a primary enrolment rate of over 90% and are likely to meet the target of 100% primary enrolment by 2030 if their efforts are sustained. North Africa is poised to meet the 2030 target, and the other Africa regions are also within range.
05Gender equality – Africa leads the world in appointing female legislators; the sub-Saharan average is greater than the global average. However, African women are still more likely than men to be in vulnerable employment, despite the downward trend of people in vulnerable employment generally.
06Clean water and sanitation – In Africa, access to improved drinking water within a 30-minute round trip is below the world average and off-target. Reaching the 2030 target on sanitation will require a significant investment for nearly half of the African countries. Unfortunately, ODA for water and sanitation to Afri-can countries had started decreasing in the pre-SDG era.

15AFRICA 2030 SUSTAINABLE DEVELOPMENT GOALS THREE-YEAR REALITY CHECK
07Affordable and clean energy – Half of the continent has electri-fication rates of less than 40%. North Africa is on track to achieve 100% electrification by 2030, and East Africa could be on track for universal electrification if investment increases. The other regions are way off-track.
08Decent work and economic growth – Unemployment remains high in Africa, reflecting the demographic challenge as well as lack of structural change. Over 40 countries have unemployment rates of over 5%. The real GDP per person employed has also fallen.
09Industry, innovation and infrastructure – Internet usage in Af-rica remains very low when compared with the rest of the world. Nearly half of African countries have internet access rates of less than 20%.
10Reduce inequality within and among countries – While no SDG data exists to assess this indicator, growing evidence shows that Africa is one of the most unequal regions in the world. Based on a measure of total resource flows for development, inequality worsened in 25 African countries between 2000 and 2015.
11Sustainable cities and communities – Africa is less urbanized than other regions in the world. While indicators and data are lacking, 13 countries have formulated and 21 are in the process of implementing national urban policies
12Sustainable consumption and production – There is no data available on any of the indicators.
13Climate action – Africa is the best performing region in the world when it comes to CO2 emissions. Of the world’s worst twenty per-formers, only one is African: South Africa, which produces 467.7 MT per annum. Egypt and Algeria are the next worst offenders.
14Life below water – There is no data available to assess the prog-ress. However, most of the countries with maritime borders do not have protected areas for marine life.
15Life on land – The continent is performing relatively well with a good amount of protected land dedicated to supporting biodiver-sity. The only two regions with a greater proportion of protected areas relative to areas of biological significance are Europe and North America. If the continent implements and enforces concert-ed and focused policy interventions, it should be on track to meet the 2030 target.
16Peace, justice and strong institutions – The number of deaths caused by conflict or terrorism in Africa is alarming in some coun-tries, particularly Somalia, Libya and Sudan. North Africa has the lowest number of all African regions – but it is still significantly higher than the global average. However, the 2030 target of re-ducing deaths can feasibly be achieved by a majority. Currently, in 91% of countries there are fewer than 1.9 deaths per 100,000 people caused by conflict or terrorism.
17Partnerships for the goals – Based on the latest data (2015), more than half of African countries have a national statistics plan that is fully funded and being implemented. Significant efforts are required by all regions for the 2030 target to be achieved.

ANNOTATED SUMMARY OF FINDINGS ... continued
16 AFRICA 2030 SUSTAINABLE DEVELOPMENT GOALS THREE-YEAR REALITY CHECK
Africa is largely off-track in relation to economic growth, social inclusion and the environment, the three pillars of the SDGs. Growth is recovering but still below the target of at least 7% per annum. The failure to achieve social inclu-sion goals is due in part to the late (or lack of) demographic transition. While performance on environment-related goals is mixed, significant progress has been made. Africa’s performance on climate action shows that 77% of countries are achieving or exceeding SDG targets.
Data gaps for monitoring SDGs remain large; only 4 in 10 indicators in the global SDG framework have data. Even where data exists, it is mostly outdated or incomparable. The limited data profile makes evidence-based planning difficult, and compromises the transparency and eventual accountability.
A multitude of factors (mainly structural) explain the lack of progress. Data and evidence-based planning remain a chal-lenge. Africa has yet to undergo a demographic transition. Total factor productivity (TFP) in agriculture has increased only marginally, and been outpaced by population growth. Drought is increasingly pronounced and recurrent on the continent, labor productivity has stagnated over the years, and human capital formation compares relatively poorly with other regions. Africa still has poor infrastructure stock – quality, quantity and access remain low – which makes it the least globally competitive region in the world. Good governance is a challenge, fragility is pronounced, and peace is, in parts, out of reach.
Adoption of the ambitious global SDG framework gave na-tional authorities a strong mandate to drive forward the agenda. Evidence has exposed significant weaknesses in coordinating different actors at local and international lev-els, and a lack of clarity around roles and responsibilities. At the international level, there has been little sense of ur-gency about the 2030 Agenda. Key stakeholders have failed to generate the requisite momentum, and this has seriously undermined implementation efforts.
Globally the financing for SDGs has not materialized and, for African economies, the funding gap remains large. Do-mestic revenues are increasing, but not significantly: 20% of countries in Africa still generate less than 15% of their GDP domestically. The estimated financing gap for SDGs is nearly three times the estimated additional revenue poten-tial. Remittances have become the most important source of foreign income for Africa, exceeding both Official Develop-ment Assistance (ODA) and FDI. The net ODA to Africa over the long term has been increasing but the annual growth rate has slowed compared to the historical average. Also, FDI has dwindled in recent years. While more than a third of financing for SDGs will come from the private sector, private sector finance for development in Africa remains low, in the range of 4-8% of the funding mix. Other funding sources are minimal and relate to south-south and triangular coop-eration . The size of most National Development Banks in Africa is small compared to the size of the economy.
An analysis of the synergies between SDG 7 and other SDGs reveals that, at an aggregate level, SDG 7 acts as an ena-bling factor for the achievement of SDG 1, SDG 2, SDG 3, SDG 6 and SDG 8. Disaggregated, target 7.3 is mostly asso-ciated with delivering co-benefits. Being a strong influencer, this target drives progress on 18 targets across 6 goals (1, 2, 3, 6, 8 and 13).
“Africa is partly on track for three goals:
Equality, Climate and Life on land.”
INTRODUCTION
17AFRICA 2030 SUSTAINABLE DEVELOPMENT GOALS THREE-YEAR REALITY CHECK
With the adoption of the SDGs in September 2015, Africa made commitments to the 2030 Agenda for Sustainable Development and the Africa Union Agenda 2063. It always faced a steep climb, its starting point being lower than the rest of the world’s. The continent was at a crossroads, with low tax revenues in relation to GDP at one end of the prob-lem and enormous development needs at the other. The SDGs were conceptualized and adopted during a period of tight global economic and financial conditions. Recent analysis of the SDGs, including the previous Sustainable Development Goal Center for Africa (SDGCA) reports on the 2030 Agenda and the first Africa SDG Index 2018, shows that African countries still lag behind in terms of achieving the SDGs, with different countries facing different problems.
Studies on progress and financing have largely taken a global approach (OECD, 2018). Even at the global level, the rate of progress is slow and insufficient to meet the 2030 targets, but the studies are not comprehensive enough due to data gaps. Africa-focused studies reiterate the global findings. However, all of the various studies are to some extent fragmented and not comprehensive enough to cover both the supply and demand factors. The outstanding ques-tions, intricacies and ambiguities relating to Africa’s SDG implementation and progress are broad and complex. Un-derstanding them requires a comprehensive analysis that examines the factors, policies and systems that are con-straining SDG achievement.
The SDGC/A’s objectives of providing a holistic three-year reality check are embedded in the SDG Mid-Term Review of the first five years 2016-2020 of implementation. This real-ity check report includes: identifying priorities for SDG im-plementation, determining institutional and financial gaps in implementation, and setting forth pragmatic recommen-dations for African countries to stay on track to achieve the
SDGs. Additionally, the report analyzes Africa’s progress to date and how far it is from achieving the SDGs, including both qualitative and quantitative analysis of progress and constraints. The report elucidates the progress and related underlying factors such as efficiency, relevancy, efficacy, and mechanisms of governments and other stakeholders in de-livering the SDGs.
The report provides a candid assessment of whether the 2030 Agenda has been transposed into action and, if so, whether it is enough. It discusses the difference in perfor-mance between the traditional development goals and the additional cross-cutting SDGs; stakeholder collaboration and uptake of the SDGs at country level; the inherent ten-sions between growth, inclusiveness and the environment; the enabling environment for SDG achievement, financial or otherwise, and the governance framework, including plan-ning, implementation, reporting and monitoring. The report highlights and juxtaposes the substantial challenges and the ambitious timeline of Agenda 2030.
More specifically, the report’s analysis encompasses:
• progress towards the SDGs 2016-2018 • simulation and forecasting for a select number of
SDGs using trend data • critical review of the performance challenges in
achieving the SDGs • mapping and performance of the governance
framework for SDGs • review of progress towards Addis Ababa Action
Agenda (AAAA) for financing development, as adopted in July 2015
• documentation of the data gaps • review of unfinished business

INTRODUCTION ... continued
18 AFRICA 2030 SUSTAINABLE DEVELOPMENT GOALS THREE-YEAR REALITY CHECK
The report forms an evidence-based platform for further action and was developed in consultation with a variety of stakeholders. A variety of methodologies were used to compile information from diverse sources. The result is a coherent examination of the state and prospects of Afri-can countries with respect to the SDGs. The report is not the product of original research, but rather a synthesis of past research published elsewhere, which covers key SDG indicators, strategies to meet the SDGs, the national and international governance structure with respect to develop-ment, development partnerships and financing, and syner-gies between the goals.
Both quantitative and qualitative data were assessed. Quantitative data was generally reproduced without ma-nipulation. Statistical forecasting models were used to ex-press how SDG trends are likely to continue in the future, and different centrality measures were applied to analyze the linkages between energy and other SDG targets. Most quantitative data came from international and multilateral organizations rather than national statistical agencies since
they have already compiled national data into a unified database. Qualitative data came from numerous studies by various institutions and multilateral organizations to show the policies, governance structures, and regulations that are pertinent to the implementation of the SDGs in Africa, espe-cially to highlight the shortcomings of the current develop-ment system with respect to the SDGs.
The findings of this report were compiled by team members at the SDG Center for Africa and reviewed internally, before being verified by external stakeholders who ensured coher-ence between different parts of the report and the accuracy of its facts and figures.
The report calls for practical measures to implement the SDGs in the remaining 12 years. It reiterates the urgent need to accelerate efforts by all stakeholders to realize the goals in Africa – the region’s failure to advance has negative implications for the whole world. Policy recommendations in the report detail how governments and other stakehold-ers can focus their efforts on achieving the SDGs.

PROGRESS TOWARDS ACHIEVING THE SDGS
01
AFRICA 2030 SUSTAINABLE DEVELOPMENT GOALS THREE-YEAR REALITY CHECK 19

PROGRESS TOWARDS ACHIEVING THE SDGS
PROGRESS TOWARDS ACHIEVING THE SDGS 01
20
This section explores the status of and progress made towards implementa-
tion over the first three years. It is organized by goal but uses country-specific
data from international sources for comparison where possible. The analysis
was constrained by a lack of information. Across the continent there is a
paucity of annual data, which makes measuring progress problematic. The
analysis is based purely on the available data sets that correspond to official
SDG indicators, with no estimates or projections. An exposition of data gaps
is also undertaken. Goal indicators were selected based on the availability of
representative data. There is no available data for SDG 10 Reduced inequali-
ties, SDG 11 Sustainable cities and SDG 12 Responsible consumption and
production. A projection of five selected goals by sub-region (SDGs 1,2, 3,
4 and 7) uses exponential forecasting based on baseline and historical data
and regional population-weighted estimates. These projections explore three
scenarios: the base scenario (median variant of forecast); the optimistic sce-
nario (takes the bottom or top 95th percentile of the forecasts), and the SDG
scenario (calculated without reference to the forecast). Performance compari-
son between MDG-related SDGs (SDG 1, 2, 3, 4, 5 and 6) and the other SDGs
is also undertaken to show how the MDGs have permeated the SDG Agenda.
Additionally, this section elucidates on progress and factors that play into the
SDGs’ performance, including efficiency, relevancy, efficacy, and transmission
mechanisms. Overall, this section lays out evidence-based recommendations
and reiterates the urgent call for all stakeholders to accelerate their efforts in
order to realize the SDGs in all African countries.
Where possible, progress is compared with the 2030 target for the selected
indicator to serve as a call for action to achieve the respective goal.
1.1 Africa SDG Performance Review
21

PROGRESS TOWARDS ACHIEVING THE SDGS 22
11. Africa SDG Performance Review
Source: UN SDG Data
South SudanZimbabwe
MadagascarBurundi
Dem. Rep. CongoSouth Africa
GuineaTogo
ZambiaSierra Leone
MalawiLiberia
GambiaSenegal
ChadCongo
Cote d’IvoireMozambique
NigerComoros
Burkina FasoBenin
SeychellesRwanda
CameroonKenya
Cabo VerdeGabon
MauritaniaTanzania
EgyptGhana
EthiopiaUgandaDjiboutiTunisia
MauritiusAlgeria
0 10 20 30 40 50 60 70 80 90
2030 Target % Living below national poverty line
SDG 1 NO POVERTY
Poverty data is outdated for a majority of countries (Beegle, Christiaensen, Dabalen, & Gaddis, 2016). Of the African countries, only six have up-to-date data for 2016 or 2017; latest available data dates back as far as 2011 in the oth-ers. Poverty levels, measured according to the percentage of
the total population living below the national poverty line, are alarming. Monitoring national poverty is important for country-specific development agendas. Poverty data is used to make accurate estimates of poverty consistent with the country’s specific economic and social circumstances and is not intended for international comparison.
Figure 1.1 Percentage living below the national poverty line (%) 2011-2017

23AFRICA 2030 SUSTAINABLE DEVELOPMENT GOALS THREE-YEAR REALITY CHECK
Figure 1.1 shows that only two countries, Algeria and Mau-ritius, have a single-digit poverty rate, while 14 countries have rates of over fifty percent. In Madagascar, Zimbabwe and South Sudan, the poverty rate is over 70%. The 2030 target is “to reduce at least by half the proportion of men, women and children of all ages living in poverty in all its dimensions according to national definitions”. Figure 1.1 is based on data from circa 2014-2015, and shows that massive efforts will be required to reduce national poverty measurements by half. For example, 24 countries have more than 40% below the national poverty line. For these coun-tries to achieve the goal by 2030, at least a fifth of their population needs to emerge from poverty in 12 years.
Figure 1.2 Prevalence of severe food insecurity (%) 2015
Source: UN SDG Data
East Central North Southern West
32,2 32,8
12,2
%
World
24,8 25,8
SDG 2 ZERO HUNGER Undernourishment levels are startling. The latest data avail-able for food insecurity is from 2015 (Figure 1.2) and shows that in Central Africa the prevalence of severe food insecu-rity is 32.8% and in East Africa it is 32.3%. In Southern and West Africa, a quarter of the population is severely food insecure. North Africa, the region where food insecurity is least prevalent, still lags behind the world average. Central African Republic has the highest incidence at 58.6% and Rwanda, Madagascar, Liberia, Zimbabwe and Zambia all have rates of above 40%. Morocco, Mali and Egypt have the lowest rates with 3.5%, 4% and 4.5% respectively. The target, of ending “all forms of hunger and malnutrition by 2030” and ensuring everyone has “sufficient and nutritious food all year”, is unlikely to be achieved as four of the re-gions would need to lift more than a quarter of their popu-lation out of hunger within just twelve years.

PROGRESS TOWARDS ACHIEVING THE SDGS 24
11. Africa SDG Performance Review
SDG 3 GOOD HEALTH AND WELL-BEING TThe likelihood of dying between birth and five years of age (under-five mortality) is highest in Africa, where it far ex-ceeds the global average of 39 deaths per 1,000 live births (as seen in Figure 1.3). Somalia, Chad and Central African Republic have the highest rates at 132.5, 127.3 and 123.6 per 1,000 live births respectively. Only 10 countries, Libya, Tunisia, Mauritius, Seychelles, Cape Verde, Egypt, Algeria, Morocco, Sao Tome and Principe and Rwanda, have rates below the world’s average. The target, to reduce under-five mortality to 25 or fewer deaths per 1,000 live births, has only been achieved by six countries. In 36 countries, where rates are above 50, major efforts are required to reduce un-der-five mortality by at least half to achieve the 2030 target.
Figure 1.3 Under-five mortality rate (per 1,000 live births) 2016
Source: UN SDG Data
Liby
aTu
nisi
aM
aurit
ius
Seyc
helle
sCa
bo V
erde
Egyp
tA
lger
iaM
oroc
coSa
o To
me
& Pr
in.
Rwan
daBo
tsw
ana
Sout
h Af
rica
Eritr
eaN
amib
iaM
adag
asca
rSe
nega
lG
abon
Keny
aU
gand
aCo
ngo
Mal
awi
Zim
babw
eTa
nzan
iaEt
hiop
iaG
hana
Zam
bia
Djib
outi
Suda
nG
ambi
aLi
beria
Esw
atin
iM
ozam
biqu
eBu
rund
iCo
mor
osTo
goCa
mer
oon
Mau
ritan
iaA
ngol
aBu
rkin
a Fa
soG
uine
a-Bi
ssau
Gui
nea
Sout
h Su
dan
Equa
toria
l Gui
nea
Nig
erLe
soth
oD
em R
ep C
ongo
Beni
nN
iger
iaM
ali
Sier
ra L
eone
Cent
ral A
fric
an R
epCh
adSo
mal
ia140
120
100
80
60
40
20
0
per
100
0 liv
e b
irth
s
World
2030 Target
25AFRICA 2030 SUSTAINABLE DEVELOPMENT GOALS THREE-YEAR REALITY CHECK
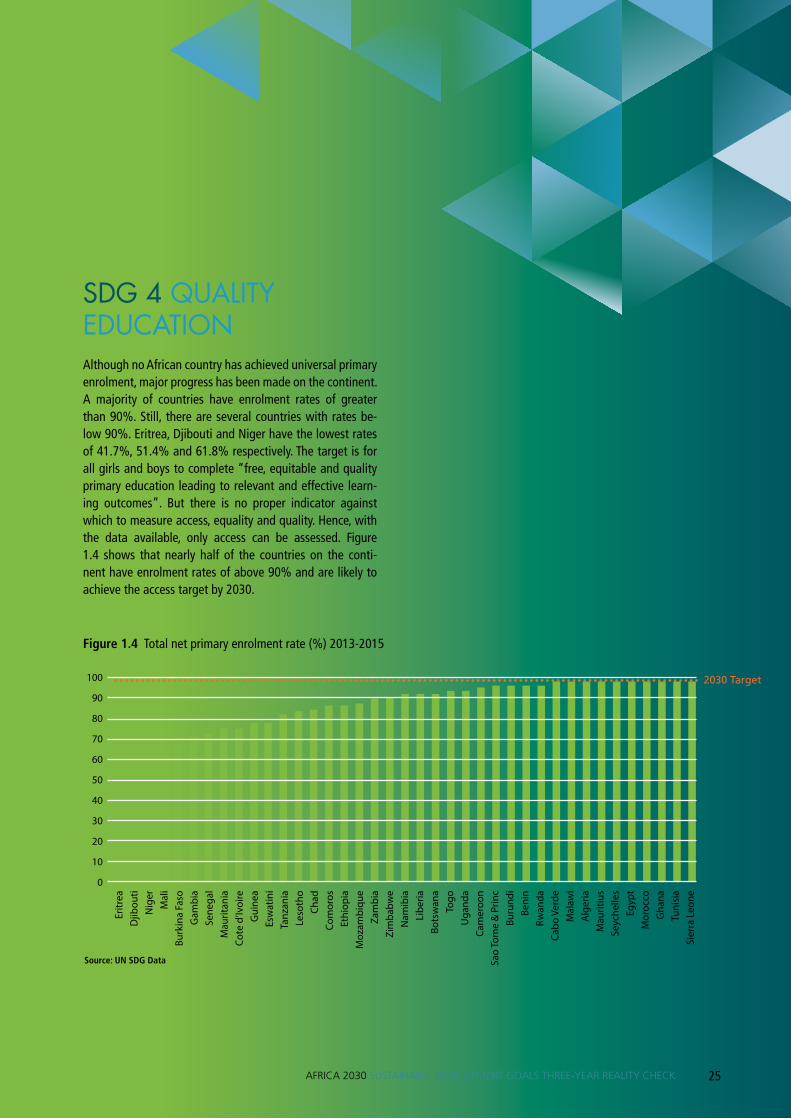
SDG 4 QUALITY EDUCATION Although no African country has achieved universal primary enrolment, major progress has been made on the continent. A majority of countries have enrolment rates of greater than 90%. Still, there are several countries with rates be-low 90%. Eritrea, Djibouti and Niger have the lowest rates of 41.7%, 51.4% and 61.8% respectively. The target is for all girls and boys to complete “free, equitable and quality primary education leading to relevant and effective learn-ing outcomes”. But there is no proper indicator against which to measure access, equality and quality. Hence, with the data available, only access can be assessed. Figure 1.4 shows that nearly half of the countries on the conti-nent have enrolment rates of above 90% and are likely to achieve the access target by 2030.
Figure 1.4 Total net primary enrolment rate (%) 2013-2015
Source: UN SDG Data
Eritr
eaD
jibou
tiN
iger
Mal
iBu
rkin
a Fa
soG
ambi
aSe
nega
lM
aurit
ania
Cote
d’Iv
oire
Gui
nea
Esw
atin
iTa
nzan
iaLe
soth
oCh
adCo
mor
osEt
hiop
iaM
ozam
biqu
eZa
mbi
aZi
mba
bwe
Nam
ibia
Libe
riaBo
tsw
ana
Togo
Uga
nda
Cam
eroo
nSa
o To
me
& Pr
inc
Buru
ndi
Beni
nRw
anda
Cabo
Ver
deM
alaw
iA
lger
iaM
aurit
ius
Seyc
helle
sEg
ypt
Mor
occo
Gha
naTu
nisi
aSi
erra
Leo
ne100
90
80
70
60
50
40
30
20
10
0
2030 Target

PROGRESS TOWARDS ACHIEVING THE SDGS 26
SDG 5 GENDER EQUALITYGender equality, measured by the proportion of seats held by women in parliament, presents a hopeful picture. Figure 1.5 shows that African countries lead the world in appointing female legislators. Indeed, the average in sub-Saharan Africa (24.2% female) exceeds the world average of 23.6%. Rwanda leads the pack with more women than men in parliament (61.3%), while Senegal and Mozam-bique have more than 40%. Still, there are several countries where less than 10% of seats are held by women, particu-larly Congo, Central African Republic, Eswatini and Nigeria.
Source: UN SDG Data
Figure 1.5 Proportion of seats held by women in national parliaments (%) 2017
RwandaSouth Africa
SenegalNamibia
MozambiqueEthiopia
AngolaTanzaniaBurundiUganda
ZimbabweTunisia
CameroonSudan
South SudanAlgeria
MauritaniaSomalia
Sub-Saharan AfricaEquatorial Guinea
WorldCabo Verde
LesothoEritrea
GuineaKenya
SeychellesMorocco
MadagascarZao Tome and Prin
ZambiaTogo
GabonNiger
MalawiLibyaEgypt
Guinea-BissauChad
GhanaSierra Leone
LiberiaMauritius
Congo, Rep.Burkina FasoCote d’Ivoire
GambiaBotswana
Dem. Rep. CongoMali
Central African Rep.Benin
EswatiniComoros
Nigeria
0 10 20 30 40 50 60 %
The target – to ensure women’s “full and effective partici-pation and equal opportunities for leadership at all levels of decision making in political, economic and public life” – might possibly be achieved by more countries if those that are close to the sub-Saharan Africa average of 25% follow the example of the top-performing countries. It is possible to double the proportion of women in parliament in less than a decade, as shown by countries like Rwanda, so achieving this target is feasible for a substantial number of African countries.
2030 Target

27AFRICA 2030 SUSTAINABLE DEVELOPMENT GOALS THREE-YEAR REALITY CHECK
SDG 6 CLEAN WATER AND SANITATION
The latest data for this indicator is from 2014. Having safe drinking water is a basic need that a substantial percentage of the African population still does not have. Globally, 89% of people have at least one basic water service, meaning an improved drinking-water source within a 30-minute round trip. In Africa, only six countries are above that threshold: Algeria, Tunisia, Seychelles, Libya, Egypt and Mauritius. In Eritrea, just 19.3 % of the population has access to a basic water service, followed by Uganda and Ethiopia, both with 39% (see Figure 1.6). Achieving the target of “universal and equitable access to safe and affordable drinking water for all” will require significant investment in infrastructure – nearly 40% of African countries currently provide basic drinking services to less two thirds of their people.
SDG 7 AFFORDABLE AND CLEAN ENERGY
Access to electricity remains a critical issue on the conti-nent. As shown in Figure 1.7 (latest data 2015) only nine countries, mainly North Africa and island nations, are above the world average of 89% electrification. In nearly 70% of the countries, less than half of the population has access to electricity. In 16 countries, only a fifth of the population has access to electricity. The target, to ensure “universal ac-cess to affordable, reliable and modern energy services”, is unlikely to be met by the continent as a whole – in 2014, three quarters of African countries had electrification rates of less than 65%.
Figure 1.6 Access to basic water service (%) 2014
Source: UN SDG Data
Eritr
eaU
gand
aEt
hiop
iaSo
mal
iaA
ngol
aD
em R
ep C
ongo
Chad
Nig
erM
ozam
biqu
eEq
uato
rial G
uine
aTa
nzan
iaSo
uth
Suda
nM
adag
asca
rBu
rkin
a Fa
soCe
ntra
l Afr
ican
Rep
Buru
ndi
Rwan
daSi
erra
Leo
neKe
nya
Suda
nZa
mbi
aTo
goCa
mer
oon
Zim
babw
eBe
nin
Mal
awi
Nig
eria
Gui
nea
Esw
atin
iCo
ngo
Gui
nea-
Biss
auM
aurit
ania
Libe
riaLe
soth
oCo
te d
’Ivoi
reM
ali
Sene
gal
Djib
outi
Gha
naN
amib
iaBo
tsw
ana
Sao
Tom
e &
Prin
Gam
bia
Mor
occo
Com
oros
Sout
h Af
rica
Cabo
Ver
deG
abon
Alg
eria
Tuni
sia
Seyc
helle
sLi
bya
Egyp
tM
aurit
ius
100
90
80
70
60
50
40
30
20
10
0
%2030 TargetWorld
11. Africa SDG Performance Review

PROGRESS TOWARDS ACHIEVING THE SDGS 28
11. Africa SDG Performance Review
Figure 1.7 Access to electricity 2015 (%)
Source: UN SDG Data
South SudanBurundi
ChadLiberia
MalawiCentral African Rep
Sierra LeoneDem Rep Congo
NigerTanzania
MadagascarGuinea-Bissau
SomaliaBurkina Faso
RwandaUganda
MozambiqueEthiopia
MaliGuineaLesothoZambiaAngola
ZimbabweBeninKenya
MauritaniaCongoSudan
TogoEritrea
DjiboutiGambiaNamibia
BotwanaCameroon
NigeriaSenegal
Cote d’IvoireEswatini
Equatorial GuineaSao Tome & Prin
ComorosGhana
South AfricaGabon
Cabo VerdeMorocco
LibyaMauritiusSeychelles
TunisiaEgypt
Algeria
0 10 20 30 40 50 60 70 80 90 100
World
2030Target
29AFRICA 2030 SUSTAINABLE DEVELOPMENT GOALS THREE-YEAR REALITY CHECK
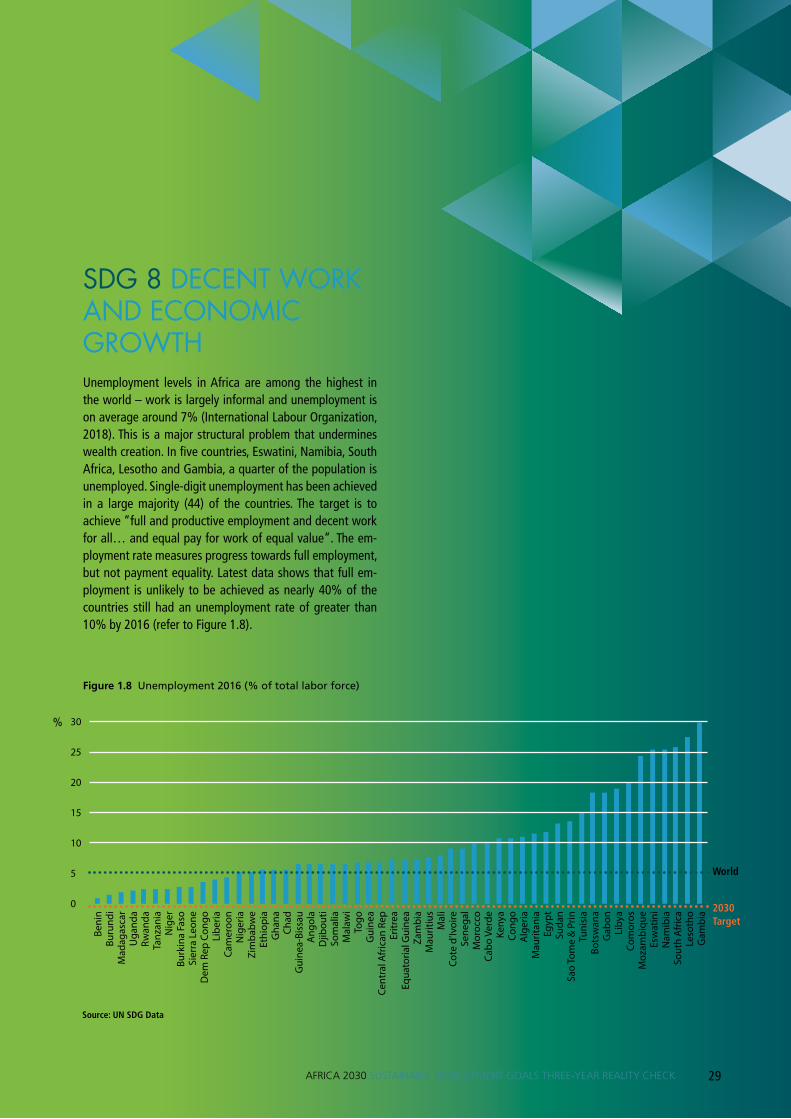
SDG 8 DECENT WORK AND ECONOMIC GROWTH Unemployment levels in Africa are among the highest in the world – work is largely informal and unemployment is on average around 7% (International Labour Organization, 2018). This is a major structural problem that undermines wealth creation. In five countries, Eswatini, Namibia, South Africa, Lesotho and Gambia, a quarter of the population is unemployed. Single-digit unemployment has been achieved in a large majority (44) of the countries. The target is to achieve “full and productive employment and decent work for all… and equal pay for work of equal value”. The em-ployment rate measures progress towards full employment, but not payment equality. Latest data shows that full em-ployment is unlikely to be achieved as nearly 40% of the countries still had an unemployment rate of greater than 10% by 2016 (refer to Figure 1.8).
Figure 1.8 Unemployment 2016 (% of total labor force)
Source: UN SDG Data
Beni
nBu
rund
iM
adag
asca
rU
gand
aRw
anda
Tanz
ania
Nig
erBu
rkin
a Fa
soSi
erra
Leo
neD
em R
ep C
ongo
Libe
riaCa
mer
oon
Nig
eria
Zim
babw
eEt
hiop
iaG
hana
Chad
Gui
nea-
Biss
auA
ngol
aD
jibou
tiSo
mal
iaM
alaw
iTo
goG
uine
aCe
ntra
l Afr
ican
Rep
Eritr
eaEq
uato
rial G
uine
aZa
mbi
aM
aurit
ius
Mal
iCo
te d
’Ivoi
reSe
nega
lM
oroc
coCa
bo V
erde
Keny
aCo
ngo
Alg
eria
Mau
ritan
iaEg
ypt
Suda
nSa
o To
me
& Pr
inTu
nisi
aBo
tsw
ana
Gab
onLi
bya
Com
oros
Moz
ambi
que
Esw
atin
iN
amib
iaSo
uth
Afric
aLe
soth
oG
ambi
a
30
25
20
15
10
5
0
%
2030 Target
World

PROGRESS TOWARDS ACHIEVING THE SDGS 30
11. Africa SDG Performance Review
SDG 9 INDUSTRY, INNOVATION AND INFRASTRUCTURE Internet usage in Africa is very low in comparison with the world average. As shown in Figure 1.9, in only seven coun-tries, Mauritius, South Africa, Tunisia, Djibouti, Seychelles, Cape Verde and Morocco, are more than 50% using inter-net. In 26 countries, less than a fifth use the internet and in four countries, Chad, Central African Republic, Guinea Bissau and Somalia, usage is below 5%. The target, to “significantly increase access to information and commu-nication technology and provide universal and affordable access to the internet”, remains a colossal challenge at a continental level. The country with the highest percentage of internet users, Morocco, is still below the world average, and two-thirds of African countries have less than 25% internet access.
Figure 1.9 Individuals using the internet (% of population)
Source: UN SDG Data
1009080706050403020100
% 2030 Target
World
Eritr
eaSo
mal
iaG
uine
a-Bi
ssau
Cent
ral A
fric
an R
epCh
adBu
rund
iD
em R
ep C
ongo
So
uth
Suda
nLi
beria
Com
oros
Rep
Cong
oG
uine
aM
adag
asca
rN
iger
Mal
iM
alaw
iSi
erra
Leo
neBe
nin
Togo
Ang
ola
Tanz
ania
Burk
ina
Faso
Ethi
opia
Keny
aM
ozam
biqu
eM
aurit
ania
Gam
bia
Rwan
daLi
bya
Uga
nda
Zim
babw
eCa
mer
oon
Equa
toria
l Gui
nea
Zam
bia
Sene
gal
Nig
eria
Leso
tho
Suda
nSa
o To
me
& Pr
inEs
wat
ini
Nam
ibia
Gha
naBo
tsw
ana
Alg
eria
Cote
d’Iv
oire
Egyp
tG
abon
Mau
ritiu
sSo
uth
Afric
aTu
nisi
aD
jibou
tiSe
yche
lles
Cabo
Ver
deM
oroc
co

31AFRICA 2030 SUSTAINABLE DEVELOPMENT GOALS THREE-YEAR REALITY CHECK
SDG 13 CLIMATE ACTION When it comes to CO2 emissions, the continent is the best performing region in the world. Of the top 20 emitters glob-ally, only one is African; South Africa produces 467.7 MT per year, and Egypt and Algeria are the next worst offenders (see Figure 1.10).
SDG 15 LIFE ON LAND The continent is doing well in protecting life on land, meas-ured according to the proportion of sites of significance for biodiversity that are protected. The only two regions that have a larger proportion of protected sites are Europe and North America. On average, Africa protects 46.1% of its important sites for terrestrial biodiversity, more than double Asia (see Figure 1.11). The target, “to ensure the conservation, restoration and sustainable use of terrestrial and inland freshwater ecosystems”, is a reasonable one to achieve – 44% of countries already protect more than half of their important terrestrial areas and policy can ensure protection of the remaining ones.
Figure 1.10 Territorial CO2 emissions 2016 (Metric)
Figure 1.10 Territorial CO2 emissions 2016 ... continued
Source: Global Carbon Atlas, 2018
Sout
h Af
rica
Egyp
tA
lger
iaN
iger
iaLi
bya
Mor
occo
Ang
ola
Tuni
sia
Suda
nG
hana
Keny
aTa
nzan
iaCo
te d
’Ivoi
reEt
hiop
iaZi
mba
bwe
Sene
gal
Moz
ambi
que
Cam
eroo
nBo
tsw
ana
Beni
nEq
uato
rial G
uine
aG
abon
Uga
nda
Dem
.Rep
Con
goZa
mbi
aM
aurit
ius
Nam
ibia
Cong
oM
adag
asca
rBu
rkin
a Fa
soM
aurit
ania
Togo
Gui
nea
Nig
erM
ali
Sier
ra L
eone
Mal
awi
Esw
atin
iLi
beria
Rwan
daCh
adD
jibou
tiEr
itrea
Som
alia
Gam
bia
Seyc
helle
sCa
bo V
erde
Buru
ndi
Cent
ral A
fric
an R
epG
uine
a-Bi
ssau
Com
oros
Sao T
ome a
nd Pr
inci
pe
500450400350250200150100500
%

PROGRESS TOWARDS ACHIEVING THE SDGS 32
11. Africa SDG Performance Review
Figure 1.11 Proportion of important sites for terrestrial biodiversity that are covered by protected areas 2017 (%)
Source: UN SDG Data
SomaliaDjibouti
LibyaEritrea
MauretaniaComorosLesothoEthiopia
SeychellesSudan
MauritiusAngola
MaliCameroon
MozambiqueDem Rep Congo
KenyaAlgeria
EgyptMadagascar
TunisiaSenegal
NigerMoroccoRwanda
BotswanaZambiaBurundi
Guinea-BissauTanzania
Sao Tome & PrinSouth Africa
EswatiniGabonGuinea
ChadBurkina Faso
CongoUganda
Central African RepBenin
Cote d’IvoireNigeriaMalawiGhana
NamibiaZimbabwe
Togo
0 10 20 30 40 50 60 70 80 90 100
AfricaAsia North America and Europe
33AFRICA 2030 SUSTAINABLE DEVELOPMENT GOALS THREE-YEAR REALITY CHECK
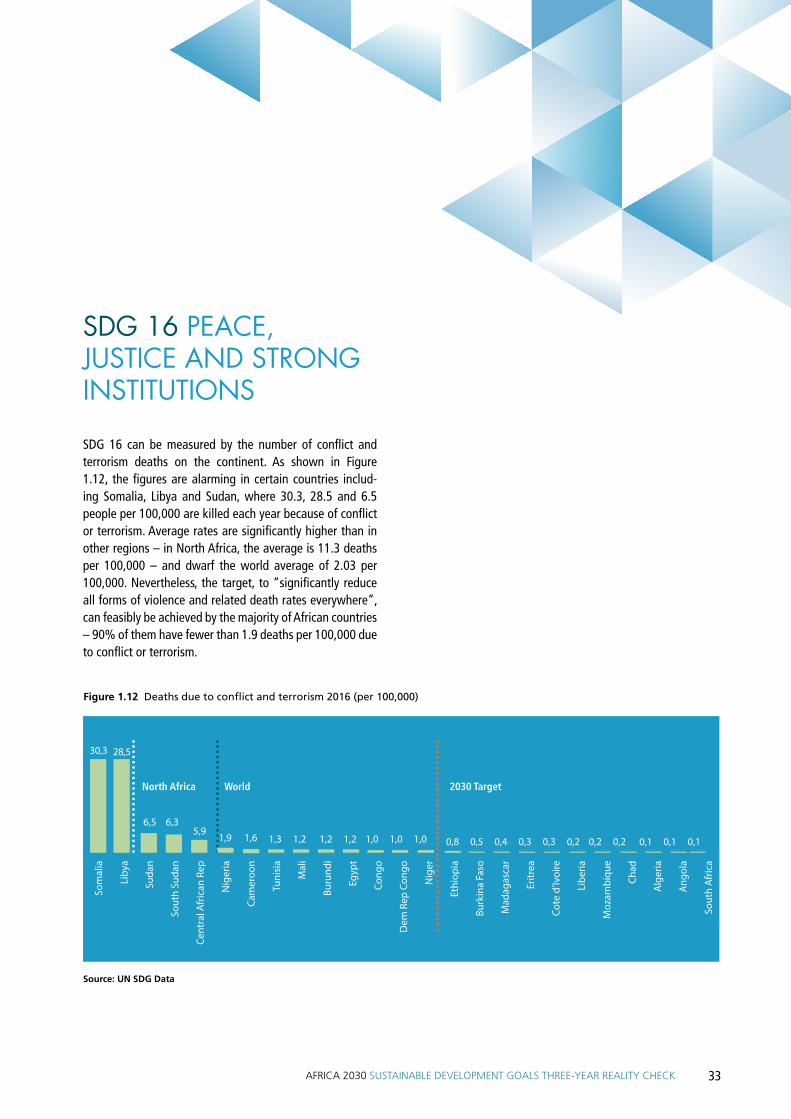
SDG 16 PEACE, JUSTICE AND STRONG INSTITUTIONS
SDG 16 can be measured by the number of conflict and terrorism deaths on the continent. As shown in Figure 1.12, the figures are alarming in certain countries includ-ing Somalia, Libya and Sudan, where 30.3, 28.5 and 6.5 people per 100,000 are killed each year because of conflict or terrorism. Average rates are significantly higher than in other regions – in North Africa, the average is 11.3 deaths per 100,000 – and dwarf the world average of 2.03 per 100,000. Nevertheless, the target, to “significantly reduce all forms of violence and related death rates everywhere”, can feasibly be achieved by the majority of African countries – 90% of them have fewer than 1.9 deaths per 100,000 due to conflict or terrorism.
Figure 1.12 Deaths due to conflict and terrorism 2016 (per 100,000)
Source: UN SDG Data
Som
alia
Liby
a
Suda
n
Sout
h Su
dan
Cent
ral A
fric
an R
ep
Nig
eria
Cam
eroo
n
Tuni
sia
Mal
i
Buru
ndi
Egyp
t
Cong
o
Dem
Rep
Con
go
Nig
er
Ethi
opia
Burk
ina
Faso
Mad
agas
car
Eritr
ea
Cote
d’Iv
oire
Libe
ria
Moz
ambi
que
Chad
Alg
eria
Ang
ola
Sout
h Af
rica
30,3 28,5
6,5 6,35,9
1,9 1,6 1,3 1,2 1,2 1,2 1,0 1,0 1,0 0,8 0,5 0,4 0,3 0,3 0,2 0,2 0,2 0,1 0,1 0,1
2030 TargetWorldNorth Africa

PROGRESS TOWARDS ACHIEVING THE SDGS 34
11. Africa SDG Performance Review
SDG 17 PARTNERSHIPS FOR THE GOALS
Progress in revitalizing the global partnership for sustain-able development is measured using the national statistical capacity indicator, which provides individual country scores (from 0 to 100) based on the national statistics system and capacity in three categories: methodology, source data, and periodicity. It shows that, although 21 countries are above the world average, significant efforts need to be directed at the institutes of statistics to reach a full score of 1,000, particularly in Libya, Somalia, Eritrea and Comoros, where the score is below 30 (see Figure 1.13).
Figure 1.13 World Bank statistical capacity indicator
Source: World Bank
100908070605040302010
0
2030 Target
Liby
aSo
mal
iaEr
itrea
Com
oros
Gab
onCe
ntra
l Afr
ican
Rep
ublic
Ang
ola
Dem
Rep
Con
goG
uine
a-Bi
ssau
Chad
Cong
oBo
tsw
ana
Gui
nea
Zam
bia
Djib
outi
Mad
agas
car
Nam
ibia
Mau
ritan
iaKe
nya
Esw
atin
iZi
mba
bwe
Alg
eria
Leso
tho
Tuni
sia
Nig
eria
Buru
ndi
Mal
iCo
te d
’Ivoi
reSu
dan
Gha
naM
ozam
biqu
eSa
o To
me
& Pr
inTo
goCa
mer
oon
Ethi
opia
Tanz
ania
Nig
erBe
nin
Burk
ina
Faso
Uga
nda
Sout
h Af
rica
Mor
occo
Sene
gal
Mal
awi
Rwan
daSe
yche
lles
Egyp
tM
aurit
ius
World
AFRICA 2030 SUSTAINABLE DEVELOPMENT GOALS THREE-YEAR REALITY CHECK
1.2 SDG Forecasting
Liby
aSo
mal
iaEr
itrea
Com
oros
Gab
onCe
ntra
l Afr
ican
Rep
ublic
Ang
ola
Dem
Rep
Con
goG
uine
a-Bi
ssau
Chad
Cong
oBo
tsw
ana
Gui
nea
Zam
bia
Djib
outi
Mad
agas
car
Nam
ibia
Mau
ritan
iaKe
nya
Esw
atin
iZi
mba
bwe
Alg
eria
Leso
tho
Tuni
sia
Nig
eria
Buru
ndi
Mal
iCo
te d
’Ivoi
reSu
dan
Gha
naM
ozam
biqu
eSa
o To
me
& Pr
inTo
goCa
mer
oon
Ethi
opia
Tanz
ania
Nig
erBe
nin
Burk
ina
Faso
Uga
nda
Sout
h Af
rica
Mor
occo
Sene
gal
Mal
awi
Rwan
daSe
yche
lles
Egyp
tM
aurit
ius
35
36
12. SDG Forecasting
PROGRESS TOWARDS ACHIEVING THE SDGS
1.2 SDG ForecastingProjecting what Africa will look like in 2030 for all of the targets is not feasible for various reasons; data is not avail-able for projections and not all targets are quantifiable. Projections only refer to a specific target within a goal. They should therefore not be understood as reflecting the en-tire goal. For this exercise, projections are based on recent trends and illustrate how much African countries need to adjust their current trajectories to meet the SDGs.
SDG TRENDS IN AFRICA
While the gathering and updating of data on SDG progress is a continuous challenge, a number of indicators are suf-ficiently complete and cover enough time to conduct a forecasting exercise. This can help to determine how close Africa’s five sub-regions will be to meeting the SDG targets if the current trends continue. A select number of indicators were chosen based on the length of their time series and their importance to sustainability in Africa. The indicators chosen are as follows:
• SDG 1: Poverty headcount ratio (World Bank, 2018e)
• SDG 2: Prevalence of undernourishment (FAO Statistics Division, 2019)
• SDG 3: Under-five mortality rate (UNICEF, 2018) • SDG 4: Net primary enrollment rate
(UNESCO, 2019) • SDG 6: Access to basic drinking water
(WHO & UNICEF, 2017) • SDG 7: Access to electricity (World Bank, 2019)
METHODOLOGY
Country-level data on these indicators were weighted ac-cording to the countries’ respective populations in each year and then aggregated by sub-region, providing popula-tion-weighted estimates for each.
Forecasting models were built using the R package fore-cast (Hyndman, 2019). The models were selected using exponential smoothing, in which the error and trend types were selected automatically according to the form, with the best predictive performance through cross-validation. The advantages of exponential smoothing are that it is able to provide accurate forecasts that place emphasis on the most recent data, without requiring a large number of observa-tions. It generally works well with data where there is a clear association between the past and current states (Ay-res, 2016). In some cases, where the high or low confidence intervals of the forecast values exceed their natural bounds (eg. 0 to 100%), the model was modified to keep these val-ues within the natural bounds. Forecasts are compared to the SDG targets as defined in SDGC/A’s Africa SDG Index (SDGC/A & SDSN, 2018).
In order to assess the likelihood and feasibility of meeting the SDGs by 2030, we evaluate three scenarios for the tar-gets that are most important in the African context. These include: the prevalence of extreme poverty; undernutrition; under-five mortality rates, and electrification. We focus on the sub-regions that are most in need of progress. Two sce-narios are derived from the forecast – the base scenario and the optimistic scenario. A third scenario, called the SDG scenario, is calculated without reference to the forecast.
The median variant of the forecast is taken to represent the base scenario, in which we assume a continuation of past trends with no major changes in policy or financing. The optimistic scenario is the curve that takes the bottom or top 95th percentile of the forecasts, depending on the target.
LEGEND: SDG FORECASTING
on track to reach the target (baseline forecast reaches goal by 2030) moving in the right direction but not quickly enough (optimistic fore-casts – the bottom or top 95th percentile – show it reaching the target)
stagnating progress (even optimistic forecast doesn’t reach the target)
moving in the wrong direction
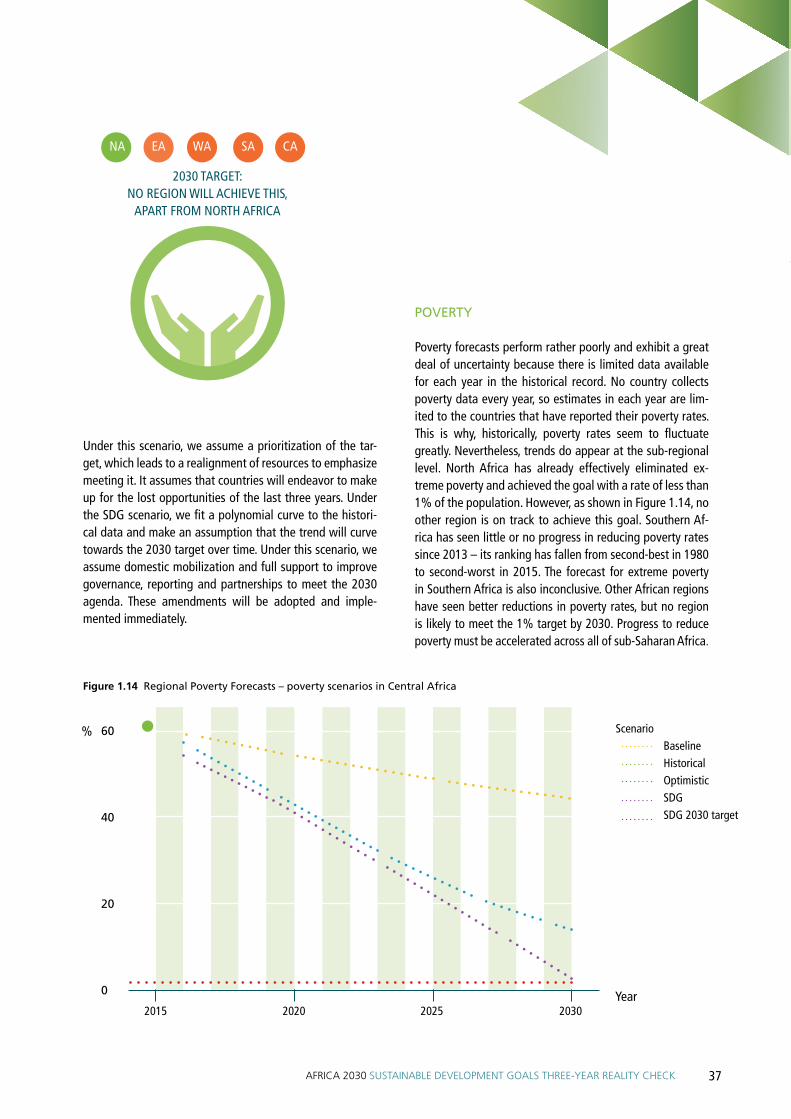
37AFRICA 2030 SUSTAINABLE DEVELOPMENT GOALS THREE-YEAR REALITY CHECK
Under this scenario, we assume a prioritization of the tar-get, which leads to a realignment of resources to emphasize meeting it. It assumes that countries will endeavor to make up for the lost opportunities of the last three years. Under the SDG scenario, we fit a polynomial curve to the histori-cal data and make an assumption that the trend will curve towards the 2030 target over time. Under this scenario, we assume domestic mobilization and full support to improve governance, reporting and partnerships to meet the 2030 agenda. These amendments will be adopted and imple-mented immediately.
Figure 1.14 Regional Poverty Forecasts – poverty scenarios in Central Africa
POVERTY
Poverty forecasts perform rather poorly and exhibit a great deal of uncertainty because there is limited data available for each year in the historical record. No country collects poverty data every year, so estimates in each year are lim-ited to the countries that have reported their poverty rates. This is why, historically, poverty rates seem to fluctuate greatly. Nevertheless, trends do appear at the sub-regional level. North Africa has already effectively eliminated ex-treme poverty and achieved the goal with a rate of less than 1% of the population. However, as shown in Figure 1.14, no other region is on track to achieve this goal. Southern Af-rica has seen little or no progress in reducing poverty rates since 2013 – its ranking has fallen from second-best in 1980 to second-worst in 2015. The forecast for extreme poverty in Southern Africa is also inconclusive. Other African regions have seen better reductions in poverty rates, but no region is likely to meet the 1% target by 2030. Progress to reduce poverty must be accelerated across all of sub-Saharan Africa.
1%GOAL
2030 TARGET: NO REGION WILL ACHIEVE THIS,
APART FROM NORTH AFRICA
NA EA WA SA CA
2015 2020 2025 2030
60
40
20
0 Year
% Scenario Baseline Historical Optimistic SDG SDG 2030 target
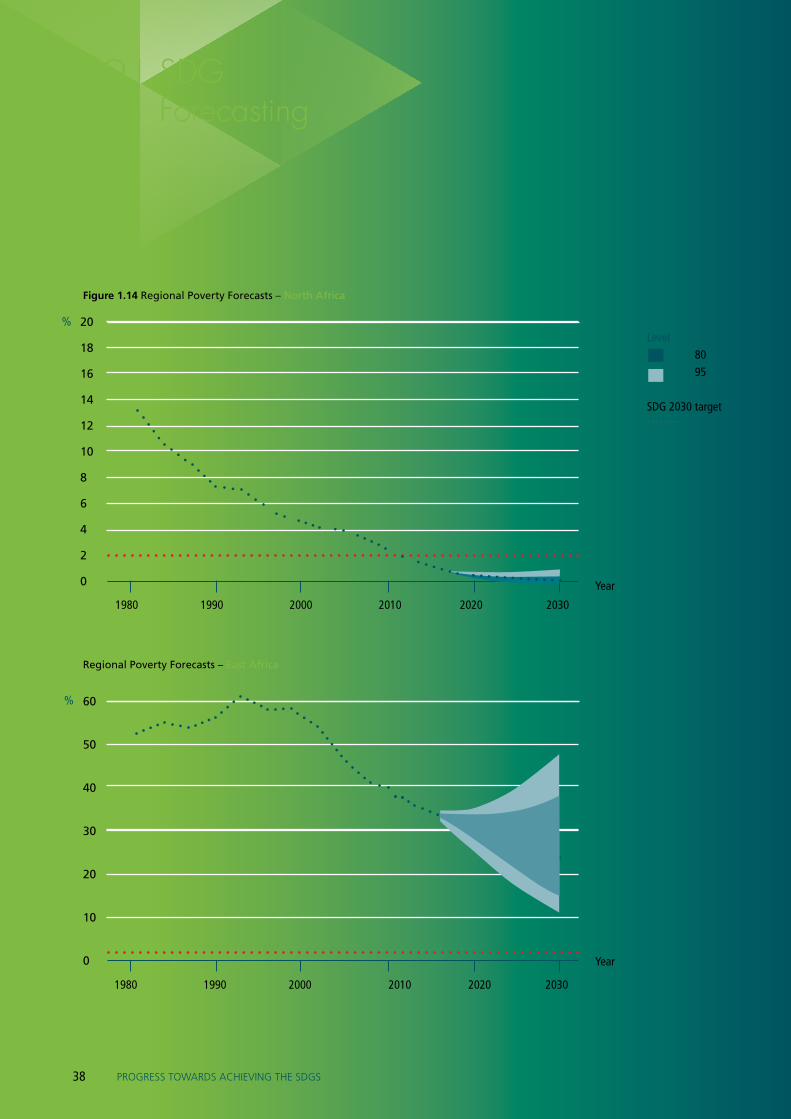
38
12. SDG Forecasting
PROGRESS TOWARDS ACHIEVING THE SDGS
Figure 1.14 Regional Poverty Forecasts – North Africa
Regional Poverty Forecasts – East Africa
1980 1990 2000 2010 2020 2030
%
20
18
16
14
12
10
8
6
4
2
0 Year
Year
%Level 80 95
SDG 2030 target
1980 1990 2000 2010 2020 2030
60
50
40
30
20
10
0

39AFRICA 2030 SUSTAINABLE DEVELOPMENT GOALS THREE-YEAR REALITY CHECK
Regional Poverty Forecasts – Southern Africa
Regional Poverty Forecasts – West Africa
1980 1990 2000 2010 2020 2030
1980 1990 2000 2010 2020 2030
60
50
40
30
20
10
0
60
50
40
30
20
10
0
Pove
rty
Rat
e in
%Po
vert
y R
ate
in %
Year
Year
Level 80 95
SDG 2030 target

40
12. SDG Forecasting
PROGRESS TOWARDS ACHIEVING THE SDGS
UNDERNUTRITION
One of the most alarming trends revealed in this analysis is the reversal of trends to reduce malnutrition rates in Africa. (Although the historical record dates back only to 2000, so the forecasts exhibit uncertainty.) Only North Africa is on track to maintain undernutrition rates below the targeted maximum of 7.5%. In every other region, trends are mov-ing away from this goal (see Figure 1.15). The situation is particularly dismal in Central Africa, where forecasts show that, under current trends, malnutrition rates of 45% or more are possible by 2030 (see Figure 1.15). Considering this upswing, it is likely that malnutrition rates will continue to increase in the near future. Malnutrition will have to be brought down extremely quickly, especially in the latter half of the 2020s, if the SDG target for malnutrition is to be met.
Figure 1.15 Historical undernutrition rates in % Central Africa
MALNUTRITION RATES:
45%instead of
7,5%
NA EA WA SA CA
2000 2010 2020 2030
60
50
40
30
20
10
0 Year
% Level 80 95
SDG 2030 target
on track moving in the right direction
moving in the wrong direction
stagnating
LEGEND

41AFRICA 2030 SUSTAINABLE DEVELOPMENT GOALS THREE-YEAR REALITY CHECK
Undernutrition forecasts Central Africa
Undernutrition Rates in African sub-region
2015 2020 2025 2030
60
50
40
30
20
10
0
Un
der
nu
trit
ion
Rat
e in
% Scenario Baseline Historical Optimistic SDG SDG 2030 target
2000 2002 2004 2006 2008 2010 2012 2014 2016
50
40
30
20
10
0 YEAR
YEAR
% Region Central Africa East Africa North Africa Southern Africa West Africa
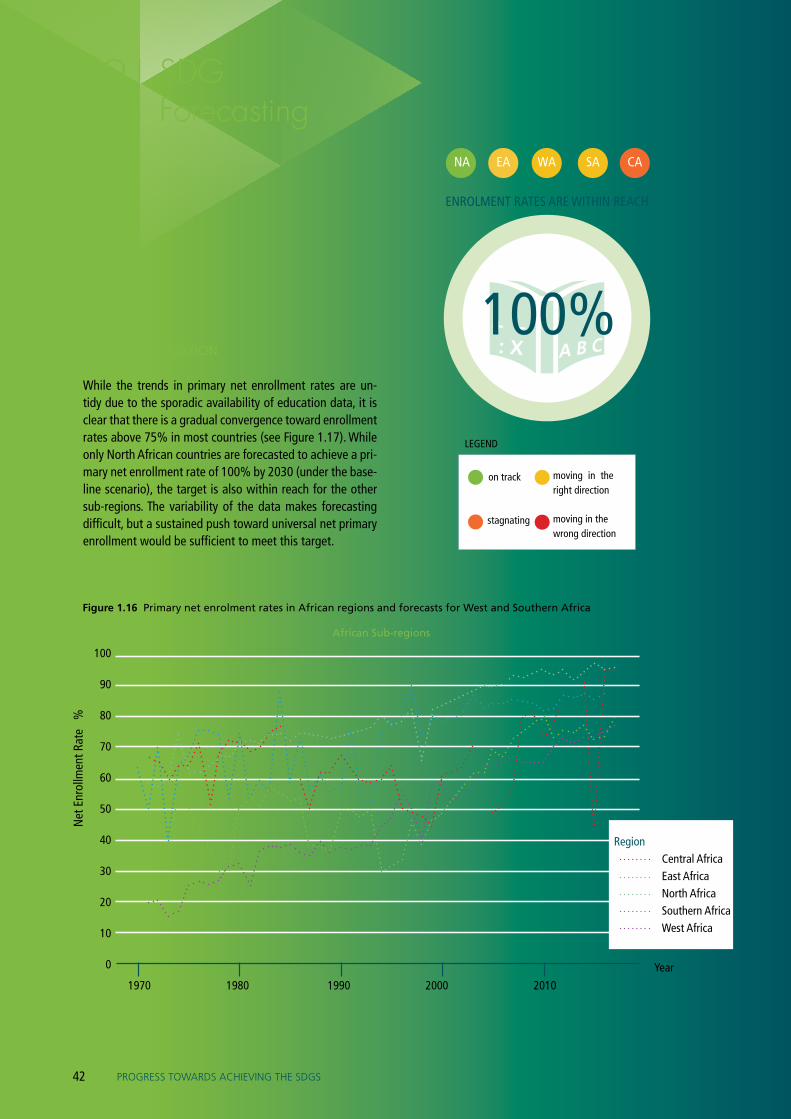
42
12. SDG Forecasting
PROGRESS TOWARDS ACHIEVING THE SDGS
PRIMARY EDUCATION
While the trends in primary net enrollment rates are un-tidy due to the sporadic availability of education data, it is clear that there is a gradual convergence toward enrollment rates above 75% in most countries (see Figure 1.17). While only North African countries are forecasted to achieve a pri-mary net enrollment rate of 100% by 2030 (under the base-line scenario), the target is also within reach for the other sub-regions. The variability of the data makes forecasting difficult, but a sustained push toward universal net primary enrollment would be sufficient to meet this target.
Figure 1.16 Primary net enrolment rates in African regions and forecasts for West and Southern Africa
NA EA WA SA CA
African Sub-regions
ENROLMENT RATES ARE WITHIN REACH
Net
Enr
ollm
ent R
ate
%
1970 1980 1990 2000 2010
100
90
80
70
60
50
40
30
20
10
0 Year
100%
on track moving in the right direction
moving in the wrong direction
stagnating
LEGEND
Region Central Africa East Africa North Africa Southern Africa West Africa

43AFRICA 2030 SUSTAINABLE DEVELOPMENT GOALS THREE-YEAR REALITY CHECK
Primary net enrolment rates in Southern Africa
Primary net enrolment rates in West Africa
Prim
ary
(NER
) %
1970 1980 1990 2010 2010 2020 2030
100
90
80
70
60
50
40
30
20
10
0 Year
Prim
ary
(NER
) %
Level 80 95
SDG 2030 target
1970 1980 1990 2010 2010 2020 2030
100
90
80
70
60
50
40
30
20
10
0 Year
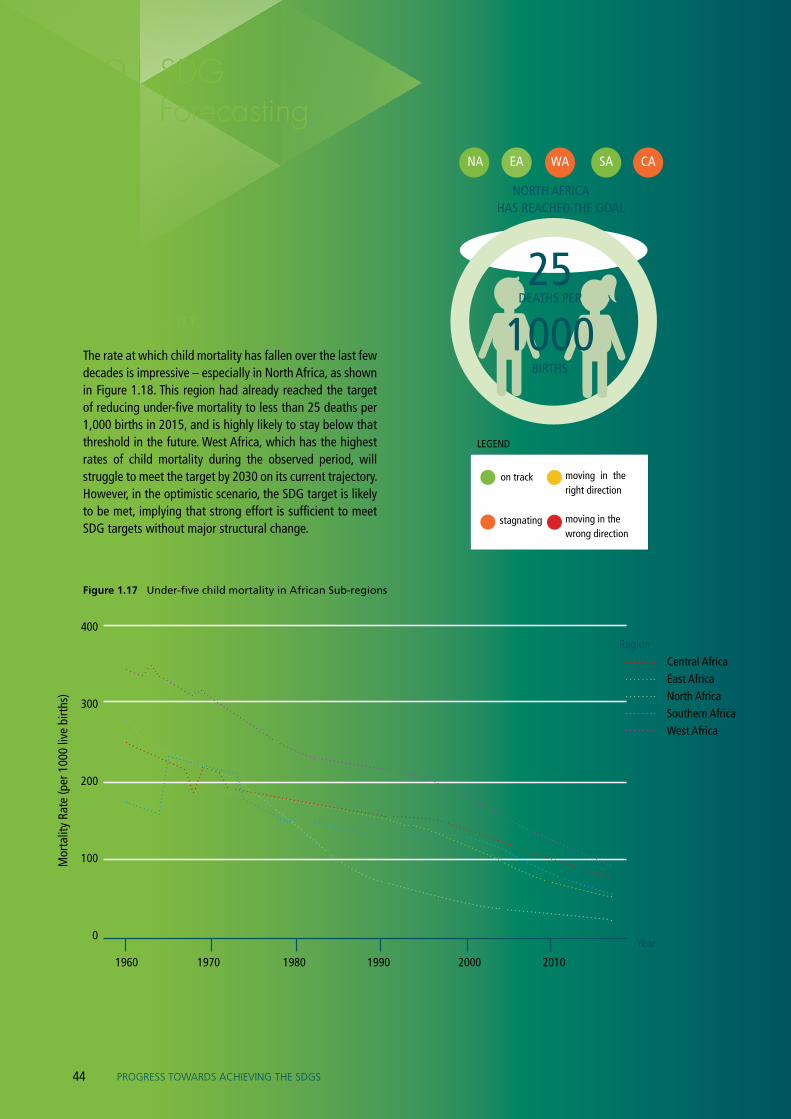
Region Central Africa East Africa North Africa Southern Africa West Africa
on track moving in the right direction
moving in the wrong direction
stagnating
LEGEND
44
12. SDG Forecasting
PROGRESS TOWARDS ACHIEVING THE SDGS
CHILD MORTALITY
The rate at which child mortality has fallen over the last few decades is impressive – especially in North Africa, as shown in Figure 1.18. This region had already reached the target of reducing under-five mortality to less than 25 deaths per 1,000 births in 2015, and is highly likely to stay below that threshold in the future. West Africa, which has the highest rates of child mortality during the observed period, will struggle to meet the target by 2030 on its current trajectory. However, in the optimistic scenario, the SDG target is likely to be met, implying that strong effort is sufficient to meet SDG targets without major structural change.
Figure 1.17 Under-five child mortality in African Sub-regions
NA EA WA SA CA
NORTH AFRICA HAS REACHED THE GOAL
251000
Mor
talit
y Ra
te (p
er 1
000
live
birt
hs)
1960 1970 1980 1990 2000 2010
400
300
200
100
0Year
BIRTHS
DEATHS PER

2016 2018 2020 2022 2024 2026 2028 2030
100
75
50
25
0 YEAR
Scenario Baseline Historical Optimistic SDG SDG 2030 target
2000 2010 2020 2030
100
150
100
50
0 YEAR
Un
der
-5 M
ort
alit
y R
ate
(per
100
0 liv
e b
irth
s)U
nd
er-5
Mo
rtal
ity
Rat
e (p
er 1
000
live
bir
ths)
Under-5 child mortality in West Africa
Under-5 mortality rate scenarios in West Africa
AFRICA 2030 SUSTAINABLE DEVELOPMENT GOALS THREE-YEAR REALITY CHECK 45
Level 80 95
SDG 2030 target

46
12. SDG Forecasting
PROGRESS TOWARDS ACHIEVING THE SDGS
ENERGY
Electrification rates in Africa have been steadily increasing over the last few decades, but are nowhere near universal yet. As seen in the image below, North Africa is on track to achieve the targeted electrification rate of 100% by 2030, and East Africa could be on track, under optimistic scenari-os. The other regions are not on track. Once again, North Af-rica is the continental leader – 98.5% of the population had access to electricity in 2016 (see Figure 1.18). One surprise that emerged was the sudden increase in electrification in East Africa between 2015 and 2016. This trend has been achieved largely because of last-mile electrification pro-jects in the region’s three most populous countries: Kenya, Ethiopia, and Tanzania, targeting informal settlements and isolated rural communities (IEA, IRENA, UN, World Bank
Figure 1.18 Electrification in Africa - Rates in African sub-regions
Group, & WHO, 2018). This divergence from past trends could have important implications for meeting SDG 7 in the region. Although highly uncertain, if this break from past trends continues then East Africa could achieve universal electrification by 2030. Other regions, especially Central Af-rica, will require a drastic, unprecedented increase in elec-trification in order to achieve the target. Lessons should be learned from East Africa, specifically that the underserved must be explicitly targeted by electrification projects. In general, all of sub-Saharan Africa needs to rapidly acceler-ate power generation and distribution to achieve universal electrification by 2030.
Region Central Africa East Africa North Africa Southern Africa West Africa
Elec
trifi
catio
n Ra
te (%
)
1990 1995 2000 2005 2010 2015
100
90
80
70
60
50
440
30
20
10
0YEAR
on track moving in the right direction
moving in the wrong direction
stagnating
LEGEND
ACCESS TO ELECTRICITY:
NORTH AFRICA HAS REACHED
100%
NA EA WA SA CA
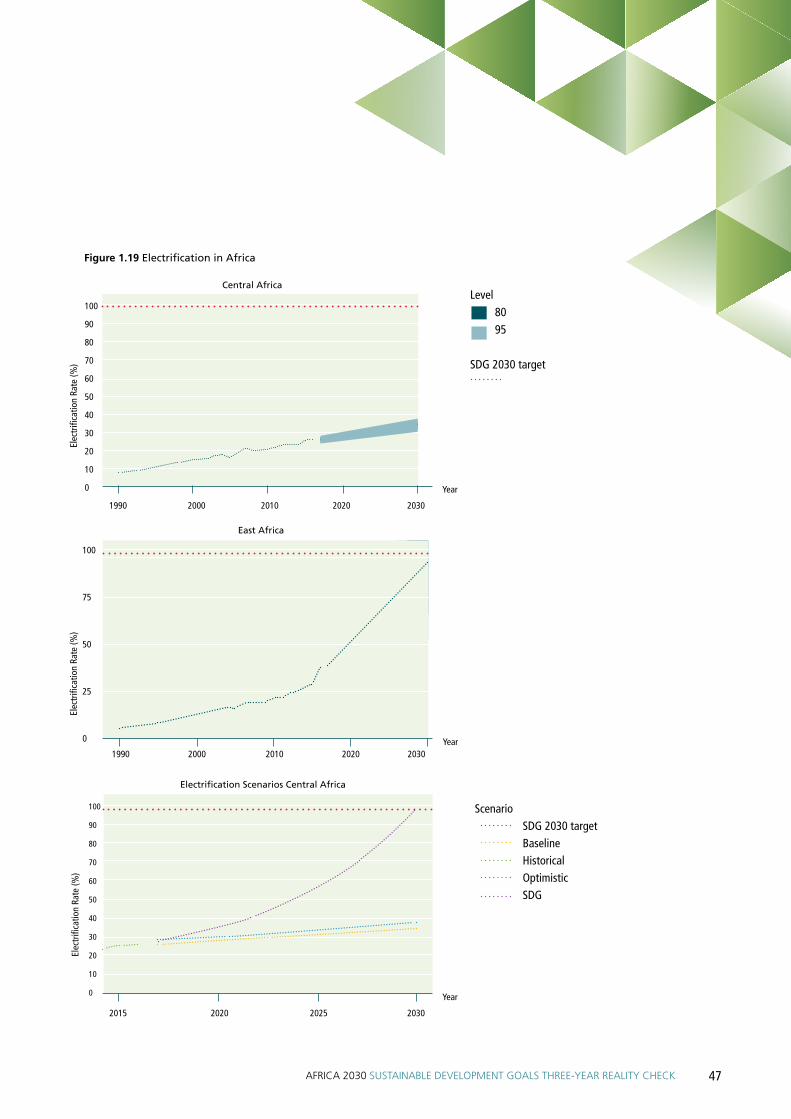
47AFRICA 2030 SUSTAINABLE DEVELOPMENT GOALS THREE-YEAR REALITY CHECK
Figure 1.19 Electrification in Africa
Scenario SDG 2030 target Baseline Historical Optimistic SDG
Elec
trifi
catio
n Ra
te (%
)
Central Africa
East Africa
Level 80 95
SDG 2030 target
1990 2000 2010 2020 2030
100
90
80
70
60
50
40
30
20
10
0 Year
Elec
trifi
catio
n Ra
te (%
)
1990 2000 2010 2020 2030
100
75
50
25
0 Year
Elec
trifi
catio
n Ra
te (%
)
Electrification Scenarios Central Africa
2015 2020 2025 2030
100
90
80
70
60
50
40
30
20
10
0 Year
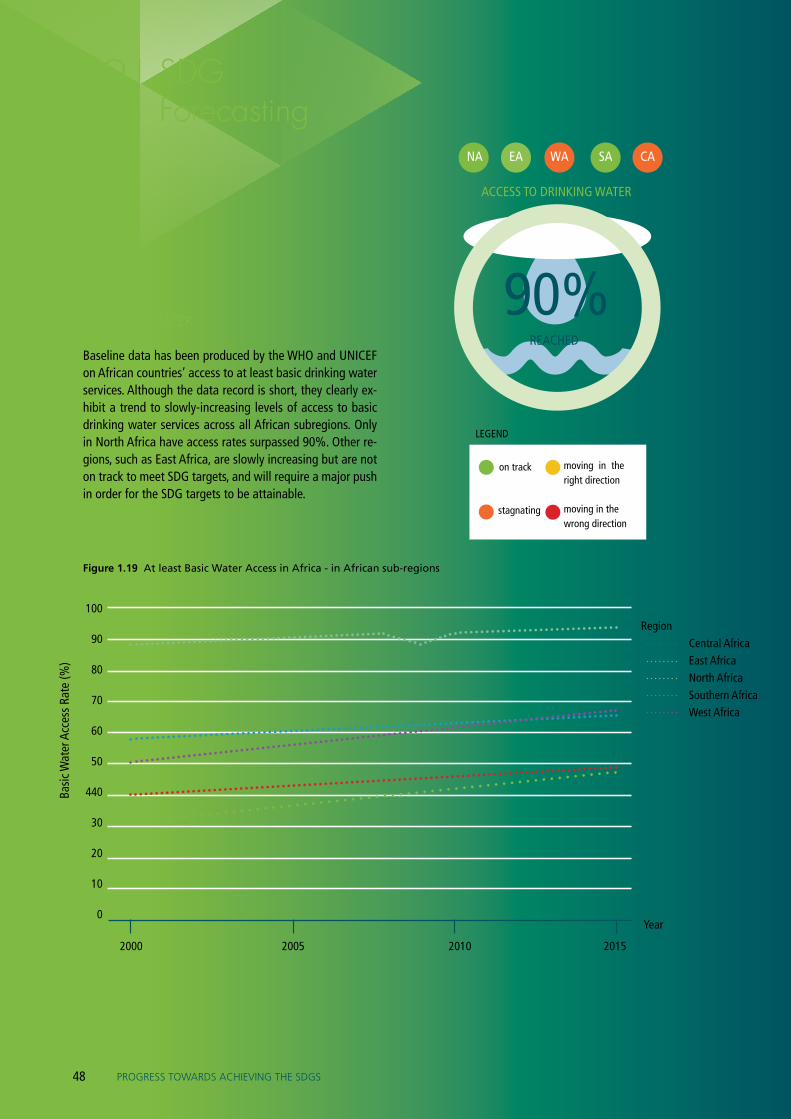
90%REACHED
NA EA WA SA CA
ACCESS TO DRINKING WATER
48
12. SDG Forecasting
PROGRESS TOWARDS ACHIEVING THE SDGS
DRINKING WATER
Baseline data has been produced by the WHO and UNICEF on African countries’ access to at least basic drinking water services. Although the data record is short, they clearly ex-hibit a trend to slowly-increasing levels of access to basic drinking water services across all African subregions. Only in North Africa have access rates surpassed 90%. Other re-gions, such as East Africa, are slowly increasing but are not on track to meet SDG targets, and will require a major push in order for the SDG targets to be attainable.
Figure 1.19 At least Basic Water Access in Africa - in African sub-regions
Region Central Africa East Africa North Africa Southern Africa West Africa
Basi
c Wat
er A
cces
s Ra
te (%
)
2000 2005 2010 2015
100
90
80
70
60
50
440
30
20
10
0Year
on track moving in the right direction
moving in the wrong direction
stagnating
LEGEND
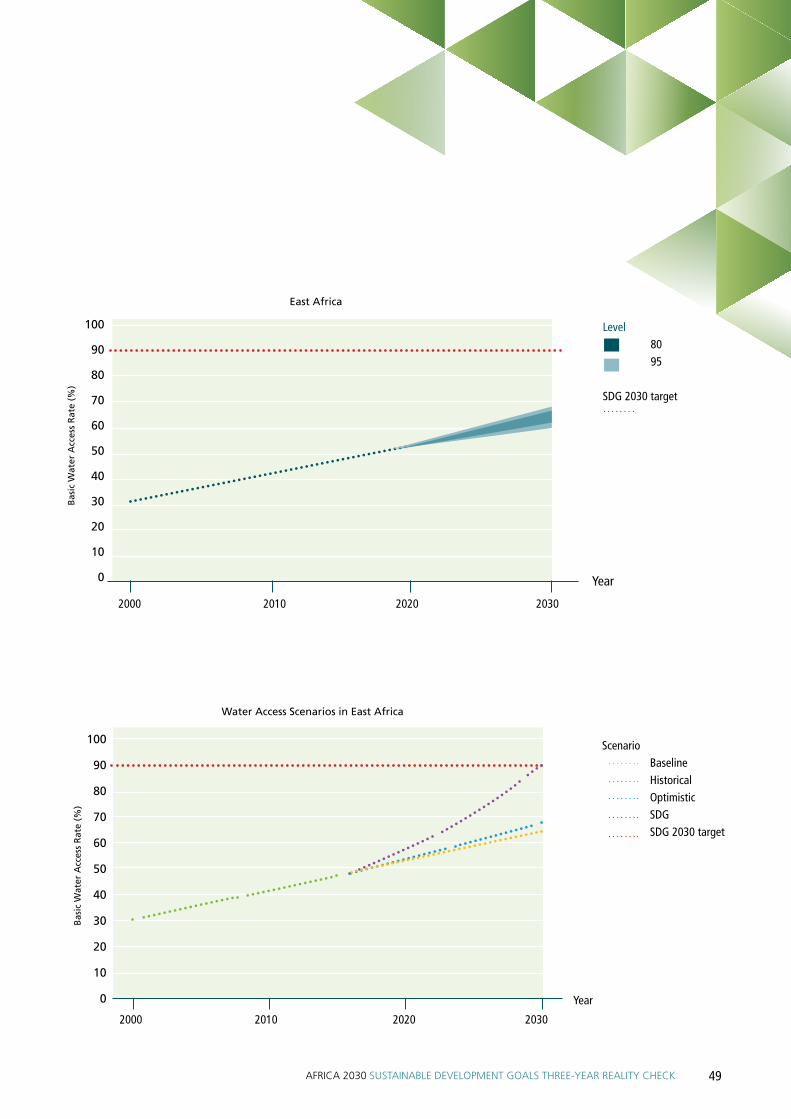
49AFRICA 2030 SUSTAINABLE DEVELOPMENT GOALS THREE-YEAR REALITY CHECK
2000 2010 2020 2030
100
90
80
70
60
50
40
30
20
10
0 Year
Scenario Baseline Historical Optimistic SDG SDG 2030 target
2000 2010 2020 2030
100
90
80
70
60
50
40
30
20
10
0 Year
Bas
ic W
ater
Acc
ess
Rat
e (%
)
East Africa
Water Access Scenarios in East Africa
Level 80 95
SDG 2030 target
Bas
ic W
ater
Acc
ess
Rat
e (%
)

50
1.3 TREND ANALYSIS

51AFRICA 2030 SUSTAINABLE DEVELOPMENT GOALS THREE-YEAR REALITY CHECK
1.3 Trend analysis (MDG-related SDGs vs other SDGs)
Goal 1 No poverty (formerly MDG 1)
As Figure 1.21 shows, West Africa has the highest percent-age of employed men (45%) and youth (40%) living below the international poverty line (US$1.90), whereas North Africa has the lowest (below 5%) (UNECA, 2019). The pro-portions of employed people living below the international poverty line has decreased in all regions. Currently, there is no updated poverty headcount data beyond 2015. In the long term, poverty has reduced, but in absolute terms, num-bers are high and challenges prevail.
Figure 1.20 “The working poor” - Proportion of employed population below the international poverty line of US$1.90 per day, 15 years old and over (%)
Source: SDGCA calculations based on UNECA online database

52
13. TrendAnalysing
PROGRESS TOWARDS ACHIEVING THE SDGS
Goal 2: Zero hunger (formerly MDG 1)
The prevalence of undernourishment in Africa has been in-creasing since 2015. Figure 1.21 shows undernourishment is increasing in each region. West Africa has the highest projected increment of 4.4% from 2014 to 2017. Despite the persistent high levels of undernourishment in East and Central Africa, the continent as a whole experienced a slight increase of 2.5% between 2014 and 2016, and the projection shows that it reached 3.5% in 2017.
Figure 1.21 Prevalence of undernourishment in the World and African regions, 2005-2017
Source: SDGCA calculations based on Food Agriculture Organisation (FAO) data, with projected figures for 2017
%
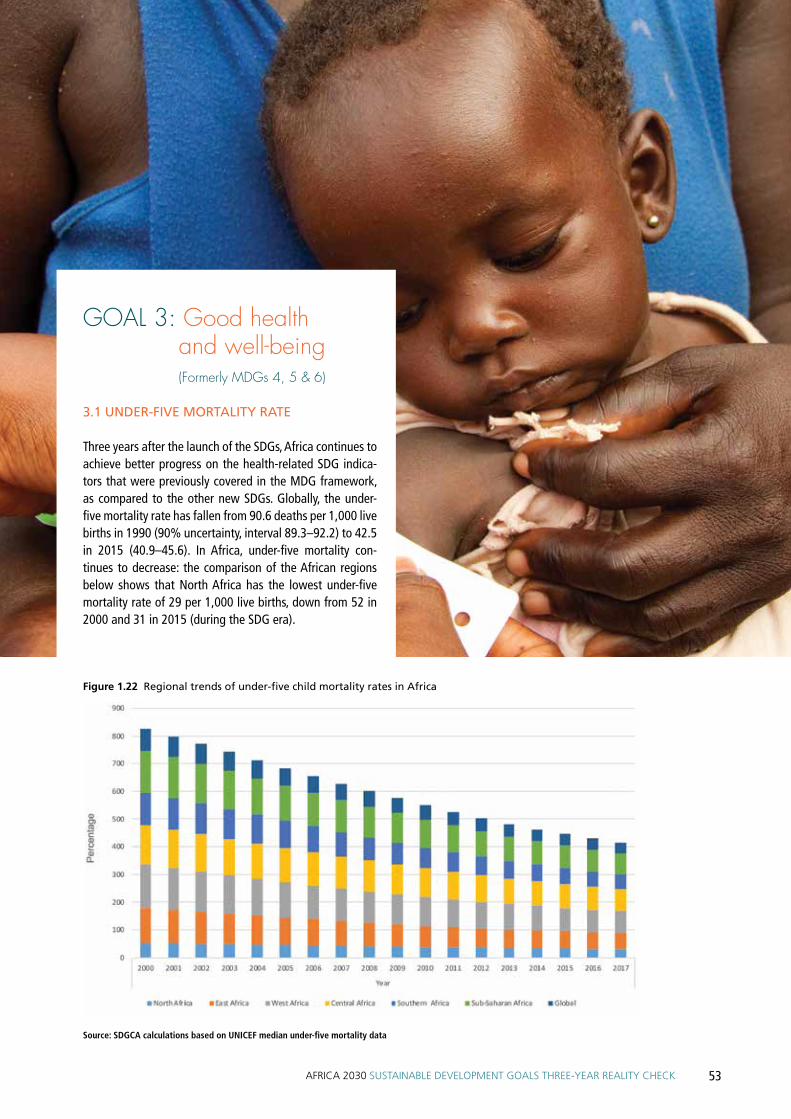
53AFRICA 2030 SUSTAINABLE DEVELOPMENT GOALS THREE-YEAR REALITY CHECK
GOAL 3: Good health and well-being (Formerly MDGs 4, 5 & 6)
3.1 UNDER-FIVE MORTALITY RATE
Three years after the launch of the SDGs, Africa continues to achieve better progress on the health-related SDG indica-tors that were previously covered in the MDG framework, as compared to the other new SDGs. Globally, the under-five mortality rate has fallen from 90.6 deaths per 1,000 live births in 1990 (90% uncertainty, interval 89.3–92.2) to 42.5 in 2015 (40.9–45.6). In Africa, under-five mortality con-tinues to decrease: the comparison of the African regions below shows that North Africa has the lowest under-five mortality rate of 29 per 1,000 live births, down from 52 in 2000 and 31 in 2015 (during the SDG era).
Figure 1.22 Regional trends of under-five child mortality rates in Africa
Source: SDGCA calculations based on UNICEF median under-five mortality data

54
13.
PROGRESS TOWARDS ACHIEVING THE SDGS
TrendAnalysing
3.2 IMPROVING MATERNAL MORTALITY
According to WHO, approximately 830 women die every day from preventable causes related to pregnancy and childbirth, and 99% of all maternal deaths occur in devel-oping countries. Globally, maternal mortality dropped by about 44% during the MDG era (1990-2015). In sub-Saha-ran Africa, it dropped from 128 in 2000 to 85 in 2017 (World Health Organization, 2018). Maternal mortality is higher for women in rural areas and poorer communities, and ado-lescents face a higher risk of complications and death as a result of pregnancy than other women. Currently, no African country has maternal mortality data for 2016 to 2018. How-ever, an assessment of the adolescent fertility rate for the African region shows that it is decreasing, with the excep-tion of North Africa, where it has increased from 37 to 41. Figure 1.23 shows the adolescent fertility rate for African regions from 2000 to 2017.
Figure 1.23 Regional adolescent fertility rate (births per 1,000 women ages 15-19)
Source: World Bank; UNFPA 2017
99% of all maternal deaths occur in developing countries.

55AFRICA 2030 SUSTAINABLE DEVELOPMENT GOALS THREE-YEAR REALITY CHECK
Goal 4: Quality education (formerly MDG 1)
Primary school enrollment rates in Africa have been rela-tively constant for some time (see Figure 1.24). Rates are fluctuating in East Africa, and increasing in Southern Africa. Sub-Saharan Africa experienced an impressive increase in the gross enrollment ratio of students in primary school between 2000 (99) and 2013 (104), but progress stalled between 2014 to 2017. The ratio can exceed 100% due to the inclusion of over-aged and under-aged students, be-cause of early or late school entrance or grade repetition. Evidence has shown that there are tremendous gains to be made in primary school enrollment and no African country has achieved universal primary education – for a country to do this, all children must have completed a full course of primary schooling (AAI, 2015). Therefore, there is still a long way to go to achieve this indicator at the continental level. Figure 1.24 shows that enrolment has been fluctuating in East Africa but increasing in Southern Africa (from 100 in 2000 to 113 in 2017) and North Africa (from 64 in 2000 to 104 in 2017). Overall it has decreased slightly in West and Central Africa during the SDG era.
Figure 1.24 Gross enrollment ratio for primary schools
Source: SDGCA calculations based on World Bank
No African country has achieved universal primary education

56
13. TrendAnalysing
PROGRESS TOWARDS ACHIEVING THE SDGS
Goal 5: Gender equality (formerly MDG 3)
Women are still more likely than men to be in vulnerable em-ployment, even though vulnerable employment is decreasing in prevalence (UN Women, 2017). Figure 1.25 shows that the proportion of seats held by women in national parliament is increasing in each region. In Rwanda, 61.3% of seats are held by women, the highest rate in Africa. Senegal comes in sec-ond (42.7%), followed by South Africa (42.2%) and Namibia (41.4%). The rest of the countries are below 40% and the lowest is Eswatini (formally Swaziland) with 6.2%.
Figure 1.25 Proportion of seats held by women in national parliaments (%)
Source: SDGCA calculations based on 2018 ECA, AfDB & AUC data
61,3% of seats in national parliament are held by women in Rwanda

57AFRICA 2030 SUSTAINABLE DEVELOPMENT GOALS THREE-YEAR REALITY CHECK
Goal 6: Clean water and sanitation
The total gross disbursement of ODA for water supply and sanitation has fallen from US$243 million to US$184 million in Central Africa 2014-2015 and from US$450 to US$319 million in Southern Africa 2014-2015 (AfDB Group, 2019). North Africa is the only region that experienced an increased ODA for water and sanitation in the same pe-riod. Overall, there was an increase in ODA in all regions between 2002 and 2014. There is no data from the SDG era to assess the progress.
Source: Open data portal, African Development Bank Group (AfDB Group, 2019)
ACCESS TO BASIC SANITATION
Africa has the lowest levels of basic sanitation services amongst world regions, although several countries have coverage levels comparable to other regions, including North African countries, Equatorial Guinea, and South Af-rica. The proportion of the population with access to at least basic sanitation services in Africa increased from 25% in 2000 to 28% in 2015 (AU, ECA, AfDB, & UNDP, 2018). Based on the Joint Monitoring Programme for Water Sup-ply’s 2017 Sanitation and Hygiene (JMP) projections, it is estimated that most countries will not be able to achieve the access target despite making notable progress between 2000 and 2015 (WHO & UNICEF, 2017). As seen in figure 6.2 below, some countries will not achieve the target by 2030. As of 2015, only eleven countries were consistently above 60% and the 2030 projections clearly show that Equatorial Guinea’s indicator will drop from 73.79 % in 2017 to 69% in 2030. Similarly, it is projected that in some countries ac-cess to basic sanitation will continue to decrease between now and 2030. These countries are: Kenya, Gambia, Nigeria and Democratic Republic of Congo. Rates will remain con-stant in Libya, Egypt and Seychelles and the only country that will achieve the 100% target by 2030 is Tunisia. It is unlikely that countries with rates of less than 60% today will achieve the target of access to adequate and equitable sanitation and hygiene for all by 2030 (as shown in Figure 1.26).
Figure 1.26 Total gross disbursement of ODA for water supply and sanitation (USD)
Total Gross Disbursement of ODA for Water Supply and Sanitation (Cur, US$)
East Africa Central Africa North Africa Southern Africa West Africa
2002
2003
2004
2005
2006
2007
2008
2009
2010
2011
2012
2013
2014
2015
0
500M
250M
750M
No data from the SDG eraon water and hygiene

58
13.
PROGRESS TOWARDS ACHIEVING THE SDGS
Figure 1.27 Population with access to basic sanitation services, 2015-2017 and 2030 projections
Source: WASHwatch 2019 projections based 2000-2015 data (WHO & UNICEF, 2017)

59AFRICA 2030 SUSTAINABLE DEVELOPMENT GOALS THREE-YEAR REALITY CHECK
Figure 1.27 Population with access to basic sanitation services, 2015-2017 and 2030 projections
Goal 7: Affordable and clean energyAccess to clean energy increased between 2000 and 2016 in each region. The highest share of people using clean fuels and technologies for cooking is in North Africa. The rest of the regions are performing poorly, but there are some coun-tries that are doing well within them: South Africa (85%), Mauritius (93%), Seychelles (90%), Cabo Verde and Gabon (79%) are all well above the world average of 56% of the population.
Figure 1.29 . Proportion of population with access to clean fuels and technologies for cooking %
Source: IEA data from the Clean fuels and technologies Service (IEA, 2019)
85% increase of access to clean energy in South Africa

60
13. TrendAnalysing
PROGRESS TOWARDS ACHIEVING THE SDGS
Goal 8: Decent work and economic growth
The proportion of the working population living with their families on less than US$1.90 per person per day has de-clined significantly over the past decades, falling from 52.8% to 33.5% in 2000 and 2015 respectively (African Un-ion, Economic Commission for Africa, African Development Bank, & United Nations Development Programme, 2017). Figure 1.29 shows that the growth rate of real GDP per em-ployed person decreased in each region from 2005 to 2016. In Central Africa, it fell from 4% in 2005 to -2% in 2016.
Figure 1.29 Growth rate of real GDP per employed person (%)
Source: SDGCA calculations based on African Statistical Yearbook (ECA, AU, & AfDB, 2018)
US$ 1.90 per day has declinedfrom 52.8% to 33.5%
% living on less than

61AFRICA 2030 SUSTAINABLE DEVELOPMENT GOALS THREE-YEAR REALITY CHECK
Goal 9: Industry, innovation and infrastructure
Africa’s infrastructure has the potential to promote eco-nomic growth and lift people out of poverty. There is evi-dence that, between 2005 and 2015, total official interna-tional support for infrastructure (millions of constant USD) increased in 28 countries (52%). In all other countries, it de-creased. Morocco saw an increment of 68.3%, and Somalia had the highest increment of 99.8%, while Swaziland saw the greatest drop from US$40 to US$12.4 million. Between 2016 and 2018, there is no data to show the progress of this SDG (ECA et al., 2018).
Goal 10: Reduce inequality within and among countries
Reducing inequality within and among countries is a key means of ensuring that the basic needs and rights of all per-sons are met. However, the requisite interventions are still absent in many countries across Africa. For instance, from 2000 to 2015, inequalities in total resource flows for devel-opment increased in 25 African countries (ECA et al., 2018).
Goal 11: Sustainable cities and communitiesData on this goal’s 10 targets and 15 indicators is limited, therefore no trend analysis was feasible. Baseline data re-lated to Target 11.3 shows that Africa’s level of urbaniza-tion stood at 43% in 2018, and the majority of the conti-nent is projected to reach 51.5% by 2030. At the regional level, Central Africa and North Africa had the highest rates
of urbanization (around 60%), followed by West Africa and Southern Africa at 45% and 43% respectively (AU et al., 2018). Effective urban and regional development planning for African countries requires sub-national data (both urban and regional), which currently is not available. However, 13 countries have formulated and 21 countries are in the pro-cess of implementing national urban policies. In additional to this, a few countries are implementing national disaster risk-reduction strategies in line with the Sendai framework. These countries are: Central African Republic, Egypt, Ethio-pia and Liberia. It is difficult to assess the progress achieved so far on the indicators for this goal because of the lack of data. Currently, the only available data for this indicator is the proportion of urban populations living in slums.
Goal 12: Responsible consumption and production
The shift towards sustainable consumption and production patterns is already underway in some African countries. Ma-terial intensity in Africa, excluding North Africa, is very low and Africa has experienced the fastest population growth rate relative to other regions. It has been projected that more than half of the anticipated global population growth between now and 2050 is expected to occur in Africa, the only region in the world still experiencing substantial popu-lation growth (AU et al., 2018). There is progress in African regions signing environmental agreements: West, North and East Africa have signed a majority of the Basel, Montre-al, Rotterdam and Stockholm agreements, while Southern and Central Africa fell short of the average in terms of their commitments. However, three years after the adoption of the SDGs and signing the environmental agreements, there is no adequate data on any of the targets or indicators to assess the progress in Africa.

62
13. TrendAnalysing
PROGRESS TOWARDS ACHIEVING THE SDGS
Goal 13: Climate Action
By 2017, 32 sub-Saharan African countries had agreed to climate pledges known as Nationally Determined Contribu-tions (NDCs), 34 had ratified the Paris Agreement, and 45 had registered for the United Nations Framework Conven-tion on Climate Change (UNFCCC) in June 2017 (Climate Analytics, 2018). Over the last decade, countries have made progress in managing the worst effects of disasters, mainly by developing institutions and policies for disaster risk re-duction and strengthening capacity for disaster prepared-ness, responses and early warnings. There is little progress in tackling the underlying drivers of disaster risk such as poverty, poor urban planning and land use, weak environ-mental and resource management, and climate change. However, some countries have begun implementing na-tional and local disaster risk-reduction strategies to address these factors and, in 2017, 39 least-developed countries undertook specific measures to initiate and address gaps in formulating and implementing national adaptation plans (NAPs). For instance, Kenya managed to work on climate-proof infrastructure in its NDC, which categorizes a range of short- and longer-term actions, including vulnerability assessments, sectoral priorities and upgrading infrastruc-ture over time (Kenya Ministry of Environment and Natural Resources, 2015).

63AFRICA 2030 SUSTAINABLE DEVELOPMENT GOALS THREE-YEAR REALITY CHECK
Goal 14: Life below water
Most of the countries with maritime borders do not have protected areas in relation to marine life. Figure 1.30 shows that Sudan (16%) has the highest share of protected areas in relation to marine life, followed by South Africa (12%). However, five countries including Angola, Comoros, Mauri-tius, Nigeria, Seychelles and Sao Tome and Principe do not have any protected areas for marine conservation.
Figure 1.30 Percentage coverage of protected areas in relation to marine areas by Country 2018
Source: SDGCA calculations based on Africa Statistical Yearbook (ECA et al., 2018)
Global Goals free diving world champion Umberto Pelizzari raised a flag below water. Photo © globalgoals.org/Enrico.

64
13. TrendAnalysing
PROGRESS TOWARDS ACHIEVING THE SDGS
Goal 15: Life on land
One of the targets for this goal is to take urgent and sig-nificant action to reduce the degradation of natural habi-tats, halt the loss of biodiversity and, by 2020, protect and prevent the extinction of threatened species (in accordance with target 15.5). The only indicator to assess this target is the Red List Index11 (IUCN & BLI, 2017). Figure 1.31 sum-marizes the trends of the Red List Index in Africa by region, showing that extinction risk is falling in each region. This means that all African regions are doing well in meeting this target, although progress is slow in Central and South-ern Africa where the extinction risk fell by just 0.1 between 2000 and 2017.
1 The International Union for Conservation of Nature (IUCN) Red List Index measures change in aggregate extinction risk across groups of species, based on genuine changes in the number of species in each category and expressed in an index ranging from 0 to 1.
Figure 1.31 Regional Red List Index
Source: SDGCA Calculations based on African Statistical Yearbook (ECA et al., 2018)
1,00
0,95
0,90
0,85
0,80
0,75North East West Central South
Africa Regions
Inde
x
2000 2010 2017

65AFRICA 2030 SUSTAINABLE DEVELOPMENT GOALS THREE-YEAR REALITY CHECK
Goal 16: Peace, justice and strong institutions
Since 2016, there has been no updated data on the indica-tors for Goal 16. Figure 1.32 shows that victims of inten-tional homicide per 100,000 people are higher in Southern Africa (33%) than any other regions, while North Africa has the lowest incidence. The data used in the chart below is from 2010 to 2015, and each country has a different data period. For instance, the Zambia data was collected in 2010, Ghana in 2011, and Libya in 2015.
Figure 1.32 Percentage of victims of intentional homicide
per 100,000 populations 2010-2015
Source: SDGCA Calculations based on African Statistical Yearbook (ECA et al., 2018)
Goal 17: Partnering for goals
By 2015, over half of African countries had a national statis-tical plan that was fully funded and under implementation. Not one country in North Africa had a national statistical plan. However, they were prevalent elsewhere: in ten out of 13 East African nations, six out of 15 West African na-tions, and nine out of 12 Southern African countries. Africa is doing well in terms of statistical development and the number of countries that have data on most of the indica-tors has increased from 2000 to 2015 (ECA et al., 2018). On the other hand, progress has been uneven, both across regions and within countries. Long-term commitment is re-quired to address critical issues in the SDG era to support statistical capacity and the implementation of SDG-related interventions.
33% in Southern Africais higher than other regions
intentional homicide
14. Data Gaps for the SDGs
PROGRESS TOWARDS ACHIEVING THE SDGS 66
1.4 Data gaps for the SDGs
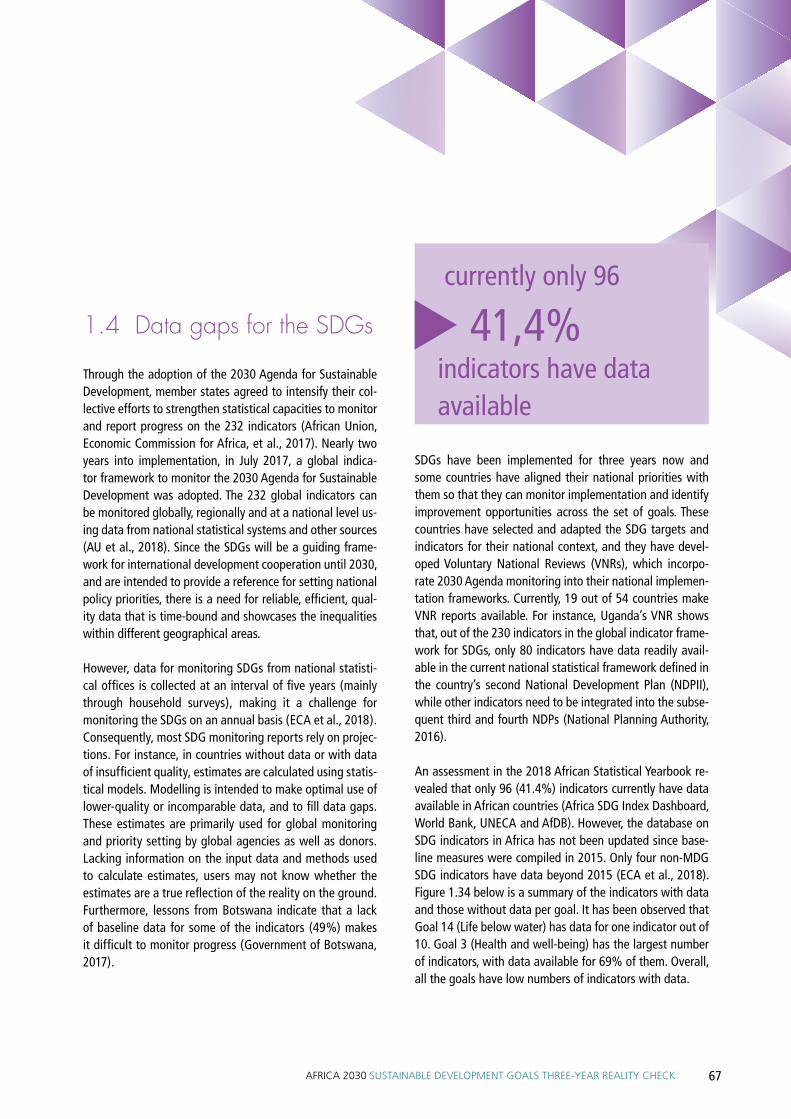
67AFRICA 2030 SUSTAINABLE DEVELOPMENT GOALS THREE-YEAR REALITY CHECK
1.4 Data gaps for the SDGs
Through the adoption of the 2030 Agenda for Sustainable Development, member states agreed to intensify their col-lective efforts to strengthen statistical capacities to monitor and report progress on the 232 indicators (African Union, Economic Commission for Africa, et al., 2017). Nearly two years into implementation, in July 2017, a global indica-tor framework to monitor the 2030 Agenda for Sustainable Development was adopted. The 232 global indicators can be monitored globally, regionally and at a national level us-ing data from national statistical systems and other sources (AU et al., 2018). Since the SDGs will be a guiding frame-work for international development cooperation until 2030, and are intended to provide a reference for setting national policy priorities, there is a need for reliable, efficient, qual-ity data that is time-bound and showcases the inequalities within different geographical areas. However, data for monitoring SDGs from national statisti-cal offices is collected at an interval of five years (mainly through household surveys), making it a challenge for monitoring the SDGs on an annual basis (ECA et al., 2018). Consequently, most SDG monitoring reports rely on projec-tions. For instance, in countries without data or with data of insufficient quality, estimates are calculated using statis-tical models. Modelling is intended to make optimal use of lower-quality or incomparable data, and to fill data gaps. These estimates are primarily used for global monitoring and priority setting by global agencies as well as donors. Lacking information on the input data and methods used to calculate estimates, users may not know whether the estimates are a true reflection of the reality on the ground. Furthermore, lessons from Botswana indicate that a lack of baseline data for some of the indicators (49%) makes it difficult to monitor progress (Government of Botswana, 2017).
SDGs have been implemented for three years now and some countries have aligned their national priorities with them so that they can monitor implementation and identify improvement opportunities across the set of goals. These countries have selected and adapted the SDG targets and indicators for their national context, and they have devel-oped Voluntary National Reviews (VNRs), which incorpo-rate 2030 Agenda monitoring into their national implemen-tation frameworks. Currently, 19 out of 54 countries make VNR reports available. For instance, Uganda’s VNR shows that, out of the 230 indicators in the global indicator frame-work for SDGs, only 80 indicators have data readily avail-able in the current national statistical framework defined in the country’s second National Development Plan (NDPII), while other indicators need to be integrated into the subse-quent third and fourth NDPs (National Planning Authority, 2016).
An assessment in the 2018 African Statistical Yearbook re-vealed that only 96 (41.4%) indicators currently have data available in African countries (Africa SDG Index Dashboard, World Bank, UNECA and AfDB). However, the database on SDG indicators in Africa has not been updated since base-line measures were compiled in 2015. Only four non-MDG SDG indicators have data beyond 2015 (ECA et al., 2018). Figure 1.34 below is a summary of the indicators with data and those without data per goal. It has been observed that Goal 14 (Life below water) has data for one indicator out of 10. Goal 3 (Health and well-being) has the largest number of indicators, with data available for 69% of them. Overall, all the goals have low numbers of indicators with data.
41,4% indicators have data available
currently only 96

68
14. Data Gaps for the SDGs
PROGRESS TOWARDS ACHIEVING THE SDGS
Figure 1.33 Number of indicators with data compared with number of indicators per SDG goal
Source: ECA et al., 2018; SDGC/A & SDSN, 2018
Partnerships for goals
Peace, justice and strong institutions
Life on land
Life below water
Climate action
Responsible consumption & production
Sustainable cities and communities
Reduce inequalities
Industry, innovation and infrastructure
Decent work and economic growth
Affordable and clean energy
Clean water and sanitation
Gender equality
Quality education
Good health and well-being
Zero hunger
No poverty
8
6
6
1
2
4
2
5
8
10
4
2
3
6
18
8
3
Total number of Indicators with data
0 5 15 20 25 30
Total number of Indicators per goal
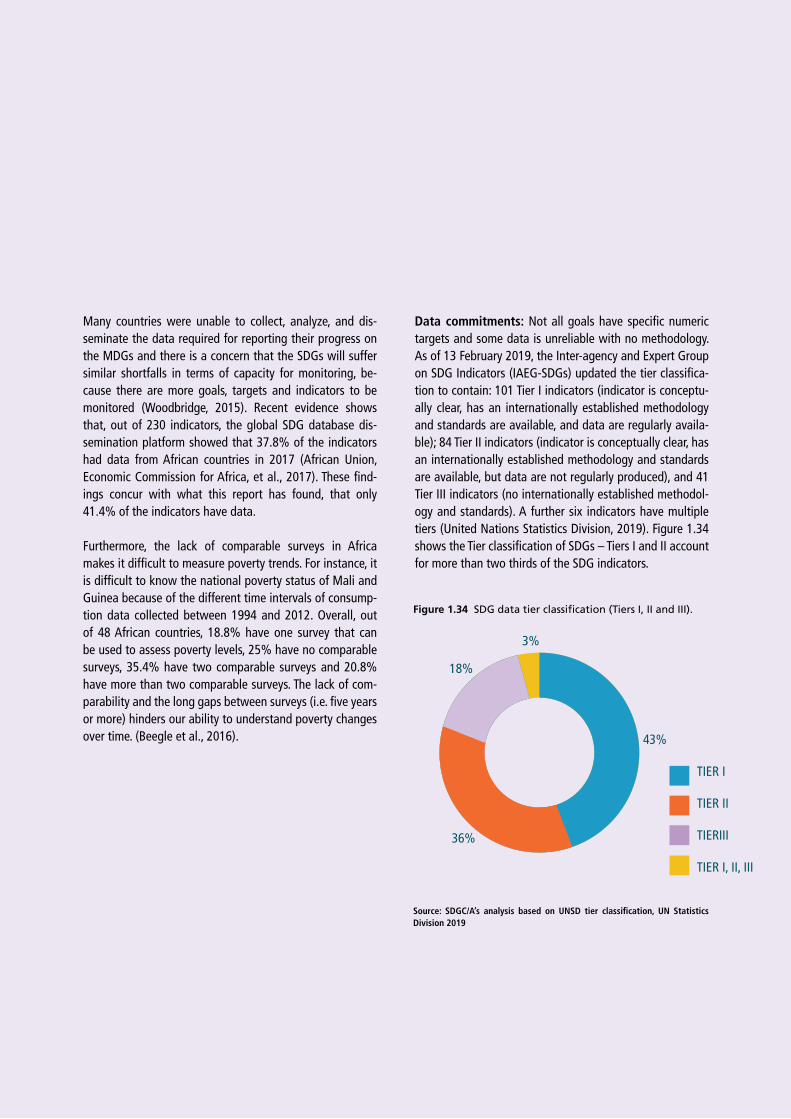
69AFRICA 2030 SUSTAINABLE DEVELOPMENT GOALS THREE-YEAR REALITY CHECK
Many countries were unable to collect, analyze, and dis-seminate the data required for reporting their progress on the MDGs and there is a concern that the SDGs will suffer similar shortfalls in terms of capacity for monitoring, be-cause there are more goals, targets and indicators to be monitored (Woodbridge, 2015). Recent evidence shows that, out of 230 indicators, the global SDG database dis-semination platform showed that 37.8% of the indicators had data from African countries in 2017 (African Union, Economic Commission for Africa, et al., 2017). These find-ings concur with what this report has found, that only 41.4% of the indicators have data.
Furthermore, the lack of comparable surveys in Africa makes it difficult to measure poverty trends. For instance, it is difficult to know the national poverty status of Mali and Guinea because of the different time intervals of consump-tion data collected between 1994 and 2012. Overall, out of 48 African countries, 18.8% have one survey that can be used to assess poverty levels, 25% have no comparable surveys, 35.4% have two comparable surveys and 20.8% have more than two comparable surveys. The lack of com-parability and the long gaps between surveys (i.e. five years or more) hinders our ability to understand poverty changes over time. (Beegle et al., 2016).
Data commitments: Not all goals have specific numeric targets and some data is unreliable with no methodology. As of 13 February 2019, the Inter-agency and Expert Group on SDG Indicators (IAEG-SDGs) updated the tier classifica-tion to contain: 101 Tier I indicators (indicator is conceptu-ally clear, has an internationally established methodology and standards are available, and data are regularly availa-ble); 84 Tier II indicators (indicator is conceptually clear, has an internationally established methodology and standards are available, but data are not regularly produced), and 41 Tier III indicators (no internationally established methodol-ogy and standards). A further six indicators have multiple tiers (United Nations Statistics Division, 2019). Figure 1.34 shows the Tier classification of SDGs – Tiers I and II account for more than two thirds of the SDG indicators.
Figure 1.34 SDG data tier classification (Tiers I, II and III).
Source: SDGC/A’s analysis based on UNSD tier classification, UN Statistics Division 2019
3%
18%
36%
43%
TIER I
TIER II
TIERIII
TIER I, II, III

70
14. Data Gaps for the SDGs
PROGRESS TOWARDS ACHIEVING THE SDGS
Out of 169 targets, 46.7% are still not quantified to enable effective assessment of progress and implementation. Goal 17 has the most unquantifiable targets (79%), followed by Goal 15 (75%). It is pointless to define goals that cannot be quantified and measured. Beyond the unquantifiable tar-gets for the SDGs, there are also unattainable ones, such as “universal health coverage,” “ending poverty in all its forms and dimensions,” and so on. Some targets use the same indicators. For example, target 1.5 is “to build the re-silience of the poor and those in vulnerable situations and reduce their exposure and vulnerability to climate-related extreme events and other economic, social and environ-mental shocks and disasters.” This overlaps with several other goals. For example, consider target 11.5 in light of 1.5:
“ By 2030, significantly reduce the number of deaths and the number of people affected and substantially decrease the direct economic losses relative to global gross domestic product caused by disasters, includ-ing water-related disasters, with a focus on protecting the poor and people in vulnerable situations”.
In order to track the sustainable development changes, quantified targets and clear, effective time frames are vi-tal to determine whether adequate progress is being made. This means an analytical review of SDGs is needed to rein-force the SDG framework. An effective global governance architecture needs to ensure a complete and equitable representation of countries in international institutions as well as decision-making processes. Challenges in the global arena need to be recognized from all sides – demand and supply, origin and destination. More importantly, they need to be understood holistically; addressing a problem without addressing its cause is a futile pursuit.
79% of Goal 17’s targets are unquantifiable

AFRICA 2030 SUSTAINABLE DEVELOPMENT GOALS THREE-YEAR REALITY CHECK
1.5 Current Performance Analysis
71

72
15. CurrentPerformanceAnalysis
PROGRESS TOWARDS ACHIEVING THE SDGS
1.5 Current performance analysis
STARTING POINT FOR AFRICA
At the start of the SDG era, Africa was characterized by low-income countries: 52% of African nations (28 in number) was classified as low-income with a GDP per capita of less than US$1,025. These countries are still characterized by low trading volumes dominated by commodity exports, a large agricultural sector, a small share of high technology exports as a share of total manufactured exports, and de-clining aid. A majority of African countries (37) had a “low” Human Development Index score of less than 0.55 2. Africa’s share of total global trade remains low – African exports ac-counted for only 2.4% of global exports in 2015, and most of these countries run a twin deficit (current account and fiscal) (Verter, 2017). After a decade and a half of trade sur-plus with China, with exports being greater than imports, this trend was reversed in 2015, resulting in a trade defi-cit thereafter. The fiscal deficits in government budgets are associated with expansionary fiscal allocations to address the large infrastructure gap estimated at US$130–US$170 billion a year, with a financing gap remaining in the range of US$67.6–US$107.5 billion (African Development Bank, 2018). As a result, the rapid depreciation of the domestic currencies against major trading currencies in 2015 (associ-ated in part with the reduction in commodity prices) raised foreign currency liabilities for most African countries (IMF, 2016). A third of the countries in sub-Saharan Africa have tax revenues of just 13% of their GDP; the fiscal space has narrowed further since 2015, and 50% of countries are as-sessed to have pronounced risk, with debt amounting to over 50% of GDP.
2 The Human Development Index (HDI) is a composite statistic of life expectancy, education, and income per capita indicators. Its score is between 0 and 1. The higher the score, the higher levels of human development.
The global environment was also unfavorable in 2015, with the slowdown in China, tightening financial conditions, the slow recovery of the eurozone, and the tightening of monetary policy in the United States. These factors had im-plications for Africa’s growth, with sub-Saharan Africa reg-istering the slowest growth (3.5%) in 15 years in 2015. In per capita terms, this was just 1% growth annually. Africa’s population growth was simultaneously the highest in the world, dominated by a youth bulge that could have signifi-cant negative effects. The persistent lack of demographic transition sparked by reduced fertility had implications for the unrealized MDGs, particularly health, but also manifest-ed in the rising numbers of poor people – despite having halved the 1990 poverty rate. In 2015, more than half of the global poor (736 million) were in sub-Saharan Africa (World Bank, 2018b). Two thirds of the countries with a poverty rate of over 18% were in sub-Saharan Africa and the av-erage poverty rate for Africa was 34% (US$1.90 per day, 2011). Only five countries (Seychelles, Mauritius, Morocco, Egypt and Algeria) had met the SDG 2030 poverty target of 3% in 2015.
Fragility was also highly prevalent in Africa, with 31 Afri-can countries classified by the IMF as fragile (International Monetary Fund, 2018b) 3 . Fragility manifests in many forms including weak institutions and corruption. This backdrop, coupled with substantial weaknesses in doing business as well as large infrastructure gaps, underlines the need to monitor the progress of structural constraints to the SDGs.
3 Fragility is when the LIC three-year moving average of its Country Policy and Institutional Assessment (CPIA) score, pre-pared by the World Bank, is 3.2 or lower. Additionally, a nation is deemed fragile if there has been a United Nations or regional peace-keeping/building operation there during the previous three years, or if the CPIA has not been computed because of conflict.

73AFRICA 2030 SUSTAINABLE DEVELOPMENT GOALS THREE-YEAR REALITY CHECK
Africa is diverse and heterogeneous, as are the SDGs. Ex-isting performance analysis reveals heterogeneous per-formance by different African nations across the different goals. The SDGs are also rooted in the five pillars of People, Prosperity, Planet, Partnership and Peace (“the 5Ps”) – an espoused framework of social inclusion, economic growth, and environmental protection. The goals are predominantly people-centered, and all of the SDGs support the Prosper-ity pillar. The next sub-section of this report explores and compares performance across the economic, social and en-vironmental dimensions of the SDGs.
ECONOMIC GROWTH, HUMAN WELL-BEING AND ENVIRONMENT
Economic Growth: Economic growth is enshrined within Sustainable Development Goal 8, which targets sustained, inclusive and sustainable economic growth, full and pro-ductive employment, and decent work for all. In particular, SDG 8.1 aims for sustained per capita economic growth in accordance with national circumstances, and at least seven percent GDP growth per annum in the least developed countries. Africa’s share of global GDP has been declining, from 3% in 2015 to 2.7% in 2017 – roughly the same drop experienced in 1990. This illustrates that convergence with global players has not happened. In the SDG era, growth in Africa has been lower than the rest of the world’s growth rate (see Figure 1.35).
Figure 1.35 Regional real GDP growth rate 2000-2023
Source: IMF World Economic Outlook Data Base, IMF 2019; dotted segments are IMF projections

74
15. CurrentPerformanceAnalysis
PROGRESS TOWARDS ACHIEVING THE SDGS
The growth rate for Africa over the medium term is expect-ed to remain subdued and would be deemed insufficient to meet the SDGs. Only five countries (Ethiopia, Ghana, Sen-egal, Côte d’Ivoire and Libya) met the growth rate of seven percent envisaged under SDG 8 in 2017. The current growth performance for African economies is shown in Figure 1.36.
Figure 1.36 GDP growth for African Countries
Source: International Monetary Fund, 2019
Nigeria accounts for nearly
25% of Africa’s poor
(430 million) (World Data Lab, 2018).
Sout
h Su
dan,
Rep
ublic
of
Equa
toria
l Gui
nea
Chad
Cong
o, R
epub
lic o
f An
gola
Leso
tho
Nam
ibia
Buru
ndi
Gab
onN
iger
iaSo
uth
Afric
aAl
geria
Suda
nEs
wat
ini
Tuni
siaSo
mal
iaBo
tsw
ana
Libe
riaCo
mor
osCo
ngo,
Dem
. Rep
. of t
heZa
mbi
aCa
mer
oon
Mau
ritan
iaM
ozam
biqu
eSi
erra
Leo
neZi
mba
bwe
Mau
ritiu
sSã
o To
mé
and
Prín
cipe
Cabo
Ver
deM
alaw
iM
oroc
coEg
ypt
Mad
agas
car
Cent
ral A
frica
n Re
publ
icTo
goG
ambi
a, Th
eUg
anda
Keny
aN
iger
Eritr
eaSe
yche
lles
Mal
iBe
nin
Gui
nea-
Biss
auTa
nzan
iaRw
anda
Burk
ina
Faso
Djib
outi
Sene
gal
Côte
d’Iv
oire
Gui
nea
Gha
naEt
hiop
ia
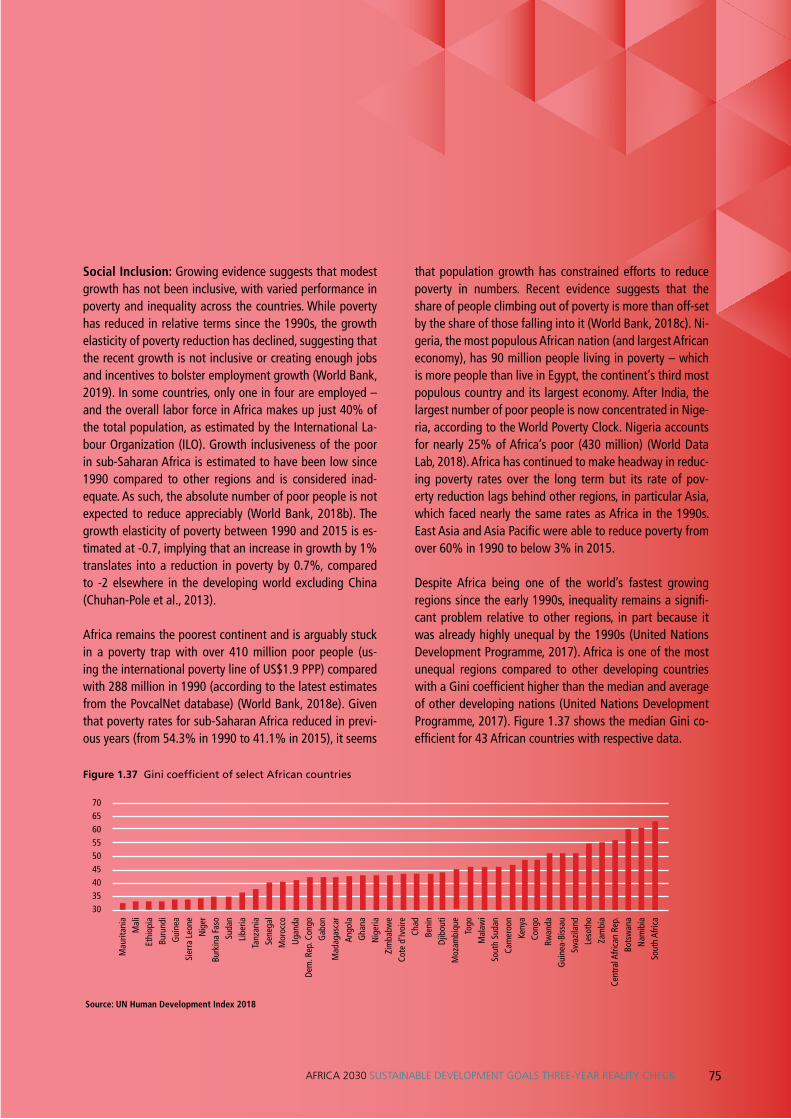
75AFRICA 2030 SUSTAINABLE DEVELOPMENT GOALS THREE-YEAR REALITY CHECK
Social Inclusion: Growing evidence suggests that modest growth has not been inclusive, with varied performance in poverty and inequality across the countries. While poverty has reduced in relative terms since the 1990s, the growth elasticity of poverty reduction has declined, suggesting that the recent growth is not inclusive or creating enough jobs and incentives to bolster employment growth (World Bank, 2019). In some countries, only one in four are employed – and the overall labor force in Africa makes up just 40% of the total population, as estimated by the International La-bour Organization (ILO). Growth inclusiveness of the poor in sub-Saharan Africa is estimated to have been low since 1990 compared to other regions and is considered inad-equate. As such, the absolute number of poor people is not expected to reduce appreciably (World Bank, 2018b). The growth elasticity of poverty between 1990 and 2015 is es-timated at -0.7, implying that an increase in growth by 1% translates into a reduction in poverty by 0.7%, compared to -2 elsewhere in the developing world excluding China (Chuhan-Pole et al., 2013).
Africa remains the poorest continent and is arguably stuck in a poverty trap with over 410 million poor people (us-ing the international poverty line of US$1.9 PPP) compared with 288 million in 1990 (according to the latest estimates from the PovcalNet database) (World Bank, 2018e). Given that poverty rates for sub-Saharan Africa reduced in previ-ous years (from 54.3% in 1990 to 41.1% in 2015), it seems
that population growth has constrained efforts to reduce poverty in numbers. Recent evidence suggests that the share of people climbing out of poverty is more than off-set by the share of those falling into it (World Bank, 2018c). Ni-geria, the most populous African nation (and largest African economy), has 90 million people living in poverty – which is more people than live in Egypt, the continent’s third most populous country and its largest economy. After India, the largest number of poor people is now concentrated in Nige-ria, according to the World Poverty Clock. Nigeria accounts for nearly 25% of Africa’s poor (430 million) (World Data Lab, 2018). Africa has continued to make headway in reduc-ing poverty rates over the long term but its rate of pov-erty reduction lags behind other regions, in particular Asia, which faced nearly the same rates as Africa in the 1990s. East Asia and Asia Pacific were able to reduce poverty from over 60% in 1990 to below 3% in 2015.
Despite Africa being one of the world’s fastest growing regions since the early 1990s, inequality remains a signifi-cant problem relative to other regions, in part because it was already highly unequal by the 1990s (United Nations Development Programme, 2017). Africa is one of the most unequal regions compared to other developing countries with a Gini coefficient higher than the median and average of other developing nations (United Nations Development Programme, 2017). Figure 1.37 shows the median Gini co-efficient for 43 African countries with respective data.
Figure 1.37 Gini coefficient of select African countries
Source: UN Human Development Index 2018
Mau
ritan
iaM
ali
Ethi
opia
Buru
ndi
Gui
nea
Sier
ra L
eone
Nig
erBu
rkin
a Fa
soSu
dan
Libe
riaTa
nzan
iaSe
nega
lM
oroc
coUg
anda
Dem
. Rep
. Con
goG
abon
Mad
agas
car
Ango
laG
hana
Nig
eria
Zim
babw
eCo
te d
’Ivoi
reCh
adBe
nin
Djib
outi
Moz
ambi
que
Togo
Mal
awi
Sout
h Su
dan
Cam
eroo
nKe
nya
Cong
oRw
anda
Gui
nea-
Biss
auSw
azila
ndLe
soth
oZa
mbi
aCe
ntra
l Afri
can
Rep.
Bots
wan
aN
amib
iaSo
uth
Afric
a
706560555045403530
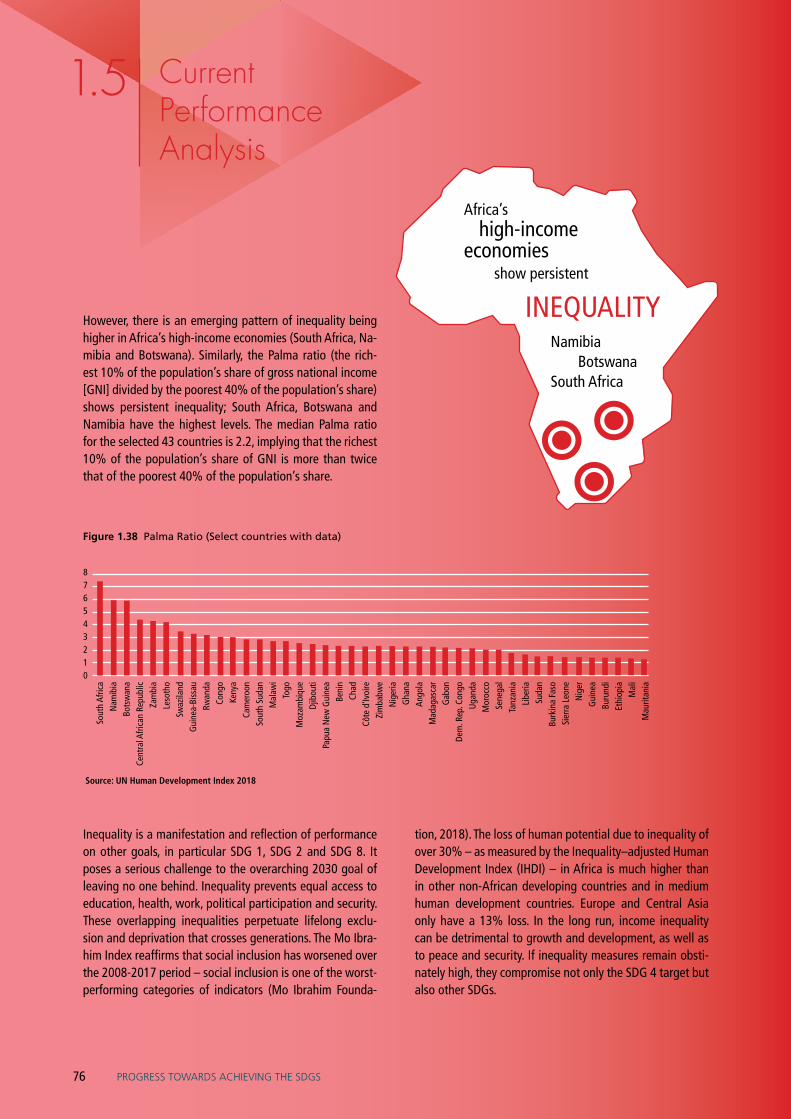
76
15. CurrentPerformanceAnalysis
PROGRESS TOWARDS ACHIEVING THE SDGS
However, there is an emerging pattern of inequality being higher in Africa’s high-income economies (South Africa, Na-mibia and Botswana). Similarly, the Palma ratio (the rich-est 10% of the population’s share of gross national income [GNI] divided by the poorest 40% of the population’s share) shows persistent inequality; South Africa, Botswana and Namibia have the highest levels. The median Palma ratio for the selected 43 countries is 2.2, implying that the richest 10% of the population’s share of GNI is more than twice that of the poorest 40% of the population’s share.
Figure 1.38 Palma Ratio (Select countries with data)
Source: UN Human Development Index 2018
Africa’s high-income economies show persistent
INEQUALITYNamibia BotswanaSouth Africa
Inequality is a manifestation and reflection of performance on other goals, in particular SDG 1, SDG 2 and SDG 8. It poses a serious challenge to the overarching 2030 goal of leaving no one behind. Inequality prevents equal access to education, health, work, political participation and security. These overlapping inequalities perpetuate lifelong exclu-sion and deprivation that crosses generations. The Mo Ibra-him Index reaffirms that social inclusion has worsened over the 2008-2017 period – social inclusion is one of the worst-performing categories of indicators (Mo Ibrahim Founda-
tion, 2018). The loss of human potential due to inequality of over 30% – as measured by the Inequality–adjusted Human Development Index (IHDI) – in Africa is much higher than in other non-African developing countries and in medium human development countries. Europe and Central Asia only have a 13% loss. In the long run, income inequality can be detrimental to growth and development, as well as to peace and security. If inequality measures remain obsti-nately high, they compromise not only the SDG 4 target but also other SDGs.
Sout
h Af
rica
Nam
ibia
Bots
wan
aCe
ntra
l Afri
can
Repu
blic
Zam
bia
Leso
tho
Swaz
iland
Gui
nea-
Biss
auRw
anda
Cong
oKe
nya
Cam
eroo
nSo
uth
Suda
nM
alaw
iTo
goM
ozam
biqu
eDj
ibou
tiPa
pua
New
Gui
nea
Beni
nCh
adCô
te d
’Ivoi
reZi
mba
bwe
Nig
eria
Gha
naAn
gola
Mad
agas
car
Gab
onDe
m. R
ep. C
ongo
Ugan
daM
oroc
coSe
nega
lTa
nzan
ia
Libe
riaSu
dan
Burk
ina
Faso
Sier
ra L
eone
Nig
erG
uine
aBu
rund
iEt
hiop
iaM
ali
Mau
ritan
ia
876543210

77AFRICA 2030 SUSTAINABLE DEVELOPMENT GOALS THREE-YEAR REALITY CHECK
The performance on other human-centered SDG indicators is ominous. The level of stunting in Africa remains high (an estimated 58 million children), undernourishment affects over 25% in both Central and Eastern Africa, and over 280 million people are malnourished. Both under-five mortal-ity and maternal mortality have improved in sub-Saharan Africa over the last two decades but they remain the high-est in the world. Under-five mortality stands at three times the 2030 target of 25 per 1,000 live births. Nearly 4 in 10 African nations have a maternal mortality rate of over 500 deaths per 100,000 live births.
Environment: On environment-related SDGs, a mixed performance has been observed. On a positive note, Af-rica has the lowest carbon emissions, but this is in part a reflection of low economic activity. Other indicators also show positive trends (SDGC/A & SDSN, 2018). Almost half of the SDGs are related to the environment and the index showed that the best performing goals are climate change action and life below water. Overall, 77% of the countries are maintaining SDG performance on climate action, i.e. their score is at or above SDG achievement level. On the other hand, among the countries not currently at an SDG-compatible level of climate action, Egypt and Seychelles are
the only countries that are increasing their scores at the rate needed to achieve SDG 13 by 2030. Furthermore, life on land is also doing well – in 48% of countries, the score is increasing at more than 50% of the required growth rate but still not enough to achieve the SDG by 2030, and 19% of countries are already at an SDG-compatible level and maintaining SDG achievement. Whereas 78% of the coun-tries are maintaining requisite carbon dioxide emissions per capita (metric tons per capita) for Goal 7 Affordable and clean energy, in 9% of countries the score is worsening.
Overall, three years’ evidence illustrates that progress to-wards the SDGs is way off-target. Based on existing analy-sis, the 2030 targets are unlikely to be met (AU et al., 2018). The medium-term risks also continue to prevail. The next sub-section outlines the underlying constraints to SDGs.
PERFORMANCE CONSTRAINTS
The macroeconomic environment matters for SDGs, and has been unfavorable but is improving. The first year of implementation saw rapid depreciation of most African currencies against the main trading cur-rencies, associated with a drop in commodity prices.
Lack of demographic
changeDeclining
labour productivity
Weak governance
Low income syndrome or
trap
Sluggish agricultural productivity
Poor infrastructure
Tight global & national economic conditions
CONSTRAINTS
TO 2030SDGs
STRUCTURAL CONSTRAINTS TO SDGS

78
15. CurrentPerformanceAnalysis
PROGRESS TOWARDS ACHIEVING THE SDGS
Consequently, 2016 saw the lowest growth rate for two decades in Africa (International Monetary Fund, 2017). The recent economic slowdown in Africa is consistent with global growth and that of emerging economies. A positive correlation is found between business cycles in SSA and China, the European Union, and United States for the pe-riod 2001-16 (International Monetary Fund, 2018a). In the Economic Report for Africa 2017, a positive correlation is also found between real GDP growth in Africa and China for the period 2000–2014 (United Nations Economic Com-mission for Africa, 2017). This has implications for SDGs, in particular for poverty reduction, employment and rais-ing sustainable financing for the goals. The predominating output gap and slow progress on people-centered SDGs are also a manifestation of structural challenges. Structural transformation is yet to happen in most African countries (World Bank, 2018b). The associated lack of structural change is constraining development (de Vries, Timmer, & de Vries, 2015).
Demographic challenges prevail. Africa is the only re-gion that hasn’t seen a demographic transition (Henao, Hui, Shaw, Dushime, & Hufft, 2017). High population growth in Africa, especially in sub-Saharan Africa, slows progress to-wards structural transformation relative to other regions, which also constrains productivity and development (World Bank, 2018b). Given that 10 out of 17 SDGs are people-centered, the lack of demographic transition constrains structural and social economic development, which speaks to the findings of de Vries et al. On average, approximately five children are born to each mother in Africa, which is equivalent to the global average of 1950 (Bloom, 2016).
This implies that Africa’s current fertility is nearly double the current global average of 2.5. Additionally, Africa’s popula-tion growth rate of 2.59% per annum by far exceeds all the other regions – global average population growth is 1.19%. This has implications for the population structure: life expectancy in Africa is the lowest in the world (61 years) and the continent has the lowest median age (19 years), the same as in 1950. It also compares unfavorably to the global
median age of 30 years (a 25-year median age in lower-middle income and a 40-year median age in high-income countries). The median age tends to increase with a region’s income per capita. If unchecked, the African population growth rate will double in 28 years – far more rapidly than Europe, which will double in 173 years, and the global pop-ulation, which will double in 64 years. This will have serious economic and social consequences. The current median age of 19 years is associated with unproductive years, which increases dependency. In 2035, Africa is poised to have as great a working age population (aged 15-64) than the rest of the world. High fertility is constraining women’s potential and increasing dependency (age dependency of 85 for Sub Saharan Africa). Africa’s population remains largely rural (60%) – and the rural population accounts for the majority of the poor. The average size of a poor household in Africa is larger than the overall national average, suggesting that the poverty problem will remain pronounced at the current population trajectory. The age dependency ratio (average dependents per working adult) in Africa is as high as it was in 2000. The pressure population growth puts on resources is starting to manifest in obstinate rates of mortality, persis-tent inequalities and increasing levels of food insecurity. The demographic structure also has implications for stunting, which remains high – the median stunting rate for Africa is slightly in excess of 30%. Stunting constrains one’s full life development, learning and future productivity (World Bank, 2018c).
Africa’s population growth rate exceeds all other regions
2.59%and will double in only 28 years
(compared to Europe:173 years)
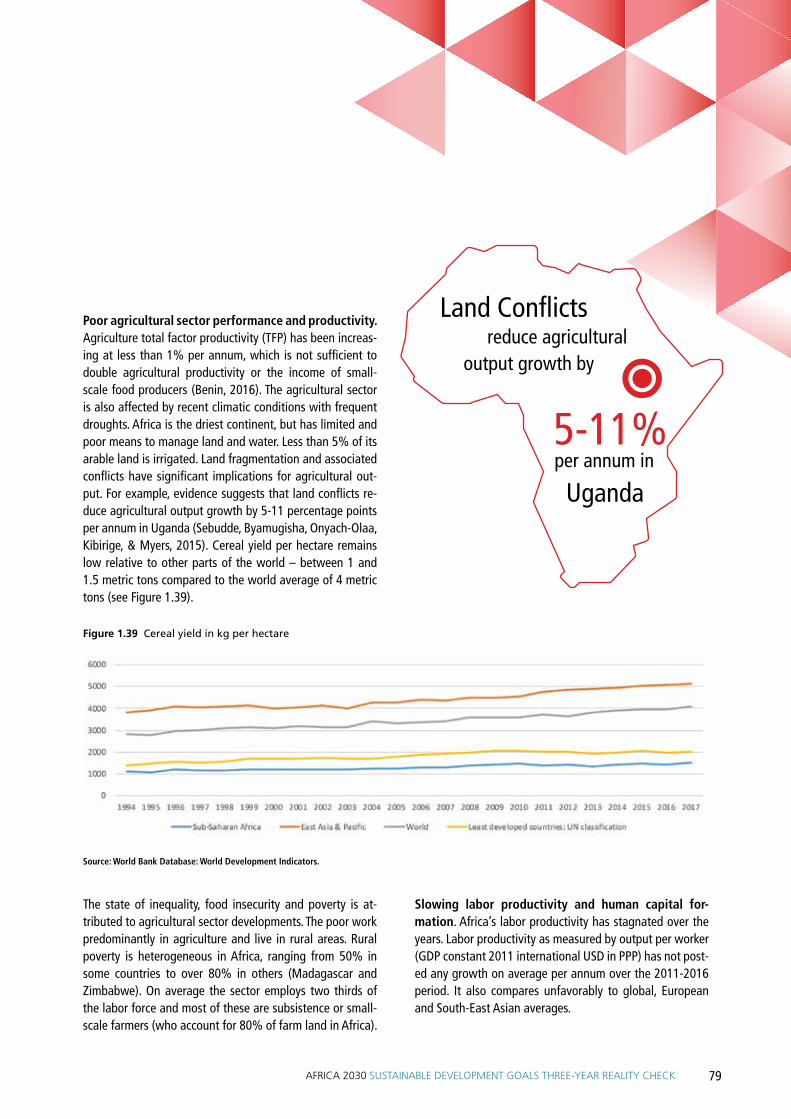
79AFRICA 2030 SUSTAINABLE DEVELOPMENT GOALS THREE-YEAR REALITY CHECK
Poor agricultural sector performance and productivity. Agriculture total factor productivity (TFP) has been increas-ing at less than 1% per annum, which is not sufficient to double agricultural productivity or the income of small-scale food producers (Benin, 2016). The agricultural sector is also affected by recent climatic conditions with frequent droughts. Africa is the driest continent, but has limited and poor means to manage land and water. Less than 5% of its arable land is irrigated. Land fragmentation and associated conflicts have significant implications for agricultural out-put. For example, evidence suggests that land conflicts re-duce agricultural output growth by 5-11 percentage points per annum in Uganda (Sebudde, Byamugisha, Onyach-Olaa, Kibirige, & Myers, 2015). Cereal yield per hectare remains low relative to other parts of the world – between 1 and 1.5 metric tons compared to the world average of 4 metric tons (see Figure 1.39).
Figure 1.39 Cereal yield in kg per hectare
Source: World Bank Database: World Development Indicators.
The state of inequality, food insecurity and poverty is at-tributed to agricultural sector developments. The poor work predominantly in agriculture and live in rural areas. Rural poverty is heterogeneous in Africa, ranging from 50% in some countries to over 80% in others (Madagascar and Zimbabwe). On average the sector employs two thirds of the labor force and most of these are subsistence or small-scale farmers (who account for 80% of farm land in Africa).
Slowing labor productivity and human capital for-mation. Africa’s labor productivity has stagnated over the years. Labor productivity as measured by output per worker (GDP constant 2011 international USD in PPP) has not post-ed any growth on average per annum over the 2011-2016 period. It also compares unfavorably to global, European and South-East Asian averages.
Land Conflicts reduce agricultural output growth by
5-11% per annum in
Uganda
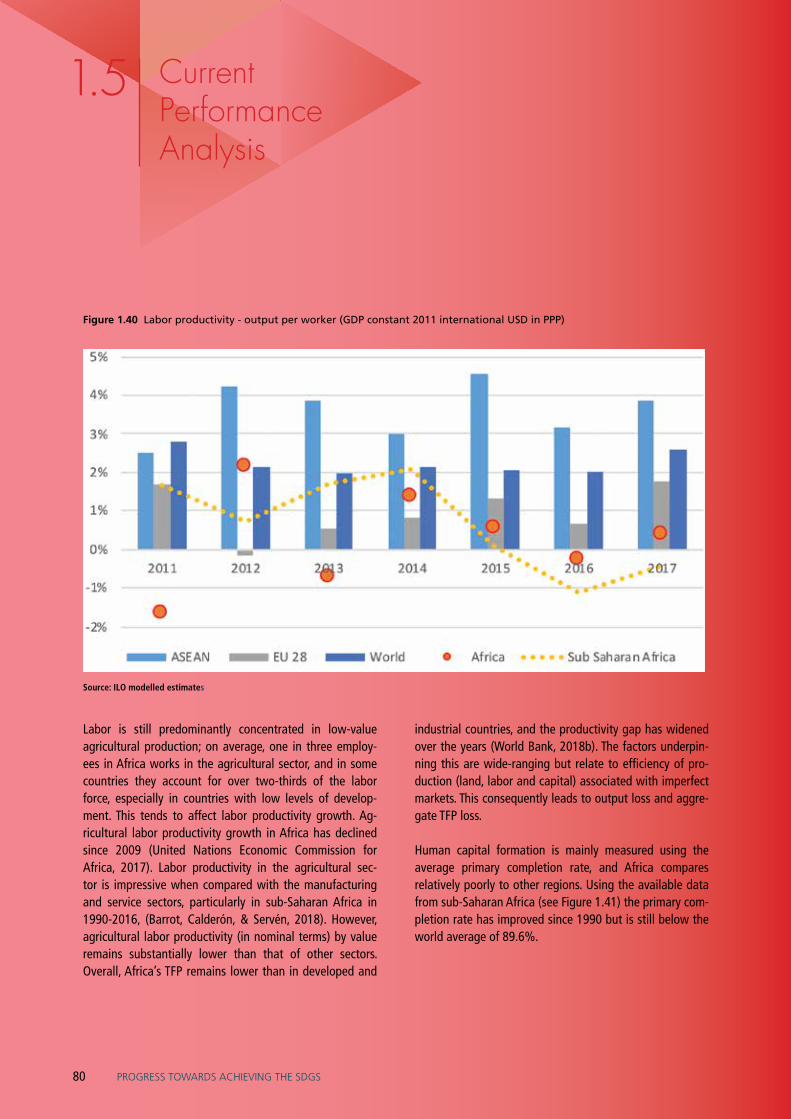
80
15. CurrentPerformanceAnalysis
PROGRESS TOWARDS ACHIEVING THE SDGS
Figure 1.40 Labor productivity - output per worker (GDP constant 2011 international USD in PPP)
Source: ILO modelled estimates
Labor is still predominantly concentrated in low-value agricultural production; on average, one in three employ-ees in Africa works in the agricultural sector, and in some countries they account for over two-thirds of the labor force, especially in countries with low levels of develop-ment. This tends to affect labor productivity growth. Ag-ricultural labor productivity growth in Africa has declined since 2009 (United Nations Economic Commission for Africa, 2017). Labor productivity in the agricultural sec-tor is impressive when compared with the manufacturing and service sectors, particularly in sub-Saharan Africa in 1990-2016, (Barrot, Calderón, & Servén, 2018). However, agricultural labor productivity (in nominal terms) by value remains substantially lower than that of other sectors. Overall, Africa’s TFP remains lower than in developed and
industrial countries, and the productivity gap has widened over the years (World Bank, 2018b). The factors underpin-ning this are wide-ranging but relate to efficiency of pro-duction (land, labor and capital) associated with imperfect markets. This consequently leads to output loss and aggre-gate TFP loss.
Human capital formation is mainly measured using the average primary completion rate, and Africa compares relatively poorly to other regions. Using the available data from sub-Saharan Africa (see Figure 1.41) the primary com-pletion rate has improved since 1990 but is still below the world average of 89.6%.
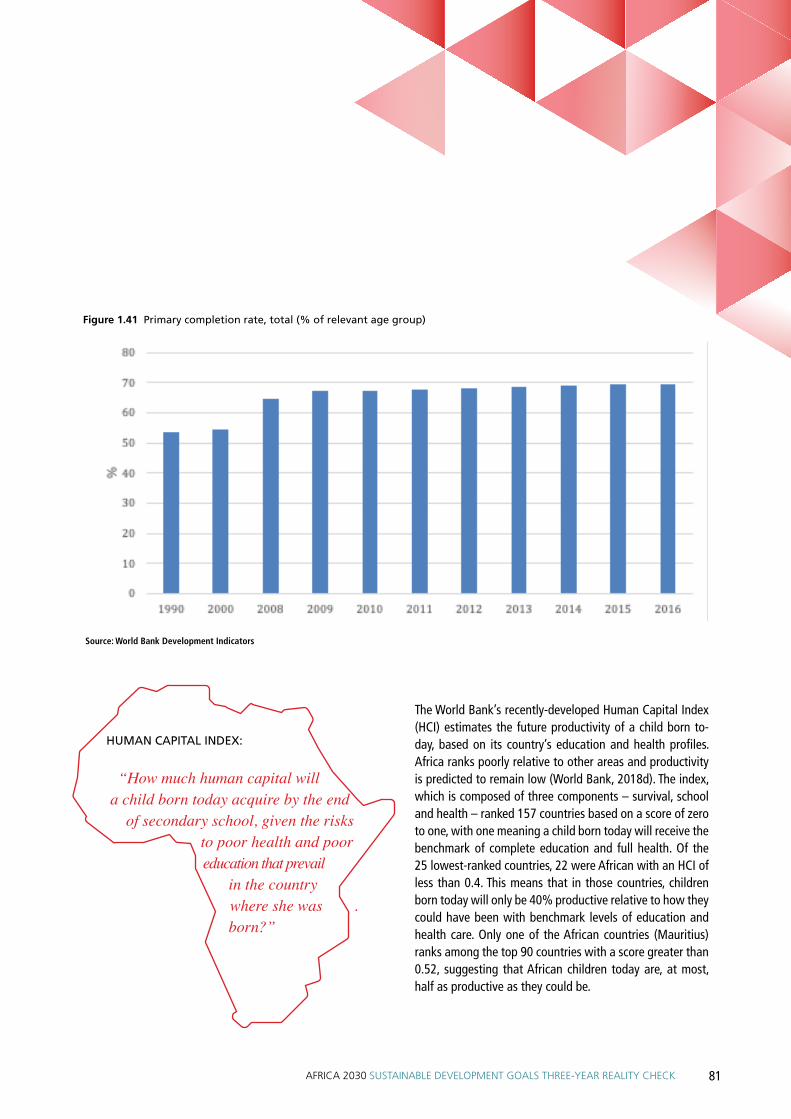
81AFRICA 2030 SUSTAINABLE DEVELOPMENT GOALS THREE-YEAR REALITY CHECK
Figure 1.41 Primary completion rate, total (% of relevant age group)
Source: World Bank Development Indicators
The World Bank’s recently-developed Human Capital Index (HCI) estimates the future productivity of a child born to-day, based on its country’s education and health profiles. Africa ranks poorly relative to other areas and productivity is predicted to remain low (World Bank, 2018d). The index, which is composed of three components – survival, school and health – ranked 157 countries based on a score of zero to one, with one meaning a child born today will receive the benchmark of complete education and full health. Of the 25 lowest-ranked countries, 22 were African with an HCI of less than 0.4. This means that in those countries, children born today will only be 40% productive relative to how they could have been with benchmark levels of education and health care. Only one of the African countries (Mauritius) ranks among the top 90 countries with a score greater than 0.52, suggesting that African children today are, at most, half as productive as they could be.
HUMAN CAPITAL INDEX:
“How much human capital will a child born today acquire by the end
of secondary school, given the risks to poor health and poor education that prevail in the country
where she was . born?”

82
15. CurrentPerformanceAnalysis
PROGRESS TOWARDS ACHIEVING THE SDGS
Poor infrastructure. Without a well-developed and expan-sive network of infrastructure, it is impossible to achieve sustainable development. Infrastructure is a key ingredient for economic growth, as is a thrust for social economic de-velopment through various transmission channels, including the provision of reliable power and road networks essential for industrial development (Ncube & Lufumpa, 2017). Af-rica still has poor infrastructure, making it the least globally competitive region in the World Economic Forum’s Global Competitiveness Index for 2017-18. Three quarters of the Index’s 25 lowest-ranking countries are in Africa. While the 2018 Africa Infrastructure Development Index (AIDI) shows improvements since 2016, performance remains heteroge-neous, with 10 African countries stuck at the bottom (Af-rican Development Bank Group, 2018). North Africa con-tinues to take the lead, as it does for other development outcomes (as shown by the Africa SDG Index), followed by Southern Africa, West Africa, East Africa and Central Africa. Inequalities in access to infrastructure have reduced across Africa but the progress witnessed over recent years is not enough for meeting SDGs. The infrastructure gap remains large (in terms of quantity, quality and access), and the need for effective public investment in and management of infrastructure projects remains pronounced (Calderon, Cantu, & Chuhan-Pole, 2018). With limited supply of infra-structure services, associated inefficiencies translate into higher transport service costs – and these related costs are higher in Africa than in other developing regions (African Development Bank Group, 2018).
Governance weakness
Evidence suggests that good governance is the key to achieving the SDGs and the 2030 Sustainable Development Agenda. Good governance is essential for transforming po-litical commitments into reality. Africa has witnessed pro-gress in governance, in both political and economic spheres, but serious challenges prevail in many African nations. Ac-cording to the 2018 Ibrahim Index of African Governance (IIAG), progress in governance has not kept up with popu-lation growth, and in particular the growing youth demo-graphic and the expectations that come with it (Mo Ibrahim Foundation, 2018).
Figure 1.42 shows that governance matters for develop-ment. Empirical literature corroborates the existence of a long-term relationship between governance and develop-ment in African countries (Adefeso, 2018). Nations with low governance scores also rank low on the Africa SDG Index. Mapping the World Bank’s Worldwide Governance Indica-tors against the Africa SDG Index also shows a positive correlation with a coefficient of 0.44. Countries with a low political score are associated with lower levels of economic development in Africa. Additionally, the key components of the IIAG show worsening personal safety, business environ-ments, and national security. The IIAG index paints an un-favourable picture for human rights, public management, rural sector growth and education in Africa. Likewise, in the Global Peace Index 2018, 45% of the lowest-ranked coun-tries are in Africa (Institute for Economics & Peace, 2017). Fragility remains prevalent – 80% of the world’s fragile states are in Africa and 65% of the countries on alert for fra-gility (with a fragility score of over 90) are in Africa (Jones, 2013). Fragile states tend to have weak institutions that risk compromising economic development. These fragile states have made the slowest progress in reducing poverty. Weak institutional capacities also undermine development in Af-rican countries. (Acemoglu & Robinson, 2008).

83AFRICA 2030 SUSTAINABLE DEVELOPMENT GOALS THREE-YEAR REALITY CHECK
Figure 1.42 Governance and SDG performance
Source: SDGC/A exposition of Africa SDG Index and Mo Ibrahim Index
10 20 30 40 50 60 70 80 90Mo Ibrahim Index
Afric
a SD
G In
dex
70
65
60
55
50
45
40
35
30
Eritrea SudanDRC
Eq. Guinea
Guinea-BissauLiberia
Comoros
Niger
DjiboutiTogo
NigeriaCote d’Ivoire
Ethiopia ZimbabweCameroon
Mali
GuineaSierra Leone
Burundi
CongoAngola
Chad
CARSomalia
Madagascar
Mozambique
Gambia
SwazilandBurkina Faso
KenyaZambiaLesotho
BeninMalawi
TanzaniaSenegal
Rwanda
Sao Tome
UgandaGabon
Egypt
Algeria
Morocco
Tunisia
Ghana
NamibiaBotswana
South Africa
MauritiusCabo Verde
Mauritania

SDG SUPPLY-SIDE DYNAMICS
02
84

SDG SUPPLY-SIDE DYNAMICS02
85AFRICA 2030 SUSTAINABLE DEVELOPMENT GOALS THREE-YEAR REALITY CHECK
This section provides a holistic and candid review of the gov-ernance framework of SDGs, where it exists. It reviews the supporting regulatory and policy frameworks, the shortfalls in these, and the accountability mechanisms (global, regional and national). The governance framework is enshrined in the commitments made in September 2015 and documented in the SDG 2030 Agenda. This section further reviews the opera-tionalization of the SDG indicator framework as well as the commitments made in SDG17. It further explores the financing for SDGs in line with the Addis Ababa Action Agenda (AAAA). It unbundles the trends, intricacies and ambiguities created by the changing global and economic dynamics including (but not limited to): changing commodity prices; slow global growth; the eurozone debt crisis, and domestic dynamics that undermine reform of domestic revenue collection. It interro-gates whether the current financing for sustainable develop-ment is enough. In particular, the exploratory analysis focuses on the fundamental sources of financing: domestic revenue, ODA, remittances, FDI, philanthropy financing, develop-ment bank financing, and other innovative financing means. However, the section does not cover the impact of respective financing or its utilization on SDGs. These should be explored in subsequent reports. The section relies predominantly on documentary evidence – which is scattered and limited. The section attempts to bridge the knowledge gaps and highlight areas where gaps prevail. It also underlines the best pathways to accelerate collective efforts and achieve a sustainable devel-opment financing system.
21. SDGGovernanceFramework
2.1 Current Governance Framework
SDG SUPPLY-SIDE DYNAMICS86

87AFRICA 2030 SUSTAINABLE DEVELOPMENT GOALS THREE-YEAR REALITY CHECK
2.1 SDG Governance Framework The 2030 Agenda for Sustainable Development, the Paris Agreement on climate change and the Addis Ababa Ac-tion Agenda on Financing for Development are interrelated global agendas that lay out ambitious aspirations for trans-forming the world – plans of action for our people, planet and prosperity. For Africa, Agenda 2063 is a long-term strategic framework for socio-economic transformation. It sets out a vision for an integrated, peaceful and prosper-ous Africa, and is 85% aligned with the goals of the SDGs (SDGC/A & SDSN, 2018).
Though strides have been made in implementing Agenda 2030, three years after its adoption, overall progress to-wards the SDG targets has been off-track. Poor momentum and slow progress is due in part to a weak SDG governance framework (OECD, 2018; United Nations, 2017). Given the complexity and transformative nature of Agenda 2030, ap-propriate and effective governance structures that reinforce its implementation have not been set-up at local or global levels. Governance involves: appropriate operational guid-ance; supporting effective coordination and collaboration of all stakeholders; making decisions that consider trade-offs and optimize synergies; implementing robust monitoring and evaluation mechanisms, and ensuring accountability.
The SDGs were designed through a broad-based dialogue and consultation process that involved representatives of government, civil society, the private sector and academia from around the world. This was the right approach, and consistent with the SDGs’ core principle of leaving no one behind. Despite enormous enthusiasm for the SDGs around the world (and the fact that they were endorsed by 193 United Nations member states), there remains a lack of clearly defined responsibilities for achieving them at na-tional and international levels. Implementation has lacked coordination and active participation from the diverse range of stakeholders, and commitments far exceed likely progress (Begashaw, 2017). The SDG agreement is not le-gally binding, and provides few guidelines for enforcing, monitoring and evaluating progress. The integration and holistic adoption of SDGs into the global policy and insti-tutional frameworks of finance is still outstanding. Trade, investment and development remain incomplete and op-erational gaps prevail (United Nations, 2019).
Among others, the key gaps in the SDG governance frame-work include: the lack of clear roles and responsibilities for key stakeholders, both locally and internationally; poor coordination of efforts by different stakeholders, which sometimes leads to a duplication of work, and weak over-sight and monitoring mechanisms to oversee progress in terms of mainstreaming and implementing SDGs and tak-ing appropriate and timely action when there are gaps. As witnessed at local and global levels, there has been little sense of urgency for Agenda 2030 and poor momentum for change amongst most key stakeholders. This has seriously undermined the implementation of SDGs (United Nations, 2018a, 2018c, 2018d).
AT THE GLOBAL LEVEL
The High-level Political Forum (HLPF), under the auspices of the UN General Assembly and the Economic and So-cial Council, oversees the follow-up and review of SDGs. As stipulated in paragraph 84 of the 2030 Agenda, HLPF is supposed to be a global platform where progress to-wards SDGs at national, regional and global levels can be monitored and challenges shared. This should include pro-viding assistance to those countries and goals making the least progress. It is also a space for different stakeholders to strategize and build solidarity. However, analysis from past HLPF sessions indicates that there are shortfalls. The forum meets once a year for eight days. This is not enough to effectively influence the course of SDG implementation, which needs to be monitored on a real-time basis. Gov-ernment reporting to the UN is voluntary and there is no requirement for countries to respond to or follow up with recommendations for action brought up at the HLPF. So far, 140 countries have prepared for or announced Voluntary National Reports (VNRs), including 35 from Africa.
Between 2016 and 2018, 19 African countries conducted VNRs (Benin, Botswana, Cabo Verde, Egypt, Ethiopia, Guin-ea, Kenya, Madagascar, Mali, Morocco, Namibia, Niger, Nigeria, Senegal, Sierra Leone, Sudan, Togo, Uganda and Zimbabwe). A further 18 African countries are expected to conduct VNRs in 2019 (Algeria, Burkina Faso, Camer-oon, Central African Republic, Chad, Côte d’Ivoire, Eritrea, Eswatini, Ghana, Lesotho, Mauritania, Mauritius, Rwanda, Republic of Congo, Sierra Leone, South Africa, Tanzania and, Tunisia). Countries’ reports differ in quality and timeliness, and the areas reported on may not cover all 17 SDGs. At HLPF, each country is given 30 minutes to present itself, including a question and answer session. Some of the pre-sentations have been criticized for portraying congratula-tory government self-assessments that may not reflect the reality on the ground (Civil Society Reflection Group, 2018).
SDG SUPPLY-SIDE DYNAMICS88
21. SDGGovernanceFramework
In preparation for the 2019 VNR presentations, a prepara-tory global workshop was held in October 2018 in Gene-va, Switzerland. The workshop summary report highlights some challenges faced with VNRs, including: establishing cross- and inter-institutional SDG coordination mecha-nisms; addressing the principle of leaving no one behind and engaging stakeholders; ensuring data availability, data disaggregation, and statistical capacity, and improving data complementarity at the global, regional and national lev-els. Other challenges include: completing the VNR report in time for the submission to the HLPF; highlighting interlink-ages between the SDGs in the reviews; transforming report-ing exercises into a useful input for debate in parliaments; linking VNRs to budgets in governments, and putting in place monitoring and evaluation mechanisms and assess-ing policy impact (Civil Society Reflection Group, 2018).
On challenges faced at the regional level, the summary found “little ownership” of the 2030 Agenda and of the Af-rican Union’s Agenda 2063 by public institutions in Africa, and slow progress in adapting and implementing SDGs in many African countries.
AT THE REGIONAL LEVEL
The African Peer Review Mechanism (APRM) is a mutually agreed self-monitoring instrument established by the AU in 2003 to strengthen governance and sustainable develop-ment. As of July 2018, 37 AU member states had joined the APRM, and governance reviews of 21 countries had been completed. In January 2017, the AU welcomed the commit-ment of the APRM on its repositioning to play a monitoring and evaluation role for Agenda 2063 and the 2030 Agenda for Sustainable Development (United Nations, 2018b).
Another structure worth mentioning is the NEPAD agency. This is the technical arm of the African Union that works in coordination with other structures of the AU and with regional economic communities to support African coun-tries in planning, implementing, monitoring and evaluating the 10-year plan 2014-2023 for agenda 2063. It is impor-tant to note that two projects of high priority to achieving
Agenda 2063 were recently launched: the Single African Air Transport Market, launched in January 2018, and the Afri-can Common Free Trade Agreement (CFTA), signed in March 2018. According to the United Nations Economic Commis-sion for Africa, it is expected that the value of intra-African trade will more than double as a result of the CFTA (African Union, UNECA, & African Development Bank, 2017). There are also other SDG regional review mechanisms in place, such as the UN system that has supported the development of a joint SDGs-A2063 results framework, the annual Africa SDGs report prepared by AUC, ECA, AfDB and UNDP jointly, and the Africa Regional Forum on Sustainable Development.
Agenda 2030 recognizes and encourages regional reviews – indeed, they have contributed to the integration of SDGs into Agenda 2063, and helped to develop key regional strategies for sustainable development. However, they are considered a complementary process that fosters mutual learning and encourages exchange of best practice and transboundary cooperation through shared challenges. The voluntary nature of membership and participation and lack of accountability for not honoring mutually-agreed respon-sibilities impacts the effectiveness of such regional mecha-nisms. In most cases, the scope of membership is limited to coordination of stakeholders, dialogues and reviews of reports. There is no strong institutional basis for decision-making that influences policy change, follow up and rein-forcement (Civil Society Reflection Group, 2018).
AT THE NATIONAL LEVEL
As signatories of the SDG Accord, governments hold the primary responsibility for ensuring their countries imple-ment the SDGs. Their responsibilities include: aligning SDGs with national priorities; defining institutional mechanisms to coordinate and engage the activities of diverse stake-holders; enhancing cross-sectoral action and accountability; integrating SDGs into budgets and financing, and strength-ening the use of data to monitor and report on progress. Countries are expected to conduct Voluntary National Re-views of SDG progress and present them to the HLPF. De-spite promising initiatives in many parts of the world, most governments have failed to turn the transformational vi-

89AFRICA 2030 SUSTAINABLE DEVELOPMENT GOALS THREE-YEAR REALITY CHECK
sion of the 2030 agenda into real policies. Worse, policies in a growing number of countries are moving them in the opposite direction, for example disagreements over climate change financing and equitable multilateral trading sys-tems. The implementation of the 2030 Agenda and SDGs must be declared a top priority by heads of government and should be considered the overarching framework for all policies. It should not be taken as just one strategy amongst many (Civil Society Reflection Group, 2018).
While primary responsibility for achieving SDGs rests with individual countries, regional and international support and partnerships are critical, especially for the poorest countries and for those facing special challenges due to their circum-stances and geographic location. In the MDG era, large, rapidly growing economies drove development advances. The world met the poverty MDG despite the fact that many of the poorest countries made little to no progress. Success in meeting the SDGs, in contrast, depends on what happens in the poorest countries.
At the international level, governments, private companies, civil society organizations, multilateral institutions and oth-er parties are bound to deliver on their SDG commitments by moral authority alone. At the national level, stakehold-ers are bound by their constitution and national laws, but SDGs may not be well integrated into these frameworks, and some SDGs are global in nature and require consistent international coordination. It is not enough to demand in-clusiveness and to involve many parties in debates. Rather, responsibilities must be spelled out clearly and apply to dif-ferent partners in different ways. (Begashaw, 2017)
GOVERNANCE AND SDG 17
Governance is enshrined in SDG 17, which aims to “strength-en the means of implementation and revitalize the Global Partnership for Sustainable Development”. This is the goal with the largest number of targets (19), and while it is the last one, it provides the foundations for the institutional ar-chitecture needed for this global agenda to succeed. SDG 17 shows that a colossal global commitment is required for the goals to be achieved by 2030. Efforts required range
from resource mobilization to technology transfer and global trade order regulation by every nation regardless of their wealth. The commitment to a Global Partnership refers to all nations – but SDG 17’s targets on multi-stakeholder partnerships do not seem to make a priority of the level of effort expected of reporting countries. We categorized the type and direction of the required efforts relating to each of the SDG 17 targets into five categories – Global, Domestic, North-South, South-North and South-South – in order to analyze the nature of the so-called Global Partnership (See Figure 2.1 and Table 2.1). Figure 2.1 SDG Target by type of effort
Source: SDGC/A calculations based on SDG targets found on https://unstats.un.org/sdgs/indicators/indicators-list/
Figure 2.1 shows that nearly half of the targets are North-South in nature, meaning the direction of the effort is ex-pected to be from developed nations to developing ones. For example, “Adopt and implement investment promotion regimes for least developed countries”, and “Promote the development, transfer, dissemination and diffusion of envi-ronmentally sound technologies to developing countries”. 37% of the targets are global, meaning that they involve effort from every nation. For example, “Promote a universal, rules-based, open, non-discriminatory and equitable multi-lateral trading system under the World Trade Organization”.
NORTH TO SOUTH
47%
DOMESTIC
16%
GLOBAL 37%

SDG SUPPLY-SIDE DYNAMICS90
21. SDGGovernanceFramework
Furthermore, 16% of the targets are related to domestic efforts such as, “Strengthen domestic resource mobiliza-tion, including through international support to developing countries, to improve domestic capacity for tax”. Remark-ably there is no target solely concerning efforts South-South or South-North. From an African perspective, only half (53%) of the targets
Table 2.1 Sources of top 10 investor FDI by North and South 2016
North South Total
197 108 305
Share 65% 35% 100%
Source: SDGC/A’s estimates drawn from World Investment Report 2018, UNCTAD
Source: World Investment Report 2018, UNCTAD
Figure 2.2 Top 10 investors in Africa by FDI stock 2016 (Billions of dollars)
US
UK
FRANCE
CHINA
USA
ITALY
SINGAPORE
INDIA
SWITZERLAND
CHINA, HK
0 10 20 30 40 50 60
57
55
49
40
24
23
17
14
13
13
demand action. This shows that African nations still need support from developed economies to pursue the “leave no one” behind agenda. However, the potential for South-South cooperation is high and starting to manifest. Recently, China pledged to invest US$60 billion in the continent, sur-passing US investment in 2016 ( US$57 billion). Over a third of the total investment by the top ten investors in the conti-nent come from the Global South (see Figure 2.2).
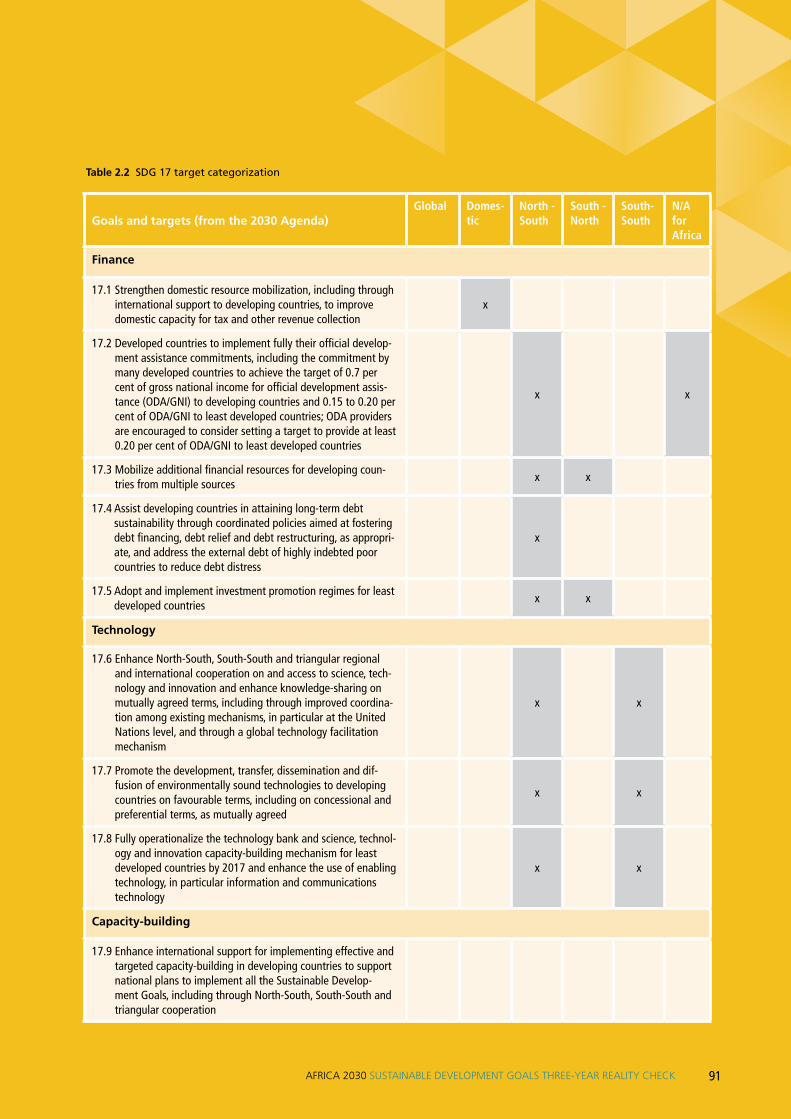
91AFRICA 2030 SUSTAINABLE DEVELOPMENT GOALS THREE-YEAR REALITY CHECK
Goals and targets (from the 2030 Agenda)Global Domes-
ticNorth - South
South - North
South-South
N/A for Africa
Finance
17.1 Strengthen domestic resource mobilization, including through international support to developing countries, to improve domestic capacity for tax and other revenue collection
x
17.2 Developed countries to implement fully their official develop-ment assistance commitments, including the commitment by many developed countries to achieve the target of 0.7 per cent of gross national income for official development assis-tance (ODA/GNI) to developing countries and 0.15 to 0.20 per cent of ODA/GNI to least developed countries; ODA providers are encouraged to consider setting a target to provide at least 0.20 per cent of ODA/GNI to least developed countries
x x
17.3 Mobilize additional financial resources for developing coun-tries from multiple sources
x x
17.4 Assist developing countries in attaining long-term debt sustainability through coordinated policies aimed at fostering debt financing, debt relief and debt restructuring, as appropri-ate, and address the external debt of highly indebted poor countries to reduce debt distress
x
17.5 Adopt and implement investment promotion regimes for least developed countries
x x
Technology
17.6 Enhance North-South, South-South and triangular regional and international cooperation on and access to science, tech-nology and innovation and enhance knowledge-sharing on mutually agreed terms, including through improved coordina-tion among existing mechanisms, in particular at the United Nations level, and through a global technology facilitation mechanism
x x
17.7 Promote the development, transfer, dissemination and dif-fusion of environmentally sound technologies to developing countries on favourable terms, including on concessional and preferential terms, as mutually agreed
x x
17.8 Fully operationalize the technology bank and science, technol-ogy and innovation capacity-building mechanism for least developed countries by 2017 and enhance the use of enabling technology, in particular information and communications technology
x x
Capacity-building
17.9 Enhance international support for implementing effective and targeted capacity-building in developing countries to support national plans to implement all the Sustainable Develop-ment Goals, including through North-South, South-South and triangular cooperation
Table 2.2 SDG 17 target categorization

SDG SUPPLY-SIDE DYNAMICS92
Goals and targets (from the 2030 Agenda)Global Domes-
ticNorth - South
South - North
South-South
N/A for Africa
Trade
17.10 Promote a universal, rules-based, open, non-discriminatory and equitable multilateral trading system under the World Trade Organization, including through the conclusion of negotiations under its Doha Development Agenda
x
17.11 Significantly increase the exports of developing countries, in particular with a view to doubling the least developed countries’ share of global exports by 2020
x
17.12 Realize timely implementation of duty-free and quota-free market access on a lasting basis for all least developed countries, consistent with World Trade Organization deci-sions, including by ensuring that preferential rules of origin applicable to imports from least developed countries are transparent and simple, and contribute to facilitating market access
x
Systemic issues
Policy and institutional coherence
17.13 Enhance global macroeconomic stability, including through policy coordination and policy coherence
x
17.14 Enhance policy coherence for sustainable development x
17.15 Respect each country’s policy space and leadership to establish and implement policies for poverty eradication and sustainable development
x
Multi-stakeholder partnerships
17.16 Enhance the Global Partnership for Sustainable Develop-ment, complemented by multi-stakeholder partnerships that mobilize and share knowledge, expertise, technology and financial resources, to support the achievement of the Sustainable Development Goals in all countries, in particular developing countries
x
17.17 Encourage and promote effective public, public-private and civil society partnerships, building on the experience and resourcing strategies of partnerships
x
Data, monitoring and accountability
17.18 By 2020, enhance capacity-building support to developing countries, including for least developed countries and small island developing states, to increase significantly the avail-ability of high-quality, timely and reliable data disaggregated by income, gender, age, race, ethnicity, migratory status, dis-ability, geographic location and other characteristics relevant in national contexts
x
17.19 By 2030, build on existing initiatives to develop mea-surements of progress on sustainable development that complement gross domestic product, and support statistical capacity-building in developing countries
x

93AFRICA 2030 SUSTAINABLE DEVELOPMENT GOALS THREE-YEAR REALITY CHECK
Developed nations still carry the overarching moral re-sponsibility to support less-developed nations, but ac-knowledgement of the need for structural change for the SDGs to be achieved will be domestic, not foreign. In the Common Africa Position on the Post 2014 Development Agenda (CAP), African heads of state strongly affirmed that the biggest issues that Africa faces are structural in nature, hence they committed to fight corruption domes-tically; minimize illicit flows and brain and capital drain; strengthen tax structures; deepen capital markets; establish long-term pension schemes, and ensure proper governance and management of their natural resources. Notwithstand-ing, domestic policies need complementary external efforts to address the other side of the coin – where illicit flows land, where the skilled diaspora stays, and in the financial capitals of the world where African assets are transacted and multinational corporations extract resources illegally.
GAPS BETWEEN COMMITMENTS AND REALITY
The finance framework for implementing SDGs, AAAA, calls for collective efforts and coordinated mechanisms for actors from local and central government and private and philan-thropic organizations to mobilize the domestic and external resources required to implement the SDGs. However, re-ports indicate that the financing picture looks discouraging; among other things, external finance has been declining, largely due to the decline of private financing and poor co-ordination (OECD 2019). More specifically, key challenges include: weak transparency mechanisms for measuring the financial flows and impact on sustainable development; lack of clear mapping of the different actors’ respective roles, resources, types of instruments etc.; weak coordina-tion mechanisms of various actors, including donors, with clear roles and responsibilities to provide maximum impact and coherent support while avoiding duplication of efforts, and other challenges relating to the many paradoxes and inconsistencies between SDG finance and policy globally (OECD, 2018).
Substantial resources are needed to achieve the SDGs by the 2030 deadline. However, it has not been clearly spelled out where they will come from. Even where commitments were made, there is little progress in fulfilling them. Glob-ally, the financial commitments made have not been fully realized and the financing gap remains large. The details are included in this report’s section on the financing of SDGs. The significant funding gap is not due to a shortfall in finan-cial resources – almost US$300 trillion is being managed by the global financial system, held in the form of devel-oped assets by developed countries that offer low returns (United Nations, 2018d). Furthermore, it has been reported that in recent years there has been massive growth and ac-cumulation of individual wealth worldwide (Spotlight on Sustainable Development, 2018). Recent research on Africa indicates that a small fraction of the excess global savings and low yield resources would be enough to plug Africa’s financing gap and finance productive and profitable infra-structure (African Development Bank, 2018).
The implications of a weak SDG governance framework in relation to mobilizing adequate long-term financing needs for implementing SDGs, has been significant. With regard to transparent financing, key limitations relate to gaps in providing appropriate indictors, tools and consolidated evidence of the investments and financial flows for SDGs. These need to be categorized by instruments and sectors, including those considered to have a high impact on pov-erty alleviation, which is a basis to track performance and improve the positioning of SDG financing. (AU et al., 2018; United Nations, 2018a, 2018c). Research findings show that provision of long-term financing in the past three years of SDGs has been inadequate (OECD, 2018; United Nations, 2018c).
21. SDGGovernanceFramework

SDG SUPPLY-SIDE DYNAMICS94
21. SDGGovernanceFramework
The last three years of implementation saw insufficient and too slow progress in attracting and directing public and private investments to areas that support the SDGs. Most African countries are still falling far behind in financ-ing SDG investments – both from public sources (including Domestic Generated Revenue [DGR] as the main source of financing SDGs) and private sources. Most of the limited DGR – 20% Sub-Saharan countries have a DGR/GDP ratio of below 15% – is used for international debt repayment, as 50% of the countries have a debt to GDP ratio of over 50% (International Monetary Fund, 2018a; United Nations, 2017, 2018c). International financial support for domestic revenue generation efforts remain limited (OECD, 2018).
Another important global issue worth discussion is the materialization of the Paris Agreement, which aims to cre-ate and ensure a healthier planet for future generations. Three years after the adoption of the agreement, progress has been slower than expected, meaning action has been insufficient to limit global warming to below 2°C. Recent research indicates that global emissions have been going up rather than going down, further exposing the world to extreme climate hazards that are becoming ever more evi-dent (Burck, Hagen, Marten, Höhne, & Bals, 2018).
Though developed countries made a commitment of US$100 billion per year in climate finance by 2020 for cli-mate action in developing countries, progress made so far is well below the target. Oxfam’s Climate Finance Shadow Re-port 2018 indicates that least developed countries received only US$9bn in annual public climate finance in 2015-2016, just 18% of the total (Carty & Le Comte, 2018). Growth in climate finance has been slow compared to the target
and research findings indicate that the increase in climate finances appears to be largely due to increases in loans – particularly to middle-income countries. Reports indicate that loans constituted two-thirds of public climate finance in 2015-2016 and only an estimated US$11–US$13bn (which constitutes just 23-27% of the total) was given as grants per year. The least developed countries, including those in Africa, continue to be neglected, lacking adequate funding for adaptation to climate change. Due to the huge disparity between the resources required by African nations and the increasing risks driven by climate change, millions will continue to be devastated by the effects of climate change, including drought and flooding. Given the potential for severe and irreversible changes, it will be very difficult if not impossible to achieve the SDGs if the trend continues (Carty & Le Comte, 2018).
The key challenges of the Paris Agreement include: the negative impact of mechanisms set to regulate greenhouse emissions (which is left to each country) impacting the ef-fectiveness of the agreement and cooperation to respond to global climate change; climate change transparency and lack of clarity around international support; lack of robust modalities for accounting for climate finance, and the time it is taking to agree on a “rulebook”, an operating manual due to be finalized at the COP25 2019 UN Climate Change Conference in Chile (following the failure to agree on rules for voluntary market mechanisms) (UNFCCC, 2019). If this trend is not reversed with urgency, climate change-related environmental disruptions could displace up to 200 million people by 2050, which will send shockwaves around the world (Carty & Le Comte, 2018; United Nations, 2018c).

95
2.2 Financing for SDGs

96
22. Financingfor SDGs
SDG SUPPLY-SIDE DYNAMICS
2.2 FINANCING FOR SDGS
Like many developing nations, Africa is at a cross roads. It is caught between a narrowing fiscal space due to growing public debt – 4 in 10 African countries are at high risk of debt stress or debt – and an ambitious development agen-da, due to be delivered in the next 12 years (World Bank, 2018b). The AAAA identifies multiple financing modalities covering public and private finance, private investment, and blended financing. It emphasizes the need for integrated national financing frameworks, with domestic revenue fi-nancing identified as the primary engine for sustainable de-velopment and a measure of national ownership. Additional resources for SDG implementation are mobilized through the South-South cooperation, the private sector, and de-velopment partners. The financial needs of the SDGs are considered unachievable – the investment gap for Africa is in the range of USD200 billion to USD1.2 trillion annually (Begashaw & Shah, 2017).
IMF estimates the incremental spending needs for achiev-ing the SDGs in selected areas (education, health, electric-ity, water and sanitation) to be 14% of GDP for low-income countries. Sub-Saharan Africa respective cost estimates are 0.4% of World GDP annually – which is approximately USD 420 at current GDP prices (Gaspar, Amaglobeli, Garcia-Es-cribano, Prady, & Soto, 2019). Arguably, the wide ranging estimates for the whole of Africa are above USD 500bn an-nually – consistent with Schmidt-Traub 2015 that estimated US$614–$638 billion. This means the financing gap is ap-proximated at 25-30% of the current Africa GDP annually (IMF 2018c).
Costs are varied and wide-ranging, and it remains impera-tive to carry out a holistic costing exercise of the needs for the remaining period. AAAA identifies national develop-ment priorities as the driver for achieving the SDGs by 2030 and, as such, international stakeholders should: align their support to national priorities and fully adhere to the Busan Partnership for Effective Development Cooperation’s prin-ciples of ownership; focus on results; partner for develop-ment, and promote transparency and shared responsibility.
While the SDGs were adopted at a time of slow growth and sizeable medium-term risks, the global economic upswing that began in 2016 has strengthened. In 2017, growth re-covered across the board, from least-developed countries to advanced economies and the eurozone. In line with the his-torical trend since 2010, growth in emerging markets and developing economies remains above the global average. The financial recovery has implications for global financial and domestic conditions, including domestic revenue.
Efficient and effective domestic revenue generation is iden-tified as the most critical conduit for sustainable develop-ment. Domestic revenue is considered the primary engine of the AAAA, fundamental in any nation and a measure of institutional capacity (Gaspar, Jaramillo, & Wingender, 2016). African countries have demonstrated progress in revenue collection over the years. The ratio of median rev-enue to GDP has increased from 20.7% in 2016 to 21.3% in 2017, while the average grew by 0.9 percentage points (See Figure 2.3 on page 102). The latter is attributed to
500 billion to
1.2 trillion
ANUAL INVESTMENT
GAP FOR AFRICA OF
US $

97AFRICA 2030 SUSTAINABLE DEVELOPMENT GOALS THREE-YEAR REALITY CHECK
recovery in commodity prices (including oil); half (22 of 45) of sub-Saharan African countries are resource intensive (including ten oil exporters). The average revenue to GDP for oil-exporting countries in Africa for 2010-2016 was nine percentage points higher than in non-oil exporters. One in five African countries still had a revenue to GDP ratio of less than 15% in 2017 and a tax to GDP ratio of less than 13%, the minimum threshold for financing the basic needs of a state, all factors constant (Gaspar et al., 2016).
In the long-term, the median total revenue and tax revenue for sub-Saharan Africa (15% and 18% respectively in 2016) has increased by only four percentage points since the mid-1990s (International Monetary Fund, 2018a). However, the tax gap is estimated to narrow over the medium term by 3-5 percentage points, through a combination of efficiency and administrative and policy reform, including but not lim-ited to the removal or reduction of tax exemptions, control of corruption, and improvement of the overall institutional and governance framework. Comprehensive information and transparency on tax expenditures continues to be lack-ing. Growing evidence suggests that countries with low economic and institutional development are associated with low tax efforts (Fenochietto & Pessino, 2013).
The tax structure for African economies is dominated by indirect taxes – particularly Value Added Tax, which ac-counts for about a third of tax revenue. This is corrobo-rated by the African Tax Outlook, which analyzed 26 Af-rican countries (African Tax Administration Forum, 2018).
However, VAT efficiency (measuring the actual VAT collec-tions as a share of the potential tax base) compares unfa-vorably to other emerging markets, low-income countries and advanced economies. Overall, taxes on goods and services predominate. Direct taxes also have increased in the recent past, notably Personal Income Tax (PIT) and Cor-porate Income Tax (CIT), despite the respective tax rates reducing over the 2000-2016 period. However, both CIT and PIT exhibit lower productivity in Africa compared with emerging markets and advanced economies. The other tax brackets, excise and property, also continue to perform poorly relative to others. In Africa, property taxation re-mains limited. In most African countries, property tax con-tributes less than 0.4% of GDP compared to more than 2% in OECD (Franzsen & McCluskey, 2017). Untapped potential is estimated at between 0.5% and 1% (Norregaard, 2013). International financing for capacity development and tax reform remains limited, with ODA to domestic revenue mo-bilization remaining below 0.3% of ODA (OECD, 2018).
Far-reaching challenges prevail, but lessons from historical reforms indicate that realizing potential tax is feasible with well-defined medium-term revenue strategies. Such strate-gies remain the primary mechanism for bolstering sustain-able revenue collection in African economies. Implementa-tion also matters – if it is not implemented, great strategy remains a zero-sum undertaking.
98
22. Financingfor SDGs
SDG SUPPLY-SIDE DYNAMICS
AAAA also underlines a commitment to redouble efforts to reduce illicit financial flows. Further to the report of the High Level Panel on Illicit Financial Flows (IFFs) from Africa, regional reports were envisaged, as well as the regular pub-lication of illicit flows’ composition and size. While holistic data on IFFs is lacking, they remain significant – and ac-count for more than each of the other main financial flows into Africa (ODA, remittances and FDI). The main conduit of illicit flows is trade invoicing. It is estimated on a net ba-sis between Africa and the world to have averaged slightly over US$70 billion – about 4% of GDP (Economic Commis-sion for Africa, 2018). The losses through other channels are also estimated to be sizable – about US$27 billion during the decade to 2015 (Salomon & Spanjers, 2017). Existing evidence suggests that progress is incremental, with the establishment of laws, policies and agreements for combat-ing illicit flows. However, coordination remains a challenge, as is implementation. Some countries continue to accept the banking of illicit flows, and several conduits of trans-fer still exist, ranging from trade invoicing to stolen natural resources. Financial secrecy jurisdictions, which protect the perpetrators, remain a key issue and international prosecu-tion can take in excess of 10 years. The return of stolen assets has not yet gained effective traction. Weak money laundering controls persist and overall significant response gaps prevail. Notable progress has been made, with only four African countries (Botswana, Ethiopia, Ghana and Tu-nisia) remaining on the Financial Action Task Force’s list of high-risk and other monitored jurisdictions (Financial Action Task Force, 2019).
National Development Banks are an integral component of the AAAA and expected to leverage nations out of market failure. The framework encourages both international and domestic development banks to promote finance for micro- small- and medium-sized enterprises, including long-term finance for infrastructural development (including energy infrastructure) and industrial transformation through credit lines that target those enterprises and technical assistance (United Nations, 2015). NDBs4, which play a decisive role in costing, coordinating, resource mobilization, capital provi-sioning and the provision of long-term financing to key stra-tegic sectors, foster economic and social transformation in Africa and progress towards the SDGs (Shah, 2016). NDBs can play an active role in mobilizing public and private sec-tor resources to support investments in different sectors of the economy (including agriculture, energy, housing, tour-ism, health, education and other priority sectors) that accel-erate achievement of SDGs in Africa (United Nations, 2017). NDBs play a catalytic role by overcoming the structural de-ficiencies of skewed financial flows and resource allocation (World Bank, 2018a).
4 In this report the term National Development Bank (NDB) is used – this also covers National Development Finance Institu-tions (DFIs), specialized financial institutions established to provide long-term finance to priority sectors of the economy as identified in national development strategies.
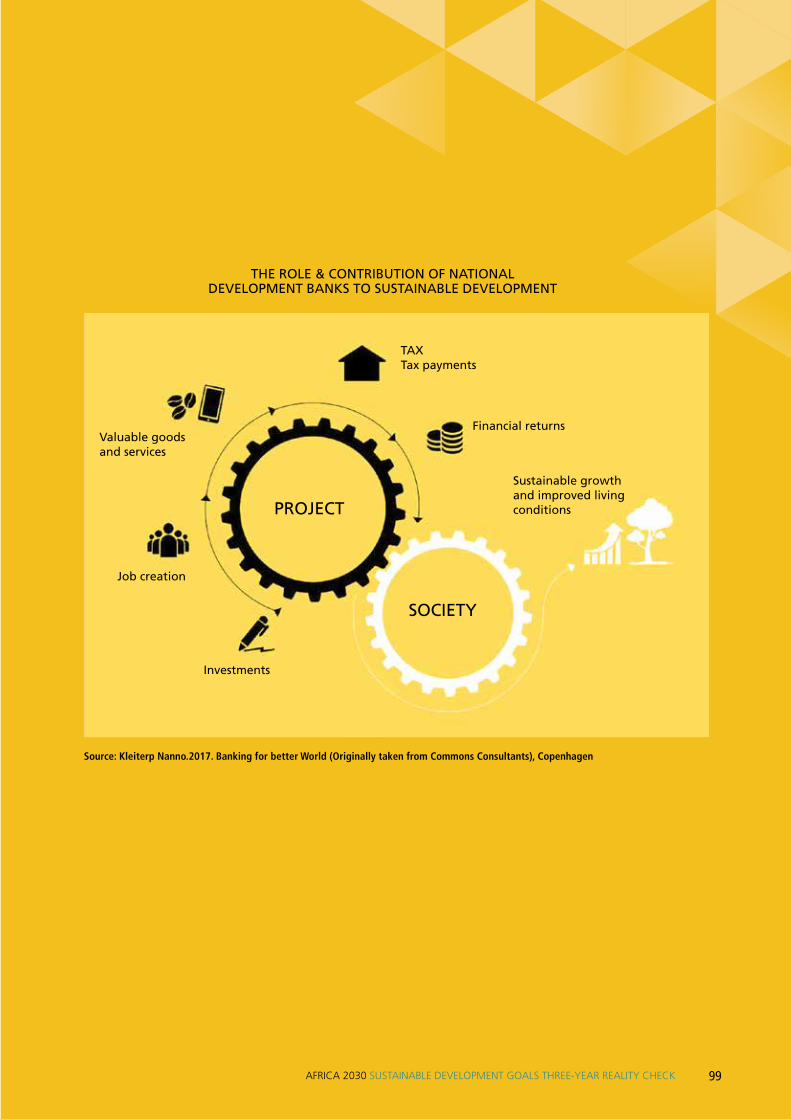
99AFRICA 2030 SUSTAINABLE DEVELOPMENT GOALS THREE-YEAR REALITY CHECK
THE ROLE & CONTRIBUTION OF NATIONAL DEVELOPMENT BANKS TO SUSTAINABLE DEVELOPMENT
Valuable goodsand services
Job creation
Investments
Financial returns
TAXTax payments
Sustainable growth and improved living conditions
SOCIETY
PROJECT
Source: Kleiterp Nanno.2017. Banking for better World (Originally taken from Commons Consultants), Copenhagen
100
22. Financingfor SDGs
SDG SUPPLY-SIDE DYNAMICS
The experience of countries including Brazil, the Republic of Korea, India and China substantiates the indispensable role of NDBs in sustainable development. The NDBs of these countries – the BNDES, KDB, IDBI and CDB, respectively – played a major role in igniting the creation of industries and implementing development strategies when they were experiencing industrial take-off (Musacchio, Lazzarini, Mak-houl, & Simmons, 2017; UNCTAD, 2016). Some of the fac-tors that contributed to the successful role of these NDBs include: a well-articulated developmental mandate, govern-ment support, and a diverse funding base (including debt and equity issuance, resources from other financial institu-tions and government transfers) (Musacchio et al., 2017; UNCTAD, 2016).
The need for strong and healthy independent NDBs is sub-stantiated by the existing market failure, including shortages of long-term funding and funding for high-risk development sectors and poorer regions. Moreover, NDBs understand the domestic environment and play a major role in building the capacity of public and private sector institutions to conceive and introduce innovative SDG-aligned investment projects that promote economic and social transformation through public-private partnerships and innovative funding mecha-nisms such as blended finance (Kleiterp, 2017).
However, in spite of their significance in serving the devel-opment finance needs of a country, very little is known by NDBs about specific financing needs for the SDGs. Many NDBs in Africa are not in a position to take on this task under their current organizational and policy conditions (Jones, 2013). Although Africa has more NDBs than any other continent bar Latin America (more than 140 NDBs in total, of which 61 are active members of AADFI), these banks have not received adequate attention in the local and global development agenda and most of them are not yet up to the task of delivering on their mandate (Jones, 2013). The scant information available about NDBs highlights the following key challenges: inadequate capitalization, weak governance, vulnerability to undue political influence, weak institutional capacity, risk management and lack of an ap-propriate monitoring and evaluation framework to assess the economic and social impact of their investment (Jones, 2013; World Bank, 2018a).
The size of most NDBs in Africa is small compared to the size of the economy in their respective countries. Being poorly capitalized limits their ability to finance large infrastructure and exposes them to shocks and stresses. Where known, the total assets to GDP ratio of NDBs in Africa ranges from between 0.3% to 2.8%, compared to other regions where it ranges from 15% to 17%. A summary of the total assets to GDP ratios of selected NDBs in Africa and other regions is shown in the Table 2.3.

101AFRICA 2030 SUSTAINABLE DEVELOPMENT GOALS THREE-YEAR REALITY CHECK
majority of NDBs in Africa face include: weak environmen-tal and social management systems; weak credit appraisal practices and delinquency management, and a lack of li-quidity management guided by liquidity policy and imple-mented with regular oversight by an asset liability commit-tee (Jones, 2013).
With regard to monitoring and evaluation, most NDBs do not have a specific framework or the capacity to assess per-formance that differs from for-profit financial institutions. While performance assessment should focus on develop-ment and economic impact (amongst other things), many DFI assessments focus on financial conditions, including their disbursement ratios, efficiency, soundness and profit-ability, which is the same as private financial institutions (World Bank, 2018a). The 2017 World Bank global survey on NDBs indicates that NDBs face challenges and that many need to strengthen and reform their development man-dates, strengthen risk management capacity, and adopt better monitoring and evaluation frameworks to assess their economic impact.
Table 2.3 Share of total assets to GDP of selected National Development Banks in Millions US$
No Name of Bank ShareCapital
TotalAssets
Total As-set/GDP
1 China Development Bank (CDB) 111,156 1,685,954 16.3%
2 Korea Development Bank (KDB) 27,018 251,710 17.8%
3 German Development Bank (KfW) 26,225 593,817 15.4%
4 Brazil Development Bank (BNDES) 11,572 330,253 14.1%
5 Development Bank of South Africa (DBSA) 820.16 5,769.12 1.7%
6 Development Bank of Ethiopia (DBE) 272.7 1,799 2.2%
7 Uganda Development Bank (UDB) 26 79 0.31%
Source: CDB, KDB, KfW, (Musacchio et al., 2017) DBS 2017, DBE 2016 & UDB 2017, compiled from audited financial statements
In relation to regulation, significant numbers (45%) of NDBs in Africa are not regulated or supervised by the Cen-tral Bank or any other financial sector regulatory body, and only 55% have an explicit performance agreement with the government. A majority (70%) has no performance-based incentive system for their management (Jones, 2013). With regard to governance, in 58% of NDBs the power to appoint or remove CEOs is retained by the government; government representatives dominate at board meetings and the par-ticipation of “independent” board members is limited or nonexistent (Jones, 2013; World Bank, 2018a). In only 58% of African NDBs do the directors meet the eligibility criteria in terms of professional and technical background (Jones, 2013).
Strengthening risk management capacity is one of the greatest challenges and priorities for NDBs, given the na-ture of their activities and the fact that their clients include those that private financial institutions consider too risky (World Bank, 2018a). Specific risk management gaps that a

102
22. Financingfor SDGs
SDG SUPPLY-SIDE DYNAMICS
Figure 2.3 Domestic revenue to GDP
Source: World Economic Outlook 2018
Globally, only five OECD and DAC members are meet-ing their ODA commitments of 0.7% of GNI – see Figure 2.4. Average ODA for the 28 DAC member states was only 0.31% of GNI in 2017.
Figure 2.4 ODA as share of GNI
Source: OECD 2018, DAC statistics
Hung
ary
Slov
ak R
epub
lic
Pola
nd
Kore
a
Gre
ece
Slov
ania
Portu
gal
Spai
n
Aust
ralia
Japa
n
New
Zea
land
Cana
da
Icel
and
Italy
Irela
nd
Aust
ria
DAC
Finl
and
Fran
ce
Belg
ium
Switz
erla
nd
Net
herla
nds
Ger
man
y
Unite
d Ki
ng-
dom
Denm
ark
Nor
way
Luxe
mbu
rg
Swed
en
1,2
1
0,8
0,6
0,4
0,2
0
ODA % of GNI (2017) UN TARGET
Som
alia
Nig
eria
Suda
nDR
CCA
RBu
rund
iCh
adEr
itrea
Ethi
opia
Cam
eroo
nM
adag
asca
rSi
erra
Leo
neUg
anda
Tanz
ania
Ango
laG
uine
aG
uine
a-Bi
ssau
Gab
onG
hana
Zam
bia
Beni
nKe
nya
Cote
d’Iv
oire
Equa
toria
l Gui
nea
Mal
iTo
goN
iger
Egyp
tBu
rkin
a Fa
soZi
mba
bwe
Rwan
daRe
p of
Con
goM
aurit
ius
Sene
gal
Tune
siaM
alaw
iM
oroc
coSw
azila
ndM
ozam
biqu
eM
aurit
ania
Com
oros
Cabo
Ver
deSo
uth
Afric
aAl
geria
Gam
bia
Libe
riaSa
o To
me
and
Prin
Bots
wan
aDj
ibou
tiN
amib
iaLe
soth
oSo
uth
Suda
nSe
yche
lles
Liby
a
504540353025201510
50
2017 2016
Below 15 %

103AFRICA 2030 SUSTAINABLE DEVELOPMENT GOALS THREE-YEAR REALITY CHECK
The net ODA to Africa over the long term has been increas-ing but the annual growth rate has slowed compared with the historical average. Net ODA grew by an average of 1% per annum over the 2010-2016 period, compared with 9% during 2001-2009 (see Figure 2.5). Overall, there has been a declining trend, with some countries back-tracking on their commitments and disbursements stagnating over the years (United Nations, 2018a).
Figure 2.5 Net ODA to Africa, constant 2015 prices 2000-2016
Source: OECD/DAC data
Over the long term 2000-2017, foreign aid to SSA account-ed for about 3.4% of GDP. More recently, ODA has faced downside risks. Debt in developed economies (including OECD nations) has risen to over 100% of GDP since 2011, with a heightened debt service burden. Post-debt crisis growth in the eurozone has remained below par, as has the global economic recovery. Tight global conditions have boosted nationalistic political agendas despite the distinctly global nature of the threats (OECD, 2018).
Multilateral development bank financing continues to rise, in line with the commitments of the AAAA. Development banks have also increased the non-grant subsidized financ-ing to low-income countries. However, the data on Africa is incomplete and scattered. Blended finance and South-South cooperation have gained traction over the SDG period but data remains scanty. The AAAA defined blended finance as concessional public finance coupled with non-concessional private finance and expertise. In practice, it entails a mix of several instruments including guarantees, syndicated
2000
2001
2002
2003
2004
2005
2006
2007
2008
2009
2010
2011
2012
2013
2014
2015
2016
Net ODA to Africa (USD Billion) % growth
USD
Mill
ion
25 %
20
15
10
5
0
-5
-10
-15
-20
50
45
40
35
30
25
20

104
22. Financingfor SDGs
SDG SUPPLY-SIDE DYNAMICS
loans, credit lines, direct investments, and collective share investments. Globally, the use of blended finance rose dur-ing 2012-2015 but it still accounts for a small share (OECD, 2018). Blended finance from multilateral development banks and NDBs leverages low levels of private finance in low-income countries5, US$1 for US$0.37 of private finance, which is less than half what it leverages in other developing countries on average (Attridge & Engen, 2019).
While South-South and triangular cooperation is given prominence, data remains limited and is presented in a non-holistic manner (UNDP, 2017). Globally, South-South cooperation is estimated to have increased to over US$20 billion, with new multilateral financial institutions such as the New Development Bank (NDB) and the Asian Infrastruc-ture Investment Bank (AIIB) becoming operational in 2016. China is Africa’s largest investor among the South-South partners, accounting for over two-thirds of flows into Africa (UNDP, 2017). South-South cooperation leverages regional economic cooperation to consolidate cohesive African un-dertakings for a lasting development impact. Africa has eight regional economic blocs: the Arab Maghreb Union (UMA); the Common Market for Eastern and Southern Af-rica (COMESA); the Community of Sahel–Saharan States (CEN–SAD); the East African Community (EAC): the Eco-nomic Community of Central African States (ECCAS); the Economic Community of West African States (ECOWAS); the Intergovernmental Authority on Development (IGAD), and the Southern African Development Community (SADC). Only two of these, COMESA and IGAD, have been involved in south-south and triangular cooperation. Regional Eco-nomic Communities (RECs) are also constrained on many fronts, inter alia, capacity weakness, financing, implementa-tion challenges and overlapping memberships in respective RECs. Africa has become a key destination for triangular cooperation, with the third largest number of projects after Latin America and the Caribbean, but the amount of coop-eration is still small.
5 According to the World Bank classification, 37 African coun-tries are LICs
The AAAA also considers private sector initiatives to be cen-tral to solving sustainable development challenges. More than a third of financing for SDGs is expected to come from the private sector. However, private sector financing for de-velopment in Africa remains low. For example, private sec-tor financing for infrastructure represents 4% of the fund-ing portfolio (African Development Bank Group, 2018). The private sector’s new commitments for African infrastructure projects in 2015 totaled US$7.4 billion – just 8.9% of the total funding mix (ICA, 2018). The use of Public Private Partnerships (PPPs) has declined in the last couples of years; there are fewer PPP projects by number in African countries than in other developing na-tions. However, Africa had the largest amount of PPP proj-ects by share of GDP – est. 1.4% of GDP in 2000-2016. The share of PPP projects that are challenged or marred by capacity and implementation problems is estimated at 0.75% of GDP – or about 50% of the projects (International Monetary Fund, 2016). This is attributed to weak laws, in-stitutions, and regulatory environments, and the associated capacity to negotiate decent contracts (African Develop-ment Bank Group, 2018).
Total investment (including private) has been on a down-ward spiral since 2015, falling to under US$500 billion. In part, this reflects the drop in gross savings as a share of GDP, from 18% in 2010 for Africa to 16% in 2017 (Interna-tional Monetary Fund, 2018a). The savings investment gap is largely financed by Foreign Direct Investment (FDI). Addi-tionally, in the long run, the widespread limitations of finan-cial development constrains domestic investment. African financial markets, financial institutions and financial depth (domestic private sector credit to GDP) all remain weak compared to other developing regions (International Mon-etary Fund, 2016). The median ratio of private sector credit to GDP in sub-Saharan Africa stood at 21%, comparing un-favorably with 40% in the rest of the developing world. The banking sector assets to GDP ratio is also less than half that of other developing regions. Additionally, financial access
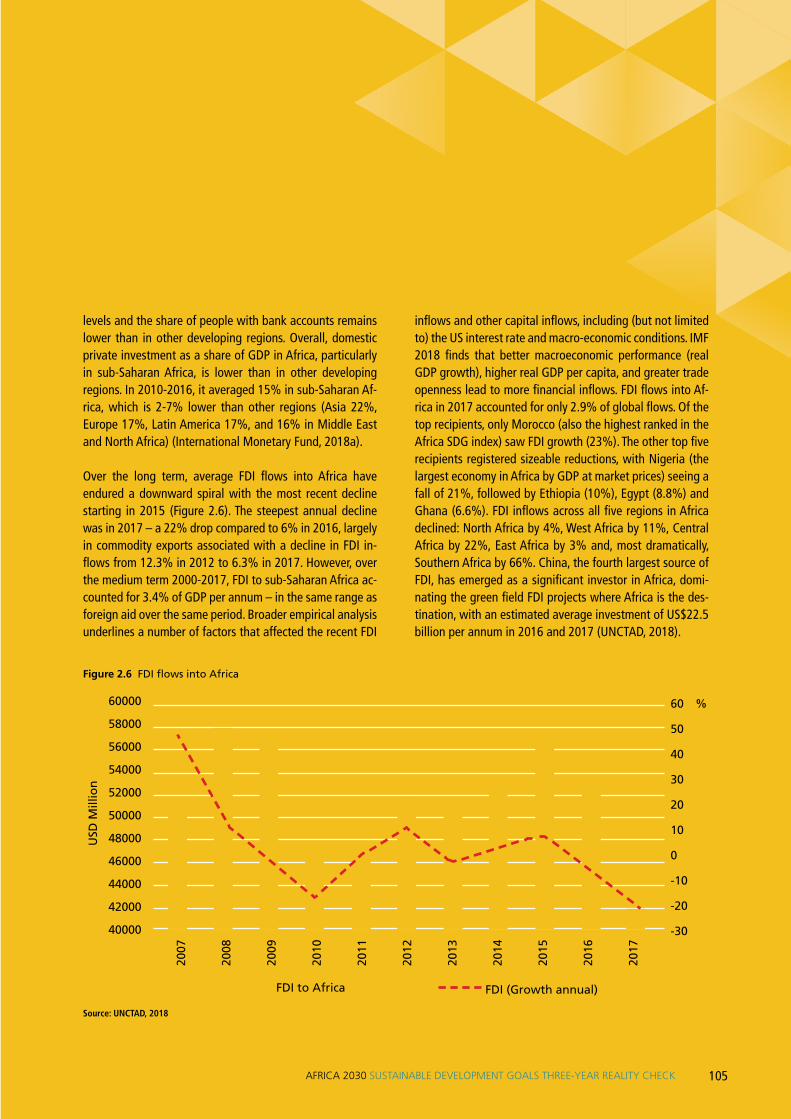
105AFRICA 2030 SUSTAINABLE DEVELOPMENT GOALS THREE-YEAR REALITY CHECK
levels and the share of people with bank accounts remains lower than in other developing regions. Overall, domestic private investment as a share of GDP in Africa, particularly in sub-Saharan Africa, is lower than in other developing regions. In 2010-2016, it averaged 15% in sub-Saharan Af-rica, which is 2-7% lower than other regions (Asia 22%, Europe 17%, Latin America 17%, and 16% in Middle East and North Africa) (International Monetary Fund, 2018a).
Over the long term, average FDI flows into Africa have endured a downward spiral with the most recent decline starting in 2015 (Figure 2.6). The steepest annual decline was in 2017 – a 22% drop compared to 6% in 2016, largely in commodity exports associated with a decline in FDI in-flows from 12.3% in 2012 to 6.3% in 2017. However, over the medium term 2000-2017, FDI to sub-Saharan Africa ac-counted for 3.4% of GDP per annum – in the same range as foreign aid over the same period. Broader empirical analysis underlines a number of factors that affected the recent FDI
inflows and other capital inflows, including (but not limited to) the US interest rate and macro-economic conditions. IMF 2018 finds that better macroeconomic performance (real GDP growth), higher real GDP per capita, and greater trade openness lead to more financial inflows. FDI flows into Af-rica in 2017 accounted for only 2.9% of global flows. Of the top recipients, only Morocco (also the highest ranked in the Africa SDG index) saw FDI growth (23%). The other top five recipients registered sizeable reductions, with Nigeria (the largest economy in Africa by GDP at market prices) seeing a fall of 21%, followed by Ethiopia (10%), Egypt (8.8%) and Ghana (6.6%). FDI inflows across all five regions in Africa declined: North Africa by 4%, West Africa by 11%, Central Africa by 22%, East Africa by 3% and, most dramatically, Southern Africa by 66%. China, the fourth largest source of FDI, has emerged as a significant investor in Africa, domi-nating the green field FDI projects where Africa is the des-tination, with an estimated average investment of US$22.5 billion per annum in 2016 and 2017 (UNCTAD, 2018).
Figure 2.6 FDI flows into Africa
Source: UNCTAD, 2018
2007
2008
2009
2010
2011
2012
2013
2014
2015
2016
2017
FDI to Africa FDI (Growth annual)
USD
Mill
ion
60
50
40
30
20
10
0
-10
-20
-30
60000
58000
56000
54000
52000
50000
48000
46000
44000
42000
40000
%
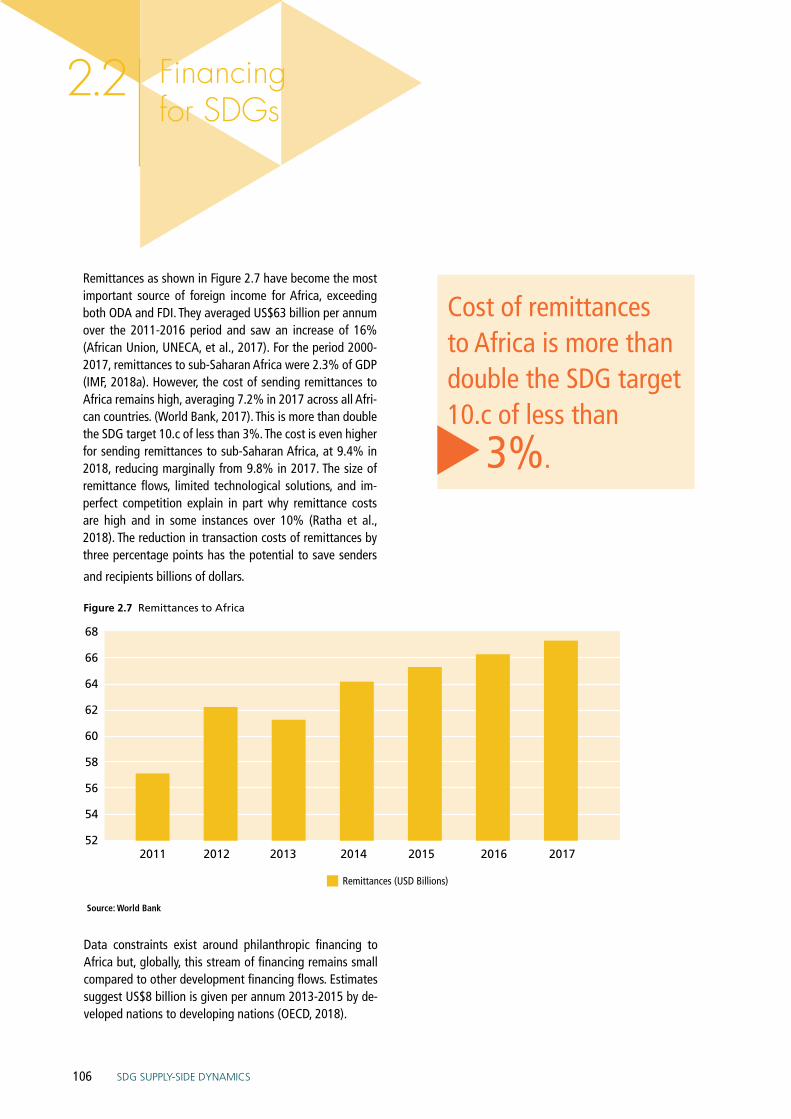
106
22. Financingfor SDGs
SDG SUPPLY-SIDE DYNAMICS
Remittances as shown in Figure 2.7 have become the most important source of foreign income for Africa, exceeding both ODA and FDI. They averaged US$63 billion per annum over the 2011-2016 period and saw an increase of 16% (African Union, UNECA, et al., 2017). For the period 2000-2017, remittances to sub-Saharan Africa were 2.3% of GDP (IMF, 2018a). However, the cost of sending remittances to Africa remains high, averaging 7.2% in 2017 across all Afri-can countries. (World Bank, 2017). This is more than double the SDG target 10.c of less than 3%. The cost is even higher for sending remittances to sub-Saharan Africa, at 9.4% in 2018, reducing marginally from 9.8% in 2017. The size of remittance flows, limited technological solutions, and im-perfect competition explain in part why remittance costs are high and in some instances over 10% (Ratha et al., 2018). The reduction in transaction costs of remittances by three percentage points has the potential to save senders
Source: World Bank
Data constraints exist around philanthropic financing to Africa but, globally, this stream of financing remains small compared to other development financing flows. Estimates suggest US$8 billion is given per annum 2013-2015 by de-veloped nations to developing nations (OECD, 2018).
and recipients billions of dollars.
Figure 2.7 Remittances to Africa
Cost of remittances to Africa is more than double the SDG target 10.c of less than 3%.
2011 2012 2013 2014 2015 2016 2017
Remittances (USD Billions)
68
66
64
62
60
58
56
54
52
03This section gives a snapshot of how SDG implementation can take advantage of synergies between the SDGs. Using Social Network Analysis (SNA) techniques, it explores important links between SDG 7 targets and other SDG targets, focusing on positive interactions and presenting an integrated and contextualised analysis of the interlinkages between the targets of SDG 7 and others.
SDG SYNERGIES AND INTER- ACTIONS
107

108
30. SDG Synergies and Interactions
SDG SYNERGIES AND INTERACTIONS
For many of the targets, efforts to meet one goal may also contribute to several other goals, whereas in other cases, some goals and targets may conflict. Action to meet one target could have unintended consequences on others if they are pursued separately. Research papers – such as ICSU’s A Guide to SDG Interactions: from Science to Imple-mentation – suggest that most goal areas are interlinked, that many targets might contribute to several goals, and that there are important trade-offs between goals and tar-gets (International Council for Science, 2017). By tackling targets in an integrated way, results can be achieved for many targets. In general, the goals are also addressed with-out reference to possible links to other goals. These links will need to be accounted for during implementation and monitoring in order to have a successful outcome.
Africa is projected to see the largest relative increase in the size of its population by 2030. The median projection of 1.68 billion people by 2030 is 42% larger than the 2015 population of 1.2 billion. Africa consumes less than 6% of primary energy compared to 41% for the OECD countries. The 2015 population of 1.2 billion defines Africa’s energy system and has a direct impact on the fundamentals of en-ergy demand. It is clear that energy impacts the economy as well as sustainable development goals (IEA et al., 2018).
More than 640 million Africans have no access to clean and reliable energy – the electricity access rate in Africa is just over 40%, the world’s lowest – and around 780 million rely on traditional solid fuels for cooking. Sub-Saharan Africa could account for 54% of people without electricity globally by 2030. Per capita consumption of energy in sub-Saharan Africa (excluding South Africa) is 180 kWh, compared with 13,000 kWh per capita in the United States and 6,500 kWh in Europe (International Energy Agency, 2017).
Africa’s energy potential, especially renewable energy, is enormous, yet only a fraction is being used. Hydropower provides around a fifth of current capacity. However, not even a tenth of its potential is utilized. Similarly, the theo-
retical potential of solar, biomass, wind, and geothermal energy is huge. NEPAD’s Renewable Energy Access Project (REAP) was designed to accelerate project implementa-tion. It deals directly with renewable energy project owners at the national level and builds on the Africa Renewable Energy Initiative’s objectives. REAP supports over 40 proj-ects ranging in size from less than 1 MW to over 1200 MW. There are also 15 energy projects in the Programme for In-frastructure Development in Africa (PIDA) at a total cost of US$40.3 billion (excluding the Nigeria-Algeria Gas Pipeline) (NEPAD Agency, African Union Commission, & African De-velopment Bank, 2017).
To fully exploit Africa’s significant potential in renewables, US$32 billion will be needed on average every year from 2015 to 2030. Also, there is a lot of money to be saved through energy efficiency – up to US$3.3 billion a year could be saved by reforming power utilities to reduce inef-ficiencies (African Development Bank, 2018).
By consulting the available literature on the SDG synergies, we defined and then mapped the interlinkages between en-ergy targets and other SDG targets. Based on two sources – the report, A Guide to SDG Interactions: from Science to Implementation by the International Council for Science, and a working document provided by the Inter-agency and Expert Group on Sustainable Development Goal Indi-cators – 41 interactions were identified with six goals: 1, 2, 3, 6, 8 and 13 (International Council for Science, 2017; United Nations Statistics Division, 2019). Using Social Net-work Analysis (SNA) techniques, SDG 7 target interactions were mapped and analyzed based on centrality measures, including degree of centrality, eigenvector centrality, be-tweenness centrality and closeness centrality.
The identification of interlinkages between SDG 7 targets and other SDG targets was conducted using literature re-views and relevant documents provided by international institutions working on SDGs. After identification, an adja-cency matrix was constructed by assigning “0” to the pairs

109AFRICA 2030 SUSTAINABLE DEVELOPMENT GOALS THREE-YEAR REALITY CHECK
of targets which do not connect to each other or have a neutral relationship and “1” to the pairs of targets which have a potential relationship between them. The adjacency matrix yielded the structure of the network of interlinkages between SDG 7 targets and other SDG targets. We then analyzed the interlinkages to identify those targets which play more influential and strategic roles in the network us-ing various centrality measurements:
• Degree centrality – measuring the width of direct con-nections
• Eigenvector centrality – measuring both width of direct connections and whether they are connected with influ-ential targets
• Betweenness centrality – measuring the bridging roles between unconnected targets
• Closeness centrality – measuring the distance separat-ing targets from others
IDENTIFICATION OF INTERLINKAGES AND ADJA-CENCY MATRIX
Current literature on the interlinkages between SDGs is lim-ited, mainly because they were only adopted a short time ago. By combining our two sources, the International Coun-cil for Science report and the Inter-agency and Expert Group report, we were able to identify 41 target interactions be-tween the six goals, 1, 2, 3, 6, 8 and 13. These interlinkages are shown in Table 3.1.
Africa: Population growth
1.2 billion 2015 + 42% = 1.68 billion 2030
Primary energy consumption:
Africa < 6% OECD > 41%
10MW solar plant in Soroti, Uganda. Photo credit: The Observer.

110
30. SDG Synergies and Interactions
SDG SYNERGIES AND INTERACTIONS
Table 3.1 Overview of identified positive interactions between the targets of SDG 7 and other SDG targets
Goal Target Positive Interactions Identified
Goal 1No poverty
Poverty and development (1.4) Renewables and energy efficiency will, in most instances, reinforce targets related to water access, scarcity and management by lowering water demands for energy production (com-pared to a less-efficient fossil fuel supply system. Energy can also contribute directly to water availability through pumping and purification.
Exposure and vulnerability (1.5) Decarbonization of the global energy system through a major up-scaling of renewables (7.2) and energy efficiency (7.3) efforts is needed to dramatically cut GHG emissions (Clarke et al., 2014). Such actions are unavoidable if exposure of the world’s poor to increased climate-related extreme events and other environmental disasters is to be significantly reduced (Intergovernmental Panel on Climate Change, 2014) (1.5).
Goal 2Zero hun-ger
Farm employment and income (2.3) Bioenergy production could reinforce initiatives pursuing agricultural job creation and higher farm wages. Bioenergy from agricultural waste also provides higher returns for job creation. Energy access can improve incomes by increasing access to technologies like irrigation and crop storage, which can in turn increase yields and reduce spoilage.
Agricultural productivity (2.4) Energy efficiency improvements can reinforce agricultural productivity by reducing the energy inputs needed. Energy access can improve water access, which can increase yields (water-energy-food nexus)
Goal 3Good health and well-being
Disease and mortality (3.4) Energy-saving measures related to ‘active travel’ (cycling and walking) can lead to improved health and well-being by lowering rates of diabetes, heart disease, dementia, and some cancers.
Health care provision (3.8) Universal energy access enables the provision of food, medicines and vaccines because mechanized refrigeration is essential for effective storage.
Air pollution (3.9) Efforts to provide energy access, expand renewables, and promote energy efficiency will lead to simultaneous reductions in air pollutant emissions.
Goal 6Clean water and sanitation
Water availability (6.1, 6.4, 6.5, 6.6)
Renewables and energy efficiency will, in most instances, reinforce targets related to water access, scarcity and management by lowering water demands for energy production (com-pared to a less-efficient fossil fuel supply system). Energy can also contribute directly to water availability through pumping and purification.
Water quality (6.3, 6.6) Renewables and energy efficiency will, in most instances, reinforce targets related to water pollution and aquatic ecosystems by reducing levels of chemical and thermal pollution (com-pared to a less-efficient fossil fuel supply system).
Goal 8Decent work and economic growth
Employment opportunities (8.2, 8.3, 8.5, 8.6)
Access to modern energy services allows individuals in poorer communities, particularly women and children, to spend more time at work and school, thus enabling employment and education opportunities.
Strong financial institutions and employment opportunities (8.10,8.2, 8.3, 8.5, 8.6)
Design, manufacture, and installation of renewables and energy efficient technologies can create conditions for new and higher-paying jobs, although some businesses will need to re-tool, and some workers will need to re-train. Strengthened financial institutions in developing countries are necessary for providing capital, credit, and insurance to local entrepreneurs attempting to enact change.
Goal 13Climate action
Climate strategies and global warming
Decarbonizing energy systems through an up-scaling of renewables and energy efficiency is a necessary – but not the only – condition for combating climate change, since less fossil fuel energy means fewer GHG emissions.
Source: International Council for Science, 2017
111AFRICA 2030 SUSTAINABLE DEVELOPMENT GOALS THREE-YEAR REALITY CHECK
NETWORK ANALYSIS OF SDG 7 INTERLINKAGES
Social Network Analysis (SNA) is a research technique that focuses on analyzing the pattern or structure and struc-tural properties of a social network within and between individuals, groups and systems. The study of networks is not restricted to sociology or even the social sciences; the relationships between entities are studied by statisticians, neuroscientists, physicians, political scientists, economists, management scientists, computer scientists, engineers and more.
SNA views social relationships in terms of a network the-ory consisting of nodes and ties (also called edges, links, or connections). Nodes are the individual actors within the networks, and ties are the relationships between the actors. This approach uses graph theory for identifying the most important actors which are placed in strategic locations in the network. There are a number of different packages available for performing network analysis but two R pack-ages (Statnet and iGraph) have become the most flexible and powerful.
In this section, a number of SNA centrality measures were performed, including degree centrality, eigenvector central-ity, betweenness centrality and closeness centrality. These were used to analyse the homogeneous structure of the SDG 7 interlinkages network. Centrality, in the field of SNA, indicates the most important or central roles played by nodes or vertices in a network.
• Degree centrality measures the number of edges con-nected to the node. In directed networks, the degree of a node can be further differentiated by in‐degree, indi-cating the direction of the edge from other nodes to the target node, and out‐degree, indicating the direction of
the edge from the target node to other nodes. In the network, high degree centrality indicates that a target has wide interactions with other targets and if it has high in‐degree centrality it indicates that achieving the target will be widely influenced by achieving other tar-gets. Higher out-degree centrality indicates that achiev-ing the target will widely influence achieving other tar-gets.
• Eigenvector centrality measures not only the width of direct connections but also whether they are connected with influential targets. In the network, high eigenvec-tor centrality indicates that the target both has wide interactions with other targets and is strategically posi-tioned to connect with other influential targets.
• Betweenness centrality measures the extent to which a target lies on the paths between other targets. In the network, a target with high betweenness centrality in-dicates that the target is unconnected but an important intermediate bridging target.
• Closeness centrality measures the mean distance from a target to other targets. In the network, a target with high closeness is very likely to be central in the network.
Figure 3.1 shows positive interactions between SDG 7 tar-gets and the other SDG targets. The size of the targets is proportional to the degree of influence (out-degree). The color represents the targets – SDG7 is green and other SDG targets are yellow.
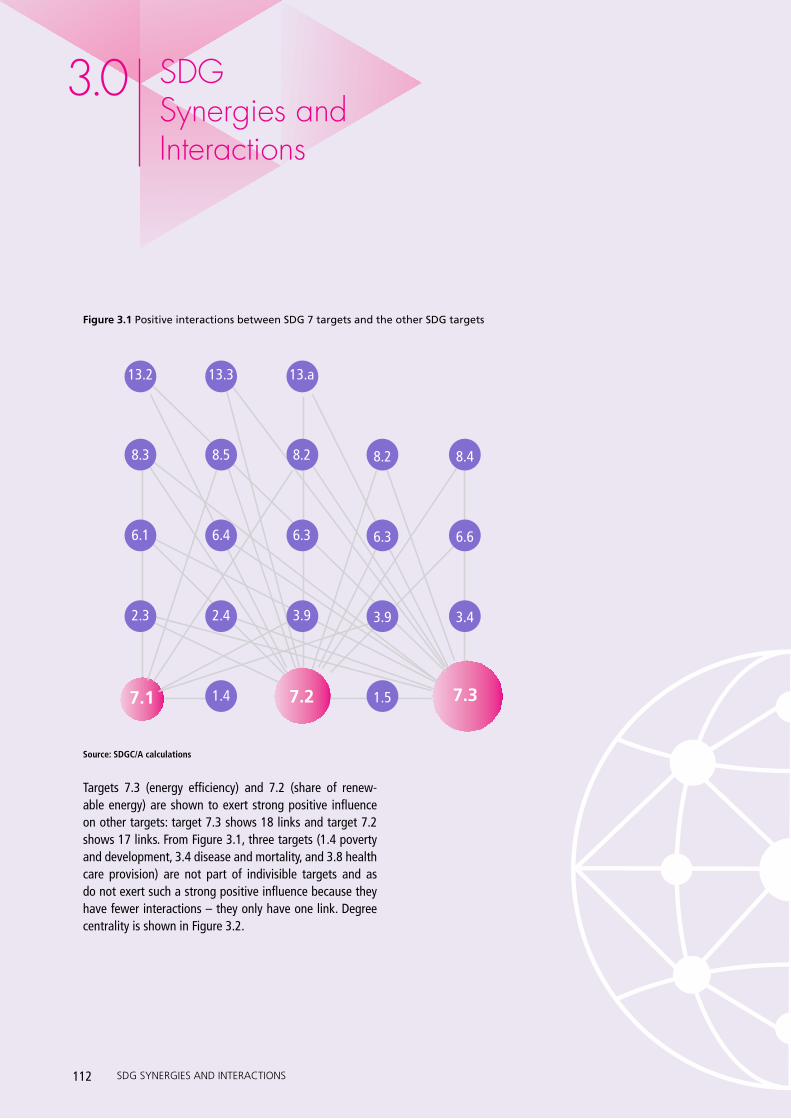
112
30. SDG Synergies and Interactions
SDG SYNERGIES AND INTERACTIONS
Figure 3.1 Positive interactions between SDG 7 targets and the other SDG targets
Source: SDGC/A calculations
Targets 7.3 (energy efficiency) and 7.2 (share of renew-able energy) are shown to exert strong positive influence on other targets: target 7.3 shows 18 links and target 7.2 shows 17 links. From Figure 3.1, three targets (1.4 poverty and development, 3.4 disease and mortality, and 3.8 health care provision) are not part of indivisible targets and as do not exert such a strong positive influence because they have fewer interactions – they only have one link. Degree centrality is shown in Figure 3.2.
7.1 7.2 7.3
13.3
8.5
6.4
2.4
1.4
13.a
8.2
6.3
3.9
8.2
6.3
3.9
1.5
8.4
6.6
3.4
13.2
8.3
6.1
2.3
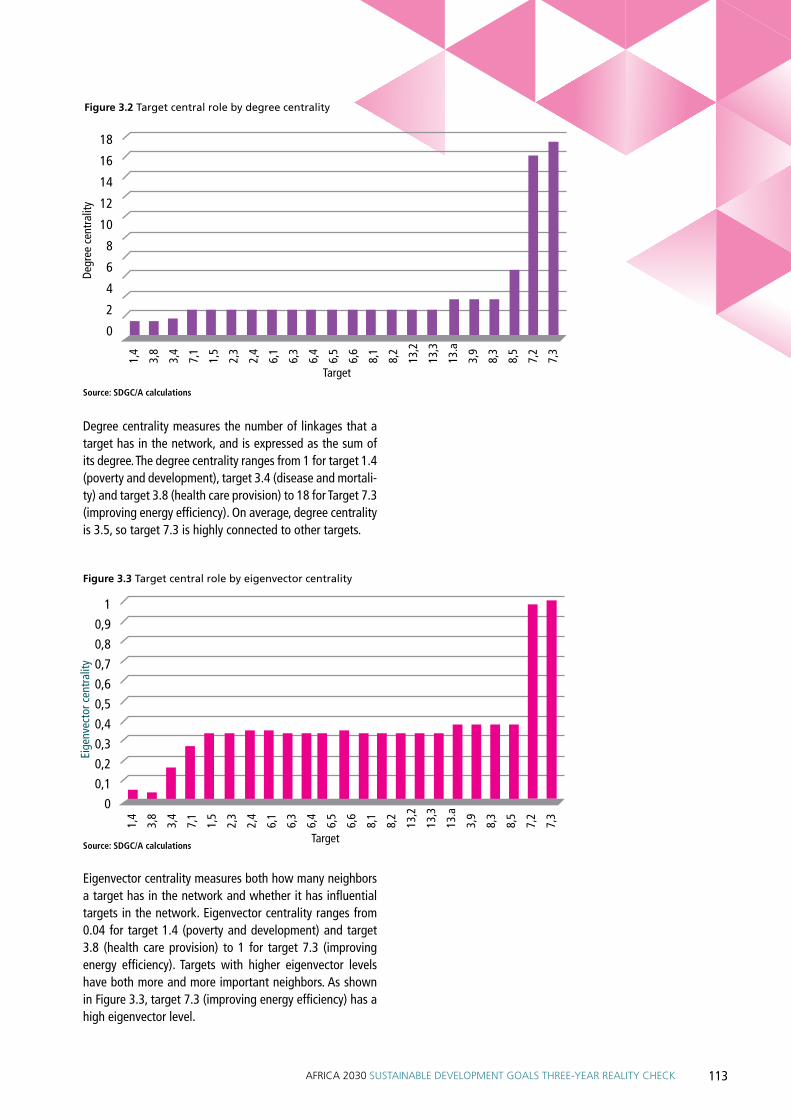
113AFRICA 2030 SUSTAINABLE DEVELOPMENT GOALS THREE-YEAR REALITY CHECK
Figure 3.2 Target central role by degree centrality
Degree centrality measures the number of linkages that a target has in the network, and is expressed as the sum of its degree. The degree centrality ranges from 1 for target 1.4 (poverty and development), target 3.4 (disease and mortali-ty) and target 3.8 (health care provision) to 18 for Target 7.3 (improving energy efficiency). On average, degree centrality is 3.5, so target 7.3 is highly connected to other targets.
Figure 3.3 Target central role by eigenvector centrality
Eigenvector centrality measures both how many neighbors a target has in the network and whether it has influential targets in the network. Eigenvector centrality ranges from 0.04 for target 1.4 (poverty and development) and target 3.8 (health care provision) to 1 for target 7.3 (improving energy efficiency). Targets with higher eigenvector levels have both more and more important neighbors. As shown in Figure 3.3, target 7.3 (improving energy efficiency) has a high eigenvector level.
1
0,9
0,8
0,7
0,6
0,5
0,4
0,3
0,2
0,1
0
Eige
nvec
tor c
entr
ality
1,4
3,8
3,4
7,1
1,5
2,3
2,4
6,1
6,3
6,4
6,5
6,6
8,1
8,2
13,2
13,3
13.a
3,9
8,3
8,5
7,2
7,3
18
16
14
12
10
8
6
4
2
0
Degr
ee c
entr
ality
1,4
3,8
3,4
7,1
1,5
2,3
2,4
6,1
6,3
6,4
6,5
6,6
8,1
8,2
13,2
13,3
13.a
3,9
8,3
8,5
7,2
7,3
Target
Target
Source: SDGC/A calculations
Source: SDGC/A calculations
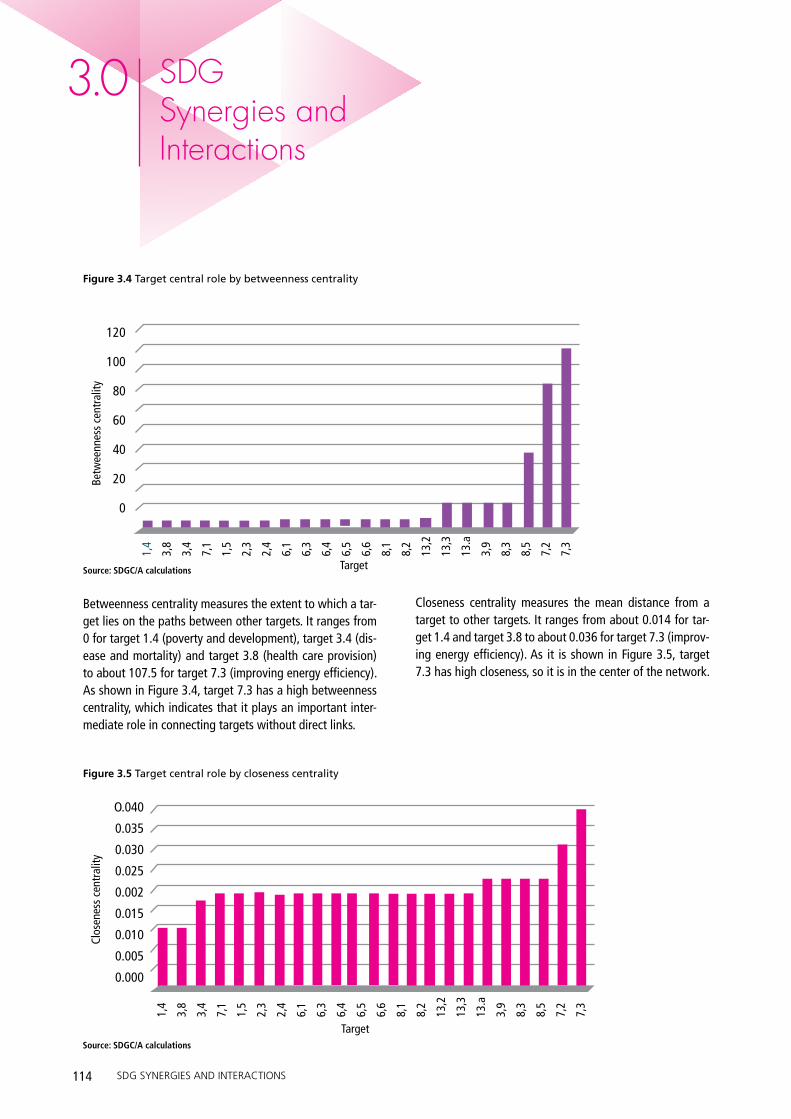
114
30. SDG Synergies and Interactions
SDG SYNERGIES AND INTERACTIONS
Figure 3.4 Target central role by betweenness centrality
Source: SDGC/A calculations
Betweenness centrality measures the extent to which a tar-get lies on the paths between other targets. It ranges from 0 for target 1.4 (poverty and development), target 3.4 (dis-ease and mortality) and target 3.8 (health care provision) to about 107.5 for target 7.3 (improving energy efficiency). As shown in Figure 3.4, target 7.3 has a high betweenness centrality, which indicates that it plays an important inter-mediate role in connecting targets without direct links.
Figure 3.5 Target central role by closeness centrality
120
100
80
60
40
20
0
Clos
enes
s ce
ntra
lity
1,4
3,8
3,4
7,1
1,5
2,3
2,4
6,1
6,3
6,4
6,5
6,6
8,1
8,2
13,2
13,3
13.a
3,9
8,3
8,5
7,2
7,3
Target
Target
Closeness centrality measures the mean distance from a target to other targets. It ranges from about 0.014 for tar-get 1.4 and target 3.8 to about 0.036 for target 7.3 (improv-ing energy efficiency). As it is shown in Figure 3.5, target 7.3 has high closeness, so it is in the center of the network.
O.040
0.035
0.030
0.025
0.002
0.015
0.010
0.005
0.000
Betw
eenn
ess
cent
ralit
y
1,4
3,8
3,4
7,1
1,5
2,3
2,4
6,1
6,3
6,4
6,5
6,6
8,1
8,2
13,2
13,3
13.a
3,9
8,3
8,5
7,2
7,3
Source: SDGC/A calculations
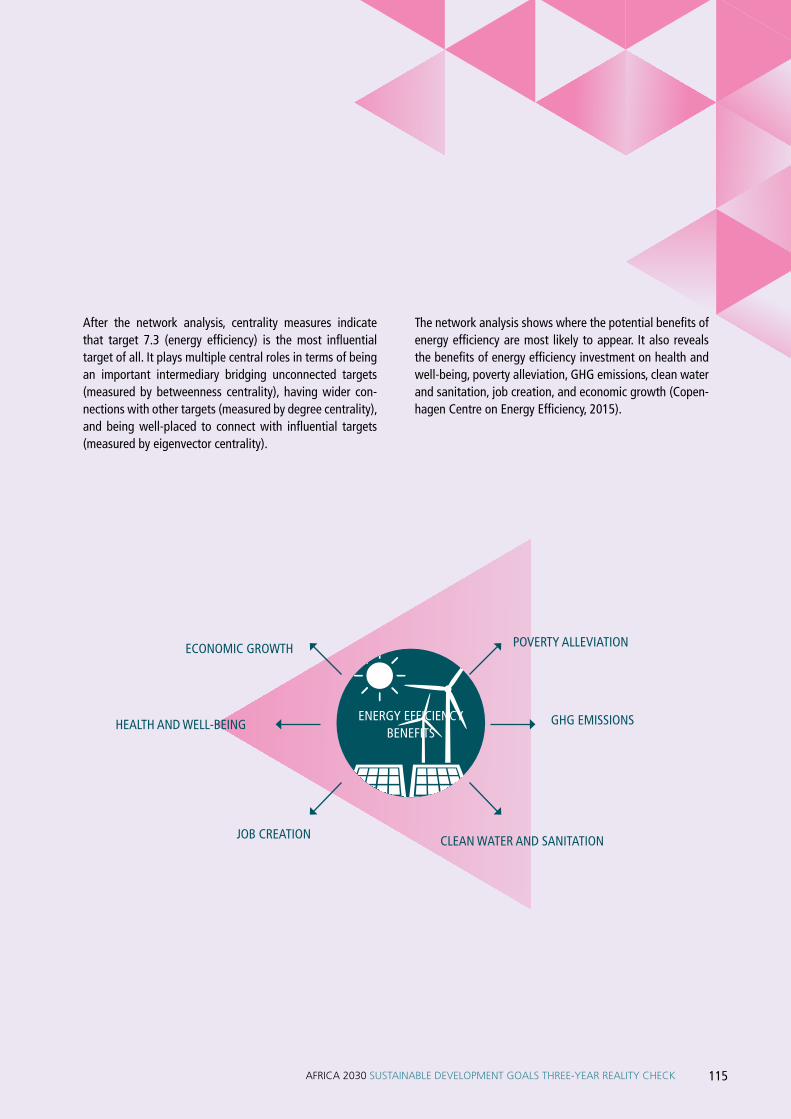
115AFRICA 2030 SUSTAINABLE DEVELOPMENT GOALS THREE-YEAR REALITY CHECK
ENERGY EFFICIENCYBENEFITS
HEALTH AND WELL-BEING
POVERTY ALLEVIATION
GHG EMISSIONS
CLEAN WATER AND SANITATIONJOB CREATION
ECONOMIC GROWTH
After the network analysis, centrality measures indicate that target 7.3 (energy efficiency) is the most influential target of all. It plays multiple central roles in terms of being an important intermediary bridging unconnected targets (measured by betweenness centrality), having wider con-nections with other targets (measured by degree centrality), and being well-placed to connect with influential targets (measured by eigenvector centrality).
The network analysis shows where the potential benefits of energy efficiency are most likely to appear. It also reveals the benefits of energy efficiency investment on health and well-being, poverty alleviation, GHG emissions, clean water and sanitation, job creation, and economic growth (Copen-hagen Centre on Energy Efficiency, 2015).
MOVING ON 04
116
AFRICA 2030 SUSTAINABLE DEVELOPMENT GOALS THREE-YEAR REALITY CHECK
4.1 Key Conclusions
117
118
41. Key Conclusions
MOVING ON
The messages and conclusions of the preceding three chap-ters are summarized below.
PART I CONCLUSION
Overall, data gaps predominate and not enough develop-ment data was available to conduct a rigorous midterm performance review. Most countries have not updated their national data since the SDGs started. The unavailability of data undermines a country’s capacity to establish SDG baselines and track performance against indicators to re-inforce evidence-based decision making. The majority of African countries do not have updated data for crucial in-dicators such as poverty, health, nutrition, education, and infrastructure. Where it exists, latest data is typically from 2015, so progress to 2018 is difficult to assess. While the continent is progressing towards SDG 5 Gender equality, SDG 13 Climate action and SDG 15 Life on land, the rest of the goals are not likely to be met. Only North Africa is mak-ing significant progress on most SDGs. The juxtaposition of former MDGs with related SDGs and other SDGs shows that monitoring frameworks for the latter are only just taking shape, but performance across the board remains mixed. Several African countries are already taking steps towards aligning the SDGs with their national development plans as well as conducting a baseline assessment using the second-ary data from national statistical offices. Evidence shows that the MDG mindset has permeated the SDG Agenda’s implementation; progress towards non-MDG SDG goals is slower. The starting point for Africa was unpropitious – and performance in growth, social inclusion and environment continues to look ominous. The main concerns relate to social inclusion, particularly due to the demographic chal-lenge. More structural factors such as productivity, human capital, infrastructure deficit and governance continue to inhibit structural transformation and development.
Annual financing mix: US$500 billion in domestic revenues,
US$50 billion in ODA, slightly less thanUS$50 billion in FDI
US$60 billion in remittances.”Illicit financial outflows mainly trade
invoicing are over US$70 billion
PART II CONCLUSION
The AAAA identifies multiple financing modalities covering public and private finance, private investment, and blended financing. However, there is a lack of holistic documenta-tion of these financial streams to Africa. In the past three years of implementation, a critical challenge hindering the SDGs in Africa and globally is the lack of commitments and mechanisms to allocate adequate financial resources from both domestic and international sources for the SDGs (Unit-ed Nations, 2018a; World Bank, 2018b). Overall, funding for SDGs around the world falls short of the required levels and the funding gap is wider for Africa than elsewhere. Af-rica generates US$500 billion in domestic revenues, US$50 billion in ODA, slightly less than US$50 billion in FDI and US$60 billion in remittances. Other financial flows are rela-tively small. Yet, illicit financial flows more than countervail remittances. The aforementioned inflows have either de-clined, stagnated or increased marginally in recent years. Research findings show that, although though there is US$300 billion in assets with low returns in the developed world, the promised surge of finance to achieve SDGs has not materialized and there has been inadequate provision of long-term finance for key development sectors (OECD, 2018; United Nations, 2018a). A myriad of domestic and external factors have affected the realization of financing for development. These include the changing global order with growing nationalism, narrowing fiscal space and lower than potential growth in developed nations, and volatile commodity prices. The estimated financing gap for Africa re-mains in excess of 14% of GDP annually, especially for low-income economies. The alignment of financial resources to SDGs is yet to be fully understood but emerging evidence suggests that some flows, such as remittances and FDI, are not optimally aligned to SDGs.
PART III CONCLUSION
Emerging evidence reveals that SDG 7 has strong linkages with other goals and targets. At the aggregate level, SDG 7 acts as an enabling factor for the achievement of SDG 1, SDG 2, SDG 3, SDG 6 and SDG 8. At the target level, target 7.3 drives progress on 18 targets across six goals (1, 2, 3, 6, 8 and 13) and has the strongest linkage with respect to SDG 13 – followed by SDG 6, SDG 8, SDG 2, SDG 3 and SDG 1.
MOVING ON
4.2 Recommendations
119
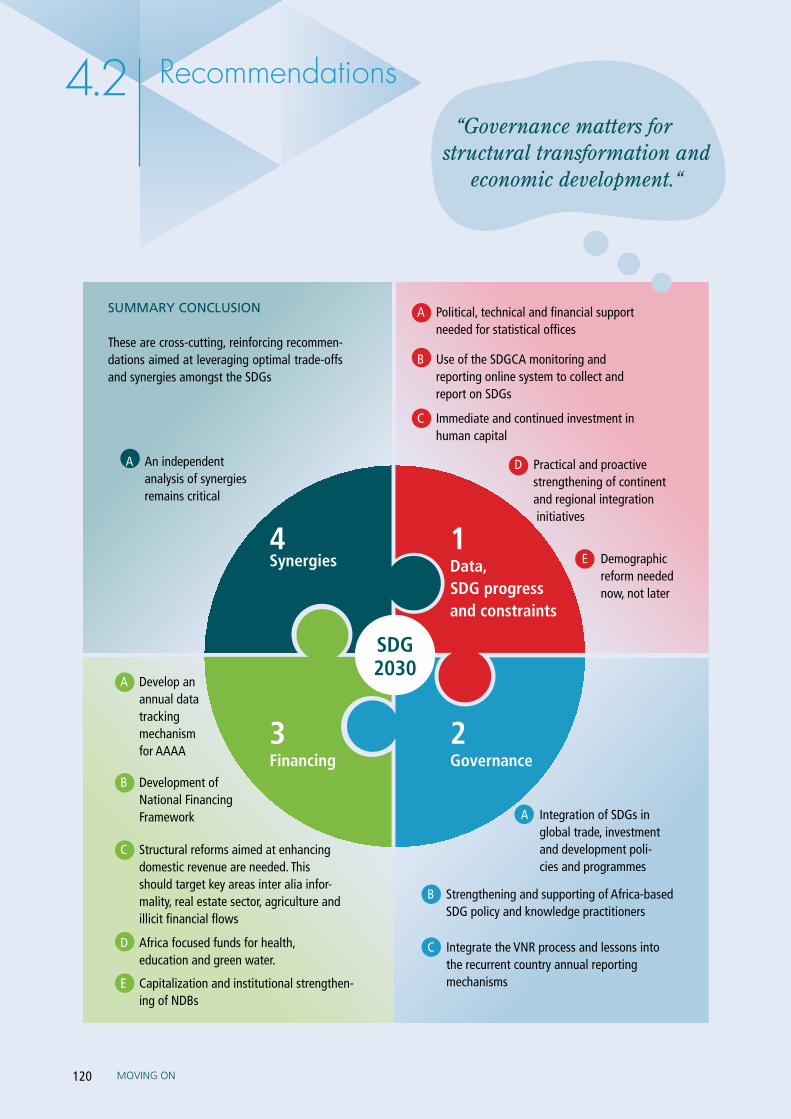
120 MOVING ON
42. Recommendations
SUMMARY CONCLUSION
These are cross-cutting, reinforcing recommen-dations aimed at leveraging optimal trade-offs and synergies amongst the SDGs
SDG 2030
1Data, SDG progress and constraints
2Governance
4Synergies
3Financing
A Political, technical and financial support needed for statistical offices
B Use of the SDGCA monitoring and reporting online system to collect and report on SDGs
C Immediate and continued investment in human capital
D Practical and proactive strengthening of continent and regional integration initiatives
E Demographic reform needed now, not later
A Integration of SDGs in global trade, investment and development poli-cies and programmes
B Strengthening and supporting of Africa-based SDG policy and knowledge practitioners
C Integrate the VNR process and lessons into the recurrent country annual reporting mechanisms E Capitalization and institutional strengthen-
ing of NDBs
A Develop an annual data tracking mechanism for AAAA
B Development of National Financing Framework
C Structural reforms aimed at enhancing domestic revenue are needed. This should target key areas inter alia infor-mality, real estate sector, agriculture and illicit financial flows
D Africa focused funds for health, education and green water.
A An independent analysis of synergies remains critical
“Governance matters for structural transformation and
economic development.“

121AFRICA 2030 SUSTAINABLE DEVELOPMENT GOALS THREE-YEAR REALITY CHECK
PART I: DATA, SDG PROGRESS AND CONSTRAINTS
Good governance matters for the strength and capacity of statistical offices and is strongly correlated with good, high-quality data. Therefore, political support for statistics, backed by the requisite financial instruments and resources, remains the most significant factor in Africa’s data revolu-tion. The challenges are structural and require time-bound actions that will also address the capacity of governments to invest in statistical capacity. Generating statistics through household surveys requires complex skills and massive hu-man capacity. Specific recommendations include but are not limited to, the following:
• Highlight the importance of technical, political and fi-nancial support to national statistics offices and region-al offices. As important as the availability of data is the ability to use data to create a message for the basis of policy formation and development planning. Develop-ment aid earmarked for capacity building in the data ecosystem is important.
• Develop a comprehensive technical guide for how governments can collect, analyze, and interpret SDG-related information and provide for associated capacity building.
• Countries should establish an online system for system-atically and regularly collating, processing and storing data and information on each of the goals and targets in the region. They can start this by using the MDG 2015 data as the baseline and adopt the SDGC/A Monitoring and Reporting System.
• African regions should regularly conduct review meet-ings, and monitor and report annually on the progress in the implementation of goals, targets and indicators. This will help to share knowledge and lessons on prog-ress, and to determine what works, what does not, and why.
• National statistical offices should take the lead in re-porting SDGs’ performance and make sure that they compile all progress achieved, e.g. domesticating of the SDGs, archiving speeches, national priorities, and any other planned activities relating to Agenda 2030.
• Countries need to use the SDGC/A Monitoring and Reporting system in response to the need for routine performance data in Africa. The main purpose of this is to provide ready access to data and information as re-quired by policymakers and development managers in monitoring progress towards the goals and targets and obtaining the required means of implementation.
• Increase resource mobilization to conduct regular, nationally-representative household and business es-tablishment surveys. These should meet internationally-recognized criteria on the selection of indicators, time-liness, verifiability, impartiality and representativeness. Resources are needed to provide training to statisti-cians, for the acquisition of technology, and to dispatch enumerators around the country.
• Expedite the integration of digital technologies into data collection and statistical analysis by national sta-tistical services. Mobile technology has the potential to provide real-time, secure, and georeferenced data that can greatly increase the overall quality of data and re-duce reliance on enumerators’ judgments. Traditional “pen and paper” survey-taking should be a last resort, not a primary recourse.
• Form partnerships with public and private companies such as banks, mobile service providers, fast-moving consumer goods companies, healthcare providers, util-ity companies and others to supplement official statis-tics with anonymized, aggregated administrative data. Collect and compile this data in a transparent manner that protects the privacy of clients and the trade secrets of corporations.

122 MOVING ON
.
• Demographic education and policy reforms are need-ed. Policy reforms should aim at regulating population growth and be consistent with available resources. Po-litical support is necessary as a leverage for this under-taking.
• Structural transformation reforms are needed, in par-ticular aimed at promoting regional industrialization, improving public services, combatting corruption and improving public investment management while cham-pioning regional frameworks and policies. Pragmatism is needed to fully realize the regional integration ben-efits, and political and operational reforms are needed to remove bureaucratic burdens and non-tariff barriers
• Integrated regional approach for standardization and harmonization of policies – with practical focused in-terventions for the regional corridors, infrastructure, institutional and regulatory frameworks that aim to foster regional integration. Collaborative planning and implementation also remains warranted – in particular related to fast tracking the ACFTA. The potential ben-efits are large – both immediate and in the long term.
• Establishment of effective implementation mechanisms for the Sustainable Development Goals (SDGs) at the national level. These should cut across the different levels from planning to oversight. Country and regional SDG-costed action plans monitored annually remain im-perative to have.
• Promoting poverty, inequality and social inclusion re-sponsive budgeting – with earmarked or ring fencing of this type of expenditure. The current spending for social protection is below the recommended 5% for AU 2063 realization – as indicated in the African Union’s Social Policy Framework for Africa.
• Foster integration of digital platforms and information technology in SDG processes and development agendas.
• Promotion of domestic savings – which in turn bolster domestic investments. The full scale realization of fi-nancial inclusion lies in addressing the structural bot-tlenecks on both the demand and supply side. On the demand side, broader reforms are warranted to address client uncertainty as well as measures to grow citizenry income levels (an effective demand population). On the supply side, addressing structural factors attributed to high intermediation costs is essential. The wait for ac-tion is over, we must address the capitalization of finan-cial sectors as well as well promote financial innova-tion, integration and development.
• Africa’s structural transformation is incomplete without embracing industrialization in line with the fourth in-dustrial revolution. Country specific diagnostic studies are needed as is the need for the revision of the respec-tive legal and policy frameworks. Strengthening policy implementation and compliance is a must.
PART II: GOVERNANCE
• The Global Partnership for Sustainable Development needs accelerating beyond the muted progress of the last three years. Effective integration and the reflection of SDGs in economic, development and trade policies, both globally and in Africa, must be undertaken now, not later. International support and partnership is criti-cal, especially for the poorest countries and those fac-ing particular challenges, if they are to implement the SDGs. Advocacy is required for governments to declare the SDGs a top priority and consider them the overarch-ing framework for all policies.
42 Recommendations
123AFRICA 2030 SUSTAINABLE DEVELOPMENT GOALS THREE-YEAR REALITY CHECK
• A clear and binding governance framework with well-articulated roles and responsibilities, lines of reporting and accountability mechanisms, both nationally and globally, must be put in place. This will coordinate vari-ous actors at local and international levels, giving them clear roles and responsibilities that help every actor to maximize their impact, and provide coherent support to avoid duplicating efforts.
• The High Level Political Forum remains relevant but re-quires effective mechanisms for follow-up. Africa-based political and administrative accountability mechanisms for tracking and reporting SDGs are needed. The recur-rent monitoring and dialogue platform will go a long way to putting in place checks and balances.
• Develop a VNR infrastructure that provides a holistic platform for comparison and information and lesson sharing, and harmonizes methodology. The integration of the Agenda 2063 in the process is essential. The pro-cess needs to be customized to include Agenda 2063 goals and to be regularly implemented. Reporting needs to be conducted more efficiently and regularly. Multi-stakeholder engagement and capacity building in the overall SDG process and monitoring is essential.
PART III: FINANCING
• An annual data tracking system for AAAA is now in place. Data remains imperative to understanding the fi-nancing needs, gaps, resource flows, utilization and im-pact of the SDGs. This will require, but is not limited to, enhanced coordination, collaboration and clarity when it comes to tracking these flows, both in Africa and in-ternational organizations elsewhere.
• Technical support is needed for the development of National Financing Frameworks as envisaged by AAAA. The development of domestic revenue mobilisation strategies should be expedited, as should implementa-tion tools. It is important to build capacity at the insti-tutional, legal, policy and individual level for revenue authorities to increase domestic revenue collection.
• Put in place incentive frameworks to attract both pri-vate and other global financing flows that are currently in low or negative interest rate investments to the con-tinent. This requires deliberate and concerted efforts by both government, multilateral agencies and other stakeholders as convenors, advocates and conduits for the re-allocation of the requisite financing.
• Capitalize NDBs to promote private investment and long-term finance for priority sectors. NDBs should be strongly capitalized and assisted by appropriate super-visory standards to create viable and sustainable NDBs. National governments in Africa have to work to trans-form their NDBs’ low capital base (0.3-2.8% of GDP) to bring them in line with the rest of the developing world (15% of GDP on average). An NDB’s capital should be compatible with the size of the national economy. Such action will help NDBs to gain confidence and access a wider range of innovative sources of finance, including borrowing from treasury and multilateral organizations, product specific credit lines, general corporate debt, capital markets, co-financing, blended finance, green and SDG bonds, and climate finance. In addition, en-hance the capacity of NDBs through long-term project design and appraisal, which will help to attract financ-ing for Africa’s untapped sectors, such as infrastructure, agriculture, power and human capital.

124
41. Key Conclusions
MOVING ON
• Improve governance and the enabling environment, as governance is a critical issue that determines the health of the NDBs. Implement a sound corporate governance system for NDBs by taking practical measures such as strengthening and institutionalizing governance frame-works with a clear mandate, strategy and deliverables. Improve on governance regulation by separating own-ership from control. Bring transparency to the process of appointing the boards of directors and CEOs of NDBs (and ensure a balanced mix of capable and indepen-dent board members). And enhance the capacity of NDB board members and senior leadership teams.
• Establish funding schemes for specific sectors in Africa. Funds for critical sectors such as water, education and health can fast track the achievement of SDGs. Set-up and managed in line with lessons learned from funds elsewhere, Africa-based managed funds for key social sectors are critical for boosting social inclusion.
PART IV SYNERGIES
Moving toward action, decision- and policy-makers must do more than merely acknowledge the existence of SDG inter-actions. They must capitalize on the potential of SDG in-teractions when planning and implementing development pathways. More specifically:
• Evidence-based analysis of the synergies between SDGs is important. Budgeting and mainstreaming should re-flect the existing synergies.
Overall therecommendations may not be
specific in nature, as such require respective pragmatic action
planning from different stakeholders. Every one counts as is their action.

REFERENCES ... continued
REFERENCES
AFRICA 2030 SUSTAINABLE DEVELOPMENT GOALS THREE-YEAR REALITY CHECK 125
126
REFERENCES ... continued
AFRICA 2030 SUSTAINABLE DEVELOPMENT GOALS THREE-YEAR REALITY CHECK
AAI. (2015). State of Education in Africa Report 2015 (p. 16). Retrieved from The Africa-America Institute website: http://www.aaionline.org/wp-content/uploads/2015/09/AAI-SOE-report-2015-final.pdf
Acemoglu, D., & Robinson, J. (2008). The Role of Institutions in Growth and Development (Working Paper No. 10). Re-trieved from World Bank website: https://siteresources.worldbank.org/EXTPREMNET/Resources/489960-1338997241035/Growth_Commission_Working_Paper_10_Role_Institutions_Growth_Development.pdf
Adefeso, H. A. (2018). Governance and Development in Africa: A Panel Causal Investigation. Canadian Social Science, 14(4), 35–40. https://doi.org/10.3968/10208
AfDB Group. (2019). AfDB Data Portal. Retrieved April 25, 2019, from https://projectsportal.afdb.org/dataportal/
African Development Bank. (2018). African Economic Outlook 2018. Retrieved from African Development Bank website: https://www.afdb.org/fileadmin/uploads/afdb/Documents/Publications/African_Economic_Outlook_2018_-_EN.pdf
African Development Bank Group. (2018, February 4). Africa Infrastructure Development Index (AIDI) - Africa Infra-structure Knowledge Program Portal. Retrieved March 13, 2019, from Knoema website: http://infrastructureafrica.open-dataforafrica.org//rscznob/africa-infrastructure-development-index-aidi
African Tax Administration Forum. (2018, July). 2018 African Tax Outlook Publication. Presented at the 2018 African Tax Outlook Publication, Pretoria, South Africa. Retrieved from https://www.gtac.gov.za/Eventdocs/ATAF%20ATO%203rd%20Edition%20PPTNM%20Nara%20Monkam.pdf
African Union, Economic Commission for Africa, African Development Bank, & United Nations Development Pro-gramme. (2017). 2017 Africa sustainable development report: tracking progress on Agenda 2063 and the sustainable de-velopment goals. Retrieved from https://www.uneca.org/sites/default/files/PublicationFiles/en_agenda2063_sdg-web.pdf
African Union, UNECA, & African Development Bank. (2017). Assessing Regional Integration in Africa VIII. Retrieved from Economic Commission for Africa website: https://www.uneca.org/sites/default/files/PublicationFiles/aria8_eng_fin.pdf
Attridge, S., & Engen, L. (2019). Blended finance in the poorest countries (p. 76). Retrieved from ODI website: https://www.odi.org/sites/odi.org.uk/files/resource-documents/12666.pdf
AU, ECA, AfDB, & UNDP. (2018). 2018 Africa Sustainable Development Report: Towards a Transformed and Resilient Con-tinent. Retrieved from Economic Commission for Africa website: https://www.uneca.org/sites/default/files/PublicationFiles/asdr_2018_en_web.pdfAyres, C. (2016, October 16). 5 Advantages and Disadvantages of Exponential Smoothing. Retrieved March 13, 2019, from ConnectUS website: https://connectusfund.org/5-advantages-and-disadvantages-of-exponential-smoothing
Barrot, L.-D., Calderón, C., & Servén, L. (2018). Openness, specialization, and the external vulnerability of developing countries. Journal of Development Economics, 134(C), 310–328.
Beegle, K., Christiaensen, L., Dabalen, A., & Gaddis, I. (2016). Poverty in a Rising Africa. Retrieved from World Bank website: http://documents.worldbank.org/curated/en/949241467996692059/pdf/103948-PUB-POVERTY-AFRICA-Box394870B-PUBLIC.pdf

127
REFERENCES ... continued
AFRICA 2030 SUSTAINABLE DEVELOPMENT GOALS THREE-YEAR REALITY CHECK
Begashaw, B. (2017, April 16). Global Governance for SDGs. D+C. Retrieved from https://www.dandc.eu/en/article/peer-pressure-can-contribute-achieving-sdgs-more-needed
Begashaw, B., & Shah, A. (2017). SDG Financing for Africa: Key Propositions and Areas of Engagement (p. 21) [Discussion Paper]. Retrieved from The Sustainable Development Goals Center for Africa website: https://sdgcafrica.org/wp-content/uploads/2017/03/sdg-financing-for-africa_key-propositions-and-areas-of-engagement-.pdf
Benin, S. (2016). Agricultural productivity in Africa: Trends, patterns, and determinants. Retrieved from http://ebrary.ifpri.org/cdm/ref/collection/p15738coll2/id/130468
Bloom, D. E. (2016, March). Demographic Upheaval. Finance & Development, 53(1). Retrieved from https://www.imf.org/external/pubs/ft/fandd/2016/03/bloom.htm
Burck, J., Hagen, U., Marten, F., Höhne, N., & Bals, C. (2018). The Climate Change Performance Index: Results 2019. Retrieved from Germanwatch website: https://www.climate-change-performance-index.org/sites/default/files/documents/ccpi2019_results.pdf
Calderon, C., Cantu, C., & Chuhan-Pole, P. (2018). Infrastructure development in Sub-Saharan Africa : a scorecard (No. WPS8425; pp. 1–47). Retrieved from World Bank website: http://documents.worldbank.org/curated/en/866331525265592425/Infrastructure-development-in-Sub-Saharan-Africa-a-scorecard
Carty, T., & Le Comte, A. (2018). Climate Finance Shadow Report 2018: Assessing progress towards the $100 billion com-mitment. https://doi.org/10.21201/2018.2388
Chuhan-Pole, P., Christiaensen, L., Angwafo, M., Buitano, M., Dennis, A., Sanoh, A., … Moran, E. (2013). Africa’s Pulse, April 2013 : An Analysis of Issues Shaping Africa’s Economic Future. Africa’s Pulse, 7(77973), 28.
Civil Society Reflection Group. (2018). Spotlight on Sustainable Development 2018: Exploring New Policy Pathways. Retrieved from https://www.2030spotlight.org/sites/default/files/spot2018/Spotlight_2018_web.pdf
Clarke, L., Jiang, K., Akimoto, K., Babiker, M., Blanford, G., Fisher-Vanden, K., … van Vuuren, D. P. (2014). Assess-ing Transformation Pathways. In Climate Change 2014: Mitigation of Climate Change. Contribution of Working Group III to the Fifth Assessment Report of the Intergovernmental Panel on Climate Change (pp. 413–510). Cambridge, UK: Cambridge University Press.
Climate Analytics. (2018, July 13). Paris Agreement Ratification Tracker. Retrieved April 28, 2019, from https://climateana-lytics.org/briefings/ratification-tracker/
Copenhagen Centre on Energy Efficiency. (2015). Accelerating Energy Efficiency: Initiatives and Opportunities - Africa. Retrieved from Copenhagen Centre on Energy Efficiency website: http://kms.energyefficiencycentre.org/sites/default/files/C2E2_REPORT_AFRICA.pdf
de Vries, G., Timmer, M., & de Vries, K. (2015). Structural Transformation in Africa: Static Gains, Dynamic Losses. The Journal of Development Studies, 51(6), 674–688. https://doi.org/10.1080/00220388.2014.997222

128
REFERENCES ... continued
AFRICA 2030 SUSTAINABLE DEVELOPMENT GOALS THREE-YEAR REALITY CHECK
REFERENCES ... continued
ECA, AU, & AfDB. (2018). AFRICAN STATISTICAL YEARBOOK 2018. Retrieved from https://www.afdb.org/fileadmin/up-loads/afdb/Documents/Publications/African_Statistical_Yearbook_2018.pdf
Economic Commission for Africa. (2018). A Study on the Global Governance Architecture for Combating Illicit Financial Flows. Retrieved from Economic Commission for Africa website: https://www.uneca.org/sites/default/files/PublicationFiles/global-governance_eng_rev.pdf
FAO Statistics Division. (2019). FAOSTAT. Retrieved January 15, 2019, from FAOSTAT website: http://www.fao.org/fao-stat/en/#home
Fenochietto, R., & Pessino, C. (2013). Understanding Countries’ Tax Effort. IMF Working Papers, 13(244). https://doi.org/10.5089/9781484301272.001
Financial Action Task Force. (2019). High-risk and other monitored jurisdictions. Retrieved May 3, 2019, from https://www.fatf-gafi.org/countries/#high-risk
Franzsen, R., & McCluskey, W. (Eds.). (2017). Property Tax in Africa: Status, Challenges, and Prospects. Retrieved from https://www.lincolninst.edu/sites/default/files/pubfiles/property-tax-in-africa-full_0.pdf
Gaspar, V., Jaramillo, L., & Wingender, P. (2016). Tax Capacity and Growth : Is there a Tipping Point? (Working Paper No. 16/234). Retrieved from International Monetary Fund website: https://www.imf.org/en/Publications/WP/Issues/2016/12/31/Tax-Capacity-and-Growth-Is-there-a-Tipping-Point-44436
Gaspar, V., Amaglobeli, D., Garcia-Escribano, M., Prady, D., & Soto, M. (2019). Fiscal Policy and Development: Human, Social, and Physical Investments for the SDGs (SDN No. 19/03; p. 45). Retrieved from International Monetary Fund website: https://www.imf.org/en/Publications/Staff-Discussion-Notes/Issues/2019/01/18/Fiscal-Policy-and-Development-Human-Social-and-Physical-Investments-for-the-SDGs-46444
Global Carbon Atlas. (2018). CO2 Emissions | Global Carbon Atlas. Retrieved April 28, 2019, from http://www.globalcar-bonatlas.org/en/CO2-emissions
Government of Botswana. (2017). Botswana Voluntary National Review on Sustainable Development Goals 2017. Re-trieved from https://sustainabledevelopment.un.org/content/documents/16397Botswana.pdf
Henao, L., Hui, M., Shaw, G., Dushime, O., & Hufft, A. (2017). Africa 2030: How Africa Can Achieve the Sustainable Development Goals (No. 2). Retrieved from Sustainable Development Goals Center for Africa website: https://sdgcafrica.org/wp-content/uploads/2018/03/SDG_2030_Nov_2017.pdf
Hyndman, R. (2019, January 18). Package “forecast.” Retrieved from https://cran.r-project.org/web/packages/forecast/forecast.pdf
ICA. (2018). Infrastructure Financing Trends in Africa – 2017 [Annual Reprot]. Retrieved from Infrastructure Consortium for Africa website: https://www.icafrica.org/fileadmin/documents/Annual_Reports/IFT2017.pdf

129
REFERENCES ... continued
AFRICA 2030 SUSTAINABLE DEVELOPMENT GOALS THREE-YEAR REALITY CHECK
REFERENCES ... continued
IEA. (2019). Clean cooking. Retrieved April 25, 2019, from https://www.iea.org/sdg/cooking/
IEA, IRENA, UN, World Bank Group, & WHO. (2018). Tracking SDG7: The Energy Progress Report 2018 [Report]. Re-trieved from World Bank website: http://documents.worldbank.org/curated/en/495461525783464109/pdf/126026-WP-PUBLIC-P167379-tracking-sdg7-the-energy-progress-report-full-report.pdf
Institute for Economics & Peace. (2017). Global Peace Index 2017: Measuring Peace in a Complex World. Retrieved from http://visionofhumanity.org/app/uploads/2017/06/GPI-2017-Report-1.pdf
Intergovernmental Panel on Climate Change. (2014). Climate Change 2014 Mitigation of Climate Change: Working Group III Contribution to the Fifth Assessment Report of the Intergovernmental Panel on Climate Change. https://doi.org/10.1017/CBO9781107415416
International Council for Science. (2017). A Guide to SDG Interactions: from Science to Implementation (D. J. Griggs, M. Nilsson, A. Stevance, & D. McCollum, Eds.). https://doi.org/International Council for Science (2017). A Guide to SDG Interactions: from Science to Implementation. International Council for Science, Paris. DOI:10.24948/2017.01 <https://doi.org/10.24948/2017.01>.
International Energy Agency. (2017). World Energy Outlook 2017. Retrieved from International Energy Association web-site: https://www.iea.org/weo2017/
International Labour Organization. (2018). World Employment and Social Outlook – Trends for Women 2018 – Global snapshot. Retrieved from https://www.ilo.org/wcmsp5/groups/public/---dgreports/---dcomm/---publ/documents/publica-tion/wcms_619577.pdf
International Monetary Fund. (2016). Sub-Saharan Africa: Time for a Policy Reset. Retrieved from International Mon-etary Fund website: https://www.imf.org/en/Publications/REO/SSA/Issues/2016/04/05/Time-for-a-Policy-Reset
International Monetary Fund. (2017). Fiscal Adjustment and Economic Diversification. Retrieved from International Monetary Fund website: https://www.imf.org/en/Publications/REO/SSA/Issues/2017/10/19/sreo1017
International Monetary Fund. (2018a). Regional Economic Outlook: Domestic Revenue Mobilization and Private Investment. Retrieved from International Monetary Fund website: https://www.imf.org/en/Publications/REO/SSA/Is-sues/2018/04/30/sreo0518
International Monetary Fund. (2018b). The IMF and fragile states: evaluation report 2018. Washington, D.C: Interna-tional Monetary Fund. Independent Evaluation Office.
International Monetary Fund. (2019, April). World Economic Outlook Database April 2019. Retrieved April 25, 2019, from IMF website: https://www.imf.org/external/pubs/ft/weo/2019/01/weodata/index.aspx
IUCN, & BLI. (2017, July 11). Metadata-15-05-01. Retrieved from https://unstats.un.org/sdgs/metadata/files/Metada-ta-15-05-01.pdf

130
REFERENCES ... continued
AFRICA 2030 SUSTAINABLE DEVELOPMENT GOALS THREE-YEAR REALITY CHECK
Jones, B. (2013). Fragile States: Taking Part in Africa’s Inclusive Growth Take-Off. Africa Economic Brief, 4(4), 12.
Kenya Ministry of Environment and Natural Resources. (2015, July 23). Kenya’s Intended Nationally Determined Contribution. Retrieved from https://www4.unfccc.int/sites/ndcstaging/PublishedDocuments/Kenya%20First/Kenya_NDC_20150723.pdf
Kleiterp, N. (2017). Banking for a Better World. https://doi.org/10.26530/OAPEN_623377
Mo Ibrahim Foundation. (2018). 2018 Ibrahim Index of African Governance. Retrieved from http://s.mo.ibrahim.foundation/u/2018/11/27173840/2018-Index-Report.pdf?_ga=2.73337687.538074975.1552405975-1706495542.1552405975
Musacchio, A., Lazzarini, S., Makhoul, P., & Simmons, E. (2017). The Role and Impact of Development Banks: A Review of their Founding, Focus, and Influence (p. 89). Retrieved from http://people.brandeis.edu/~aldom/papers/The%20Role%20and%20Impact%20of%20Development%20Banks%20-%203-9-2017.pdf
National Planning Authority. (2016). Review Report on Uganda’s Readiness for Implementation of the 2030 Agenda. Re-trieved from Government of Uganda website: https://sustainabledevelopment.un.org/content/documents/10689Uganda%20Review%20Report_CDs1.pdf
Ncube, M., & Lufumpa, C. L. (Eds.). (2017). Infrastructure in Africa: Lessons for future development (1st ed.). https://doi.org/10.2307/j.ctt1t88xmm
NEPAD Agency, African Union Commission, & African Development Bank. (2017). PIDA Progress Report – 2017. Retrieved from http://www.au-pida.org/download/pida-progress-report-2017/
Norregaard, J. (2013). Taxing Immovable Property Revenue Potential and Implementation Challenges. IMF Working Pa-pers, 13(129). https://doi.org/10.5089/9781484369050.001
OECD. (2018). Global Outlook on Financing for Sustainable Development 2019: Time to Face the Challenge. Retrieved from https://doi.org/10.1787/9789264307995-en
Pachauri, S., Brew-Hammond, A., Barnes, D. F., Bouille, D. H., Gitonga, S., Modi, V., … Zerrifi, H. (2012). Energy Access for Development. In Global Energy Assessment: Toward a Sustainable Future (pp. 1401–1458). Cambridge, UK: Cambridge University Press.
Ratha, D., De, S., Kim, E. J., Plaza, S., Schuettler, K., Seshan, G., & Yameogo, N. D. (2018). Migration and remittances : Special topic : Transit Migration (Brief No. 29). Retrieved from World Bank Group website: https://www.knomad.org/sites/default/files/2018-04/Migration%20and%20Development%20Brief%2029.pdf
Salomon, M., & Spanjers, J. (2017). Illicit Financial Flows to and from Developing Countries: 2005-2014. Retrieved from Global Financial Integrity website: https://www.gfintegrity.org/wp-content/uploads/2017/05/GFI-IFF-Report-2017_final.pdf

131
REFERENCES ... continued
AFRICA 2030 SUSTAINABLE DEVELOPMENT GOALS THREE-YEAR REALITY CHECK
Schmidt-Traub, G. (2015). Investment Needs to Achieve the Sustainable Development Goals (p. 137). Retrieved from Sus-tainable Development Solutions Network website: http://unsdsn.org/resources/publications/sdg-investment-needs/
SDGC/A, & SDSN. (2018). Africa SDG Index and Dashboards Report 2018. Retrieved from Sustainable Development Goals Center for Africa and Sustainable Development Solutions Network website: https://sdgcafrica.org/wp-content/up-loads/2018/07/AFRICA-SDG-INDEX-AND-DASHBOARDS-REPORT-2018-Complete-WEB.pdf
Sebudde, R. K., Byamugisha, F. F. K., Onyach-Olaa, M., Kibirige, M. K., & Myers, G. W. (2015). Searching for the ’grail’ : can Uganda’s land support its prosperity drive? : Main Report (English) (Working Paper No. 99060; pp. 1–88). Re-trieved from World Bank Group website: http://documents.worldbank.org/curated/en/755981467986343093/Main-report
Shah, A. (2016). Development Banking for the SDGs: A Three Point Plan.
The World Bank. (2019). World Development Report 2019: The Changing Nature of Work. Retrieved from World Bank Group website: http://documents.worldbank.org/curated/en/816281518818814423/pdf/2019-WDR-Report.pdf
UN Women. (2017). Annual Report 2016-2017. Retrieved from http://www2.unwomen.org/-/media/annual%20report/at-tachments/sections/library/un-women-annual-report-2016-2017-en.pdf?vs=5634
UNCTAD. (2016). The Role of Development Banks in Promoting Growth and Sustainable Development in the South (No. UNCTAD/GDS/ECIDC/2016/1; p. 51). Retrieved from United Nations website: https://unctad.org/en/PublicationsLibrary/gdsecidc2016d1_en.pdf
UNCTAD. (2018). World Investment Report 2018: Investment and New Industrial Policies. https://doi.org/10.18356/ebb78749-en
UNDP. (2017). South-South Cooperation in Sub-Saharan Africa: Strategies for UNDP Engagement. Retrieved from https://reliefweb.int/sites/reliefweb.int/files/resources/UNDP_RBA_South-South%2520Cooperation%2520in%2520Sub-Saharan%2520Africa_EN.pdf
UNECA. (2019). ECAStats: Online access. Retrieved March 12, 2019, from https://ecastats.uneca.org/data/browsebysec-tor1.aspx
UNESCO. (2019). UIS Statistics. Retrieved March 13, 2019, from http://data.uis.unesco.org/#
UNFCCC. (2019). Report of the Conference of the Parties on its twenty-fourth session, held in Katowice from 2 to 15 December 2018. Katowice Climate Change Conference – December 2018. Presented at the COP 24, Katowice, Poland. Retrieved from https://unfccc.int/sites/default/files/resource/10.pdf
UNICEF. (2018, March). Under-five mortality. Retrieved March 13, 2019, from UNICEF DATA website: https://data.unicef.org/topic/child-survival/under-five-mortality/

132
REFERENCES ... continued
AFRICA 2030 SUSTAINABLE DEVELOPMENT GOALS THREE-YEAR REALITY CHECK
United Nations. (2012, April 12). Framework of operational guidelines on United Nations support to South-South and triangular cooperation. Retrieved from https://www.un.org/ga/search/view_doc.asp?symbol=SSC/17/3
United Nations. (2015, July 27). Addis Ababa Action Agenda of the Third International Conference on Financing for De-velopmnent. Presented at the Third Internatinal Conference on Financing for Development, Addis Ababa, Ethiopia. Retrieved from https://www.un.org/esa/ffd/wp-content/uploads/2015/08/AAAA_Outcome.pdf
United Nations. (2017). The Sustainable Development Goals Report 2017 (No. 17–01700). Retrieved from United Nations website: https://unstats.un.org/sdgs/files/report/2017/thesustainabledevelopmentgoalsreport2017.pdf
United Nations. (2018a). Financing for development: progress and prospects 2018. New York: United Nations.
United Nations. (2018b). New Partnership for Africa’s Development: sixteenth consolidated progress report on im-plementation and international support (No. A/73/269). Retrieved from United Nations website: https://undocs.org/pdf?symbol=en/A/73/269
United Nations. (2018c). The Sustainable Development Goals Report 2018. Retrieved from https://unstats.un.org/sdgs/files/report/2018/TheSustainableDevelopmentGoalsReport2018-EN.pdf
United Nations. (2018d, September 24). Media Advisory - The Secretary General High Level Meeting on Financing the 2030 Agenda for Sustainable Development. Retrieved from https://www.un.org/sustainabledevelopment/wp-content/up-loads/2018/09/Draft-media-advisory-SG-HLM-on-financing-2030A_20-Sep.pdf
United Nations. (2019). Report of the Inter-Agency Task Force on Financing for Development 2019: financing for sustain-able development report 2019. Retrieved from https://developmentfinance.un.org/sites/developmentfinance.un.org/files/FSDR2019.pdf
United Nations Development Programme. (2017). Income inequality trends in sub-Saharan Africa: divergence, deter-minants and consequences: overview (A. F. Odusola, G. A. Cornia, H. Bhorat, & P. Conceição, Eds.). New York, NY: United Nations Development Programme, Regional Bureau for Africa.
United Nations Economic Commission for Africa. (2017). Economic Report on Africa 2017: Urbanization and Industri-alization for Africa’s Transformation. Retrieved from United Nations website: https://www.uneca.org/publications/econom-ic-report-africa-2017
United Nations Statistics Division. (2019, April 4). IAEG-SDGs Tier Classification for Global SDG Indicators. Retrieved April 25, 2019, from IAEG-SDGs website: https://unstats.un.org/sdgs/iaeg-sdgs/tier-classification/
Verter, N. (2017). International Trade: The Position of Africa in Global Merchandise Trade. In Emerging Issues in Economics and Development. Retrieved from https://www.intechopen.com/books/emerging-issues-in-economics-and-development/international-trade-the-position-of-africa-in-global-merchandise-trade
133
REFERENCES ... continued
AFRICA 2030 SUSTAINABLE DEVELOPMENT GOALS THREE-YEAR REALITY CHECK
WHO, & UNICEF. (2017). Progress on drinking water, sanitation and hygiene: 2017 update and SDG baselines. Retrieved from World Health Organization website: https://washdata.org/sites/default/files/documents/reports/2018-01/JMP-2017-re-port-final.pdf
Woodbridge, M. (2015). From MDGs to SDGs: What are the Sustainable Development Goals. Retrieved from http://local-izingthesdgs.org/library/251/From-MDGs-to-SDGs-What-are-the-Sustainable-Development-Goals.pdf
World Bank. (2017). Migration and Remittances - Recent Developments and Outlook - Special Topic: Return Migration (Brief No. 28). Retrieved from World Bank website: https://www.knomad.org/sites/default/files/2017-12/Migration%20and%20Development%20Report%2012-14-17%20web.pdf
World Bank. (2018a). 2017 Survey of National Development Banks [Global Report]. Retrieved from World Bank Group website: http://documents.worldbank.org/curated/en/977821525438071799/pdf/125958-WP-PUBLIC-WorldBankGlobal-ReportNationalDevelopmentBanksVFull.pdf
World Bank. (2018b). Africa’s Pulse, No. 18: An Analysis of Issues Shaping Africa’s Economic Future (No. 18). Retrieved from World Bank website: https://openknowledge.worldbank.org/bitstream/handle/10986/30455/9781464813658.pdf?sequence=2&isAllowed=y
World Bank. (2018c). Poverty and Shared Prosperity 2018: Piecing Together the Poverty Puzzle. Retrieved from World Bank website: https://openknowledge.worldbank.org/bitstream/handle/10986/30418/9781464813306.pdf
World Bank. (2018d). The Human Capital Project. Retrieved from World Bank Group website: https://openknowledge.worldbank.org/handle/10986/11866
World Bank. (2018e, September). PovcalNet. Retrieved October 12, 2018, from http://iresearch.worldbank.org/Povcal-Net/home.aspx
World Bank. (2019). Access to electricity (% of population) | Data. Retrieved March 13, 2019, from https://data.worldbank.org/indicator/EG.ELC.ACCS.ZS
World Data Lab. (2018, December). World Poverty Clock. Retrieved April 28, 2019, from https://worldpoverty.io
World Health Organization. (2018). World health statistics 2018: monitoring health for the SDGs. Retrieved from http://apps.who.int/iris/bitstream/handle/10665/272596/9789241565585-eng.pdf?ua=1

134 AFRICA 2030 SUSTAINABLE DEVELOPMENT GOALS THREE-YEAR REALITY CHECK
SDGC/A BOARD
DIRECTOR GENERALDr Belay Ejigu Begashaw
CO-CHAIRS His Excellency Paul Kagame, President of the Republic of RwandaMr. Aliko Dangote, Owner, Dangote Group
MEMBERSHis Excellency General Idriss Déby Itno, President of the Republic of ChadHis Excellency Nana Akufo-Addo, President of the Republic of GhanaHis Excellency Filipe Jacinto Nyusi, President of the Republic of MozambiqueHis Excellency Alassane Dramane Ouattara, President of the Republic of Côte d’IvoireHis Excellency Alpha Condé, President of the Republic of GuineaHis Excellency Patrice Talon, President of the Republic of BeninHis Excellency George Manneh Weah, President of the Republic of LiberiaHis Excellency, Edgar Chagwa Lungu, President of the Republic of ZambiaMs. Amina J. Mohammed, Deputy Secretary-General, United NationsProfessor Jeffrey D. Sachs, Director, Sustainable Development Solutions NetworkMs. Kerry Kennedy, President, The Robert F. Kennedy Center for Human RightsDr. Betsee Parker, PhilanthropistMr. Börje Ekholm, President and Chief Executive Officer, Ericsson GroupDr. Akinwumi Adesina, President of the African Development BankMrs. Graça Machel, Chancellor, University of Cape TownDr. Ibrahim Assane Mayaki, Chief Executive Officer, NEPADDr. Hamadoun Touré, former Executive Director, SMART AfricaMr. Claudio Descalzi, Chief Executive Officer, ENIMs Lee Mi-kyung,President, Korea International Cooperation Agency (KOICA) Dr. Benedict Okey Oramah, President and Chairman, African Export-Import BankMs. Jacqueline Corbelli, Founder, Chairman and Chief Executive Officer, BrightLineMr. Shinichi KITAOKA, President, Japan International Cooperation Agency (JICA)Mr. Paul Polman, former Chief Executive Officer, Unilever
EX BOARD MEMBERSMr. Hendrik Jacobus du Toit, Chief Executive Officer, Investec Asset ManagementMr. Niclas Kjellström-Matseke, Chief Executive Officer, Perennis AfricaMr. Ashish Thakkar, Chief Executive Officer and Founder, Mara Group and Mara FoundationDr. James Mwangi, Managing Director and Chief Executive Officer, Equity Bank Kenya Limited
Copyright © Sustainable Development Goal Center for Africa (SDGC/A), 2019
Africa 2030 2019 Version, ISSN 2077-5091.
Two previous versions of the ISSN 2077-5091 were published in 2017.
The Sustainable Development Goal Center for Africa (SDGC/A) reserves all rights. No part of this publication may be re-produced, stored in a retrieval system or transmitted, in any form or by any means, electronic, mechanical, photocopying, recording or otherwise, without prior written permission from SDGC/A.
Produced by The Sustainable Development Goal Center for Africa (SDGC/A)Photographs by the SDGC/A and Millennium Promise.Published by The Sustainable Development Goal Center for Africa (SDGC/A), June 2019Editing: Jessica Hatcher, [email protected]; Graphic Design: Stefanie Freccia, [email protected]