Embed Size (px)
Citation preview

American Mineralogist, Volume 95, pages 1747–1757, 2010
0003-004X/10/1112–1747$05.00/DOI: 10.2138/am.2010.3557 1747
AFM study of the epitaxial growth of brushite (CaHPO4·2H2O) on gypsum cleavage surfaces
André Jorge Pinto,1 encArnAción ruiz-Agudo,2,* christine V. Putnis,2 Andrew Putnis,2 AmAliA Jiménez,1 And mAnuel Prieto1
1Department of Geology, Universidad de Oviedo, Jesús Arias de Velasco s/n, 33005 Oviedo, Spain 2Institut für Mineralogie, Universität Münster, Corrensstrasse 24, 48149 Münster, Germany
AbstrAct
The epitaxial overgrowth of brushite (CaHPO4·2H2O) by the interaction of phosphate-bearing, slightly acidic, aqueous solutions with gypsum (CaSO4·2H2O) was investigated in situ using atomic force microscopy (AFM). Brushite growth nuclei were not observed to form on the {010} gypsum cleavage surface, but instead formed in areas of high dissolution, laterally attached to gypsum [101] step edges. During the brushite overgrowth the structural relationships between brushite (Aa) and gyp-sum (A2/a) result in several phenomena, including the development of induced twofold twining, habit polarity, and topographic effects due to coalescence of like-oriented crystals. The observed brushite growth is markedly anisotropic, with the growth rate along the main periodic bond chains (PBCs) in the brushite structure increasing in the order [101] > [101] > [010], leading to tabular forms elongated on [101]. Such a growth habit may result from the stabilization of the polar [101] direction of brushite due to changes in hydration of calcium ions induced by the presence of sulfate in solution, which is consistent with the stabilization of the gypsum [101] steps during dissolution in the presence of HPO2–
4 ions. The coupling between growth and dissolution was found to result in growth rate fluctuations controlled by the changes in the solution composition.
Keywords: Brushite, gypsum, in situ AFM, epitaxy
introduction
Calcium phosphate minerals occur in a wide range of en-vironments within the Earth, and the study of these phases is also fundamental to understanding biomineralization within the human body (Boskey 2007; Pasteris et al. 2008). For example, brushite (CaHPO4·2H2O) is a major component of kidney and bladder stones (e.g., Wesson and Ward 2007) and has wide use as a coating for bone implants (Arsic et al. 2004). Francis and Webb (1971) showed that, due to the crystallographic similari-ties between both minerals, brushite may serve as an effective template for the nucleation of hydroxylapatite, Ca5(PO4)3(OH), one of the most important biominerals. More recently, the crystallographic relationships between brushite, pharmacolite (CaHAsO4·2H2O), and gypsum (CaSO4·2H2O) as well as the development of oriented intergrowths between these minerals have been studied by several authors (Rinaudo et al. 1994; Hina et al. 2001; Rodríguez-Blanco et al. 2007; Pinto et al. 2009). The structural similarity of brushite with gypsum and pharmacolite was first considered in depth by Heijnen and Hartman (1991), who made a comparative study of their theoretical morphologies using an A-setting for the three unit cells. These three dihydrates crystallize in the monoclinic system with nearly identical unit cells, although the space group of brushite and pharmacolite is Aa, while gypsum crystallizes in A2/a. Pinto et al. (2009) described the epitaxial overgrowth of brushite on the gypsum
cleavage surface, showing that brushite can grow onto gypsum with two alternative epitaxial relationships related by a twofold rotation axis. To explain such a phenomenon, these authors relied on the existing difference in point symmetry between substrate (2/m) and overgrowth (m). Pinto et al. (2009) discussed these epi-taxial relationships in a detailed way, on the basis of microscale observations and a periodical bond chain (PBC) study, but there is still the necessity for an in situ AFM study of the initial stages and mechanisms of the overgrowth process at the nanoscale.
Atomic force microscopy (AFM) studies on gypsum {010} cleavage surfaces have shown that the specific solution chemistry can strongly influence the dissolution and growth micro-topography. Bosbach and Hochella (1996) performed an in situ study of the inhibiting effect of foreign molecules on gypsum growth, by monitoring variations in step configuration and advancement velocity in the presence of phosphonic acid derivatives, Na-citrate, and tartaric acid. These authors suc-cessfully correlated the adsorption of foreign molecules into preferential surface sites with the observed changes in surface morphology and growth kinetics. The presence of background electrolytes has also been shown to affect the growth features of gypsum {010} surfaces (Bosbach et al. 1996). Coupled dissolution-crystallization reactions starting with gypsum as the parent solid were observed by Astilleros et al. (2007), who investigated the interaction between gypsum and Pb-bearing aqueous solutions. Combining macroscopic experiments and in situ AFM observations, these authors showed that the dissolu-tion of gypsum is accompanied by the precipitation of anglesite * E-mail: [email protected]

PINTO ET Al.: EPITAXIAl GROWTH OF BRUSHITE ONTO GyPSUM1748
Table 1. Initial composition of the experimental solutions and satura-tion indexes with respect to gypsum and brushite
Reference pH Ca (mM) S (mM) P (mM) SIGypsum SIBrushite
R-1 5.52 15.00 15.00 0.00 –0.11 –D-1 5.52 31.90 9.25 2.13 –0.12 –0.01G-1 5.52 1.50 – 75.00 – 0.14G-2 5.56 1.80 – 75.00 – 0.25G-3 5.52 2.00 – 75.00 – 0.27
(PbSO4), and that gypsum may represent an efficient tool for the sequestration of Pb.
Brushite {010} cleavage surfaces were first imaged in air us-ing AFM by Siperko and landis (1992). Scanning force micros-copy (SFM) studies on brushite growth and dissolution have been reviewed in Qiu and Orme (2008). While many of these works have dealt with brushite dissolution, there are considerably fewer studies on brushite growth. In addition to the references included in Qiu and Orme (2008), Hariadi et al. (2002) showed that the growth of brushite in the presence of supersaturated solutions can be mechanically stimulated by the AFM tip motion, because it enhances the transport of adsorbed ion clusters from upper ter-races over the growth-step edges. However, to our knowledge, this is the first in situ AFM study imaging brushite nucleation. In this framework, the objectives of this paper are (1) to present a study of the effect of phosphate-bearing species on gypsum dissolution morphologies; (2) to determine the mechanism of the epitaxial overgrowth of brushite onto the gypsum cleavage surface; and (3) to define the processes that control the brushite growth rate. Prior to the presentation of our results, the indexing of gypsum dissolution/growth steps is discussed in some depth, as it depends on the unit-cell choice and has been a source of inconsistency in several AFM studies.
exPerimentAl methodsThe interaction between gypsum cleavage fragments and phosphate-bearing,
slightly acidic, aqueous solutions was studied by AFM, using a fluid cell of a Digital Instruments Nanoscope III Multimode AFM working in contact mode under ambient temperature (23 ± 1 °C). The scanning frequency was 5 Hz, giving an average scan time of 1.5 scans per min, and the areas scanned were typically 5 × 5 or 10 × 10 µm. AFM images were collected using Si3N4 tips (Veeco Instruments, tip model NP-S20) with spring constants of 0.12 and 0.58 N m–1. Images were analyzed using the NanoScope software (version 5.12b48). The gypsum fragments were cleaved from optical quality single crystals (Alameda de la Sagra, Toledo, Spain). Gypsum cleaves readily on {010} because these lattice planes are parallel to double sheets of water molecules between which there is only weak H-bonding. The crystals were cleaved immediately before each AFM experiment, to expose fresh (010) or (010) surfaces of about 3 × 3 × 1 mm in size. The resulting working surfaces were previously examined by optical microscopy to ensure the absence of undesired macroscopic steps, cracks, or impurity particles.
The aqueous solutions (Table 1) were prepared immediately before the experiments using CaCl2, Na2SO4, H3PO4 (Sigma, reactive grade) and deionized (Milli-Q) water. The initial pH was adjusted to ~5.5 with sodium hydroxide, to have H2PO–
4 and HPO2–4 as the prevailing aqueous phosphate species and to favor
brushite precipitation (Pinto et al. 2009). The pH was measured with an inolab pH-meter, equipped with a WTW Sentix 21 electrode. A 15 mM CaCl2-Na2SO4 solution (hereafter referred to as the rinse solution, R-1) was injected in the fluid cell just prior to the experiments, to remove any particles from the substrate surface. Each experiment was started by filling the fluid cell containing the gyp-sum crystal with the experimental solution, which was maintained static with no flow through the system. Consequently, the composition of the aqueous solution changed as the system approached equilibrium. Measurements on sequences of AFM images, scanned in the same direction at known intervals of time, allowed for quantifying the changes occurring during the interaction experiments, such as etch-pit spreading (for gypsum dissolution) and advancement of growth-fronts (for brushite growth).
Activities of different chemical species and saturation indexes (SI) with respect to brushite and gypsum were calculated using PHREEQC (Parkhurst and Appelo 1999). The PHREEQC.DAT database was completed with the thermodynamic solubility product of brushite (Ksp = 10–6·59; Gregory et al. 1970). The saturation index is defined as
SI Ca anion2+=
=
log log
∙IAPK
a aKsp sp
where aCa2+ and aanion are Ca2+ and anion (SO42– and HPO4
2– for gypsum and brushite, respectively) activities and Ksp is the solubility product of the solid phase considered. Table 1 displays the initial compositions of the solutions used in the experiments, as well as the saturation indexes with respect to both brushite and gypsum. Despite the slight supersaturation (SI > 0) of solutions G-1, G-2, and G-3 with respect to brushite, no spontaneous precipitation was detected by visual inspection during solution preparation, or in subsequent hours. The composition of G-1, G-2, and G-3 was selected considering that brushite precipitation was not observed before the equilibrium with respect to gypsum was reached or an initial SIBrushite < 0.14. Spontaneous precipitation from solution occurred for an initial SIBrushite > 0.27.
The overgrowth was confirmed to be brushite by X-ray diffraction, using a PANalytical X’PERT PRO X-ray powder diffractometer equipped with a PIXcel solid-state detector. The diffractograms were obtained in glancing mode, by carrying out 2θ scans at a fixed small angle of incidence of the X-ray beam on the substrate surface. The confirmation was carried out using solution G-3 as, in this case, the overgrowth reached a thickness of more than 200 nm after 1 h of reaction time.
results And discussion
Reaction pathwaysThe interaction between gypsum and phosphate-bearing
aqueous solutions at pH ~5.5 leads to a process in which, depend-ing on the initial phosphate concentration, gypsum dissolution was followed by surface precipitation of brushite. During that process, the release of Ca2+ and SO4
2– ions from the dissolving gypsum to the aqueous solution was coupled with the reaction between Ca2+ and HPO4
2– ions to form brushite nuclei, according to the equation:
HPO2–4(aq)+CaSO4⋅2H2O(s) ↔ CaHPO4⋅2H2O(s)+SO2–
4(aq) (1)
where the subscripts aq and s represent aqueous species and solid phases, respectively. The specific replacement behavior depended on the initial solution composition, which in the present case allowed for distinguishing two main types of experiments. Starting from solution D-1, the aqueous solution remained slightly undersaturated with respect to brushite during the whole process, so that only gypsum dissolution occurred. Since the experiment took place in a batch setting, during the process the system tended to approach thermodynamic equilibrium, which in this case implies saturation with respect to gypsum. This type of experiment is suitable to study the extent to which the presence of phosphate ions affects the gypsum dissolution behavior and, particularly, the micro-/nano-topographic features of the {010} surfaces. In contrast, starting from solutions G-1, G-2, and G-3, gypsum dissolution was immediately followed by nucleation and growth of brushite and this replacement dissolution-crystallization process continued until simultane-ous equilibrium with respect to both brushite and gypsum was reached. AFM experiments using these solutions are therefore suitable to determine the mechanism of overgrowth of brushite onto the gypsum cleavage surface. In the next sections, we pres-ent these two types of experiments separately.
PINTO ET Al.: EPITAXIAl GROWTH OF BRUSHITE ONTO GyPSUM 1749
Unit-cell choice and indexing of dissolution and growth morphologies
The existence of several alternative gypsum unit-cell choices (I-centered, F-centered, and various A-centered settings) is well known in the fields of mineralogy and crystal growth (e.g., Hei-jnen and Hartman 1991; Chang et al. 1996). Such alternative cells correspond to different settings of the space group number 15, generically symbolized by the standard C2/c setting (Hahn 2005). Unfortunately, this fact has frequently been disregarded in AFM studies on gypsum, which has led to several inconsistencies and misunderstandings in interpreting the crystallographic identity of the growth and dissolution steps (cf. Bosbach and Rammensee 1994; Bosbach et al. 1995; Bosbach and Hochella 1996; Fan and Teng 2007). For this reason, to compare the present results with previous work, the problem arising from the choice of the unit cell is addressed.
The crystal structure of gypsum is often described in an I2/a space group setting (e.g., Pedersen and Semmingsen 1982; Cole and lancucki 1974) where the c-axis does not correspond to the morphological c-axis, which is the direction along which the {010} plates are usually elongated (the needle axis in fibrous gypsum). In an attempt to settle this question, Heijnen and Hart-man (1991) proposed to use the A2/a setting of De Jong and Bouman (1939), such that the structural c-axis coincides with the morphological one. A correlation between the primary facets and step directions in the different space group settings can be found in Qiu and Orme (2008). The problem arises when some authors use a morphological criterion (c || elongation) to index the elongation direction observed in growth islands or dissolution etch pits and, at the same time, the I2/a space-group setting to describe the structure and calculate angles between steps edges. For instance, in two pioneer AFM studies on gypsum growth and dissolution, Bosbach and co-workers (Bosbach and Rammensee 1994; Bosbach et al. 1995) indexed the elongation direction as [001], but then they chose the I-centered cell to describe the structure. However, using an I2/a setting, the elongation direc-tion is not [001] but [101]. Therefore, the typical acute angle of ~53° observed between step edges is not the angle between [001]I and [100]I, but the angle between [101]I and [001]I or between [001]A and [101]A using A2/a. In fact, Bosbach and co-workers chose the De Jong and Bouman (1939) A2/a unit cell in later papers (Bosbach and Hochella 1996; Bosbach et al. 1996) and described the arrow-like shapes (≈53°) observed in previous papers (Bosbach et al. 1995) as determined by [001]A and [101]A steps. More recently, Fan and Teng (2007) indexed the elongation direction of the typical gypsum dissolution etch pits as [001], using a morphological criterion. However, a careful inspection indicates that these authors applied an I2/a setting (they used the generic symbol C2/c but did not specify the unit-cell choice) to construct their explanatory structural schemes and calculate the angles between steps. This is clear if one considers the structure of the [001] step presented in that paper, which is described as terminated by (either Ca2+ or SO4
2–)
like-charge centers. Such structure corresponds to the mono-layer step [001]I = [101]A (Fig. 1a), but this direction is not the elongation direction of the etch pits. Actually, the elongation direction is [101]I = [001]A. Therefore, although these authors claim the absence of [101] dissolution steps, that observation
arises from a misunderstanding. It is also worth noting that the classical, morphological unit cell differs from both the I-centered cell and the A-centered cell. The old morphological cell actu-ally corresponds to an F-centered cell (Chang et al. 1996) that contains 8 instead of 4 formula units. Such a cell was chosen to get [001] and [100] parallel to the dominant crystal edges in the typical gypsum morphologies. In summary, [001]F || [001]A || [101]I and [100]F || [101]A || [001]I.
To understand the indexing of the morphological features observed in the present paper, Figure 2a shows the relationships between the most important forms and directions in the gypsum structure, using an A2/a setting. Hereafter, we refer to this unit-cell setting. As can be observed, the most acute angle (~53°) occurs between [001] and [101], whereas the angle between [001] and [100] is significantly larger (~66°). These three directions correspond to the crystal edges determined by intersection of the pinacoid form {010} with the side forms {120}, {111}, and {011}. In the typical gypsum habit, the form {111} dominates over {011}. The parallelograms drawn on the pinacoid face (010) represent two hypothetical etch pits outlined by either [001] and [100] or [001] and [101] in which the opposite slopes of [100] and [101] can be observed. As Fan and Teng (2007) pointed out, it is worth noting that on (010) the shapes of these two etch-pit types (Fig. 2b) are mirror images of the ones on (010) (Fig. 2a). In the presentation of results, we have chosen AFM images with (010) faces exposed, to deal with orientations analogous to those in Figure 2a. Finally, with the aim of facilitating comparison with gypsum, we have not chosen the setting Ia of the unit cell that appears in the original report of the brushite structure (Curry and Jones 1971), but the setting Aa chosen by Heijnen and Hartman (1991).
HPO42- Ca2+SO42-
[101]
[001]
+
+
+
-
-
-
-
[100]+
+
+
--
--
--
--
--
-a
[101]
b
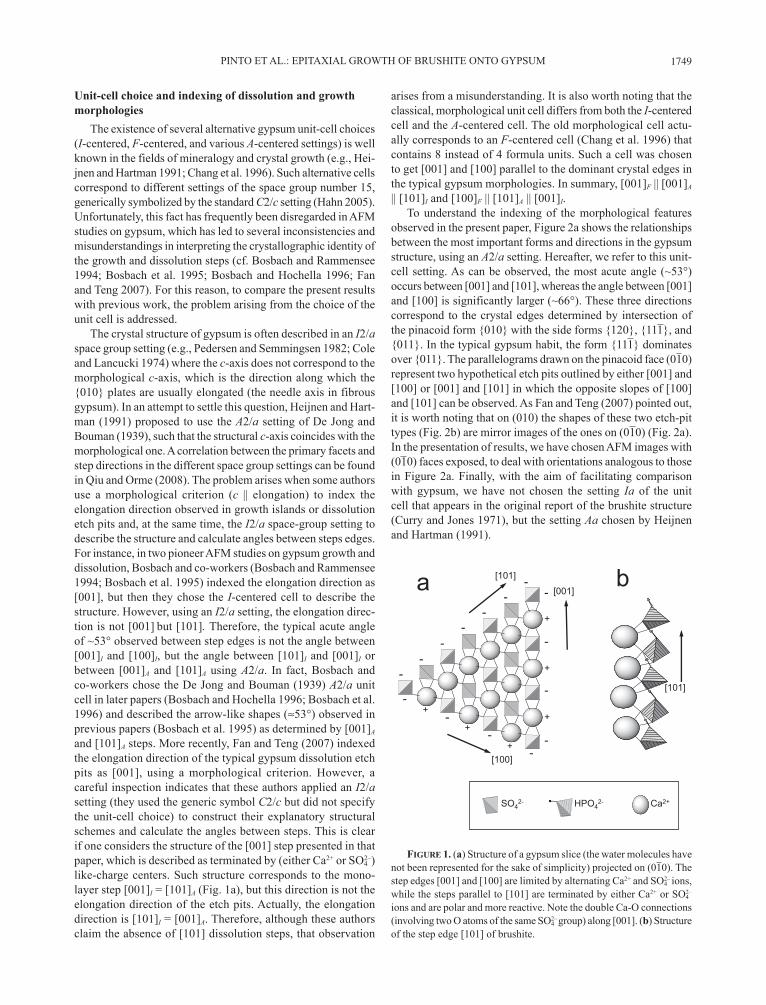
Figure 1. (a) Structure of a gypsum slice (the water molecules have not been represented for the sake of simplicity) projected on (010). The step edges [001] and [100] are limited by alternating Ca2+ and SO4
2– ions, while the steps parallel to [101] are terminated by either Ca2+ or SO4
2–
ions and are polar and more reactive. Note the double Ca-O connections (involving two O atoms of the same SO4
2– group) along [001]. (b) Structure of the step edge [101] of brushite.

PINTO ET Al.: EPITAXIAl GROWTH OF BRUSHITE ONTO GyPSUM1750
in the dissolution topography of the {010} surfaces of gypsum. A detailed description of the bond arrangement along these PBCs, including bond-valence calculations, has been given by Rodríguez-Blanco et al. (2007).
Gypsum dissolution in the presence of phosphate-bearing aqueous solutions
Figure 3b displays some typical etch pits developed on the (010) surface of a gypsum cleavage fragment in contact with solution D-1. The slight initial undersaturation (SI = −0.01) of the reacting solution with respect to brushite precluded the pre-cipitation of this mineral during the experiment, which allowed us to study the influence of the aqueous phosphate species on the dissolution nano-/micro-topography. As can be observed, the dissolution features are relatively similar to those shown in Figure 3a. When new etch pits “nucleated” on the surface, their shape initially coincided with that of the etch pits formed in contact with the rinse solution, with an outline defined by [001] and [101] steps and an average length/width ratio for these experiments of ~6–7. However, in contact with the phosphate-bearing solution, the [101] steps seemed to be more stable and remained crystal-lographically well defined after prolonged dissolution times. Steps are regarded as more stable or less stable according to their significance in the morphology of the crystal. In contrast, the [001] steps were comparatively less stable than in contact with the rinse solution. As dissolution progressed, the inner monomolecular [001] steps lost their crystallographic identity and became curved. This was particularly apparent in inner steps within deep etch pits as shown in Figures 3c–3d.
The changes in step morphologies during crystal growth of gypsum in the presence of foreign aqueous species have been previously described in several papers (e.g., Bosbach and Ho-chella 1996; Bosbach et al. 1996). For instance, Bosbach and Hochella (1996) showed that the presence of growth inhibitors changed the morphology of the [101] steps, which developed curved or jagged shapes depending on the inhibitor concentra-tion. During dissolution, as in crystal growth processes, the development of curved steps is usually interpreted in terms of surface adsorption of co-solutes that locally change the “stabil-ity” of the step structure. The phenomenon is not surprising since the presence of co-solutes can affect dissolution through a blocking mechanism in which adsorbed species at step edges form a barrier to slow step retreat (e.g., Arvidson et al. 2006; Pérez-Garrido et al. 2007; Ruiz-Agudo et al. 2009). In the pres-ent case, the development of curved steps can be explained as a result of the adsorption of phosphate species, mainly HPO2–
4 and monovalent H2PO–
4 ions, on the initially straight [001] steps. The phenomenon was particularly visible in deep etch pits, in which the fluid was stagnant and both dissolution and adsorption/desorption are expected to be sluggish. Nevertheless, there are alternative explanations that may well explain the stabilization of the steps parallel to [101].
Kowacz and Putnis (2008) studied the dissolution behavior of barite (BaSO4) in the presence of different background elec-trolytes and concluded that changes in etch-pit morphologies involving development of uncommon steps are not necessarily due to the adsorption of foreign ions at the step fronts. For in-stance, highly reactive steps with fronts limited by ions of the
Figure 2. (a) Typical morphology of a gypsum crystal indexed using an A2/a space group setting. The parallelograms on the face (010) represent two etch pits outlined by either [001] and [100] or [001] and [101]. Note the opposite slopes of [100] and [101] with respect to [001]. (b) Configuration of the two etch-pit types on (010). Note that on (010), the shapes of these two etch-pit types are mirror images of those on (010) and that the two crystal schemes cannot be superimposed on each other through any in-plane rotation operation.
AFM imaging of the initial gypsum surfaceFigure 3a shows an AFM deflection image obtained from the
contact between gypsum and solution R-1. This aqueous solution is slightly undersaturated (SI = −0.11) with respect to gypsum, allowing the visualization of dissolution morphologies on the cleavage surface. Dissolution takes place by a layer-by-layer mechanism, controlled by the relative retreat movement of [001], [101], and [100] steps, with heights of ~7.6 Å, corresponding to half of the b-axis periodicity. These steps can be isolated, but generally delimit etch pits elongated on the [001] direction. As can be observed in Figure 3a, the etch pit labeled as type 1 is outlined by [001] and [101] steps. The type 2 etch-pit is outlined by [001] and [100] steps and appears less frequently. Neverthe-less, whereas the crystallographic identity of the [001] steps along the elongation direction is well defined, the identity of [101] and [100] is frequently lost and most etch pits developed curved, non-singular tips.
With the exception of the indexing problem, all these features are in good agreement with those described in previous papers (Bosbach and Rammensee 1994; Bosbach et al. 1995; Fan and Teng 2007) for gypsum dissolution morphologies developed in near-equilibrium conditions. The gypsum {010} structural planes constitute F-forms (Heijnen and Hartman 1991) with three PBCs oriented along [100], [001], and [101]. There is a fourth PBC along [201], but it is energetically much less important than the other three. The repeating period on [001] is longer than that on [100], but the PBC along [001] is stronger due to the double Ca-O bonds (involving two O atoms of the same SO4
2– group) along this direction (see bonds in Fig. 1a). The PBC along [101] is a hybrid of the other two, consisting of a zigzag arrangement of alternating double and single Ca-O links. These features explain the stability and morphological predominance of the [001] steps

PINTO ET Al.: EPITAXIAl GROWTH OF BRUSHITE ONTO GyPSUM 1751
same sign can become more stable (less reactive) in the presence of background electrolytes. This can occur because increasing ion hydration by salt addition reduces both the repulsive inter-actions between like-charged ions and the attractive interac-tions between unlike-charged ions due to the charge-screening capacity of water. Hence, the presence of electrolytes may stabilize steps bonded by either Ca2+ or SO4
2– ions (i.e., [101]
steps), whereas steps bonded by alternating Ca2+ and SO42– ions
(i.e., those parallel to [001] and [100]) may be less stable in salt solutions (see the step structures in Fig. 1a). This effect is not necessarily related to the presence of a high ionic strength, but it is related to the specific characteristics of the background ions present in solution, and it seems to be particularly relevant in the presence of kosmotropes (i.e., ions with high charge den-
Figure 3. AFM image of the gypsum (010) surface in contact with (a) solution R-1, (b–d) solution D-1. The directions [001], [101], and [100] correspond to an A2/a space-group setting. The etch pit labeled 1 in a is outlined by [001] and [101] steps, whereas the etch pit labeled 2 is outlined by [001] and [100]. Note the perturbation of [001] steps during gypsum dissolution in contact with solution D-1 (SIGypsum = −0.12, SIBrushite = −0.01), resulting in the development of etch pits parallel to [101] (c–d).

PINTO ET Al.: EPITAXIAl GROWTH OF BRUSHITE ONTO GyPSUM1752
sity). Ruiz-Agudo et al. (2010) found a similar effect for calcite dissolution in the presence of F–. Both sulfate and phosphate species have a strong kosmotrope character (Collins 2004). Therefore, in this case, variations in etch pit morphology could be explained without considering specific interactions between background electrolytes in solution and the gypsum surfaces. Furthermore, as shown later, a similar effect may account for the observed stabilization of the [101] direction in brushite in the presence of sulfate. This hypothesis could be tested by performing growth and dissolution experiments using different background electrolytes. However, such studies are beyond the scope of the present work.
AFM imaging of the epitaxial overgrowth of brushite on gypsum
General features. In the case of the experiments performed with solutions G-1, G-2, and G-3, the initial dissolution of gyp-sum was followed by crystallization of brushite on the gypsum surface. As shown in Table 1, these three initial solutions are moderately supersaturated with respect to brushite and highly un-dersaturated (zero sulfate concentration) with respect to gypsum. Despite these initial conditions of supersaturation, no brushite precipitation was detected by visual inspection at the beginning of the experiments. Only after a period of fast gypsum dissolution, the increase in calcium concentration produced a supersaturation
Figure 4. Sequence of AFM images showing the epitaxial overgrowth of brushite on the (010) gypsum cleavage surface (Br = brushite, Gy = gypsum). The experiment was carried out using solution G-1. The reaction time is displayed in the lower right part of the corresponding image. The newly formed crystals are elongated on [101] and can be oriented either with [101] or [101] parallel to the [101] direction of the gypsum substrate. The edges [101] and [001] are also shown.
PINTO ET Al.: EPITAXIAl GROWTH OF BRUSHITE ONTO GyPSUM 1753
threshold high enough to allow for brushite nucleation. Even so, in initially flat zones, with low step density and wide terraces, brushite nucleation was not detected. In these areas, only the typi-cal layer-by-layer dissolution of gypsum was observed, involving movement of [001], [101], and [100] steps, and the formation of more or less shallow etch pits. Such a range of metastability is not unusual when one considers the solubility of brushite in the light of the classical nucleation theory, which in fact connects metastability, interfacial tension, and solubility (see e.g., Sangwal 1989). In a converse scenario, Tang et al. (2003) reported the existence of a slight level of metastability for the dissolution of brushite in contact with undersaturated solutions. A rigorous, in-depth study of the nucleation rate cannot be performed because in our experimental setup (i.e., batch experiments), chemical information on the evolving composition of the solution (i.e., saturation state) cannot be obtained.
Brushite nucleation was only detected within enhanced dis-solution areas such as high step edges, and resulted in arrow-like step edge morphologies, which are reminiscent of the gypsum growth fronts described by Bosbach and Hochella (1996). The angular relationships indicate that these forms are outlined by [101] and [001] step edges, occasionally truncated by short [100] segments. Figure 4 shows a growth sequence obtained during the interaction of the surface (010) of gypsum with solution G-1. Immediately after contact with solution, gypsum dissolved quickly and the supersaturation with respect to brushite increased
dramatically. Under these conditions, surface nucleation of brush-ite can be detected after ~60 s. Initially, the brushite nuclei did not form on the (010) surface, but laterally attached to the [101] step edges (Fig. 4a). However, these initial nuclei quickly spread over the (010) surface to form islands with a typical thickness of ~15–16 Å (approximately one unit-cell height along the b-axis), which grew with their elongation direction parallel to the gypsum [101] steps. As growth proceeded, the islands quickly evolved to thick three-dimensional crystals and assumed better-defined contours, allowing the measurement of angles between edges. The side faces, however, were poorly defined, precluding direct indexing. As can be seen in Figure 4d, the dominant {010} form is outlined by [101] and [101] edges. The [001] edges also ap-peared, and developed virtually parallel to the [001] direction of gypsum, but tended to disappear during growth.
The most stable forms of brushite crystals grown in pure solu-tions have been determined from etch-pit morphologies using SEM (Ohta et al. 1979) and from scanning probe microscopy (SPM) observations of etch pits (Scudiero et al. 1999) and growth hillocks (Tang et al. 2005). These faces are {010}, {120}, {111}, and {111}. The macroscopic habit is dominated by the {010} form, and the steps [001], [101], and [101] define the triangular etch pits or the growth hillocks observed in most dissolution and growth studies of brushite (010) faces. However, when sulfate is present in solution (in our case due to gypsum dissolution), the brushite crystals that nucleated on gypsum cleavage surfaces do not show the [001] edge as a predominant direction and tend to be elongated on [101] (Pinto et al. 2009; Rinaudo et al. 1994). It is worth noting that the faster the growth rate along a given PBC, the slower the growth rate normal to such direction and the more stable the steps parallel to that direction, in this case those parallel to [101]. As already stated for gypsum dissolution, this may be explained by the stabilization of steps bonded by ions with the same charge ([101] steps, Fig. 1b) and destabilization of steps bonded by alternating Ca2+ and HPO4
2– ions ([001] and [101] steps) due to increasing ion hydration by the presence in solution of ions with high charge density (i.e., SO4
2–).The fact that nucleation does not occur on flat areas of the
gypsum {010} cleavage surfaces can be explained if one consid-ers that, on this surface, the growth layers are linked between them only through weak hydrogen bonds. Epitaxial nucleation is then favored by a more or less strong adhesion between sub-strate and overgrowth and is more likely to occur at the polar and more reactive [101] steps (see step structures in Fig. 1a) than on the cleavage surface. Previous ex situ observations (Pinto et al. 2009) pointed toward a “Stranksy-Krastanov” mechanism
(Chernov 1984) for the epitaxial growth of brushite onto gypsum, and suggested a bi-dimensional reticular control. However, the present results clearly indicate that brushite does not nucleate on the gypsum cleavage surface but laterally nucleates on [101] step edges formed in high dissolution areas. The fact that the initial growth nuclei quickly spread over the gypsum surface to form two-dimensional islands is a secondary consequence of the growth process, which, at the most, should be considered a Volmer-Weber process, involving development of more or less thick three-dimensional crystals. The Volmer-Weber model is characteristic of substrate–overgrowth pairs showing both low adhesion and large linear misfit (Chernov 1984).
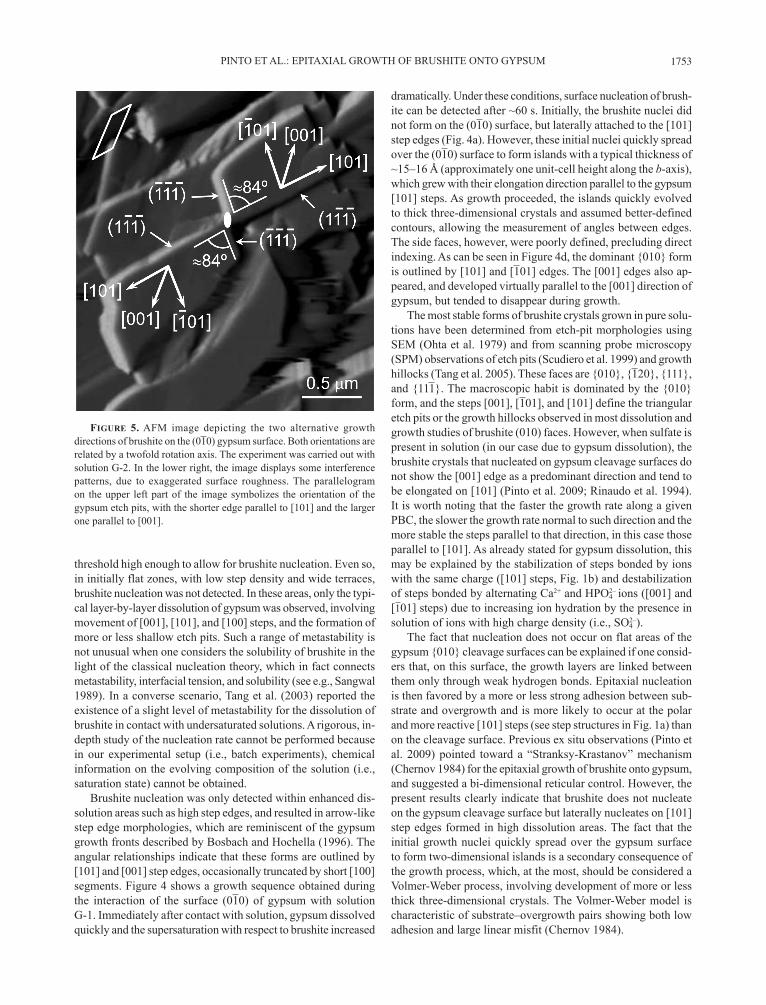
Figure 5. AFM image depicting the two alternative growth directions of brushite on the (010) gypsum surface. Both orientations are related by a twofold rotation axis. The experiment was carried out with solution G-2. In the lower right, the image displays some interference patterns, due to exaggerated surface roughness. The parallelogram on the upper left part of the image symbolizes the orientation of the gypsum etch pits, with the shorter edge parallel to [101] and the larger one parallel to [001].
PINTO ET Al.: EPITAXIAl GROWTH OF BRUSHITE ONTO GyPSUM1754
Induced twining. It is worth noting that the newly formed brushite crystals can be oriented either with [101] or [101] parallel to the [101] direction of gypsum. This phenomenon becomes evident by comparing the orientation of different crystals in Figure 4 (see Fig. 4c), but it is more clearly shown in Figure 5, where the two alternative orientations of brushite can be observed at a higher magnification. These two orientations are related by a twofold axis, which defines the twin law. In the image, the brushite crystals have the (010) surface exposed. Both crystals are elongated on [101] and show side faces whose crystallographic identity will be discussed later. This observa-tion confirms previous observations by Pinto et al. (2009), who explained this type of induced twinning to be the result of the difference in symmetry between substrate and overgrowth. Gyp-sum crystallizes in the centrosymmetric point group 2/m (space group A2/a) and has no polar directions. However, brushite crystallizes in the non-centrosymmetric point group m (space group Aa), with all structure directions, except [010], being polar. Thus, brushite can grow onto the gypsum substrate with two alternative, statistically equivalent, orientations related by a twofold rotation axis. In other words, the twin law reproduced the symmetry axis present in the gypsum substrate, but absent in the brushite overgrowth.
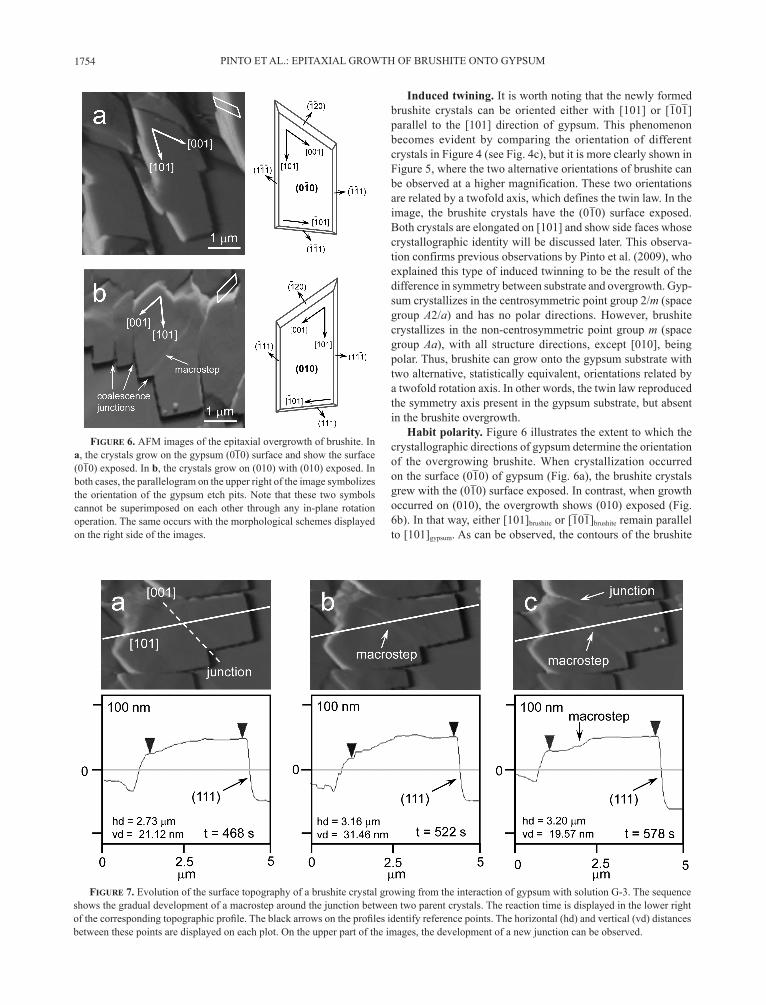
Habit polarity. Figure 6 illustrates the extent to which the crystallographic directions of gypsum determine the orientation of the overgrowing brushite. When crystallization occurred on the surface (010) of gypsum (Fig. 6a), the brushite crystals grew with the (010) surface exposed. In contrast, when growth occurred on (010), the overgrowth shows (010) exposed (Fig. 6b). In that way, either [101]brushite or [101]brushite remain parallel to [101]gypsum. As can be observed, the contours of the brushite
Figure 7. Evolution of the surface topography of a brushite crystal growing from the interaction of gypsum with solution G-3. The sequence shows the gradual development of a macrostep around the junction between two parent crystals. The reaction time is displayed in the lower right of the corresponding topographic profile. The black arrows on the profiles identify reference points. The horizontal (hd) and vertical (vd) distances between these points are displayed on each plot. On the upper part of the images, the development of a new junction can be observed.
Figure 6. AFM images of the epitaxial overgrowth of brushite. In a, the crystals grow on the gypsum (010) surface and show the surface (010) exposed. In b, the crystals grow on (010) with (010) exposed. In both cases, the parallelogram on the upper right of the image symbolizes the orientation of the gypsum etch pits. Note that these two symbols cannot be superimposed on each other through any in-plane rotation operation. The same occurs with the morphological schemes displayed on the right side of the images.

PINTO ET Al.: EPITAXIAl GROWTH OF BRUSHITE ONTO GyPSUM 1755
crystals on (010) and (010) cannot be superimposed upon each other through any in-plane rotation operation. The phenomenon is exactly the same as that described for gypsum etch pits (see Fig. 2). However, unlike gypsum, the brushite crystals showed a polar shape, with the two extremes along [101] being different. This is the reason that just one orientation of the triangular etch pits is observed in dissolution experiments performed in pure solutions (e.g., Scudiero et al. 1999). In brushite, because of the Aa symmetry, the face (hkl) is not equivalent to its polar coun-terpart (h k l), and this induced the habit to be polar. The schemes on the right side of the images in Figure 6 show a simulation of the crystal habit in the presence of sulfate, including the side faces. The edges [101] were the most developed and this makes the domes {111} and {1 11} the most important side forms. The dome {111} was also very well defined, but its parallel coun-terpart {1 1 1} frequently did not appear. The dome {120} had a larger development, but it was, in general, poorly defined, had a curved form, and tended to disappear during the growth process. As already stated, this could be related to changes in hydration induced by the presence of sulfate and the charge-screening capacity of water molecules. Finally, the parallel counterpart, {120}, of this last form was not observed.
It is worth noting that the previous indexing was carried out assuming the hierarchy of counterparts proposed by Heijnen and Hartman (1991), who consider {120} > {120}, {111} > {1 11}, and {111} > {1 1 1}. Obviously, the absolute polarity of the experimental habit with respect to the structure is not known. Nevertheless, interchanging the indices between counterparts does not alter the previous conclusions.
Coalescence effects. As the brushite crystals spread on the surface, they came into contact with each other and merged to form larger overgrowth areas. When individuals with opposite [101] orientations met, the resulting aggregate is a twofold twin. However, when the individuals have the same crystallographic orientation, they merged to form a single bigger crystal. This second type of coalescence was responsible for the typical stair-like outlines that can be observed in many crystals, as shown in
Figure 6b. When the structure of the merging crystals did not exactly match, the junction line between them became an obstacle for the advancement of growth steps, which tended to pile up. Consequently, the merged crystal developed a macrostep on its surface. The effect is also shown in Figure 6b, in which a large macrostep, formed by coalescence, crossed the (010) surface of the crystal, roughly parallel to [001]. This macrostep was not merely a result of the different thickness of the parent crystals but developed sometime after coalescence. Figure 7 shows an AFM growth sequence of this typical crystal, and the corresponding height profiles in nanometers. From the profiles shown, it be-comes clear that the macrostep developed progressively on (010) during the growth process. In the same figure, one can notice the gradual development of a new junction between the main crystal and another one on the upper part of the image.
Figure 7 shows that the (010) surface is rather irregular. Apart from the macrostep previously described, the surface shows a diversity of heights. The topography changes considerably be-tween images and, occasionally (Fig. 7b), local elevated areas with ~8 Å height (~½ brushite unit cell) can also be detected, probably indicating ongoing surface nucleation. In contrast, the profile of the face (111) remains quite flat.
Growth rate fluctuations. Figure 8 illustrates the growth behavior of a typical brushite crystal formed by the interaction of gypsum and solution G-1. Figure 8 shows the crystal lengths along [101], [101], and [010] (height) as a function of time. This is a non-standard measure of the step kinetics, but it is commonly used in AFM studies of mineral growth. Figure 8b represents the evolution of the step advancement rates (obtained as the deriva-tive of length with respect to time) along the same directions. As previously shown and discussed, the anisotropic growth of brushite in the presence of sulfate leads to the development of crystals elongated on [101]. The general length relationship is [101] > [101] > [010], and the much slower growth rate along [010] causes the crystals to have tabular shapes.
Whereas the plot in Figure 8a is indicative of the crystal habit, the evolution of growth rates along the main PBCs of
Figure 8. (a) Evolution of the length of a typical brushite crystal along [101], [101], and [010] (height). The curves represent a cubic B-spline connection among the experimental values. (b) Evolution of the step advancement rates. Both plots correspond to the same crystal, formed by the interaction of gypsum with solution G-1.

PINTO ET Al.: EPITAXIAl GROWTH OF BRUSHITE ONTO GyPSUM1756
the brushite structure shown in Figure 8b indicates the changes occurring during the entire interaction process, until thermody-namic equilibrium with respect to both brushite and gypsum was reached. As can be observed, the maximum growth rates were ~10.2, 4.2, and 0.6 nm/s, along the directions [101], [101], and [010], respectively. The maximum values along [101] and [101] are slightly higher than those observed by Tang et al. (2005) at a constant SI = 0.20, which suggests that brushite growth oc-curred in our experiments at supersaturations above this value. The curves corresponding to [101] and [101] run fairly paral-lel to each other, and reflect two growth pulses. Initially, the spreading rates along both directions increased rapidly, reach-ing maximal values (at times between ~80–150 s) of ~9 and 4 nm/s for [101] and [101], respectively. Then, the rates quickly decrease to reach, minimum values of ~3 and 1 nm/s along [101] and [101], respectively, after ~225 s of reaction time. After this minimum, a new event of “accelerating” growth was observed from ~225 to 300 s, when maximal ~11 and 4 nm/s spreading rates were achieved. Finally, the rates quickly decreased to reach a virtually null value at ~525 s of reaction time. The growth in thickness (i.e., along the [010] direction) behaved in a different way, showing only a clear maximum after which the growth rate gradually decreased.
The general trend, including the growth rate hierarchy and the existence of two growth fluctuations, was completely repro-ducible both in different crystals in the same experiment and across repeated experiments using solutions G-1, G-2, or G-3. However, the specific quantitative values changed from one crystal to another and there was no robust correlation between the initial saturation index and the measured nanoscale growth rates. This is understandable as in the present case, brushite nucleation only occurred in areas of high dissolution, where the gypsum [101] step fronts served as nucleation hosts due to their higher attachment capacity. The kinetics of gypsum dissolution in free-drift experiments has been demonstrated to be mostly controlled by diffusion through a concentration boundary layer established above the surface (Christofferson and Christofferson 1976). Therefore, the initial gypsum topography and the local step density and roughness can be expected to affect the con-centration gradients around each specific brushite crystal and, hence, its individual growth rate.
Independent of the specific quantitative values, the described results point toward a rate controlling effect of the solution composition on the coupling between growth and dissolution. That growth may occur in cycles is not unusual. The presence of long and short period oscillations in crystallization processes has been widely reported in the crystal growth literature (e.g., García-Ruiz et al. 1987; Ristic et al. 1996; Vekilov et al. 1996; li and Tsukamoto 2001), although the causes remain, in some cases, undefined or controversial. In the present case, crystallization of brushite and dissolution of gypsum occur by different mecha-nisms, and have, therefore, different kinetics. As gypsum quickly dissolves, supersaturation with respect to brushite dramatically increases leading to an initial fast growth of brushite nuclei. As a consequence, Ca2+ concentration in solution begins to decrease. Consequently, the supersaturation decreases, and the growth of brushite slows down. At that point, since equilibrium has not yet been attained with respect to gypsum, substrate dissolution
continues around the nearly non-growing brushite crystals. The newly released Ca2+ ions transfer to the vicinity of the brushite surfaces and, when a certain supersaturation threshold with respect to brushite is again attained, a new growth pulse begins. The process stops after two cycles, when equilibrium with respect to both brushite and gypsum is assumed to occur.
Obviously, the proposed mechanism implies the existence of a threshold of supersaturation below which the crystal grows very slowly. Such a critical supersaturation may be related to a change in the growth mechanism (e.g., two-dimensional nucleation), but can also be associated with adsorption of foreign ions or with formation of a partly ordered solution layer or “protector” preventing the growth (Chernov 1984). In this framework, the fact that the growth rate along [010] does not follow a two-cycle pattern, points toward a different growth behavior for (010). On the one hand, the topography of this surface shows irregulari-ties resulting from a diversity of effects (see Fig. 7), which are a source of growth rate variations. On the other hand, (010) is less reactive than the side faces, since the (020) growth layers are linked between them only through weak hydrogen bonds. Under these conditions, the supersaturation threshold for two-dimensional nucleation on (010) could be high enough to prevent the beginning of a second cycle of fast growth.
In a recent paper, Arsic et al. (2004) studied the liquid order-ing at the brushite (010)-water interface by means of surface X-ray diffraction. These authors conclude that such an interface consists of two water bilayers, with different ordering properties, which can be the cause for the moderate solubility of brushite at room temperature. In general terms, the first bilayer exhibits high levels of ordering and can be considered as a part of the brushite structure. The second water bilayer, however, displays ordering only perpendicularly to the (010) interface and should inhibit the diffusion of both water molecules and solvated ions to the crystalline interface. Such water layers can offer a consid-erable resistance to face growth, i.e., both to step advancement and generation. Again, the supersaturation needed to overcome this resistance could be high enough to prevent the beginning of a second cycle.
concluding remArks
The previous observations on the epitaxial overgrowth of brushite are consistent with the description made by Pinto et al. (2009) from ex situ SEM imaging. However, the present study reveals some details that were impossible to observe ex situ at a lower resolution. The proposed growth forms and edge directions, with {111} parallel to [101] and less developed than {111}, correspond to the morphologies described previously for the growth of brushite from supersaturated solutions in the presence of sulfate ions (Rinaudo et al. 1994; Pinto et al. 2009). The presence of SO4
2– could stabilize steps bonded by either Ca2+ or HPO4
2– ions (i.e., [101] steps), whereas steps bonded by alternating HPO4
2– and Ca2+ (i.e., those parallel to [001]) may be less stable in salt solutions. Thus, brushite crystals become elongated along [101]. A similar effect may be induced by the presence of HPO4
2– during gypsum dissolution. The generation of macrosteps associated with the coalescence of crystallites and the development of growth rate fluctuations are two striking findings, which illustrate the difficulty of correlation between

PINTO ET Al.: EPITAXIAl GROWTH OF BRUSHITE ONTO GyPSUM 1757
different observation scales. These in situ AFM experiments have elucidated the initial stages of epitaxial growth and this has given a new view of the replacement mechanism.
AcknowledgmentsThis research project was funded by the European Commission (grants MRTN-
CT-2006-035488 and PITN-GA-2008-215360) and the Ministry of Science and Education of Spain (grant CGl2007-65523-CO2-02/BTE). We thank two anony-mous referees and C.A. Orme for the constructive comments that have helped to improve the overall quality of our paper. The research at the University of Münster is supported by the Deutsche Forschungsgemeinschaft (DFG).
reFerences citedArsic, J., Kaminski, D., Poodt, P., and Vlieg, E. (2004) liquid ordering at the
Brushite (010)-water interface. Physical Review B, 69, 245406.Arvidson, R.S., Collier, M., Davis, K.J., Vinson, M.D., Amonette, J.E., and luttge,
A. (2006) Magnesium inhibition of calcite dissolution kinetics. Geochimica et Cosmochimica Acta, 70, 583–594.
Astilleros, J.M., Rodriguez-Blanco, J.D., Godelitsas, A., Fernández-Díaz, l., and Prieto, M. (2007) Interaction of gypsum with Pb-bearing aqueous solutions. Geochimica et Cosmochimica Acta, 71, A42.
Bosbach, D. and Hochella, Jr., M.F. (1996) Gypsum growth in the presence of growth inhibitors: a scanning force microscopy study. Chemical Geology, 132, 227–236.
Bosbach, D. and Rammensee, W. (1994) In situ investigation of growth and dissolution on the (010) surface of gypsum by scanning force microscopy. Geochimica et Cosmochimica Acta, 58, 843–849.
Bosbach, D., Jordan, D., and Rammensee, W. (1995) Crystal growth and dissolu-tion of gypsum and fluorite: An in situ Scanning Force Microscope study. European. Journal of Mineralogy, 7, 267–278.
Bosbach, D., Junta-Rosso, J.l., Becker, U., and Hochella, Jr., M.F. (1996) Gypsum growth in the presence of background electrolytes studied by scanning force microscopy. Geochimica et Cosmochimica Acta, 60, 3295–3304.
Bosbach, D., Hall, C., and Putnis, A. (1998) Mineral precipitation and dissolution in aqueous solution: In-situ microscopic observation on barite (001) with atomic force microscopy. Chemical Geology, 151, 143–160.
Boskey, A.l. (2007) Mineralization of bones and teeth. Elements, 3, 385–391.Chang, l.l.I., Howie, R.A., and Zussman, J. (1996) Rock-Forming Minerals:
Non-silicates: Sulphates, Carbonates, Phosphates, Halides (2nd edition), vol. 5b, 383 p. longman, Essex.
Chernov, A.A. (1984) Modern Crystallography III: Crystal Growth, 246 p. Springer-Verlag, Berlin.
Christofferson, J. and Christofferson, M.R. (1976) The kinetics of dissolution of calcium sulphate dihydrate in water. Journal of Crystal Growth, 35, 79–88.
Cole, W.F. and lancucki, C.J. (1974) A refinement of the crystal structure of calcium sulphate dihydrate. Acta Crystallographica, B30, 921–929.
Collins, K.D. (2004) Ions from the Hofmeister series and osmolytes: Effects on pro-teins in solution and in the crystallization process. Methods, 34, 300–311.
Curry, N.A. and Jones, D.W. (1971) Crystal structure of brushite, calcium hydrogen ortophosphate dihydrate: A neutron-diffraction investigation. Journal of the Chemical Society A, 3725–3729.
De Jong, W.F. and Bouman, J. (1939) Das reziproke aund das Bravaissche Gitter von Gips. Zeitschrift für Kristallographie, 100, 275–276.
Fan, C. and Teng, H. (2007) Surface behavior of gypsum during dissolution. Chemical Geology, 245, 242–253.
Francis, M.D. and Webb, N.C. (1971) Hydroxyapatite formation from a hydrated calcium monohydrogen phosphate precursor. Calcified Tissue International, 6, 335–342.
García-Ruiz, J.M., Santos, A., and Alfaro, E.J. (1987) Oscillatory growth rates in single crystals growing under diffusional control. Journal of Crystal Growth, 84, 555–558.
Gregory, T.M., Moreno, E.C., and Brown, W.E. (1970) Solubility of CaHPO4·2H2O in the system Ca(OH)2-H3PO4-H2O at 5, 15, 25, and 37.5 °C. Journal of Re-search, National Bureau of Standards, 74A, 461–475.
Hahn, T. (2005) International Tables for Crystallography Vol. A: Space Group Symmetry, 938 p. Springer, Dordrecht.
Hariadi, R., langford, S.C., and Dickinson, J.T. (2002) Controlling nanometer-scale crystal growth on a model biomaterial with a scanning force microscope. langmuir, 18, 7773–7776.
Heijnen, W.M.M. and Hartman, P. (1991) Structural morphology of gypsum
(CaSO4.2H2O), brushite (CaHPO4.2H2O), and pharmacolite (CaHAsO4.2H2O). Journal of Crystal Growth, 108, 290–300.
Hina, A., Nancollas, G.H., and Grynpas, M. (2001) Surface induced constant composition crystal growth kinetics studies. The brushite-gypsum system. Journal of Crystal Growth, 223, 213–224.
Kowacz, M. and Putnis, A. (2008) The effect of specific background electrolytes on water structure and solute hydration: Consequences for crystal dissolution and growth. Geochimica et Cosmochimica Acta, 72, 4476–4487.
li, C. and Tsukamoto, K. (2001) The direct interference intensity phase analyzing technique for in situ Michelson interference and its application in studying of the fluctuation of crystal growth rates. Journal of Crystal Growth, 233, 336–342.
Ohta, M., Tsutsumi, M., and Ueno, S. (1979) Observations of etch pits on as-grown faces of brushite crystals. Journal of Crystal Growth, 47, 135–136.
Parkhurst, D.l. and Appelo, C.A.J. (1999) User’s guide to PHREEQC (ver. 2): A computer program for speciation, batch-reaction, one dimensional transport and inverse geochemical calculations. U.S. Geological Survey, Denver, Colorado.
Pasteris, J.D., Wopenka, B., and Valsami-Jones, E. (2008) Bone and tooth miner-alization: Why apatite? Elements, 4, 97–104.
Pérez-Garrido, C., Fernández-Díaz, l., Pina, C.M., and Prieto, M. (2007) In situ AFM observations of the interaction between calcite (1014) surfaces and Cd-bearing aqueous solutions. Surface Science, 601, 5499–5509.
Pedersen, B.F. and Semmingsen, D. (1982) Neutron diffraction refinement of the structure of gypsum, Ca2SO4.2H2O. Acta Crystallographica, B38, 1074–1077.
Pinto, A.J., Jimenez, A., and Prieto, M. (2009) Interaction between phosphate-bearing solutions with gypsum: Epitaxy and induced twinning of brushite (CaHPO4·2H2O) on the gypsum cleavage surface. American Mineralogist, 94, 313–322.
Qiu, S.R. and Orme, C.A. (2008) Dynamics of biomineral formation at the near-molecular level. Chemical Reviews, 108, 4784–4822.
Rinaudo, C., lanfranco, A.M., and Franchini-Angela, M. (1994) The system CaHPO4·2H2O-CaSO4·2H2O: Crystallization from calcium phosphate solutions in the presence of SO4
2–. Journal of Crystal Growth, 142, 184–192.Ristic, R.I., Shekunov, B., and Shewood, J.N. (1996) long and short period
growth rate variations in potash alum crystals. Journal of Crystal Growth, 160, 330–336.
Rodríguez-Blanco, J.D., Jiménez, A., and Prieto, M. (2007) Oriented overgrowth of pharmacolite (CaHAsO4·2H2O) on gypsum (CaSO4·2H2O). Crystal Growth and Design, 7, 2756–2763.
Ruiz-Agudo, E., Putnis, C.V., Jiménez-lópez, C., and Rodriguez-Navarro, C. (2009) An atomic force microscopy study of calcite dissolution in saline solutions: The role of magnesium ions. Geochimica et Cosmochimica Acta, 73, 3201–3217.
Ruiz-Agudo, E., Kowacz, M., Putnis, C.V., and Putnis, A. (2010) The role of background electrolytes on the kinetics and mechanism of calcite dissolution. Geochimica et Cosmochimica Acta, 74, 1256–1267.
Sangwal, K. (1989) On the estimation of surface entropy factor, interfacial tension, dissolution enthalpy and metastable zone-width for substances crystallizing from solution. Journal of Crystal Growth, 97, 393–405.
Scudiero, l., langford, S.C., and Dickinson, J.T. (1999) Scanning force microscope observations of corrosive wear on single-crystal brushite (CaHPO4·2H2O) in aqueous solution. Tribology letters, 6, 41–55.
Siperko, l.M. and landis, W.J. (1992) Atomic scale imaging of hydroxy-apatite and brushite in air by force microscopy. Applied Physics letters, 61, 2610–2612.
Tang, R., Orme, C.A., and Nancollas, G.H. (2003) A new understanding of demineralization: the dynamics of brushite dissolution. Journal of Physical Chemistry B, 107, 10653–10657.
Tang, R., Darragh, M., Orme, C.A., Guan, X., Hoyer, J.R., and Nancollas, G.H. (2005) Control of biomineralization dynamics by interfacial energies. Ang-ewandte Chemie, 117, 3764–3768.
Vekilov, P.G., Alexander, J.I.D., and Rosenberger, F. (1996) Nonlinear response of layer growth dynamics in the mixed kinetics-bulk-transport regime. Physical Review E, 54, 6650–6660.
Wesson, J.A. and Ward, M.D. (2007) Pathological biomineralization of kidney stones. Elements, 3, 415–421.
Manuscript received March 15, 2010Manuscript accepted July 2, 2010Manuscript handled by Joshua Feinberg